Embed Size (px)
Citation preview
ANALYST CERTIFICATION AND IMPORTANT DISCLOSURES BEGIN ON PAGE 23. Yuanta does and seeks to do business with companies covered in its research reports. As a result, investors should be aware that the firm may have a conflict of interest that could affect the objectivity of this report. Investors should consider this report as only a single factor in making their investment decision.
BUY (Initiation) Close 1 Nov, 2010 Price HK$6.90 Hang Seng Index 23,652.9
Share price performance relative to Hang Seng Index
0.0
1.0
2.0
3.0
4.0
5.0
6.0
7.0
8.0
Nov-09 Feb-10 May-10 Aug-100
100
200
300
400
500
Share Price (HK$) Performance relative to Hang Seng Index (%)
Market cap US$968.5 mn 6M avg. daily turnover US$2.1 mn Outstanding shares 1,088.0 mn Free float 42.0% Net debt/equity 12.1% P/B (2010F) 3.7x P/E (2010F) 10.2x
Financial outlook (HK$ mn)
Year to Dec 2009 2010F 2011F 2012F
Sales 4,361 8,501 11,150 13,652 Op. profit 139 727 1,069 1,176 Net profit 23 725 935 1,110 EPS (HK$) 0.03 0.68 0.79 0.94 EPS ∆ (%) (13.2) 2,605.1 16.8 18.6 DPS (HK$) 0.04 0.08 0.00 0.00 P/E (X) 274.8 10.2 8.7 7.3 Div. Yld (%) 0.5 1.2 0.0 0.0 ROE (%) 2.1 46.3 37.4 31.5
Company profile: TCL designs and manufactures mobile devices that are marketed under the "TCL" brand in China and "Alcatel" brand in overseas markets. The company also provides handset ODM services
TCL Communication (2618 HK) An emerging market handset play Initiate with a BUY rating and TP of HK$8.8: We initiate coverage of TCL with a BUY recommendation and a target price of HK$8.8. We are positive on TCL owing to its market share gain story in emerging markets since 3Q09 due to the revamp of its Alcatel brand and as sales at its ODM business have taken off. In light of strong shipment growth from its dual business (ODM+OBM) model, TCL looks set to see a strong earnings rebound in 2010F. From 2011 onwards, despite a high earnings base in 2010, we forecast EPS to grow 17% YoY to HK$0.79 and 19% to HK$0.94 in 2012 thanks to 1) healthy handset demand in emerging markets and its continued geographical expansion; and 2) further market share gains from diversifying its product offerings and improving its quality, which we believe will bear fruit especially given its competitive pricing.
The successful start-up of TCL’s ODM business has led to economies of scale on increased shipment volume. Furthermore, we expect its ODM business will become a stable cash cow business in 2011-2012 given that its key clients are shifting focus to advanced converged products and are not allocating sufficient R&D resources to lower margin / profit products.
The Alcatel brand revamp has paid off: TCL’s Alcatel branded products started to gain traction in emerging markets from 2Q09 with strong shipment growth outpacing most major global and local peers. We attribute this to its improving brand awareness after undergoing lengthy restructuring since 2005 and continuous expansion into new markets. In 2Q10, the Alcatel brand was ranked fourth in Latin America with a market share of 8.6%, up from 3.3% in 2Q09 and fifth in CEMA with a market share of 2.7% vs. 1.7% in 2Q09.
Strong R&D capabilities to sustain long-term growth: Thanks to patent ownership and strong design capabilities, we believe TCL will be able to see sustainable long-term growth on the back of seamless product cycles. TCL obtained the patents for core GSM and GPRS technologies when it acquired Alcatel’s former R&D team as part of its acquisition of Alcatel’s mobile handset business in 2005.
Solid EPS growth in 2011-12F: We forecast 17% EPS (on fully diluted base) growth in 2011 and 19% in 2012 after a strong rebound in 2010F as 1) its market share gains in emerging markets will continue to gather pace – especially with the crackdown of illegal handsets, which will benefit brand makers like TCL Comm.; and 2) rising smartphone shipments will boost ASP expansion.
Valuation: Our TP of HK$8.8, which we derive from the avg. of our P/E, P/B, and DCF valuations, implies 27.5% upside potential.
Hong Kong: Handsets 2 November, 2010
Primary Analyst: Bonnie Chang +852 3969 9904 [email protected] With significant contribution from: Kelly Hsu +886 2 3518 7947 [email protected]
Yuanta TCL Communication (2618 HK) Hong Kong: Handsets 2 Nov, 2010 Greater China Discovery Series Page 2 of 25
Table of contents
Investment thesis.................................................................................................. 3
Valuation .............................................................................................................. 8
Earnings forecast ................................................................................................ 12
Industry overview................................................................................................ 15
Company overview .............................................................................................. 18
Appendix A: Important Disclosures ..................................................................... 23
Yuanta Greater China Equities ............................................................................. 25
Yuanta TCL Communication (2618 HK) Hong Kong: Handsets 2 Nov, 2010 Greater China Discovery Series Page 3 of 25
Investment thesis
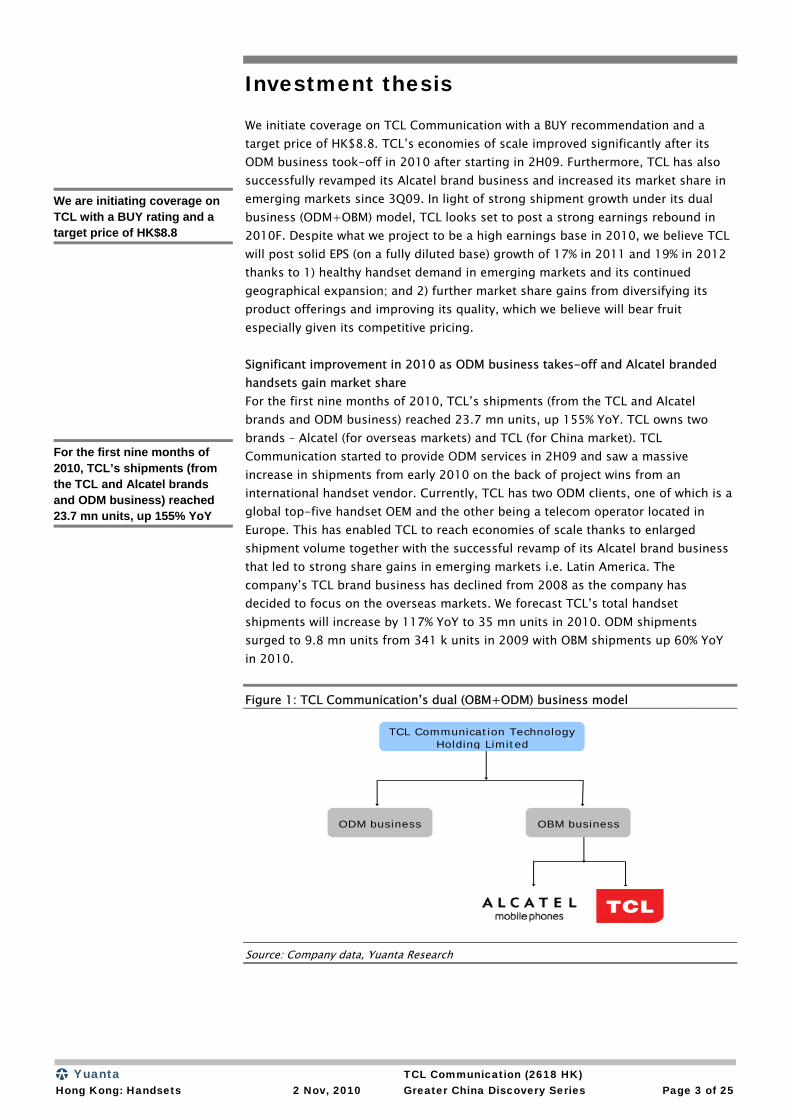
We initiate coverage on TCL Communication with a BUY recommendation and a target price of HK$8.8. TCL’s economies of scale improved significantly after its ODM business took-off in 2010 after starting in 2H09. Furthermore, TCL has also successfully revamped its Alcatel brand business and increased its market share in emerging markets since 3Q09. In light of strong shipment growth under its dual business (ODM+OBM) model, TCL looks set to post a strong earnings rebound in 2010F. Despite what we project to be a high earnings base in 2010, we believe TCL will post solid EPS (on a fully diluted base) growth of 17% in 2011 and 19% in 2012 thanks to 1) healthy handset demand in emerging markets and its continued geographical expansion; and 2) further market share gains from diversifying its product offerings and improving its quality, which we believe will bear fruit especially given its competitive pricing. Significant improvement in 2010 as ODM business takes-off and Alcatel branded handsets gain market share For the first nine months of 2010, TCL’s shipments (from the TCL and Alcatel brands and ODM business) reached 23.7 mn units, up 155% YoY. TCL owns two brands – Alcatel (for overseas markets) and TCL (for China market). TCL Communication started to provide ODM services in 2H09 and saw a massive increase in shipments from early 2010 on the back of project wins from an international handset vendor. Currently, TCL has two ODM clients, one of which is a global top-five handset OEM and the other being a telecom operator located in Europe. This has enabled TCL to reach economies of scale thanks to enlarged shipment volume together with the successful revamp of its Alcatel brand business that led to strong share gains in emerging markets i.e. Latin America. The company’s TCL brand business has declined from 2008 as the company has decided to focus on the overseas markets. We forecast TCL’s total handset shipments will increase by 117% YoY to 35 mn units in 2010. ODM shipments surged to 9.8 mn units from 341 k units in 2009 with OBM shipments up 60% YoY in 2010.
Figure 1: TCL Communication’s dual (OBM+ODM) business model
TCL Communication TechnologyHolding Limited
ODM business OBM business
Source: Company data, Yuanta Research
We are initiating coverage on TCL with a BUY rating and a target price of HK$8.8
For the first nine months of 2010, TCL’s shipments (from the TCL and Alcatel brands and ODM business) reached 23.7 mn units, up 155% YoY
Yuanta TCL Communication (2618 HK) Hong Kong: Handsets 2 Nov, 2010 Greater China Discovery Series Page 4 of 25
Improving market position to sustain earnings growth in 2011-2012 We forecast TCL’s EPS to grow 17% in 2011 and 19% in 2012 on the back of 17% and 13% shipment growth respectively, mostly driven by the growth of its OBM business in emerging markets. We expect TCL to enjoy increasing sales thanks to its rising brand awareness in emerging markets and improving product portfolios in the global handset market by leveraging its Alcatel brand. We forecast its ODM sales to be flat but this business will become a stable cash cow after ODM shipments peak in 2011F (on the assumption no further clients are added). ► Successfully rebuilding the Alcatel brand: In our view, 2010 has been a
milestone for TCL as it has successfully turned around its Alcatel brand and rebuilt its brand awareness in emerging markets after lengthy restructuring following its acquisition of the Alcatel handset business in 2005. We now see TCL as a handset brand maker with global exposure, notably in emerging markets like Latin America. As such the company will benefit from fast GDP growth and rising mobile subscriber bases as network expansion increases. Also, its on-going business expansion into new markets such as Russia and its efforts to raise penetration in its existing coverage landscape will continue to fuel shipment growth.
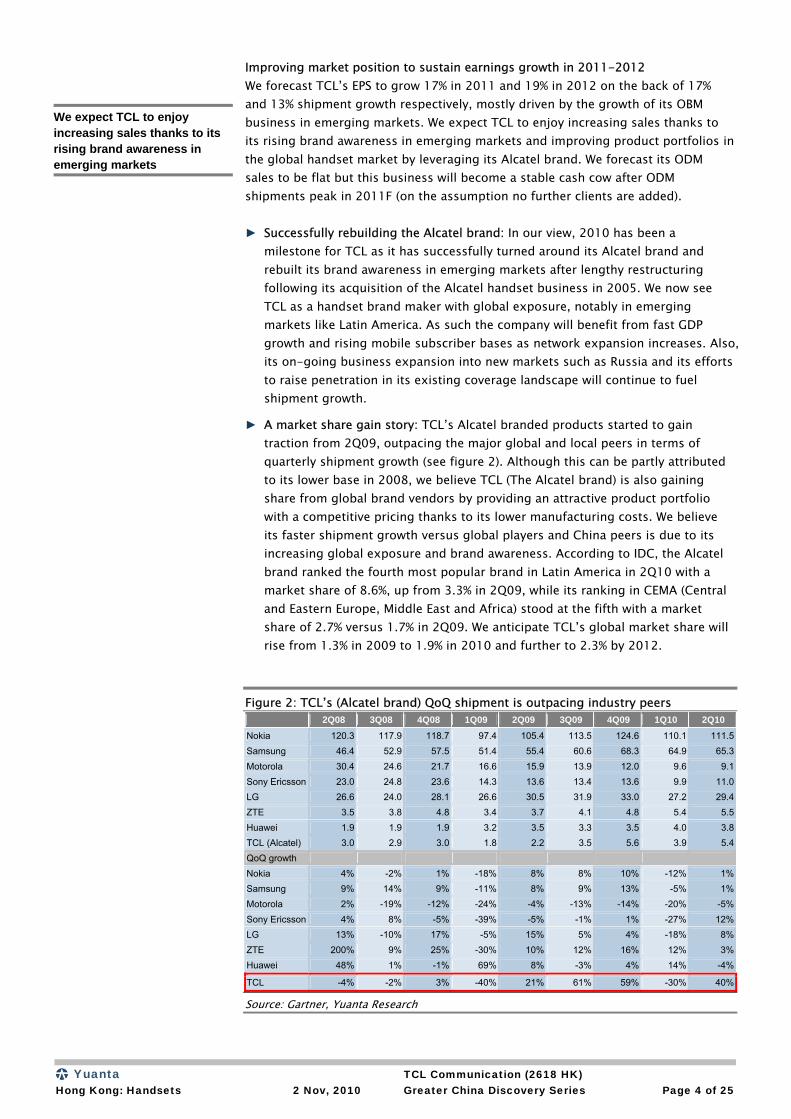
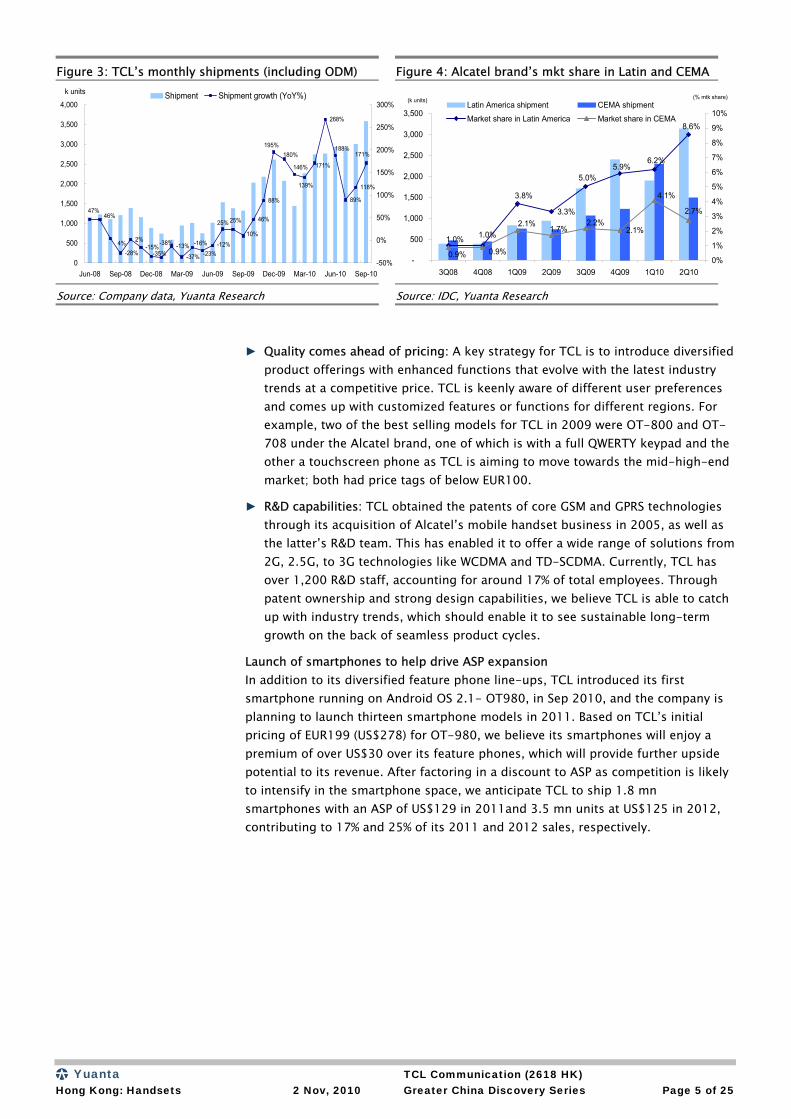
► A market share gain story: TCL’s Alcatel branded products started to gain traction from 2Q09, outpacing the major global and local peers in terms of quarterly shipment growth (see figure 2). Although this can be partly attributed to its lower base in 2008, we believe TCL (The Alcatel brand) is also gaining share from global brand vendors by providing an attractive product portfolio with a competitive pricing thanks to its lower manufacturing costs. We believe its faster shipment growth versus global players and China peers is due to its increasing global exposure and brand awareness. According to IDC, the Alcatel brand ranked the fourth most popular brand in Latin America in 2Q10 with a market share of 8.6%, up from 3.3% in 2Q09, while its ranking in CEMA (Central and Eastern Europe, Middle East and Africa) stood at the fifth with a market share of 2.7% versus 1.7% in 2Q09. We anticipate TCL’s global market share will rise from 1.3% in 2009 to 1.9% in 2010 and further to 2.3% by 2012.
Figure 2: TCL’s (Alcatel brand) QoQ shipment is outpacing industry peers 2Q08 3Q08 4Q08 1Q09 2Q09 3Q09 4Q09 1Q10 2Q10
Nokia 120.3 117.9 118.7 97.4 105.4 113.5 124.6 110.1 111.5Samsung 46.4 52.9 57.5 51.4 55.4 60.6 68.3 64.9 65.3Motorola 30.4 24.6 21.7 16.6 15.9 13.9 12.0 9.6 9.1Sony Ericsson 23.0 24.8 23.6 14.3 13.6 13.4 13.6 9.9 11.0LG 26.6 24.0 28.1 26.6 30.5 31.9 33.0 27.2 29.4ZTE 3.5 3.8 4.8 3.4 3.7 4.1 4.8 5.4 5.5Huawei 1.9 1.9 1.9 3.2 3.5 3.3 3.5 4.0 3.8TCL (Alcatel) 3.0 2.9 3.0 1.8 2.2 3.5 5.6 3.9 5.4QoQ growth
Nokia 4% -2% 1% -18% 8% 8% 10% -12% 1%Samsung 9% 14% 9% -11% 8% 9% 13% -5% 1%Motorola 2% -19% -12% -24% -4% -13% -14% -20% -5%Sony Ericsson 4% 8% -5% -39% -5% -1% 1% -27% 12%LG 13% -10% 17% -5% 15% 5% 4% -18% 8%ZTE 200% 9% 25% -30% 10% 12% 16% 12% 3%Huawei 48% 1% -1% 69% 8% -3% 4% 14% -4%
TCL -4% -2% 3% -40% 21% 61% 59% -30% 40%
Source: Gartner, Yuanta Research
We expect TCL to enjoy increasing sales thanks to its rising brand awareness in emerging markets
Yuanta TCL Communication (2618 HK) Hong Kong: Handsets 2 Nov, 2010 Greater China Discovery Series Page 5 of 25
Figure 3: TCL’s monthly shipments (including ODM) Figure 4: Alcatel brand’s mkt share in Latin and CEMA
-28%
2%-15% -13%
-37%
46%
88%
268%
89%
118%
188%171%
-16%
146%
139%
195%180%
171%
25%
10%4%
47%46%
-35%
-38%
25%
-12%-23%
0
500
1,000
1,500
2,000
2,500
3,000
3,500
4,000
Jun-08 Sep-08 Dec-08 Mar-09 Jun-09 Sep-09 Dec-09 Mar-10 Jun-10 Sep-10
k units
-50%
0%
50%
100%
150%
200%
250%
300%Shipment Shipment growth (YoY%)
3.3%
2.1%
8.6%
6.2%5.9%
5.0%
3.8%
1.0%1.0%
2.7%
4.1%
2.2%1.7%
2.1%
0.9%0.9%-
500
1,000
1,500
2,000
2,500
3,000
3,500
3Q08 4Q08 1Q09 2Q09 3Q09 4Q09 1Q10 2Q10
(k units)
0%
1%
2%
3%
4%
5%
6%
7%
8%
9%
10%
(% mtk share)Latin America shipment CEMA shipment
Market share in Latin America Market share in CEMA
Source: Company data, Yuanta Research Source: IDC, Yuanta Research
► Quality comes ahead of pricing: A key strategy for TCL is to introduce diversified product offerings with enhanced functions that evolve with the latest industry trends at a competitive price. TCL is keenly aware of different user preferences and comes up with customized features or functions for different regions. For example, two of the best selling models for TCL in 2009 were OT-800 and OT-708 under the Alcatel brand, one of which is with a full QWERTY keypad and the other a touchscreen phone as TCL is aiming to move towards the mid-high-end market; both had price tags of below EUR100.
► R&D capabilities: TCL obtained the patents of core GSM and GPRS technologies through its acquisition of Alcatel’s mobile handset business in 2005, as well as the latter’s R&D team. This has enabled it to offer a wide range of solutions from 2G, 2.5G, to 3G technologies like WCDMA and TD-SCDMA. Currently, TCL has over 1,200 R&D staff, accounting for around 17% of total employees. Through patent ownership and strong design capabilities, we believe TCL is able to catch up with industry trends, which should enable it to see sustainable long-term growth on the back of seamless product cycles.
Launch of smartphones to help drive ASP expansion In addition to its diversified feature phone line-ups, TCL introduced its first smartphone running on Android OS 2.1- OT980, in Sep 2010, and the company is planning to launch thirteen smartphone models in 2011. Based on TCL’s initial pricing of EUR199 (US$278) for OT-980, we believe its smartphones will enjoy a premium of over US$30 over its feature phones, which will provide further upside potential to its revenue. After factoring in a discount to ASP as competition is likely to intensify in the smartphone space, we anticipate TCL to ship 1.8 mn smartphones with an ASP of US$129 in 2011and 3.5 mn units at US$125 in 2012, contributing to 17% and 25% of its 2011 and 2012 sales, respectively.
Yuanta TCL Communication (2618 HK) Hong Kong: Handsets 2 Nov, 2010 Greater China Discovery Series Page 6 of 25
Consolidating China white brand market We also believe these China brands like TCL Comm are consolidating the part of low-end handset segment captured by China white brands, due to:
► Cost advantages: While TCL Comm largely leverages low-cost turnkey solutions offered by Mediatek or Spreadtrum as white-box handset makers, TCL Comm enjoys better cost structure vs. China white brands on larger scale.
► Rising awareness on both quality & safety: We see the rising consumer awareness of quality and safety for handset that triggered the crackdown of handsets without proper IMEI (International Mobile Equipment Identity) numbers by several govts in emerging countries. This should benefit legitimate phone makers like TCL to gain trajectory in emerging markets.
Strong FCF-generating capabilities and improving balance sheet We forecast TCL to post a net profit of HK$725 mn in 2010, up from HK$23 mn in 2009, on robust sales of HK$8.5 bn (+95% YoY). We expect capex to remain stable at low level of around HK$36 mn versus HK$26 mn in 2009, as company should have sufficient capacity to accommodate further shipment growth (company currently has capacity of 50 mn units per year, versus our shipment forecast of 41 mn units in 2011 and 46 mn units in 2012). This would lead to an increase in FCF ROE to 6.7% in 2010 and 6.8% in 2011, up from -0.5% in 2009. Given the strong earnings growth, we also expect TCL’s ROE to trend up from 2% in 2009 to 46% in 2010 and remain at 32-37% in 2011-2012. Following the redemption of its convertible bond in 2009 (issued in 2007 for working capital expansion) and the completion of its rights issue in early 2010, plus its disciplined capex, we expect TCL to turn net cash position from 2011 onwards. Dual business model – the positives outweigh the negatives In addition to its OBM business, TCL started its ODM business in 2H09 riding on the outsourcing trend of low-end and price-sensitive products from global handset OEMs who were and still are streamlining corporate structures and shifting their focus to more profitable segments post the financial crisis. From TCL’s perspective, this was a good opportunity to raise its overall manufacturing scale to 1) reduce manufacturing costs; and 2) increasing purchasing power over suppliers on larger volume. Moreover, TCL is also working on customized handsets for telecom operators in its ODM structure, which we see as the right move for TCL as it could potentially benefit from stronger channel distribution support by leveraging its closer relationship with operators. We believe TCL is now reaping the rewards from entering the ODM business, as its 9M10 handset shipments increased by 155% YoY to 23.7 mn units, of which 6.2 mn units were ODM related (26% of total shipments). In addition to its two current ODM clients, the company indicated that it expects to add three to five ODM clients, mostly operators, in the future.
We forecast TCL to post a net profit of HK$725 mn in 2010, up from HK$23 mn in 2009
We believe TCL is now reaping the rewards from entering the ODM business, as 26% of its 9M10 handset shipments were ODM related
Yuanta TCL Communication (2618 HK) Hong Kong: Handsets 2 Nov, 2010 Greater China Discovery Series Page 7 of 25
Investment Risks
Currency risks Given TCL’s high exposure to overseas markets (53% of shipments are to North/Latin America, 34% to EMEA during 1Q-3Q10), 70% of TCL’s revenue is denominated in USD, 20-25% in EUR and the remainder in Renminbi, while cost is mostly denominated in Renminbi. Therefore, any USD/HKD volatility against EUR and Renminbi could impact TCL’s margins. Macro/ handset industry demand volatility We believe TCL’s earnings growth will be driven by robust product shipment growth as it continues to gain market share on healthy handset demand. Should there be a change in the macro environment, like the financial crisis in 2008 or the PIGS crisis in 2Q10 that dampened end-demand, we would turn more conservative on its shipment growth prospects. Execution risks on its OBM business While we expect TCL to continue to expand its market share at the expense of both foreign vendors and domestic competitors, any execution risks that result in the company failing to deliver continuous product innovations or smooth product transitions will likely cap its shipment growth, and present further downside to our forecasts. Conflict between ODM and OBM business A combined business model of ODM and OBM often means conflict of interest is a concern. In TCL’s case, we see low risks of such a conflict of interest with its major ODM client in light of the fact that its client is moving its focus away from low-end feature phones and has a lack of R&D resource dedicated to low-end products. Nonetheless, any change of the outsourcing strategies of its ODM partners may adversely impact TCL’s profitability
Yuanta TCL Communication (2618 HK) Hong Kong: Handsets 2 Nov, 2010 Greater China Discovery Series Page 8 of 25
Valuation
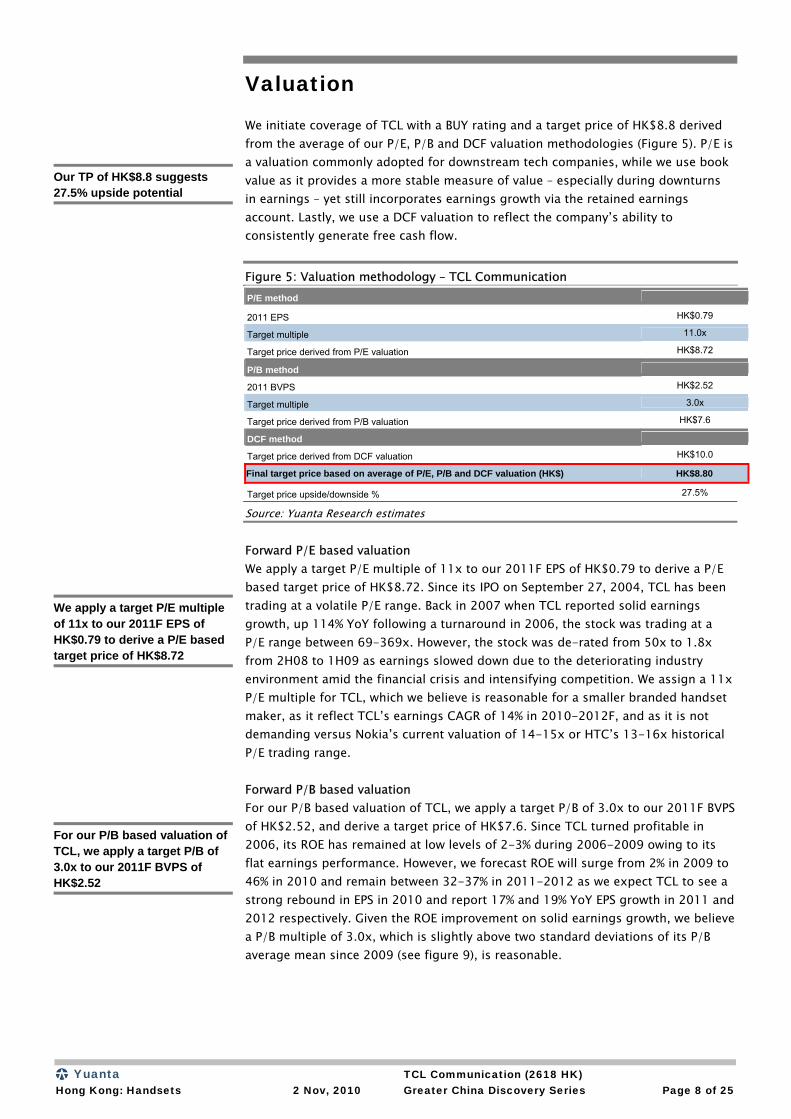
We initiate coverage of TCL with a BUY rating and a target price of HK$8.8 derived from the average of our P/E, P/B and DCF valuation methodologies (Figure 5). P/E is a valuation commonly adopted for downstream tech companies, while we use book value as it provides a more stable measure of value – especially during downturns in earnings – yet still incorporates earnings growth via the retained earnings account. Lastly, we use a DCF valuation to reflect the company’s ability to consistently generate free cash flow.
Figure 5: Valuation methodology – TCL Communication P/E method
2011 EPS HK$0.79
Target multiple 11.0x
Target price derived from P/E valuation HK$8.72
P/B method
2011 BVPS HK$2.52
Target multiple 3.0x
Target price derived from P/B valuation HK$7.6
DCF method
Target price derived from DCF valuation HK$10.0
Final target price based on average of P/E, P/B and DCF valuation (HK$) HK$8.80
Target price upside/downside % 27.5%
Source: Yuanta Research estimates
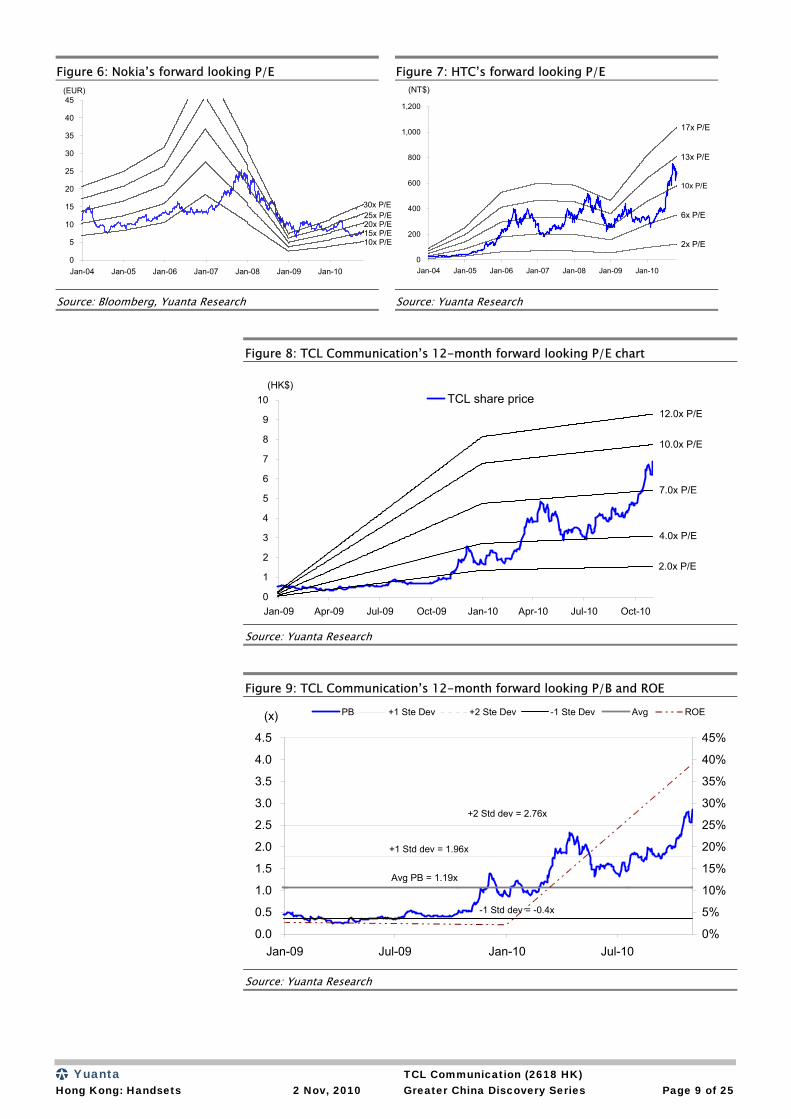
Forward P/E based valuation We apply a target P/E multiple of 11x to our 2011F EPS of HK$0.79 to derive a P/E based target price of HK$8.72. Since its IPO on September 27, 2004, TCL has been trading at a volatile P/E range. Back in 2007 when TCL reported solid earnings growth, up 114% YoY following a turnaround in 2006, the stock was trading at a P/E range between 69-369x. However, the stock was de-rated from 50x to 1.8x from 2H08 to 1H09 as earnings slowed down due to the deteriorating industry environment amid the financial crisis and intensifying competition. We assign a 11x P/E multiple for TCL, which we believe is reasonable for a smaller branded handset maker, as it reflect TCL’s earnings CAGR of 14% in 2010-2012F, and as it is not demanding versus Nokia’s current valuation of 14-15x or HTC’s 13-16x historical P/E trading range. Forward P/B based valuation For our P/B based valuation of TCL, we apply a target P/B of 3.0x to our 2011F BVPS of HK$2.52, and derive a target price of HK$7.6. Since TCL turned profitable in 2006, its ROE has remained at low levels of 2-3% during 2006-2009 owing to its flat earnings performance. However, we forecast ROE will surge from 2% in 2009 to 46% in 2010 and remain between 32-37% in 2011-2012 as we expect TCL to see a strong rebound in EPS in 2010 and report 17% and 19% YoY EPS growth in 2011 and 2012 respectively. Given the ROE improvement on solid earnings growth, we believe a P/B multiple of 3.0x, which is slightly above two standard deviations of its P/B average mean since 2009 (see figure 9), is reasonable.
Our TP of HK$8.8 suggests 27.5% upside potential
We apply a target P/E multiple of 11x to our 2011F EPS of HK$0.79 to derive a P/E based target price of HK$8.72
For our P/B based valuation of TCL, we apply a target P/B of 3.0x to our 2011F BVPS of HK$2.52
Yuanta TCL Communication (2618 HK) Hong Kong: Handsets 2 Nov, 2010 Greater China Discovery Series Page 9 of 25
Figure 6: Nokia’s forward looking P/E Figure 7: HTC’s forward looking P/E
30x P/E25x P/E20x P/E15x P/E10x P/E
0
5
10
15
20
25
30
35
40
45
Jan-04 Jan-05 Jan-06 Jan-07 Jan-08 Jan-09 Jan-10
(EUR)
17x P/E
13x P/E
10x P/E
6x P/E
2x P/E
0
200
400
600
800
1,000
1,200
Jan-04 Jan-05 Jan-06 Jan-07 Jan-08 Jan-09 Jan-10
(NT$)
Source: Bloomberg, Yuanta Research Source: Yuanta Research
Figure 8: TCL Communication’s 12-month forward looking P/E chart
12.0x P/E
10.0x P/E
7.0x P/E
4.0x P/E
2.0x P/E
0
1
2
3
4
5
6
7
8
9
10
Jan-09 Apr-09 Jul-09 Oct-09 Jan-10 Apr-10 Jul-10 Oct-10
(HK$)TCL share price
Source: Yuanta Research
Figure 9: TCL Communication’s 12-month forward looking P/B and ROE
+1 Std dev = 1.96x
+2 Std dev = 2.76x
-1 Std dev = -0.4x
0.0
0.5
1.0
1.5
2.0
2.5
3.0
3.5
4.0
4.5
Jan-09 Jul-09 Jan-10 Jul-10
(x)
0%
5%
10%
15%
20%
25%
30%
35%
40%
45%
PB +1 Ste Dev +2 Ste Dev -1 Ste Dev Avg ROE
Avg PB = 1.19x
Source: Yuanta Research
Yuanta TCL Communication (2618 HK) Hong Kong: Handsets 2 Nov, 2010 Greater China Discovery Series Page 10 of 25
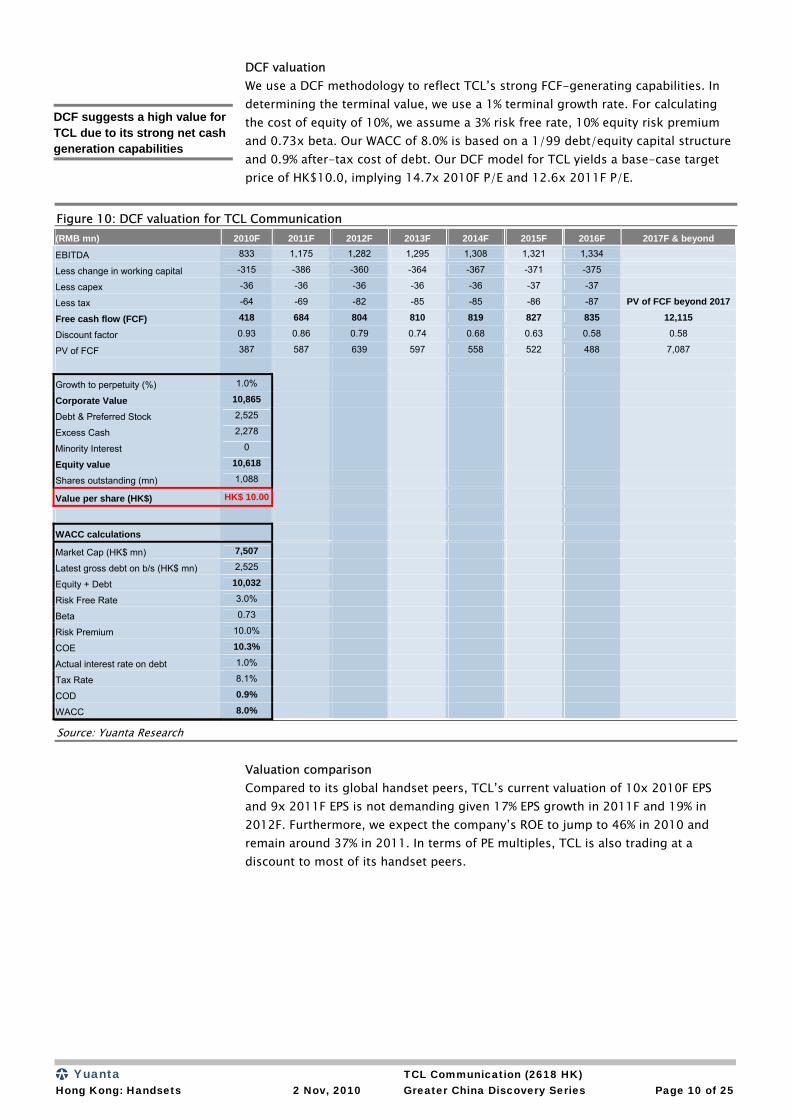
DCF valuation We use a DCF methodology to reflect TCL’s strong FCF-generating capabilities. In determining the terminal value, we use a 1% terminal growth rate. For calculating the cost of equity of 10%, we assume a 3% risk free rate, 10% equity risk premium and 0.73x beta. Our WACC of 8.0% is based on a 1/99 debt/equity capital structure and 0.9% after-tax cost of debt. Our DCF model for TCL yields a base-case target price of HK$10.0, implying 14.7x 2010F P/E and 12.6x 2011F P/E.
Figure 10: DCF valuation for TCL Communication (RMB mn) 2010F 2011F 2012F 2013F 2014F 2015F 2016F 2017F & beyond
EBITDA 833 1,175 1,282 1,295 1,308 1,321 1,334
Less change in working capital -315 -386 -360 -364 -367 -371 -375
Less capex -36 -36 -36 -36 -36 -37 -37
Less tax -64 -69 -82 -85 -85 -86 -87 PV of FCF beyond 2017
Free cash flow (FCF) 418 684 804 810 819 827 835 12,115
Discount factor 0.93 0.86 0.79 0.74 0.68 0.63 0.58 0.58
PV of FCF 387 587 639 597 558 522 488 7,087
Growth to perpetuity (%) 1.0%
Corporate Value 10,865
Debt & Preferred Stock 2,525
Excess Cash 2,278
Minority Interest 0
Equity value 10,618
Shares outstanding (mn) 1,088
Value per share (HK$) HK$ 10.00
WACC calculations
Market Cap (HK$ mn) 7,507
Latest gross debt on b/s (HK$ mn) 2,525
Equity + Debt 10,032
Risk Free Rate 3.0%
Beta 0.73
Risk Premium 10.0%
COE 10.3%
Actual interest rate on debt 1.0%
Tax Rate 8.1%
COD 0.9%
WACC 8.0%
Source: Yuanta Research
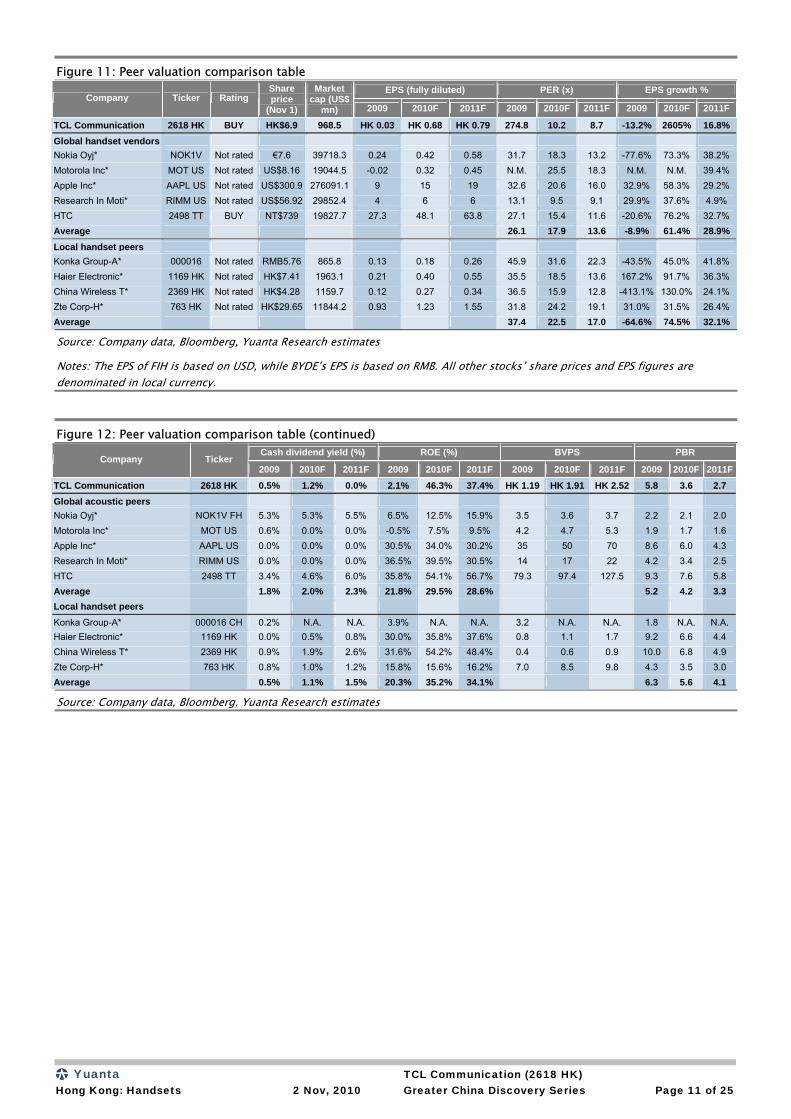
Valuation comparison Compared to its global handset peers, TCL’s current valuation of 10x 2010F EPS and 9x 2011F EPS is not demanding given 17% EPS growth in 2011F and 19% in 2012F. Furthermore, we expect the company’s ROE to jump to 46% in 2010 and remain around 37% in 2011. In terms of PE multiples, TCL is also trading at a discount to most of its handset peers.
DCF suggests a high value for TCL due to its strong net cash generation capabilities
Yuanta TCL Communication (2618 HK) Hong Kong: Handsets 2 Nov, 2010 Greater China Discovery Series Page 11 of 25
Figure 11: Peer valuation comparison table EPS (fully diluted) PER (x) EPS growth %
Company Ticker Rating Share price
(Nov 1)
Market cap (US$
mn) 2009 2010F 2011F 2009 2010F 2011F 2009 2010F 2011F
TCL Communication 2618 HK BUY HK$6.9 968.5 HK 0.03 HK 0.68 HK 0.79 274.8 10.2 8.7 -13.2% 2605% 16.8%Global handset vendors Nokia Oyj* NOK1V Not rated €7.6 39718.3 0.24 0.42 0.58 31.7 18.3 13.2 -77.6% 73.3% 38.2% Motorola Inc* MOT US Not rated US$8.16 19044.5 -0.02 0.32 0.45 N.M. 25.5 18.3 N.M. N.M. 39.4% Apple Inc* AAPL US Not rated US$300.9 276091.1 9 15 19 32.6 20.6 16.0 32.9% 58.3% 29.2% Research In Moti* RIMM US Not rated US$56.92 29852.4 4 6 6 13.1 9.5 9.1 29.9% 37.6% 4.9% HTC 2498 TT BUY NT$739 19827.7 27.3 48.1 63.8 27.1 15.4 11.6 -20.6% 76.2% 32.7% Average 26.1 17.9 13.6 -8.9% 61.4% 28.9% Local handset peers Konka Group-A* 000016 Not rated RMB5.76 865.8 0.13 0.18 0.26 45.9 31.6 22.3 -43.5% 45.0% 41.8% Haier Electronic* 1169 HK Not rated HK$7.41 1963.1 0.21 0.40 0.55 35.5 18.5 13.6 167.2% 91.7% 36.3% China Wireless T* 2369 HK Not rated HK$4.28 1159.7 0.12 0.27 0.34 36.5 15.9 12.8 -413.1% 130.0% 24.1% Zte Corp-H* 763 HK Not rated HK$29.65 11844.2 0.93 1.23 1.55 31.8 24.2 19.1 31.0% 31.5% 26.4% Average 37.4 22.5 17.0 -64.6% 74.5% 32.1%
Source: Company data, Bloomberg, Yuanta Research estimates
Notes: The EPS of FIH is based on USD, while BYDE’s EPS is based on RMB. All other stocks’ share prices and EPS figures are denominated in local currency.
Figure 12: Peer valuation comparison table (continued) Cash dividend yield (%) ROE (%) BVPS PBR
Company Ticker 2009 2010F 2011F 2009 2010F 2011F 2009 2010F 2011F 2009 2010F 2011F
TCL Communication 2618 HK 0.5% 1.2% 0.0% 2.1% 46.3% 37.4% HK 1.19 HK 1.91 HK 2.52 5.8 3.6 2.7Global acoustic peers Nokia Oyj* NOK1V FH 5.3% 5.3% 5.5% 6.5% 12.5% 15.9% 3.5 3.6 3.7 2.2 2.1 2.0 Motorola Inc* MOT US 0.6% 0.0% 0.0% -0.5% 7.5% 9.5% 4.2 4.7 5.3 1.9 1.7 1.6 Apple Inc* AAPL US 0.0% 0.0% 0.0% 30.5% 34.0% 30.2% 35 50 70 8.6 6.0 4.3 Research In Moti* RIMM US 0.0% 0.0% 0.0% 36.5% 39.5% 30.5% 14 17 22 4.2 3.4 2.5 HTC 2498 TT 3.4% 4.6% 6.0% 35.8% 54.1% 56.7% 79.3 97.4 127.5 9.3 7.6 5.8 Average 1.8% 2.0% 2.3% 21.8% 29.5% 28.6% 5.2 4.2 3.3 Local handset peers
Konka Group-A* 000016 CH 0.2% N.A. N.A. 3.9% N.A. N.A. 3.2 N.A. N.A. 1.8 N.A. N.A.Haier Electronic* 1169 HK 0.0% 0.5% 0.8% 30.0% 35.8% 37.6% 0.8 1.1 1.7 9.2 6.6 4.4 China Wireless T* 2369 HK 0.9% 1.9% 2.6% 31.6% 54.2% 48.4% 0.4 0.6 0.9 10.0 6.8 4.9 Zte Corp-H* 763 HK 0.8% 1.0% 1.2% 15.8% 15.6% 16.2% 7.0 8.5 9.8 4.3 3.5 3.0 Average 0.5% 1.1% 1.5% 20.3% 35.2% 34.1% 6.3 5.6 4.1
Source: Company data, Bloomberg, Yuanta Research estimates
Yuanta TCL Communication (2618 HK) Hong Kong: Handsets 2 Nov, 2010 Greater China Discovery Series Page 12 of 25
Earnings forecast
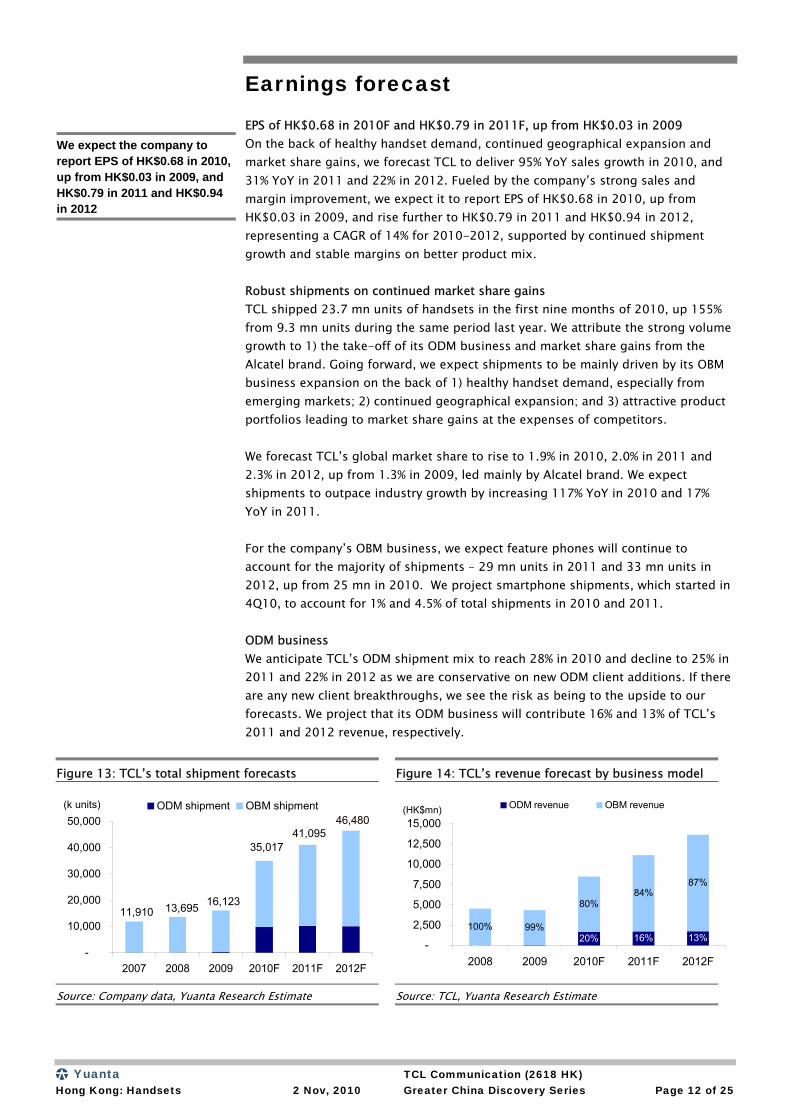
EPS of HK$0.68 in 2010F and HK$0.79 in 2011F, up from HK$0.03 in 2009 On the back of healthy handset demand, continued geographical expansion and market share gains, we forecast TCL to deliver 95% YoY sales growth in 2010, and 31% YoY in 2011 and 22% in 2012. Fueled by the company’s strong sales and margin improvement, we expect it to report EPS of HK$0.68 in 2010, up from HK$0.03 in 2009, and rise further to HK$0.79 in 2011 and HK$0.94 in 2012, representing a CAGR of 14% for 2010-2012, supported by continued shipment growth and stable margins on better product mix. Robust shipments on continued market share gains TCL shipped 23.7 mn units of handsets in the first nine months of 2010, up 155% from 9.3 mn units during the same period last year. We attribute the strong volume growth to 1) the take-off of its ODM business and market share gains from the Alcatel brand. Going forward, we expect shipments to be mainly driven by its OBM business expansion on the back of 1) healthy handset demand, especially from emerging markets; 2) continued geographical expansion; and 3) attractive product portfolios leading to market share gains at the expenses of competitors. We forecast TCL’s global market share to rise to 1.9% in 2010, 2.0% in 2011 and 2.3% in 2012, up from 1.3% in 2009, led mainly by Alcatel brand. We expect shipments to outpace industry growth by increasing 117% YoY in 2010 and 17% YoY in 2011. For the company’s OBM business, we expect feature phones will continue to account for the majority of shipments – 29 mn units in 2011 and 33 mn units in 2012, up from 25 mn in 2010. We project smartphone shipments, which started in 4Q10, to account for 1% and 4.5% of total shipments in 2010 and 2011. ODM business We anticipate TCL’s ODM shipment mix to reach 28% in 2010 and decline to 25% in 2011 and 22% in 2012 as we are conservative on new ODM client additions. If there are any new client breakthroughs, we see the risk as being to the upside to our forecasts. We project that its ODM business will contribute 16% and 13% of TCL’s 2011 and 2012 revenue, respectively.
Figure 13: TCL’s total shipment forecasts Figure 14: TCL’s revenue forecast by business model
35,017 41,095
46,480
16,123 13,695 11,910
-
10,000
20,000
30,000
40,000
50,000
2007 2008 2009 2010F 2011F 2012F
(k units) ODM shipment OBM shipment
-20% 16% 13%
100% 99%
80%84%
87%
-
2,500
5,000
7,500
10,000
12,500
15,000
2008 2009 2010F 2011F 2012F
(HK$mn) ODM revenue OBM revenue
Source: Company data, Yuanta Research Estimate Source: TCL, Yuanta Research Estimate
We expect the company to report EPS of HK$0.68 in 2010, up from HK$0.03 in 2009, and HK$0.79 in 2011 and HK$0.94 in 2012
Yuanta TCL Communication (2618 HK) Hong Kong: Handsets 2 Nov, 2010 Greater China Discovery Series Page 13 of 25
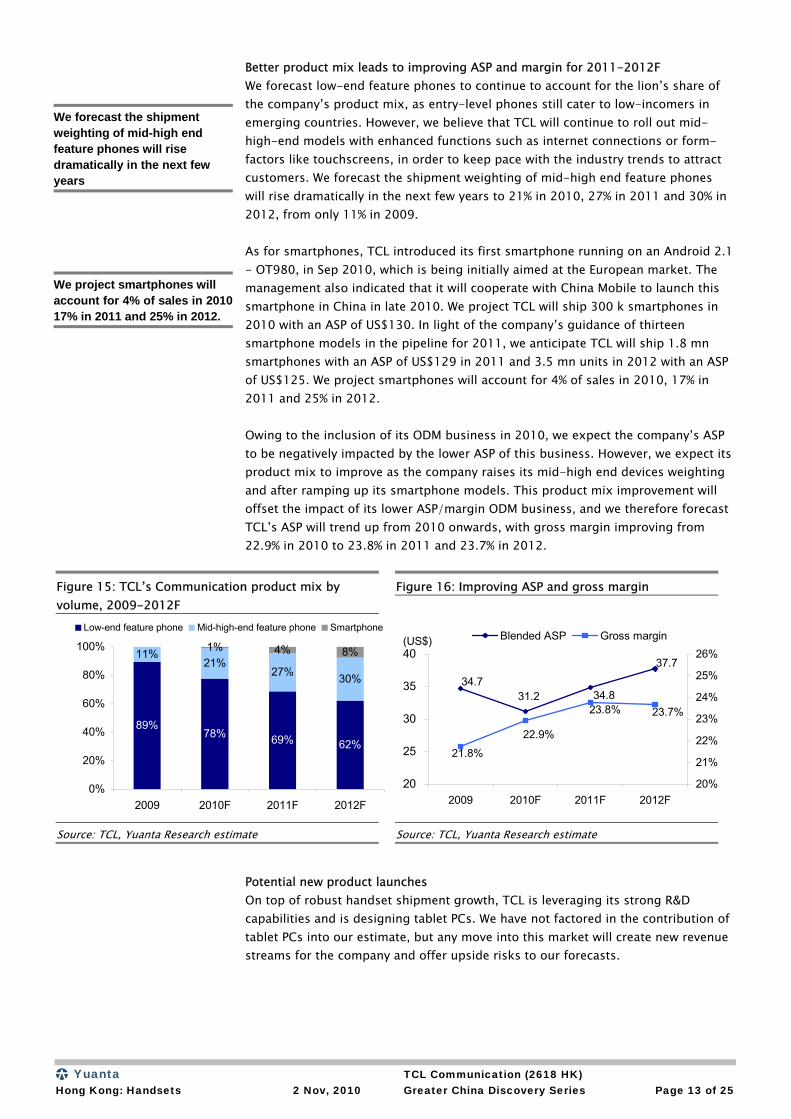
Better product mix leads to improving ASP and margin for 2011-2012F We forecast low-end feature phones to continue to account for the lion’s share of the company’s product mix, as entry-level phones still cater to low-incomers in emerging countries. However, we believe that TCL will continue to roll out mid-high-end models with enhanced functions such as internet connections or form-factors like touchscreens, in order to keep pace with the industry trends to attract customers. We forecast the shipment weighting of mid-high end feature phones will rise dramatically in the next few years to 21% in 2010, 27% in 2011 and 30% in 2012, from only 11% in 2009. As for smartphones, TCL introduced its first smartphone running on an Android 2.1 - OT980, in Sep 2010, which is being initially aimed at the European market. The management also indicated that it will cooperate with China Mobile to launch this smartphone in China in late 2010. We project TCL will ship 300 k smartphones in 2010 with an ASP of US$130. In light of the company’s guidance of thirteen smartphone models in the pipeline for 2011, we anticipate TCL will ship 1.8 mn smartphones with an ASP of US$129 in 2011 and 3.5 mn units in 2012 with an ASP of US$125. We project smartphones will account for 4% of sales in 2010, 17% in 2011 and 25% in 2012. Owing to the inclusion of its ODM business in 2010, we expect the company’s ASP to be negatively impacted by the lower ASP of this business. However, we expect its product mix to improve as the company raises its mid-high end devices weighting and after ramping up its smartphone models. This product mix improvement will offset the impact of its lower ASP/margin ODM business, and we therefore forecast TCL’s ASP will trend up from 2010 onwards, with gross margin improving from 22.9% in 2010 to 23.8% in 2011 and 23.7% in 2012.
Figure 15: TCL’s Communication product mix by volume, 2009-2012F
Figure 16: Improving ASP and gross margin
89%78% 69% 62%
11%21%
27% 30%
1% 4% 8%
0%
20%
40%
60%
80%
100%
2009 2010F 2011F 2012F
Low-end feature phone Mid-high-end feature phone Smartphone
34.731.2
37.7
34.823.8%
22.9%
21.8%
23.7%
20
25
30
35
40
2009 2010F 2011F 2012F
(US$)
20%
21%
22%
23%
24%
25%
26%Blended ASP Gross margin
Source: TCL, Yuanta Research estimate Source: TCL, Yuanta Research estimate
Potential new product launches On top of robust handset shipment growth, TCL is leveraging its strong R&D capabilities and is designing tablet PCs. We have not factored in the contribution of tablet PCs into our estimate, but any move into this market will create new revenue streams for the company and offer upside risks to our forecasts.
We forecast the shipment weighting of mid-high end feature phones will rise dramatically in the next few years
We project smartphones will account for 4% of sales in 201017% in 2011 and 25% in 2012.
Yuanta TCL Communication (2618 HK) Hong Kong: Handsets 2 Nov, 2010 Greater China Discovery Series Page 14 of 25
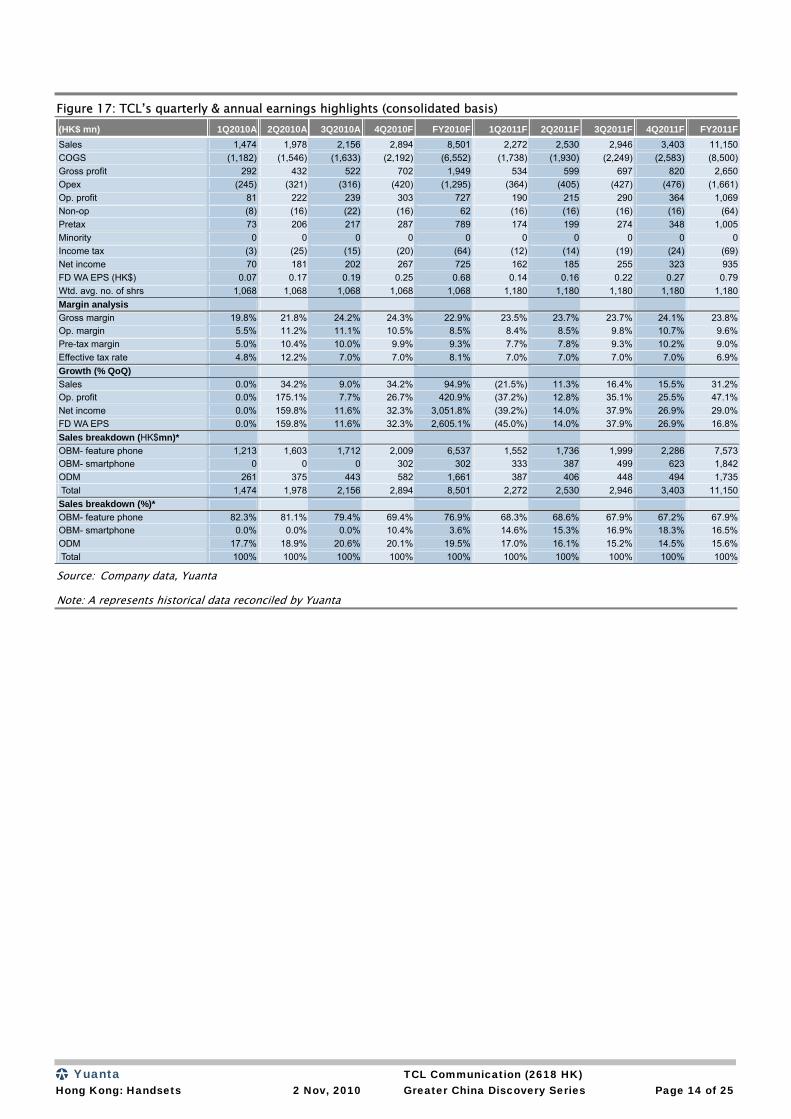
Figure 17: TCL’s quarterly & annual earnings highlights (consolidated basis) (HK$ mn) 1Q2010A 2Q2010A 3Q2010A 4Q2010F FY2010F 1Q2011F 2Q2011F 3Q2011F 4Q2011F FY2011FSales 1,474 1,978 2,156 2,894 8,501 2,272 2,530 2,946 3,403 11,150COGS (1,182) (1,546) (1,633) (2,192) (6,552) (1,738) (1,930) (2,249) (2,583) (8,500)Gross profit 292 432 522 702 1,949 534 599 697 820 2,650Opex (245) (321) (316) (420) (1,295) (364) (405) (427) (476) (1,661)Op. profit 81 222 239 303 727 190 215 290 364 1,069Non-op (8) (16) (22) (16) 62 (16) (16) (16) (16) (64)Pretax 73 206 217 287 789 174 199 274 348 1,005Minority 0 0 0 0 0 0 0 0 0 0Income tax (3) (25) (15) (20) (64) (12) (14) (19) (24) (69)Net income 70 181 202 267 725 162 185 255 323 935FD WA EPS (HK$) 0.07 0.17 0.19 0.25 0.68 0.14 0.16 0.22 0.27 0.79Wtd. avg. no. of shrs 1,068 1,068 1,068 1,068 1,068 1,180 1,180 1,180 1,180 1,180Margin analysis Gross margin 19.8% 21.8% 24.2% 24.3% 22.9% 23.5% 23.7% 23.7% 24.1% 23.8%Op. margin 5.5% 11.2% 11.1% 10.5% 8.5% 8.4% 8.5% 9.8% 10.7% 9.6%Pre-tax margin 5.0% 10.4% 10.0% 9.9% 9.3% 7.7% 7.8% 9.3% 10.2% 9.0%Effective tax rate 4.8% 12.2% 7.0% 7.0% 8.1% 7.0% 7.0% 7.0% 7.0% 6.9%Growth (% QoQ) Sales 0.0% 34.2% 9.0% 34.2% 94.9% (21.5%) 11.3% 16.4% 15.5% 31.2%Op. profit 0.0% 175.1% 7.7% 26.7% 420.9% (37.2%) 12.8% 35.1% 25.5% 47.1%Net income 0.0% 159.8% 11.6% 32.3% 3,051.8% (39.2%) 14.0% 37.9% 26.9% 29.0%FD WA EPS 0.0% 159.8% 11.6% 32.3% 2,605.1% (45.0%) 14.0% 37.9% 26.9% 16.8%Sales breakdown (HK$mn)* OBM- feature phone 1,213 1,603 1,712 2,009 6,537 1,552 1,736 1,999 2,286 7,573OBM- smartphone 0 0 0 302 302 333 387 499 623 1,842ODM 261 375 443 582 1,661 387 406 448 494 1,735 Total 1,474 1,978 2,156 2,894 8,501 2,272 2,530 2,946 3,403 11,150Sales breakdown (%)* OBM- feature phone 82.3% 81.1% 79.4% 69.4% 76.9% 68.3% 68.6% 67.9% 67.2% 67.9%OBM- smartphone 0.0% 0.0% 0.0% 10.4% 3.6% 14.6% 15.3% 16.9% 18.3% 16.5%ODM 17.7% 18.9% 20.6% 20.1% 19.5% 17.0% 16.1% 15.2% 14.5% 15.6% Total 100% 100% 100% 100% 100% 100% 100% 100% 100% 100%
Source: Company data, Yuanta
Note: A represents historical data reconciled by Yuanta
Yuanta TCL Communication (2618 HK) Hong Kong: Handsets 2 Nov, 2010 Greater China Discovery Series Page 15 of 25
Industry overview
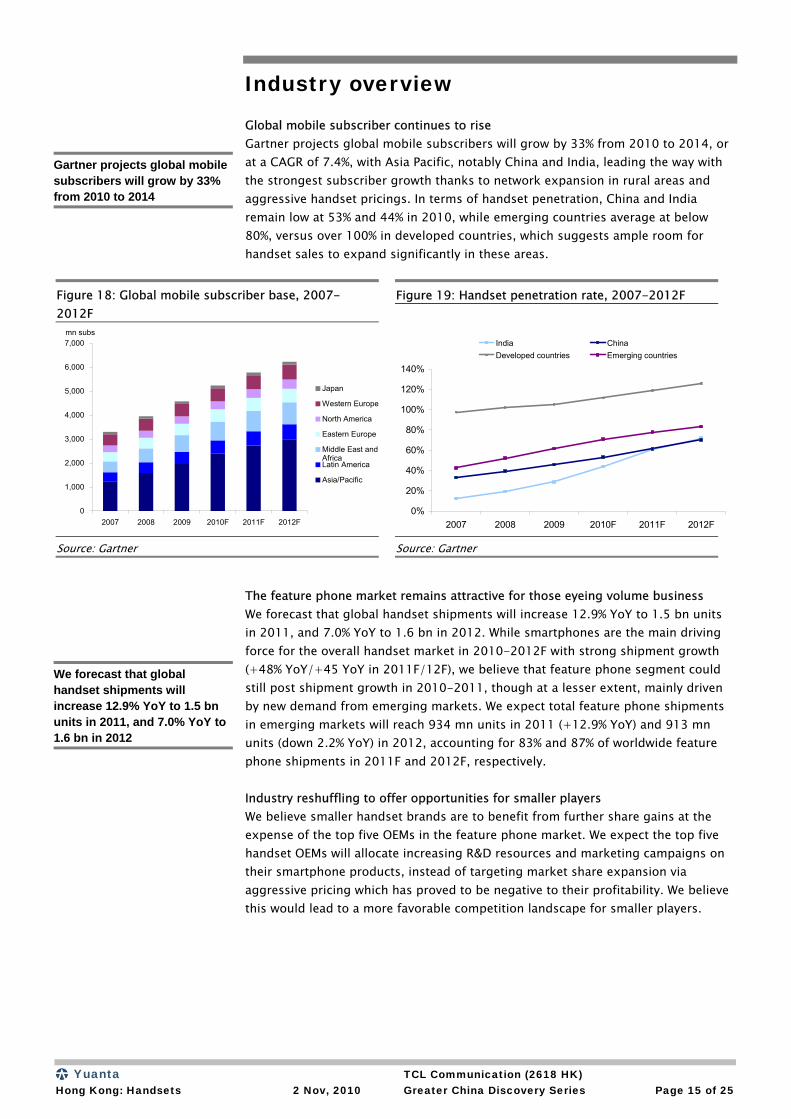
Global mobile subscriber continues to rise Gartner projects global mobile subscribers will grow by 33% from 2010 to 2014, or at a CAGR of 7.4%, with Asia Pacific, notably China and India, leading the way with the strongest subscriber growth thanks to network expansion in rural areas and aggressive handset pricings. In terms of handset penetration, China and India remain low at 53% and 44% in 2010, while emerging countries average at below 80%, versus over 100% in developed countries, which suggests ample room for handset sales to expand significantly in these areas.
Figure 18: Global mobile subscriber base, 2007-2012F
Figure 19: Handset penetration rate, 2007-2012F
0
1,000
2,000
3,000
4,000
5,000
6,000
7,000
2007 2008 2009 2010F 2011F 2012F
mn subs
Japan
Western Europe
North America
Eastern Europe
Middle East andAfricaLatin America
Asia/Pacific
0%
20%
40%
60%
80%
100%
120%
140%
2007 2008 2009 2010F 2011F 2012F
India ChinaDeveloped countries Emerging countries
Source: Gartner Source: Gartner
The feature phone market remains attractive for those eyeing volume business We forecast that global handset shipments will increase 12.9% YoY to 1.5 bn units in 2011, and 7.0% YoY to 1.6 bn in 2012. While smartphones are the main driving force for the overall handset market in 2010-2012F with strong shipment growth (+48% YoY/+45 YoY in 2011F/12F), we believe that feature phone segment could still post shipment growth in 2010-2011, though at a lesser extent, mainly driven by new demand from emerging markets. We expect total feature phone shipments in emerging markets will reach 934 mn units in 2011 (+12.9% YoY) and 913 mn units (down 2.2% YoY) in 2012, accounting for 83% and 87% of worldwide feature phone shipments in 2011F and 2012F, respectively. Industry reshuffling to offer opportunities for smaller players We believe smaller handset brands are to benefit from further share gains at the expense of the top five OEMs in the feature phone market. We expect the top five handset OEMs will allocate increasing R&D resources and marketing campaigns on their smartphone products, instead of targeting market share expansion via aggressive pricing which has proved to be negative to their profitability. We believe this would lead to a more favorable competition landscape for smaller players.
Gartner projects global mobile subscribers will grow by 33% from 2010 to 2014
We forecast that global handset shipments will increase 12.9% YoY to 1.5 bn units in 2011, and 7.0% YoY to 1.6 bn in 2012
Yuanta TCL Communication (2618 HK) Hong Kong: Handsets 2 Nov, 2010 Greater China Discovery Series Page 16 of 25
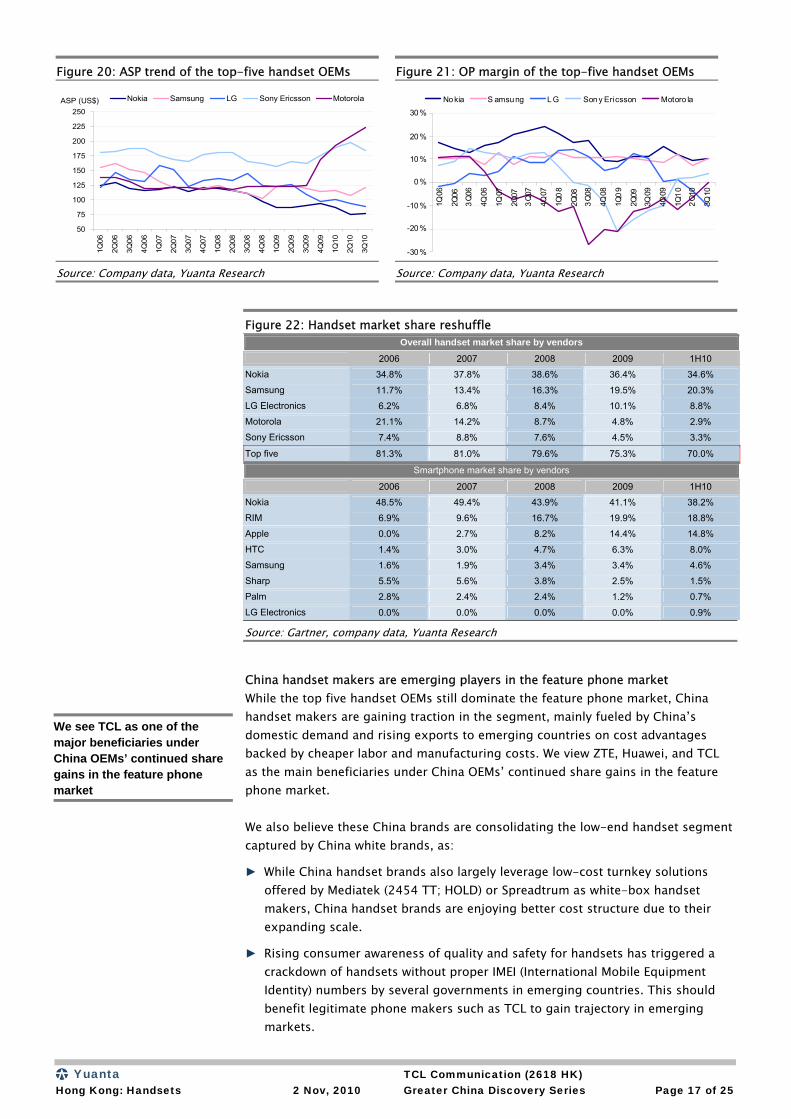
Nokia Nokia remains the largest handset maker in the world and continues to perform well in low- and mid-end devices. Its market share, however, has dropped from 38.6 % in 2008 to around 32% in 3Q10. It is also facing deteriorating ASPs and margins dragged by its weak positioning in the smartphone segment due to a lack of compelling products and limited touchscreen line-ups to attract customers. Although Nokia has demonstrated its clear intentions to regain lost ground by restructuring the group to accelerate product innovation and the introduction of new platforms, the Symbian^3 and MeeGo (co-developed with Intel, to be launched in 2011) to target high-end segments, we believe Nokia will continue to undergo share lose pressure in the near term and the revitalization of its smartphone segment is undoubtly the company’s top priority at the current stage. Motorola After 14 loss-making quarters and several structural reshuffles, Motorola has made a come back in the handset market with the success of its “Droid” smartphone series and turned profitable in 3Q10. We believe Motorola will concentrate on enhancing its smartphone portfolio, in order to drive ASP/margins and further regain its brand value in the handset market. Sony Ericsson As for Sony Ericsson who has never really been a devoted player in the mid-/low-end feature phone segment, we see no major change in its strategy as it will pursue the value sector of the market to ensure ASP and profit sustainability. Samsung Samsung is one the biggest winners in 2009 with shipment growth outpacing the industry, but the strength was mainly in the feature phone segment and its smartphone portfolio had been lagging behind its rivals within the Android camp. The launch of Galaxy S series in mid 2010 along with aggressive campaigns and multi-operator cooperation signaled Samsung’s ambition to catch up in the smartphone space. We expect Samsung will continue to work on enriching its smartphone platform, including Android and Windows Phone 7, in order to keep pace with the industry trend as well as to maintain its ASP/margins. LG Like its Korean peer Samsung, LG posted impressive shipment growth in 2009, mainly in the feature phone segment. Nevertheless, LG saw the second consecutive loss (at operating level) in its handset business in 3Q10, which the company attributed to sales and ASP declines in the developed market. Given that ASP pressure in the handset market is only getting worse amidst intensified competition, we believe LG will continue to struggle on its operating level, unless it is able to allocate resources to create key differentiators in its smartphone line-ups and lift its brand awareness, hence enabling meaningful ASP improvements.
We believe Nokia will continue to undergo share lose pressure in the near term
Yuanta TCL Communication (2618 HK) Hong Kong: Handsets 2 Nov, 2010 Greater China Discovery Series Page 17 of 25
Figure 20: ASP trend of the top-five handset OEMs Figure 21: OP margin of the top-five handset OEMs
50
75
100
125
150
175
200
225
250
1Q06
2Q06
3Q06
4Q06
1Q07
2Q07
3Q07
4Q07
1Q08
2Q08
3Q08
4Q08
1Q09
2Q09
3Q09
4Q09
1Q10
2Q10
3Q10
ASP (US$) Nokia Samsung LG Sony Ericsson Motorola
-30 %
-20 %
-10 %
0 %
10 %
20 %
30 %
1Q06
2Q06
3Q06
4Q06
1Q07
2Q07
3Q07
4Q07
1Q0
8
2Q08
3Q08
4Q08
1Q0
9
2Q09
3Q09
4Q09
1Q1
0
2Q10
3Q10
Nokia S amsung L G Son y Ericsson Motoro la
Source: Company data, Yuanta Research Source: Company data, Yuanta Research
Figure 22: Handset market share reshuffle Overall handset market share by vendors
2006 2007 2008 2009 1H10
Nokia 34.8% 37.8% 38.6% 36.4% 34.6%
Samsung 11.7% 13.4% 16.3% 19.5% 20.3% LG Electronics 6.2% 6.8% 8.4% 10.1% 8.8%
Motorola 21.1% 14.2% 8.7% 4.8% 2.9%
Sony Ericsson 7.4% 8.8% 7.6% 4.5% 3.3%
Top five 81.3% 81.0% 79.6% 75.3% 70.0%
Smartphone market share by vendors
2006 2007 2008 2009 1H10
Nokia 48.5% 49.4% 43.9% 41.1% 38.2% RIM 6.9% 9.6% 16.7% 19.9% 18.8%
Apple 0.0% 2.7% 8.2% 14.4% 14.8%
HTC 1.4% 3.0% 4.7% 6.3% 8.0% Samsung 1.6% 1.9% 3.4% 3.4% 4.6%
Sharp 5.5% 5.6% 3.8% 2.5% 1.5% Palm 2.8% 2.4% 2.4% 1.2% 0.7%
LG Electronics 0.0% 0.0% 0.0% 0.0% 0.9%
Source: Gartner, company data, Yuanta Research
China handset makers are emerging players in the feature phone market While the top five handset OEMs still dominate the feature phone market, China handset makers are gaining traction in the segment, mainly fueled by China’s domestic demand and rising exports to emerging countries on cost advantages backed by cheaper labor and manufacturing costs. We view ZTE, Huawei, and TCL as the main beneficiaries under China OEMs’ continued share gains in the feature phone market. We also believe these China brands are consolidating the low-end handset segment captured by China white brands, as:
► While China handset brands also largely leverage low-cost turnkey solutions offered by Mediatek (2454 TT; HOLD) or Spreadtrum as white-box handset makers, China handset brands are enjoying better cost structure due to their expanding scale.
► Rising consumer awareness of quality and safety for handsets has triggered a crackdown of handsets without proper IMEI (International Mobile Equipment Identity) numbers by several governments in emerging countries. This should benefit legitimate phone makers such as TCL to gain trajectory in emerging markets.
We see TCL as one of the major beneficiaries under China OEMs’ continued share gains in the feature phone market
Yuanta TCL Communication (2618 HK) Hong Kong: Handsets 2 Nov, 2010 Greater China Discovery Series Page 18 of 25
Company overview
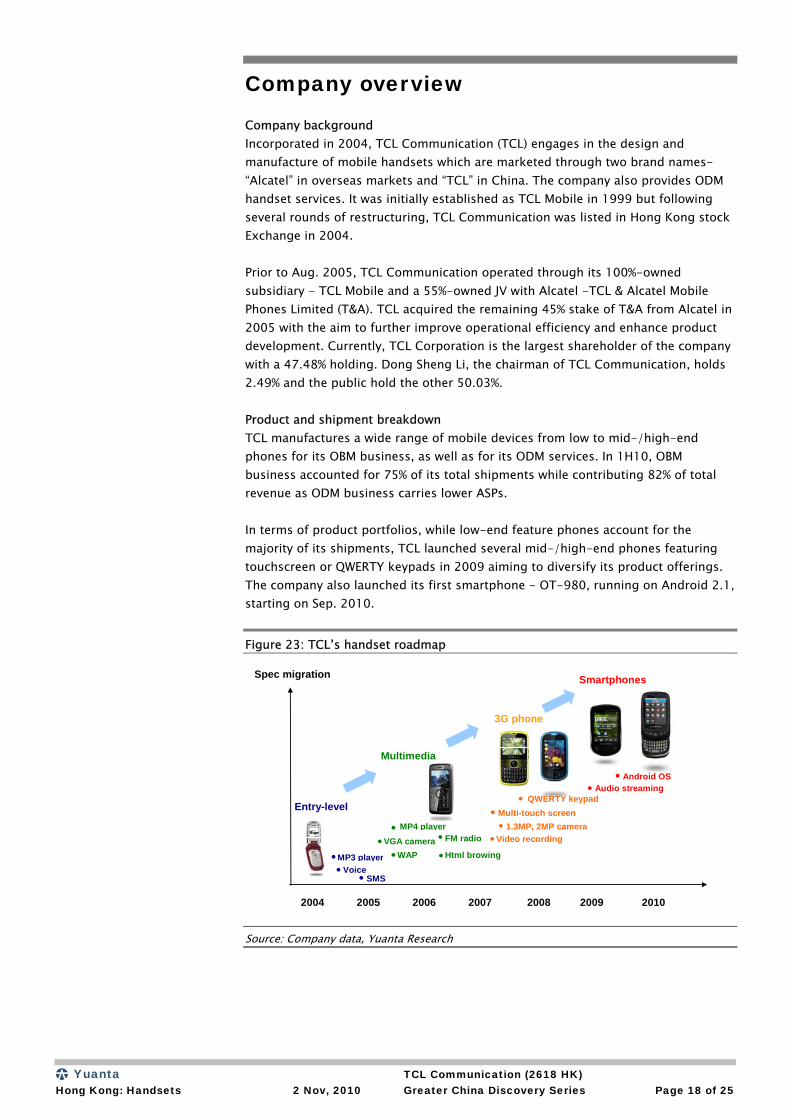
Company background Incorporated in 2004, TCL Communication (TCL) engages in the design and manufacture of mobile handsets which are marketed through two brand names- “Alcatel” in overseas markets and “TCL” in China. The company also provides ODM handset services. It was initially established as TCL Mobile in 1999 but following several rounds of restructuring, TCL Communication was listed in Hong Kong stock Exchange in 2004. Prior to Aug. 2005, TCL Communication operated through its 100%-owned subsidiary - TCL Mobile and a 55%-owned JV with Alcatel -TCL & Alcatel Mobile Phones Limited (T&A). TCL acquired the remaining 45% stake of T&A from Alcatel in 2005 with the aim to further improve operational efficiency and enhance product development. Currently, TCL Corporation is the largest shareholder of the company with a 47.48% holding. Dong Sheng Li, the chairman of TCL Communication, holds 2.49% and the public hold the other 50.03%. Product and shipment breakdown TCL manufactures a wide range of mobile devices from low to mid-/high-end phones for its OBM business, as well as for its ODM services. In 1H10, OBM business accounted for 75% of its total shipments while contributing 82% of total revenue as ODM business carries lower ASPs. In terms of product portfolios, while low-end feature phones account for the majority of its shipments, TCL launched several mid-/high-end phones featuring touchscreen or QWERTY keypads in 2009 aiming to diversify its product offerings. The company also launched its first smartphone - OT-980, running on Android 2.1, starting on Sep. 2010.
Figure 23: TCL’s handset roadmap
Spec migration
2004 2005 2006 2007 2008 2009 2010
Smartphones
Entry-level
Multimedia
3G phone
MP4 player
QWERTY keypad
Android OS
Multi-touch screen
MP3 player
1.3MP, 2MP cameraVGA camera FM radio
Voice
Audio streaming
Html browing
SMS
WAP
Video recording
Source: Company data, Yuanta Research
Yuanta TCL Communication (2618 HK) Hong Kong: Handsets 2 Nov, 2010 Greater China Discovery Series Page 19 of 25
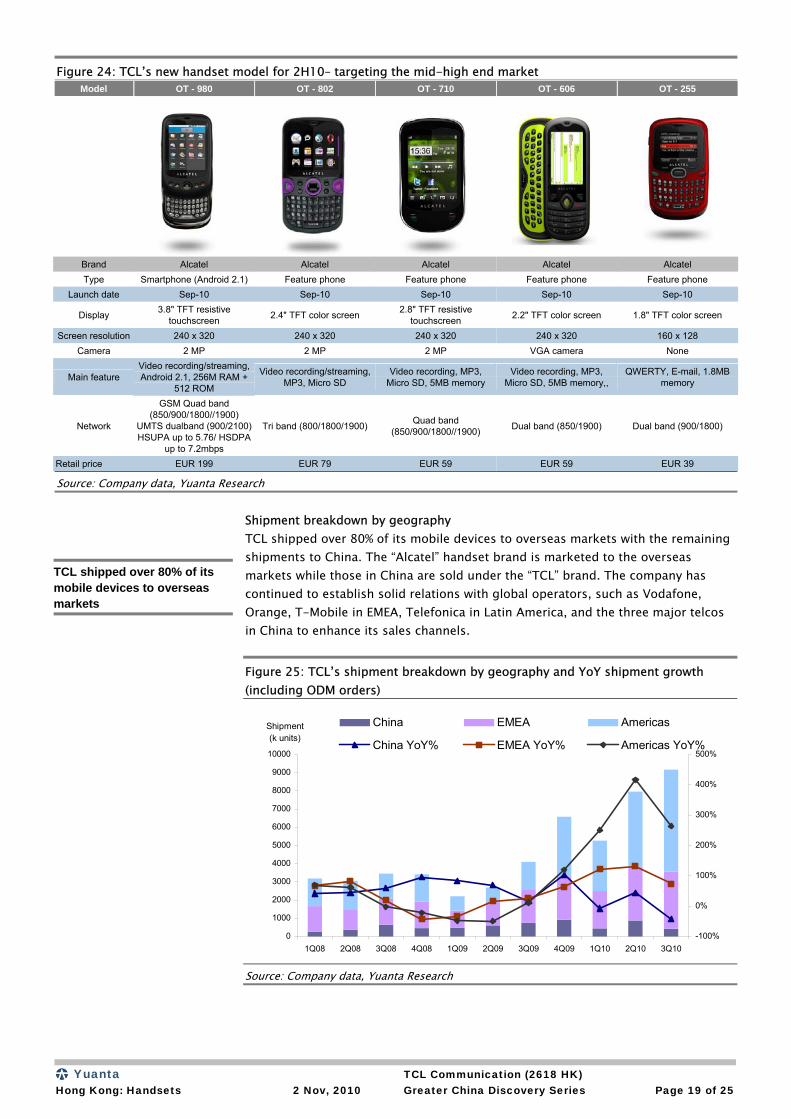
Figure 24: TCL’s new handset model for 2H10– targeting the mid-high end market Model OT - 980 OT - 802 OT - 710 OT - 606 OT - 255
Brand Alcatel Alcatel Alcatel Alcatel Alcatel Type Smartphone (Android 2.1) Feature phone Feature phone Feature phone Feature phone
Launch date Sep-10 Sep-10 Sep-10 Sep-10 Sep-10
Display 3.8" TFT resistive touchscreen 2.4" TFT color screen 2.8" TFT resistive
touchscreen 2.2" TFT color screen 1.8" TFT color screen
Screen resolution 240 x 320 240 x 320 240 x 320 240 x 320 160 x 128 Camera 2 MP 2 MP 2 MP VGA camera None
Main feature Video recording/streaming, Android 2.1, 256M RAM +
512 ROM
Video recording/streaming, MP3, Micro SD
Video recording, MP3, Micro SD, 5MB memory
Video recording, MP3, Micro SD, 5MB memory,,
QWERTY, E-mail, 1.8MB memory
Network
GSM Quad band (850/900/1800//1900)
UMTS dualband (900/2100) HSUPA up to 5.76/ HSDPA
up to 7.2mbps
Tri band (800/1800/1900) Quad band (850/900/1800//1900) Dual band (850/1900) Dual band (900/1800)
Retail price EUR 199 EUR 79 EUR 59 EUR 59 EUR 39
Source: Company data, Yuanta Research
Shipment breakdown by geography TCL shipped over 80% of its mobile devices to overseas markets with the remaining shipments to China. The “Alcatel” handset brand is marketed to the overseas markets while those in China are sold under the “TCL” brand. The company has continued to establish solid relations with global operators, such as Vodafone, Orange, T-Mobile in EMEA, Telefonica in Latin America, and the three major telcos in China to enhance its sales channels. Figure 25: TCL’s shipment breakdown by geography and YoY shipment growth (including ODM orders)
0
1000
2000
3000
4000
5000
6000
7000
8000
9000
10000
1Q08 2Q08 3Q08 4Q08 1Q09 2Q09 3Q09 4Q09 1Q10 2Q10 3Q10
Shipment(k units)
-100%
0%
100%
200%
300%
400%
500%
China EMEA Americas
China YoY% EMEA YoY% Americas YoY%
Source: Company data, Yuanta Research
TCL shipped over 80% of its mobile devices to overseas markets
Yuanta TCL Communication (2618 HK) Hong Kong: Handsets 2 Nov, 2010 Greater China Discovery Series Page 20 of 25
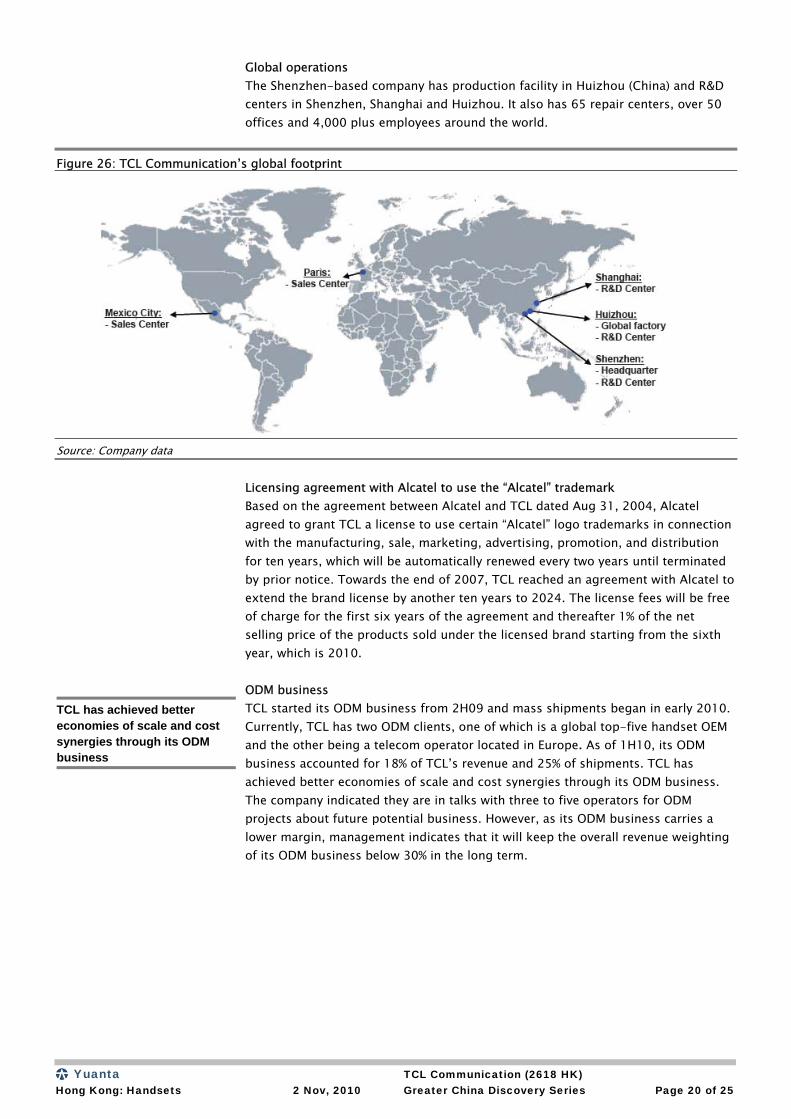
Global operations The Shenzhen-based company has production facility in Huizhou (China) and R&D centers in Shenzhen, Shanghai and Huizhou. It also has 65 repair centers, over 50 offices and 4,000 plus employees around the world.
Figure 26: TCL Communication’s global footprint
Source: Company data
Licensing agreement with Alcatel to use the “Alcatel” trademark Based on the agreement between Alcatel and TCL dated Aug 31, 2004, Alcatel agreed to grant TCL a license to use certain “Alcatel” logo trademarks in connection with the manufacturing, sale, marketing, advertising, promotion, and distribution for ten years, which will be automatically renewed every two years until terminated by prior notice. Towards the end of 2007, TCL reached an agreement with Alcatel to extend the brand license by another ten years to 2024. The license fees will be free of charge for the first six years of the agreement and thereafter 1% of the net selling price of the products sold under the licensed brand starting from the sixth year, which is 2010.
ODM business TCL started its ODM business from 2H09 and mass shipments began in early 2010. Currently, TCL has two ODM clients, one of which is a global top-five handset OEM and the other being a telecom operator located in Europe. As of 1H10, its ODM business accounted for 18% of TCL’s revenue and 25% of shipments. TCL has achieved better economies of scale and cost synergies through its ODM business. The company indicated they are in talks with three to five operators for ODM projects about future potential business. However, as its ODM business carries a lower margin, management indicates that it will keep the overall revenue weighting of its ODM business below 30% in the long term.
TCL has achieved better economies of scale and cost synergies through its ODM business
Yuanta TCL Communication (2618 HK) Hong Kong: Handsets 2 Nov, 2010 Greater China Discovery Series Page 21 of 25
Management team ► Mr. Dongsheng Li, Chairman and President: Mr. Li was one of the founders of
TCL Corporation. Mr. Li is responsible for overseeing the corporate strategies and the company’s operations. He has more than 20 years of experience in the manufacturing and sales of electronic products. He holds a Bachelor’s Degree in Science from South China University of Technology.
► Dr. Aiping Guo (George), CEO and Vice President: Dr. Guo joined TCL Group in 2001 and has been appointed the COO, Senior Vice President and President of the company. He has extensive experience in overall management, strategic planning and development in the wireless industry. Prior to joining TCL, Mr. Guo held positions as Project Coordinator for IBM, Senior Business Consultant in Arthur Andersen and Chief Technology Officer in Zhaodaola Internet Company. Dr. Guo graduated from Stanford University with a Doctor’s Degree in Management Science and Engineering.
► Mr. Lianming Bo, COO: Mr. Bo joined TCL in 2000. He has over nine years of experience in the consumer electronics products industry. Mr. Bo held several management positions including VP and Financial Director of TCL IT Industrial Group, VP of TCL Component Strategic Business Unit, as well as Human Resources Director and Senior VP of TCL Corporation. Prior to joining TCL, he was the chief accountant of Shenzhen Airlines. Mr. Guo graduated from Xi-An Jiaotong University with a Doctor’s Degree in Business Management.
► Mr. Thomas Yuk Tung Liu, CFO: Mr. Liu has over 20 years of experience in auditing, international finance and trading business. Prior to joining TCL, he was the Asia Pacific Regional Financial Controller of Stratus Corporation in US and the Sales and Marketing Director and General Manager of Neo-Neon Holdings Limited. Mr. Liu holds a Bachelor’s Degree in Economics from University of Hong Kong, a MBA from the University of New South Wales, Australia, and a Master’s Degree in Accounting from Jinan University, PRC.
Yuanta TCL Communication (2618 HK) Hong Kong: Handsets 2 Nov, 2010 Greater China Discovery Series Page 22 of 25
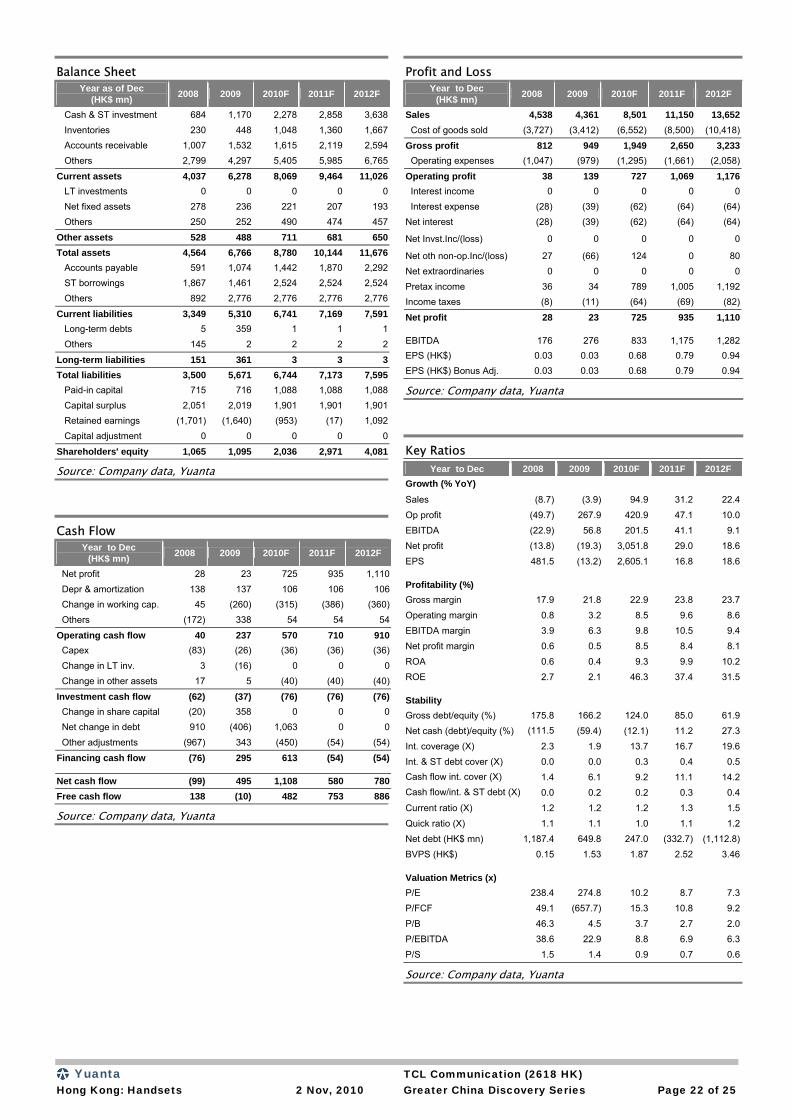
Balance Sheet Year as of Dec
(HK$ mn) 2008 2009 2010F 2011F 2012F
Cash & ST investment 684 1,170 2,278 2,858 3,638 Inventories 230 448 1,048 1,360 1,667 Accounts receivable 1,007 1,532 1,615 2,119 2,594 Others 2,799 4,297 5,405 5,985 6,765
Current assets 4,037 6,278 8,069 9,464 11,026 LT investments 0 0 0 0 0 Net fixed assets 278 236 221 207 193 Others 250 252 490 474 457
Other assets 528 488 711 681 650Total assets 4,564 6,766 8,780 10,144 11,676 Accounts payable 591 1,074 1,442 1,870 2,292 ST borrowings 1,867 1,461 2,524 2,524 2,524 Others 892 2,776 2,776 2,776 2,776
Current liabilities 3,349 5,310 6,741 7,169 7,591 Long-term debts 5 359 1 1 1 Others 145 2 2 2 2
Long-term liabilities 151 361 3 3 3Total liabilities 3,500 5,671 6,744 7,173 7,595 Paid-in capital 715 716 1,088 1,088 1,088 Capital surplus 2,051 2,019 1,901 1,901 1,901 Retained earnings (1,701) (1,640) (953) (17) 1,092 Capital adjustment 0 0 0 0 0
Shareholders' equity 1,065 1,095 2,036 2,971 4,081
Source: Company data, Yuanta
Cash Flow
Year to Dec (HK$ mn) 2008 2009 2010F 2011F 2012F
Net profit 28 23 725 935 1,110 Depr & amortization 138 137 106 106 106 Change in working cap. 45 (260) (315) (386) (360) Others (172) 338 54 54 54
Operating cash flow 40 237 570 710 910 Capex (83) (26) (36) (36) (36) Change in LT inv. 3 (16) 0 0 0 Change in other assets 17 5 (40) (40) (40)
Investment cash flow (62) (37) (76) (76) (76) Change in share capital (20) 358 0 0 0 Net change in debt 910 (406) 1,063 0 0 Other adjustments (967) 343 (450) (54) (54)
Financing cash flow (76) 295 613 (54) (54)
Net cash flow (99) 495 1,108 580 780Free cash flow 138 (10) 482 753 886
Source: Company data, Yuanta
Profit and Loss Year to Dec
(HK$ mn) 2008 2009 2010F 2011F 2012F
Sales 4,538 4,361 8,501 11,150 13,652 Cost of goods sold (3,727) (3,412) (6,552) (8,500) (10,418)
Gross profit 812 949 1,949 2,650 3,233 Operating expenses (1,047) (979) (1,295) (1,661) (2,058)
Operating profit 38 139 727 1,069 1,176 Interest income 0 0 0 0 0 Interest expense (28) (39) (62) (64) (64)Net interest (28) (39) (62) (64) (64)
Net Invst.Inc/(loss) 0 0 0 0 0
Net oth non-op.Inc/(loss) 27 (66) 124 0 80Net extraordinaries 0 0 0 0 0Pretax income 36 34 789 1,005 1,192Income taxes (8) (11) (64) (69) (82)
Net profit 28 23 725 935 1,110
EBITDA 176 276 833 1,175 1,282EPS (HK$) 0.03 0.03 0.68 0.79 0.94EPS (HK$) Bonus Adj. 0.03 0.03 0.68 0.79 0.94
Source: Company data, Yuanta
Key Ratios
Year to Dec 2008 2009 2010F 2011F 2012F Growth (% YoY)
Sales (8.7) (3.9) 94.9 31.2 22.4Op profit (49.7) 267.9 420.9 47.1 10.0EBITDA (22.9) 56.8 201.5 41.1 9.1Net profit (13.8) (19.3) 3,051.8 29.0 18.6EPS 481.5 (13.2) 2,605.1 16.8 18.6
Profitability (%)
Gross margin 17.9 21.8 22.9 23.8 23.7Operating margin 0.8 3.2 8.5 9.6 8.6EBITDA margin 3.9 6.3 9.8 10.5 9.4Net profit margin 0.6 0.5 8.5 8.4 8.1ROA 0.6 0.4 9.3 9.9 10.2ROE 2.7 2.1 46.3 37.4 31.5
Stability
Gross debt/equity (%) 175.8 166.2 124.0 85.0 61.9Net cash (debt)/equity (%) (111.5 (59.4) (12.1) 11.2 27.3Int. coverage (X) 2.3 1.9 13.7 16.7 19.6Int. & ST debt cover (X) 0.0 0.0 0.3 0.4 0.5Cash flow int. cover (X) 1.4 6.1 9.2 11.1 14.2Cash flow/int. & ST debt (X) 0.0 0.2 0.2 0.3 0.4Current ratio (X) 1.2 1.2 1.2 1.3 1.5Quick ratio (X) 1.1 1.1 1.0 1.1 1.2Net debt (HK$ mn) 1,187.4 649.8 247.0 (332.7) (1,112.8)BVPS (HK$) 0.15 1.53 1.87 2.52 3.46
Valuation Metrics (x) P/E 238.4 274.8 10.2 8.7 7.3P/FCF 49.1 (657.7) 15.3 10.8 9.2P/B 46.3 4.5 3.7 2.7 2.0P/EBITDA 38.6 22.9 8.8 6.9 6.3P/S 1.5 1.4 0.9 0.7 0.6
Source: Company data, Yuanta
Yuanta TCL Communication (2618 HK) Hong Kong: Handsets 2 Nov, 2010 Greater China Discovery Series Page 23 of 25
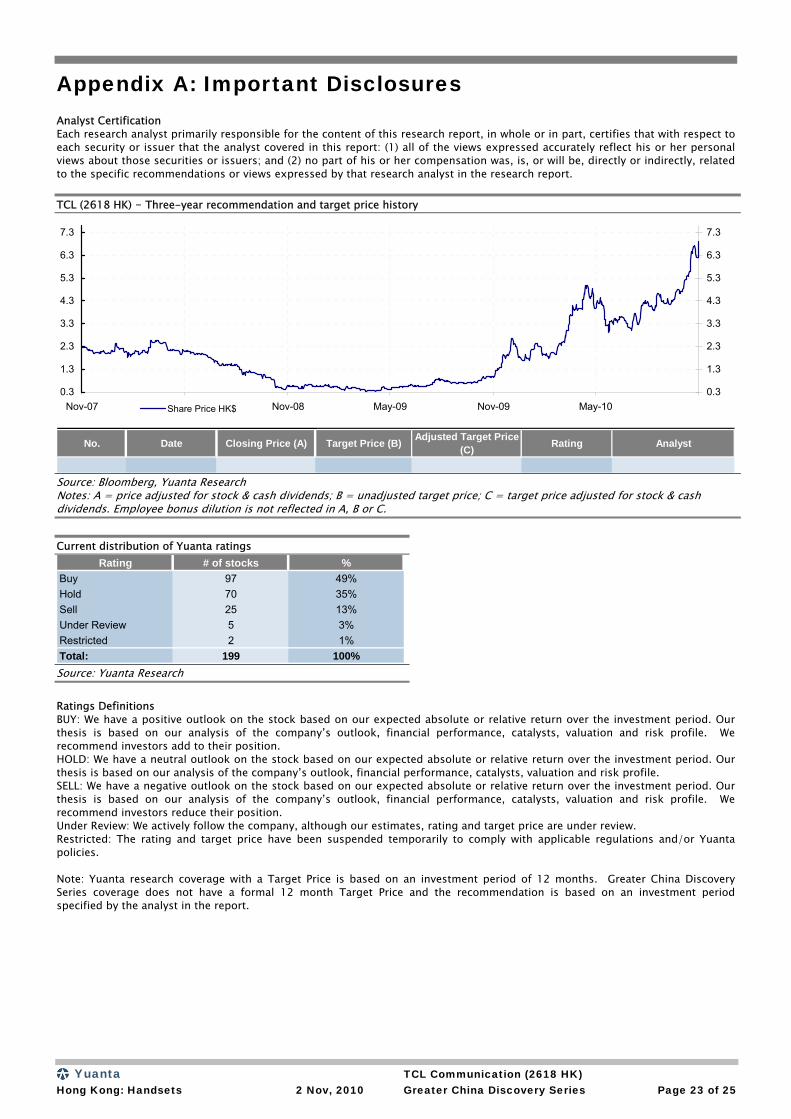
Appendix A: Important Disclosures Analyst Certification Each research analyst primarily responsible for the content of this research report, in whole or in part, certifies that with respect to each security or issuer that the analyst covered in this report: (1) all of the views expressed accurately reflect his or her personal views about those securities or issuers; and (2) no part of his or her compensation was, is, or will be, directly or indirectly, related to the specific recommendations or views expressed by that research analyst in the research report. TCL (2618 HK) – Three-year recommendation and target price history
No. Date Closing Price (A) Target Price (B) Adjusted Target Price (C) Rating Analyst
0.3
1.3
2.3
3.3
4.3
5.3
6.3
7.3
Nov-07 May-08 Nov-08 May-09 Nov-09 May-100.3
1.3
2.3
3.3
4.3
5.3
6.3
7.3
Share Price HK$
Source: Bloomberg, Yuanta Research Notes: A = price adjusted for stock & cash dividends; B = unadjusted target price; C = target price adjusted for stock & cash dividends. Employee bonus dilution is not reflected in A, B or C. Current distribution of Yuanta ratings
Rating # of stocks %Buy 97 49%Hold 70 35%Sell 25 13%Under Review 5 3%Restricted 2 1%Total: 199 100% Source: Yuanta Research Ratings Definitions BUY: We have a positive outlook on the stock based on our expected absolute or relative return over the investment period. Our thesis is based on our analysis of the company’s outlook, financial performance, catalysts, valuation and risk profile. We recommend investors add to their position. HOLD: We have a neutral outlook on the stock based on our expected absolute or relative return over the investment period. Our thesis is based on our analysis of the company’s outlook, financial performance, catalysts, valuation and risk profile. SELL: We have a negative outlook on the stock based on our expected absolute or relative return over the investment period. Our thesis is based on our analysis of the company’s outlook, financial performance, catalysts, valuation and risk profile. We recommend investors reduce their position. Under Review: We actively follow the company, although our estimates, rating and target price are under review. Restricted: The rating and target price have been suspended temporarily to comply with applicable regulations and/or Yuanta policies. Note: Yuanta research coverage with a Target Price is based on an investment period of 12 months. Greater China Discovery Series coverage does not have a formal 12 month Target Price and the recommendation is based on an investment period specified by the analyst in the report.
Yuanta TCL Communication (2618 HK) Hong Kong: Handsets 2 Nov, 2010 Greater China Discovery Series Page 24 of 25
Global Disclaimer © 2010 Yuanta. All rights reserved. The information in this report has been compiled from sources we believe to be reliable, but we do not hold ourselves responsible for its completeness or accuracy. It is not an offer to sell or solicitation of an offer to buy any securities. All opinions and estimates included in this report constitute our judgment as of this date and are subject to change without notice. This report provides general information only. Neither the information nor any opinion expressed herein constitutes an offer or invitation to make an offer to buy or sell securities or other investments. This material is prepared for general circulation to clients and is not intended to provide tailored investment advice and does not take into account the individual financial situation and objectives of any specific person who may receive this report. Investors should seek financial advice regarding the appropriateness of investing in any securities, investments or investment strategies discussed or recommended in this report. The information contained in this report has been compiled from sources believed to be reliable but no representation or warranty, express or implied, is made as to its accuracy, completeness or correctness. This report is not (and should not be construed as) a solicitation to act as securities broker or dealer in any jurisdiction by any person or company that is not legally permitted to carry on such business in that jurisdiction. Yuanta research is distributed in the United States only to Major U.S. Institutional Investors (as defined in Rule 15a-6 under the Securities Exchange Act of 1934, as amended and SEC staff interpretations thereof). All transactions by a US person in the securities mentioned in this report must be effected through a registered broker-dealer under Section 15 of the Securities Exchange Act of 1934, as amended. Yuanta research is distributed in Taiwan by Yuanta Securities Taiwan. Yuanta research is distributed in Hong Kong by Yuanta Securities (Hong Kong) Limited, which is licensed in Hong Kong by the Securities and Futures Commission for regulated activities, including Type 4 regulated activity (advising on securities). In Hong Kong, this research report may not be redistributed, retransmitted or disclosed, in whole or in part or and any form or manner, without the express written consent of Yuanta Securities (Hong Kong) Limited. Taiwan persons wishing to obtain further information on any of the securities mentioned in this publication should contact: Attn: Institutional Department Yuanta Securities Taiwan 13F, 2-3, 225, Section 3 Nanking East Road, Taipei 104 Taiwan Hong Kong persons wishing to obtain further information on any of the securities mentioned in this publication should contact: Attn: Research Yuanta Securities (Hong Kong) Limited 23/F, Li Po Chun Chambers, 189 Des Voeux Road, Central Hong Kong
Yuanta Greater China Equities
Research
Gary Chia Head of Greater China Research +886 2 3518 7900 [email protected]
Ming Tan, CFA Deputy Head of Greater China Research Head of Financials +852 3969 9525 [email protected]
John Brebeck, CFA Head of Research, Taiwan Head of Taiwan Strategy +886 2 3518 7906 [email protected]
Kelvin Ho Deputy Head of China Research Head of Telecom and Media +86 21 6187 3812 [email protected]
Vincent Chen Head of Technology Research Tech Strategist +852 3969 9903 [email protected]
George Chang, CFA Head of Upstream Tech +886 2 3518 7907 [email protected]
Kevin Gin, CFA Head of Real Estate +852 3969 9515 [email protected]
Min Li Head of Alternative Energy +852 3969 9521 [email protected]
Charles Z. Yan, CFA Head of Consumer +852 3969 9530 [email protected]
Danny Ho Taiwan Petrochemical +886 2 3518 7923 [email protected]
Kim-Chong Tan China Energy +852 3969 9526 [email protected]
Tess Wang Taiwan Financials +886 2 3518 7901 [email protected]
Johnny Wong Transportation & Conglomerates +852 3969 9524 [email protected]
Dennis Chan Notebook Supply Chain +886 2 3518 7913 [email protected]
Bonnie Chang Handsets +852 3969 9904 [email protected]
Claire Chang China Telecom & Media +852 3969 9516 claire.chang @yuanta.com
Andrew C Chen IC Backend +886 2 3518 7940 [email protected]
Larry Cho Small Cap +852 3969 9523 [email protected]
Ming Hsun Lee, CFA Taiwan Small & Mid Cap +886 2 3518 7938 [email protected]
Joy Lin Hong Kong Financials +852 3969 9522 [email protected]
May Lin Taiwan Telecom & Media +886 2 3518 7942 [email protected]
Luke Qian China Retail +86 21 6187 3821 [email protected]
Wendy Wang Alternative Energy +852 3969 9519 [email protected]
Sales and Trading
James Poon Head of Hong Kong Cash Equities/President + 852 3969 9860 [email protected]
Arthur Lo Head of Greater China Sales Coverage +852 3969 9866 [email protected]
John Chang Head of Taiwan Equities +886 2 2175 8898 [email protected]
Juan Tseng Head of Taiwan Sales +886 2 2175 8962 [email protected]
Duncan Wun Head of Hong Kong Sales +852 3969 9869 [email protected]
Dan Clarke Head of Greater China Execution +886 2 2175 8958 [email protected]
Chris Dunham Head of HK Sales Trading & Execution +852 3969 9768 [email protected]
Fanny Lin Head of Dealing +886 2 2175 8818 [email protected]
Riga Saito Head of Taiwan Sales Trading +886 2 2175 8800 [email protected]
Kerry Chen - Sales +886 2 2175 8922 [email protected]
Leo Hu - Sales +886 2 2175 8880 [email protected]
Vickie Hu - Sales +852 3969 9878 [email protected]
Chan Hui – Sales Trading +852 3969 9728 [email protected]
Jesse Knutson – Sales Trading +886 2 2175 8936 [email protected]
Michael Lin - Sales +886 2 2175 8977 [email protected]
Charles Nissen - Sales +852 3969 9832 [email protected]
Winnie Shek – Sales Trading +852 3969 9769 [email protected]
Joanna Shih - Sales +886 2 2175 8960 [email protected]
Ming Yi Tan - Sales +852 3969 9879 [email protected]
Joyce Wan - Sales +852 3969 9876 [email protected]
Jason Wang – Sales Trading +886 2 2175 8888 [email protected]
![IN THE COURT OF APPEAL OF THE REPUBLIC OF ......Yuanta Asset Management International Limited v [2018] SGCA(I) 03 Telemedia Pacific Group Ltd 2 were the plaintiffs while Yuanta and](https://img.pdfslide.net/doc/110x75/5f3ee63d0771a44a433a584d/in-the-court-of-appeal-of-the-republic-of-yuanta-asset-management-international.jpg)