Embed Size (px)
Citation preview
WWW.THEICCT.ORG© INTERNATIONAL COUNCIL ON CLEAN TRANSPORTATION, 2016
An emissions inventory for agricultural tractors and construction equipment in IndiaAuthor: Zhenying Shao
Date: 17 May 2016
Keywords: Air pollution, diesel engines, off-road emissions, non-road emissions, particulate matter (PM),
nitrogen oxides (NOX), Bharat Stage III emission standards
BACKGROUND
Ind ia suf fers f rom severe a i r pollution. In 2014, the World Health Organization announced that India’s cities were among the most polluted in the world.1 Mobile sources are major contributors to local air pollution due to the emissions from combustion. Aggressive measures have been planned to control emissions from on-road motor vehicles. They include a clear roadmap toward ultralow-sulfur fuel and filter-forcing Bharat Stage VI (BS VI) emission standards,2 which ensure that all new on-road diesel engines are equipped with the latest emission control technologies, including diesel particulate filters (DPFs), to maximally reduce tailpipe emissions.
However, limited attention has been paid to non-road (land-based) mobile sources, even though the majority of them are powered by diesel engines. These engines usually emit much higher unit pollutants than on-road engines, due to less stringent regulation and enforce-ment. This raises concerns about their potential emissions, including fine
1 World Health Organization (2014), Ambient (outdoor) air pollution in cities database 2014, retrieved from http://www.who.int/phe/health_topics/outdoorair/databases/cities/en/.
2 Gazette of India BS VI notification: http://egazette.nic.in/WriteReadData/2016/168300.pdf
particulate matter with a diameter of 2.5 micrometers or less (PM2.5) and nitrogen oxides (NOx), considering the rapidly growing market. These engines increase the chances of the public being exposed to high levels of pollution, leading to deteriorat-ing health conditions in India. To adequately control those sources, it is necessary to understand their market characteristics and the devel-opment of their emissions inventory.
This study looks into two key types of non-road mobile sources: agri-cultural tractors and construction equipment. Agricultural tractors are widely used in rural areas, and often operate beyond their designated tasks , se rv ing as a l te rnat ive transportation for passengers and goods. Most construction equipment is used in or near India’s urban centers, where population density is high and air quality is typically poor. Both agricultural tractors and construction equipment use limited emission control technology. As a result, emissions from their diesel engines are expected to be significant, and will potentially have strong negative impacts on local air quality and health in India.
Few data exist on the fleet charac-teristics and usage patterns of agri-cultural tractors and construction equipment. This preliminary study is intended to shed some light on
non-road emissions in India and to call for more attention and action.
THE NON-ROAD EQUIPMENT MARKET
This section examines sales trends for agricultural tractors and construc-tion equipment separately, breaking down the new equipment fleet by engine size and (for construction equipment only) by equipment type.
Agricultural tractors
Agriculture is one of the main drivers of the Indian economy, accounting for 18% of gross domestic product in recent years.3 With its growing population and shrinking agricultural land base, India is experiencing a rapid transition toward agricultural mechanization for higher produc-tivity, and this trend is expected to continue.4
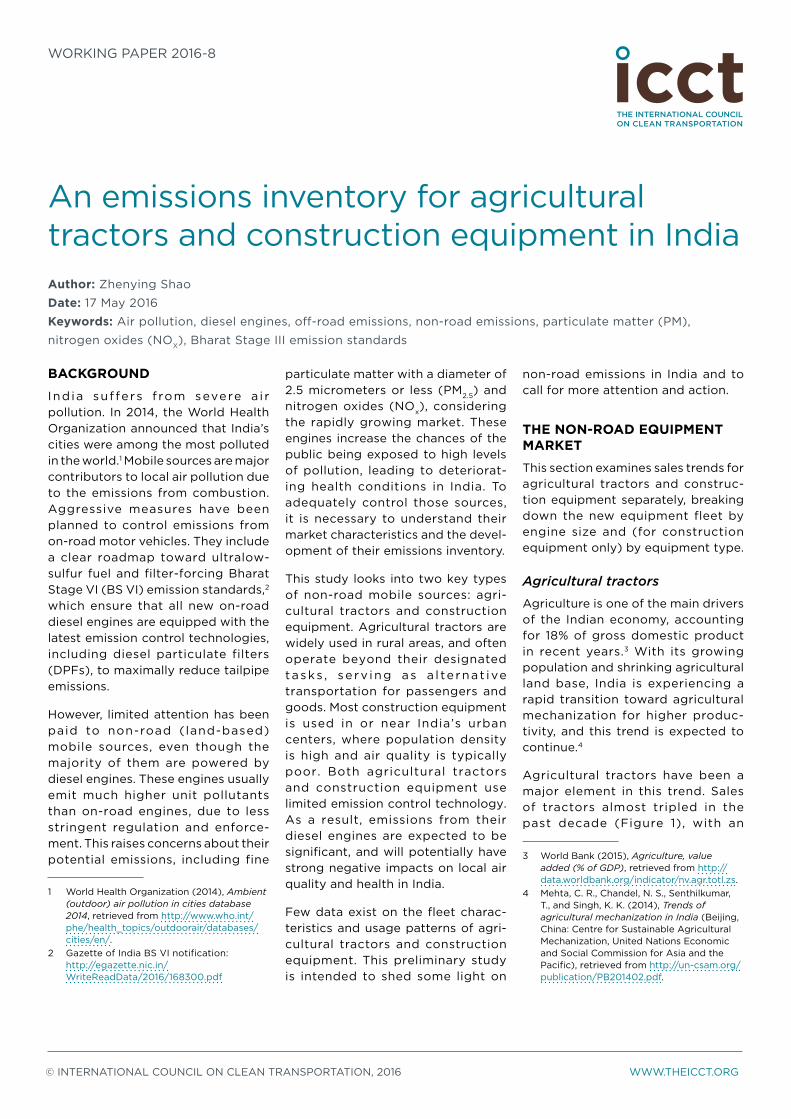
Agricultural tractors have been a major element in this trend. Sales of tractors almost tripled in the past decade (Figure 1), with an
3 World Bank (2015), Agriculture, value added (% of GDP), retrieved from http://data.worldbank.org/indicator/nv.agr.totl.zs.
4 Mehta, C. R., Chandel, N. S., Senthilkumar, T., and Singh, K. K. (2014), Trends of agricultural mechanization in India (Beijing, China: Centre for Sustainable Agricultural Mechanization, United Nations Economic and Social Commission for Asia and the Pacific), retrieved from http://un-csam.org/publication/PB201402.pdf.
WORKING PAPER 2016-8
AN EMISSIONS INVENTORY FOR AGRICULTURAL TRACTORS AND CONSTRUCTION EQUIPMENT IN INDIA
2 INTERNATIONAL COUNCIL ON CLEAN TRANSPORTATION WORKING PAPER 2016-8
average annual growth rate of over 5% between 2000 and 2010. The economic recession of 2007–2008 had a limited impact on tractor sales, indicating strong market demand. The rate of sales increase reached around 10% annually starting in 2010 and is expected to continue for the next decade or two. Although a slight sales drop was observed in 2012, the market increased by 20% in 2013, reaching over 633,000 unit sales.5
Me d ium- s i ze eng ines (2 1 –40 horsepower [hp]) have consistently dominated the market, although their market share has shrunk from 80% to 50% in recent years. Major expansion has occurred in the market for the largest (>40 hp). Thus, the Indian tractor market is diverse with a growing preference for bigger tractors.
Construction equipment
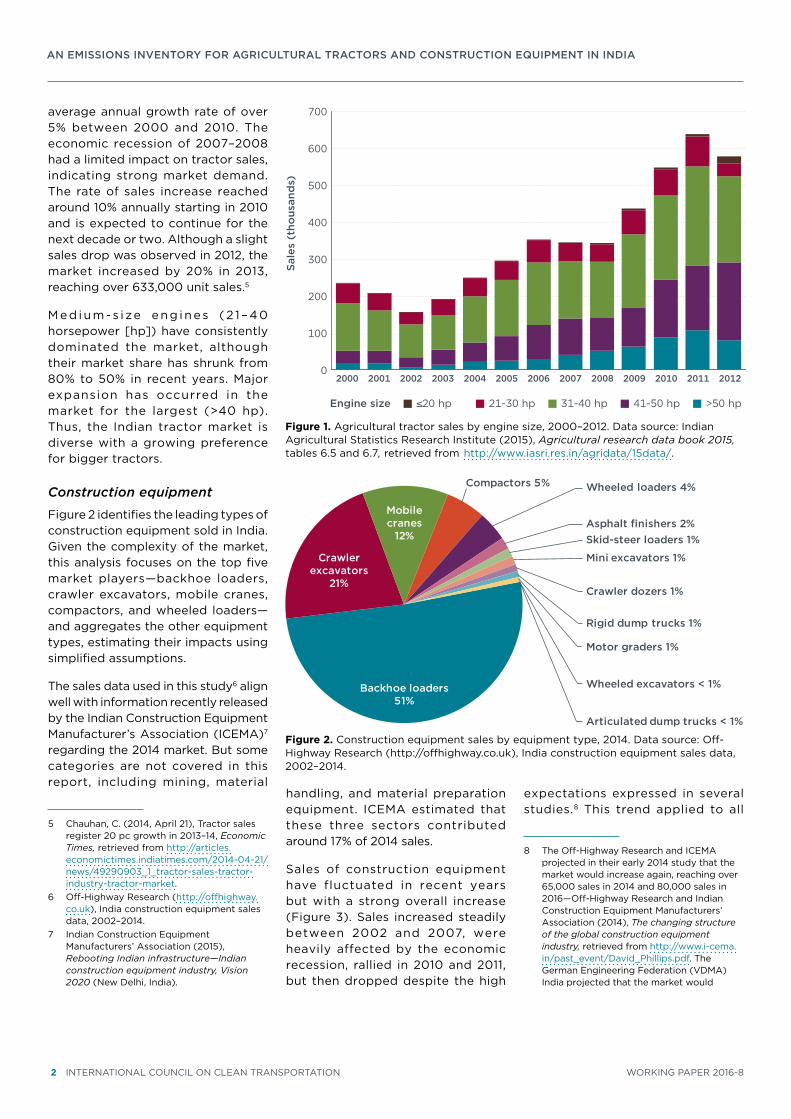
Figure 2 identifies the leading types of construction equipment sold in India. Given the complexity of the market, this analysis focuses on the top five market players—backhoe loaders, crawler excavators, mobile cranes, compactors, and wheeled loaders—and aggregates the other equipment types, estimating their impacts using simplified assumptions.
The sales data used in this study6 align well with information recently released by the Indian Construction Equipment Manufacturer’s Association (ICEMA)7 regarding the 2014 market. But some categories are not covered in this report, including mining, material
5 Chauhan, C. (2014, April 21), Tractor sales register 20 pc growth in 2013–14, Economic Times, retrieved from http://articles.economictimes.indiatimes.com/2014-04-21/news/49290903_1_tractor-sales-tractor-industry-tractor-market.
6 Off-Highway Research (http://offhighway.co.uk), India construction equipment sales data, 2002–2014.
7 Indian Construction Equipment Manufacturers’ Association (2015), Rebooting Indian infrastructure—Indian construction equipment industry, Vision 2020 (New Delhi, India).
handling, and material preparation equipment. ICEMA estimated that these three sectors contributed around 17% of 2014 sales.
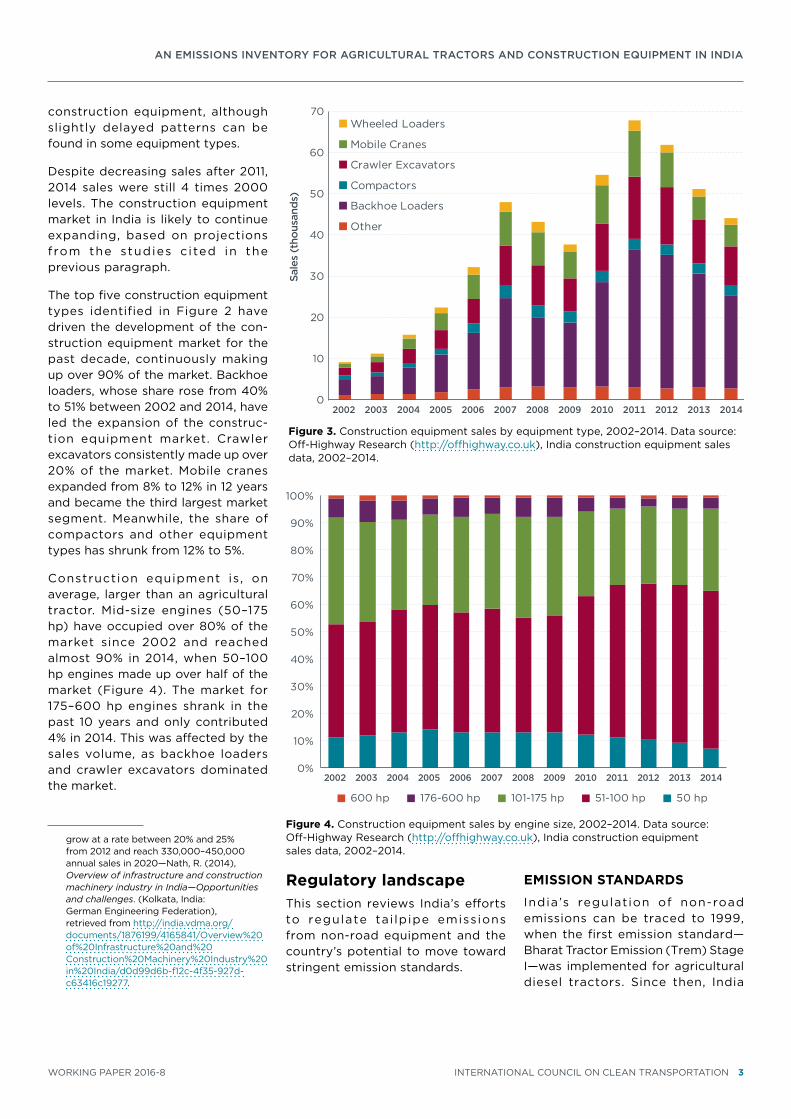
Sales of construction equipment have fluctuated in recent years but with a strong overall increase (Figure 3). Sales increased steadily between 2002 and 2007, were heavily affected by the economic recession, rallied in 2010 and 2011, but then dropped despite the high
expectations expressed in several studies.8 This trend applied to all
8 The Off-Highway Research and ICEMA projected in their early 2014 study that the market would increase again, reaching over 65,000 sales in 2014 and 80,000 sales in 2016—Off-Highway Research and Indian Construction Equipment Manufacturers’ Association (2014), The changing structure of the global construction equipment industry, retrieved from http://www.i-cema.in/past_event/David_Phillips.pdf. The German Engineering Federation (VDMA) India projected that the market would
Engine size 21-30 hp≤20 hp
2000 2001 2002 2003 2004 2005 2006 2007 2008 2009 2010 2011 2012
31-40 hp 41-50 hp >50 hp
Sales (tho
usan
ds)
700
600
500
400
300
200
100
0
Figure 1. Agricultural tractor sales by engine size, 2000–2012. Data source: Indian Agricultural Statistics Research Institute (2015), Agricultural research data book 2015, tables 6.5 and 6.7, retrieved from http://www.iasri.res.in/agridata/15data/.
Backhoe loaders51%
Crawlerexcavators
21%
Mobilecranes
12%
Compactors 5% Wheeled loaders 4%
Asphalt finishers 2%Skid-steer loaders 1%
Mini excavators 1%
Crawler dozers 1%
Rigid dump trucks 1%
Motor graders 1%
Wheeled excavators < 1%
Articulated dump trucks < 1%
Figure 2. Construction equipment sales by equipment type, 2014. Data source: Off-Highway Research (http://offhighway.co.uk), India construction equipment sales data, 2002–2014.
AN EMISSIONS INVENTORY FOR AGRICULTURAL TRACTORS AND CONSTRUCTION EQUIPMENT IN INDIA
WORKING PAPER 2016-8 INTERNATIONAL COUNCIL ON CLEAN TRANSPORTATION 3
construction equipment, although slightly delayed patterns can be found in some equipment types.
Despite decreasing sales after 2011, 2014 sales were still 4 times 2000 levels. The construction equipment market in India is likely to continue expanding, based on projections from the studies c i ted in the previous paragraph.
The top five construction equipment types identified in Figure 2 have driven the development of the con-struction equipment market for the past decade, continuously making up over 90% of the market. Backhoe loaders, whose share rose from 40% to 51% between 2002 and 2014, have led the expansion of the construc-tion equipment market. Crawler excavators consistently made up over 20% of the market. Mobile cranes expanded from 8% to 12% in 12 years and became the third largest market segment. Meanwhile, the share of compactors and other equipment types has shrunk from 12% to 5%.
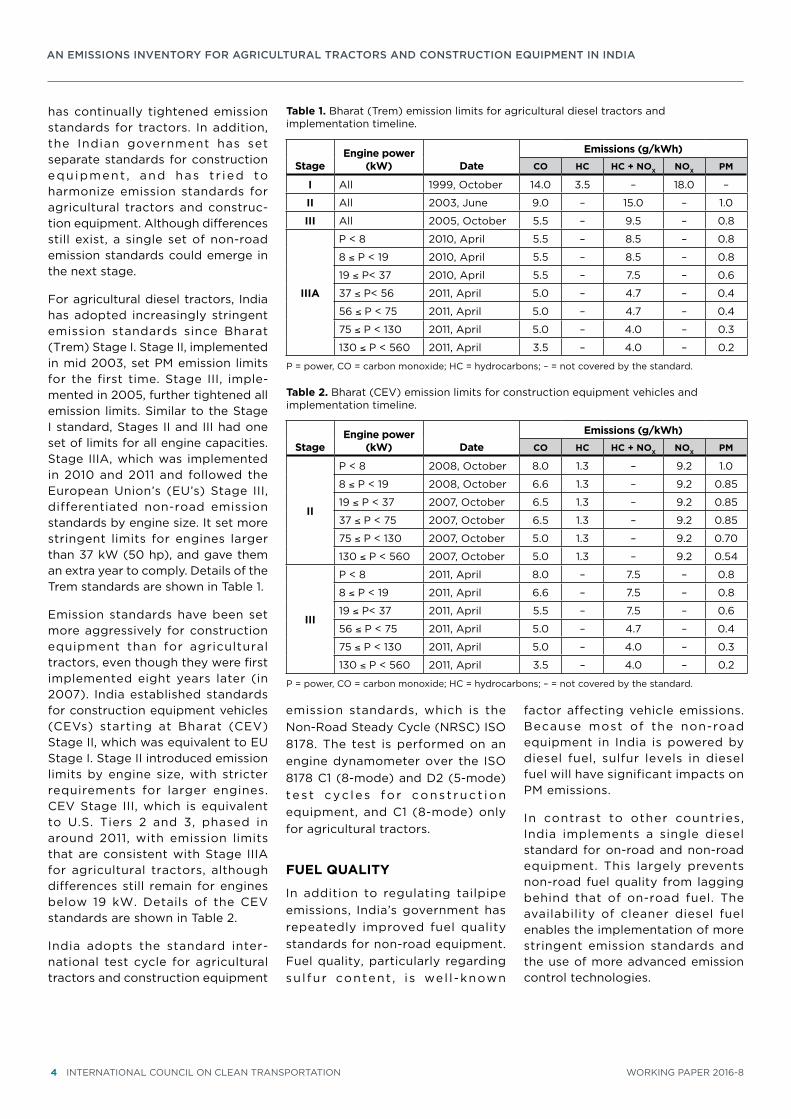
Construction equipment is , on average, larger than an agricultural tractor. Mid-size engines (50–175 hp) have occupied over 80% of the market since 2002 and reached almost 90% in 2014, when 50–100 hp engines made up over half of the market (Figure 4). The market for 175–600 hp engines shrank in the past 10 years and only contributed 4% in 2014. This was affected by the sales volume, as backhoe loaders and crawler excavators dominated the market.
grow at a rate between 20% and 25% from 2012 and reach 330,000–450,000 annual sales in 2020—Nath, R. (2014), Overview of infrastructure and construction machinery industry in India—Opportunities and challenges. (Kolkata, India: German Engineering Federation), retrieved from http://india.vdma.org/documents/1876199/4165841/Overview%20of%20Infrastructure%20and%20Construction%20Machinery%20Industry%20in%20India/d0d99d6b-f12c-4f35-927d-c63416c19277.
Regulatory landscapeThis section reviews India’s efforts to regulate tai lpipe emissions from non-road equipment and the country’s potential to move toward stringent emission standards.
EMISSION STANDARDS
India’s regulation of non-road emissions can be traced to 1999, when the first emission standard—Bharat Tractor Emission (Trem) Stage I—was implemented for agricultural diesel tractors. Since then, India
0
10
20
30
40
50
60
70Wheeled Loaders
Sale
s (t
hous
ands
)
Mobile Cranes
Crawler Excavators
Compactors
Backhoe Loaders
Other
2003 2004 2005 2006 2007 2008 2009 2010 2011 2012 2013 20142002
Figure 3. Construction equipment sales by equipment type, 2002–2014. Data source: Off-Highway Research (http://offhighway.co.uk), India construction equipment sales data, 2002–2014.
0%
10%
20%
30%
40%
50%
60%
70%
80%
90%
100%
2002 2003 2004 2005 2006 2007 2008 2009 2010 2011 2012 2013 2014
600 hp 176-600 hp 101-175 hp 51-100 hp 50 hp
Figure 4. Construction equipment sales by engine size, 2002–2014. Data source: Off-Highway Research (http://offhighway.co.uk), India construction equipment sales data, 2002–2014.
AN EMISSIONS INVENTORY FOR AGRICULTURAL TRACTORS AND CONSTRUCTION EQUIPMENT IN INDIA
4 INTERNATIONAL COUNCIL ON CLEAN TRANSPORTATION WORKING PAPER 2016-8
has continually tightened emission standards for tractors. In addition, the Indian government has set separate standards for construction equ ipment , and has t r ied to harmonize emission standards for agricultural tractors and construc-tion equipment. Although differences still exist, a single set of non-road emission standards could emerge in the next stage.
For agricultural diesel tractors, India has adopted increasingly stringent emission standards since Bharat (Trem) Stage I. Stage II, implemented in mid 2003, set PM emission limits for the first time. Stage III, imple-mented in 2005, further tightened all emission limits. Similar to the Stage I standard, Stages II and III had one set of limits for all engine capacities. Stage IIIA, which was implemented in 2010 and 2011 and followed the European Union’s (EU’s) Stage III, differentiated non-road emission standards by engine size. It set more stringent limits for engines larger than 37 kW (50 hp), and gave them an extra year to comply. Details of the Trem standards are shown in Table 1.
Emission standards have been set more aggressively for construction equipment than for agricultural tractors, even though they were first implemented eight years later (in 2007). India established standards for construction equipment vehicles (CEVs) starting at Bharat (CEV) Stage II, which was equivalent to EU Stage I. Stage II introduced emission limits by engine size, with stricter requirements for larger engines. CEV Stage III, which is equivalent to U.S. Tiers 2 and 3, phased in around 2011, with emission limits that are consistent with Stage IIIA for agricultural tractors, although differences still remain for engines below 19 kW. Details of the CEV standards are shown in Table 2.
India adopts the standard inter-national test cycle for agricultural tractors and construction equipment
emission standards, which is the Non-Road Steady Cycle (NRSC) ISO 8178. The test is performed on an engine dynamometer over the ISO 8178 C1 (8-mode) and D2 (5-mode) tes t cyc les fo r cons t ruc t ion equipment, and C1 (8-mode) only for agricultural tractors.
FUEL QUALITY
In addition to regulating tailpipe emissions, India’s government has repeatedly improved fuel quality standards for non-road equipment. Fuel quality, particularly regarding su l fur content , i s wel l -known
factor affecting vehicle emissions. Because most of the non-road equipment in India is powered by diesel fuel, sulfur levels in diesel fuel will have significant impacts on PM emissions.
In contrast to other countries, India implements a single diesel standard for on-road and non-road equipment. This largely prevents non-road fuel quality from lagging behind that of on-road fuel. The availability of cleaner diesel fuel enables the implementation of more stringent emission standards and the use of more advanced emission control technologies.
Table 1. Bharat (Trem) emission limits for agricultural diesel tractors and implementation timeline.
Stage Engine power
(kW) DateEmissions (g/kWh)
CO HC HC + NOX NOX PM
I All 1999, October 14.0 3.5 – 18.0 –
II All 2003, June 9.0 – 15.0 – 1.0
III All 2005, October 5.5 – 9.5 – 0.8
IIIA
P < 8 2010, April 5.5 – 8.5 – 0.8
8 ≤ P < 19 2010, April 5.5 – 8.5 – 0.8
19 ≤ P< 37 2010, April 5.5 – 7.5 – 0.6
37 ≤ P< 56 2011, April 5.0 – 4.7 – 0.4
56 ≤ P < 75 2011, April 5.0 – 4.7 – 0.4
75 ≤ P < 130 2011, April 5.0 – 4.0 – 0.3
130 ≤ P < 560 2011, April 3.5 – 4.0 – 0.2
P = power, CO = carbon monoxide; HC = hydrocarbons; – = not covered by the standard.
Table 2. Bharat (CEV) emission limits for construction equipment vehicles and implementation timeline.
Stage Engine power
(kW) DateEmissions (g/kWh)
CO HC HC + NOX NOX PM
II
P < 8 2008, October 8.0 1.3 – 9.2 1.0
8 ≤ P < 19 2008, October 6.6 1.3 – 9.2 0.85
19 ≤ P < 37 2007, October 6.5 1.3 – 9.2 0.85
37 ≤ P < 75 2007, October 6.5 1.3 – 9.2 0.85
75 ≤ P < 130 2007, October 5.0 1.3 – 9.2 0.70
130 ≤ P < 560 2007, October 5.0 1.3 – 9.2 0.54
III
P < 8 2011, April 8.0 – 7.5 – 0.8
8 ≤ P < 19 2011, April 6.6 – 7.5 – 0.8
19 ≤ P< 37 2011, April 5.5 – 7.5 – 0.6
56 ≤ P < 75 2011, April 5.0 – 4.7 – 0.4
75 ≤ P < 130 2011, April 5.0 – 4.0 – 0.3
130 ≤ P < 560 2011, April 3.5 – 4.0 – 0.2
P = power, CO = carbon monoxide; HC = hydrocarbons; – = not covered by the standard.
AN EMISSIONS INVENTORY FOR AGRICULTURAL TRACTORS AND CONSTRUCTION EQUIPMENT IN INDIA
WORKING PAPER 2016-8 INTERNATIONAL COUNCIL ON CLEAN TRANSPORTATION 5
India’s diesel fuel sulfur content has dropped from 10,000 parts per million (ppm) in most of the country since 1999.9 Currently, fuel sulfur content is limited to 350 ppm nationwide and 50 ppm for 63 cities in India.10 Most agri-cultural tractors, operating in rural areas, still use 350 ppm fuel. The government plans to implement a 50 ppm sulfur fuel standard nationwide in April 2017 and 10 ppm in April 2020.11 This ultralow-sulfur fuel will help to further reduce emissions from non-road equipment. More importantly, it allows India to adopt more stringent emission standards, which enable the use of effective emission control technologies, even potentially requiring DPFs.
9 Bansal, G., and Bandivadekar, A. (2013), Overview of India’s vehicle emissions control program—Past successes and future prospects (Washington, DC: The International Council on Clean Transportation), retrieved from http://www.theicct.org/indias-vehicle-emissions-control-program.
10 TransportPolicy.net (2015), India: Fuels: Diesel and gasoline, retrieved from http://transportpolicy.net/index.php?title=India:_Fuels:_Diesel_and_Gasoline.
11 The International Council on Clean Transportation (2013), Policy summary: India’s vehicle emission control program (Washington, DC), retrieved from http://www.theicct.org/sites/default/files/publications/ICCT_Briefing_IndiaPolicySummary_20130703.pdf.
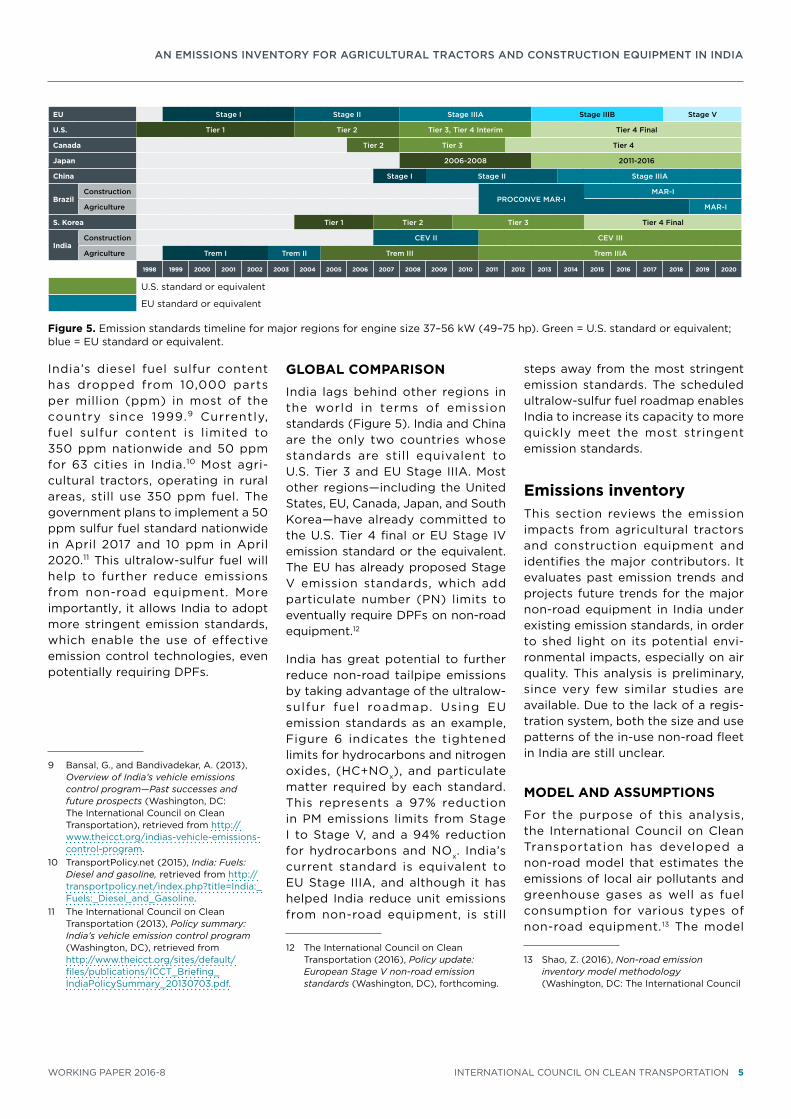
GLOBAL COMPARISON
India lags behind other regions in the world in terms of emission standards (Figure 5). India and China are the only two countries whose standards are still equivalent to U.S. Tier 3 and EU Stage IIIA. Most other regions—including the United States, EU, Canada, Japan, and South Korea—have already committed to the U.S. Tier 4 final or EU Stage IV emission standard or the equivalent. The EU has already proposed Stage V emission standards, which add particulate number (PN) limits to eventually require DPFs on non-road equipment.12
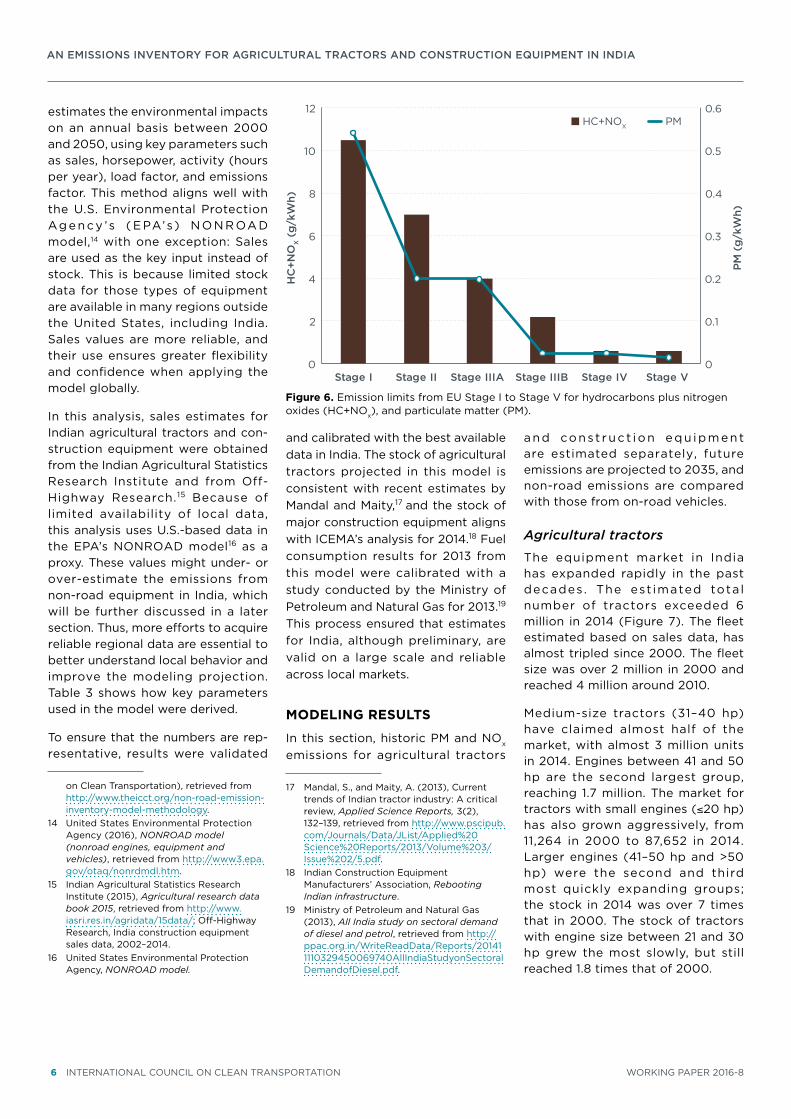
India has great potential to further reduce non-road tailpipe emissions by taking advantage of the ultralow-sulfur fuel roadmap. Using EU emission standards as an example, Figure 6 indicates the tightened limits for hydrocarbons and nitrogen oxides, (HC+NOx), and particulate matter required by each standard. This represents a 97% reduction in PM emissions limits from Stage I to Stage V, and a 94% reduction for hydrocarbons and NOx. India’s current standard is equivalent to EU Stage IIIA, and although it has helped India reduce unit emissions from non-road equipment, is still
12 The International Council on Clean Transportation (2016), Policy update: European Stage V non-road emission standards (Washington, DC), forthcoming.
steps away from the most stringent emission standards. The scheduled ultralow-sulfur fuel roadmap enables India to increase its capacity to more quickly meet the most stringent emission standards.
Emissions inventoryThis section reviews the emission impacts from agricultural tractors and construction equipment and identifies the major contributors. It evaluates past emission trends and projects future trends for the major non-road equipment in India under existing emission standards, in order to shed light on its potential envi-ronmental impacts, especially on air quality. This analysis is preliminary, since very few similar studies are available. Due to the lack of a regis-tration system, both the size and use patterns of the in-use non-road fleet in India are still unclear.
MODEL AND ASSUMPTIONS
For the purpose of this analysis, the International Council on Clean Transportation has developed a non-road model that estimates the emissions of local air pollutants and greenhouse gases as well as fuel consumption for various types of non-road equipment.13 The model
13 Shao, Z. (2016), Non-road emission inventory model methodology (Washington, DC: The International Council
EU Stage I Stage II Stage IIIA Stage IIIB Stage V
U.S. Tier 1 Tier 2 Tier 3, Tier 4 Interim Tier 4 Final
Canada Tier 2 Tier 3 Tier 4
Japan 2006-2008 2011-2016
China Stage I Stage II Stage IIIA
BrazilConstruction
PROCONVE MAR-IMAR-I
Agriculture MAR-I
S. Korea Tier 1 Tier 2 Tier 3 Tier 4 Final
IndiaConstruction CEV II CEV III
Agriculture Trem I Trem II Trem III Trem IIIA
1998 1999 2000 2001 2002 2003 2004 2005 2006 2007 2008 2009 2010 2011 2012 2013 2014 2015 2016 2017 2018 2019 2020
U.S. standard or equivalent
EU standard or equivalent
Figure 5. Emission standards timeline for major regions for engine size 37–56 kW (49–75 hp). Green = U.S. standard or equivalent; blue = EU standard or equivalent.
AN EMISSIONS INVENTORY FOR AGRICULTURAL TRACTORS AND CONSTRUCTION EQUIPMENT IN INDIA
6 INTERNATIONAL COUNCIL ON CLEAN TRANSPORTATION WORKING PAPER 2016-8
estimates the environmental impacts on an annual basis between 2000 and 2050, using key parameters such as sales, horsepower, activity (hours per year), load factor, and emissions factor. This method aligns well with the U.S. Environmental Protection Ag e n cy ’s ( E PA’s) N O N R OA D model,14 with one exception: Sales are used as the key input instead of stock. This is because limited stock data for those types of equipment are available in many regions outside the United States, including India. Sales values are more reliable, and their use ensures greater flexibility and confidence when applying the model globally.
In this analysis, sales estimates for Indian agricultural tractors and con-struction equipment were obtained from the Indian Agricultural Statistics Research Institute and from Off-Highway Research.15 Because of limited availability of local data, this analysis uses U.S.-based data in the EPA’s NONROAD model16 as a proxy. These values might under- or over-estimate the emissions from non-road equipment in India, which will be further discussed in a later section. Thus, more efforts to acquire reliable regional data are essential to better understand local behavior and improve the modeling projection. Table 3 shows how key parameters used in the model were derived.
To ensure that the numbers are rep-resentative, results were validated
on Clean Transportation), retrieved from http://www.theicct.org/non-road-emission-inventory-model-methodology.
14 United States Environmental Protection Agency (2016), NONROAD model (nonroad engines, equipment and vehicles), retrieved from http://www3.epa.gov/otaq/nonrdmdl.htm.
15 Indian Agricultural Statistics Research Institute (2015), Agricultural research data book 2015, retrieved from http://www.iasri.res.in/agridata/15data/; Off-Highway Research, India construction equipment sales data, 2002–2014.
16 United States Environmental Protection Agency, NONROAD model.
and calibrated with the best available data in India. The stock of agricultural tractors projected in this model is consistent with recent estimates by Mandal and Maity,17 and the stock of major construction equipment aligns with ICEMA’s analysis for 2014.18 Fuel consumption results for 2013 from this model were calibrated with a study conducted by the Ministry of Petroleum and Natural Gas for 2013.19 This process ensured that estimates for India, although preliminary, are valid on a large scale and reliable across local markets.
MODELING RESULTS
In this section, historic PM and NOx emissions for agricultural tractors
17 Mandal, S., and Maity, A. (2013), Current trends of Indian tractor industry: A critical review, Applied Science Reports, 3(2), 132–139, retrieved from http://www.pscipub.com/Journals/Data/JList/Applied%20Science%20Reports/2013/Volume%203/Issue%202/5.pdf.
18 Indian Construction Equipment Manufacturers’ Association, Rebooting Indian infrastructure.
19 Ministry of Petroleum and Natural Gas (2013), All India study on sectoral demand of diesel and petrol, retrieved from http://ppac.org.in/WriteReadData/Reports/201411110329450069740AllIndiaStudyonSectoralDemandofDiesel.pdf.
and const ruc t ion equ ipment are estimated separately, future emissions are projected to 2035, and non-road emissions are compared with those from on-road vehicles.
Agricultural tractors
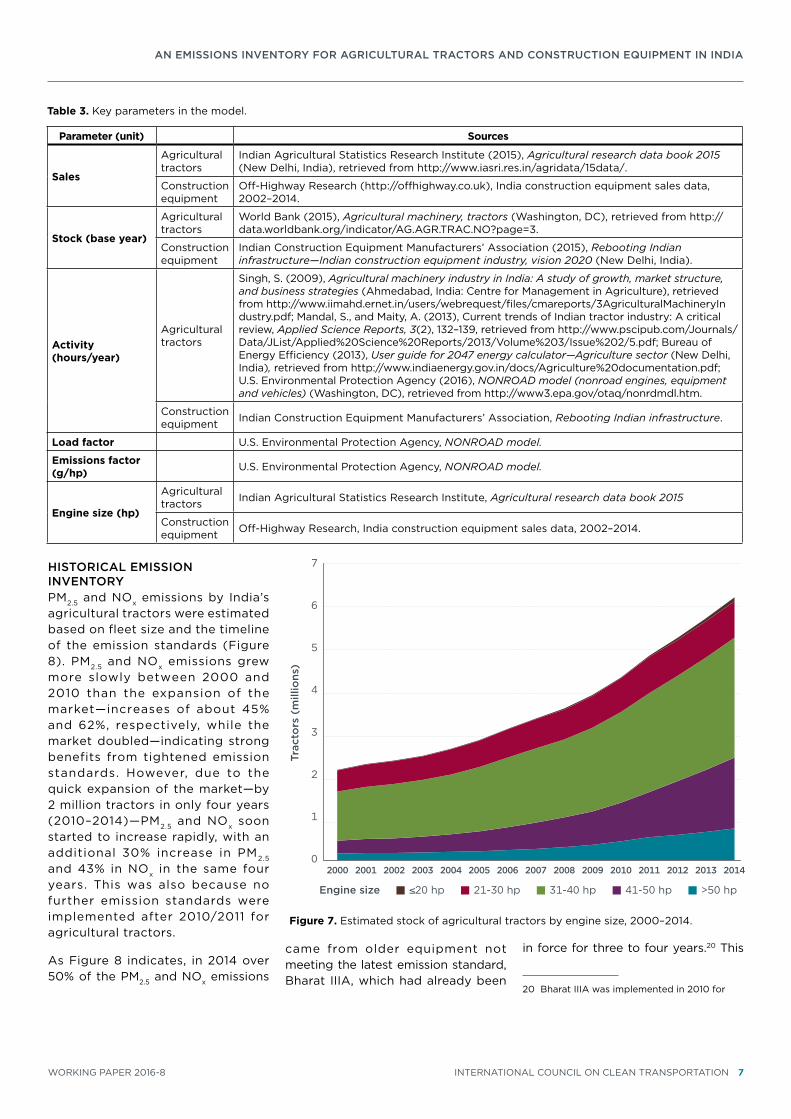
The equipment market in India has expanded rapidly in the past decades . The est imated tota l number of tractors exceeded 6 million in 2014 (Figure 7). The fleet estimated based on sales data, has almost tripled since 2000. The fleet size was over 2 million in 2000 and reached 4 million around 2010.
Medium-size tractors (31–40 hp) have claimed almost half of the market, with almost 3 million units in 2014. Engines between 41 and 50 hp are the second largest group, reaching 1.7 million. The market for tractors with small engines (≤20 hp) has also grown aggressively, from 11,264 in 2000 to 87,652 in 2014. Larger engines (41–50 hp and >50 hp) were the second and third most quickly expanding groups; the stock in 2014 was over 7 times that in 2000. The stock of tractors with engine size between 21 and 30 hp grew the most slowly, but still reached 1.8 times that of 2000.
0
0.1
0.2
0.3
0.4
0.5
0.6
0
2
4
6
8
10
12
Stage I
HC
+NO
X (
g/k
Wh)
PM
(g
/kW
h)
Stage II Stage IIIA Stage IIIB Stage IV Stage V
HC+NOX PM
Figure 6. Emission limits from EU Stage I to Stage V for hydrocarbons plus nitrogen oxides (HC+NOx), and particulate matter (PM).
AN EMISSIONS INVENTORY FOR AGRICULTURAL TRACTORS AND CONSTRUCTION EQUIPMENT IN INDIA
WORKING PAPER 2016-8 INTERNATIONAL COUNCIL ON CLEAN TRANSPORTATION 7
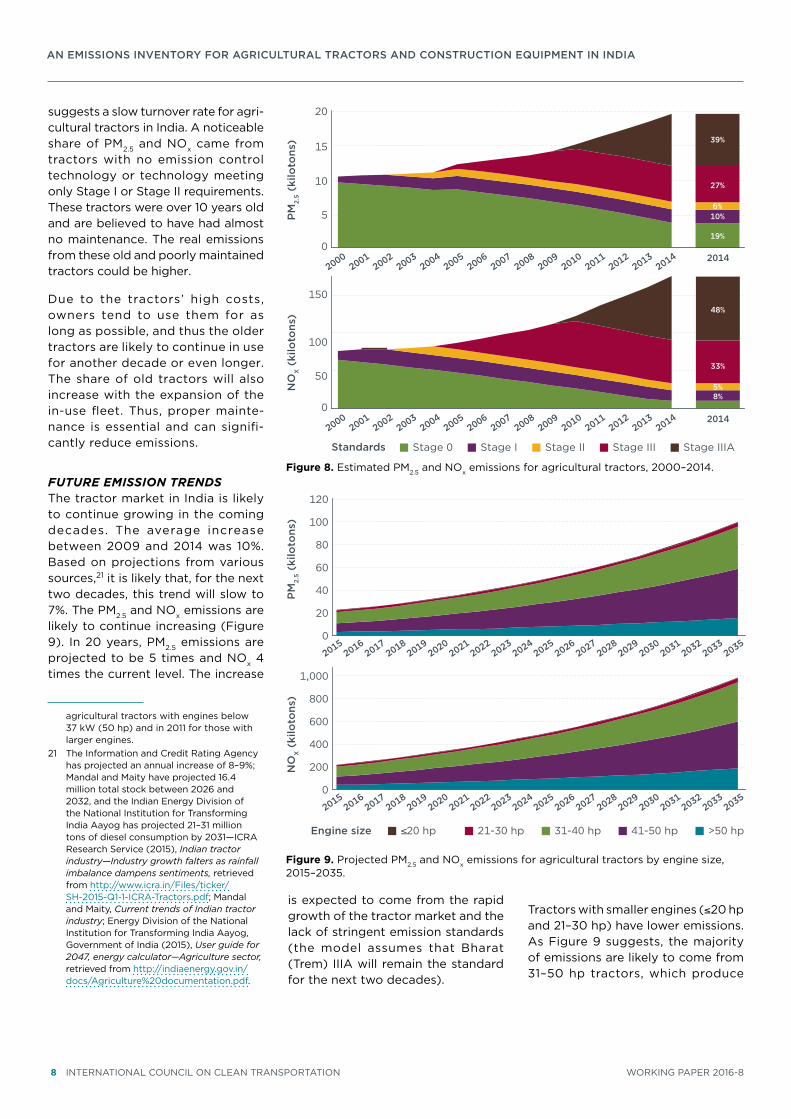
HISTORICAL EMISSION INVENTORY PM2.5 and NOx emissions by India’s agricultural tractors were estimated based on fleet size and the timeline of the emission standards (Figure 8). PM2.5 and NOx emissions grew more slowly between 2000 and 2010 than the expansion of the market—increases of about 45% and 62%, respectively, while the market doubled—indicating strong benefits from tightened emission standards. However, due to the quick expansion of the market—by 2 million tractors in only four years (2010–2014)—PM2.5 and NOx soon started to increase rapidly, with an additional 30% increase in PM2.5 and 43% in NOx in the same four years. This was also because no further emission standards were implemented after 2010/2011 for agricultural tractors.
As Figure 8 indicates, in 2014 over 50% of the PM2.5 and NOx emissions
came from older equipment not meeting the latest emission standard, Bharat IIIA, which had already been
in force for three to four years.20 This
20 Bharat IIIA was implemented in 2010 for
Table 3. Key parameters in the model.
Parameter (unit) Sources
Sales
Agricultural tractors
Indian Agricultural Statistics Research Institute (2015), Agricultural research data book 2015 (New Delhi, India), retrieved from http://www.iasri.res.in/agridata/15data/.
Construction equipment
Off-Highway Research (http://offhighway.co.uk), India construction equipment sales data, 2002–2014.
Stock (base year)
Agricultural tractors
World Bank (2015), Agricultural machinery, tractors (Washington, DC), retrieved from http://data.worldbank.org/indicator/AG.AGR.TRAC.NO?page=3.
Construction equipment
Indian Construction Equipment Manufacturers’ Association (2015), Rebooting Indian infrastructure—Indian construction equipment industry, vision 2020 (New Delhi, India).
Activity (hours/year)
Agricultural tractors
Singh, S. (2009), Agricultural machinery industry in India: A study of growth, market structure, and business strategies (Ahmedabad, India: Centre for Management in Agriculture), retrieved from http://www.iimahd.ernet.in/users/webrequest/files/cmareports/3AgriculturalMachineryIndustry.pdf; Mandal, S., and Maity, A. (2013), Current trends of Indian tractor industry: A critical review, Applied Science Reports, 3(2), 132–139, retrieved from http://www.pscipub.com/Journals/Data/JList/Applied%20Science%20Reports/2013/Volume%203/Issue%202/5.pdf; Bureau of Energy Efficiency (2013), User guide for 2047 energy calculator—Agriculture sector (New Delhi, India), retrieved from http://www.indiaenergy.gov.in/docs/Agriculture%20documentation.pdf; U.S. Environmental Protection Agency (2016), NONROAD model (nonroad engines, equipment and vehicles) (Washington, DC), retrieved from http://www3.epa.gov/otaq/nonrdmdl.htm.
Construction equipment Indian Construction Equipment Manufacturers’ Association, Rebooting Indian infrastructure.
Load factor U.S. Environmental Protection Agency, NONROAD model.
Emissions factor (g/hp) U.S. Environmental Protection Agency, NONROAD model.
Engine size (hp)
Agricultural tractors Indian Agricultural Statistics Research Institute, Agricultural research data book 2015
Construction equipment Off-Highway Research, India construction equipment sales data, 2002–2014.
0
1
2
3
4
5
6
7
2000 2001 2002 2003 2004 2005 2006 2007 2008 2009 2010 2011 2012 2013 2014
Engine size 21-30 hp≤20 hp 31-40 hp 41-50 hp >50 hp
Trac
tors (millions
)
Figure 7. Estimated stock of agricultural tractors by engine size, 2000–2014.
AN EMISSIONS INVENTORY FOR AGRICULTURAL TRACTORS AND CONSTRUCTION EQUIPMENT IN INDIA
8 INTERNATIONAL COUNCIL ON CLEAN TRANSPORTATION WORKING PAPER 2016-8
suggests a slow turnover rate for agri-cultural tractors in India. A noticeable share of PM2.5 and NOx came from tractors with no emission control technology or technology meeting only Stage I or Stage II requirements. These tractors were over 10 years old and are believed to have had almost no maintenance. The real emissions from these old and poorly maintained tractors could be higher.
Due to the tractors’ high costs, owners tend to use them for as long as possible, and thus the older tractors are likely to continue in use for another decade or even longer. The share of old tractors will also increase with the expansion of the in-use fleet. Thus, proper mainte-nance is essential and can signifi-cantly reduce emissions.
FUTURE EMISSION TRENDSThe tractor market in India is likely to continue growing in the coming decades. The average increase between 2009 and 2014 was 10%. Based on projections from various sources,21 it is likely that, for the next two decades, this trend will slow to 7%. The PM2.5 and NOx emissions are likely to continue increasing (Figure 9). In 20 years, PM2.5 emissions are projected to be 5 times and NOx 4 times the current level. The increase
agricultural tractors with engines below 37 kW (50 hp) and in 2011 for those with larger engines.
21 The Information and Credit Rating Agency has projected an annual increase of 8–9%; Mandal and Maity have projected 16.4 million total stock between 2026 and 2032, and the Indian Energy Division of the National Institution for Transforming India Aayog has projected 21–31 million tons of diesel consumption by 2031—ICRA Research Service (2015), Indian tractor industry—Industry growth falters as rainfall imbalance dampens sentiments, retrieved from http://www.icra.in/Files/ticker/SH-2015-Q1-1-ICRA-Tractors.pdf; Mandal and Maity, Current trends of Indian tractor industry; Energy Division of the National Institution for Transforming India Aayog, Government of India (2015), User guide for 2047, energy calculator—Agriculture sector, retrieved from http://indiaenergy.gov.in/docs/Agriculture%20documentation.pdf.
is expected to come from the rapid growth of the tractor market and the lack of stringent emission standards (the model assumes that Bharat (Trem) IIIA will remain the standard for the next two decades).
Tractors with smaller engines (≤20 hp and 21–30 hp) have lower emissions. As Figure 9 suggests, the majority of emissions are likely to come from 31–50 hp tractors, which produce
0
5
10
15
20
20142000
2001
2002
2003
2004
2005
2006
2007
2008
2009
2010
2011
2012
2013
2014
Standards Stage II Stage IIIStage 0 Stage I Stage IIIA
PM
2.5 (k
iloto
ns)
NO
X (kiloto
ns)
0
50
100
15048%
33%
5%8%
39%
27%
6%10%
19%
20142000
2001
2002
2003
2004
2005
2006
2007
2008
2009
2010
2011
2012
2013
2014
Figure 8. Estimated PM2.5 and NOx emissions for agricultural tractors, 2000–2014.
0
60
40
20
80
100
120
2015
2016
2017
2018
2019
2020
2021
2022
2023
2024
2025
2026
2027
2028
2029
2030
2031
2032
2033
2035
PM
2.5 (k
iloto
ns)
NO
X (kiloto
ns)
0
600
400
200
800
1,000
2015
2016
2017
2018
2019
2020
2021
2022
2023
2024
2025
2026
2027
2028
2029
2030
2031
2032
2033
2035
Engine size ≤20 hp 21-30 hp 31-40 hp 41-50 hp >50 hp
Figure 9. Projected PM2.5 and NOx emissions for agricultural tractors by engine size, 2015–2035.
AN EMISSIONS INVENTORY FOR AGRICULTURAL TRACTORS AND CONSTRUCTION EQUIPMENT IN INDIA
WORKING PAPER 2016-8 INTERNATIONAL COUNCIL ON CLEAN TRANSPORTATION 9
over three-quarters of PM2.5 and NOx emissions. This is consistent with patterns from the stock projection, showing these tractors making up over 70% of the market.
Construction equipment
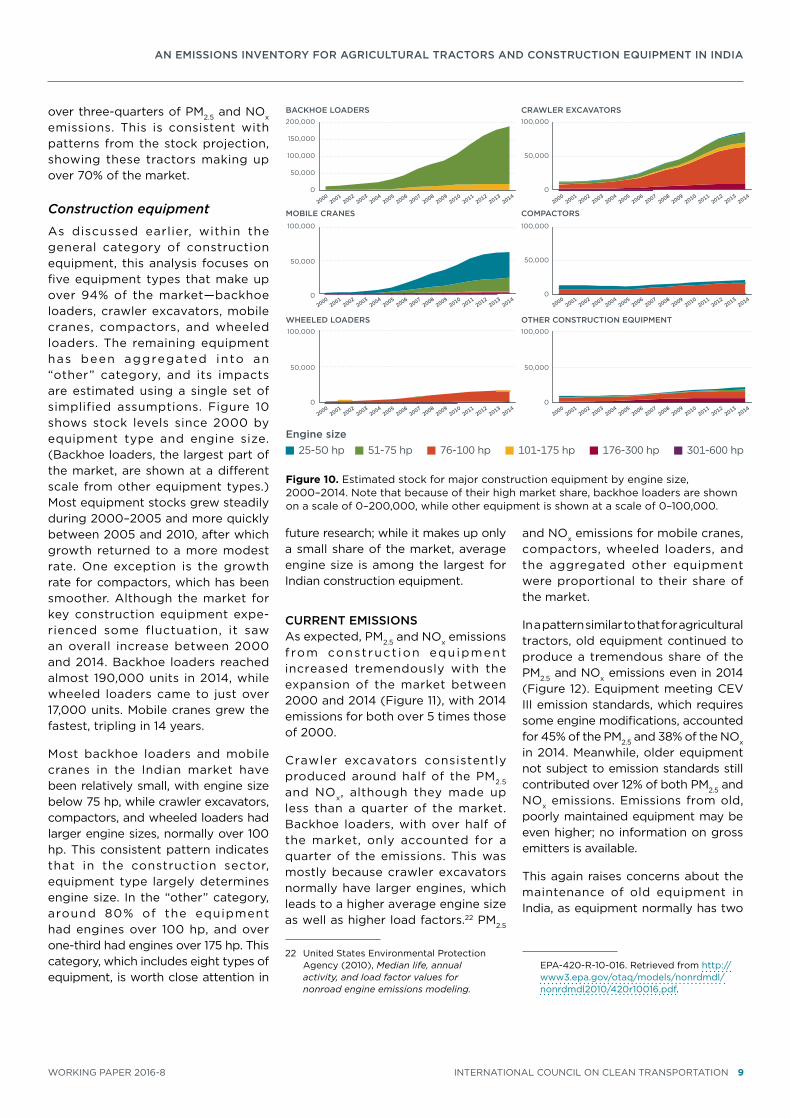
As discussed earlier, within the general category of construction equipment, this analysis focuses on five equipment types that make up over 94% of the market—backhoe loaders, crawler excavators, mobile cranes, compactors, and wheeled loaders. The remaining equipment has been aggregated into an “other” category, and its impacts are estimated using a single set of simplified assumptions. Figure 10 shows stock levels since 2000 by equipment type and engine size. (Backhoe loaders, the largest part of the market, are shown at a different scale from other equipment types.) Most equipment stocks grew steadily during 2000–2005 and more quickly between 2005 and 2010, after which growth returned to a more modest rate. One exception is the growth rate for compactors, which has been smoother. Although the market for key construction equipment expe-rienced some fluctuation, it saw an overall increase between 2000 and 2014. Backhoe loaders reached almost 190,000 units in 2014, while wheeled loaders came to just over 17,000 units. Mobile cranes grew the fastest, tripling in 14 years.
Most backhoe loaders and mobile cranes in the Indian market have been relatively small, with engine size below 75 hp, while crawler excavators, compactors, and wheeled loaders had larger engine sizes, normally over 100 hp. This consistent pattern indicates that in the construction sector, equipment type largely determines engine size. In the “other” category, around 80% of the equipment had engines over 100 hp, and over one-third had engines over 175 hp. This category, which includes eight types of equipment, is worth close attention in
future research; while it makes up only a small share of the market, average engine size is among the largest for Indian construction equipment.
CURRENT EMISSIONSAs expected, PM2.5 and NOx emissions f rom construct ion equ ipment increased tremendously with the expansion of the market between 2000 and 2014 (Figure 11), with 2014 emissions for both over 5 times those of 2000.
Crawler excavators consistently produced around half of the PM2.5 and NOx, although they made up less than a quarter of the market. Backhoe loaders, with over half of the market, only accounted for a quarter of the emissions. This was mostly because crawler excavators normally have larger engines, which leads to a higher average engine size as well as higher load factors.22 PM2.5
22 United States Environmental Protection Agency (2010), Median life, annual activity, and load factor values for nonroad engine emissions modeling.
and NOx emissions for mobile cranes, compactors, wheeled loaders, and the aggregated other equipment were proportional to their share of the market.
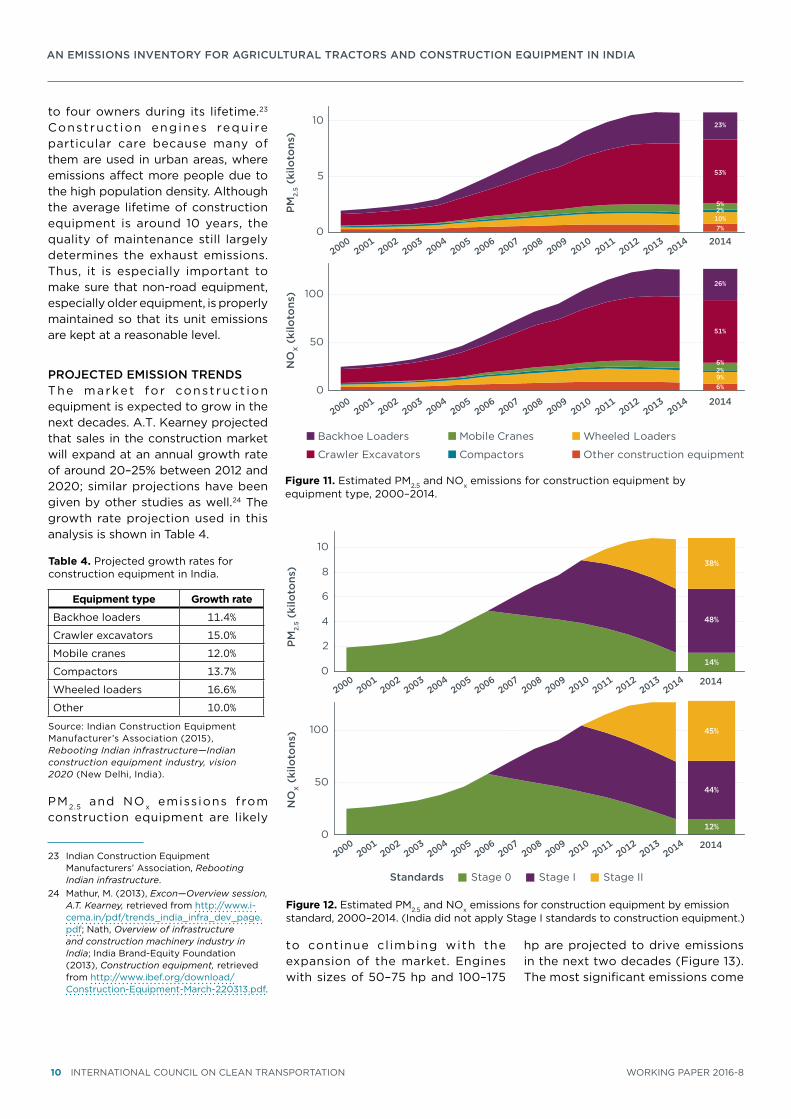
In a pattern similar to that for agricultural tractors, old equipment continued to produce a tremendous share of the PM2.5 and NOx emissions even in 2014 (Figure 12). Equipment meeting CEV III emission standards, which requires some engine modifications, accounted for 45% of the PM2.5 and 38% of the NOx in 2014. Meanwhile, older equipment not subject to emission standards still contributed over 12% of both PM2.5 and NOx emissions. Emissions from old, poorly maintained equipment may be even higher; no information on gross emitters is available.
This again raises concerns about the maintenance of old equipment in India, as equipment normally has two
EPA-420-R-10-016. Retrieved from http://www3.epa.gov/otaq/models/nonrdmdl/nonrdmdl2010/420r10016.pdf.
0
50,000
100,000
0
50,000
100,000
0
50,000
100,000
0
50,000
100,000
150,000
200,000
0
50,000
100,000
0
50,000
100,000
BACKHOE LOADERS CRAWLER EXCAVATORS
MOBILE CRANES COMPACTORS
WHEELED LOADERS OTHER CONSTRUCTION EQUIPMENT
2000
2001
2002
2003
2004
2005
2006
2007
2008
2009
2010
2011
2012
2013
2014
2000
2001
2002
2003
2004
2005
2006
2007
2008
2009
2010
2011
2012
2013
2014
2000
2001
2002
2003
2004
2005
2006
2007
2008
2009
2010
2011
2012
2013
2014
2000
2001
2002
2003
2004
2005
2006
2007
2008
2009
2010
2011
2012
2013
2014
2000
2001
2002
2003
2004
2005
2006
2007
2008
2009
2010
2011
2012
2013
2014
2000
2001
2002
2003
2004
2005
2006
2007
2008
2009
2010
2011
2012
2013
2014
Engine size25-50 hp 51-75 hp 76-100 hp 101-175 hp 176-300 hp 301-600 hp
Figure 10. Estimated stock for major construction equipment by engine size, 2000–2014. Note that because of their high market share, backhoe loaders are shown on a scale of 0–200,000, while other equipment is shown at a scale of 0–100,000.
AN EMISSIONS INVENTORY FOR AGRICULTURAL TRACTORS AND CONSTRUCTION EQUIPMENT IN INDIA
10 INTERNATIONAL COUNCIL ON CLEAN TRANSPORTATION WORKING PAPER 2016-8
to four owners during its lifetime.23 Construct ion engines requi re particular care because many of them are used in urban areas, where emissions affect more people due to the high population density. Although the average lifetime of construction equipment is around 10 years, the quality of maintenance still largely determines the exhaust emissions. Thus, it is especially important to make sure that non-road equipment, especially older equipment, is properly maintained so that its unit emissions are kept at a reasonable level.
PROJECTED EMISSION TRENDSThe market for const ruct ion equipment is expected to grow in the next decades. A.T. Kearney projected that sales in the construction market will expand at an annual growth rate of around 20–25% between 2012 and 2020; similar projections have been given by other studies as well.24 The growth rate projection used in this analysis is shown in Table 4.
Table 4. Projected growth rates for construction equipment in India.
Equipment type Growth rate
Backhoe loaders 11.4%
Crawler excavators 15.0%
Mobile cranes 12.0%
Compactors 13.7%
Wheeled loaders 16.6%
Other 10.0%
Source: Indian Construction Equipment Manufacturer’s Association (2015), Rebooting Indian infrastructure—Indian construction equipment industry, vision 2020 (New Delhi, India).
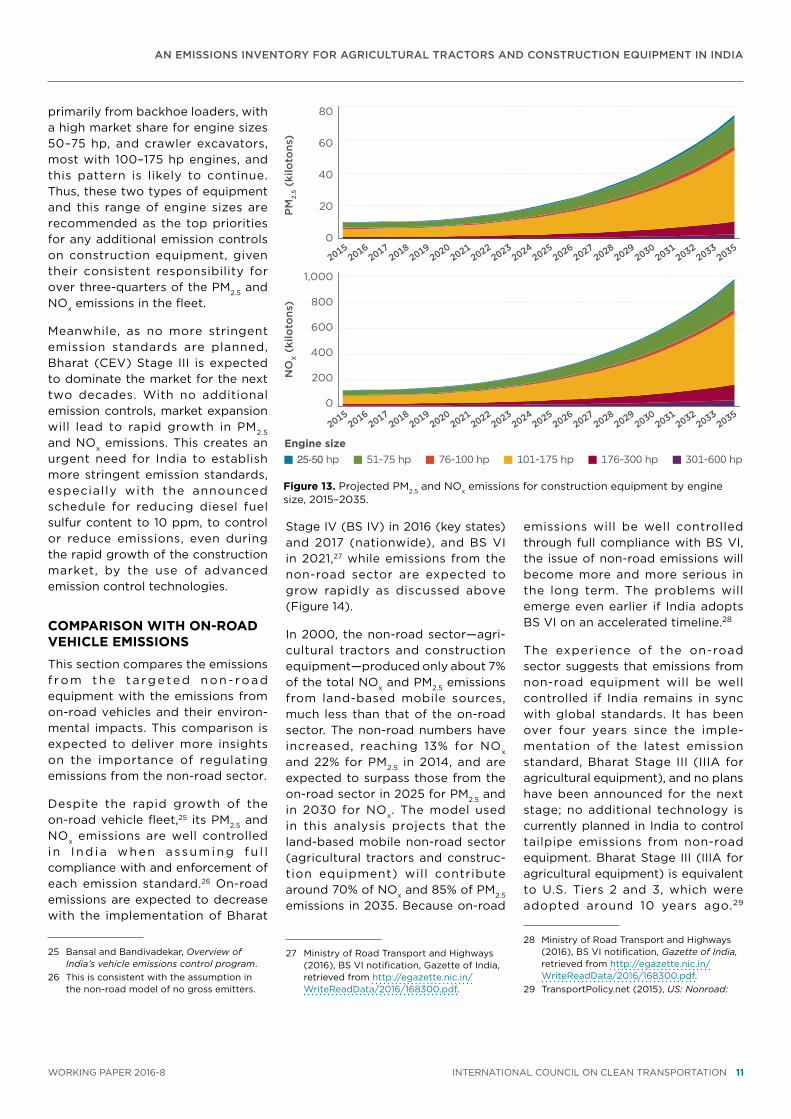
PM2.5 and NOx emissions from construction equipment are likely
23 Indian Construction Equipment Manufacturers’ Association, Rebooting Indian infrastructure.
24 Mathur, M. (2013), Excon—Overview session, A.T. Kearney, retrieved from http://www.i-cema.in/pdf/trends_india_infra_dev_page.pdf; Nath, Overview of infrastructure and construction machinery industry in India; India Brand-Equity Foundation (2013), Construction equipment, retrieved from http://www.ibef.org/download/Construction-Equipment-March-220313.pdf.
to continue cl imbing with the expansion of the market. Engines with sizes of 50–75 hp and 100–175
hp are projected to drive emissions in the next two decades (Figure 13). The most significant emissions come
PM
2.5
(kilo
tons
)N
OX (
kilo
tons
)
0
2
4
6
8
10
0
50
100
Standards Stage IIStage 0 Stage I
45%
44%
12%
38%
48%
14%
20142000
20012002
20032004
20052006
20072008
20092010
20112012
20132014
20142000
20012002
20032004
20052006
20072008
20092010
20112012
20132014
Figure 12. Estimated PM2.5 and NOx emissions for construction equipment by emission standard, 2000–2014. (India did not apply Stage I standards to construction equipment.)
0
5
10
0
50
100
Wheeled LoadersMobile Cranes
Crawler Excavators Compactors
Backhoe Loaders
Other construction equipment
20142000
2001
2002
2003
2004
2005
2006
2007
2008
2009
2010
2011
2012
2013
2014
20142000
2001
2002
2003
2004
2005
2006
2007
2008
2009
2010
2011
2012
2013
2014
23%
53%
5%2%10%7%
26%
51%
6%2%9%6%
PM
2.5 (k
iloto
ns)
NO
X (kiloto
ns)
Figure 11. Estimated PM2.5 and NOx emissions for construction equipment by equipment type, 2000–2014.
AN EMISSIONS INVENTORY FOR AGRICULTURAL TRACTORS AND CONSTRUCTION EQUIPMENT IN INDIA
WORKING PAPER 2016-8 INTERNATIONAL COUNCIL ON CLEAN TRANSPORTATION 11
primarily from backhoe loaders, with a high market share for engine sizes 50–75 hp, and crawler excavators, most with 100–175 hp engines, and this pattern is likely to continue. Thus, these two types of equipment and this range of engine sizes are recommended as the top priorities for any additional emission controls on construction equipment, given their consistent responsibility for over three-quarters of the PM2.5 and NOx emissions in the fleet.
Meanwhile, as no more stringent emission standards are planned, Bharat (CEV) Stage III is expected to dominate the market for the next two decades. With no additional emission controls, market expansion will lead to rapid growth in PM2.5 and NOx emissions. This creates an urgent need for India to establish more stringent emission standards, especially with the announced schedule for reducing diesel fuel sulfur content to 10 ppm, to control or reduce emissions, even during the rapid growth of the construction market, by the use of advanced emission control technologies.
COMPARISON WITH ON-ROAD VEHICLE EMISSIONS
This section compares the emissions f rom the ta rge ted non- road equipment with the emissions from on-road vehicles and their environ-mental impacts. This comparison is expected to deliver more insights on the importance of regulating emissions from the non-road sector.
Despite the rapid growth of the on-road vehicle fleet,25 its PM2.5 and NOx emissions are well controlled in I nd ia when assuming fu l l compliance with and enforcement of each emission standard.26 On-road emissions are expected to decrease with the implementation of Bharat
25 Bansal and Bandivadekar, Overview of India’s vehicle emissions control program.
26 This is consistent with the assumption in the non-road model of no gross emitters.
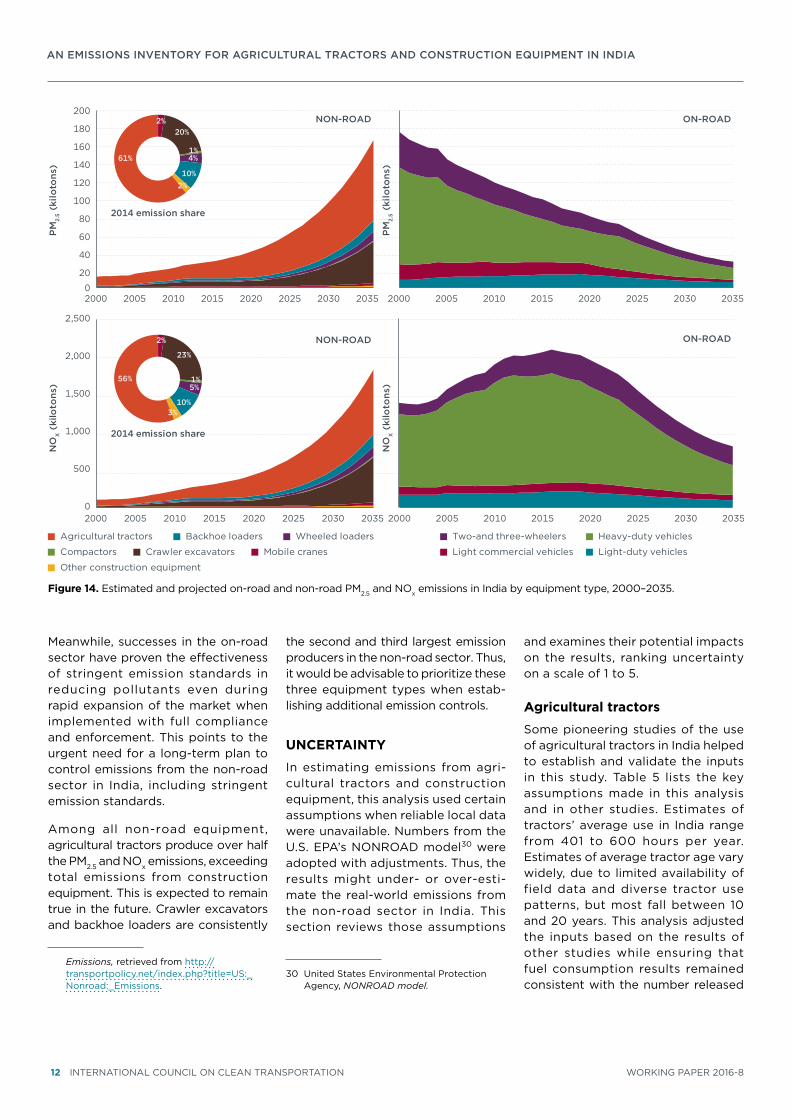
Stage IV (BS IV) in 2016 (key states) and 2017 (nationwide), and BS VI in 2021,27 while emissions from the non-road sector are expected to grow rapidly as discussed above (Figure 14).
In 2000, the non-road sector—agri-cultural tractors and construction equipment—produced only about 7% of the total NOx and PM2.5 emissions from land-based mobile sources, much less than that of the on-road sector. The non-road numbers have increased, reaching 13% for NOx and 22% for PM2.5 in 2014, and are expected to surpass those from the on-road sector in 2025 for PM2.5 and in 2030 for NOx. The model used in this analysis projects that the land-based mobile non-road sector (agricultural tractors and construc-tion equipment) will contribute around 70% of NOx and 85% of PM2.5 emissions in 2035. Because on-road
27 Ministry of Road Transport and Highways (2016), BS VI notification, Gazette of India, retrieved from http://egazette.nic.in/WriteReadData/2016/168300.pdf.
emissions will be well controlled through full compliance with BS VI, the issue of non-road emissions will become more and more serious in the long term. The problems will emerge even earlier if India adopts BS VI on an accelerated timeline.28
The experience of the on-road sector suggests that emissions from non-road equipment will be well controlled if India remains in sync with global standards. It has been over four years since the imple-mentation of the latest emission standard, Bharat Stage III (IIIA for agricultural equipment), and no plans have been announced for the next stage; no additional technology is currently planned in India to control tailpipe emissions from non-road equipment. Bharat Stage III (IIIA for agricultural equipment) is equivalent to U.S. Tiers 2 and 3, which were adopted around 10 years ago.29
28 Ministry of Road Transport and Highways (2016), BS VI notification, Gazette of India, retrieved from http://egazette.nic.in/WriteReadData/2016/168300.pdf.
29 TransportPolicy.net (2015), US: Nonroad:
2015
2016
2017
2018
2019
2020
2021
2022
2023
2024
2025
2026
2027
2028
2029
2030
2031
2032
2033
2035
2015
2016
2017
2018
2019
2020
2021
2022
2023
2024
2025
2026
2027
2028
2029
2030
2031
2032
2033
2035
PM
2.5 (k
iloto
ns)
NO
X (kiloto
ns)
0
20
40
60
80
0
400
200
600
800
1,000
Engine size25-50 hp 51-75 hp 76-100 hp 101-175 hp 176-300 hp 301-600 hp
Figure 13. Projected PM2.5 and NOx emissions for construction equipment by engine size, 2015–2035.
AN EMISSIONS INVENTORY FOR AGRICULTURAL TRACTORS AND CONSTRUCTION EQUIPMENT IN INDIA
12 INTERNATIONAL COUNCIL ON CLEAN TRANSPORTATION WORKING PAPER 2016-8
Meanwhile, successes in the on-road sector have proven the effectiveness of stringent emission standards in reducing pollutants even during rapid expansion of the market when implemented with full compliance and enforcement. This points to the urgent need for a long-term plan to control emissions from the non-road sector in India, including stringent emission standards.
Among all non-road equipment, agricultural tractors produce over half the PM2.5 and NOx emissions, exceeding total emissions from construction equipment. This is expected to remain true in the future. Crawler excavators and backhoe loaders are consistently
Emissions, retrieved from http://transportpolicy.net/index.php?title=US:_Nonroad:_Emissions.
the second and third largest emission producers in the non-road sector. Thus, it would be advisable to prioritize these three equipment types when estab-lishing additional emission controls.
UNCERTAINTY
In estimating emissions from agri-cultural tractors and construction equipment, this analysis used certain assumptions when reliable local data were unavailable. Numbers from the U.S. EPA’s NONROAD model30 were adopted with adjustments. Thus, the results might under- or over-esti-mate the real-world emissions from the non-road sector in India. This section reviews those assumptions
30 United States Environmental Protection Agency, NONROAD model.
and examines their potential impacts on the results, ranking uncertainty on a scale of 1 to 5.
Agricultural tractors
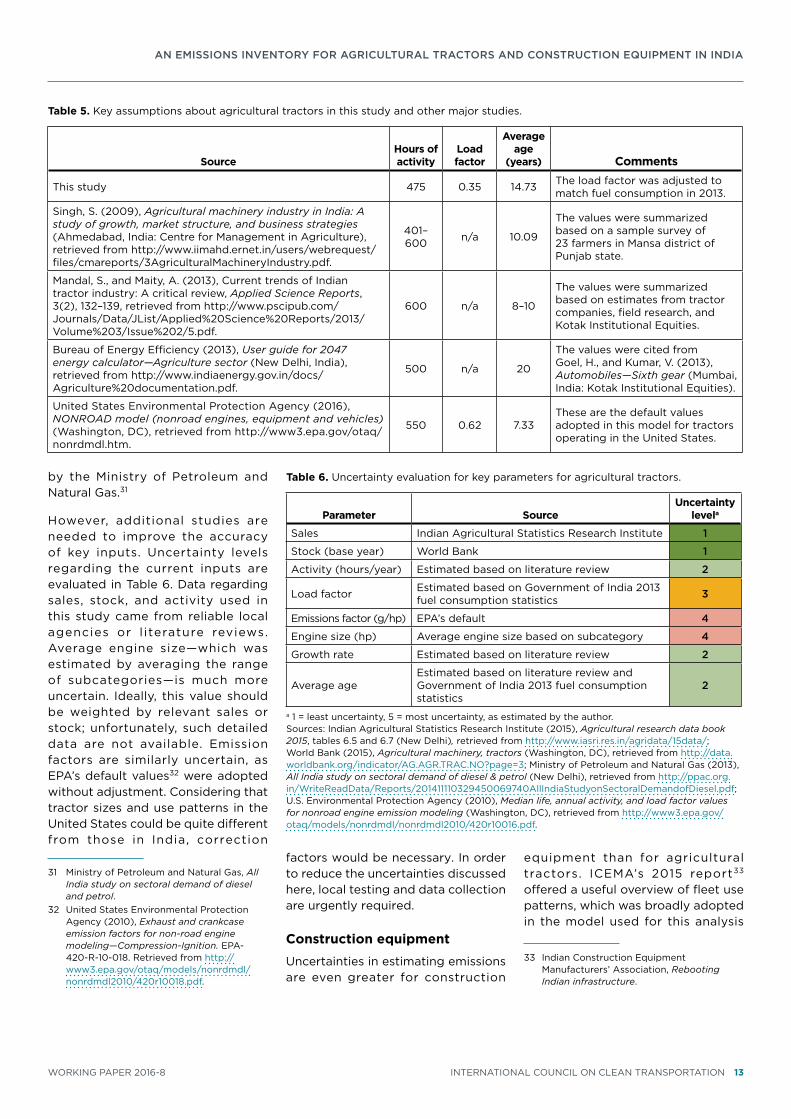
Some pioneering studies of the use of agricultural tractors in India helped to establish and validate the inputs in this study. Table 5 lists the key assumptions made in this analysis and in other studies. Estimates of tractors’ average use in India range from 401 to 600 hours per year. Estimates of average tractor age vary widely, due to limited availability of field data and diverse tractor use patterns, but most fall between 10 and 20 years. This analysis adjusted the inputs based on the results of other studies while ensuring that fuel consumption results remained consistent with the number released
0
20
40
60
80
100
120
140
160
180
200
2000 2005 2010 2015 2020 2025 2035
Agricultural tractors Backhoe loaders Wheeled loaders
Compactors Crawler excavators Mobile cranes
Other construction equipment
2%20%
1%4%
10%2%
61%
2000 2005 2010 2015 2020 2025 2030 2035
0
500
1,000
1,500
2,000
2,500
2000 2005 2010 2015 2020 2025 2030
2030
2035 2000 2005 2010 2015 2020 2025 2030 2035
PM
2.5 (k
iloto
ns)
NO
X (kiloto
ns)
PM
2.5 (k
iloto
ns)
NO
X (kiloto
ns)
Two-and three-wheelers Heavy-duty vehicles
Light commercial vehicles Light-duty vehicles
2%
23%
1%5%
10%3%
56%
2014 emission share
2014 emission share
ON-ROADNON-ROAD
ON-ROADNON-ROAD
Figure 14. Estimated and projected on-road and non-road PM2.5 and NOx emissions in India by equipment type, 2000–2035.
AN EMISSIONS INVENTORY FOR AGRICULTURAL TRACTORS AND CONSTRUCTION EQUIPMENT IN INDIA
WORKING PAPER 2016-8 INTERNATIONAL COUNCIL ON CLEAN TRANSPORTATION 13
by the Ministry of Petroleum and Natural Gas.31
However, additional studies are needed to improve the accuracy of key inputs. Uncertainty levels regarding the current inputs are evaluated in Table 6. Data regarding sales, stock, and activity used in this study came from reliable local agencies or l iterature reviews. Average engine size—which was estimated by averaging the range of subcategories—is much more uncertain. Ideally, this value should be weighted by relevant sales or stock; unfortunately, such detailed data are not available. Emission factors are similarly uncertain, as EPA’s default values32 were adopted without adjustment. Considering that tractor sizes and use patterns in the United States could be quite different from those in India, correction
31 Ministry of Petroleum and Natural Gas, All India study on sectoral demand of diesel and petrol.
32 United States Environmental Protection Agency (2010), Exhaust and crankcase emission factors for non-road engine modeling—Compression-Ignition. EPA-420-R-10-018. Retrieved from http://www3.epa.gov/otaq/models/nonrdmdl/nonrdmdl2010/420r10018.pdf.
factors would be necessary. In order to reduce the uncertainties discussed here, local testing and data collection are urgently required.
Construction equipment
Uncertainties in estimating emissions are even greater for construction
equipment than for agricultural tractors. ICEMA’s 2015 report33 offered a useful overview of fleet use patterns, which was broadly adopted in the model used for this analysis
33 Indian Construction Equipment Manufacturers’ Association, Rebooting Indian infrastructure.
Table 5. Key assumptions about agricultural tractors in this study and other major studies.
SourceHours of activity
Load factor
Average age
(years) Comments
This study 475 0.35 14.73 The load factor was adjusted to match fuel consumption in 2013.
Singh, S. (2009), Agricultural machinery industry in India: A study of growth, market structure, and business strategies (Ahmedabad, India: Centre for Management in Agriculture), retrieved from http://www.iimahd.ernet.in/users/webrequest/files/cmareports/3AgriculturalMachineryIndustry.pdf.
401–600 n/a 10.09
The values were summarized based on a sample survey of 23 farmers in Mansa district of Punjab state.
Mandal, S., and Maity, A. (2013), Current trends of Indian tractor industry: A critical review, Applied Science Reports, 3(2), 132–139, retrieved from http://www.pscipub.com/Journals/Data/JList/Applied%20Science%20Reports/2013/Volume%203/Issue%202/5.pdf.
600 n/a 8–10
The values were summarized based on estimates from tractor companies, field research, and Kotak Institutional Equities.
Bureau of Energy Efficiency (2013), User guide for 2047 energy calculator—Agriculture sector (New Delhi, India), retrieved from http://www.indiaenergy.gov.in/docs/Agriculture%20documentation.pdf.
500 n/a 20
The values were cited from Goel, H., and Kumar, V. (2013), Automobiles—Sixth gear (Mumbai, India: Kotak Institutional Equities).
United States Environmental Protection Agency (2016), NONROAD model (nonroad engines, equipment and vehicles) (Washington, DC), retrieved from http://www3.epa.gov/otaq/nonrdmdl.htm.
550 0.62 7.33These are the default values adopted in this model for tractors operating in the United States.
Table 6. Uncertainty evaluation for key parameters for agricultural tractors.
Parameter SourceUncertainty
levela
Sales Indian Agricultural Statistics Research Institute 1
Stock (base year) World Bank 1
Activity (hours/year) Estimated based on literature review 2
Load factor Estimated based on Government of India 2013 fuel consumption statistics 3
Emissions factor (g/hp) EPA’s default 4
Engine size (hp) Average engine size based on subcategory 4
Growth rate Estimated based on literature review 2
Average ageEstimated based on literature review and Government of India 2013 fuel consumption statistics
2
a 1 = least uncertainty, 5 = most uncertainty, as estimated by the author.Sources: Indian Agricultural Statistics Research Institute (2015), Agricultural research data book 2015, tables 6.5 and 6.7 (New Delhi), retrieved from http://www.iasri.res.in/agridata/15data/; World Bank (2015), Agricultural machinery, tractors (Washington, DC), retrieved from http://data.worldbank.org/indicator/AG.AGR.TRAC.NO?page=3; Ministry of Petroleum and Natural Gas (2013), All India study on sectoral demand of diesel & petrol (New Delhi), retrieved from http://ppac.org.in/WriteReadData/Reports/201411110329450069740AllIndiaStudyonSectoralDemandofDiesel.pdf; U.S. Environmental Protection Agency (2010), Median life, annual activity, and load factor values for nonroad engine emission modeling (Washington, DC), retrieved from http://www3.epa.gov/otaq/models/nonrdmdl/nonrdmdl2010/420r10016.pdf.
AN EMISSIONS INVENTORY FOR AGRICULTURAL TRACTORS AND CONSTRUCTION EQUIPMENT IN INDIA
14 INTERNATIONAL COUNCIL ON CLEAN TRANSPORTATION WORKING PAPER 2016-8
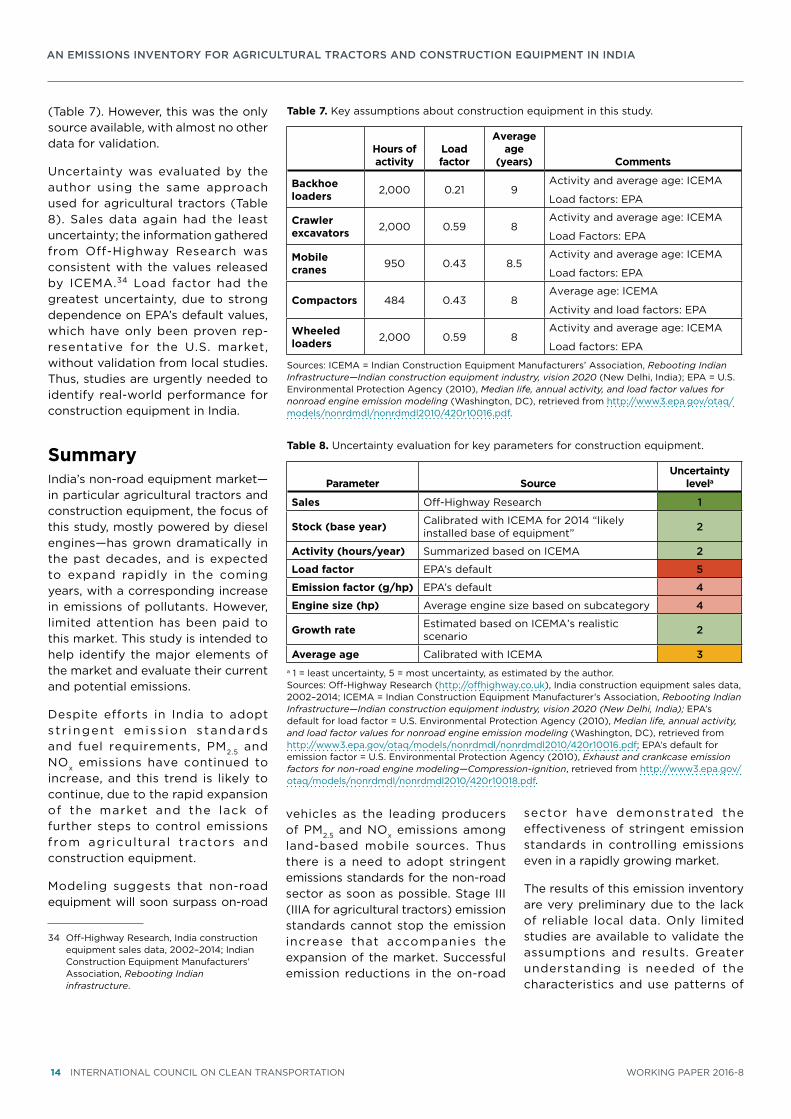
(Table 7). However, this was the only source available, with almost no other data for validation.
Uncertainty was evaluated by the author using the same approach used for agricultural tractors (Table 8). Sales data again had the least uncertainty; the information gathered from Off-Highway Research was consistent with the values released by ICEMA.34 Load factor had the greatest uncertainty, due to strong dependence on EPA’s default values, which have only been proven rep-resentative for the U.S. market, without validation from local studies. Thus, studies are urgently needed to identify real-world performance for construction equipment in India.
Summary India’s non-road equipment market—in particular agricultural tractors and construction equipment, the focus of this study, mostly powered by diesel engines—has grown dramatically in the past decades, and is expected to expand rapidly in the coming years, with a corresponding increase in emissions of pollutants. However, limited attention has been paid to this market. This study is intended to help identify the major elements of the market and evaluate their current and potential emissions.
Despite efforts in India to adopt s t r ingent emiss ion s tandards and fuel requirements, PM2.5 and NOx emissions have continued to increase, and this trend is likely to continue, due to the rapid expansion of the market and the lack of further steps to control emissions from agricultural tractors and construction equipment.
Modeling suggests that non-road equipment will soon surpass on-road
34 Off-Highway Research, India construction equipment sales data, 2002–2014; Indian Construction Equipment Manufacturers’ Association, Rebooting Indian infrastructure.
vehicles as the leading producers of PM2.5 and NOx emissions among land-based mobile sources. Thus there is a need to adopt stringent emissions standards for the non-road sector as soon as possible. Stage III (IIIA for agricultural tractors) emission standards cannot stop the emission increase that accompanies the expansion of the market. Successful emission reductions in the on-road
sector have demonstrated the effectiveness of stringent emission standards in controlling emissions even in a rapidly growing market.
The results of this emission inventory are very preliminary due to the lack of reliable local data. Only limited studies are available to validate the assumptions and results. Greater understanding is needed of the characteristics and use patterns of
Table 7. Key assumptions about construction equipment in this study.
Hours of activity
Load factor
Average age
(years) Comments
Backhoe loaders 2,000 0.21 9
Activity and average age: ICEMA
Load factors: EPA
Crawler excavators 2,000 0.59 8
Activity and average age: ICEMA
Load Factors: EPA
Mobile cranes 950 0.43 8.5
Activity and average age: ICEMA
Load factors: EPA
Compactors 484 0.43 8Average age: ICEMA
Activity and load factors: EPA
Wheeled loaders 2,000 0.59 8
Activity and average age: ICEMA
Load factors: EPA
Sources: ICEMA = Indian Construction Equipment Manufacturers’ Association, Rebooting Indian Infrastructure—Indian construction equipment industry, vision 2020 (New Delhi, India); EPA = U.S. Environmental Protection Agency (2010), Median life, annual activity, and load factor values for nonroad engine emission modeling (Washington, DC), retrieved from http://www3.epa.gov/otaq/models/nonrdmdl/nonrdmdl2010/420r10016.pdf.
Table 8. Uncertainty evaluation for key parameters for construction equipment.
Parameter SourceUncertainty
levela
Sales Off-Highway Research 1
Stock (base year) Calibrated with ICEMA for 2014 “likely installed base of equipment” 2
Activity (hours/year) Summarized based on ICEMA 2
Load factor EPA’s default 5
Emission factor (g/hp) EPA’s default 4
Engine size (hp) Average engine size based on subcategory 4
Growth rate Estimated based on ICEMA’s realistic scenario 2
Average age Calibrated with ICEMA 3a 1 = least uncertainty, 5 = most uncertainty, as estimated by the author.Sources: Off-Highway Research (http://offhighway.co.uk), India construction equipment sales data, 2002–2014; ICEMA = Indian Construction Equipment Manufacturer’s Association, Rebooting Indian Infrastructure—Indian construction equipment industry, vision 2020 (New Delhi, India); EPA’s default for load factor = U.S. Environmental Protection Agency (2010), Median life, annual activity, and load factor values for nonroad engine emission modeling (Washington, DC), retrieved from http://www3.epa.gov/otaq/models/nonrdmdl/nonrdmdl2010/420r10016.pdf; EPA’s default for emission factor = U.S. Environmental Protection Agency (2010), Exhaust and crankcase emission factors for non-road engine modeling—Compression-ignition, retrieved from http://www3.epa.gov/otaq/models/nonrdmdl/nonrdmdl2010/420r10018.pdf.
AN EMISSIONS INVENTORY FOR AGRICULTURAL TRACTORS AND CONSTRUCTION EQUIPMENT IN INDIA
WORKING PAPER 2016-8 INTERNATIONAL COUNCIL ON CLEAN TRANSPORTATION 15
agricultural tractors and construction equipment in India. Very few studies have even touched on the number of these in-use diesel engines, let alone the performance of the equipment. The model used in this analysis adopted U.S. data. Even with careful adjustments applied to these inputs, the uncertainty of this estimation could still be high.
RecommendationsStringent emission standards are urgently required for non-road equipment.
The need for more stringent emission standards has become more urgent due to the rapid expansion of the non-road market and the large share of diesel engines in this market. Meanwhile, the roadmap toward 10 ppm diesel fuel has offered a useful platform for India to leapfrog to the most advanced emission standards, currently adopted in the EU and United States, and even potentially to filter-forcing standards, achieving additional emission reductions.
Maintenance is key.
Most non-road equipment, including agricultural tractors and construction equipment, has a long lifetime and multiple owners. Due to high costs, owners tend to maximize their use of the equipment, and there is a sub-stantial chance that old equipment will produce disproportionally high emissions because of lack of mainte-nance.35 The results of the modeling
35 Mukherjee, A., and Ping, C. (2008). Agricultural machinery safety- a perpetual theme of human society. UNAPCAEM, retrieved from http://www.unapcaem.org/publication/amsafety.pdf; A.T. Kearny. (2014). Building India’s earthmoving and construction equipment industry. retrieved
carried out for this analysis have already shown that old equipment could produce a remarkable share of PM2.5 and NOx emissions even without accounting for these high emitters.
More data on in-use characteristics of non-road equipment are needed.
There is a strong need for more studies of the Indian non-road market. On-site surveys and interviews can help identify in-use performance patterns for major equipment types used in India. This can improve the model inputs and help ensure more accurate results and fewer uncertain-ties. This will provide a deeper under-standing of the non-road market in India, which will help better regulate emissions.
A registration system can help better regulate the fleet in India.
In addition to local studies, the estab-lishment of a non-road equipment registration system in India is strongly recommended. California has started such a system, the Diesel Off-road On-line Reporting System (DOORS), requiring all fleet owners to report their equipment’s serial number, type, manufacturer, and model and model year, as well as information about the engine.36 In addition, each in-use machine is required to be labeled on both sides with a unique equipment
from https://www.atkearney.com/pt/automotive/ideas-insights/featured-article/-/asset_publisher/4rTTGHNzeaaK/content/building-india-s-earthmoving-and-construction-equipment-industry-landing-page-abstract/10192?_101_INSTANCE_4rTTGHNzeaaK_redirect=%2Fpt%2Fautomotive%2Fideas-insights
36 California Air Resources Board (2013), DOORS user guide—Initial reporting, retrieved from http://www.arb.ca.gov/msprog/ordiesel/documents/doors/userguide-initialreporting.pdf.
identification number assigned by the California Air Resources Board. India already requires manufactur-ers to mark construction equipment with an identification number;37 this requirement could be extended to tractors. Taking advantage of its existing identification system and existing VAHAN registration platform—the National Register e-Services of Registered Vehicles system 38—Ind ia cou ld use an approach similar to California’s to register non-road equipment and thus collect more information about this sector.
Next stepsIt is hoped that this preliminary emissions inventory wil l direct attention to potential environmental impacts from the non-road sector in India and inspire further research on fleet characteristics and use patterns, as well as more in-depth analysis of the sector. In addition to improvements to the model, both the assumptions made in this analysis and its results need to be calibrated with other studies of agricultural tractors and construction equipment in India. Evaluation of the impacts of non-road equipment on the environ-ment and on health under different policy scenarios, to inform future decisions on emission standards, is another promising direction for research and analysis.
37 Automotive Research Association of India (2015), Automotive industry standard: Construction equipment vehicles or earth-moving vehicles/machinery—Product identification numbering system, retrieved from https://araiindia.com/hmr/Control/AIS/1016201524316PMAIS_136_F.pdf.
38 Ministry of Road Transport and Highways (2015), National register e-services of registered vehicles, retrieved from https://vahan.nic.in/nrservices/.