Embed Size (px)
Citation preview
An Empirical Analysis Comparing Public Self-Selecting Elementary Schools to
Traditional Based Elementary Schools Within the Anchorage School District
by Matthew McCauley
Sponsored byCollege of Business and Public Policy and
University of Alaska Anchorage Honors College
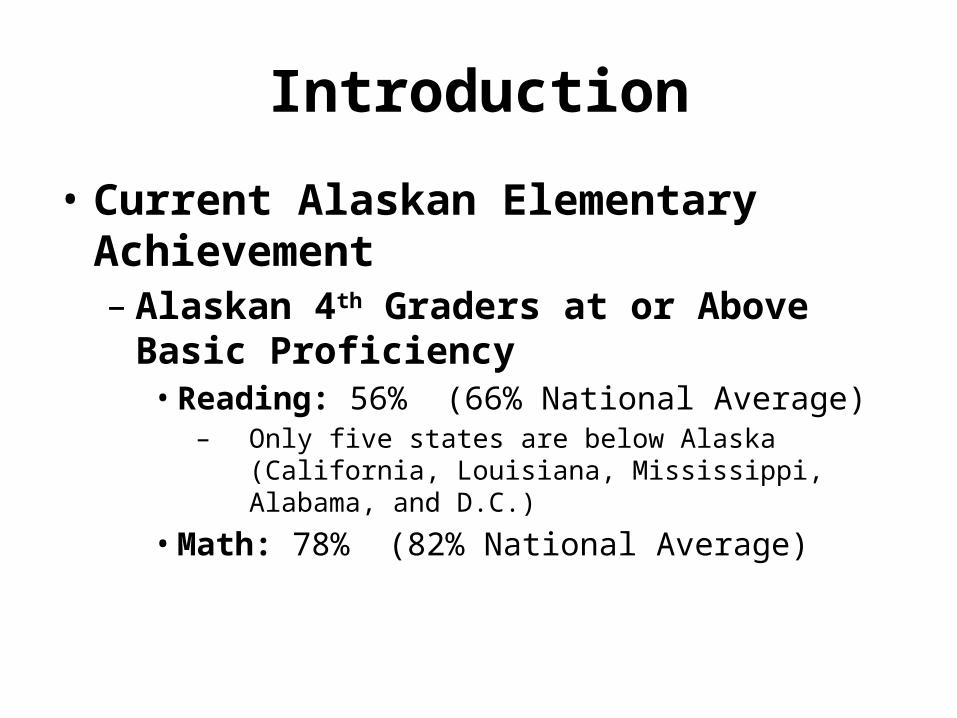
Introduction
• Current Alaskan Elementary Achievement – Alaskan 4th Graders at or Above Basic Proficiency• Reading: 56% (66% National Average)
– Only five states are below Alaska (California, Louisiana, Mississippi, Alabama, and D.C.)
• Math: 78% (82% National Average)
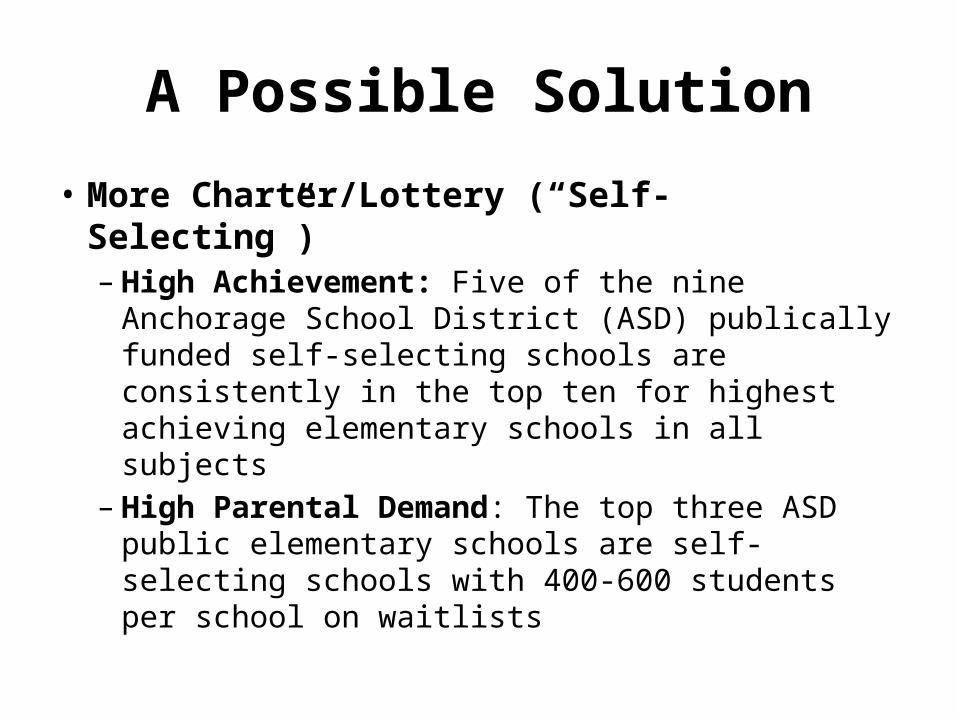
A Possible Solution
• More Charter/Lottery (“Self-Selecting”) – High Achievement: Five of the nine Anchorage
School District (ASD) publically funded self-selecting schools are consistently in the top ten for highest achieving elementary schools in all subjects
– High Parental Demand: The top three ASD public elementary schools are self-selecting schools with 400-600 students per school on waitlists

SBA: Percentage School Proficient
Reading Writing Math Science0%
10%
20%
30%
40%
50%
60%
70%
80%
90%
100%
90%87%
81%
70%
83%77%
72%
57%
SBA Comparison: Self-Selecting to Traditional
Self Selecting Avg District Avg

TerraNova Above Average Scores
Reading Language Math0%
5%
10%
15%
20%
25%
30%
35%
40%
45%42% 42%
31%
17% 16%
7%
TerraNova 4th Quartiles (76-99)
Self-Selecting District
My Question
What is most likely driving the differences in test scores between self-selecting K-6 elementary schools and traditional based schools?

Presentation Outline
• Related Literature• Data Summary and Sources• Econometric Framework• Discussion of Results

Related Literature• In Michigan self-selecting schools test scores were lower
or average to traditional public schools (Eberts and Hollenbeck 2001)
• Milwaukee, Wisconsin self-selecting school’s test score were lower or average to traditional public schools (Hiren Nisar 2010)
• In New York self-selecting schools had higher test scores compared to traditional public schools. (Hoxby et. al 2009)
– Authors controlled for parent, student, and teacher characteristics such as income, educational attainment of parents, teacher quality, students who were limited in English proficiency, F/R lunch, etc.
– My model controls for similar characteristics

My Research Methods
• Compare Self-Selecting Schools to Traditional Based Schools By:– Using least squares regression, random effects
model, and a panel data set– Controlling for parental, teacher, and student
characteristics

Data Summary and Sources
• Anchorage School District Elementary School Data. – “Profile of Performance”- School Years 2007-2010– Number of Students for Each School By Home Zip Code
Including Self-Selecting Schools• 2010 Census and American Community Survey
(2006-2010)– Average household income by census tract matched to
zip code– Average household educational attainment by census
tract matched to zip code

Data Summary and Sources
• 2008-2009 ASD ranked 94th out of the 100 largest school districts– ASD area covers 1,900 Square miles (Size of Delaware)– 42% of Alaska’s population lives in Anchorage– 50,000 students– Diversity: 50.8 percent non-white, 49.2 white– Over 90 different languages are spoken within the
ASD– $14,193 per student– 2,839 full time teachers

Econometric Framework• Two Competing Hypotheses– H0: The methods and teachers in self-selecting schools drive
the differences in outcomes; therefore, replicating a self-selecting school and its methods would increase test scores across the district.
– H1: A second hypothesis is that it is primarily the characteristics of parents or students that are driving differences in self-selecting school outcomes; that is, parents with a higher than average educational attainment, higher earnings, etc. (things that are highly correlated with student achievement) are more likely to send a child to a self-selecting school.

Variables and Descriptions• Dependent Variables– SBA Subject (Reading, Writing, Math, and Science)– TerraNova Subject (Reading, Language, and Math)
• Independent Variables– (1) Parental Effects
• Lnwkvolhrs: Nat. log of parental volunteers hours• Lnincome: Nat. log of average household income by zip• Pctbach: Average household educational attainment by zip
– (2) Teacher Quality Effects• Peraddegree: Percentage of teachers with masters or higher• Nbacert: National Board Certified teachers per school
– (3) Student Effects• Classstr: Classroom teacher to student ratio by school• Pctlep: Percentage of limited English proficient students• Pcteds: Percentage of free or reduced lunch students
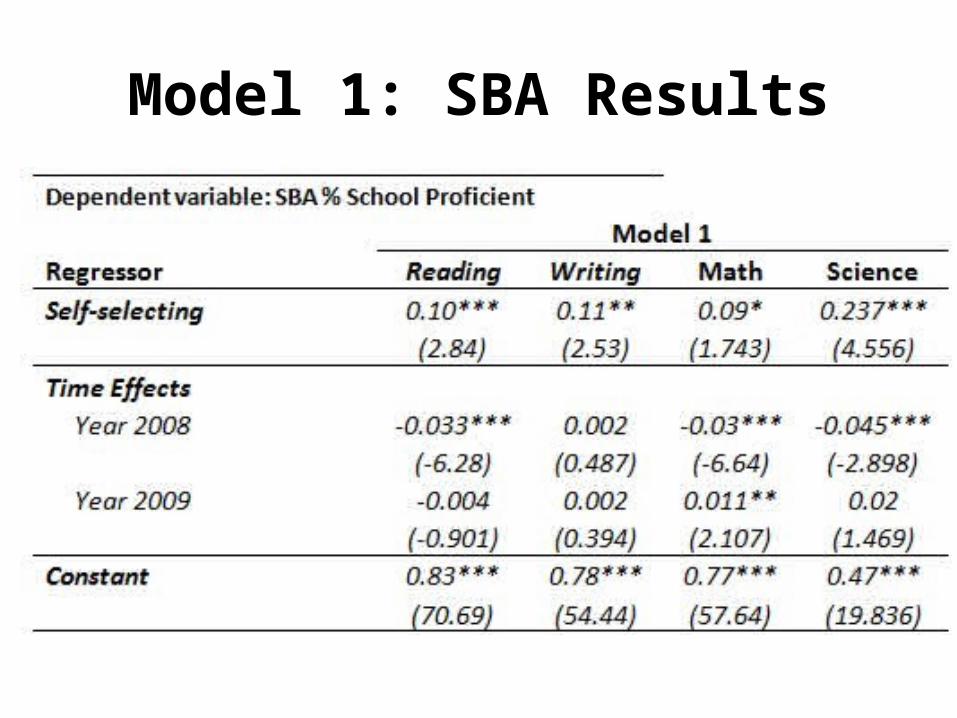
Model 1: SBA Results
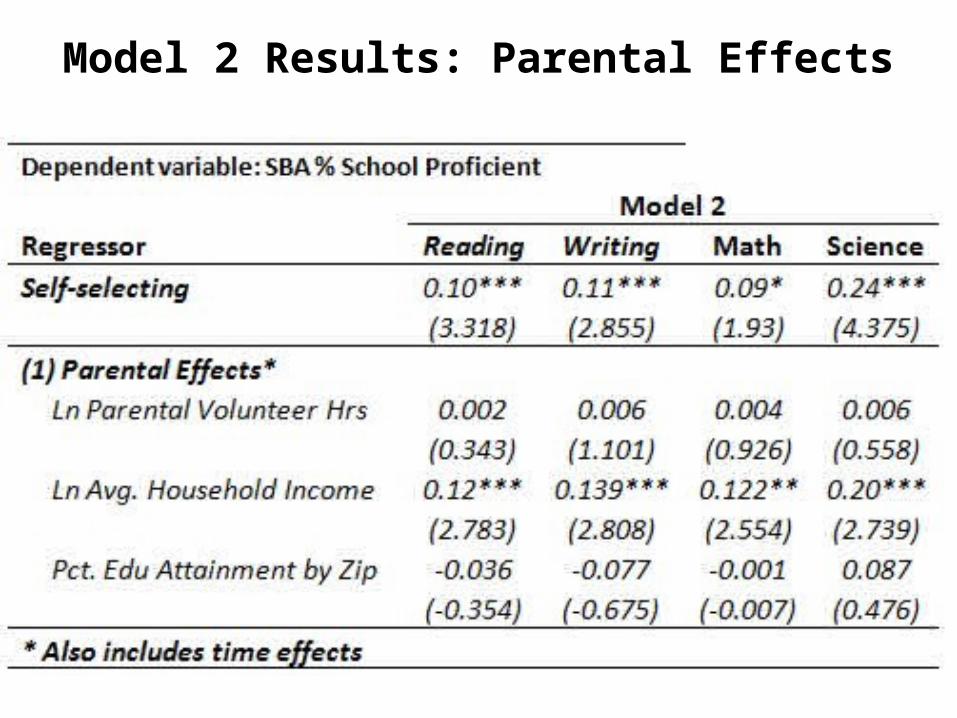
Model 2 Results: Parental Effects

Model 2 Results: Teacher Effects

Model 2 Results: Student Effects

2007-08 EDS 2007-08 LEP 2008-09 EDS 2008-09 LEP 2009-10 EDS 2009-10 LEP0%
10%
20%
30%
40%
50%
60%
45%
19%
44%
20%
50%
17%14%
8%
11%
8%
13%
5%
EDS and LEP Percentage Enrolled Self-Selecting and Traditional Based
Traditional K-6 Self-Selecting K-6

Interact: Self-Selecting and EDS
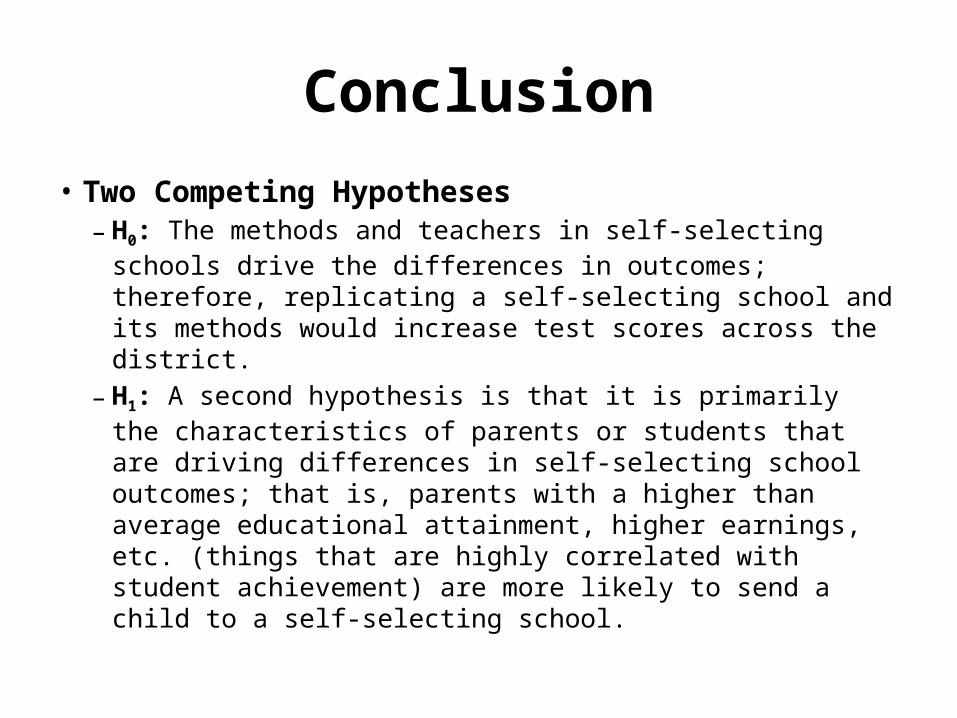
Conclusion
• Two Competing Hypotheses– H0: The methods and teachers in self-selecting schools drive
the differences in outcomes; therefore, replicating a self-selecting school and its methods would increase test scores across the district.
– H1: A second hypothesis is that it is primarily the characteristics of parents or students that are driving differences in self-selecting school outcomes; that is, parents with a higher than average educational attainment, higher earnings, etc. (things that are highly correlated with student achievement) are more likely to send a child to a self-selecting school.

Questions?


![ANCHORAGE SCHOOL DISTRICT ANCHORAGE, ALASKA ASD … · 2019-07-17 · music/art & health/P.E.] to be distributed across the elementary schools based on a 4% decrease in the pupil-teacher](https://img.pdfslide.net/doc/110x75/5fa6b432ac25325b8e2bf88d/anchorage-school-district-anchorage-alaska-asd-2019-07-17-musicart-healthpe.jpg)