Embed Size (px)
Citation preview
Coast Investment & Development Company
An Empirical Analysis Investigating
the Petrochemical Industry in Kuwait
I N V E S T M E N T U P D A T E March 2009

March 2009
An Empirical Analysis Investigating the petrochemical Industry in
Kuwait
Coast Research | Investment Update
2
/
Coast Investment & Development Company Shuhada Street, Al Sharq Area, Near Sawaber Complex P. O. Box 26755 Safat 13128 Kuwait Tel: (965) 22230555 Fax: (965) 22415364/ (965) 22408932 Email: [email protected] Website: www.coast.com.kw
Manal Hani Sabbah Investment Analyst [email protected] Direct: (965) 22230579
Corporate Finance and Investment Services - Research
March 2009
An Empirical Analysis Investigating the petrochemical Industry in
Kuwait
Coast Research | Investment Update
3
History of Oil Industry in Kuwait:
In 1911 the Anglo-Persian Oil Company (APOC), which was developing oil fields in Iran, requested
permission to negotiate a concession from Kuwait. The British government refused the request (as it
was entitled to do so under an 1899 treaty that granted Britain substantial control of Kuwait's foreign
policy), but two years later the British government commissioned a geological survey of the area. In
1913 the British government signed an agreement with Kuwait's Shaykh Mubarak the Great in which
he promised to grant concessions only to companies approved by the British government, clarifying
and reaffirming the agreement of 1899. World War I interrupted another effort to negotiate a
concession. By this time, the British government had purchased 51 percent ownership in APOC as
part of an effort to ensure oil supplies for the Royal Navy.
After World War I, interest in oil grew. APOC continued attempts to obtain a Kuwait concession.
Meanwhile, in the 1920s, Gulf Oil of the United States began to seek concessions in the gulf to
overcome its lack of crude oil sources. British treaties with most rulers in the gulf, including Kuwait,
made it difficult for non-British companies to gain access, although the United States government
pressured the British to provide equal treatment to United States oil firms. In 1932 Gulf Oil and
APOC formed a joint company to negotiate a concession in Kuwait, and this effort received British
government approval. In 1934 Kuwait's ruler, Shaykh Ahmad al Jabir Al Sabah, signed a concession
agreement with the Kuwait Oil Company (KOC), the firm jointly owned by APOC and Gulf Oil.
KOC began surveying in 1935. Commercial export of crude oil began in June 1946. Production
amounted to 5.9 million barrels in 1946 and 16.2 million barrels in 1947 then production continued to
increase until it peaked in 1972.
In the years after World War II, other companies received smaller concessions, in particular for
offshore oil, but KOC, which the government nationalized in 1976, retained the lion's share. The
American Independent Oil Company (Aminoil) was the successful bidder for Kuwait's rights in the
Neutral Zone, receiving in June 1948 a sixty-year concession for exploration and production.
Aminoil, which was owned by a number of small United States oil companies, had a joint operation
with the Getty Oil Company, which held the Saudi rights in the Neutral Zone. The Arabian American
Oil Company (Aramco, the main developer of Saudi Arabia's oil fields) reportedly viewed the terms
given Kuwait by Aminoil as unfavorable and relinquished its concession in the Neutral Zone, which
Getty won. Aminoil started exploratory drilling in 1949 but did not strike oil until 1953. Production
began in 1954. Production from the Neutral Zone was shared between the two countries, and Aminoil
paid royalties and taxes to Kuwait, whereas Getty paid royalties and taxes to Saudi Arabia. The zone
was partitioned in 1969, but the partitioning did not affect the concession arrangements.

March 2009
An Empirical Analysis Investigating the petrochemical Industry in
Kuwait
Coast Research | Investment Update
4
Frozen out of oil operations by the major oil companies, Kuwait started to develop its own
proficiency in the oil industry. The Kuwait National Petroleum Company (KNPC) was formed in
1960 with the expressed intention of becoming an integrated oil company. It began with 60 percent
government ownership; the remaining shares were held by private Kuwaiti investors. The government
bought out private investors in 1975. KNPC bought out KOC's local oil distribution facilities and
became the sole supplier of oil in Kuwait
In 1963 the Petrochemicals Industries Company (PIC) was formed, with 80 percent state ownership.
In 1976 the government bought out private investors, and PIC became wholly government owned.
Kuwait's goal of real participation in and control over its oil industry was achieved in 1976 when the
government bought KOC, including the refinery and other installations. In 1976 Kuwait concluded
negotiations to purchase 60 percent of its one-half share of AOC's offshore operations. In 1977
Kuwait nationalized the firm, paying compensation on the basis of an official estimate of the value of
assets. Aminoil became the Kuwait Wafrah Oil Company. In 1978 operations of the Al Wafrah field
passed to KOC, and KNPC took over the former Aminoil refinery and shipping terminal at Mina Abd
Allah.
As oil revenues rose in the 1970s, the Kuwaiti government continued its upstream and downstream
expansion, establishing the Kuwait Petroleum Corporation (KPC). KPC became the country's national
integrated oil company, with KOC, KNPC, PIC, the Kuwait Oil Tanker Company, and the Kuwait
Foreign Petroleum Exploration Company among its more important wholly owned subsidiaries.
Oil production levels fluctuated in the period after World War II .At first, production of crude oil rose
rapidly, peaking at nearly 1.1 billion barrels in 1970 before falling to more modest levels. In 1973 the
Kuwaiti government set an oil production limit of 3 million bpd under pressure from the National
Assembly. In the 1980s, as surplus oil supplies grew, Kuwait's production ceiling was reduced to 1.5
million bpd. In 1986 Kuwait reluctantly agreed to an OPEC limit of 1.25 million bpd . In early 1990,
Kuwait produced nearly 2 million bpd.

March 2009
An Empirical Analysis Investigating the petrochemical Industry in
Kuwait
Coast Research | Investment Update
5
Overview and Recent Trends:
In June 2008, the price of WTI crude oil hit an all-time high of $145 per barrel. By December, it had
fallen to a low of $30 per barrel. Following the sharp price decline that occurred during the second
half of 2008, the global oil market has remained relatively stable since the beginning 2009. This
situation is expected to continue through most of 2009, until economic recovery in the United States
and elsewhere leads to a rebound in oil demand growth.
Petrochemical sector in Kuwait:
Petroleum and Chemicals industry is the most vital industry in Kuwait. Kuwait`s oil industry
accounts for 80% of government`s revenue. Petroleum and petrochemicals represents nearly half of
GDP and 95% of export revenues. Oil prices had been rising since 2003 which caused the Kuwaiti
economic conditions to flourish until 2008 when the global financial crisis started affecting Kuwait`s
forecasted income. The latest victim of the global financial crisis in the Kuwaiti petrochemicals sector
was the call off of a $17.4 billion venture to create the world`s largest maker of Polyethylene with
Dow Chemical. However, Petroleum and Chemicals sector holds 4% of total market capitalization of
companies listed in Kuwait stock exchange. Companies of this sector are involved primarily in
industrial and petrochemical projects, production, sales and marketing of chemical products, oilfields
services including drilling, testing and consulting. Table 1 shows the sector`s listed companies.
Table 1
Company No. Company Name P/BV P/E ROA ROE
502 Kuwait Pipes Industries & Oil Services Co. 0.32 - -5.9 -19.86
506 Heavy Engineering and Shipbuilding Company 2.44 - -0.97 -5.04
507 Contracting & Marine Services Co. 1.32 18.73 2.43 7.04
514 Boubyan Petrochemical Co. 0.97 8.43 6.02 11.46
517 Al-Kout Industrial Projects Co. 2.64 17.33 7.83 15.24
526 Qurain Petrochemical Industries Company 1.2 - -3.98 -4.04
528 Ikarus Petroleum Industries Co. 0.45 8.75 3.85 5.14
606 Al-Safat Energy Holding 0.51 3.97 9.6 12.87
608 Independent Petroleum Group 0.85 8.7 2.83 9.8
617 National Petroleum Services Company 1.54 13.03 7.72 11.8
627 Aref Energy Holding Company 1.51 20.57 4.83 7.35
629 Gulf Petroleum Investment Co. 0.61 2.154 10.85 23.6
633 Burgan company for well drilling, trading & maintenance 2.83 13.65 10.96 20.76
645 Oula Fuel Marketing Company 2.47 18.15 10.82 13.63
655 Soor Fuel Marketing Co. 2.05 24.25 6.2 8.44
Source: Coast research, Zawya, Reuters

March 2009
An Empirical Analysis Investigating the petrochemical Industry in
Kuwait
Coast Research | Investment Update
6
Boubyan Petrochemical Group constitutes the largest player in this sector with 17% of the sector`s
total market capitalization. Its investments include Equate Petrochemical Company, Boubyan Plastic
industries Company, National Waste Management Company, Muna Noor Manufacturing and Trading
Company and Olayan Arabian Packaging Company LLC. The Group operates in Kuwait and member
countries of the Gulf Co-operation Council with market capitalization decreased 69% in the period of:
2008-2009 . Furthermore, the market capitalization of the second largest player in Petroleum and
Chemicals sector , Qurain Petrochemical Industries Company, decreased 57% for the same period as
seen in Figure 1.
Figure 1:
Source: Zawya, Coast research
The market capitalization growth of the rest of the companies is shown in Table 2. The National
Petroleum Services Company recorded the least decline of 3% followed by Independent Petroleum
Group with 17% negative growth rate. On the other hand, Kuwait Pipes Industries & Oil Services Co.
had the maximum decline of 77%.

March 2009
An Empirical Analysis Investigating the petrochemical Industry in
Kuwait
Coast Research | Investment Update
7
Table 2:
MC ( Mn KWD)
Company No Company Name 2008 2009 %
502 Kuwait Pipes Industries & Oil Services Co. 104.10 23.47 -77%
506 Heavy Engineering and Shipbuilding Company 75.70 42.43 -44%
507 Contracting & Marine Services Co. 86.60 59.49 -31%
514 Boubyan Petrochemical Co. 646.80 201.66 -69%
517 Al-Kout Industrial Projects Co. 122.40 45.06 -63%
606 Al-Safat Energy Holding 145.90 40.47 -72%
608 Independent Petroleum Group 59.40 49.57 -17%
617 National Petroleum Services Company 16.50 15.94 -3%
627 Aref Energy Holding Company 277.51 115.70 -58%
629 Gulf Petroleum Investment Co. 79.06 18.77 -76%
633 Burgan company for well drilling, trading & maintenance
177.80 101.57 -43%
645 Oula Fuel Marketing Company 148.50 88.57 -40%
526 Qurain Petrochemical Industries Company 434.50 187.32 -57%
528 Ikarus Petroleum Industries Co. 0.00 67.61 -
655 Soor Fuel Marketing Co. 0.00 76.59 -
Source: Reuters, Coast Research
Figure 2 shows the largest players holdings of the total market capitalization of the Petroleum and Chemicals sector.
Figure 2:
Boubyan Petrochemical Co.
17%
Qurain Petrochemical Industries Company
16%
Aref Energy Holding Company
11%
Burgan company for well drilling, trading &
maintenance9%
Others47%
Petroleum and Chemicals Sector in KSE
Source: Reuters

March 2009
An Empirical Analysis Investigating the petrochemical Industry in
Kuwait
Coast Research | Investment Update
8
The profitability of the companies in petroleum and chemicals sector varied during 2006 and 2007, but most of the companies had positive net profit growth rates. The largest player, Boubyan Petrochemicals, had 85% net profit growth rate while Qurain Petrochemicals had negative growth rate of 31% as shown in Figure 2. Growth rates for the rest of the sector`s companies are shown in Table 3. Notably, maximum growth rate was 568% recorded for Kuwait Pipes Industries & Oil Services Co.
Figure 3:
Source: Zawya
Table 3:
Company No. Company Name Annual profit(KWD`000`)
2006 2007 %
502 Kuwait Pipes Industries & Oil Services Co. (3,077) 14,409 568%
506 Heavy Engineering and Shipbuilding Company (7,269) 4,841 167%
507 Contracting & Marine Services Co. 7,935 4,062 -49%
514 Boubyan Petrochemical Co. 22,001 40,632 85%
517 Al-Kout Industrial Projects Co. 2,295 3,749 63%
526 Qurain Petrochemical Industries Company 21,600 14,802 -31%
528 Ikarus Petroleum Industries Co. 10,973 11,615 6%
606 Al-Safat Energy Holding (363) 337 193%
608 Independent Petroleum Group 6,090 6,724 10%
617 National Petroleum Services Company 718 1,547 116%
627 Aref Energy Holding Company 849 1,037 22%
629 Gulf Petroleum Investment Co. 7,016 6,528 -7%
633 Burgan company for well drilling, trading & maintenance 4,828 8,394 74%
645 Oula Fuel Marketing Company 3,481 4,040 16%
655 Soor Fuel Marketing Co. NA 3,119 NA
Source: Zawya

March 2009
An Empirical Analysis Investigating the petrochemical Industry in
Kuwait
Coast Research | Investment Update
9
Coast Petroleum and Chemicals Index and KSE Weighted Index almost had the same overall pattern of movement during the period 2007-2008 signifying a reasonably high correlation. The maximum monthly return of Weighted Index for the period was 12% recorded in April, 2007 while the maximum Petroleum and Chemicals Index return was 15% recorded in March,2008. On the other hand, the minimum return of both indices was -20% recorded in September,2008 as a result of the declining economic conditions as shown in Figure 4.
Figure 4:
Source: Coast Research
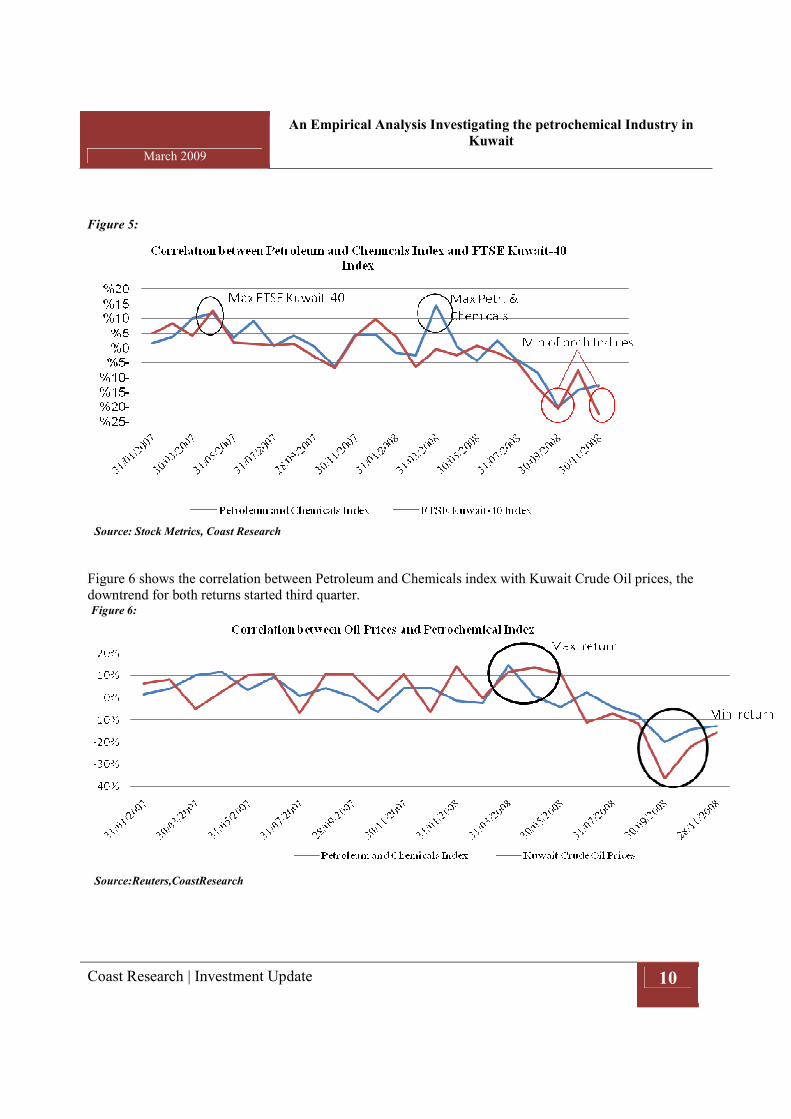
Coast Petroleum and Chemicals Index and FTSE Kuwait-40 Index almost had the same overall pattern of movement during the period 2007-2008 given that Petroleum and Chemicals Index was more volatile. The maximum FTSE Kuwait-40 Index for the period was 13% recorded in April,2007 while the maximum Petroleum and Chemicals Index was 15% recorded in March,2008. On the other hand, the minimum returns of both indices were -22% and -20% respectively recorded in the fourth quarter of 2008 as a result of the huge recession as shown in Figure 5.
March 2009
An Empirical Analysis Investigating the petrochemical Industry in
Kuwait
Coast Research | Investment Update
10
Figure 5:
Source: Stock Metrics, Coast Research
Figure 6 shows the correlation between Petroleum and Chemicals index with Kuwait Crude Oil prices, the downtrend for both returns started third quarter. Figure 6:
Source:Reuters,CoastResearch
March 2009
An Empirical Analysis Investigating the petrochemical Industry in
Kuwait
Coast Research | Investment Update
11
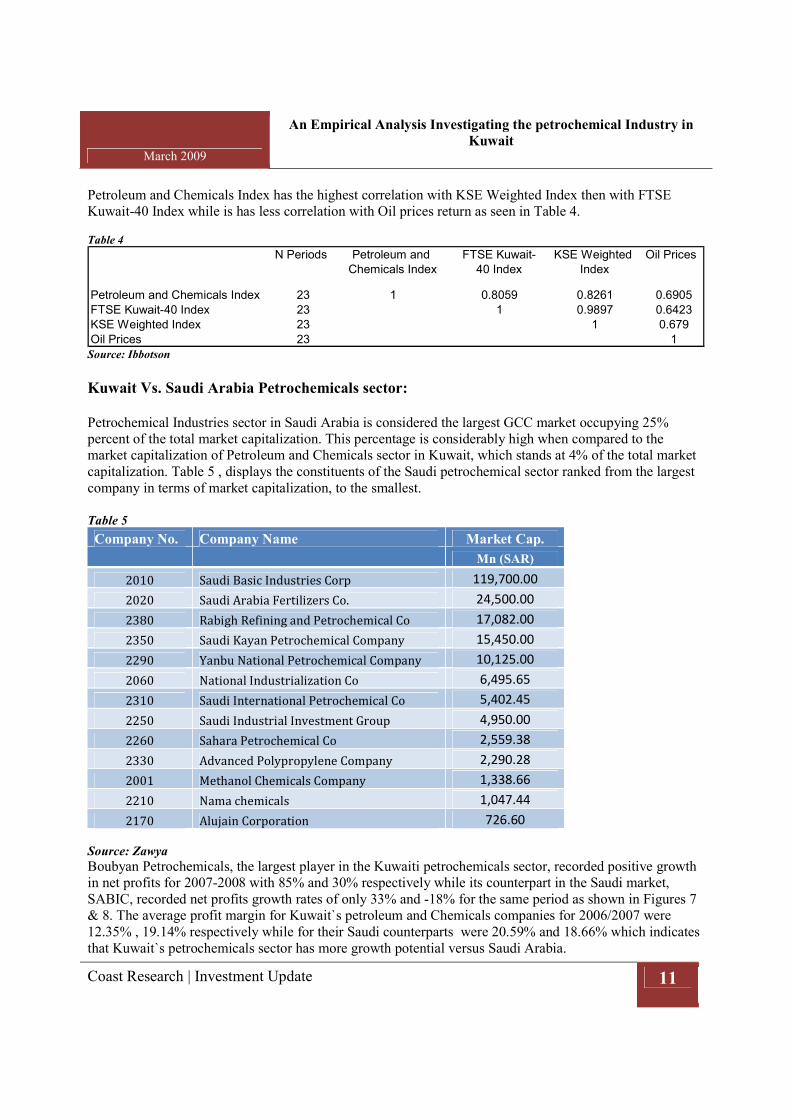
Petroleum and Chemicals Index has the highest correlation with KSE Weighted Index then with FTSE Kuwait-40 Index while is has less correlation with Oil prices return as seen in Table 4.
Table 4
N Periods Petroleum and
Chemicals Index
FTSE Kuwait-
40 Index
KSE Weighted
Index
Oil Prices
Petroleum and Chemicals Index 23 1 0.8059 0.8261 0.6905
FTSE Kuwait-40 Index 23 1 0.9897 0.6423
KSE Weighted Index 23 1 0.679
Oil Prices 23 1 Source: Ibbotson
Kuwait Vs. Saudi Arabia Petrochemicals sector:
Petrochemical Industries sector in Saudi Arabia is considered the largest GCC market occupying 25% percent of the total market capitalization. This percentage is considerably high when compared to the market capitalization of Petroleum and Chemicals sector in Kuwait, which stands at 4% of the total market capitalization. Table 5 , displays the constituents of the Saudi petrochemical sector ranked from the largest company in terms of market capitalization, to the smallest. Table 5
Company No. Company Name Market Cap.
Mn (SAR)
2010 Saudi Basic Industries Corp 119,700.00
2020 Saudi Arabia Fertilizers Co. 24,500.00
2380 Rabigh Refining and Petrochemical Co 17,082.00
2350 Saudi Kayan Petrochemical Company 15,450.00
2290 Yanbu National Petrochemical Company 10,125.00
2060 National Industrialization Co 6,495.65
2310 Saudi International Petrochemical Co 5,402.45
2250 Saudi Industrial Investment Group 4,950.00
2260 Sahara Petrochemical Co 2,559.38
2330 Advanced Polypropylene Company 2,290.28
2001 Methanol Chemicals Company 1,338.66
2210 Nama chemicals 1,047.44
2170 Alujain Corporation 726.60
Source: Zawya
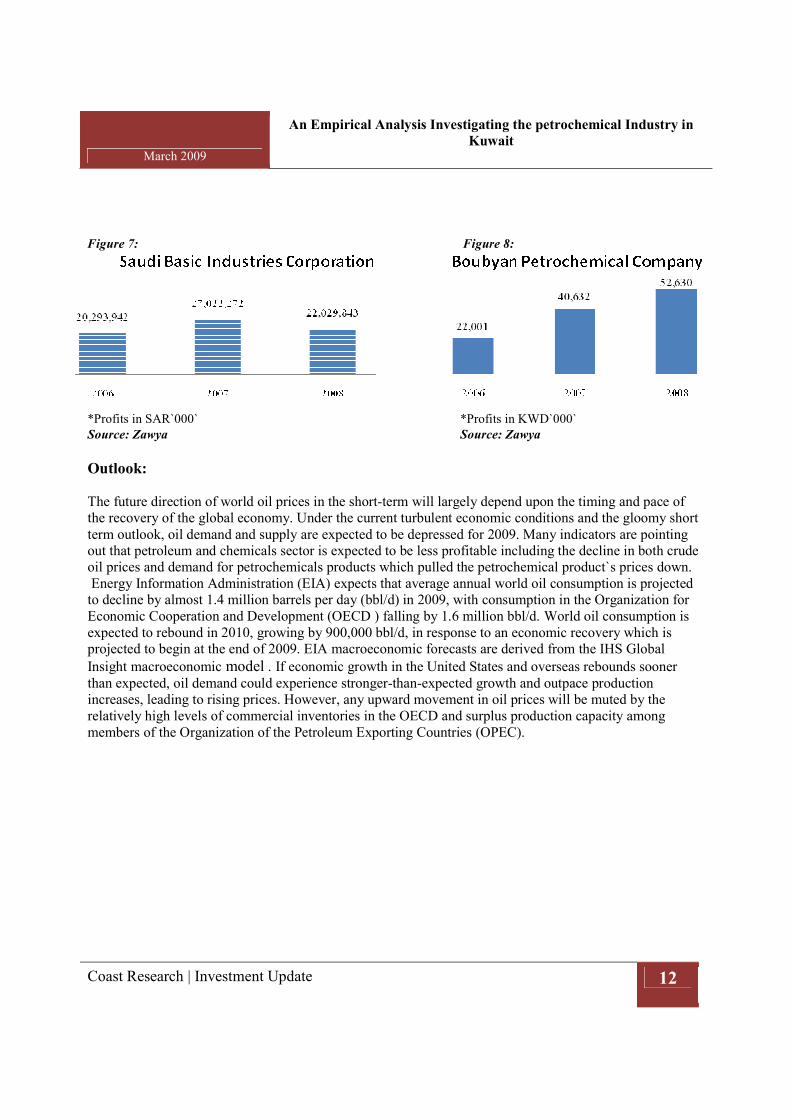
Boubyan Petrochemicals, the largest player in the Kuwaiti petrochemicals sector, recorded positive growth in net profits for 2007-2008 with 85% and 30% respectively while its counterpart in the Saudi market, SABIC, recorded net profits growth rates of only 33% and -18% for the same period as shown in Figures 7 & 8. The average profit margin for Kuwait`s petroleum and Chemicals companies for 2006/2007 were 12.35% , 19.14% respectively while for their Saudi counterparts were 20.59% and 18.66% which indicates that Kuwait`s petrochemicals sector has more growth potential versus Saudi Arabia.
March 2009
An Empirical Analysis Investigating the petrochemical Industry in
Kuwait
Coast Research | Investment Update
12
Figure 7: Figure 8:
*Profits in SAR`000` *Profits in KWD`000`
Source: Zawya Source: Zawya
Outlook: The future direction of world oil prices in the short-term will largely depend upon the timing and pace of the recovery of the global economy. Under the current turbulent economic conditions and the gloomy short term outlook, oil demand and supply are expected to be depressed for 2009. Many indicators are pointing out that petroleum and chemicals sector is expected to be less profitable including the decline in both crude oil prices and demand for petrochemicals products which pulled the petrochemical product`s prices down. Energy Information Administration (EIA) expects that average annual world oil consumption is projected to decline by almost 1.4 million barrels per day (bbl/d) in 2009, with consumption in the Organization for Economic Cooperation and Development (OECD ) falling by 1.6 million bbl/d. World oil consumption is expected to rebound in 2010, growing by 900,000 bbl/d, in response to an economic recovery which is projected to begin at the end of 2009. EIA macroeconomic forecasts are derived from the IHS Global Insight macroeconomic model . If economic growth in the United States and overseas rebounds sooner than expected, oil demand could experience stronger-than-expected growth and outpace production increases, leading to rising prices. However, any upward movement in oil prices will be muted by the relatively high levels of commercial inventories in the OECD and surplus production capacity among members of the Organization of the Petroleum Exporting Countries (OPEC).

March 2009
An Empirical Analysis Investigating the petrochemical Industry in
Kuwait
Coast Research | Investment Update
13
Disclaimers:
This document and its content are prepared for your personal information purposes only and it is not an offer, or the
solicitation of an offer, to buy or sell a security or enter into any other agreement. Projections of potential risk or return are
illustrative, and should not be taken as limitations of the maximum possible loss or gain. The information and any views
expressed are given as at the date of writing and subject to change. While the information has been obtained from sources
believed to be reliable we do not represent that it is accurate or complete and it should not be relied on as such. Coast
Investment and Development Company, its affiliates and subsidiaries accept no liability for any direct or consequential loss
arising from use of this document or its contents. At any time, Coast Investment and Development Company or its employees
may have a position, subject to change, in any securities or instruments referred to, or provide services to the issuer of those
securities and instruments.