Embed Size (px)
Citation preview
Volume 4, Number 3, July – September’ 2015
ISSN (Print):2279-0977, (Online):2279-0985
PEZZOTTAITE JOURNALS SJIF (2012): 3.23, SJIF (2013): 5.057, SJIF (2014): 5.871
International Journal of Applied Services Marketing Perspectives© Pezzottaite Journals. 1706 |P a g e
AN EMPIRICAL ANALYSIS OF CUSTOMERS’ ATTITUDE
TOWARDS THE SERVICES OF LIC
Dr. B. Revathy14 S. Bhagavathi15
ABSTRACT
Liberalization of the financial services sector has led to insurance companies functioning increasingly under competitive
pressures; so companies are consequently directing their strategies towards increasing customer satisfaction and loyalty
through improved service quality. With the opening of insurance industry to private players, the competition has intensified
and it has become very difficult for the companies to attract and retain the policyholders. Every company has recognized the
need for shifting from a traditional strategy to survive in the market. Customer service is an integral part of any life insurance
company. It is necessary to identify the key success factors in the life insurance industry, in terms of customer satisfaction, to
survive the intense competition and increase insurance penetration. To assess the awareness and attitude of policyholders
towards life insurance about life insurance products and their services, the survey was conducted in Kanyakumari district.
The results of the survey and views expressed by the respondents are given in this article.
KEYWORDS
Financial Services, Liberalization, Service Quality, Intense Competition, Insurance Penetration etc.
INTRODUCTION
Risk and uncertainty are incidental in life. Man may meet with a premature death. He may suffer due to accidents, destruction of
property, fires, sea-perils, floods, earthquakes and many other such natural calamities. Wherever there is uncertainty, there is risk
as well as insecurity involved. It is in providing against risk and insecurity of this kind that insurance play its prominent role.
Insurance does not eliminate losses arising from uncertain events, but it reduces its intensity by spreading the losses over a large
number of people, who insure against such risks. The main principle underlining insurance is the pooling of risks. A co-operative
device distributes the losses incurred by such risks. It is in this sense, that insurance has been described as an institution, which
eliminates risk and substitutes certainty for uncertainty.
In order to satisfy the varied tastes of the people, the Life Insurance Corporation of India has been introducing a variety of
innovative policies. Initially, the LIC offered only two types of policies viz; Whole Life policy and Endowment policy. Now it has
a long list of around 60 plans. Each policy caters to the needs of people. In these competitive days, the LIC introduces new
products with very competitive pricing and returns compared to the offerings of the private players. By this way, the LIC mops up
the savings from the public for providing money for welfare schemes.
SCENARIO BEFORE PRIVATIZATION
The Life Insurance Corporation of India was the only player in the field and enjoyed absolute monopoly. It had a vast
infrastructure throughout the country. Due to lack of competition, the organization was very complacent. Its product lacked
innovatory approach. Mainly money back policies and the policies that generated more commission for the agents were mostly
sold. Agents who were not professionally trained and lacked knowledge / expertise to propagate the philosophy of life insurance
procured most of the business. Due to this handicap, policies of the Life Insurance Corporation of India were not much perceived
by the public as a saving instrument. A glance at the business profile reveals that 75 percent of the business was generated in the
months of January, February and March while remaining 25 percent of the business was procured in the remaining nine months.
Life Insurance Policy was little perceived as an instrument of investment for earning return and was compared with the other
financial investment avenues. The real worth of life insurance, which included risk coverage, was not appreciated. Lack of correct
appreciation had been responsible for low response. It will be relegation for many to know that 10 percent of the agents procured
90 percent of the business and the remaining 90 percent of the agents procured the remaining 10 percent of the business. Most of
the agents did the job on part time basis and sold the policies to their reference group.
Due to these maladies, a vast portion of the population remained uninsured. 10 percent of its own employees are not insured
which reflects poorly on the management which has not been able to convince its own employees about the advantages of life
insurance. Customer service was another grey area, which was not adequately geared up to provide speedy and efficient service.
14 Associate Professor, Department of Commerce, Manonmaniam Sundaranar University, Tamil Nadu, India,
[email protected] 15Assistant Professor (Commerce), Arignar Anna College, Tamil Nadu, India, [email protected]
Volume 4, Number 3, July – September’ 2015
ISSN (Print):2279-0977, (Online):2279-0985
PEZZOTTAITE JOURNALS SJIF (2012): 3.23, SJIF (2013): 5.057, SJIF (2014): 5.871
International Journal of Applied Services Marketing Perspectives© Pezzottaite Journals. 1707 |P a g e
Due to this problem, there were many complaints from the policyholders. The organization was looked upon as an insensitive
institution.
POST PRIVATIZATION SCENARIO
The privatization of Insurance sector in 1999 has ushered in dynamism in the field. The Life Insurance Corporation of India has
been shaken up from its deep slumber and has been on guard to gear up for competition. Private companies have entered into the
Frey with joint ventures with foreign partners. This has been done to utilize their expertise in the field and give an opportunity to
professionally managed companies to win the confidence of the people. The major private player is ICICI Prudential Life and is
marketing its product with a slogan 'We cover you at every step in life”. Another player in the field is HDFC Standard Life and
this company has joined hands with Standard Life Assurance Company of UK. The company has a catchy ad line – 'Making the
life easier for you.' “Max India Limited has joined hands with Max – New York Life in propagating its philosophy with the slogan
“Your partner for life". Aditya Birla Group has joined hands with Sun Life Financial Company of Canada. The company has
carried the slogan "Your dreams, our commitment" to lure prospective customers. These companies have launched a number of
innovative products after carrying out deep research on the requirements of the prospective customers. In addition to innovative
products, these private companies offer state of the art service, professional administrative backup to provide customer - oriented
products and efficient after sales service to the full satisfaction of the customers. The private operators are handicapped by lack of
infrastructure and trained work - force. In addition to all these handicaps, the credibility factor is of utmost importance. NBFCs
have created such a mess in the financial sector that the private companies disillusion the investors. Insurance and in, particular
life insurance is a long-term contract. Hence, it is imperative to ensure credibility of the companies before making investments.
The investors would like to be doubly sure about the credibility of the company before making investments. Attractive / creative
product profile and packages are not bound to lure the investors very easily. The private players are likely to target village
population, which is hitherto untapped, and there is enormous potential for business in this area. With the professional approach,
these companies are likely to make effective business in the area. To tide over the handicap of credibility, the private companies
here started entering into agreements with established banks for the sale of the policy plans in different metropolitan cities.
The LIC of India is offering numerous services for the benefit of the policyholders. Such services are rendered either through its
branch officers or through well-trained agents. The policyholders also face sometimes inconveniences while they are dealing with
the LIC office or its agents. Thus, there is a possibility for the formation of a positive or negative attitude among the policyholders
towards the services of the LIC and its agents. This article deals with the attitude of the policyholders towards the services of the
LIC of India.
SAMPLE DESIGN
All the 4 branches of the LIC in Kanyakumari District are selected for the study. The policyholders belonging to the four taluks
namely Thovalai, Agasteeswaram, Kalkulam and Vilavancode have insured with the four branches of Kanyakumari District. The
sample respondents were selected by stratified random sampling method. For the purpose of the study, ten percent of the
policyholders from each taluk were considered. Out of 3517 policyholders, 703 were randomly selected. As 3 respondents did not
respond, only 700 samples were selected for further analysis.
ATTITUDE TOWARDS THE SERVICES OF THE LIC OF INDIA
Opinion of the policyholders of the services of the LIC may vary from person to person. The LIC of India has enjoyed
monopolistic position until 2000, the year in which the insurance sector was opened up to the private players in India as per the
regulations of the IRDA Act 1999. Hence, in this competitive environment, it is imperative to measure the level of attitude of the
policyholders towards the services of the LIC. Since the attitude of a person is a qualitative factor, which cannot be measured in
quantitative terms, it can be measured with the help of scaling technique. A five-point scale, based on the Likert's Scaling
Technique has been devised to measure the level of attitude of the policyholders towards the services of the LIC of India.
Frame of Attitude Scale
Based on the services and benefits offered by the LIC to the policyholders, thirty-five statements representing the attitude of an
individual policyholder towards the LIC were framed. All these twenty five statements jointly measure the level of attitude of the
respondents. For every statement, five choices namely, strongly agree, agree, neither agree nor disagree, disagree and strongly
disagree were given to the respondents for measuring their responses. The scores allotted for every positive statement are as
below:
Strongly agree - 5
Agree - 4
Neither agree nor disagree - 3
Volume 4, Number 3, July – September’ 2015
ISSN (Print):2279-0977, (Online):2279-0985
PEZZOTTAITE JOURNALS SJIF (2012): 3.23, SJIF (2013): 5.057, SJIF (2014): 5.871
International Journal of Applied Services Marketing Perspectives© Pezzottaite Journals. 1708 |P a g e
Disagree - 2
Strongly disagree - 1
However, for every negative statement, the scores allotted are:
Strongly agree - 1
Agree - 2
Neither agree nor disagree - 3
Disagree - 4
Strongly disagree - 5
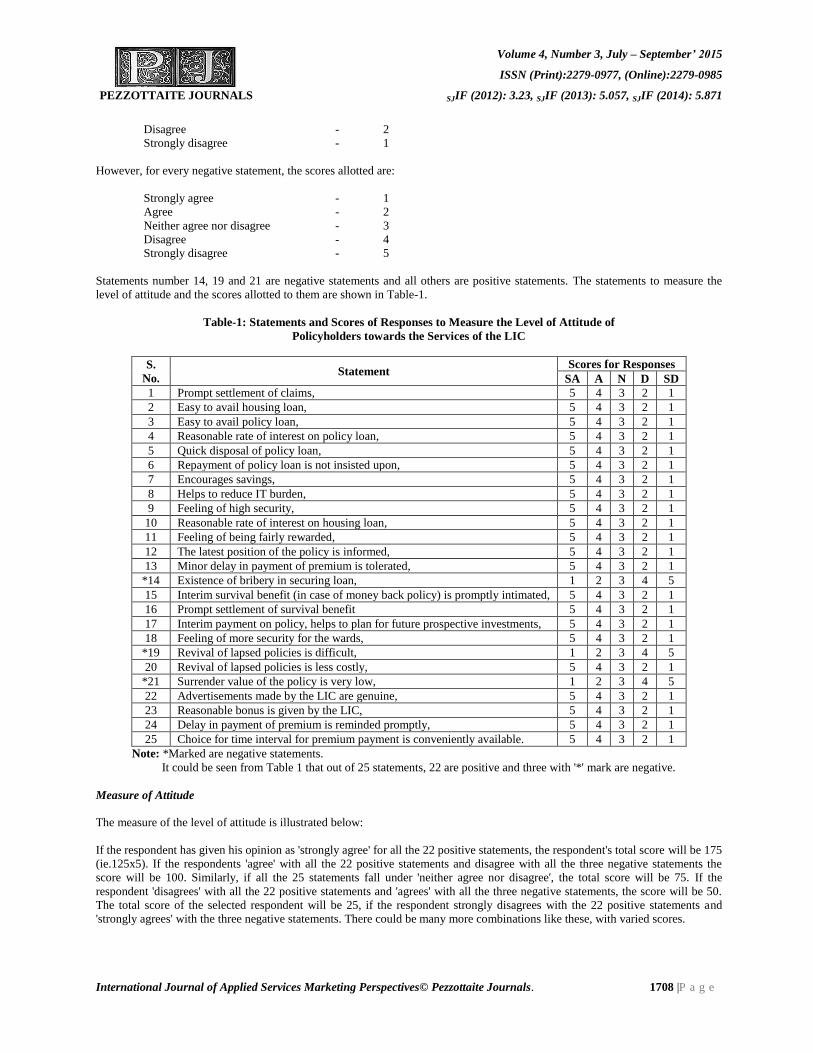
Statements number 14, 19 and 21 are negative statements and all others are positive statements. The statements to measure the
level of attitude and the scores allotted to them are shown in Table-1.
Table-1: Statements and Scores of Responses to Measure the Level of Attitude of
Policyholders towards the Services of the LIC
S.
No. Statement
Scores for Responses
SA A N D SD
1 Prompt settlement of claims, 5 4 3 2 1
2 Easy to avail housing loan, 5 4 3 2 1
3 Easy to avail policy loan, 5 4 3 2 1
4 Reasonable rate of interest on policy loan, 5 4 3 2 1
5 Quick disposal of policy loan, 5 4 3 2 1
6 Repayment of policy loan is not insisted upon, 5 4 3 2 1
7 Encourages savings, 5 4 3 2 1
8 Helps to reduce IT burden, 5 4 3 2 1
9 Feeling of high security, 5 4 3 2 1
10 Reasonable rate of interest on housing loan, 5 4 3 2 1
11 Feeling of being fairly rewarded, 5 4 3 2 1
12 The latest position of the policy is informed, 5 4 3 2 1
13 Minor delay in payment of premium is tolerated, 5 4 3 2 1
*14 Existence of bribery in securing loan, 1 2 3 4 5
15 Interim survival benefit (in case of money back policy) is promptly intimated, 5 4 3 2 1
16 Prompt settlement of survival benefit 5 4 3 2 1
17 Interim payment on policy, helps to plan for future prospective investments, 5 4 3 2 1
18 Feeling of more security for the wards, 5 4 3 2 1
*19 Revival of lapsed policies is difficult, 1 2 3 4 5
20 Revival of lapsed policies is less costly, 5 4 3 2 1
*21 Surrender value of the policy is very low, 1 2 3 4 5
22 Advertisements made by the LIC are genuine, 5 4 3 2 1
23 Reasonable bonus is given by the LIC, 5 4 3 2 1
24 Delay in payment of premium is reminded promptly, 5 4 3 2 1
25 Choice for time interval for premium payment is conveniently available. 5 4 3 2 1
Note: *Marked are negative statements.
It could be seen from Table 1 that out of 25 statements, 22 are positive and three with '*' mark are negative.
Measure of Attitude
The measure of the level of attitude is illustrated below:
If the respondent has given his opinion as 'strongly agree' for all the 22 positive statements, the respondent's total score will be 175
(ie.125x5). If the respondents 'agree' with all the 22 positive statements and disagree with all the three negative statements the
score will be 100. Similarly, if all the 25 statements fall under 'neither agree nor disagree', the total score will be 75. If the
respondent 'disagrees' with all the 22 positive statements and 'agrees' with all the three negative statements, the score will be 50.
The total score of the selected respondent will be 25, if the respondent strongly disagrees with the 22 positive statements and
'strongly agrees' with the three negative statements. There could be many more combinations like these, with varied scores.
Volume 4, Number 3, July – September’ 2015
ISSN (Print):2279-0977, (Online):2279-0985
PEZZOTTAITE JOURNALS SJIF (2012): 3.23, SJIF (2013): 5.057, SJIF (2014): 5.871
International Journal of Applied Services Marketing Perspectives© Pezzottaite Journals. 1709 |P a g e
Level of Attitude
The level of attitude of the sample policyholders who have expressed their opinion on the effective services of the LIC of India is
discussed. For all the twenty-five statements, the maximum score one can get is 125, if one 'strongly agrees' with all the positive
statements and 'strongly disagrees' with all the negative statements. Similarly, one can get a minimum score of 25, if one strongly
disagrees with all the positive statements and 'strongly agrees' with all the negative statements. Hence, the total score of a
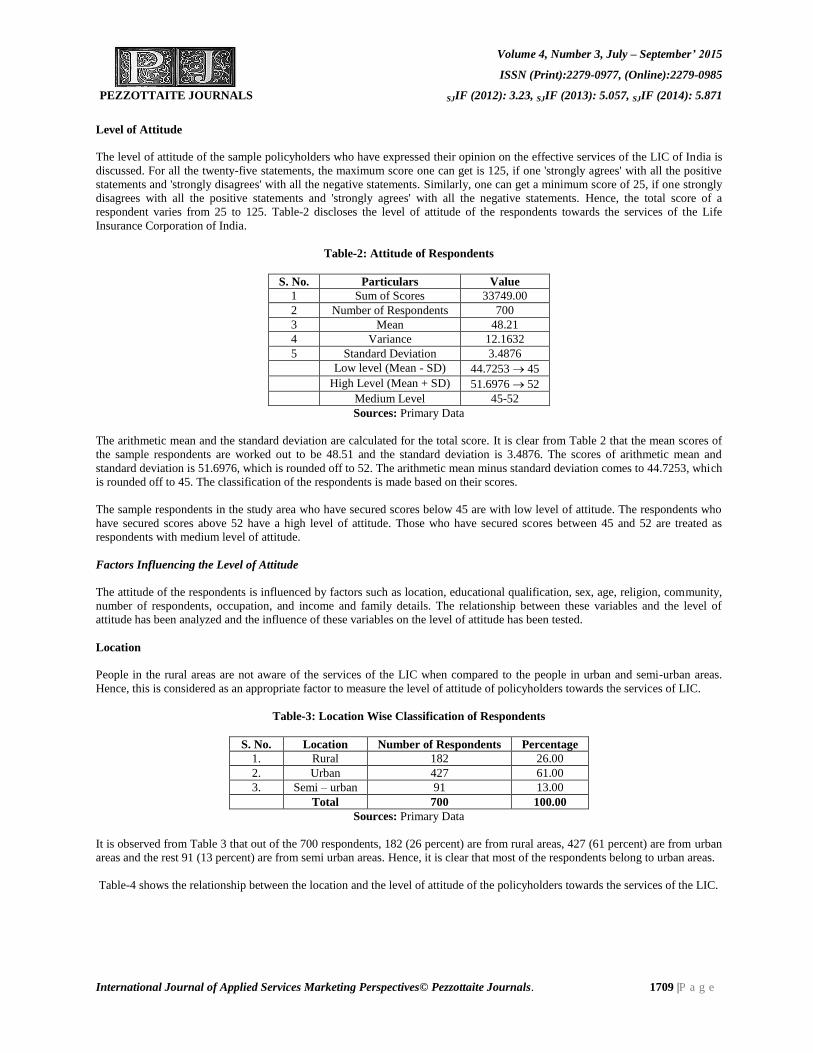
respondent varies from 25 to 125. Table-2 discloses the level of attitude of the respondents towards the services of the Life
Insurance Corporation of India.
Table-2: Attitude of Respondents
S. No. Particulars Value
1 Sum of Scores 33749.00
2 Number of Respondents 700
3 Mean 48.21
4 Variance 12.1632
5 Standard Deviation 3.4876
Low level (Mean - SD) 44.7253 45
High Level (Mean + SD) 51.6976 52
Medium Level 45-52
Sources: Primary Data
The arithmetic mean and the standard deviation are calculated for the total score. It is clear from Table 2 that the mean scores of
the sample respondents are worked out to be 48.51 and the standard deviation is 3.4876. The scores of arithmetic mean and
standard deviation is 51.6976, which is rounded off to 52. The arithmetic mean minus standard deviation comes to 44.7253, which
is rounded off to 45. The classification of the respondents is made based on their scores.
The sample respondents in the study area who have secured scores below 45 are with low level of attitude. The respondents who
have secured scores above 52 have a high level of attitude. Those who have secured scores between 45 and 52 are treated as
respondents with medium level of attitude.
Factors Influencing the Level of Attitude
The attitude of the respondents is influenced by factors such as location, educational qualification, sex, age, religion, community,
number of respondents, occupation, and income and family details. The relationship between these variables and the level of
attitude has been analyzed and the influence of these variables on the level of attitude has been tested.
Location
People in the rural areas are not aware of the services of the LIC when compared to the people in urban and semi-urban areas.
Hence, this is considered as an appropriate factor to measure the level of attitude of policyholders towards the services of LIC.
Table-3: Location Wise Classification of Respondents
S. No. Location Number of Respondents Percentage
1. Rural 182 26.00
2. Urban 427 61.00
3. Semi – urban 91 13.00
Total 700 100.00
Sources: Primary Data
It is observed from Table 3 that out of the 700 respondents, 182 (26 percent) are from rural areas, 427 (61 percent) are from urban
areas and the rest 91 (13 percent) are from semi urban areas. Hence, it is clear that most of the respondents belong to urban areas.
Table-4 shows the relationship between the location and the level of attitude of the policyholders towards the services of the LIC.

Volume 4, Number 3, July – September’ 2015
ISSN (Print):2279-0977, (Online):2279-0985
PEZZOTTAITE JOURNALS SJIF (2012): 3.23, SJIF (2013): 5.057, SJIF (2014): 5.871
International Journal of Applied Services Marketing Perspectives© Pezzottaite Journals. 1710 |P a g e
Table-4: Location and Level of Attitude
S. No. Location Level of Attitude
Low Medium High Total
1. Rural 30 (16.48) 110 (60.44) 42 (23.08) 182 (100)
2. Urban 114 (26.70) 238 (55.74) 75 (17.56) 427 (100)
3. Semi Urban 9 (9.89) 57 (62.64) 25 (27.47) 91 (100)
Total 153 405 142 700
Sources: Primary Data
Note: Figures in Parenthesis Denote Percentage
It is observed from Table 4 that out of the 182 respondents from the rural areas, 30 (16.48 percent), 110 (60.44 percent), and 42
(23.08 percent) are in the low, medium and high levels of attitude respectively. Regarding the urban respondents, 114 (26.70
percent), 238 (55.74 percent), and 75 (17.56 percent) are in the low, medium and high levels of attitude respectively. Out of the 91
respondents from the semi-urban areas, 9 (9.89 percent), 57 (62.64 percent) and 25 (27.47 percent) are in the low, medium and
high level of attitude respectively.
Educational Status
'Education' has been included as a variable because it helps to reflect the values, attitude, tastes or more broadly the life style of
the respondents. Generally, educated people are better aware of the multifarious services offered by the LIC of India when
compared to less educated and uneducated people. The less educated or uneducated people can have the knowledge of the services
and benefits of the LIC only through agents before and after taking the policy. Thus, the level of attitude varies according to the
level of education of the policyholders. Table 5 shows the educational status of the respondents.
Table-5: Educational Status of the Respondents
S. No. Educational Status Number of Respondents Percentage
1. School Education 371 53.00
2. Graduation 174 24.86
3. Professional 125 17.86
4. Diploma 30 4.29
Total 700 100
Sources: Primary Data
It is observed from Table 5 that out of the 700 respondents 371 (53 percent) have completed school education, 174 (24.86 percent)
are graduates, 125 (17.86 percent) are professionals and 30 (4.29 percent) are Diploma holders.
Table 6 depicts the level of attitude of the respondents towards the services of the LIC based on their education.
Table-6: Educational Status and Level of Attitude
S. No. Educational Level Level of Attitude
Low Medium High Total
1. School Education 78 (21.02) 227 (61.19) 66 (17.79) 371 (100)
2. Graduation 39 (22.41) 98 (56.32) 37 (21.26) 174 (100)
3. Professional 30 (24) 62 (49.6) 33 (26.4) 125 (100)
4. Diploma 6 (15) 18 (45) 6 (15) 40 (100)
Total 153 405 142 700
Sources: Primary Data
Note: Figures in Parenthesis Denote Percentage
Table 6 shows that out of 371 respondents having school level education, 78 (21.02 percent), 66 (17.79 percent) and 227 (61.19
percent) show low, high and medium levels of attitude respectively. Among the 174 respondents who are graduates, 39 (22.41
percent), 98 (56.32 percent), 37 (21.26 percent) have low, medium and high levels of attitude respectively. Out of the 125
respondents who have professional education, 30 (24 percent), 62 (49.6 percent), 33 (21.4 percent), have low, medium and high
levels of attitude respectively. Out of the 40 Diploma holders, 6 (15 percent), 18 (45 percent), 6 (15 percent) have low, medium
and high levels of attitude respectively.
Volume 4, Number 3, July – September’ 2015
ISSN (Print):2279-0977, (Online):2279-0985
PEZZOTTAITE JOURNALS SJIF (2012): 3.23, SJIF (2013): 5.057, SJIF (2014): 5.871
International Journal of Applied Services Marketing Perspectives© Pezzottaite Journals. 1711 |P a g e
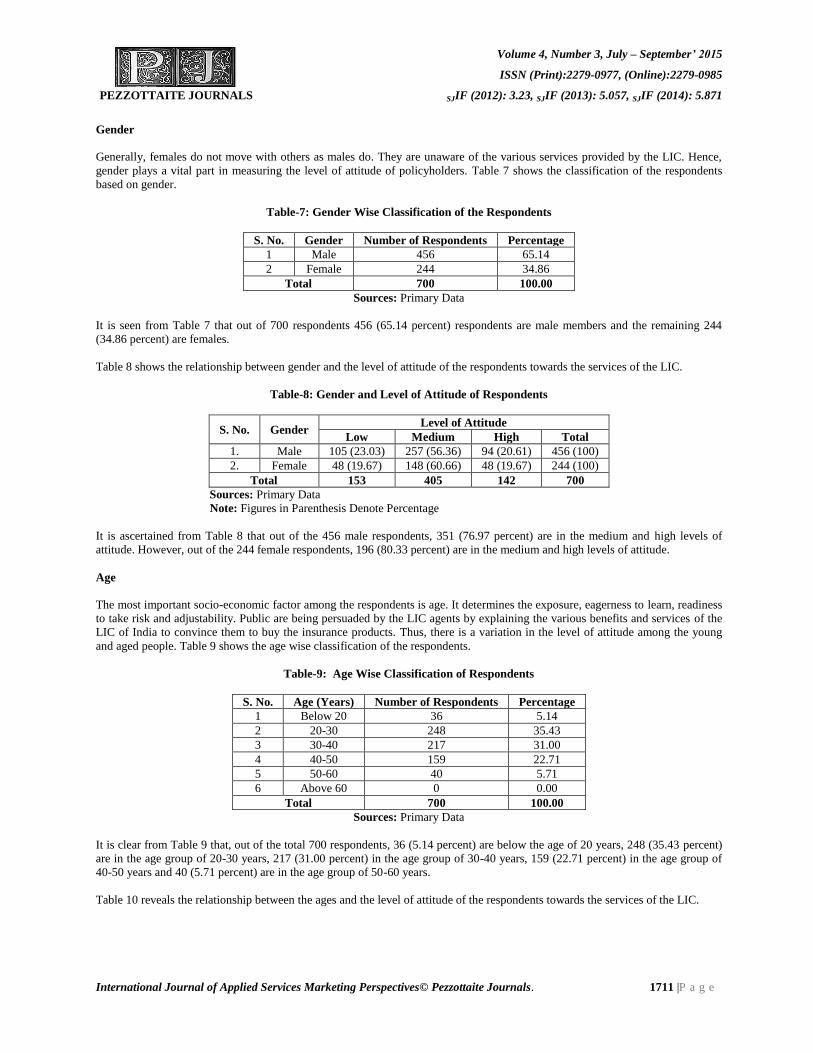
Gender
Generally, females do not move with others as males do. They are unaware of the various services provided by the LIC. Hence,
gender plays a vital part in measuring the level of attitude of policyholders. Table 7 shows the classification of the respondents
based on gender.
Table-7: Gender Wise Classification of the Respondents
S. No. Gender Number of Respondents Percentage
1 Male 456 65.14
2 Female 244 34.86
Total 700 100.00
Sources: Primary Data
It is seen from Table 7 that out of 700 respondents 456 (65.14 percent) respondents are male members and the remaining 244
(34.86 percent) are females.
Table 8 shows the relationship between gender and the level of attitude of the respondents towards the services of the LIC.
Table-8: Gender and Level of Attitude of Respondents
S. No. Gender Level of Attitude
Low Medium High Total
1. Male 105 (23.03) 257 (56.36) 94 (20.61) 456 (100)
2. Female 48 (19.67) 148 (60.66) 48 (19.67) 244 (100)
Total 153 405 142 700
Sources: Primary Data
Note: Figures in Parenthesis Denote Percentage
It is ascertained from Table 8 that out of the 456 male respondents, 351 (76.97 percent) are in the medium and high levels of
attitude. However, out of the 244 female respondents, 196 (80.33 percent) are in the medium and high levels of attitude.
Age
The most important socio-economic factor among the respondents is age. It determines the exposure, eagerness to learn, readiness
to take risk and adjustability. Public are being persuaded by the LIC agents by explaining the various benefits and services of the
LIC of India to convince them to buy the insurance products. Thus, there is a variation in the level of attitude among the young
and aged people. Table 9 shows the age wise classification of the respondents.
Table-9: Age Wise Classification of Respondents
S. No. Age (Years) Number of Respondents Percentage
1 Below 20 36 5.14
2 20-30 248 35.43
3 30-40 217 31.00
4 40-50 159 22.71
5 50-60 40 5.71
6 Above 60 0 0.00
Total 700 100.00
Sources: Primary Data
It is clear from Table 9 that, out of the total 700 respondents, 36 (5.14 percent) are below the age of 20 years, 248 (35.43 percent)
are in the age group of 20-30 years, 217 (31.00 percent) in the age group of 30-40 years, 159 (22.71 percent) in the age group of
40-50 years and 40 (5.71 percent) are in the age group of 50-60 years.
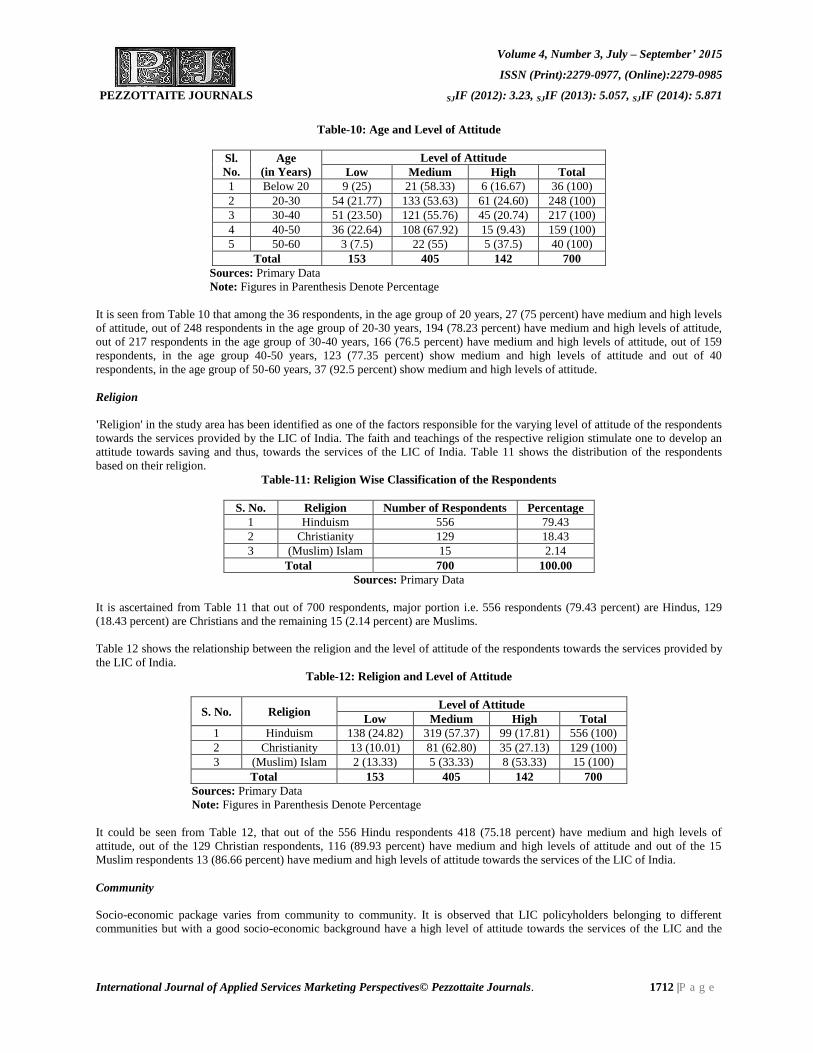
Table 10 reveals the relationship between the ages and the level of attitude of the respondents towards the services of the LIC.
Volume 4, Number 3, July – September’ 2015
ISSN (Print):2279-0977, (Online):2279-0985
PEZZOTTAITE JOURNALS SJIF (2012): 3.23, SJIF (2013): 5.057, SJIF (2014): 5.871
International Journal of Applied Services Marketing Perspectives© Pezzottaite Journals. 1712 |P a g e
Table-10: Age and Level of Attitude
Sl.
No.
Age
(in Years)
Level of Attitude
Low Medium High Total
1 Below 20 9 (25) 21 (58.33) 6 (16.67) 36 (100)
2 20-30 54 (21.77) 133 (53.63) 61 (24.60) 248 (100)
3 30-40 51 (23.50) 121 (55.76) 45 (20.74) 217 (100)
4 40-50 36 (22.64) 108 (67.92) 15 (9.43) 159 (100)
5 50-60 3 (7.5) 22 (55) 5 (37.5) 40 (100)
Total 153 405 142 700
Sources: Primary Data
Note: Figures in Parenthesis Denote Percentage
It is seen from Table 10 that among the 36 respondents, in the age group of 20 years, 27 (75 percent) have medium and high levels
of attitude, out of 248 respondents in the age group of 20-30 years, 194 (78.23 percent) have medium and high levels of attitude,
out of 217 respondents in the age group of 30-40 years, 166 (76.5 percent) have medium and high levels of attitude, out of 159
respondents, in the age group 40-50 years, 123 (77.35 percent) show medium and high levels of attitude and out of 40
respondents, in the age group of 50-60 years, 37 (92.5 percent) show medium and high levels of attitude.
Religion
'Religion' in the study area has been identified as one of the factors responsible for the varying level of attitude of the respondents
towards the services provided by the LIC of India. The faith and teachings of the respective religion stimulate one to develop an
attitude towards saving and thus, towards the services of the LIC of India. Table 11 shows the distribution of the respondents
based on their religion.
Table-11: Religion Wise Classification of the Respondents
S. No. Religion Number of Respondents Percentage
1 Hinduism 556 79.43
2 Christianity 129 18.43
3 (Muslim) Islam 15 2.14
Total 700 100.00
Sources: Primary Data
It is ascertained from Table 11 that out of 700 respondents, major portion i.e. 556 respondents (79.43 percent) are Hindus, 129
(18.43 percent) are Christians and the remaining 15 (2.14 percent) are Muslims.
Table 12 shows the relationship between the religion and the level of attitude of the respondents towards the services provided by
the LIC of India.
Table-12: Religion and Level of Attitude
S. No. Religion Level of Attitude
Low Medium High Total
1 Hinduism 138 (24.82) 319 (57.37) 99 (17.81) 556 (100)
2 Christianity 13 (10.01) 81 (62.80) 35 (27.13) 129 (100)
3 (Muslim) Islam 2 (13.33) 5 (33.33) 8 (53.33) 15 (100)
Total 153 405 142 700
Sources: Primary Data
Note: Figures in Parenthesis Denote Percentage
It could be seen from Table 12, that out of the 556 Hindu respondents 418 (75.18 percent) have medium and high levels of
attitude, out of the 129 Christian respondents, 116 (89.93 percent) have medium and high levels of attitude and out of the 15
Muslim respondents 13 (86.66 percent) have medium and high levels of attitude towards the services of the LIC of India.
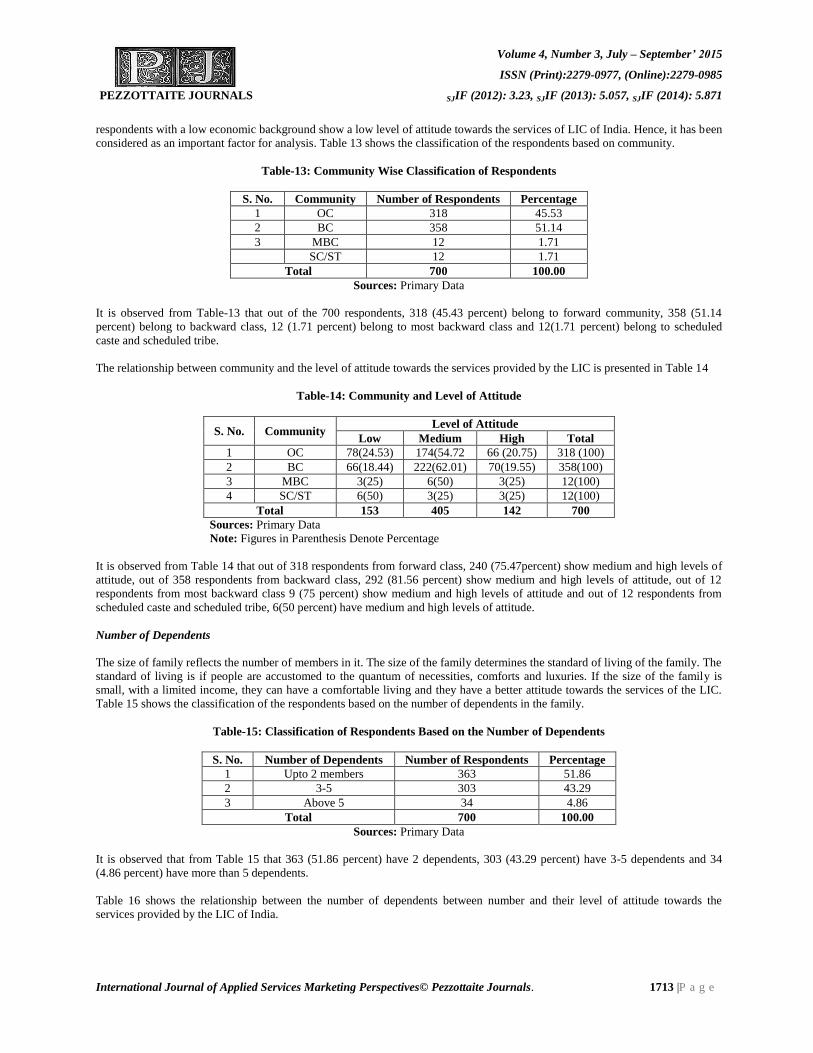
Community
Socio-economic package varies from community to community. It is observed that LIC policyholders belonging to different
communities but with a good socio-economic background have a high level of attitude towards the services of the LIC and the
Volume 4, Number 3, July – September’ 2015
ISSN (Print):2279-0977, (Online):2279-0985
PEZZOTTAITE JOURNALS SJIF (2012): 3.23, SJIF (2013): 5.057, SJIF (2014): 5.871
International Journal of Applied Services Marketing Perspectives© Pezzottaite Journals. 1713 |P a g e
respondents with a low economic background show a low level of attitude towards the services of LIC of India. Hence, it has been
considered as an important factor for analysis. Table 13 shows the classification of the respondents based on community.
Table-13: Community Wise Classification of Respondents
S. No. Community Number of Respondents Percentage
1 OC 318 45.53
2 BC 358 51.14
3 MBC 12 1.71
SC/ST 12 1.71
Total 700 100.00
Sources: Primary Data
It is observed from Table-13 that out of the 700 respondents, 318 (45.43 percent) belong to forward community, 358 (51.14
percent) belong to backward class, 12 (1.71 percent) belong to most backward class and 12(1.71 percent) belong to scheduled
caste and scheduled tribe.
The relationship between community and the level of attitude towards the services provided by the LIC is presented in Table 14
Table-14: Community and Level of Attitude
S. No. Community Level of Attitude
Low Medium High Total
1 OC 78(24.53) 174(54.72 66 (20.75) 318 (100)
2 BC 66(18.44) 222(62.01) 70(19.55) 358(100)
3 MBC 3(25) 6(50) 3(25) 12(100)
4 SC/ST 6(50) 3(25) 3(25) 12(100)
Total 153 405 142 700
Sources: Primary Data
Note: Figures in Parenthesis Denote Percentage
It is observed from Table 14 that out of 318 respondents from forward class, 240 (75.47percent) show medium and high levels of
attitude, out of 358 respondents from backward class, 292 (81.56 percent) show medium and high levels of attitude, out of 12
respondents from most backward class 9 (75 percent) show medium and high levels of attitude and out of 12 respondents from
scheduled caste and scheduled tribe, 6(50 percent) have medium and high levels of attitude.
Number of Dependents
The size of family reflects the number of members in it. The size of the family determines the standard of living of the family. The
standard of living is if people are accustomed to the quantum of necessities, comforts and luxuries. If the size of the family is
small, with a limited income, they can have a comfortable living and they have a better attitude towards the services of the LIC.
Table 15 shows the classification of the respondents based on the number of dependents in the family.
Table-15: Classification of Respondents Based on the Number of Dependents
S. No. Number of Dependents Number of Respondents Percentage
1 Upto 2 members 363 51.86
2 3-5 303 43.29
3 Above 5 34 4.86
Total 700 100.00
Sources: Primary Data
It is observed that from Table 15 that 363 (51.86 percent) have 2 dependents, 303 (43.29 percent) have 3-5 dependents and 34
(4.86 percent) have more than 5 dependents.
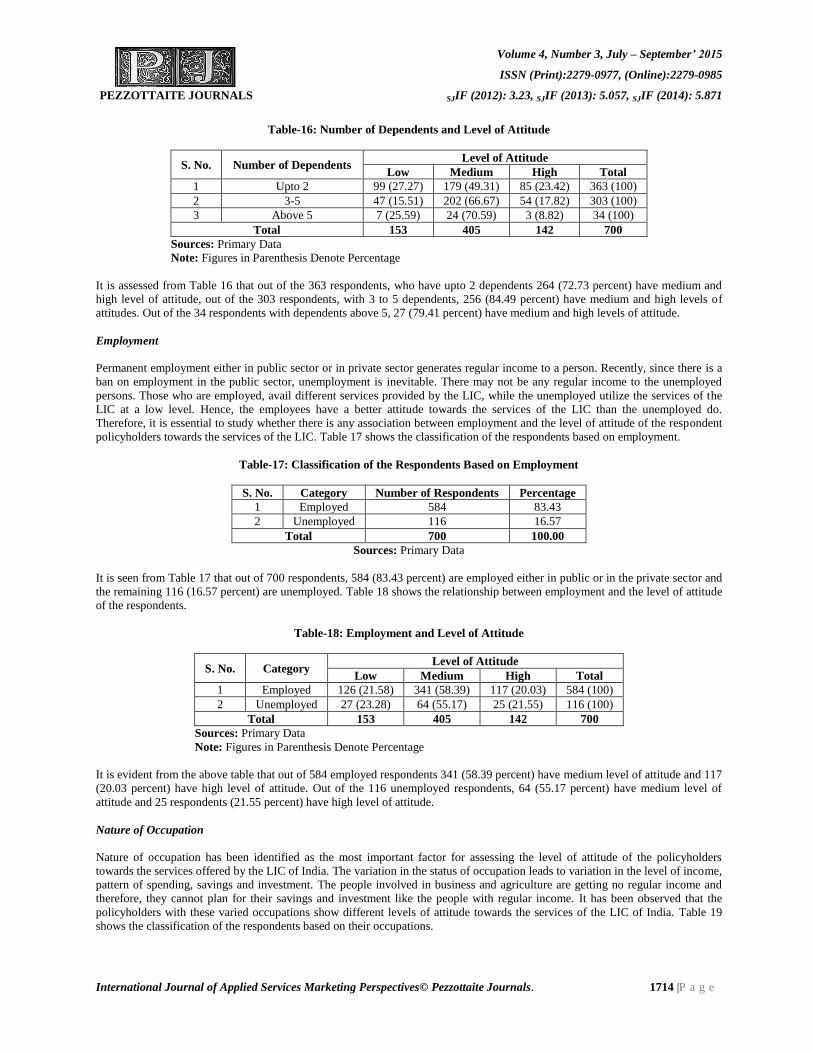
Table 16 shows the relationship between the number of dependents between number and their level of attitude towards the
services provided by the LIC of India.
Volume 4, Number 3, July – September’ 2015
ISSN (Print):2279-0977, (Online):2279-0985
PEZZOTTAITE JOURNALS SJIF (2012): 3.23, SJIF (2013): 5.057, SJIF (2014): 5.871
International Journal of Applied Services Marketing Perspectives© Pezzottaite Journals. 1714 |P a g e
Table-16: Number of Dependents and Level of Attitude
S. No. Number of Dependents Level of Attitude
Low Medium High Total
1 Upto 2 99 (27.27) 179 (49.31) 85 (23.42) 363 (100)
2 3-5 47 (15.51) 202 (66.67) 54 (17.82) 303 (100)
3 Above 5 7 (25.59) 24 (70.59) 3 (8.82) 34 (100)
Total 153 405 142 700
Sources: Primary Data
Note: Figures in Parenthesis Denote Percentage
It is assessed from Table 16 that out of the 363 respondents, who have upto 2 dependents 264 (72.73 percent) have medium and
high level of attitude, out of the 303 respondents, with 3 to 5 dependents, 256 (84.49 percent) have medium and high levels of
attitudes. Out of the 34 respondents with dependents above 5, 27 (79.41 percent) have medium and high levels of attitude.
Employment
Permanent employment either in public sector or in private sector generates regular income to a person. Recently, since there is a
ban on employment in the public sector, unemployment is inevitable. There may not be any regular income to the unemployed
persons. Those who are employed, avail different services provided by the LIC, while the unemployed utilize the services of the
LIC at a low level. Hence, the employees have a better attitude towards the services of the LIC than the unemployed do.
Therefore, it is essential to study whether there is any association between employment and the level of attitude of the respondent
policyholders towards the services of the LIC. Table 17 shows the classification of the respondents based on employment.
Table-17: Classification of the Respondents Based on Employment
S. No. Category Number of Respondents Percentage
1 Employed 584 83.43
2 Unemployed 116 16.57
Total 700 100.00
Sources: Primary Data
It is seen from Table 17 that out of 700 respondents, 584 (83.43 percent) are employed either in public or in the private sector and
the remaining 116 (16.57 percent) are unemployed. Table 18 shows the relationship between employment and the level of attitude
of the respondents.
Table-18: Employment and Level of Attitude
S. No. Category Level of Attitude
Low Medium High Total
1 Employed 126 (21.58) 341 (58.39) 117 (20.03) 584 (100)
2 Unemployed 27 (23.28) 64 (55.17) 25 (21.55) 116 (100)
Total 153 405 142 700
Sources: Primary Data
Note: Figures in Parenthesis Denote Percentage
It is evident from the above table that out of 584 employed respondents 341 (58.39 percent) have medium level of attitude and 117
(20.03 percent) have high level of attitude. Out of the 116 unemployed respondents, 64 (55.17 percent) have medium level of
attitude and 25 respondents (21.55 percent) have high level of attitude.
Nature of Occupation
Nature of occupation has been identified as the most important factor for assessing the level of attitude of the policyholders
towards the services offered by the LIC of India. The variation in the status of occupation leads to variation in the level of income,
pattern of spending, savings and investment. The people involved in business and agriculture are getting no regular income and
therefore, they cannot plan for their savings and investment like the people with regular income. It has been observed that the
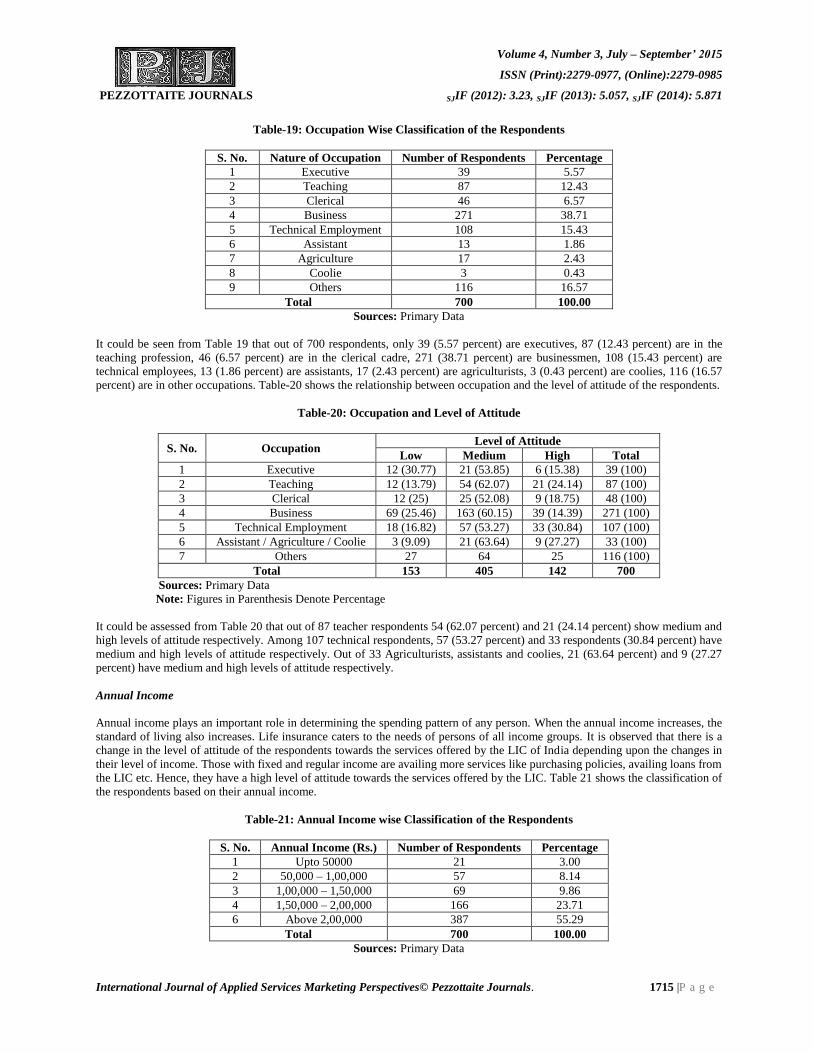
policyholders with these varied occupations show different levels of attitude towards the services of the LIC of India. Table 19
shows the classification of the respondents based on their occupations.
Volume 4, Number 3, July – September’ 2015
ISSN (Print):2279-0977, (Online):2279-0985
PEZZOTTAITE JOURNALS SJIF (2012): 3.23, SJIF (2013): 5.057, SJIF (2014): 5.871
International Journal of Applied Services Marketing Perspectives© Pezzottaite Journals. 1715 |P a g e
Table-19: Occupation Wise Classification of the Respondents
S. No. Nature of Occupation Number of Respondents Percentage
1 Executive 39 5.57
2 Teaching 87 12.43
3 Clerical 46 6.57
4 Business 271 38.71
5 Technical Employment 108 15.43
6 Assistant 13 1.86
7 Agriculture 17 2.43
8 Coolie 3 0.43
9 Others 116 16.57
Total 700 100.00
Sources: Primary Data
It could be seen from Table 19 that out of 700 respondents, only 39 (5.57 percent) are executives, 87 (12.43 percent) are in the
teaching profession, 46 (6.57 percent) are in the clerical cadre, 271 (38.71 percent) are businessmen, 108 (15.43 percent) are
technical employees, 13 (1.86 percent) are assistants, 17 (2.43 percent) are agriculturists, 3 (0.43 percent) are coolies, 116 (16.57
percent) are in other occupations. Table-20 shows the relationship between occupation and the level of attitude of the respondents.
Table-20: Occupation and Level of Attitude
S. No. Occupation Level of Attitude
Low Medium High Total
1 Executive 12 (30.77) 21 (53.85) 6 (15.38) 39 (100)
2 Teaching 12 (13.79) 54 (62.07) 21 (24.14) 87 (100)
3 Clerical 12 (25) 25 (52.08) 9 (18.75) 48 (100)
4 Business 69 (25.46) 163 (60.15) 39 (14.39) 271 (100)
5 Technical Employment 18 (16.82) 57 (53.27) 33 (30.84) 107 (100)
6 Assistant / Agriculture / Coolie 3 (9.09) 21 (63.64) 9 (27.27) 33 (100)
7 Others 27 64 25 116 (100)
Total 153 405 142 700
Sources: Primary Data
Note: Figures in Parenthesis Denote Percentage
It could be assessed from Table 20 that out of 87 teacher respondents 54 (62.07 percent) and 21 (24.14 percent) show medium and
high levels of attitude respectively. Among 107 technical respondents, 57 (53.27 percent) and 33 respondents (30.84 percent) have
medium and high levels of attitude respectively. Out of 33 Agriculturists, assistants and coolies, 21 (63.64 percent) and 9 (27.27
percent) have medium and high levels of attitude respectively.
Annual Income
Annual income plays an important role in determining the spending pattern of any person. When the annual income increases, the
standard of living also increases. Life insurance caters to the needs of persons of all income groups. It is observed that there is a
change in the level of attitude of the respondents towards the services offered by the LIC of India depending upon the changes in
their level of income. Those with fixed and regular income are availing more services like purchasing policies, availing loans from
the LIC etc. Hence, they have a high level of attitude towards the services offered by the LIC. Table 21 shows the classification of
the respondents based on their annual income.
Table-21: Annual Income wise Classification of the Respondents
S. No. Annual Income (Rs.) Number of Respondents Percentage
1 Upto 50000 21 3.00
2 50,000 – 1,00,000 57 8.14
3 1,00,000 – 1,50,000 69 9.86
4 1,50,000 – 2,00,000 166 23.71
6 Above 2,00,000 387 55.29
Total 700 100.00
Sources: Primary Data
Volume 4, Number 3, July – September’ 2015
ISSN (Print):2279-0977, (Online):2279-0985
PEZZOTTAITE JOURNALS SJIF (2012): 3.23, SJIF (2013): 5.057, SJIF (2014): 5.871
International Journal of Applied Services Marketing Perspectives© Pezzottaite Journals. 1716 |P a g e
It is inferred from Table 21 that out of 700 respondents 21 respondents (3 percent) are with the maximum annual income of Rs.
50,000, 57 (8.14 percent) with the annual income ranging between Rs. 50,000 and Rs. 10,00,00. 69 respondents (9.86 percent)
with the annual income between Rs. 10,00,00 and Rs. 1,50,000, 166 respondents (23.71 percent) with the annual income between
Rs. 1,50,000 and Rs. 2,00,000 and 387 respondents (55.29 percent) are with the annual income of above Rs. 200000.
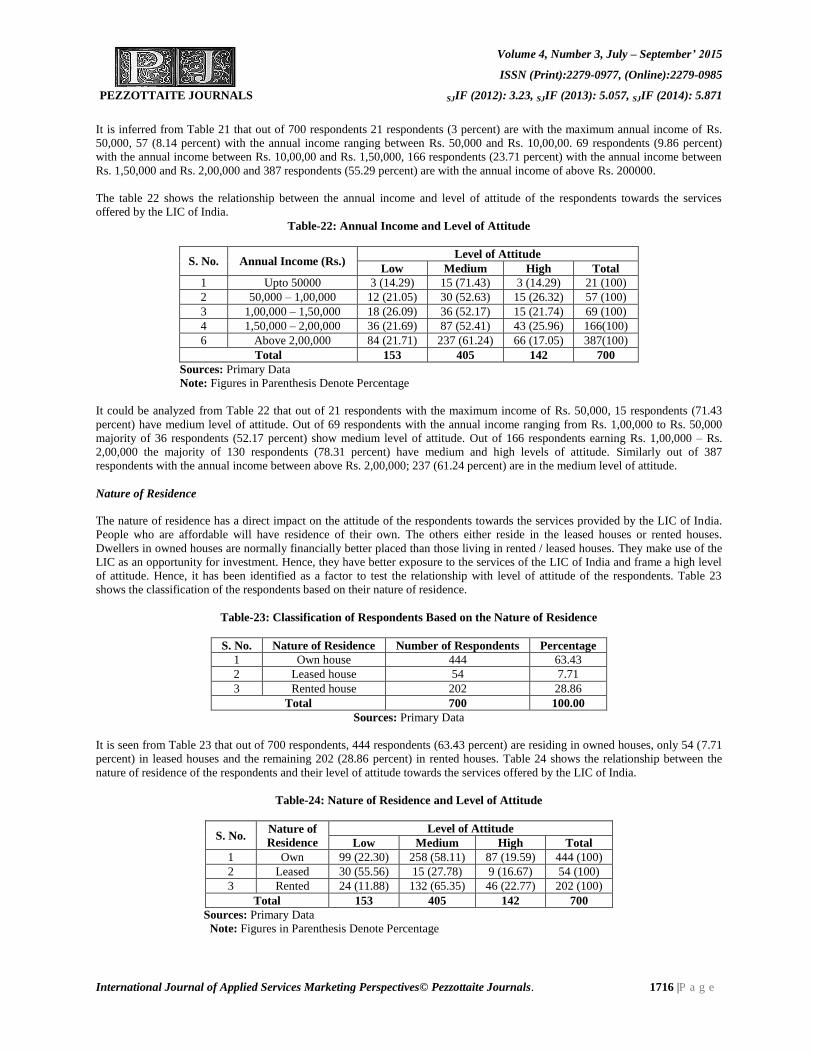
The table 22 shows the relationship between the annual income and level of attitude of the respondents towards the services
offered by the LIC of India.
Table-22: Annual Income and Level of Attitude
S. No. Annual Income (Rs.) Level of Attitude
Low Medium High Total
1 Upto 50000 3 (14.29) 15 (71.43) 3 (14.29) 21 (100)
2 50,000 – 1,00,000 12 (21.05) 30 (52.63) 15 (26.32) 57 (100)
3 1,00,000 – 1,50,000 18 (26.09) 36 (52.17) 15 (21.74) 69 (100)
4 1,50,000 – 2,00,000 36 (21.69) 87 (52.41) 43 (25.96) 166(100)
6 Above 2,00,000 84 (21.71) 237 (61.24) 66 (17.05) 387(100)
Total 153 405 142 700
Sources: Primary Data
Note: Figures in Parenthesis Denote Percentage
It could be analyzed from Table 22 that out of 21 respondents with the maximum income of Rs. 50,000, 15 respondents (71.43
percent) have medium level of attitude. Out of 69 respondents with the annual income ranging from Rs. 1,00,000 to Rs. 50,000
majority of 36 respondents (52.17 percent) show medium level of attitude. Out of 166 respondents earning Rs. 1,00,000 – Rs.
2,00,000 the majority of 130 respondents (78.31 percent) have medium and high levels of attitude. Similarly out of 387
respondents with the annual income between above Rs. 2,00,000; 237 (61.24 percent) are in the medium level of attitude.
Nature of Residence
The nature of residence has a direct impact on the attitude of the respondents towards the services provided by the LIC of India.
People who are affordable will have residence of their own. The others either reside in the leased houses or rented houses.
Dwellers in owned houses are normally financially better placed than those living in rented / leased houses. They make use of the
LIC as an opportunity for investment. Hence, they have better exposure to the services of the LIC of India and frame a high level
of attitude. Hence, it has been identified as a factor to test the relationship with level of attitude of the respondents. Table 23
shows the classification of the respondents based on their nature of residence.
Table-23: Classification of Respondents Based on the Nature of Residence
S. No. Nature of Residence Number of Respondents Percentage
1 Own house 444 63.43
2 Leased house 54 7.71
3 Rented house 202 28.86
Total 700 100.00
Sources: Primary Data
It is seen from Table 23 that out of 700 respondents, 444 respondents (63.43 percent) are residing in owned houses, only 54 (7.71
percent) in leased houses and the remaining 202 (28.86 percent) in rented houses. Table 24 shows the relationship between the
nature of residence of the respondents and their level of attitude towards the services offered by the LIC of India.
Table-24: Nature of Residence and Level of Attitude
S. No. Nature of
Residence
Level of Attitude
Low Medium High Total
1 Own 99 (22.30) 258 (58.11) 87 (19.59) 444 (100)
2 Leased 30 (55.56) 15 (27.78) 9 (16.67) 54 (100)
3 Rented 24 (11.88) 132 (65.35) 46 (22.77) 202 (100)
Total 153 405 142 700
Sources: Primary Data
Note: Figures in Parenthesis Denote Percentage
Volume 4, Number 3, July – September’ 2015
ISSN (Print):2279-0977, (Online):2279-0985
PEZZOTTAITE JOURNALS SJIF (2012): 3.23, SJIF (2013): 5.057, SJIF (2014): 5.871
International Journal of Applied Services Marketing Perspectives© Pezzottaite Journals. 1717 |P a g e
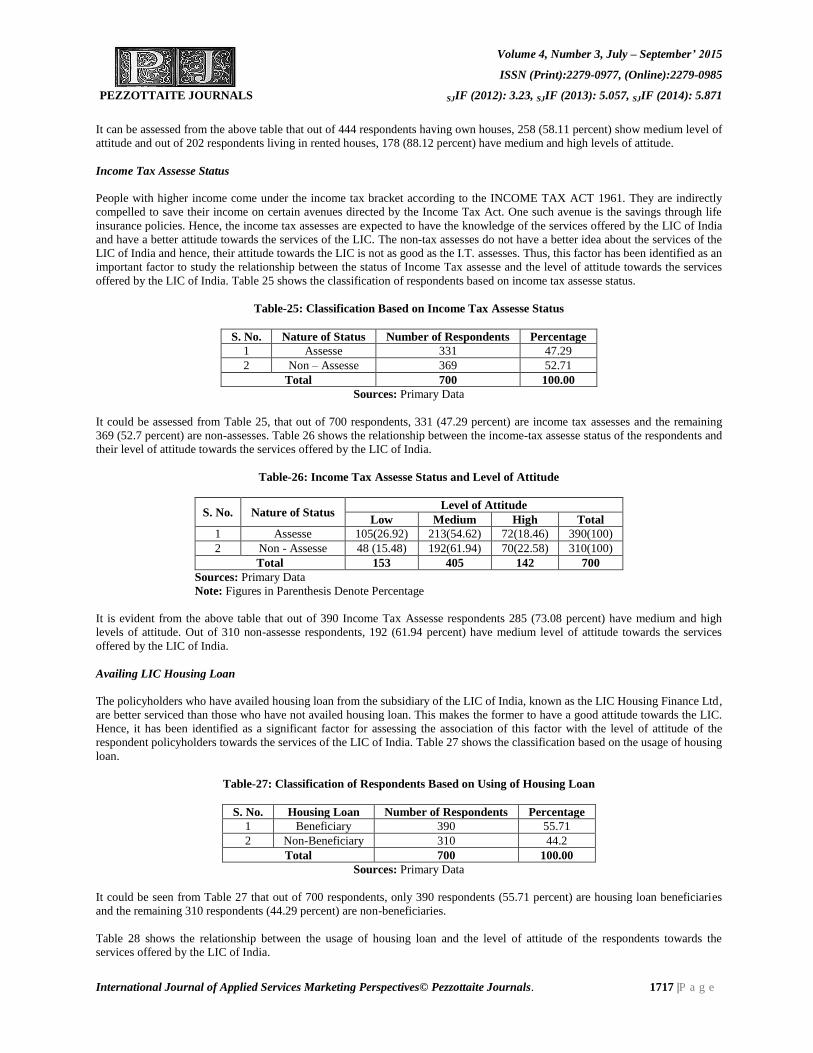
It can be assessed from the above table that out of 444 respondents having own houses, 258 (58.11 percent) show medium level of
attitude and out of 202 respondents living in rented houses, 178 (88.12 percent) have medium and high levels of attitude.
Income Tax Assesse Status
People with higher income come under the income tax bracket according to the INCOME TAX ACT 1961. They are indirectly
compelled to save their income on certain avenues directed by the Income Tax Act. One such avenue is the savings through life
insurance policies. Hence, the income tax assesses are expected to have the knowledge of the services offered by the LIC of India
and have a better attitude towards the services of the LIC. The non-tax assesses do not have a better idea about the services of the
LIC of India and hence, their attitude towards the LIC is not as good as the I.T. assesses. Thus, this factor has been identified as an
important factor to study the relationship between the status of Income Tax assesse and the level of attitude towards the services
offered by the LIC of India. Table 25 shows the classification of respondents based on income tax assesse status.
Table-25: Classification Based on Income Tax Assesse Status
S. No. Nature of Status Number of Respondents Percentage
1 Assesse 331 47.29
2 Non – Assesse 369 52.71
Total 700 100.00
Sources: Primary Data
It could be assessed from Table 25, that out of 700 respondents, 331 (47.29 percent) are income tax assesses and the remaining
369 (52.7 percent) are non-assesses. Table 26 shows the relationship between the income-tax assesse status of the respondents and
their level of attitude towards the services offered by the LIC of India.
Table-26: Income Tax Assesse Status and Level of Attitude
S. No. Nature of Status Level of Attitude
Low Medium High Total
1 Assesse 105(26.92) 213(54.62) 72(18.46) 390(100)
2 Non - Assesse 48 (15.48) 192(61.94) 70(22.58) 310(100)
Total 153 405 142 700
Sources: Primary Data
Note: Figures in Parenthesis Denote Percentage
It is evident from the above table that out of 390 Income Tax Assesse respondents 285 (73.08 percent) have medium and high
levels of attitude. Out of 310 non-assesse respondents, 192 (61.94 percent) have medium level of attitude towards the services
offered by the LIC of India.
Availing LIC Housing Loan
The policyholders who have availed housing loan from the subsidiary of the LIC of India, known as the LIC Housing Finance Ltd,
are better serviced than those who have not availed housing loan. This makes the former to have a good attitude towards the LIC.
Hence, it has been identified as a significant factor for assessing the association of this factor with the level of attitude of the
respondent policyholders towards the services of the LIC of India. Table 27 shows the classification based on the usage of housing
loan.
Table-27: Classification of Respondents Based on Using of Housing Loan
S. No. Housing Loan Number of Respondents Percentage
1 Beneficiary 390 55.71
2 Non-Beneficiary 310 44.2
Total 700 100.00
Sources: Primary Data
It could be seen from Table 27 that out of 700 respondents, only 390 respondents (55.71 percent) are housing loan beneficiaries
and the remaining 310 respondents (44.29 percent) are non-beneficiaries.
Table 28 shows the relationship between the usage of housing loan and the level of attitude of the respondents towards the
services offered by the LIC of India.

Volume 4, Number 3, July – September’ 2015
ISSN (Print):2279-0977, (Online):2279-0985
PEZZOTTAITE JOURNALS SJIF (2012): 3.23, SJIF (2013): 5.057, SJIF (2014): 5.871
International Journal of Applied Services Marketing Perspectives© Pezzottaite Journals. 1718 |P a g e
Table-28: Usage of Housing Loan and Level of Attitude
S. No. Housing Loan Level of Attitude
Low Medium High Total
1 Beneficiary 105(26.92) 213 (54.62) 72(18.46) 390(100)
2 Non-Beneficiary 48 (15.48) 192 (61.94) 70(22.58) 310(100)
Total 153 405 142 700
Sources: Primary Data
Note: Figures in Parenthesis Denote Percentage
It is inferred from Table 28 that out of 390 housing loan beneficiaries, 72 (18.46 percent) have high level of attitude and out of
310 housing loan non-beneficiaries, 262 respondents (84.52 percent) have medium and high levels of attitude.
Policy Loan Beneficiary
Policy loan is one, which is availed from the LIC for meeting the urgent financial needs of the policyholder. The loan is
sanctioned on the spot and the cheque is issued immediately by the LIC. The rate of interest on this loan is also meager. When the
loan is not repaid within the stipulated period, no severe action is taken by the LIC. Hence, the policyholders who have availed the
policy loan have developed intimacy with the LIC. The intimacy with the LIC creates a better attitude in the minds of the
policyholders and therefore policy loan is considered as an important factor for analyzing the association with the level of attitude
of the policyholders towards the services offered by the LIC of India. Table 29 shows the classification of respondents based on
the beneficiaries of policy loan.
Table-29: Classification of Respondents Based on Availing of Policy Loan
S. No. Policy Loan Number of Respondents Percentage
1 Beneficiary 437 62.43
2 Non-Beneficiary 263 37.57
Total 700 100.00
Sources: Primary Data
It is assessed from Table 29 that out of 700 respondents, 437 (62.43 percent) are beneficiaries and the remaining 263 (37.75
percent) are non-beneficiaries of policy loan from the LIC. Table 30 shows the relationship between the usage of policy loan and
the level of attitude of the respondents.
Table-30: Usage of Policy Loan and Level of Attitude
S. No. Housing Loan Level of Attitude
Low Medium High Total
1 Beneficiary 111(25.40) 239(54.69) 87(19.91) 437(100)
2 Non-Beneficiary 42 (15.97) 166(16.12) 55(20.91) 263(100)
Total 153 405 142 700
Sources: Primary Data
Note: Figures in Parenthesis Denote Percentage
It could be seen from Table 30 that majority of the policy loan beneficiaries are having better attitude than that of non-loan
beneficiaries towards the services provided by the LIC of India. Out of 437 policy loan beneficiary respondents, 239 respondents
(54.69 percent) have medium level of attitude and 87 (19.91 percent) have high level of attitude. In the case of non-beneficiaries
of policy loan, out of 263 respondents, 166 (16.12 percent) have medium level of attitude and 55 respondents (20.91 percent) have
high level of attitude towards the services offered by the LIC of India.
Influence of Advertisement
Today advertisement is the strongest weapon used by almost all the organizations in the world to boost the sale of their products
and services. The LIC is also frequently advertising its attractive products through Press, TV and other means of advertisement.
Severe competition from the private insurers is also a challenge faced by the LIC. The policyholders, who have greater exposure
to the LIC advertisement, are much influenced, which make them develop a favourable attitude towards the LIC and its services.
Hence, it is imperative to study the influence of advertisements by the LIC of India on the level of attitude of the respondent
Volume 4, Number 3, July – September’ 2015
ISSN (Print):2279-0977, (Online):2279-0985
PEZZOTTAITE JOURNALS SJIF (2012): 3.23, SJIF (2013): 5.057, SJIF (2014): 5.871
International Journal of Applied Services Marketing Perspectives© Pezzottaite Journals. 1719 |P a g e
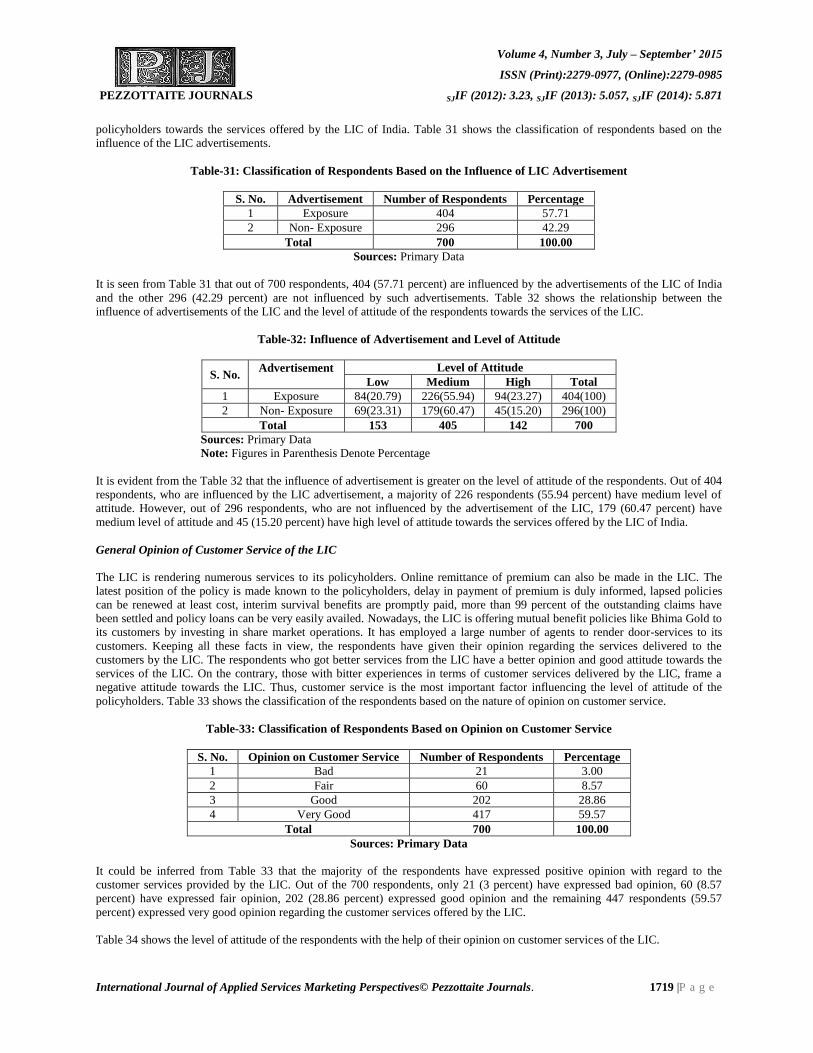
policyholders towards the services offered by the LIC of India. Table 31 shows the classification of respondents based on the
influence of the LIC advertisements.
Table-31: Classification of Respondents Based on the Influence of LIC Advertisement
S. No. Advertisement Number of Respondents Percentage
1 Exposure 404 57.71
2 Non- Exposure 296 42.29
Total 700 100.00
Sources: Primary Data
It is seen from Table 31 that out of 700 respondents, 404 (57.71 percent) are influenced by the advertisements of the LIC of India
and the other 296 (42.29 percent) are not influenced by such advertisements. Table 32 shows the relationship between the
influence of advertisements of the LIC and the level of attitude of the respondents towards the services of the LIC.
Table-32: Influence of Advertisement and Level of Attitude
S. No. Advertisement
Level of Attitude
Low Medium High Total
1 Exposure 84(20.79) 226(55.94) 94(23.27) 404(100)
2 Non- Exposure 69(23.31) 179(60.47) 45(15.20) 296(100)
Total 153 405 142 700
Sources: Primary Data
Note: Figures in Parenthesis Denote Percentage
It is evident from the Table 32 that the influence of advertisement is greater on the level of attitude of the respondents. Out of 404
respondents, who are influenced by the LIC advertisement, a majority of 226 respondents (55.94 percent) have medium level of
attitude. However, out of 296 respondents, who are not influenced by the advertisement of the LIC, 179 (60.47 percent) have
medium level of attitude and 45 (15.20 percent) have high level of attitude towards the services offered by the LIC of India.
General Opinion of Customer Service of the LIC
The LIC is rendering numerous services to its policyholders. Online remittance of premium can also be made in the LIC. The
latest position of the policy is made known to the policyholders, delay in payment of premium is duly informed, lapsed policies
can be renewed at least cost, interim survival benefits are promptly paid, more than 99 percent of the outstanding claims have
been settled and policy loans can be very easily availed. Nowadays, the LIC is offering mutual benefit policies like Bhima Gold to
its customers by investing in share market operations. It has employed a large number of agents to render door-services to its
customers. Keeping all these facts in view, the respondents have given their opinion regarding the services delivered to the
customers by the LIC. The respondents who got better services from the LIC have a better opinion and good attitude towards the
services of the LIC. On the contrary, those with bitter experiences in terms of customer services delivered by the LIC, frame a
negative attitude towards the LIC. Thus, customer service is the most important factor influencing the level of attitude of the
policyholders. Table 33 shows the classification of the respondents based on the nature of opinion on customer service.
Table-33: Classification of Respondents Based on Opinion on Customer Service
S. No. Opinion on Customer Service Number of Respondents Percentage
1 Bad 21 3.00
2 Fair 60 8.57
3 Good 202 28.86
4 Very Good 417 59.57
Total 700 100.00
Sources: Primary Data
It could be inferred from Table 33 that the majority of the respondents have expressed positive opinion with regard to the
customer services provided by the LIC. Out of the 700 respondents, only 21 (3 percent) have expressed bad opinion, 60 (8.57
percent) have expressed fair opinion, 202 (28.86 percent) expressed good opinion and the remaining 447 respondents (59.57
percent) expressed very good opinion regarding the customer services offered by the LIC.
Table 34 shows the level of attitude of the respondents with the help of their opinion on customer services of the LIC.
Volume 4, Number 3, July – September’ 2015
ISSN (Print):2279-0977, (Online):2279-0985
PEZZOTTAITE JOURNALS SJIF (2012): 3.23, SJIF (2013): 5.057, SJIF (2014): 5.871
International Journal of Applied Services Marketing Perspectives© Pezzottaite Journals. 1720 |P a g e
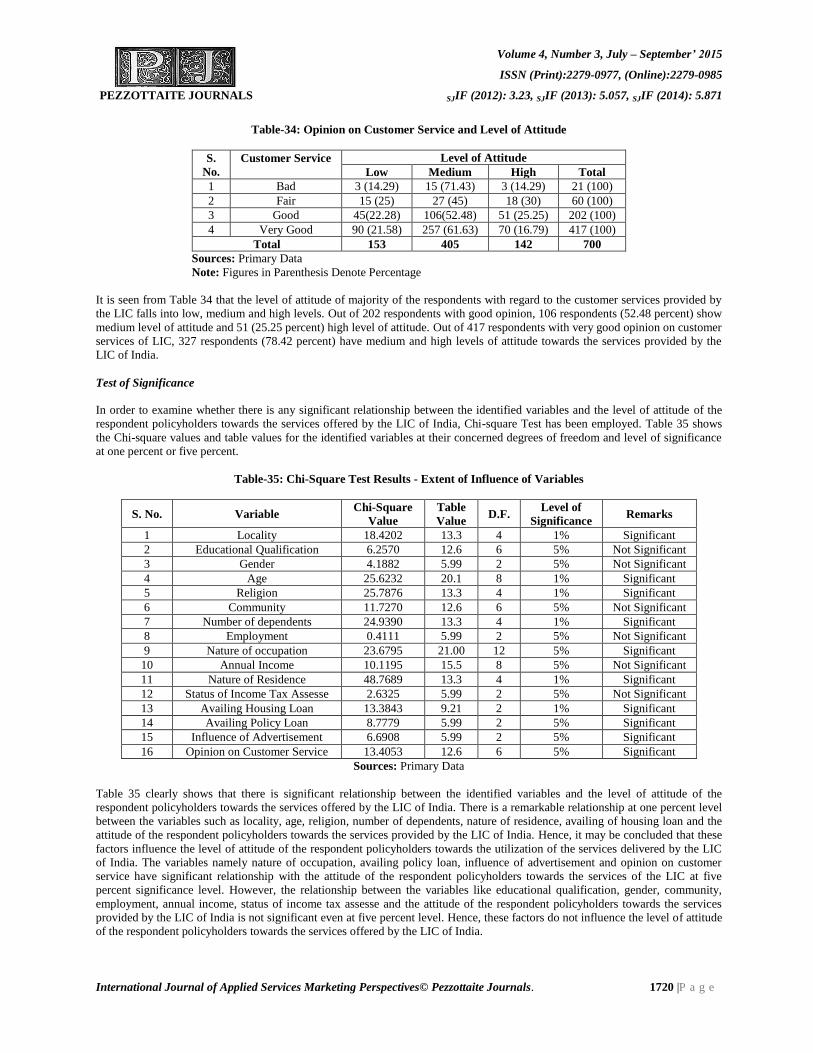
Table-34: Opinion on Customer Service and Level of Attitude
S.
No.
Customer Service
Level of Attitude
Low Medium High Total
1 Bad 3 (14.29) 15 (71.43) 3 (14.29) 21 (100)
2 Fair 15 (25) 27 (45) 18 (30) 60 (100)
3 Good 45(22.28) 106(52.48) 51 (25.25) 202 (100)
4 Very Good 90 (21.58) 257 (61.63) 70 (16.79) 417 (100)
Total 153 405 142 700
Sources: Primary Data
Note: Figures in Parenthesis Denote Percentage
It is seen from Table 34 that the level of attitude of majority of the respondents with regard to the customer services provided by
the LIC falls into low, medium and high levels. Out of 202 respondents with good opinion, 106 respondents (52.48 percent) show
medium level of attitude and 51 (25.25 percent) high level of attitude. Out of 417 respondents with very good opinion on customer
services of LIC, 327 respondents (78.42 percent) have medium and high levels of attitude towards the services provided by the
LIC of India.
Test of Significance
In order to examine whether there is any significant relationship between the identified variables and the level of attitude of the
respondent policyholders towards the services offered by the LIC of India, Chi-square Test has been employed. Table 35 shows
the Chi-square values and table values for the identified variables at their concerned degrees of freedom and level of significance
at one percent or five percent.
Table-35: Chi-Square Test Results - Extent of Influence of Variables
S. No. Variable Chi-Square
Value
Table
Value D.F.
Level of
Significance Remarks
1 Locality 18.4202 13.3 4 1% Significant
2 Educational Qualification 6.2570 12.6 6 5% Not Significant
3 Gender 4.1882 5.99 2 5% Not Significant
4 Age 25.6232 20.1 8 1% Significant
5 Religion 25.7876 13.3 4 1% Significant
6 Community 11.7270 12.6 6 5% Not Significant
7 Number of dependents 24.9390 13.3 4 1% Significant
8 Employment 0.4111 5.99 2 5% Not Significant
9 Nature of occupation 23.6795 21.00 12 5% Significant
10 Annual Income 10.1195 15.5 8 5% Not Significant
11 Nature of Residence 48.7689 13.3 4 1% Significant
12 Status of Income Tax Assesse 2.6325 5.99 2 5% Not Significant
13 Availing Housing Loan 13.3843 9.21 2 1% Significant
14 Availing Policy Loan 8.7779 5.99 2 5% Significant
15 Influence of Advertisement 6.6908 5.99 2 5% Significant
16 Opinion on Customer Service 13.4053 12.6 6 5% Significant
Sources: Primary Data
Table 35 clearly shows that there is significant relationship between the identified variables and the level of attitude of the
respondent policyholders towards the services offered by the LIC of India. There is a remarkable relationship at one percent level
between the variables such as locality, age, religion, number of dependents, nature of residence, availing of housing loan and the
attitude of the respondent policyholders towards the services provided by the LIC of India. Hence, it may be concluded that these
factors influence the level of attitude of the respondent policyholders towards the utilization of the services delivered by the LIC
of India. The variables namely nature of occupation, availing policy loan, influence of advertisement and opinion on customer
service have significant relationship with the attitude of the respondent policyholders towards the services of the LIC at five
percent significance level. However, the relationship between the variables like educational qualification, gender, community,
employment, annual income, status of income tax assesse and the attitude of the respondent policyholders towards the services
provided by the LIC of India is not significant even at five percent level. Hence, these factors do not influence the level of attitude
of the respondent policyholders towards the services offered by the LIC of India.
Volume 4, Number 3, July – September’ 2015
ISSN (Print):2279-0977, (Online):2279-0985
PEZZOTTAITE JOURNALS SJIF (2012): 3.23, SJIF (2013): 5.057, SJIF (2014): 5.871
International Journal of Applied Services Marketing Perspectives© Pezzottaite Journals. 1721 |P a g e
CONCLUSION
Customers want the services provided to them to be efficient (prompt and hassle-free) as they perceive life insurance as a guard
against the uncertainties of the future. Further, they demand flexible solutions and convertibility options related to investment
options and consequently they desire that the services should be personalized involving efficient handling of these changing
preferences. Customer will not settle for anything mediocre in the context of functional services because it is the major contributor
to their perception of quality and thereby satisfaction vis-à-vis insurance services. On the other hand, „satisfaction with the
insurance company‟ has much lower influence upon overall satisfaction. This might be attributed to the fact that in life insurance,
there is not much contact between the insurance companies and the policyholders. Quality improvements by management should
not just focus on improving customer satisfaction but also target on improving the customers‟ perception of service quality. In
other words, the service providers should try to continuously improve both service quality and customer satisfaction.
REFERENCES
1. Anderson, et.al. (1986). Thesis and Assignment Writing. New Delhi: Wiley Eastern Limited.
2. Bajpai, O. P. (1959). Elements of Life Insurance. Allahabad: Kitab Mahal.
3. Bala Chandran, S. (2007). Life Insurance. Mumbai: Insurance Institute of India.
4. Banerjee, B. N. (1994). Law of Insurance. Allahabad: The Law Book Company Private Limited.
5. Bhole, L. M. (1999). Financial Institutions and Markets. New Delhi: Tata Mc Graw Hill.
6. Bodla, B. S. (et al.). (2005). Insurance Fundamentals, Environment and Procedures. New Delhi: Deep and Deep
Publications.
7. Desai, G. R. (1973). Life Insurance in India - Its History and Dimensions of Growth. New Delhi: Macmillan India.
8. Etti, Baranoff. (2004). Risk Management and Insurance. New York: John Wileg and Sons.
9. Gopalakrishnan, G. (1994). Insurance Principle and Practice. New Delhi: Sterling Publishers.
10. Gurusamy, S. (2004). Financial Services and System. Chennai: Vijay Nicole Imprints Private Limited.
11. John, R. Ingrisano (et. al.). (1995). Insurance Dictionary. Delhi: S.Chand and Company.
12. Julia, Holyoake, & William, Weipers. (2002). Insurance. Delhi: AITBS Publishers and Distributors.
13. Kothari, N. S., & Bhal, P. (1990). Principle and Practice of Insurance. Agra: Sahitya Bhavan.
14. Kumar, & Dharmendra. (1991). The LIC Story. Bombay: Vakil and Sons.
15. Mathew, M. J. (2003). Insurance Principles and Practices. Jaipur: RBSA Publishers.
16. Mishra, M. N. (1991). LIC of India - A Study of Working and Performance. Agra: RSBA Publications.
17. Mishra, M. N. (1999). Insurance Principles and Practice. New Delhi: S. Chand & Company Limited.
18. Mishra, M. N. (2004). Modern Concepts of Insurance. New Delhi: S. Chand and Company Limited.
19. Palande. (et. al.). (2007). Insurance in India. New Delhi: Sage Publications.
20. Periasamy, P. (2003). Principles and Practice of Insurance. Mumbai: Himalaya Publishing House.
21. Ray, R. H. (1982). Life Insurance in India. New Delhi: Allied Publishers.
*****