Embed Size (px)
Citation preview
University of Kentucky University of Kentucky
UKnowledge UKnowledge
University of Kentucky Doctoral Dissertations Graduate School
2010
AN EMPIRICAL ANALYSIS OF REPUTATION EFFECTS AND AN EMPIRICAL ANALYSIS OF REPUTATION EFFECTS AND
NETWORK CENTRALITY IN A MULTI-AGENCY CONTEXT NETWORK CENTRALITY IN A MULTI-AGENCY CONTEXT
Emily Jane Plant University of Kentucky, [email protected]
Right click to open a feedback form in a new tab to let us know how this document benefits you. Right click to open a feedback form in a new tab to let us know how this document benefits you.
Recommended Citation Recommended Citation Plant, Emily Jane, "AN EMPIRICAL ANALYSIS OF REPUTATION EFFECTS AND NETWORK CENTRALITY IN A MULTI-AGENCY CONTEXT" (2010). University of Kentucky Doctoral Dissertations. 17. https://uknowledge.uky.edu/gradschool_diss/17
This Dissertation is brought to you for free and open access by the Graduate School at UKnowledge. It has been accepted for inclusion in University of Kentucky Doctoral Dissertations by an authorized administrator of UKnowledge. For more information, please contact [email protected].

ABSTRACT OF DISSERTATION
Emily Jane Plant
The Graduate School
University of Kentucky
2010
AN EMPIRICAL ANALYSIS OF REPUTATION EFFECTS AND NETWORK CENTRALITY IN A MULTI-AGENCY CONTEXT
ABSTRACT OF DISSERTATION
A dissertation submitted in partial fulfillment of the
requirements of the degree of Doctor of Philosophy in the College of Business and Economics
at the University of Kentucky
By
Emily Jane Plant
Lexington, Kentucky
Director: Dr. Robert Dahlstrom, Bloomfield Professor of Marketing
Lexington, KY
2010
Copyright © Emily Jane Plant 2010
ABSTRACT OF DISSERTATION
AN EMPIRICAL ANALYSIS OF REPUTATION EFFECTS AND NETWORK CENTRALITY IN A MULTI-AGENCY CONTEXT
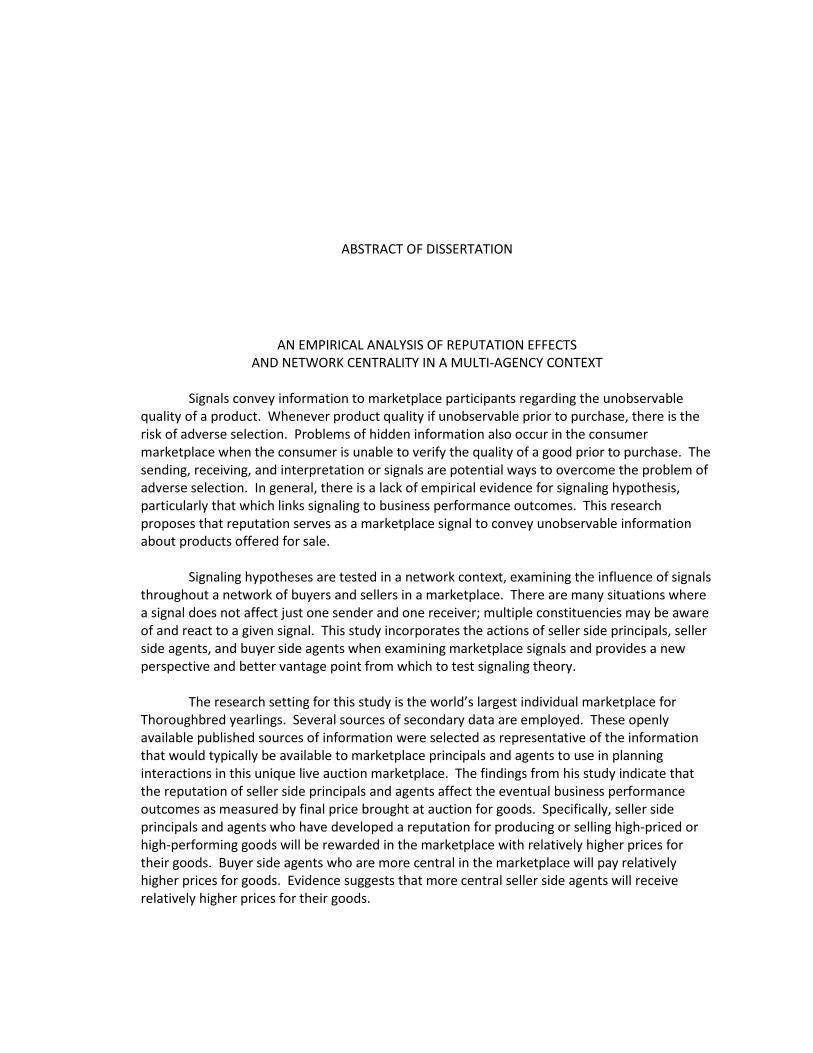
Signals convey information to marketplace participants regarding the unobservable
quality of a product. Whenever product quality if unobservable prior to purchase, there is the risk of adverse selection. Problems of hidden information also occur in the consumer marketplace when the consumer is unable to verify the quality of a good prior to purchase. The sending, receiving, and interpretation or signals are potential ways to overcome the problem of adverse selection. In general, there is a lack of empirical evidence for signaling hypothesis, particularly that which links signaling to business performance outcomes. This research proposes that reputation serves as a marketplace signal to convey unobservable information about products offered for sale.
Signaling hypotheses are tested in a network context, examining the influence of signals throughout a network of buyers and sellers in a marketplace. There are many situations where a signal does not affect just one sender and one receiver; multiple constituencies may be aware of and react to a given signal. This study incorporates the actions of seller side principals, seller side agents, and buyer side agents when examining marketplace signals and provides a new perspective and better vantage point from which to test signaling theory. The research setting for this study is the world’s largest individual marketplace for Thoroughbred yearlings. Several sources of secondary data are employed. These openly available published sources of information were selected as representative of the information that would typically be available to marketplace principals and agents to use in planning interactions in this unique live auction marketplace. The findings from his study indicate that the reputation of seller side principals and agents affect the eventual business performance outcomes as measured by final price brought at auction for goods. Specifically, seller side principals and agents who have developed a reputation for producing or selling high-priced or high-performing goods will be rewarded in the marketplace with relatively higher prices for their goods. Buyer side agents who are more central in the marketplace will pay relatively higher prices for goods. Evidence suggests that more central seller side agents will receive relatively higher prices for their goods.

KEYWORDS: Agency Theory, Signaling, Reputation, Auctions, Network Centrality
__Emily J. Plant________________________
Student’s Signature
__5/21/2010__________________________ Date

AN EMPIRICAL ANALYSIS OF REPUTATION EFFECTS AND NETWORK CENTRALITY IN A MULTI-AGENCY CONTEXT
By
Emily Jane Plant
____Dr. Robert F. Dahlstrom______________
Director of Dissertation
____Dr. Merl Hackbart___________________ Director of Graduate Studies
____5/21/2010_________________________
Date

RULES FOR THE USE OF DISSERTATIONS
Unpublished dissertations submitted for the Doctor's degree and deposited in the University of
Kentucky Library are as a rule open for inspection, but are to be used only with due regard to
the rights of the authors. Bibliographical references may be noted, but quotations or
summaries of parts may be published only with the permission of the author, and with the usual
scholarly acknowledgments.
Extensive copying or publication of the dissertation in whole or in part also requires the consent
of the Dean of the Graduate School of the University of Kentucky.
A library that borrows this dissertation for use by its patrons is expected to secure the signature
of each user.
Name Date
______________________________________________________________________________
______________________________________________________________________________
______________________________________________________________________________
______________________________________________________________________________
______________________________________________________________________________
______________________________________________________________________________
______________________________________________________________________________
______________________________________________________________________________
______________________________________________________________________________
______________________________________________________________________________

DISSERTATION
Emily Jane Plant
The Graduate School
University of Kentucky
2010

AN EMPIRICAL ANALYSIS OF REPUTATION EFFECTS AND NETWORK CENTRALITY IN A MULTI-AGENCY CONTEXT
DISSERTATION
A dissertation submitted in partial fulfillment of the
requirements of the degree of Doctor of Philosophy in the College of Business and Economics
at the University of Kentucky
By
Emily Jane Plant
Lexington, Kentucky
Director: Dr. Robert Dahlstrom, Bloomfield Professor of Marketing
Lexington, KY
2010
Copyright © Emily Jane Plant 2010

For everyone who believed in me.

iii
TABLE OF CONTENTS LIST OF TABLES ............................................................................................................................... vii
LIST OF FIGURES ............................................................................................................................ viii
CHAPTER ONE: ................................................................................................................................. 1
INTRODUCTION ................................................................................................................................ 1
Background .................................................................................................................................. 1
Research Gap ............................................................................................................................... 4
Research Approach/Methodology .............................................................................................. 4
Proposed Study ............................................................................................................................ 5
Research Findings ........................................................................................................................ 6
Contribution to Practice .............................................................................................................. 6
Contribution to Theory ................................................................................................................ 7
Limitations ................................................................................................................................... 8
Overview .................................................................................................................................... 10
CHAPTER TWO: .............................................................................................................................. 11
LITERATURE REVIEW ...................................................................................................................... 11
Introduction ............................................................................................................................... 11
Agency Theory ........................................................................................................................... 11
The Problem of Hidden Action .............................................................................................. 11
Overcoming the Problem of Hidden Action ...................................................................... 12
Problem of Hidden Information ............................................................................................ 15
Overcoming the Problem of Hidden Information .............................................................. 15
Gap in literature ..................................................................................................................... 17
Signaling ..................................................................................................................................... 18
Default-Independent Signals ............................................................................................. 20
Default-Contingent Signals ................................................................................................ 23
Signaling- Business to Business .............................................................................................. 25
Gap in Literature .................................................................................................................... 26
Signaling in Other Contexts: Finance and Economics ................................................................ 27
Market Statistics as Signals .................................................................................................... 27
Companies’ Role in Signaling ............................................................................................. 28
Third Parties’ Role in Signaling .......................................................................................... 29
Signaling at Auction ................................................................................................................... 30
Role of Other Market Participants in Signaling at Auction .................................................... 31
Role of Sellers in Signaling at Auction.................................................................................... 32

iv
Gap in Literature .................................................................................................................... 33
Social Networks ......................................................................................................................... 34
Social Networks Perspective on the Marketplace ................................................................. 34
Centrality ........................................................................................................................... 36
Networks Studies in Marketing ............................................................................................. 37
Consumers ......................................................................................................................... 38
Organizations ..................................................................................................................... 40
Distribution Channels ........................................................................................................ 43
Gap in the Literature .............................................................................................................. 46
Thoroughbred Pricing Studies ................................................................................................... 47
Gap in the Literature .............................................................................................................. 55
Chapter Summary .................................................................................................................. 55
CHAPTER THREE: ............................................................................................................................ 56
RESEARCH MODEL AND HYPOTHESES ........................................................................................... 56
Introduction ............................................................................................................................... 56
Qualitative Approach ................................................................................................................. 56
Qualitative Findings ........................................................................................................... 57
Model of Marketplace Signaling ................................................................................................ 60
Research Model ......................................................................................................................... 65
Control Variables ....................................................................................................................... 73
Item Specific Quality Variables .............................................................................................. 73
Chapter Summary ...................................................................................................................... 74
CHAPTER FOUR: ............................................................................................................................. 75
RESEARCH METHODOLOGY ........................................................................................................... 75
Introduction ............................................................................................................................... 75
Research Setting ........................................................................................................................ 75
Research Design ......................................................................................................................... 79
Sampling Procedures ............................................................................................................. 79
Data Collection................................................................................................................... 79
Measurement of Research Variables......................................................................................... 82
Reputation ............................................................................................................................. 82
Price Reputation ................................................................................................................ 84
Performance Reputation ................................................................................................... 84
Centrality ............................................................................................................................... 86
Control Variables ................................................................................................................... 86
Thoroughbred Variables .................................................................................................... 86
v
Measurement Validity ............................................................................................................... 87
Analytical Procedures ................................................................................................................ 90
Data Analysis .......................................................................................................................... 90
Multiple Regression Analysis ............................................................................................. 90
Chapter Summary ...................................................................................................................... 92
CHAPTER FIVE: ............................................................................................................................... 93
RESULTS ......................................................................................................................................... 93
Introduction ............................................................................................................................... 93
Sample ....................................................................................................................................... 93
Data Preparation ....................................................................................................................... 93
Assumptions .............................................................................................................................. 95
Descriptive Statistics for Focal Research Variables ................................................................... 96
Reputation ............................................................................................................................. 96
Performance Reputation ................................................................................................... 96
Price Reputation ................................................................................................................ 97
Centrality ............................................................................................................................... 98
Seller Side Agent ................................................................................................................ 99
Buyer Side Agent ................................................................................................................ 99
Descriptive Statistics for Control Variables ............................................................................... 99
Sire ......................................................................................................................................... 99
Dam ........................................................................................................................................ 99
Siblings ................................................................................................................................. 100
Model Development ................................................................................................................ 103
Hypothesis Testing ................................................................................................................... 104
Summary of Hypothesis Testing .............................................................................................. 105
Post Hoc Analyses ................................................................................................................ 106
Chapter Summary .................................................................................................................... 107
CHAPTER 6: .................................................................................................................................. 111
DISCUSSION ................................................................................................................................. 111
Introduction ............................................................................................................................. 111
Theoretical implications .......................................................................................................... 111
Signaling ............................................................................................................................... 111
Social Networks in Marketing .............................................................................................. 112
Managerial implications .......................................................................................................... 113
Limitations and Future Research ............................................................................................. 113
Conclusion ............................................................................................................................... 115

vi
REFERENCES ................................................................................................................................. 116
VITA .............................................................................................................................................. 131

vii
LIST OF TABLES Table 2.1, Typology of Marketing Signals ...................................................................................... 20
Table 2.2, Summary of Yearling Pricing Studies ............................................................................ 52
Table 3.1, Table of Hypotheses...................................................................................................... 73
Table 4.1, Table of Measures ......................................................................................................... 87
Table 5.1, Variables ........................................................................................................................ 95
Table 5.2, Descriptive Statistics for Reputation Variables ............................................................. 98
Table 5.3, Descriptive Statistics for Centrality Variables ............................................................... 99
Table 5.4, Descriptive Statistics for Control Variables ................................................................. 100
Table 5.5, Correlations ................................................................................................................. 101
Table 5.6, Independent Variables Individually Regressed on Dependent Variable (PRICE) ........ 102
Table 5.7, Model Summary .......................................................................................................... 103
Table 5.8, Regression Results ...................................................................................................... 104
Table 5.9, Results of Marketplace Model .................................................................................... 105
Table 5.10, Summary of Hypothesis Testing Results ................................................................... 106
Table 5.11, Post Hoc Analysis Regression Results ....................................................................... 107
viii
LIST OF FIGURES Figure 3.1, Model of Marketplace Signaling .................................................................................. 62
Figure 3.2, Research Model ........................................................................................................... 66
Figure 4.1, Yearling consignor supervising inspection of horses ................................................... 76
Figure 4.2, Bloodstock agent inspecting yearling .......................................................................... 77
Figure 4.3, Veterinarians taking radiographs of yearling’s legs ..................................................... 78
Figure 4.4, Sample Keeneland Catalog Page ................................................................................. 81
Figure 4.5, Sample Thoroughbred Times Buyer’s Guide ............................................................... 82
Figure 5.1, Sample published media with ranking of leading seller side agents by average price ...
..................................................................................................................................................... 108
Figure 5.2, Sample published media- seller side agent promoting number of sakes winners .... 109
Figure 5.3, Sample published media- seller side agent promoting number of stakes winners .. 110
1
CHAPTER ONE: INTRODUCTION
At the Keeneland September Thoroughbred Yearling sale, hundreds of buyers convene
on the sales grounds hoping to find a special yearling that can go on to become a great
racehorse. Buyers have limited information, but must decide among thousands of potential
race horses brought to market. Fortunately, sellers and other buyers, along with their agents,
offer multiple signals to indicate their belief of each horse’s potential.
This research will examine the manner by which sellers, buyers, and their third-party
agents signal to the marketplace regarding their opinions of which horses for sale offer the
highest potential.
Background
Signaling is a successful method marketers use to overcome the problem of information
asymmetry in a marketplace. Information asymmetry occurs when a buyer in a marketplace
lacks necessary information to determine the quality of a product offered for sale (Williamson
1985). Some examples of signaling include advertising, brand names, reputation, coupons, high
price, warranties, and money-back guarantee (Kirmani and Rao 2000).
General support has been found for signaling predictions for both low-price consumer
goods and consumer durables, but there is limited knowledge of signaling in markets with
variable prices and multiple parties to transactions. Questions to be explored in this research
project include:
• How do market participants use signals to indicate unobservable quality in a market
where goods are not offered at a fixed price? Most literature on signaling considers
only fixed price consumer goods. There are many examples of where goods are not
sold at a fixed price. Consider for example any good that is sold at auction, the stock
market, the market for real-estate, and markets for commodities such as agricultural
goods and natural resources.
• What is the influence of third-party agents in this marketplace (for variable price
goods)? The vast majority of marketing literature considers marketplace transactions
between two parties only. Employing network logic to study this problem allows for a
contrasting vantage point and a new perspective of the problem. In situations where
2
the buyer and seller in a transaction never meet, one must consider the network in
which the transaction takes place.
Importance of Research
There are many situations where goods are not offered for sale at a fixed price.
Consider any market where goods are offered for auction, including the markets for wine, art,
classic cars, and the increasingly widespread use of internet auctions. Houses and used cars are
generally offered at non-fixed prices. Sellers wish to obtain the highest possible price for their
goods, while buyers want to pay fair prices. Signals can be used by both buyer and seller to
indicate their value of the product offered.
When neither seller nor buyer are able to assess the true quality of a product prior to
purchase, it is difficult to assess whether consumers have made satisfactory transactions. From
the buyer’s point of view, it may have paid a higher-than or lower-than fair price for their good,
but it will not be aware of the fairness until it has fully experienced the good. Signaling
literature assumes that the sellers will experience negative repercussions if they offer low-
quality goods for sale at high-quality prices, but how does this dynamic change if even the seller
is not aware of the true quality prior to selling the good?
Most marketplaces do not involve situations where one seller is transacting with one
buyer without any other parties involved. By considering the marketplace beyond the singular
dyad of sellerbuyer, this research will contribute to a more complete understanding of how
signals operate in marketing channels. The influence and actions of third-party agents- i.e.,
consignors, bloodstock agents, and veterinarians- will be considered in the signaling model of
this marketplace.
This research will use secondary data from a marketplace where producers’ goods are
sold through the channel of distribution via multiple sellers. Hypotheses will be developed
which can empirically examine economic logic underlying signaling. The theoretical model
represents an important contribution, linking marketing hypotheses with business performance
outcomes (Lehmann 2004).
Theoretical Base for Research
Agency relationships are widespread in marketing. An agency relationship is present
when one party (known as the principal) is dependent on another party (known as the agent) to
complete some task on behalf of the principal. Whenever a principal contracts with an agent

3
with the goal of achieving some outcome, problems may arise (Eisenhardt 1989). Within this
agency problem, there is the problem of adverse selection. Adverse selection, also known as
the problem of hidden information, occurs pre-contractually when the principal is unable to
verify ahead of time that the agent actually has the skills and qualities that they desire.
This research will focus on the problem of hidden information, as this is the relevant
problem when buyers and sellers are contracting in a marketplace to buy and sell goods. In the
marketplace studied here, there are several groups of principals and agents. Briefly, there are
buyer-side and seller-side principals and agents. On the seller side, the principals are the
producers of the Thoroughbred, the people who breed the horses. Their agent is the consignor,
a person who consigns the yearlings for sale at the Keeneland September Yearling sale. On the
buyer side, the principals are the buyers who wish to purchase yearlings at the Keeneland
auction. They enlist agents including veterinarians to assess the health and soundness of the
animal and bloodstock agents to make an expert judgment on the suitability and athletic
potential of the Thoroughbred yearlings under consideration.
The Problem of Hidden Information
Whenever there is incomplete information, there is the potential for agency problems.
Adverse selection is used to describe the absence of information before a decision is made. This
lack of information could lead to an adverse, or less than ideal, decision (Eisenhardt 1989). One
such example is when the principal cannot verify the agent’s skills or abilities at the time of
hiring. The agents may interview very well and claim that they have the needed skills to be a
top performer, but it is very difficult or even impossible for the principal to verify in advance
that the candidates will actually perform up to expectations. Problems of hidden information
also occur in the consumer marketplace where the consumer is unable to verify the quality of a
good before purchase (Akerlof 1970; Eisenhardt 1989). Consumers may use information in the
marketplace to help overcome this problem of adverse selection (Akerlof 1970). Adverse
selection occurs when the consumers purchase goods which do not meet their needs.
Signaling to Overcome the Problem of Adverse Selection
A marketing signal is a marketing activity which provides information beyond the
activity itself and reveals insights into the unobservable, such as the intention, motives, goals, or
internal situation (Porter 1980; Herbig and Milewicz 1996). One focus of signaling in the
4
marketing literature has been to explain how one party can communicate to another about
unobservable product quality and help to overcome the problem of adverse selection.
Signals are actions that parties can take to reveal their true qualities. Quality signals can
be transmitted in many forms, including brand name, price, warranties, and advertising
expenditure (Kirmani and Rao 2000). Signaling considers a rational consumer who expects a
firm to honor the implicit commitment expressed through a signal. Not honoring the
commitment is economically unwise, as firms who cheat and offer a low-quality product at a
high-quality price will be penalized in the marketplace by a lack of repeat purchases (Rao, Lu et
al. 1999).
Research Gap
Agency literature focuses almost entirely on dyadic relationships, finding the best
contract to govern a relationship between a principal and their agent. This perspective leaves
questions regarding relationships that take place beyond a dyadic level. While there are a
limited number of studies to consider agency beyond the dyadic level (e.g., Anderson,
Hakansson et al. 1994; Mishra, Heide et al. 1998; Antia and Frazier 2001; Rindfleisch and
Moorman 2001; Dahlstrom and Ingram 2003; Wathne and Heide 2004), the marketing research
to consider signaling in a network context is even more limited. Considering that it is quite
difficult to pinpoint circumstances where signaling takes place exclusively within a dyad,
examining signaling in the context of a network of marketplace participants will shed light on
how these signals are sent, received, and interpreted within a network. In more general terms,
there is a lack of empirical evidence linking signaling to business performance outcomes.
Research Approach/Methodology
This research will use a variety of different approaches to examine this marketplace. In
the largest single marketplace in the world for the good (Keeneland Association 2009), buyers
and sellers come together at a single location where over $327 million of goods are bought and
sold in a three-week period. This design effectively controls for time, location, and economic
conditions, as all goods are transacted within the same time frame, in the same location, and
with the same facilities available to all sellers.
A combination of qualitative and quantitative approaches will be used. Qualitative
approaches include: interviews with marketplace participants to get a preliminary perspective
on the important issues in the marketplace; extensive observation of the process of buying and
5
selling in the marketplace; and integration into the marketplace as a participant by working
during a product sale. This integration into the marketplace in question allows the researcher
to get a unique insider’s perspective into the market. Secondary data of the economic results of
the marketplace sales will be used to link signaling hypotheses to business performance
outcomes.
Proposed Study
To address this gap, the current research proposes and examines empirically a research
model of marketplace effects of third-party agents on business performance outcomes.
Hypotheses examine the signaling actions of these agents and how they affect the final dollar
value brought for the product at auction. In this marketplace, the quality of the good is not
observable prior to purchase, so marketplace participants must use signals to determine the
quality of the goods offered for sale. The reputational effects of the marketplace participants
are studied along with the physical actions they undertake. Reputation is developed by fulfilling
signaling promises over time (Herbig and Milewicz 1994; Herbig and Milewicz 1994; Herbig and
Milewicz 1996). The marketplace is a social process where participants look to the actions of
others to determine what actions they should subsequently take (e.g., White 1981; White 1981;
Granovetter 1985; Podolny 1993). The participants are constantly observing the actions of
others, so network position variables are included to examine the effect that these positions
may have on the marketplace participants’ performance outcomes. Participants with higher
levels of measured centrality should have access to and control over more information
(Freeman 1978/79; Wasserman and Faust 1994) and should subsequently be able to leverage
this information advantage to their own benefit. There are considerable questions to be
answered regarding the bottom line effect that network properties may have on a business’s
balance sheet.
This study will utilize a combination of qualitative and quantitative data. At present,
there are a total of 31 depth interviews with industry participants, 186 hours of participant
observation, and 156 hours spent in the field as a participant in a sale. Approximately 1,000
pictures and 20 hours of video have been captured for study. Data from 3,605 individual
transactions were cataloged for quantitative analysis. Variables relating to the reputation and
centrality of marketplace participants including seller side principals, seller side agents, and
buyer side agents were collected from a variety of published sources.
6
Research Findings
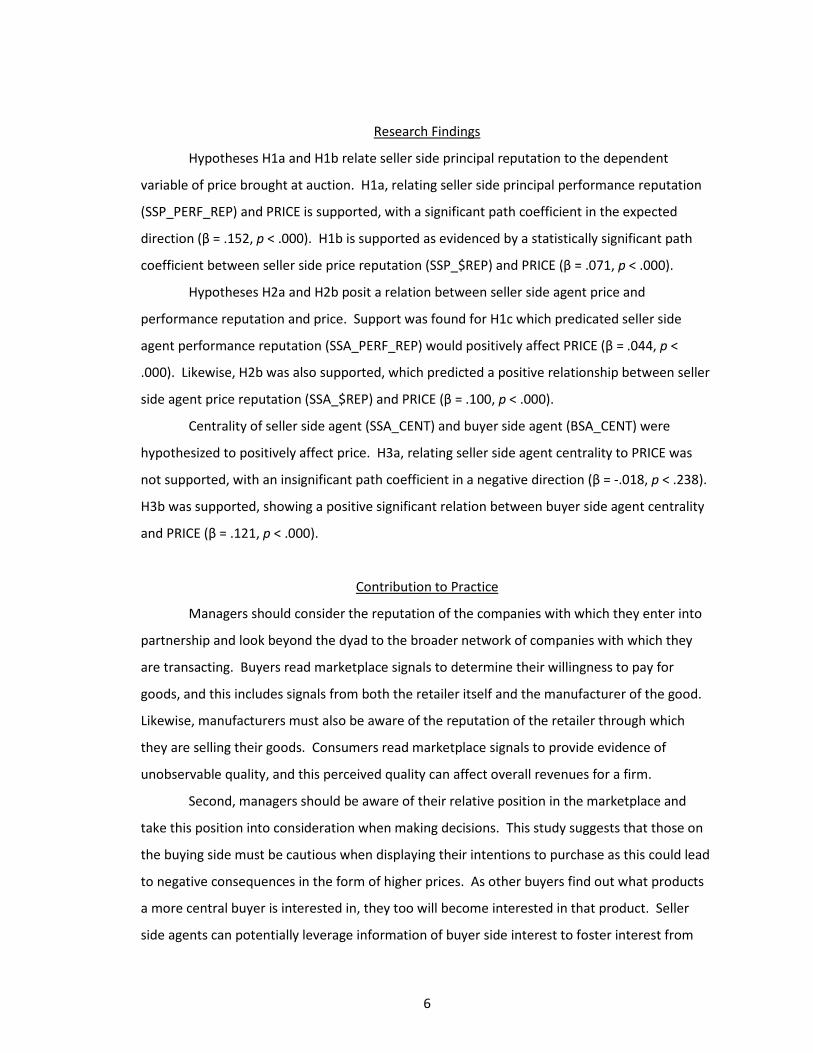
Hypotheses H1a and H1b relate seller side principal reputation to the dependent
variable of price brought at auction. H1a, relating seller side principal performance reputation
(SSP_PERF_REP) and PRICE is supported, with a significant path coefficient in the expected
direction (β = .152, p < .000). H1b is supported as evidenced by a statistically significant path
coefficient between seller side price reputation (SSP_$REP) and PRICE (β = .071, p < .000).
Hypotheses H2a and H2b posit a relation between seller side agent price and
performance reputation and price. Support was found for H1c which predicated seller side
agent performance reputation (SSA_PERF_REP) would positively affect PRICE (β = .044, p <
.000). Likewise, H2b was also supported, which predicted a positive relationship between seller
side agent price reputation (SSA_$REP) and PRICE (β = .100, p < .000).
Centrality of seller side agent (SSA_CENT) and buyer side agent (BSA_CENT) were
hypothesized to positively affect price. H3a, relating seller side agent centrality to PRICE was
not supported, with an insignificant path coefficient in a negative direction (β = -.018, p < .238).
H3b was supported, showing a positive significant relation between buyer side agent centrality
and PRICE (β = .121, p < .000).
Contribution to Practice
Managers should consider the reputation of the companies with which they enter into
partnership and look beyond the dyad to the broader network of companies with which they
are transacting. Buyers read marketplace signals to determine their willingness to pay for
goods, and this includes signals from both the retailer itself and the manufacturer of the good.
Likewise, manufacturers must also be aware of the reputation of the retailer through which
they are selling their goods. Consumers read marketplace signals to provide evidence of
unobservable quality, and this perceived quality can affect overall revenues for a firm.
Second, managers should be aware of their relative position in the marketplace and
take this position into consideration when making decisions. This study suggests that those on
the buying side must be cautious when displaying their intentions to purchase as this could lead
to negative consequences in the form of higher prices. As other buyers find out what products
a more central buyer is interested in, they too will become interested in that product. Seller
side agents can potentially leverage information of buyer side interest to foster interest from
7
other participants on the buyer side. Competition when attempting to make a purchase can
drive up prices as more people compete for the same resource.
Contribution to Theory
This research provides empirical evidence for signaling hypotheses, demonstrating that
reputation serves as a marketplace signal to convey unobservable information about products
offered for sale. Buyers in a marketplace look to the price and performance reputation of seller
side principals and agents for signals to indicate which products are most desirable. Those
seller side principals and agents who can send credible signals will be rewarded in the
marketplace with higher prices for their goods.
Evidence indicates that participants on the buyer side of the marketplace will look to
the reputation of both the seller (seller side agent) and manufacturer (seller side principal) of
the good. Seller side principals who have a reputation for producing products with a higher
average price and seller side agents who have a reputation for selling products with a higher
average price are both associated with higher prices brought at auction. Seller side agent
reputation for selling high performing goods also shows a positive association with price. This
supports previous findings that reputation is seen by consumers as a signal of product quality,
and that manufacturers can signal product quality by selling through a reputable retailer (e.g.,
Chu and Chu 1994; Dawar and Parker 1994).
This research examines signaling beyond the dyad, examining the influence of signals
throughout the entire network of buyers and sellers in the marketplace. There are many
situations where a signal does not affect just one sender and one receiver; multiple
constituencies may be aware of and react to a given signal. A limited number of studies have
considered agency relationships beyond the dyadic level (e.g., Anderson, Hakansson et al. 1994;
Rindfleisch and Moorman 2001; Dahlstrom and Ingram 2003). This study incorporates the
actions of seller side principals, seller side agents, and buyer side agents when examining the
marketplace signals and provides a new perspective and better vantage point from which to
test signaling theory. In a marketplace where buyer and seller do not actually meet, it is
impossible to hypothesize about their relationship without considering it in a network context.
A key tenent of this network approach is that it allows for the testing of the effect of
network positioning on business performance outcomes. Markets are a social process where
observation of the actions of other participants is critical in determining interest. More
interested parties indicates that a product carries a higher valuation (Rothkopf 1969). The seller

8
side agent is posited to use their position in the marketplace to gather and utilize information
about buyer side interest in order to obtain the highest possible price for their goods. These
agents can look to records of past marketplaces to determine the past behavior of the buyer
side participants and infer possible future behavior (Milgrom 1981; Ashenfelter 1989). In
addition, buyer side agents look to the actions of others to determine what actions they should
take (White 1981; White 1981; Granovetter 1985; Podolny 1993). Those buyer side agents that
are more central will have more access to information and will be more visible in the
marketplace. They will be conducting many transactions with many different parties, and their
actions will serve as a visible signal to the other agents. Buyer side agents will use the bidding
action of others in consideration of their willingness to pay for a good. More bidders willing to
bid more money indicates positive information regarding the quality of the good (Milgrom and
Weber 1982). The more central buyer side agents are more active and prominent in the
marketplace, and their actions will thus be the most visible. Likewise, seller side agents will be
more aware of the actions of these more central buyer side agents and can use information
regarding which products they are interested in to possibly foster interest from other buyer side
agents. This theory is supported in this research as buyer side agents with relatively higher
centrality measures are associated with relatively higher prices paid for goods at auction.
Limitations
The limitations of this research should be noted. First, this study is limited in data
available for constructing reputation variables. Reputation is established by fulfilling signaling
promises over time (Herbig and Milewicz 1994; Herbig and Milewicz 1996), which implies a
long-term measurement time frame. Ideally, long term measures tracing back multiple years
would be utilized for the study. However this information is limited by the fact that complete
information is not available prior to the year 2007. The researcher had to manually gather
much of the data, and so the data is limited to the year when the researcher began to collect
this data. Additionally, some information is not available through any published means, forcing
reliance on limited information contained in published sources. For example, data on principal
performance reputation was limited to the top 300 seller side principals for the year, limiting
the number of principals for which complete data is available. This presents an opportunity for
future research, as the researcher can continue to collect the relevant data moving forward
from 2007 and revisit the study hypotheses with more complete data.

9
Second, the data is limited by the hidden nature of some parties transacting in the
marketplace. The true identity of the buyer side principal is unknown, so the network is
calculated based on the seller side principal, the seller side agent, and the buyer side agent.
This is not entirely limiting as the buyer side agent is the entity actually transacting visibly in the
marketplace, so it is their actions and not the actions of the buyer side agent that will serve as
signals to the rest of the marketplace. Likewise, the data only records the network of
completed transactions. This does not capture other parties that were interested in an item or
who was actually involved in bidding- only the final details of who won the auction. Items
which were offered for sale but did not meet the minimum price for a sale (reserve not
attained) are also not included.
Finally, there is no way to control for the non-phenotypic qualities of the items offered
for sale. These are living creatures who are assessed for quality based not only on the variables
which can be quantified but also those that are impossible to measure. A product may be
comprised of expensive and highly desirable inputs, but if it is flawed in physical structure this
will affect the sale price. Controlling for these qualities is extremely difficult if not impossible.
Every marketplace participant has different guidelines for what physical traits they consider
desirable. Likewise, they all have different limitations on physical flaws that are undesirable.
Future research may attempt to control for these qualities by drawing on the researcher
experience in the marketplace to make expert judgment regarding the overall physical qualities
of the item in question.
Future research should employ samples from other auction marketplaces to assess if
these results are generalizable to other populations. Although this study uses the sample of the
largest marketplace in the world for this item so as to get a robust sample, other smaller
markets for this good may operate through different mechanisms. There are multiple other
marketplaces for this same good operating throughout the United States and abroad, and these
marketplaces could be tested for replication. Additionally, a sample could be drawn from a
similar open marketplace for another type of good.
Future research should also explore the unexpected results in this study. Seller side
principal price reputation did not have the expected positive relation with price brought at
auction. This finding could support previous research which posited an adverse selection
hypothesis for seller side principals in the marketplace. Chezum and Wimmer (1997; Chezum
and Wimmer 2000) demonstrated that the purpose a principal has for producing a good could
have an influence on price brought at auction. Specifically, those principals who bred

10
thoroughbreds to race received relatively lower prices for their yearlings. They predicted that
the breeders who also raced were perceived to keep the best stock for themselves and sell the
rest at auction. This adverse selection hypothesis was not supported in a later study by Vickner
and Koch (2001). This discrepant finding provides an opportunity for future research to revisit
this hypothesis.
Overview
Chapter two reviews agency theory, signaling, and social networks research in
marketing. The purpose of this chapter is to synthesize these research streams and identify
avenues for future research. Chapter three develops a research model to address the
relationship between marketplace signaling phenomena and business performance outcomes.
Chapter four presents the research methodology—including the research setting, research
design, operationalization and measurement of research variables—employed to test the
proposed research model. Chapter five reports the research results. Chapter six outlines the
implications of the research findings and addresses future research directions, along with the
limitations of this study.
Copyright © Emily J. Plant 2010

11
CHAPTER TWO: LITERATURE REVIEW
Introduction
The purpose of this chapter is to synthesize agency theory, signaling, and social
networks research in marketing and to provide a basis for integrating these research streams.
This review is organized as follows: first, agency theory literature will be reviewed. Next,
signaling theory will be covered. This signaling review covers the following topics: signaling in
the marketing literature; signaling in other literatures outside of marketing including finance
and economics; and signaling at auction. Finally, literature covering social networks topics in
marketing will be surveyed.
Agency Theory
Agency relationships are widespread in marketing. An agency relationship is said to be
present whenever one party (known as the principal) is dependent on another party (known as
the agent) to complete some task on behalf of the principal (Eisenhardt 1989). While the most
widely recognized agency relationship is the employer-employee relationship, there are many
other examples of agency relationships. For example, the relationship between a retailer and
its customers is an agency relationship, as is the relationship between a firm and its advertising
agency or a franchiser and franchisee.
Whenever a principal contracts with an agent with the goal of achieving some outcome,
problems may arise. Cooperating parties (i.e. the principal and agent) are assumed to have
different attitudes towards risk and different goals and divisions of labor. There is the “problem
of risk sharing” and the “agency problem” (Eisenhardt 1989). The agency problem encompasses
the problem of adverse selection and the problem of moral hazard. Adverse selection, also
known as the problem of hidden information, occurs pre-contractually when the principal is
unable to verify ahead of time that agents actually have the desired skills and qualities. Moral
hazard, also known as the problem of hidden action, occurs post-contractually when the
principal is unable to evaluate the agent’s level of output relative to level of input.
The Problem of Hidden Action
The problem of hidden action, also known as moral hazard, occurs when the principal is
unable to evaluate exactly how good of a job the agent is doing. The principal must make a
12
decision regarding how it will compensate employees for the work they have performed. The
basic decision lies in the extent to which the agent will be paid with an outcome or behavior-
based control system (Eisenhardt 1985; Anderson and Oliver 1987; Eisenhardt 1989). At its
most basic level this is the decision between a salary (behavior) versus a commission (outcome)
pay structure. With an outcome-based control system, there is very little monitoring of action
or managerial direction for the agents. The principal uses objective measures of the agent’s
work output to evaluate performance. With a behavior-based control system, the principal
more closely monitors the agent and directs their activities. The agent is evaluated via less
objective means.
Agency theory attempts to find the best contract to govern a relationship, given certain
assumptions. These assumptions include those about: people, who are self-interest seeking,
have bounded rationality, and are risk averse; organizations, where there is goal conflict among
members; and information, which is a commodity that can be purchased (Eisenhardt 1989).
Basically, people and organizations are motivated and bounded by different goals and risk
tolerances. People will seek options that will deliver the best outcome for themselves- they are
motivated to undertake actions that will bring us benefit. People are also bounded in the fact
that there are limits upon the ability of humans to adapt to complex environments. People are
considered more risk averse than are organizations because they are unable to diversify their
employment whereas an organization is capable of diversifying their investments (Eisenhardt
1989). Organizations are assumed to have goal conflict among members when individuals with
different preferences must come together in a cooperative effort. If an organization wishes to
obtain more information they must be willing to purchase this commodity through investment
in time or resources to do so. These assumptions about people and organizations must be
considered any time a principal and agent contract in a relationship.
Overcoming the Problem of Hidden Action
Much of the literature on agency theory has been devoted to resolving the problem of
which type of contract to use between a principal and its agent. The decision between an
outcome or a behavior-based pay structure must consider the risk tolerance of the parties
involved (Eisenhardt 1989). Whenever there is an agency situation in which individuals or
groups are cooperating for some goal, those involved will have different attitudes towards risk.
These different attitudes can lead to different divisions of labor, based on individual risk
tolerance (Jensen and Meckling 1976).

13
If the agent is compensated via outcome-based means, it will be paid based on
verifiable output such as the dollar amount of sales contracts closed. On one hand, the agent is
incentivized to deliver more output so that it may make more money, but on the other hand, it
must accept more risk. The risk is inherent in the notion that its level of output is at least
partially dependent on external factors such as the quality of the product it is selling, the
amount of advertising done by the company, or even economic conditions. With a behavior-
based contract, the agent is evaluated based on their actual behavior, not on their verifiable
output. Behaviors monitored could include the number sales presentations given, aptitude, or
product knowledge (Anderson and Oliver 1987). This contracting option represents less risk to
agents, because their pay is dependent on the things they attempt to perform well, not on the
actual outcomes achieved. The agent is shielded from the risk of external factors influencing
their pay (Bergen, Dutta et al. 1992).
The risk tolerance of the principal must also be considered. If the agent is to be
compensated via an outcome-based contract, the principal assumes less risk because it will only
have to pay the agent for work outcomes actually achieved. If they compensate the agent
through behavior-based contact, they risk the problem of “shirking”, where the agents do not
put forth full effort because they know that their pay is not dependent on their performance
outcomes (Eisenhardt 1989).
There are some examples of empirical tests of agency propositions in recent literature
that focus on choices between the types of control systems firms may employ to govern
relationships. Murry and Heide (1998) study what affects retailer participation in manufacturer-
sponsored promotion programs. They look at both interpersonal relationships between the
boundary personnel in retailer and manufacturer firms, and also at organizational level
variables including incentive premiums and monitoring efforts. Support was found for the
hypothesis that the use of performance-based contracts provided an opportunity for self-
selection into relationships, in that fewer retailers chose to participate in promotions governed
by those types of contracts. Bloom and Milkovich (1998) study the relationship between risk,
incentive pay, and organizational performance. They find that firms facing higher risk will not
place more emphasis on incentive pay and that these firms that relied on incentive pay
performed more poorly than those firms that faced high risk who did not emphasize incentive
pay. These results are contrary to what agency theory risk-reward tradeoff would predict. On
the other hand, Krafft’s empirical study of sales force control systems (1999) found many
predictions based on agency theory including those based on the risk faced by the firm. Other

14
predictions supported by his tests included those based on the measurability of outcomes and
cost of that measurement as a determinant of control system, along with the measurability of
the sales force behavior, and the complexity of products. Ghosh and John (2000) find that the
basic agency theory prediction of incentive-insurance trade-off holds to some degree under
specific circumstances where risk-neutral principals deal with risk-averse agents whose actions
are non-verifiable. When a job involves a higher level of output uncertainty, principals tend to
use more salary weighted compensation plans, but Ghosh and John find no support beyond this.
Sarin and Mahajan (2001) follow this line of research and examine how the different options for
control systems (outcome versus behavior based) affect team performance as measured both
on internal (i.e. self-rated performance and team member satisfaction) and external (i.e. speed
to market, innovation, adherence to budget and schedule, product quality, and market
performance) dimensions. Overall, they found that when it is possible to evaluate performance
individually, it is better to use an outcome based control system. Heide (2003) looks specifically
at situations where there is plural governance which is the use of both internal and external
contracting for the same basic transaction. When firms choose to supplement external
contracting with an internal relationship they have an internal structure from which to monitor
the market-based governance.
Other empirical tests of the problem of hidden action focus not necessarily on choices
between different contracts, but more on how the mechanisms within the contracts may affect
the performance of those contracts. For example, one study found that both principals and
agents derive less benefit (as measured the level of conflict or harmony experienced and the
profit achieved) when they believe that the relationship is asymmetric in favor of the other
party (Ross, Anderson et al. 1997). Similar to the Ross et al. study (1997), Nygaard and
Dahlstrom (2002) studied agent relationships in firms involved in a horizontal alliance. When
boundary-spanning agents put forth effort into learning a new system, and discover the parts of
the control systems that favor the principal, they will experience higher levels of conflict in their
relationship with management, decreasing performance. This is just one example of role stress
boundary spanners may face- the study found overall role stress is a negative antecedent to
organizational outcomes (Nygaard and Dahlstrom 2002). Mishra, Heide, and Cort (1998)
conduct an analysis of the ways that agency problems can be resolved via different control
systems. Results support the idea that incentives including price premiums and compensation
can alleviate problems of hidden action. Joseph and Richardson (2002) provide further
evidence that compensation via managerial ownership may alleviate hidden action by aligning
15
managerial goals with those of the company. Jap and Anderson (2003) look at how different
types of relationship safeguards affect both exchange performance outcomes and also the
future expectations of that relationship. Relationship safeguards studied include bilateral
idiosyncratic investments, goal congruence, and interpersonal trust. The effectiveness of these
safeguards depends on the level of opportunism inherent in the relationship. When there are
relatively lower levels of opportunism, interpersonal trust positively impacts the relationship. In
higher levels of opportunism, goal congruence is a better safeguard than interpersonal trust. At
both high and low levels of opportunism bilateral idiosyncratic investments are an effective
relationship safeguard.
In a look at agency relationships beyond a dyadic perspective, Wathne and Heide (2004)
study how the governance structure that a firm chooses to employ with its upstream suppliers
may affect their downstream customer relationships. The firm’s ability to show flexibility
toward their customers is dependent on the governance mechanisms that are in place with
their suppliers, specifically the type of incentive structure they have in place.
Problem of Hidden Information
Whenever there is incomplete information, there is the problem of agency (Eisenhardt
1989). Adverse selection occurs when an adverse, or less than ideal, decision is made. One
such example is that the principal cannot verify the agents’ skills or abilities at the time of hiring.
The agent may interview very well and claim that it has the needed skills to be a top performer,
but it is very difficult or even impossible for the principal to verify in advance that the candidate
will actually perform up to expectations. Problems of hidden information also occur in the
consumer marketplace when the consumer is unable to verify the quality of a good before
purchase. By definition, the consumer cannot know the true quality of an experience good until
after he or she has purchased and used the good (Nelson 1970). Adverse selection occurs when
the consumer purchases a good which does not meet their needs.
Overcoming the Problem of Hidden Information
As in the literature regarding the problem of hidden action, much of the literature on
the topic of the problem of hidden information is devoted to overcoming the problem and
finding the best possible outcome. According to Bergen, Dhutta, and Walker (1992), the
problem of hidden information can be overcome in at least three ways: screening, signaling, or
providing opportunities for self-selection. A principal may screen an agent to establish their
true characteristics by collecting additional information over and above the signals sent by the
16
agent. Screening can include observing agent behavior, administering aptitude tests, or
interviewing personal references among other activities. Screening is generally conceptualized
as actions undertaken by the principal to gather information about the agent. It is most
effective when it is relatively easy for the principal to obtain information about a potential
agent. Signaling occurs when an agent engages in actions that are intended to “signal” to the
principal that they are the type of agent that the principal is seeking. This would occur when
the agent knows that it has certain desirable characteristics that would be beneficial for the
principal. For example, obtaining an MBA is a signal that a candidate has a high level of mental
ability and motivation. Generally, screening is thought of as actions that the principal takes to
find out information about the agent, while signaling is when the agent undertakes an action to
transmit information to the principal. Opportunities for self-selection occur when the principal
constructs a situation that will enable potential agents to put themselves in situations that will
let the principal know that they have the ability and willingness to expend the effort required to
perform the task at hand. An example of this could be when a firm requires a lengthy and
difficult training program for new recruits in order to find an agent with the technical
competency the firm requires (Bergen, Dutta et al. 1992).
Recent empirical research into the problem of hidden information includes studies of
how firms may use relationship building activities to overcome agency problems. For example,
several studies have examined how firms may build relationships with customers in order to
give them assurances of their motives and guide customer perceptions of the relationship
between firm and consumer. Retailers can use various methods including direct mail,
preferential treatment, interpersonal communication, and rewards to guide consumer
perception of the relationship (De Wulf, Odekerken-Schroder et al. 2001). This investment in
relationship increases relationship quality and leads to behavioral loyalty on the part of the
consumer. Palmatier, Gopalakrishna, and Houston (2006) also look at the return that a firm
might see on their marketing activities. Building relationships with consumers through social
program, financial rewards, and idiosyncratic investments helps overcome the problem of
hidden information by assuring customers of the company motives. The same notion that
relationship building can overcome doubts can also be extended beyond the relationship
between firm and consumer. Commitment to building social connections to be leveraged for
organizational purposes was shown to increase market performance as measured by sales
growth and market share (Gu, Hung et al. 2008). In a similar vein, credible commitment of a
retailer to a manufacturer can impact the distribution intensity for goods (Frazier and Lassar
17
1996). The credible commitments (as measured by contractual restrictiveness and retailer
investments) can overcome doubt of motives and intentions and encourage contracting parties
to intensify a relationship.
Efforts to overcome problems of hidden information may take place at one level of the
organization and may affect agency problems at other levels of the organization. For example,
because customers interact with front line employees directly, they see those employees as the
window to what management policies and procedures are. Customer trust of the front line
employees impacts trust of management and the company as a whole. Front line employee
actions must overcome problems of hidden information for consumers, and transmit
information about the company motives. This trust will have the end effect of increasing
customer value and customer loyalty (Sirdeshmukh, Singh et al. 2002). Wathne and Heide
(2004) demonstrate that upstream supplier qualification programs, which overcome problems
of information asymmetry by providing opportunities for self selection, can affect a company’s
ability to show flexibility toward a downstream channel partner.
Some recent empirical studies have demonstrated that signaling can effectively
overcome the problem of hidden information. For instance, by making preannouncements to
the marketplace about new product releases, firms can alleviate the lack of information about
future plans of the firm. Sorescu, Shankar, and Kushwaha (2007) found that in general, pre-
announcing generates positive long term financial rewards. Empirical agency research also
shows that firms can signal to consumers through the use of bonds (Mishra, Heide et al. 1998),
brand name affiliation (Ingram and Baum 1997), and through pre-qualifying products as
conforming to a certain quality standard (Wimmer and Chezum 2003). The fact that a company
chooses to supplement an external governance system with an internal one in a plural
governance situation serves as a signal in itself and provides an opportunity for self-selection for
those external firms considering entrance into the relationship (Heide 2003). External firms
considering contracting with the firm who already employs an internal governance system are
aware that they must comply with the limitations of the internal governance structure if they
wish to do business with that company.
Gap in literature
Agency literature focuses almost entirely on dyadic relationships, finding the best
contract to govern a relationship between a principal and their agent. This leaves a significant
gap to be filled regarding agency relationships beyond the dyad. A general shift has been
occurring in the marketing literature such that researchers are examining not only one-to-one
18
dyadic relationships within firms but also relationships within their greater network context
(e.g. Achrol 1997; Achrol and Kotler 1999; Möller and Halinen 1999). A limited number of
studies have considered agency relationships beyond the dyadic level, including Anderson,
Hakansson, and Johanson (1994), Antia and Frazier (2001), Dahlstrom and Ingram (2003),
Mishra, Heide, and Cort (1998), Rindfleisch and Moorman (2001), (Sirdeshmukh, Singh et al.
2002) and Wathne and Heide (2004). Employing network logic to study this problem allows for
a better vantage point and a new perspective on the problem. There are many situations where
the buyer and the seller in a transaction never actually meet. For example, think of the market
for real estate where transactions are conducted via third-party agents, where the buyer and
seller may never actually meet. Other examples include situations where goods are sold at
auction, where the identity of the buyer or seller may never be disclosed. In order to examine
these situations it is imperative that the network in which the transaction takes place is
considered. Even if we cannot identify the buyer and the seller in a transaction, we can still
study their behavior and the outcomes of the marketplace by looking at the network in which
the transaction takes place.
This literature review will focus on the signaling method as a way of overcoming the
problem of adverse selection. Of the three ways to overcome the problem of adverse selection,
signaling perhaps provides the most versatility. Signals can be conceptualized in many types of
relationships, and can go both from principal to agent and from agent to principal. Signals can
be present in multi-level agency relationships, and can be seen by multiple parties at the same
time. Specifically, the marketing community has found the theory of signaling to be particularly
effective in explaining how marketers can use signals to communicate to consumers regarding
unobservable product quality (e.g. Rao and Bergen 1992; Rao and Monroe 1996; Kirmani and
Rao 2000).
Signaling
In many situations, one party may lack information that the other party has. The party
that lacks information may make inferences about the situation based on information provided
by the other party. A marketing signal is defined as “a marketing activity which provides
information beyond the activity itself and which reveals insights into the unobservable, the
message within the message” (Herbig and Milewicz 1994, p. 19). A signal provides a direct or
indirect indication of intentions, motives, goals, or even internal situation and these signals
convey information to other actors in the marketplace (Spence 1974; Porter 1980). The
19
marketing literature has particularly focused on the theory of signaling to explain how one party
can communicate to another about unobservable product quality, and help to overcome the
problem of adverse selection.
Kirmani and Rao (2000) identify a typology of marketing signals. The main classification
is based on whether the firm incurs the monetary loss due to signaling, and if this loss occurs
whether or not they default on their product quality claims, or if they only incur the loss if they
default on their quality claims. Default on a quality claim occurs when a firm promotes that
their product is of high quality, but the customer finds that the product is not actually of high
quality. Signals which cause the firm to incur loss with or without default are known as
“default-independent claims”, while signals which only incur monetary loss if default occurs are
known as “default-contingent claims”. These categories are further broken down based upon
the type of costs that the company must risk in proving the signal. While the costs of the
default-independent signal are incurred whether or not the firm defaults on its quality claims,
costs for signals which are only incurred during an actual sale are known as “sale-contingent”,
while signals which cost the firm no matter if a sale is made or not are known as “sale-
independent”. Examples of sale-contingent signals include low introductory prices, coupons, or
slotting allowances. Examples of sale-independent signals include advertising, brand name, or
retailer investment in reputation. For default-contingent signals, the bond for the firm is based
on the potential for future consequences. If the firm stakes its future revenues on offering a
default-contingent signal, that signal is known as “revenue-risking”. If the firm stakes its costs
on offering a default-contingent signal, that signal is known as “cost-risking”. An example of a
revenue-risking signal is a high price, while warranties and money-back guarantees are
examples of cost-risking signal (Kirmani and Rao 2000).
Following on the theoretical base and the strong pedagogical development as outlined
by Kirmani and Rao, the rest of this section will be organized around their Typology of
Marketing Signals classification method. Their 2000 paper provides a comprehensive and
efficient structural review of signaling.

20
TABLE 2.1 Typology of Marketing Signals
Notes Default-Independent
Sale-Independent
Firm incurs costs if they default on quality claim or not, if they make a sale or not.
Sale-Contingent
Firm incurs costs if they default on quality claim or not, but only if they make a sale.
Default-Contingent
Revenue-Risking
Firm incurs costs only if they default on quality claim, firm stakes future revenues.
Cost-Risking Firm incurs costs only if they default on quality claim, firm stakes future costs.
*adapted from Kirmani and Rao, 2000, p 69
Default-Independent Signals
When a firm chooses to send a signal that will result in monetary loss no matter if they
default on their quality claims or not, they are sending a default-independent signal. These
default-independent signals can be further broken down into two types: sale-independent and
sale-contingent. With sale-independent signals, firms will incur the cost of signaling whether or
not an actual sale is made or not. The cost of sale-contingent signals are only incurred if an
actual sale is made.
Sale-Independent
Even if no one actually buys the firms’ products, the costs of sale-independent signals
are incurred. Much of the existing literature on signaling focuses on the effects of the sale-
independent signals of advertising, brand name, and retailer investment in reputation (e. g.
Kirmani and Wright 1993; Chu and Chu 1994; Dawar and Parker 1994; Erdem and Swait 1998;
Rao, Lu et al. 1999; Zhao 2000; Aiken and Boush 2006). The findings in these studies will be
elaborated upon in the following sections.
Advertising. When a firm makes a monetary outlay into advertising, it is taking steps to inform
the marketplace about its product. They may be trying to increase awareness, project a certain
image of their product, or persuade consumers that their product is better than competitors’
offerings. Regardless of the type of message that the advertising is sending, the very act of
spending money on advertising sends a signal to the marketplace. Marketing literature focuses
mostly on the signal that this advertising expenditure sends to the consumer. Consumers are
aware that advertising campaigns cost firms money. Kirmani and Wright (1989) examine how
perceived advertising campaign expense may influence consumer expectations about product
21
quality. They find that in some situations there is a positive relationship between advertising
expense and perceived quality. A recent study by Aiken and Boush (2006) found a positive
relationship between implied investment in advertising and consumer trust in a web-based
retailer. In general, there is support for low-priced consumer goods (Rotfeld and Rotzoll 1976)
and consumer durables (Phillips, Chang et al. 1983), but not all studies support the predicted
relationship between advertising expense and perceived quality. For example, Caves and
Greene (1996) do find support for this relationship, concluding that advertising expenditure
does not serve as a quality signal. The findings of Zhao (2000) might shed some light on the
disparate conclusions. They claim that previous findings of positive relationships between
advertising expenditures and quality perceptions are due to the fact that only high-quality firms
can afford to invest heavily in advertising. Basically, these firms had high quality product
offerings, which was the real driver of the positive quality perceptions, not just the fact that
they spent money on advertising.
Brand name. Consumers have been shown to react more favorably to some element of the
marketing mix for a name branded product versus an unnamed or fictitiously named product
(Keller 1993). This increased benefit to the company for the name brand product is known as
brand equity- the increased price that a consumer is willing to pay for the features inherent in
that product beyond what the features are worth themselves. Brand names must credibly
convey unobservable quality, because false claims can result in economic consequences for the
brand. For example, if a consumer purchases a product that it believes will be high quality
based on the brand name, and the consumer finds that the product is actually low quality (the
company defaults on their quality claim), its perception of the brand will decrease and that
consumer will be less likely to purchase that brand in the future (Rao, Lu et al. 1999).
Consumers use simplifying heuristics when they have limited time and resources
(Tversky and Kahneman 1974). They will look for signals in the marketplace to help them make
decisions. Brand name can serve as a signal to consumers regarding the quality of the product
being considered for purchase. In fact, brand name has been found to be a more important
signal of quality than price Rao (Rao and Monroe 1989; Dawar and Parker 1994).
Studies such as Erdem and Swait (1998) and Erdem, Swait, and Valenzuela (2006)
examine brand equity as a signaling phenomenon, but take an information economics approach
to the theory. They find correlational evidence that brand name does communicate
unobservable quality, even in multiple countries around the world (Erdem, Swait et al. 2006),
but that this effect is actually found because of increased credibility given to brand name sellers
22
due to their investments in brand equity such as advertising, product design, and special
packaging modification. These investments build brand equity, and as such brand names can
convey unobservable quality credibly. It would not be economically wise for a low quality
retailer to invest in brand name, because consumers would soon discover that the quality
claims are false and not make repeat purchases of the brand (Erdem and Swait 1998). This
includes an empirical test by Rao, Qu, Ruekert (1999) which finds support for the prediction that
brand name can signal unobservable product quality. Ingram and Baum (1997) examine the
effect of chain (brand name) affiliation on the survival changes of hotels in Manhattan. They
find that in general, the use of the brand name does improve the performance of the hotel in
that they have a higher chance of survival on the whole. Overall, experimental work in brand as
a signal of quality has been consistent with signaling predictions (Kirmani and Rao 2000).
Retailer investment in reputation. Similar to the idea that firm investments in a brand can
increase brand credibility, which will increase consumer perceptions of quality, firm
investments in reputation can send a signal to consumers that their product is high quality.
Reputable retailers are less likely to default on their reputation of offering high quality products,
as they will experience monetary consequences if they offer products which do not meet
consumer expectations. As such, consumers use retailer reputation as a signal of product
quality offered (Chu and Chu 1994; San Martin and Camarero 2005; Aiken and Boush 2006; Li,
Srinivasan et al. 2009). Dawar and Parker (1994) find that while retailer reputation is less
important in signaling quality than brand name or price, reputation is seen by consumers as a
signal of product quality. Herbig and Milewicz (1994a, b, 1996) believe that retailer reputation is
actually the element which determines if communication via signaling will be effective.
Reputation is established by fulfilling signaling promises over time, which implies a long-term
investment in maintaining the perception of a high quality product.
Sale-Contingent
The cost of sale-contingent signals are only incurred if an actual sale is made. One
example of a sale-contingent signal includes offering a low introductory price. By offering a low
introductory price the firm is sending the signal that they are willing to give up immediate
income for the first sale in hopes that they will recover the profits via future sales (Schmalensee
1978). The firm is charging a price lower than actually justified by the quality of the product,
giving up short-term profit in the hopes of long-term future profits. Only a firm offering a high-
quality product can rely on this method of being effective (Wathne, Biong et al. 2001). A firm
23
offering low quality products cannot rely on future purchases by consumers because consumers
will discover that the product is not of high quality and they will not purchase again.
There is little empirical evidence regarding sale-contingent signals such as low
introductory prices. Dawar and Sarvay (1997) find no support for the ability of low introductory
prices to convey the signal that the product is high quality. In fact, there is some evidence that
price can exercise an unconscious influence on expectancies about product quality, and these
expectancies can influence actual quality perceptions (Rao 2005; Shiv, Carmon et al. 2005). This
suggests that lower prices signal lower quality, although the specific context of a low
introductory price to induce trial was not considered.
Default-Contingent Signals
When a firm chooses to send a signal that only results in a monetary loss if they default
on their quality claims, they are sending a default-contingent signal. Default-contingent signals
can be further broken down into two types: revenue-risking and cost-risking. With revenue-
risking signals the firm is risking future revenues if they default on their quality claims. With
cost-risking the firm is risking increases in costs if they default on their quality claims.
Revenue-Risking
The monetary losses of a revenue-risking signal are only incurred if a firm defaults on its
quality claim. One example of a revenue-risking signal is when a firm charges a high price to
signal quality. The firm is risking future profits if it defaults on its quality claim. If consumers
discover that the product is not of the quality to justify the price, they will not purchase again,
and the firm will not receive future revenues (Mishra, Heide et al. 1998; San Martin and
Camarero 2005). The price-perceived quality relationship has been well established in the
literature, but empirical evidence of the relationship is relatively sparse.
Consumers have been shown to use price to make attributions about product quality.
Higher prices signal higher quality, while lower prices signal lower quality (e.g. Rao and Monroe
1988; Rao and Monroe 1989; Lichtenstein, Ridgway et al. 1993), including some empirical
evidence (Gerstner 1985; Tellis and Wernerfelt 1987). While Gerstner (1985) does find some
support for the relationship between price and quality, his overall findings are very weak. The
findings are not robust across product categories, and nonfrequently purchased items had
somewhat stronger relationships than those that are frequently purchased. This could be
because nonfrequently purchased items are generally more expensive, and products with

24
higher prices may have a stronger price-quality relationship (Gerstner 1985). Evidence from
Tellis and Wenerfelt (1987) also shows that the price-quality relationship is not stable across
product categories. They show that price is a better indicator of quality for durable goods which
should be useful for a longer period of time and for goods such as packaged goods where the
quality is not able to be determined through inspection. Mishra, Heide, and Cort (1998) find
empirical support for the hypothesis that consumers who make purchasing decisions under
conditions of quality uncertainty will pay a premium price to ensure quality. Consumers use
simplifying heuristics when they have limited time and resources to make judgments about
products (Tversky and Kahneman 1974). They read the signals in the marketplace, and one such
signal is that of price. The relationship of price to perceived quality has been found to be robust
even across many countries (Dawar and Parker 1994). The same authors also found that price
was more important than retailer reputation, store name, or physical appearance in signaling
quality, but less important than brand name.
A few studies have not found support for the overall proposition of price as a quality
signal. Caves and Greene (1996) find evidence for price as a quality signal only for frequent but
unimportant purchases. Shiv, Carmon, and Ariely (2005) do find that the anticipated
relationship of price to quality holds in an experimental setting but find that it is due at least in
part to a placebo effect. This placebo effect is where price can exert an unconscious influence
on expectancies about product quality, and these expectancies can then have an impact on
perceived product performance.
Cost-Risking
The monetary loss of a cost-risking signal is only incurred if the firm defaults on their
quality claim. While defaulting on a revenue-risking signal will cause a firm to forgo future
revenues, defaulting on a cost-risking signal will cause the firm to incur higher future costs. One
example of a cost-risking signal is to offer a product warranty or a money-back guarantee. The
firm is offering a promise to the marketplace that its product is of high quality, and if it does not
offer the expected high quality it will incur higher costs. It is only wise for a high quality firm to
offer cost-risking signals. A low quality firm would find too high of a default rate and incur high
costs related to repairs and refunds when it is discovered by consumers that the product is not
of high quality. As such, a cost-risking signal can communicate to consumers that the product
being offered is of high quality (Kirmani and Rao 2000).
25
The offer of a guarantee signals quality by taking advantage of the higher probability of
returns for a lower quality product (Moorthy and Srinivasan 1995). In an experimental study,
Boulding and Kirmani (1993) find that warranties are a successful signal only for reputable firms.
San Martin and Camarero (2005) find that by offering a warranty, a firm can engender
consumer trust in the quality of the service. On specific example is in the context of a service
where quality is not immediately evident after the service is rendered- such as an automotive
service department. Evidence supports the notion that low-price guarantees do increase
consumer purchase intentions, consumers must find the signal credible (Biswas, Dutta et al.
2006).
Signaling- Business to Business
While most of the literature on signaling focuses solely on the concept of a firm
signaling to a consumer, there are some examples of signaling used in a business to business
context. These signals are different than the signals conceptualized in the business to consumer
context. Signals in the business to business context are actions such as competitors
announcements to the marketplace regarding its position or future actions. This market
signaling may influence competitive behavior. Competitive reactions are often based on signals
which come before actual actions in the marketplace (Herbig and Milewicz 1994; Robertson,
Eliashberg et al. 1995; Zhao 2000). Competitors must make inferences about the intentions
behind the signal and make predictions about the future actions of the signaling firm. The firm
sending the signal must also consider how the signal will be interpreted by competitors. For
example, a firm announcing to the marketplace that its are going to release a new product must
consider how this signal will be received by their competitors and anticipate how those
competitors will react. Manufacturers can also use signals such as advertising, slotting
allowances, and wholesale prices to signal high product demand to retailers, in order to
encourage them to stock their products (Desai 2000). Wathne, Biong, and Heide (2001) provide
experimental evidence that price is used as a signal to potential new channel partners of a high
quality product. In a market simulation, Herbig and Milewicz (1994) show that in order for
business communication to be effective via signaling, the firm must be reputable.
Heide (2003) proposes and tests empirically the notion that when a firm employs a
hierarchical governance structure this decision itself is a signal to outside suppliers. The
existence of the hierarchical arrangement serves as a self selection device for suppliers in that
the presence of the relationship signals to the external suppliers about what they could expect
26
in a contact- specifically an increase in centralization and formalization. Tested empirically in
the context of retail store managers, Murry and Heide (1998) demonstrate that using
performance-based incentives for promotional program participation can provide an
opportunity for risk-averse retailers to opt-out of a performance based program. The utilization
of the performance-based incentive program served as a signal to channel members that their
reward would be based on performance, so those who were not willing to commit to
performance would choose not to enter into such contract.
Gap in Literature
There is very little literature on signaling in marketing that considers signals beyond a
dyadic relationship. There are many situations where the signal does not just affect just one
sender and one receiver- multiple constituencies may be aware of and react to a given signal.
For example, Chu and Chu (1994) consider a distribution channel where a manufacturer is able
to signal that its product is of high quality through choosing to sell it through a reputable
retailer. The end consumer is receiving the signal that the product is of high quality because it is
being offered by a reputable retailer; the manufacturer is also signaling to the retailer that it
believes the retailer is reputable by choosing to sell their product through that channel.
Similarly, Rao, Qu, and Ruekert (1999) show that a brand can enhance claims of quality by co-
branding with a second reputable brand. Consumers will perceive the claims of this co-branded
product to be more credible because of the tie with the reputable brand. Both firms are
signaling jointly to the consumer that they believe one another to be of high quality, if either
party believed the partner brand would default on its quality claims, it would not take the risk of
putting their brand name at stake. Some literature discussed earlier which consider business to
business signaling also consider what the competitor reaction to the signals will be, along with
the effect the signals have on the end consumer (Zhao 2000; Prabhu and Stewart 2001). In this
way, they are considering the effects of signaling beyond the traditional view of one firm
signaling to one consumer.
In addition, there is a general lack of empirical evidence for signaling hypotheses (Rao,
Lu et al. 1999). While some studies (e.g. Boulding and Kirmani 1993; Caves and Greene 1996;
Erdem and Swait 1998; San Martin and Camarero 2005; Biswas, Dutta et al. 2006; Erdem, Swait
et al. 2006) have offered empirical evidence where signals are shown to affect consumer
purchasing outcomes, it is certainly limited. A few studies (Murry and Heide 1998; Heide 2003)
have provided empirical evidence of signaling hypotheses in a business to business context,

27
where the type of governance contract offered to channel members serves as a signal and
opportunity for self selection into the relationship. In particular, there is a lack of empirical
evidence linking signaling hypotheses with business performance outcomes.
Beyond the marketing literature, we can find many examples of signaling. In particular,
signaling is used extensively in the finance and economics literature.
Signaling in Other Contexts: Finance and Economics
The concept of market signals has been discussed at length in the finance literature. In
general, the literature considers situations where buyers and sellers are interacting in a market
for some good, and they must use signals to infer information about the true quality of that
good. Individual consumers may have different pieces of private and imperfect information,
with different consumers receiving different signals from the marketplace. This private
information influences the decisions that consumers make. By looking at aggregate data
regarding market sales, it is possible to get a clearer picture of the signaling mechanisms
operating (Caminal and Vives 1996).
In the stock market, like many goods markets in general, buyers are unable to
accurately determine the quality of a good before purchase. Akerlof’s (1970) paper on the
problems inherent in a market with goods of different qualities discusses signals as a way to
counteract quality uncertainty. Since buyers do not know the quality of their potential a priori,
they must look to signals such as market statistics of past sales to judge the quality of the good.
Signaling literature in finance and economics can be broadly divided into auction and
non-auction contexts. First, I will discuss the non-auction context.
Market Statistics as Signals
One demonstration of the use of market statistics as signals is presented by Akerlof
(1970) in the used car market. Although a consumer does not know ahead of time if the used
car that it wishes to purchase will be a good car or a ‘lemon’, it can look to market statistics to
help with their purchasing decision. They can find out the probability that a certain make of
used car is a good car- think of Consumer Reports magazine, which publishes ratings that assess
the relative reliability of used cars. Buyers can use this information to judge options of available
used cars and increase their chances of buying a high quality product. One other market
statistic identified is information on past market share. Market share provides an additional
source of information about relative quality differences, as they aggregate dispersed
28
information on the actions of previous customers. Firms actively compete for market share in
an attempt to manipulate consumers’ learning. They will cut prices in the hopes of increasing
sales and market share. Consumers use market share as a signal of quality- the higher the
market share, the more other consumers are buying the product and the higher the perception
of quality (Caminal and Vives 1996).
Companies’ Role in Signaling
From the marketing literature we know that companies use signals such as advertising,
guarantees, branding, and reputation to influence perceived quality. In finance we find that
companies also purposefully drive quality perception through the use of signals. A firm can use
its reputation to signal quality in a market where there is imperfect information (Shapiro 1982;
Rosenman and Wilson 1991). Rosenman and Wilson (1991) consider a market for cherries in
which the goods are sold in lots. Firms can make the decision to sort their cherries by size prior
to sale, or sell them in mixed lots. They find that the firms that do not sort receive a more
premium price for their heterogeneous lots of cherries than do sorting firms for the same
product. Rosenman and Wilson posit that the very act of sorting sends a signal to the market.
The firms that do sort are pre-examining their merchandise, and are believed to be removing
the largest, highest quality cherries from the population of cherries for sale in homogenous lots
of large cherries. By not sorting, consumers infer that the non-sorting firms are leaving the
large, high quality cherries in and making them available to the buyer in the heterogeneous lots.
The very act of not sorting is a signal to consumers that they will find a better quality
assortment in their lot.
Firms can influence trading volume of their stocks via the public announcements that
they make, with the market reacting either positively or negatively depending on the
information in the announcement. The public announcements serve as signals of the current
state of health of the company (Kandel and Pearson 1995). Some firm-level decisions can affect
stock market returns, such as the decision to call or not on an outstanding convertible bond
(Acharya 1988). Similarly, the trades of company directors signal to the market, depending on
whether the directors buy or sell stock. Director purchases serve as a way for managers to
communicate private information. They can use purchases to signal positive information, such
as that the stock is undervalued, and it will result in positive abnormal market returns. Stock
sales by managers, on the other hand, signal negative information and result in negative
abnormal returns (Gregory, Matatko et al. 1997; Louis and Robinson 2005; Louis and White

29
2007). Even the actions of the central bank are posited as signals to the market as a whole that
inform about the relative health of the economy and affect the general price level, output, and
employment (Friedman and Maier 1999). It is clear that signals at the firm level are used to
communicate unobservable quality information, which has been empirically shown to affect
business performance outcomes in the form of stock market returns. Signals regarding
company quality can also be sent to the market by agents outside the company. This occurs
when the signal is not sent between the company and a buyer, but rather through an agent in
the middle of the transaction. The next section will explore further these situations where
signals are transmitted through third party agents.
Third Parties’ Role in Signaling
In many markets third party agents are relied on to evaluate company quality. The
actions of these agents serve as signals to the market which can affect business performance.
Subjective information from experts is widely used to make predictions in situations of
uncertainty in a variety of contexts ranging from horse races, the stock market, and markets for
art and wine. The expert opinions of race track handicappers are widely used as a signal of the
probability that a certain horse will win a race (Figlewski 1979). Bond market investors are
unable to directly observe the default probability of any borrower, so they must use the
associated observable insurance coverage of a third party insurance company to determine the
interest yield on a debt issue (Thakor 1982). Third party agents such as stock brokers interpret
signals of company public announcements, and their interpretation of the message, positive or
negative, drives stock trading(Kandel and Pearson 1995).
Zuckerman (1999) presents a concept of markets as a social process where the third
party experts, not the buyers themselves, are the market drivers. This follows on White’s (1981;
White 1981) work on production markets where he asserts that the “central dynamic in
production markets consists of mutual monitoring among sellers rather than reaction to an
amorphous mass of buyers (p. 1400)”. Zuckerman explains that here, third party experts are
responsible for giving market participants and products legitimacy. They shape market patterns
through their product recommendations and endorsements. In industries such as the stock
market where theses experts have significant influence, they actually replace end consumers as
the primary audience that can determine the success or failure of a product. If a seller fails to
get a review from these market experts, their product will not be recognized as being a
“legitimate” product. If the product does not gain such recognition, there will be a lower

30
chance of success. Zuckerman recommends that companies must actively work to garner
recognition by these experts because those firms that are reviewed by the experts are more
highly valued than those that are not. Hilger, Rafert, and Villas-Boas (2007) find general
empirical support for the notion that expert opinion can increase consumer demand. Even the
way that experts classify stocks can affect financial returns. For example, being classified
consistently into a specific industry classification system can affect stock market returns.
Different experts use different methods and interpretive models to analyze market
performance. If a stock is placed into multiple different classifications at different times by
analysts, it stands a better chance of getting incorporated into more market models. This
inclusion into more models will lead to higher levels of trade than those stocks that are not
classified into multiple industry classifications (Zuckerman 2004).
Signaling at Auction
Auctions are widely used mechanisms for selling goods. Klemperer (1999) gives an
overview of the basic premises and assumptions regarding auctions which are summarized
here. Governments use auctions to sell treasury bills, foreign exchange, mineral rights
(including oil fields), and other assets. Klemperer cites houses, cars, agricultural produce and
livestock, and art and antiques as examples of items commonly sold by auction. The auction
represents an efficient method of determining the public value of a good. There are four basic
types of auctions that are often employed in practice and studied. There is the ascending-bid
auction, also known as the oral, open, or English auction. In these auctions, the price is
successively raised until only one bidder remains. The highest bidder wins the item. The
descending-bid auction, also called the Dutch auction, is used in the sale of flowers in the
Netherlands. Here the auction starts at a high price, and the price is lowered successively until
someone agrees to accept that price. There is also the first-price sealed-bid auction and the
second-price (or Vickery) sealed-bid auction. In both of these types, bidders independently
submit a bid without knowing the price others have bid. In the first-price version, the highest
(or lowest) price wins, in the second-price version the highest bid wins, but the price paid is the
second-highest bid. Asymmetric information is a key feature of any auction.
There are situations where the seller is bidding at auction, not the buyer. Examples
could include where sellers are bidding on a construction contract, or a supplier bidding on a
contract to provide a manufacturer with raw goods. Often, in situations where sellers are
31
bidding, they will be trying to bid the lowest or most competitive price. This is contrasted
where buyers typically must bid the highest price to win an auction.
There are two basic auction models, representing differing levels of information
availability. In the private-value model, each bidder knows only how much he values the object,
and this information is private. The common-value model differs in that the actual value of the
item is identical for all bidders, but individual bidders have different amounts of private
information regarding what that value actually is. In Klemperers’ (1999) example, the value of
an oil-lease depends on how much oil is actually contained under the ground of a particular plot
of land. Bidders may have access to different geological signals about how much oil there
actually is, and this private information may cause them to have differing valuations.
There is also a general-model which combines characteristics of both the private and
common-value models. Here each bidder receives a private information signal, but each
bidder’s value is based on all of the signals in the marketplace, both public and private. A key
feature of bidding in any auction with a common-value component is the ‘winner’s curse’. This
is the notion that whoever wins the auction is willing to pay a price higher than anyone else and
the winner pays more, on average, than the item is actually worth. The winner is the bidder
who has overestimated the value of the item to the greatest degree (Klemperer 2002).
One key idea in the literature surrounding auctions is the premise that market
participants look to signals in the market to determine their estimate of the value of an item
(White 1981). Typically, this involves bidders looking to other bidders, market statistics about
the goods for sale, and the item sellers.
Role of Other Market Participants in Signaling at Auction
Markets are social processes (White 1981; White 1981; Granovetter 1985; Podolny
1993). Bidders look to the actions of other consumers in the marketplace for signals to indicate
unobservable quality to help them determine the price they are willing to pay. Rothkopf (1969)
examines how a buyer values a product when the true value is unknown. He finds that bidders
look to the number of other bidders bidding on the same object when determining their
valuation. The more bidders, the higher the value they place on the item. Market traders look
to past auction results for information to determine the value of the object at hand. Higher
past equilibrium prices convey more favorable information about the quality of the objects
being sold than lower prices (Milgrom 1981; Ashenfelter 1989). Traders also use current
bidding prices in determining value. Bidders use the bidding action of others in consideration of
32
their willingness to pay for a good. More bidders willing to bid more money indicates positive
information regarding the quality of the good (Milgrom and Weber 1982). This evidence carries
into auctions where suppliers are the bidders.
While each participant may look to individual others to help themselves in making a
determination of the value of the object for sale, this sharing of information can affect the
accuracy of the auction price as true determination of the value of the object. If there are many
participants in an auction, the market aggregates information into a collective evaluation. As
the market grows, each individual participant pays less and less attention to his own private
information and considers the aggregate behavior more and more. This aggregation of many
pieces of private information results in a sale that reflects the true value of the item
(Pesendorfer and Swinkels 2000). For this reason, auctions are often seen as the best way of
determining the value of an item that is unique, rare, or of undetermined quality (Ashenfelter
1989; Klemperer 1999).
Role of Sellers in Signaling at Auction
While market participants look to other buyers in the market to help determine the
value of an item offered at auction, there are also circumstances where potential bidders may
look to the seller of the item for signals of worth. For instance, Milgrom and Weber (1982)
found that a seller can raise the expected price of their item by adopting a policy of providing
expert appraisals of quality of the object it wishes to sell. Overtly offering market participants a
dollar value upon which to base their valuation can serve as a powerful, credible signal of
quality. Sellers can provide information on past sales of similar objects to help buyers
determine value, and in some circumstances, the auction house will publish an estimate of the
price it expects an item to bring. If the auction house does a good job in setting an estimate
(not so high that bidders are discouraged from entering the bidding, not so low that sellers feel
they will not get a fair price), this estimated price can be a very efficient means for signaling the
value of an item, just as past auction results are useful in predicting sale price (Ashenfelter
1989; Louargand and McDaniel 1991).
In recent years, online electronic auctions have yielded insights into the role the item
seller has in affecting buyer valuation. In most auction scenarios, an auction house is used to
sell items collectively on behalf of many individual sellers. An auctioneer works to obtain the
highest price possible for the good being sold. The auctioneer coordinates bids from various
sources and actively works to establish competition between parties. By encouraging this
33
competition, the auctioneer himself has a role in driving prices (Heath and Luff 2007). In an
online auction, there is no physical auctioneer, and bidders simply submit their bids
electronically and try to win the auction by having the highest bid at the designated close of the
auction. The seller in the online auction is directly selling to the bidders, so the bidders will look
to that seller for signals of the quality of the good. Sellers can increase the price for which their
item sells for at auction by signaling about both the quality of the good they are offering and
the reputation of themselves as sellers. Li, Srinivasan, and Sun (2004) found that by offering
quality indicators such as detailed pictures, the acceptance of third party secure payment
systems, and offering a money-back guarantee, sellers will obtain higher prices for their goods.
In a similar vein Melnik and Alm (2005) and Houser and Wooders (2006) found that a positive
reputation as determined by amount of positive feedback on the online auction site eBay had a
positive and statistically significant effect on price. In particular, these reputational effects were
more important for heterogeneous goods where buyers could not simply look to past auction
results of identical items in determining value. Sellers can also influence the final price they
receive for their goods via the reserve, or minimum acceptable price, that they set for their
items. This reserve price can serve as a reference price for the consumer to judge the ultimate
worth of the item. In general, the literature (e.g. Ariely and Simonson 2003; Kamins, Dreze et al.
2004; Suter and Hardesty 2005) finds that a higher reserve price will result in a higher final
auction price, while a lower reserve price will lead to a lower final price. In addition, Suter and
Hardesty (2005) and Kamins, Dreze, and Folkes (2004) found that a greater number of bidders
participating in the auction was associated with higher final prices.
Gap in Literature
While some tenents of auction theory are well established, there are questions to be
answered in the marketing literature. While the idea that auction participants are affected by
the other auction participants is well established (e.g. Milgrom and Weber 1982), and the
notion that auctions are often seen as the best way of determining the value of an item that is
unique, rare, or of undetermined quality (e.g. Ashenfelter 1989; Klemperer 1999), most
research on auctions ignores the mediators of auction outcomes. There is some evidence of the
role of seller reputation at auction including empirical evidence from online auctions (e.g.
Melnik and Alm 2005; Houser and Wooders 2006). Other empirical evidence from electronic
auctions includes evidence of an increased final price by those auctions which offering quality
indicators (Li, Srinivasan et al. 2004; Li, Srinivasan et al. 2009). Many questions exist regarding
34
these mediators of auction performance, particularly in situations outside of controlled online
electronic auctions.
Social Networks
Social Networks Perspective on the Marketplace
The network conceptualization in markets shed insight on the behavior, attitudes, and
perceptions of those involved (Burt 1992; Wasserman and Faust 1994). Harrison White’s work
(1981; White 1981; White 2002) on markets focused on explaining what, exactly, a market is,
why markets come into existence, and why they persist. The market is a social process, where
actions are based on “perceptions that are shared and public” (White 1981). The market
structure is originated from feedback between producers and buyers in the market on the
terms of trade offered. The market is sustained via the choices that the individual actors make
regarding the purchases they make. These choices are seen by other market participants, and
these other participants use the actions of others as signals of the choices they should make.
This networks perspective lies somewhere between the structuralist and individualist
conceptualizations of the market (Mayhew 1980). Structuralists see individuals as “mere
puppets” whose actions are dictated by the social structure they are in (Degenne and Forse
1999). The Individualists’ idea is grounded in economic theory and sees the actions of
individuals as autonomous behaviors undertaken to maximize their own personal utility
function (Hunt and Morgan 1995). White’s theory of the market (1981; White 1981; White
2002) fills the void as an intermediate point between looking at society as a whole and looking
at individual interaction only. Behavior of participants cannot be determined solely by position
or solely by individual goal seeking (Kilduff and Krackhardt 1994). The market is seen as a role
structure of firms that are linked together through interacting observations of trade. Producers
see the decisions that other producers make regarding production of goods and base their own
decisions at least in part on these observations. The market structure is maintained through
this feedback, not through a third-party authority dictating how the producers should behave.
Producers decide what to output by observing the outcomes of other producers in the market,
not by speculating on how buyers will react to products. Firms don’t use the preferences of
buyers to make decisions; they base their actions on what other producers are doing. Firms try
to find a place in the market where they can succeed- a certain niche level of output that they
can maintain. The producer production levels also signal to other market participants. For
example, consumers assess producer production levels as signals of quality (White 2002).
35
Granovetter (1985) shared White’s basic conceptualization of the market as a social
structure. His focus was on examining the difference between the networks perspective and
the economic perspective as promoted by Williamson (1975; Williamson 1979; Williamson
1981). Williamson’s New Institutional Economics view places less emphasis on the effect of
legal, political, or social forces on social institutions, and places more weight on economic forces
as drivers. Firms contract hierarchically within the firm when it can be done most efficiently in
terms of the cost of economic transactions, but they will contract in the market if this cannot be
done. Opportunism, according to this view, is constrained by the authority and structure of the
institutions. Granovetters’ idea, known as embeddedness, builds on the notion of markets as
networks, as presented in White (White 1981). He sees economic action as embedded in the
structures of social relations. It is impossible to analyze behavior and institutions separately
because they so constrained by social relations. These social relations play a central role in the
market process. The relations and structure of the market generate trust and discourage
opportunistic behavior since business relationships are embedded in social relationships. These
social relationships are viewed as more important in bringing order to economic life than the
authority mechanisms as highlighted by Williamson’s conceptualization (Granovetter 1985).
Podolny (1993) built on the idea of the market structure as being derived from trade
among market participants by introducing the role of producer status as a determinant of
market structure. While White (1981a,b) focused on the producer’s role in the market in
dictating their production decisions, Podolny focused on status. A producer’s status is defined
as “the perceived quality of that producer’s products in relation to the perceived quality of that
producer’s competitors’ products” (Podolny 1993, p. 830). Status is seen as a significant
determinant in generating and producing hierarchy among producers in the market. The
producer’s status position affects the opportunities that it may have in comparison to those
opportunities available to its competitors. Market status is a signal of the underlying quality of a
firm’s offerings, and higher status producers are able to command higher prices in the market.
According to Podolny (1993, p. 833), status is affected by the exchange relations that producer
has with consumers, the ties to third parties associated with the market in the distribution
channel, and ties to other producers. When market participants exchange with one another,
they are linked to, or identified with one another. Status is based on the quality of that
producer’s past offerings and their interactions with past high status individuals. In the case of
a market participant who sells the goods of other producers, higher status participants will be
able to obtain higher quality goods to sell from producers. The higher status sellers will be able

36
to command higher prices, so producers will be incentivized to sell via their channel. The firms’
status influences the attention that market participants pay to quality, their assessment of that
quality, and their regard for the product in general. Reputation is modeled as a part of status-
status ordering helps determine which firms will develop reputations for quality and which
won’t (Podolny 1993). In general, this implies that reputation differences may be due in part to
affiliations the participants have, and not just their capabilities (Benjamin and Podolny 1999).
Networks are the “plumbing” of the market. They are the channels or conduits through
which “market stuff” flows (Podolny 2001). This includes information along with actual goods,
services, or payments. But networks are not just pipes- we don’t just send and receive
information between market participants. The network ties act as signals to others in the
marketplace, prisms reflecting the relationships in the market (Podolny 2001). Market
participants see these relationships and make inferences about the underlying quality of the
individuals or firms involved. The networks approach acknowledges that relationships cannot
be defined solely by their collection of attributes (Knoke and Kuklinski 1982; Wasserman and
Faust 1994; Scott 2000). Network-based measurement provides a complementary
methodological approach to help explain the behavior, attitudes, and perceptions of market
participants. This approach has been advocated both for marketing in general (Iacobucci 1996)
and for distribution channel research specifically (Knoke and Kuklinski 1982; Burt 1992).
For this research, the networks concept of centrality will be used to assess the relative
position of actors in the marketplace to examine their influence. Centrality is an effective way
to measure how active an actor is in a marketplace, and inform us of that actors access to and
control over information flows. Actors with greater access to and control over information will
be able to leverage more influence over the marketplace.
Centrality
At the most basic level, centrality is a measure of how active an actor is in a network. A
more active actor will have a higher degree of centrality, a less active actor a lower degree. In a
circle where no actor is more active than any other, all will have the same centrality index. This
degree centrality focuses only on direct and adjacent choices. Prominence in degree centrality is
relatively equivalent to activity (Wasserman and Faust 1994). In 1977, Linton Freeman
introduced a new set of centrality measures called betweenness centrality. These measures of
centrality expanded beyond the existing centrality measures (Bavelas 1951; Beauchamp 1965;
Sabidussi 1966) which measured centrality as a function of the sum of the minimum distance
37
between that point and all others. The limitation of these measures was that they could not be
used in unconnected networks, such as those found in natural settings. Freemans’ 1977
measure defines centrality in terms of the degree to which a point falls on the shortest path
between others, giving them the potential for control of communication. This betweenness
measure of centrality should be used when there is potential for control of communication by
individuals who may be substantially relevant.
A point with a relatively high degree of betweenness centrality is somehow “in the thick
of things” (Freeman 1978/79). It may have more interpersonal influence on the other actors in
the network, and should have greater access to more information. The person who is in direct
contact with many others should see himself as a major channel of information, and others will
see him that way as well by observing his behavior in the network. Being involved in the many
flows of information allows a market participant to keep aware of new developments, and
control the flow of information, money, and other resources (Van Den Bulte and Wuyts 2007).
On the other hand, a person with low degree is peripheral to the network, and will be isolated
from involvement with many others (Freeman 1978/79).
Networks Studies in Marketing
A general shift has been occurring in the marketing literature to view market
organizations as not just sets of independent organizations operating independently but as
networks of specialized firms tied together in cooperative exchange relationships (Achrol and
Kotler 1999; Kothandaraman and Wilson 2001). In the modern era, there has been a great deal
of industrial restructuring which has changed the setting of markets and organizations. As
companies downsize, outsource, and specialize, they must become more flexible and learn new
ways of doing business. One of the fundamental changes is to realize the importance of other
firms operating in the same environment and build relationships, or networks, with partners,
suppliers, distributors, and even competitors. While relational exchange may seem at first to be
an issue that simply takes place between two firms that are involved in some sort of exchange,
the true nature of the relationship is defined by the long-term makeup of the greater
institutional framework, including the individual people who work for and buy from the
organizations. As such, marketing must look at the relationships which define firms not just on
a one-to-one level, but must view these relationships in their greater network context. For this
literature review I will categorize the networks marketing literature into three general camps of

38
study, following along the same general division as Van Den Bulte (2007). These three divisions
are as follows: consumers, organizations, and channels of distribution.
Consumers
People are influenced by the other people they come into contact with. Social
psychology has long known that individual behavior is influenced by the groups with which we
surround ourselves with, that people change their behavior based on the people they are
around (Asch 1953; Merton and Rossi 1953). More specifically, consumer purchase decisions
are influenced both by the networks of individuals that we are a part of, along with those
groups that we are not directly a part of but we watch or admire (Bearden and Etzel 1982). This
social influence can be used to explain brand and product choice. So while club members may
make decisions based on the purchases of other club members, they may also look to other
reference groups such as celebrities for signals of the brands and products they should
consume. Similarly, Sirsi, Ward, and Reingen (1996) demonstrate that the culture to which an
individual belongs can shape consumption behaviors. The culture in which an individual is
embedded in may restrict the opportunities available for learning different beliefs, and so
individuals who are members of the same culture will tend to make similar purchasing
decisions.
While some consumers may have different levels of susceptibility to interpersonal
influence (Bearden, Netemeyer et al. 1989), the nature of the relationship can also affect the
influence one individual or group may have on another. For example, Reingen et al. (1984)
studied brand and product choice in a sorority. They found that different levels of social
relationships (roommate, friend, someone with whom you study, play sports, or eat with, etc.)
can affect the level of brand congruence across these relations. In addition, those relations with
multiple levels of ties (individuals or groups that have more than one level of social
relationships) had even more brand congruence. While this research has focused on how a
network influences the purchasing decisions of an individual consumer, an interesting
application of the network approach is on the way that groups make decisions- specifically, how
a group which consists of several subgroups makes decisions which have both group and
individual level implications. Ward and Reingen (1990) studied how opinions and beliefs about
the optimal decision are influenced by the social structure of the group. The social structure
affects the interaction patterns of the group participants, which in turn influences the shared
knowledge structures affecting the decision that group ultimately decides on.
39
Some types of goods exercise more significant social influence over people. Goffman
(1951) outlined the notion that some purchases we make can be used specifically to symbolize
or signal our status in the world. These status objects can then influence others in their
purchasing decisions and affect the way the possessor of that symbolic good is viewed (Richins
1994). Think of a Rolex watch, a Porsche sports car, or some other special possession and its
role in symbolizing something about the individual that possesses this item. We can send a
powerful signal about ourselves and our values by the items that we choose to own.
Consumers who desire these unique, status-laden goods can even affect the pricing decisions
that companies make. For example, Amaldoss and Jain (2005) found that sometimes a
consumer’s desire for uniqueness can increase demand for some goods as the price increases.
The higher price signals to the purchasing consumer and to those that observe the consumer
displaying this purchase that the good is even more desirable. As such, the desire for
uniqueness and status can actually lead to higher prices and higher profits for the firm.
While consumer goods purchases have proved a fertile area of research for the study of
social networks in marketing, another major trend that has emerged is the study of word-of-
mouth referral networks. Reingen and Kernan (1986) and Reingen (1987) examined the network
of a piano tuner and studied the way that word-of-mouth referrals transmit through the
network. They found evidence for key network opinion leaders, individuals who have influence
on the decisions of multiple people. These opinion leaders are key links in the network,
disseminating opinion through multiple channels. In addition, membership in multiple groups
was found to be instrumental in the spread of word-of-mouth referrals. Brown and Reingen
(1987) examined the differing roles of strong versus weak ties in this referral network. While
weak ties act to ‘bridge’ information, allowing it to travel between different social groups,
strong ties are more likely to be activated for broadcasting referral information. Overall, strong
ties were thought to be more influential in the word-of-mouth referral network. Frenzen and
Nakamoto (1993) also found support for the notion that strong ties are more important in the
spread of a word-of-mouth referral. Recent empirical work (Van Den Bulte and Joshi 2007) has
supported theory that some customers are more valuable for marketers to target with new
innovations, as these consumers are more likely to both adopt new developments and also
influence others in their network to purchase the innovation (Gladwell 2002).
Recent networks work in the area of consumer behavior have explored the specific
mechanism that might be at play in consumer brand choice. Henderson, Iacobucci, and Calder
(1998; Henderson, Iacobucci et al. 2002) have examined consumer associative networks to
40
explore the brand constructs of positioning, complementarity, and substitutability. The use of
networks analysis methods can provide insight into how consumers view brands and how
brands are associated or not associated with each other. This could have important
implications for marketers who must make decisions about product positioning. Hill, Provost,
and Volinksy (2006) looked at the problem of identifying likely adopters of a product based on
their network. They found support for the idea that network linkage can affect product or
service adoption. For example, some ties were found to significantly predict adoption. People
who were linked with someone who already uses the product or service were shown to be
three to five times as likely to adopt that product or service.
Organizations
Changes in the way that companies conduct business has led to a shift in the way that
researchers examine relationships within the organization. Business has moved away from the
adversarial buyer-seller relationship described by Porter (1985) towards a cooperative
relationship paradigm where there is mutual benefit for both parties (Kothandaraman and
Wilson 2001). Just as consumer researchers are interested in exploring the effects that an
individual’s network may have on its purchasing decision, organizational researchers hope to
reveal insight into how networks affect decisions within organizations. The networks approach
views the organization as “a set of roles linked by several networks that can transmit
information, influence, and affect” (Hutt, Reingen et al. 1988, p. 9). With this approach, it is
possible to investigate individuals and groups by focusing not on their attributes, but on their
interrelationships. Within the organizational networks literature, two main themes can be
identified. One main focus is on the ways that the network affects organizational purchasing
decisions; the other on the implications for networks in strategy formulation and
implementation.
In an early work on networks in the organizational literature, Bristor and Ryan (1987)
advocated to move away from thinking of organizational purchasing being conducted by a
“buying group” to viewing these decisions as being made by a “buying network”. The buying
network is defined as “the set of individuals involved in a purchase process, over a specified
time frame, and the set of one or more relationships that link (or fail to link) each dyad” (p.
256). This shift toward looking at this process as a network process reflects the more general
shift in the modern business environment towards assessing an organization or group not just
as an independent entity but seeing them in their greater context of the other organizations
and groups with which they are in contact. The network approach examines the relationships

41
between these groups of individuals, not just the attributes of those groups of individuals.
Bristor (1988) advocates a networks approach to investigating coalitions in organizational
purchasing. She hypothesized that coalition members’ social ties affected the resources
available to them, which in turn affected their strength and ability to influence organizational
buying decisions. It has been proposed that through these ties and the resources that can be
obtained through them, that organizations can gain social capital (Leana and Van Buren 1999).
A recent empirical study of “Guanxi”(Gu, Hung et al. 2008), which is defined as the “durable
social connections and networks a firm uses to exchange favors for organizational purposes”
examines how this phenomenon influences firm performance in china. Guanxi shares similar
characteristics with the notion of social capital, as both deal with the resources that are gained
and leveraged via social connections. This study found that guanxi does indeed have a positive
effect on market performance, as measured by sales growth and market share.
An added benefit of the networks-based measurement approach allowed for
empirically testing for the presence of these coalitions while learning about them. Ronchetto,
Hutt and Reingen (1989) continued with the networks approach to studying organizational
purchasing decisions. They found empirical support for the idea that organizational actors
receive influence from the position they occupy in the buying system and structural position
and influence in the buying system were positively related. This particular study examined the
network within the organization, measuring the centrality, distance from the dominant
reference group (i.e. top management or other main center of influence), and distance from the
organizational boundary (boundary-spanning personnel). They combined analysis of these
network structure variables with variables indicating formal rank and departmental
membership of the organization. The dependent variable of influence was measured by how
often the actors were sought out for advice and how often they were included in decision
making discussions.
A networks approach has also been used to examine marketing strategy formulation.
Hutt, Reingen, and Ronchetto (1988) traced emergent processes in marketing strategy
formulation to identify key players in the organization. They were particularly interested in
managers who engaged in autonomous strategic behavior, where an individual acts as a change
agent for promoting a new strategy. They traced the communications patterns that emerged
during the marketing strategy formulation process for a set of new products and analyzed the
effect that certain roles played in developing and implementing the strategy through time.
Certain roles, such as the managers who engaged in autonomous strategic behavior, were
42
found to be fundamental in implementing a new marketing strategy. Houston et al. (2001)
presented a case study where they followed a firm’s efforts to enter a new technology market.
They found that the manager’s social structure influenced the marketing strategy independently
of the organizations formal structure, providing more evidence that just examining people
based on their attributes (i.e., title according to an organizational chart) cannot convey the true
nature of that individual’s influence within the organization.
The literature has also explored network effects on marketing strategy in a more
general sense. Corporations must be aware that they do not conduct business in a vacuum;
they must pay close attention to other companies operating in their same market. Ritter (1999)
examined how firms should use their networks to get a competitive advantage by identifying
the antecedents to a concept called “network competence”. This network competence is
basically the ability of the firm to leverage its network resources. He proposes that some
companies are better at doing this than others due to their: availability of resources, network
orientation of human resource management, integration of intraorganizational communication,
and openness of corporate culture (p. 471). Organizations that operate in markets with
network externalities must also be aware of the effect that this phenomenon has on their
strategic decisions. A network externality exists when a customer’s utility for a product
increases as the number of customers who use identical or compatible products increases
(Gupta, Jain et al. 1999; Srinivasan, Lilien et al. 2004). These externalities can have real
implications for business. For example Srinivasan, Lilien, and Rangaswamy (2004) found that
network externalities significantly decrease the survival duration of marketplace first entry
pioneers. This is especially relevant for high technology products. For example if you are the
only person you know with a computer and access to the internet, your utility will be much
lower than if you know many other people with that same technology. If you have no one else
to email and share links to interesting websites with, your enjoyment and value will be derived
only from what you experience. Likewise, if you are the only person with a fax machine, there
will be no one else to send or receive faxes from. When high definition televisions were
released, consumers who owned these televisions could only experience the high definition
feature on the limited number of channels that offered that technology. Network externalities
alter consumer behavior, as it is rational for a consumer to wait for a critical mass of others to
adopt the technology before they make the purchase. A good example of this can be seen in
the recent battle for high-definition video format between Blu-Ray and HD DVD (Block 2005).
Consumers were offered a choice of both in the marketplace, but both formats required

43
different DVD players. Early-adopting consumers who wanted a high definition option were
forced to make a choice between the two technologies, knowing that there was a risk that their
chosen format might not be the one to survive. The survival of the technologies depended not
only on the production and purchase of the hardware, but also on the movie production
companies’ adoption of a given format for release of their movies. While many consumers risk
their chosen technology becoming outdated, á la the VHS vs. Beta war of the late 1970’s and
1980’s, others rationally waited until the market declared an eventual winner. The Blu Ray and
HD DVD manufacturers were at least partially at the mercy of the network externalities.
Distribution Channels
While the organizational literature focuses on the networks relationships within and
between firms with the level of analysis on the individual, distribution channels literature looks
at these relationships on the level of the group. The application of networks theory to the study
of distribution channels makes logical sense. These relationships often have a profound effect
on the ability of the company to deliver a valuable product or service to the end consumer.
Instead of studying these relationships at the attribute level, networks theory allows
researchers to examine these transactions on a relationship level. Even going back to the
1970’s, we find that channels researchers were exploring the effect of the greater relational
network on channel behavior. For example, Czepiel (1974) studied the behavioral process of
word-of-mouth diffusion of major technological innovations in industrial markets. A significant
finding of the study was the confirmation that an informal social community linking the
marketplace firms did in fact exist. Participants in the marketplace leveraged their friendship
relationships to seek information regarding the market. It is worth noting that this may be the
first identified use of sociometric techniques in the marketing literature.
Because business moved away from the adversarial buyer-seller relationship described
by Porter (1985) towards a cooperative networked relationship where there is mutual benefit
for both parties, including more advanced information professing, knowledge creation, and
adaptation capabilities (Achrol and Kotler 1999; Kothandaraman and Wilson 2001). With this
revolution, distribution channels researchers became interested in exactly how these
relationships with outside parties affected the business environment. Early researchers
(Achrol, Reve et al. 1983) presented the argument that it was necessary to supplement the
political economy approach to studying marketing channel dyads (Stern and Reve 1980) by
incorporating factors external to the dyad. These researchers looked at the context in which
dyadic relationships took place, where companies were working together to manage the flow of

44
goods and services through the supply chain. When researchers looked beyond the dyadic
relationship, they realized that the initial, dyadic relationship was dependent on the relationship
that those firms had with other firms, the relationships of those ancillary firms, and so on
throughout the environment (Anderson, Hakansson et al. 1994). Skinner and Guiltinan (1985)
studied the determinants of control within a distribution channel. They looked at the
mechanisms managers in a manufacturer-distributor channel might use to affect dyadic control
by influencing the power-dependence relationship between the parties. Their main finding was
that the distributors could affect their dependence on the upstream manufacturers by utilizing
resources in their network environment. By acquiring information and resources from others in
their environment, such as trade associations, or by purchasing from a secondary supplier, the
dealers were able to reduce their dependence on the manufacturer.
Rindfleisch and Moorman (2001) used network theory to examine how different forms
of alliances, and the ties within those relationships, may affect customers. Specifically, they
looked at how firms get and use information in new product alliances within horizontal (with
competitors) versus vertical (channel partner) relationships. They found that these
relationships differed in both the structure of relationship between the parties and the
motivations of the individuals involved in those relationships. These differences affected
cooperation between the parties, along with the way that information was acquired and used.
This finding is rooted in the fact that relationships between competitors and relationships
between vertical channel partners are fundamentally different. At the core of the matter,
companies are more reluctant to share information with competitors. The same authors
explored this topic again in 2003 with a longitudinal study on interfirm cooperation. Though
firms must sometimes look to other to fill needs for providing value to end consumers and
partner to offset the risks and costs of new product development, there is the possibility that
this cooperation between competitors could have a detrimental effect on end consumers.
Rindfleisch and Moorman (2003) found that firms which cooperate horizontally with
competitors became less consumer oriented over time, whereas this effect was not found for
firms that cooperate vertically with channel members. The behavioral and structural
mechanisms affect this relationship between alliance type and customer orientation.
Specifically, firms with weak ties to competitors with which they collaborate had a greater
decrease in customer orientation than those with strong ties to competitors. The loss of
customer orientation was moderated by the presence of a third party monitor, such as a
45
government agency. Firms that collaborate with competitors where these monitors are present
had a smaller decrease in customer orientation than those without.
Wathne and Heide (2004) also explored the effect on end consumers of firms’ upstream
relationships. They found that a firm’s strategy towards its downstream relationships is
contingent on how the upstream relationships are organized. The ability of a firm to show
flexibility towards its downstream customers under conditions of uncertainty in the final end
consumer market was shown to be dependent on the governance mechanisms (supplier
qualification programs and incentive structures based on hostages) that had been used in the
firm’s upstream supplier relationship. Similarly, Wuyts et al. (2004) examined how buyers in a
supply chain consider the network of ties between the vendor, supplier, and buyer, looking
beyond their direct dyadic interaction with a vendor. These findings support the value of
assessing the distribution channel from a network perspective. Mishra, Heide, and Cort (1998)
found that the strategies a firm uses to manage its relationships with end consumers influences
how a firm manages its employee relations.
Antia and Frazier (2001) explored the network factors that affected the severity of the
enforcement response to explicit contract violations. They found that density of the network
was negatively related to contract enforcement, and the centrality of the agent was inversely
related to contract enforcement. Principals judge how agents and their networks will react to
the enforcement response and they fear retaliation when enforcing in dense networks or when
dealing with very central agents. However, this fear of retaliation is tempered by the positive
signaling effects to the network as a whole when the principal decided to make ‘an example’
out of a prominent agent by punishing them. Overall, principals need to balance the needs of
the network as a whole, while also working to maintain key relationships.
While Antia and Frazier (2001) focused on violations by agents, the possibility of
violations by the principals must also be considered. Heide and John (1988) found that the
actions agents engage in with end consumers can affect the actions of their principals. In
particular, an agent’s bonding efforts with customers can discourage opportunism by principals,
as the principal would be risking the relationship with the end consumer if they acted
opportunistically against their agent. Dahlstrom and Ingram (2003) took a conceptual approach
to analyzing how an agent’s relationships may affect the possibility of adverse selection by a
principal. Adverse selection arises when a principal makes a less than ideal selection of an
agent. Before contracting with an agent, the principal desires to gather as much information
about an agent as it can to alleviate the information asymmetry problem. The information

46
asymmetry problem is inherent in the principal agent relationship because, before contracting,
the principal must rely on information provided by the agent to make their assessment of the
ability of the agent to perform the necessary task. Principals can evaluate the agent’s abilities,
but Dahlstrom and Ingram (2003) present an argument that the principal can also use network
theory to help in decision making. They identified that principals can screen an agent’s social
network, along with evaluating their abilities, as a method of evaluating potential agents. The
network properties of that agent’s network affect the cost of the search that a principal must
incur. For example, a principal will incur lower costs to search the network of an agent with a
very dense network. The greater density means that the principal will be able to access a
greater proportion of the agent’s network with fewer steps. A denser network means that the
agent’s connections are more closely intertwined with one another. In addition, if that agent
has a network with relatively stronger ties, the principal will be able to get better information
about that agent. The same holds if the agent has many multiplex ties, or ties between people
on several different levels. An example of a multiplex tie is if the agent had a tie that they both
took classes with, socialized outside of work with, an0d with whom they ate lunch. These
multiplex ties will be a more valuable source of information for the principal because multiple
ties will know more about the agent than someone with just one type of connection to them.
This work indicates an interaction between the structure of the agent’s network and the
process and influence on costs that a principal incurs to reduce pre-contractual information
asymmetry.
Gap in the Literature
Networks based consumer studies have mostly focused on exploring the networks
properties that may influence consumer choices (e.g. Bearden and Etzel 1982; Reingen, Foster
et al. 1984; Reingen and Kernan 1986; Frenzen and Nakamoto 1993; Henderson, Iacobucci et al.
2002; Amaldoss and Jain 2005; Hill, Provost et al. 2006). Organizational studies explore the role
of the network in both organizational purchasing (e.g. Bristor 1988; Ronchetto Jr, Hutt et al.
1989) and marketing strategy (e.g. Hutt, Reingen et al. 1988; Gupta, Jain et al. 1999; Ritter 1999;
Srinivasan, Lilien et al. 2004). Channels literature considers both communication within the
networks (e.g. Czepiel 1974; Money, Gilly et al. 1998) and relations (e.g. Skinner and Guiltinan
1985; Anderson, Hakansson et al. 1994; Mishra, Heide et al. 1998; Antia and Frazier 2001)
within the marketing channels of distribution. Research has shown that the sociometric
structure of the network may influence the decisions that you make (e.g. Reingen, Foster et al.
47
1984; Bristor 1988; Ronchetto, Hutt et al. 1989; Ward and Reingen 1990; Rindfleisch and
Moorman 2001; Rindfleisch and Moorman 2003; Hill, Provost et al. 2006; Van Den Bulte and
Joshi 2007). Studies have also demonstrated that individual psychometric characteristics may
influence network outcomes (e.g. Hutt, Reingen et al. 1988; Sirsi, Ward et al. 1996; Amaldoss
and Jain 2005). More research that combines several techniques, including incorporating
qualitative methods to support quantitative methods (e.g. Anderson, Hakansson et al. 1994;
Rindfleisch and Moorman 2003) would add value by providing convergent validation (Campbell
and Fiske 1959). However, there is a lack of evidence relating networks measures to business
performance outcomes, with just a few rare exceptions (Gu, Hung et al. 2008). This gap leaves
considerable questions to be answered regarding the bottom line effect that network
properties may have on a business’s balance sheet. This follows the general call in the
marketing literature to link marketing activities to bottom line business performance outcomes
(Lehmann 2004).
Thoroughbred Pricing Studies
A common method for selling young Thoroughbreds is the use of public auction. Each
year, approximately 27% of the foal crop produced are sold at auction as yearlings, including
16% at the Keeneland September Sale (The Jockey Club 2009). A yearling is a one-year-old
horse. Thoroughbred buyers come to the sales in the hopes of selecting a winning racehorse.
In order to do this, they enlist the help of expert third-party agents, along with gathering as
much pertinent information they can from industry publications. However, there are no
guarantees when making purchases. There is no way to determine with certainty if a particular
yearling will go on to be a great (or even decent!) racehorse. Recent research suggests that
approximately 10-20% of speed is heritable, and handicap and earnings measures are
approximately 30-40% heritable (Richard, Bruns et al. 2000; Thiruvenkadan, Kandasamy et al.
2009). A horse with an outstanding pedigree and impeccable confirmation (physical structure)
may not win any races. Look to the example of ‘The Green Monkey’, who boasts the world
record for the highest price paid for a racehorse at public auction. In 2006, John Magnier paid
$16 million dollars for the horse at the Fasig-Tipton Florida Select sale of two-year-olds in
training at Calder Race Course. In his lifetime, ‘The Green Monkey’ earned only $10,440 on the
track and placed in only one race (Biles 2008). Only about 40% of yearlings sold at auction earn
more in racetrack earnings than their initial purchase price, with approximately 5-6% winning
any type of stakes race (Heckerman 1996). Higher priced horses do earn more money on the

48
track relative to lower priced horses and are far more likely to win a stakes race. Even so, these
higher priced horses are less likely to earn more than their purchase price. In fact, less than
10% of yearlings that sold for $100,000 or more earn more than their purchase price
(Heckerman 1996).
Buyers and their third-party expert agents use available information to assist in
overcoming adverse selection and choose a horse that they believe will have a promising
chance of winning. Information is available via free published ‘catalog books’ provided by the
auction house, along with supplemental auction guides available for purchase, in addition to
information provided by industry experts. Third party experts, known as bloodstock agents and
veterinarians, are often hired to assist the buyer in their purchasing decisions. Yearlings are at a
limited stage of physical development, so their assessment is thought of as more of an art than
a science. Purchasers must use the characteristics of the yearling’s sire (father) and dam
(mother), the performance of his siblings and half siblings, along with other characteristics such
as month of birth or sex of the yearling to make their best determination of the quality of the
yearling.
Pedigree has long been used to determine the relative potential of a young horse as a
racehorse. According to Donald Lesh (1978), of all Thoroughbreds born in North America,
Ireland, Great Britain, and France, there is a ratio of one top-class winner per 1,000 foals and
five pattern race winners per 1,000 foals. A top-class race is defined as a “Group 1” or “Grade 1”
race, the highest caliber of racing competition. A pattern race is defined as a Group or Grade 2
or 3 race- not quite as intense competition as a Grade or Group 1, but still elite level
competition. Since the end of World War II, 75% of top-class winners have been sired by horses
who also won a top-class race. If sires who didn’t win a top-class race themselves but who have
already sired a top-class winner are added to this group, we can identify a set which accounts
for 98% of the top-class winners and 80% of all pattern race winners. Among this group of sires
who have themselves won a top class race or have already produced a top class winner, the
odds of producing a top class or pattern winner go up significantly. This group shows a
significantly higher performance rate than the general population, with 27 pattern winners per
1,000 foals and 7 top class winners per 1,000 foals (Lesh 1978). This is evidence of the power of
selective breeding- earnings and speed have been shown to be an inherited trait (Bowling
1996).
Most of the literature identifying antecedents to auction sales price of thoroughbreds
utilizes a hedonic price regression as the standard econometric methodology. In general,
49
yearling price is determined through a combination of phenotypic (physical build/confirmation
and movement) and non-phenotypic variables. While conformation and movement surely
influence price, there is no generally accepted system for measuring phenotypic variation, and
as such this variable is absent in the literature (Commer 1991). Non-phenotypic variables
include a combination of variables including the pedigree, sex, age, stakes nominations, day of
sale when horse is sold (book placement), yearling veterinary records, and seller type (Commer
1991; Buzby and Jessup 1994; Chezum and Wimmer 1997; Chezum and Wimmer 2000; Robbins
and Kennedy 2001; Vickner and Koch 2001; Kane, McIlwraith et al. 2003; Kane, Park et al. 2003).
Macroeconomic factors have also been found to influence sale price (Commer 1991; Karungu,
Reed et al. 1993; Buzby and Jessup 1994; Neibergs and Thalheimer 1997).
The discussion of control variables will be broken up into three sections. First,
individual level yearling specific variables will be discussed. Then, macroeconomic factors,
followed by seller side effects, will be considered.
Yearling Variables
Commer (1991) examined the price determination factors in the mid-Atlantic market for
Thoroughbred yearlings. His sample includes 812 yearlings sold by the Fasig-Tipton midatlantic
sale from 1987-1989. He found that on the sire’s side, the number of black type progeny
positively influenced price. On the female side of the pedigree, the dam’s racing earnings, the
number of black type horses she has produced, and the number of black type horses from the
second dam also positively influence price. In addition, male horses, foals born in January or
February, horses who were nominated to the Breeders Cup or Maryland Millions Stakes races,
horses who were registered Maryland bred, and horses sold in the Select portion of the sale all
commanded relatively higher prices. Buzby and Jessup (1994) constructed a model testing for
the effects of macroeconomic variables on yearling sale prices, but they also performed analysis
on yearling specific variables. Using only these yearling variables, they found that the yearlings’
sex, the number of dams’ black type offspring, sire stud fee in year sold, and sire racing history
were significant influencers. Interestingly, they found that the month in which the yearling was
born was not significant, in contrast to Commer (1991). When a log-linear regression was
utilized instead of a linear regression, yearling sex and sire’s racing history were not significant,
indicating a lack of stability for these variables. When combining macroeconomic factors with
yearling specific variables, interest rate, dollars in gross foreign purchase, sire stud fee in year
50
yearling is sold, month yearling foaled, and dam black type offspring were found to be
significant.
Chezum and Wimmer (1997) were mostly concerned with testing for adverse selection
in the yearling market, and they included yearling specific variables in their model. They found
that dams’ offspring average earnings, sire stud fee in year bred, the presence of other
successful crosses of the sire and dams’ families, and age were all significant. In addition, they
found that colts, horses who are “Derby Eligible” based on their dosage index and center of
distribution, and yearlings who represent their sires’ first crop of yearlings also brought
significantly higher prices. (The dosage index is a technique for classifying Thoroughbred
pedigrees by type. It reflects the ratio of speed-to-stamina in a pedigree. Center of distribution
is another number assigned to each yearling that is an indication of the distance that a horse
should be able to run. The term “Derby Eligible” is based on the notion that horses with a
dosage index of more than 4.00 are not believed capable of running well at the distance of the
Kentucky Derby, or 1.25 miles.) The yearling being the dam’s first foal was not significant, and
yearlings born out of state received a significant premium in relation to Kentucky-foaled horses.
Robbins and Kennedy (2001) utilize a smaller, regional market for yearlings, the British
Columbia market. They use data from 1985-1997 and find evidence in line with previous
studies. They found that relatively older yearlings bring higher prices and colts bring more than
fillies. Sire stud fee was found to be the best variable to capture the influence of the sire on
sale price, while dam progeny performance and not the performance of the dam herself
influences price. The dam’s black type offspring were more influential than the extended family
black type.
Neibergs (2001) looked specifically at broodmare characteristics in three categories-
breeding, racing, and genetics (pedigree). Overall, breeding characteristics (the mare’s ability to
produce high quality horses) had the strongest effect, followed by racing characteristics (her
abilities as a racehorse) and, finally, genetic characteristics (her sire, dam, and siblings).
Unproven mares were found to command a premium.
Vickner and Koch (2001) found positive significant effects for if the yearling was sold in
the “Select” portion of the sale, sire’s stud fee (composite of year yearling was bred and year
yearling sold), racing success of the yearling’s half siblings, the number of stakes winners based
on the same cross of sire and dam’s families, and if the foal was born in Kentucky. Relatively
older yearlings brought higher prices, while a greater number of progeny offered in the sale by
the same sire had a negative effect on price. They also found that the number of repository
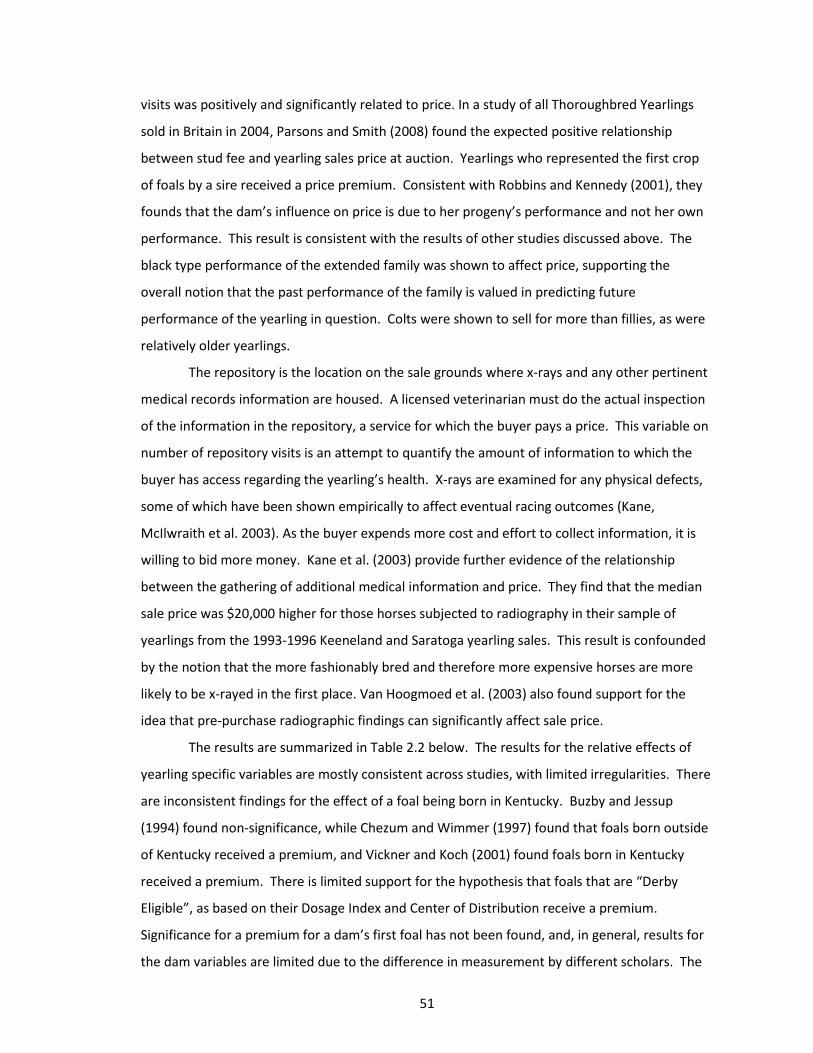
51
visits was positively and significantly related to price. In a study of all Thoroughbred Yearlings
sold in Britain in 2004, Parsons and Smith (2008) found the expected positive relationship
between stud fee and yearling sales price at auction. Yearlings who represented the first crop
of foals by a sire received a price premium. Consistent with Robbins and Kennedy (2001), they
founds that the dam’s influence on price is due to her progeny’s performance and not her own
performance. This result is consistent with the results of other studies discussed above. The
black type performance of the extended family was shown to affect price, supporting the
overall notion that the past performance of the family is valued in predicting future
performance of the yearling in question. Colts were shown to sell for more than fillies, as were
relatively older yearlings.
The repository is the location on the sale grounds where x-rays and any other pertinent
medical records information are housed. A licensed veterinarian must do the actual inspection
of the information in the repository, a service for which the buyer pays a price. This variable on
number of repository visits is an attempt to quantify the amount of information to which the
buyer has access regarding the yearling’s health. X-rays are examined for any physical defects,
some of which have been shown empirically to affect eventual racing outcomes (Kane,
McIlwraith et al. 2003). As the buyer expends more cost and effort to collect information, it is
willing to bid more money. Kane et al. (2003) provide further evidence of the relationship
between the gathering of additional medical information and price. They find that the median
sale price was $20,000 higher for those horses subjected to radiography in their sample of
yearlings from the 1993-1996 Keeneland and Saratoga yearling sales. This result is confounded
by the notion that the more fashionably bred and therefore more expensive horses are more
likely to be x-rayed in the first place. Van Hoogmoed et al. (2003) also found support for the
idea that pre-purchase radiographic findings can significantly affect sale price.
The results are summarized in Table 2.2 below. The results for the relative effects of
yearling specific variables are mostly consistent across studies, with limited irregularities. There
are inconsistent findings for the effect of a foal being born in Kentucky. Buzby and Jessup
(1994) found non-significance, while Chezum and Wimmer (1997) found that foals born outside
of Kentucky received a premium, and Vickner and Koch (2001) found foals born in Kentucky
received a premium. There is limited support for the hypothesis that foals that are “Derby
Eligible”, as based on their Dosage Index and Center of Distribution receive a premium.
Significance for a premium for a dam’s first foal has not been found, and, in general, results for
the dam variables are limited due to the difference in measurement by different scholars. The
52
overall consensus seems to be that it is the performance of the dam’s offspring and not her own
performance that influences the price of her yearling offspring at auction.
Macroeconomic Factors
Lawrence (1970) appears to be the first work in the literature examining factors
affecting auction prices of equines. His findings suggested that racing purses available, quantity
of yearlings auctioned, and national income had a significant impact on price brought at
auction. Karangu, Reed, and Tvedt (1993) examined the macroeconomic factors that may
influence sale price at yearling auctions and found that the overall racing purse rate, the
exchange rate, and the nominal interest rate all significantly influenced price. It is important to
TABLE 2.2
Summary of Yearling Pricing Studies
Commer (1991)
Buzby and
Jessup (1994)
Chezum and
Wimmer (1997)
Vickner and Koch
(2001)
Robbins and
Kennedy (2001)
Parsons and
Smith (2008)
Sire Stud Fee
+ + + + + Sire Racing History n/s +
Sire Black Type Progeny + Sire Progeny Earnings n/s Sire # Progeny in Sale
-
-
Sire # Progeny Wins n/s Freshman Sire
+ n/s
+
Dam Racing Earnings +
n/s n/s Dam # winners n/s
Dam Black Type Progeny + + Dam Progeny Earnings
+ + + +
Dam Extended Family Black Type +
+ +
Dams First Foal
n/s Colt + + + n/s + +
Month Foaled + n/s + + + + Stakes Nominations +
Select Portion of Sale +
+ "Derby Eligible"
+ n/s
Foal born in KY
n/s - + Prior successful "nicks"
+ +
Number of repository visits
+

53
consider such macroeconomic factors since a significant portion (35%) of yearlings sold at the
largest yearling sales in the United States (Saratoga and Keeneland) were purchased by foreign
investors. In fact, this foreign investment represented 53% of the total gross at those sales
(Karungu, Reed et al. 1993). Using a sample of 3,027 yearlings sold at the Keeneland “Select”
sales between 1980 and 1990, Buzby and Jessup (1994) combined the study of yearling specific
and macroeconomic variables to examine the total effect on the market. They performed three
separate regressions: one using only macroeconomic factors, one using only yearling specific
variables, and one using both macroeconomic and yearling specific variables. For the
macroeconomic regression, they found that the year of the sale, a variable representing yearly
gross purchase in dollars at the Keeneland Select sales from foreign investors (Ireland, England,
Japan, France, and Canada), and the interest rate all significantly influence sales prices. In the
third regression, which combined macroeconomic factors with yearling specific variables,
interest rate, dollars in gross foreign purchase, sire stud fee in year yearling is sold, month
yearling foaled, and dam black type offspring were found to be significant.
Neibergs and Thalheimer (1997) also examined macroeconomic variables using data
from yearling sales from 1960-1994 and found that, on the supply side, the number of foals, the
average price of a yearling at auction, and tax benefits from investments in broodmares all
positively affected the supply of yearlings. The farm production cost index negatively affected
yearling supply. On the demand side, the tax benefits from investment in yearlings, the average
purse per race in North America, the gross foreign purchase, and gross domestic product were
all positive and significant influencers on demand. The total number of yearlings had a negative
relationship to demand.
Seller-Side Effects
Chezum and Wimmer (1997) examined the effect that the breeder of the horse may
have on yearling sales price. They test for the presence of adverse selection in the
Thoroughbred yearling market by looking at sale price differences for breeders of
Thoroughbreds who race horses themselves versus breeders who do not race. It is posited that
breeders who also race will keep the best horses for themselves and sell the inferior stock at
auction. This is thought to be because the breeders have an information advantage, as they are
intimately aware of the qualities of the yearling from the time of its birth and are therefore
believed to be better equipped to determine which yearlings will be better racehorses. The
adverse selection hypothesis is expected to hold because, if breeders are retaining their best

54
animals, then the buyers who buy their produce at auction are thought to get lower quality
stock. Adverse selection would suggest that buyers will be aware of this, so breeders who race
will receive lower prices relative to breeders who do not race.
Using data from the 1994 Keeneland September yearling sale, Chezum and Wimmer
(1997) found evidence for adverse selection, finding that breeders who race do in fact get
relatively less money for their stock. In 2000, Chezum and Wimmer (Chezum and Wimmer
2000) revisited their adverse selection hypothesis, this time looking at the problem in relation
to betting on Thoroughbred races. They found that homebreds, horses that are kept by their
breeder for racing, are favored over non-homebreds in races where bettors have very little
information upon which to base their predictions- namely, races for two year old maidens.
These are young horses that are just beginning their racing careers and have never won a race.
As such, bettors must look to other information upon which to base their decisions, including
the fact that the breeder of the horse has retained that animal for racing. This is thought to add
evidence to the hypothesis that breeders keep their best stock for racing, as the bettors are
posited to be aware of this idea and thus use this information for making their bets.
Vickner and Koch (2001) construct a hedonic hammer price model using a sample of
212 horses from the 1999 Keeneland September sale. They wished to reexamine the adverse
selection hypothesis of Chezum and Wimmer (1997; Chezum and Wimmer 2000). They found
no evidence for adverse selection- the racing intensity of the breeder was an insignificant
influence on price brought at auction. Wimmer and Chezum (2003) extended their research on
adverse selection in the auction market by taking a random sample of 10% of all Thoroughbreds
born in the United States in 1993. They examined the effect of third-party certification via
inclusion into a “Select” sale in alleviating problems of adverse selection. In order to be offered
for sale in a Select sale, yearlings must be chosen for inclusion by the auction company. The
auction company first makes a selection based on the pedigree of the yearlings and then
physically examines each animal to ensure that they meet the quality criteria for inclusion. The
act of being offered in a Select sale will indicate to buyers that the horse in question meets
certain criteria and should offer the potential buyer evidence that this animal is not being
offered for sale by the breeder because it is not of high enough quality to be retained for racing
by the breeder. The buyer is assured that this animal is not a “cull” of the breeder’s stock.
They found evidence for adverse selection in non-Select sales, with no evidence of adverse
selection in Select sales by looking at the sales data for breeders who race vs. breeders who do
not race and comparing the dollars brought at auction. They confirmed these results by looking
55
at the racetrack performance of this cohort of yearlings. This further evidence confirmed that
third-party certification via inclusion into a Select sale alleviates the problems of adverse
selection.
Gap in the Literature
There are multiple examples of Thoroughbred pricing variables that have not
consistently found support in the literature. For example, while Buzby and Jessup (1994) found
that sire racing history was associated with yearling sale price, Commer (1991) found that
variable to be non-significant. The dam’s racing earnings were shown to have an effect on
yearling sale price by Commer (1991) both Robbins and Kennedy (2001) and Parsons and Smith
(Parsons and Smith 2008) did not find this effect. Another disparate finding involves the state
of the yearlings’ birth. Buzby and Jessup (1994) found that being born in Kentucky was not a
predictor of yearling sale price, while Chezum and Wimmer (1997) found this variable to have a
negative effect on price and Vickner and Koch (2001) found this variable had a positive effect on
price. These are just a few examples of studies that have not found consistent results. This
study will revisit these variables studied in prior literature and provide further evidence for the
significance or non significance of these variables as predictors of yearling auction price. This
research uses a sample from the largest Thoroughbred marketplace for yearlings in the world.
With a sample size of 3,605, representing approximately 65% of the total transactions in the
marketplace, this study will revisit the conflicting findings in the Thoroughbred pricing literature
thus far.
Chapter Summary
The purpose of this chapter is to synthesize agency theory, signaling, and social
networks research in marketing and to provide a basis for integrating these research streams.
Chapter three develops a series of empirically testable hypotheses related to market signaling
and network relationships to business performance outcomes.
Copyright © Emily J. Plant 2010
56
CHAPTER THREE: RESEARCH MODEL AND HYPOTHESES
Introduction
The marketing literature is currently undergoing a general shift towards viewing
relationships beyond the one-to-one dyadic perspective. Scholars view market organizations
not just as singular organizations operating independently but as networks of specialized firms
tied together in cooperative exchange relationships (e.g. Achrol 1997; Achrol and Kotler 1999;
Möller and Halinen 1999). Viewing a firm as a link in a greater network of firms operating in a
given environment can provide a unique perspective for examining questions, particularly in the
context of channels of distribution where firms must necessarily connect in order to move a
product from the point of initial production to the final end user.
The particular phenomenon of interest here is the concept of market signaling. Signals
convey a direct or indirect indication of intentions, motives, goals, or even internal situation and
convey information to other actors in the marketplace (Spence 1974; Porter 1980). The
marketing literature has focused research on the theory of signaling to explain how one party
can communicate to another about unobservable product quality and help to overcome the
problem of adverse selection (Kirmani and Rao 2000). This research will focus on the role of
third-party agents in marketplace signaling phenomena. These agents act as liaisons between
buyers and sellers in the marketplace, and their role in signaling and subsequent effect on
business performance outcomes has been scarcely considered in the marketing literature.
Building on the discussion of market signaling as a network phenomenon involving third-
party agents acting as links between buyers and sellers, this chapter will develop a series of
empirically testable hypotheses relating market signaling and network relationships to business
performance outcomes. This discussion is developed in three steps. First, the qualitative
approach to theory development will be discussed. Then, the theoretical model will be
developed and clarified. Finally, the set of hypotheses to be tested will be specified. In
addition, the set of control variables will be presented that will help isolate the effects of
market signaling and network variables on business performance outcomes.
Qualitative Approach
Beginning a quantitative study with a qualitative study can yield insight beyond what is
traditionally known about the problem. By conducting a qualitative study prior to collecting the
57
quantitative data, it is possible to get a grounded theory of the phenomena of interest. The
grounded theory approach (Glaser and Strauss 1967) is a technique for discovering the concepts
and hypotheses relevant to a problem and developing a theory which accurately fits the data.
While traditional research works to verify theories, this grounded theory approach emphasizes
the generation of new theory which is intimately linked with the data and hopefully perfectly
fits the question at hand (Glaser and Strauss 1967). While many theories currently exist seeking
to explain market signaling and networks phenomena, none have been specifically designed to
relate signaling processes and network relationships.
The grounded theory approach is a set of techniques for identifying categories and
concepts that emerge from text and linking those concepts into formal theories (Glaser and
Strauss 1967; Bernard 2006). Interview transcripts are examined for analytic categories, or
themes. The data from those categories are compared and contrasted with other information
obtained in the interviews. Traditionally, the results of the analysis are presented using
exemplars, or quotes from the interviews, which clarify the theory.
In the context of a specialized professional world such as the one of interest in this
study, it is important to be able to see the market from an “insider’s” point of view. Industry
professionals tend to use specific and highly specialized vocabulary to describe the world in
which they work. Goodwin (1994) advocates the use of anthropological field study to
investigate the practices of members of a professional field. Using this approach, one can find
the “theories, artifacts and bodies of expertise that are its special domain of competence and
set it apart from other groups” (Goodwin, p. 1). In short, Goodwin advocates integration into
one’s field of interest in order to get an insider’s point of view, allowing the researcher to
perceive and define the events that take place within a professional’s world. My approach
involved: extensive qualitative observation and documentation of industry professionals in the
marketplace; widespread reading of the most popular industry publications; recorded
interviews; and direct participation in the marketplace as a hired member of a professional
group.
Qualitative Findings
The first approach involved observation, documentation, and interviewing of industry
professionals as they participated in the marketplace. Nineteen interviews were conducted,
ranging in time from 5 minutes to 47 minutes. Along with verbal interviews, photographs and
video were collected to document the processes that took place at the sale. These pictures

58
were then reviewed and used as evidence to observe the phenomena that emerged from the
verbal interviews. These interviews were recorded and transcribed, and the grounded theory
approach was followed for analyzing the findings. Three main themes were identified by
categorizing key statements made in interviews into broad categories:
1. Information is king. The gathering of information about the happenings in the
marketplace is of paramount importance to professionals. Many of them described this
information gathering as a main duty of their job. They watch the goings on to make
determinations of who they think is interested in their products, and how interested.
Knowing this information allows them to make determinations of, for example, the
reserve price they should put on their goods since all goods in this marketplace are sold
at auction. One seller summarized this phenomenon whereby the actions of market
participants can be used by other market participants to drive demand for a certain
good:
“The trainer, agent, owner, and vet may all come and take a look. You have to
watch the action at your barn. Once a few big time people see your horse, the
buzz gets out and all of the sudden everyone wants to see them.”
While this quote provides evidence of the positive effects that participant action can
have in signaling market demand, there can also be negative signaling effects.
“If one vet gives your horse the rejection decision, then the word gets out and
you’re screwed.”
This theme captures the concept of market signaling as a way of disseminating and
gathering information. Hypotheses for testing signaling hypotheses will be explicated in
the overall model of the impact of market signaling phenomena on business
performance outcomes.
2. There is a general denial of the notion that one can quantitatively explicate what is
going on in the marketplace. Professionals reiterated that while the base price for a
product is partially determined by the quality of its inputs, it is the phenotypic qualities
of the product that truly determine price. For example, one professional noted,
“You can have the page (catalog page, pedigree), but if you don’t have the
goods (phenotypic qualities, physical build) you aren’t going to get the price.”

59
This statement was echoed by others:
“Pedigree will bring them in, but when you get the pedigree plus the
conformation, well that’s when fireworks happen.”
These phenotypic qualities, such as physical confirmation, are impossible to measure
quantitatively. Each animal is unique in its structure and qualities, and furthermore
every person has their own notion of what is “ideal”. Since these things cannot be
measured and quantified, professionals believed that little of the variance in business
performance outcomes could be deduced quantitatively.
However, it should be noted that many interviewees acknowledged the
existence of trends and fashionability in the marketplace, the aforementioned “page”
that can build the base price. For example:
“The market is willing to pay a lot for the hot goods.”
One goal of this research is to attempt to construct a model of the marketplace in
question that can explain auction prices based on quantitative variables. Results from
the model could provide evidence for the relative impact of the quantitative variables
versus the non-quantitative (phenotypic) variables.
3. Some professionals believed that the seller of the product did not matter much. They
believed that, overall, buyers will find the products that they want, no matter where
they are located.
“It doesn’t matter where it is, the buyers will find it. You could put it across the
street, outside of the sale grounds, and they would still find the nice ones.”
Additionally:
“While you always have the seller in the back of your mind, the individual
[product] trumps all.”
They believed that some sellers will get higher prices overall for their goods not because
they can leverage the brand equity of their name, but because their past performance
in the market will allow them to obtain better quality stock to sell in the first place.
“The big guys can publish that they had top sales, etc. last year. That way, they
end up with better stock.”

60
While they do not believe that the seller makes much of a difference, they do believe
that a seller with a bad reputation will be punished in the market.
“While I don’t pay attention to the seller much, there are some of them that I
know to stay away from. They’ve burned me in the past, and I’m not going to
make that mistake again.”
The question of the relative impact of the seller in the marketplace will be assessed in
this research. Hypotheses regarding the impact of third-party agents, which include the
sellers as mentioned above, will be tested.
As a final qualitative approach, a way to integrate myself into the professional world of
this marketplace, I obtained a job working for a seller in the marketplace. Becoming a
participant allowed a unique perspective that is unknown to most researchers. Building upon
my past experience of interviewing and observing marketplace participants, I was able to put
these observations into action and integrate myself into the daily life of the marketplace
participants. Working in the marketplace provided the unique opportunity to interact with
other participants and allowed for a level of trust to be built beyond what could be gained
simply as an outside researcher. I was invited to participate in daily activities which included:
appraisal of the goods (Thoroughbred Yearlings) upon arrival to the marketplace, showing the
goods and answering questions about them to potential purchasers, and participating in
company meetings to discuss market strategy and findings. Only by seeing a professional world
from the inside can you gain true professional vision and the ability to obtain the proper
perception and understanding of the structure of a specific profession (Goodwin 1994).
Model of Marketplace Signaling
Building upon the theoretical framework presented in Chapter Two and following on
the qualitative research presented above, a model of marketplace signaling will first be
presented. Signals convey information to marketplace participants regarding the unobservable
quality of a product. Whenever quality is unobservable prior to purchase, there is the risk of
adverse selection. Adverse selection, which is also known as the problem of hidden
information, occurs pre-contractually when the principal is unable to verify ahead of time that
the agent has the desired skills and qualities. Problems of hidden information also occur in the
61
consumer marketplace when the consumer is unable to verify the quality of a good prior to
purchase. The sending, receiving, and interpretation of signals is one potential way to
overcome the problem of adverse selection.
However, there is a general lack of empirical evidence for signaling hypotheses. While
some studies (e.g. Boulding and Kirmani 1993; Caves and Greene 1996; Erdem and Swait 1998;
San Martin and Camarero 2005; Biswas, Dutta et al. 2006; Erdem, Swait et al. 2006) have
offered empirical evidence where signals are shown to affect consumer purchasing outcomes, it
is certainly limited. In particular, there is a lack of empirical evidence linking signaling to
business performance outcomes.
Additionally, there is little literature on signaling that considers signals beyond a dyadic
relationship (e.g. Zhao 2000; Prabhu and Stewart 2001). There are many situations where a
signal does not affect just one sender and one receiver. This lack of evidence is particularly
relevant for this research setting, as this market represents a situation where buyer and seller
are not transacting directly to buy and sell goods. It is impossible to assess this marketplace
without considering the greater network context in which the transactions take place. In
addition to the condition that buyer and seller do not transact directly, the goods are also not
sold at a fixed price. There are several other examples of marketplaces with these conditions,
such as the stock market, the market for real estate, and markets for commodities such as
agricultural goods and natural resources.
In a marketplace where goods are not transacted between buyer and seller directly,
goods are not sold at a fixed price, and the quality of the goods is impossible to determine prior
to purchase there lies a great potential for adverse selection to occur. As such, buyers rely on
the advice of third-party agents to help in their decision making. Agents are called upon to
make evaluations of their opinion of the quality of the goods, and advise on the price they
believe should be paid. Agents interact with each other, and their opinions are influenced by
the actions of other agents. This model will provide the necessary framework upon which to
build an integrated model of marketplace effects of third-party agents on business performance
outcomes.
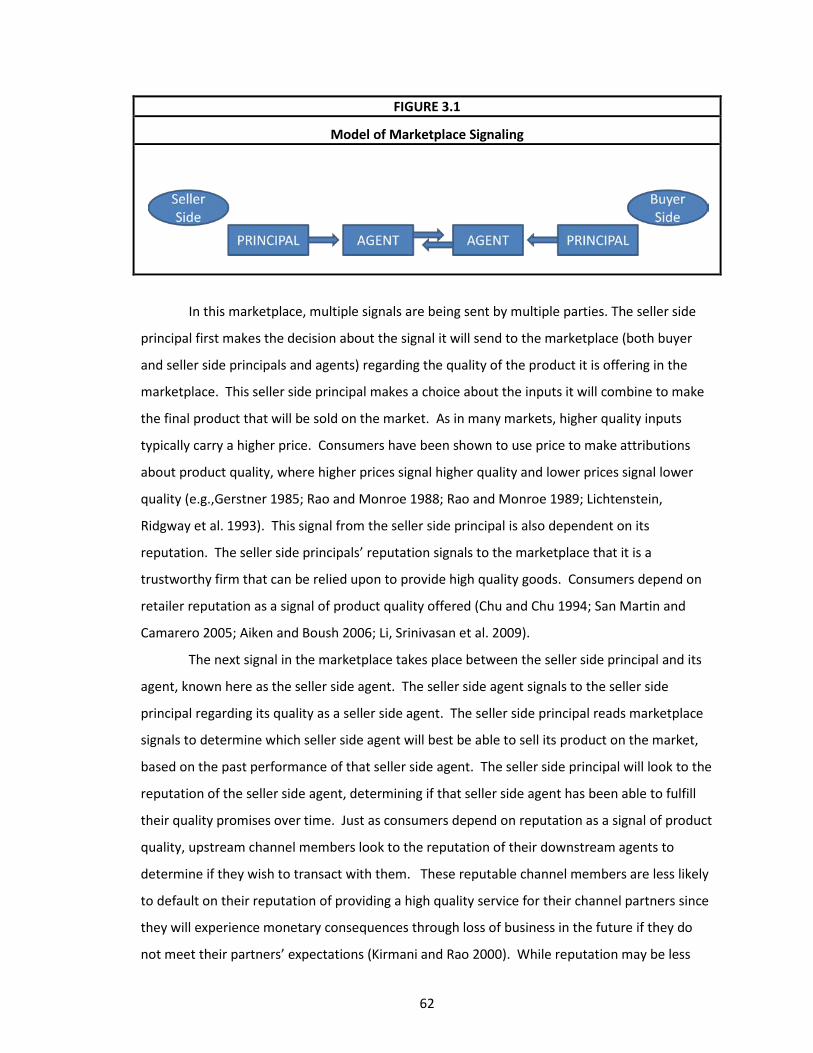
62
FIGURE 3.1
Model of Marketplace Signaling
In this marketplace, multiple signals are being sent by multiple parties. The seller side
principal first makes the decision about the signal it will send to the marketplace (both buyer
and seller side principals and agents) regarding the quality of the product it is offering in the
marketplace. This seller side principal makes a choice about the inputs it will combine to make
the final product that will be sold on the market. As in many markets, higher quality inputs
typically carry a higher price. Consumers have been shown to use price to make attributions
about product quality, where higher prices signal higher quality and lower prices signal lower
quality (e.g.,Gerstner 1985; Rao and Monroe 1988; Rao and Monroe 1989; Lichtenstein,
Ridgway et al. 1993). This signal from the seller side principal is also dependent on its
reputation. The seller side principals’ reputation signals to the marketplace that it is a
trustworthy firm that can be relied upon to provide high quality goods. Consumers depend on
retailer reputation as a signal of product quality offered (Chu and Chu 1994; San Martin and
Camarero 2005; Aiken and Boush 2006; Li, Srinivasan et al. 2009).
The next signal in the marketplace takes place between the seller side principal and its
agent, known here as the seller side agent. The seller side agent signals to the seller side
principal regarding its quality as a seller side agent. The seller side principal reads marketplace
signals to determine which seller side agent will best be able to sell its product on the market,
based on the past performance of that seller side agent. The seller side principal will look to the
reputation of the seller side agent, determining if that seller side agent has been able to fulfill
their quality promises over time. Just as consumers depend on reputation as a signal of product
quality, upstream channel members look to the reputation of their downstream agents to
determine if they wish to transact with them. These reputable channel members are less likely
to default on their reputation of providing a high quality service for their channel partners since
they will experience monetary consequences through loss of business in the future if they do
not meet their partners’ expectations (Kirmani and Rao 2000). While reputation may be less

63
important in signaling quality than brand name or price (Dawar and Parker 1994), reputation
may be the element that determines if communication via signaling will be effective (Herbig and
Milewicz 1994; Herbig and Milewicz 1994; Herbig and Milewicz 1996).
The choice that the upstream channel member (seller side principal) makes then, in
turn, signals to the marketplace about its opinion of the downstream agent (seller side agent)
with whom it chooses to consign it’s goods. This decision is very important to the seller side
principal, as they are entrusting this downstream partner to be their link to the end consumer,
and this seller side agent holds the responsibility of obtaining the highest price possible for the
seller side principal’s goods at auction. This relationship can be conceived as a co-branding
relationship of sorts. The seller side principal is entering into a relationship where the
downstream member will be selling the seller side principal’s good, linking the brand of the
seller side principal and the brand of the seller side agent. Prior research has provided evidence
that manufacturers can signal that their product is high quality by choosing to sell it through a
reputable retailer (Chu and Chu 1994).
The seller side agent, acting as a third-party agent between the producer and the
marketplace of other principals and agents in general, must then signal to potential buyer side
principals and agents both about its reputation as a product seller and about the quality of the
goods it is offering for sale on behalf of seller side principals. Its reputation as a seller side
agent is important in backing up the quality claims of the products that they offer. While the
retailer reputation is less important in signaling quality than brand name or price, reputation is
seen by consumers as a signal of product quality (Dawar and Parker 1994). The seller side
principal’s reputation is what determines if their communication via signaling will be effective
(Herbig and Milewicz 1994; Herbig and Milewicz 1994; Herbig and Milewicz 1996).
In this marketplace, buyer side principals enlist the help of multiple expert agents
(termed here buyer side agents) to assist them in their purchase decisions. One example of
agents of this type is a home buyer who enlists both a real estate agent and a home inspector to
assist them in its purchase decisions. The home buyer lacks the necessary skills to evaluate the
item for purchase, so it hires experts specifically trained to evaluate the purchase. In the
marketplace under study, the seller side agent of the goods, who is acting on behalf of the seller
side principal, must read the signals from these buyer side expert agents to determine
marketplace interest and willingness to pay for the goods that they are consigning. If more
agents are inspecting their goods, the consignor can infer that there is more marketplace
interest in purchasing the goods. Markets are a social process, where observation of the actions

64
of other participants is critical in determining interest. More interested parties means that the
product carries a higher valuation (Rothkopf 1969). One crucial role of the consignor is to have
an intimate knowledge of the other marketplace participants, which involves knowing their past
purchasing behavior. Marketplace traders can look to past published information to determine
the past behavior of the participants, and then infer possible future behavior (Milgrom 1981;
Ashenfelter 1989). Past high dollar purchases can signal the potential for future high dollar
purchases.
Finally, the buyer side agents use the actions of other agents like themselves as signals
of marketplace behavior. Markets are a social process, where participants look to the actions of
other participants for signals to indicate unobservable quality (White 1981; White 1981;
Granovetter 1985; Podolny 1993). In this marketplace, the quality of these credence goods is
unobservable prior to purchase and cannot be determined for perhaps several years after
purchase. As such, buyer side principals hire expert agents who attempt to read marketplace
signals to infer the opinions of others when making their determination of the quality of the
good and thus their opinion on what the buyer side principal should be willing to pay. It has
been demonstrated that marketplace participants look to the number of other parties that are
interested in a product when determining the price they are willing to pay. The more interested
parties, the higher the value they place on the item (Rothkopf 1969).
It should be noted that while the buyer side principal is a participant in this market, it
remains hidden. Typically, buyer side principals conduct all business through their agent(s), so
the other marketplace participants may never know who will actually be purchasing the
product. They know only what the buyer side agents are doing on behalf of this hidden buyer
side principal. This marketplace, along with others such as the stock market, represents a
situation where the third-party experts and not the buyers themselves are the market drivers.
It is not the monitoring of the buyers themselves that is important, rather it is the monitoring of
the experts who are enlisted to make decisions on behalf of the buyers (e.g. White 1981;
Zuckerman 1999; Hilger, Rafert et al. 2007).
This model of marketplace signaling has been presented to provide the necessary
framework upon which to build an integrated model of marketplace effects of third-party
agents on business performance outcomes. Hypotheses will be developed which can
empirically examine economic logic underlying signaling in a network context.

65
Research Model
The research model presented below (Figure 3.2) represents an integrated model of
marketplace effects of third-party agents on business performance outcomes. This model
represents an auction marketplace where multiple seller side principals consign their products
for sale via downstream seller side agents. These seller side agents represent the products of
the seller side principals for sale in the marketplace. Buyer side principals enlist the help of
expert buyer side agents to assist in their purchase decisions.
There are two main classes of third-party agents acting in this marketplace. The first is
the seller side agent who is acting as the link between the seller side principal and the buyer
side agents. The other are the buyer side agents who act as liaisons between seller side agents
and the buyer side principals. While this research presents an overall integrative model of
marketplace effects, it will particularly focus on the role of these third-party buyer and seller
agents and their effect on business performance outcomes. The model and research
hypotheses will first be described, followed by a discussion of the control variables enlisted.
First and foremost, the decision of input quality by the seller side principal will have a
direct effect on the price brought in the marketplace at auction. Higher priced, higher quality
inputs will have a higher base cost and should sell for more money. These price/quality control
variables are discussed in the control variables section.
The seller side principal of the good must first make the decision concerning with whom
to consign their goods. The choice by the seller side principal of which seller side agent to use is
an important one. When entering into a consignment agreement, the seller side principal is
signaling to the marketplace that it trusts the chosen seller side agent to make every effort to
sell and promote their goods and obtain the highest price possible at auction.
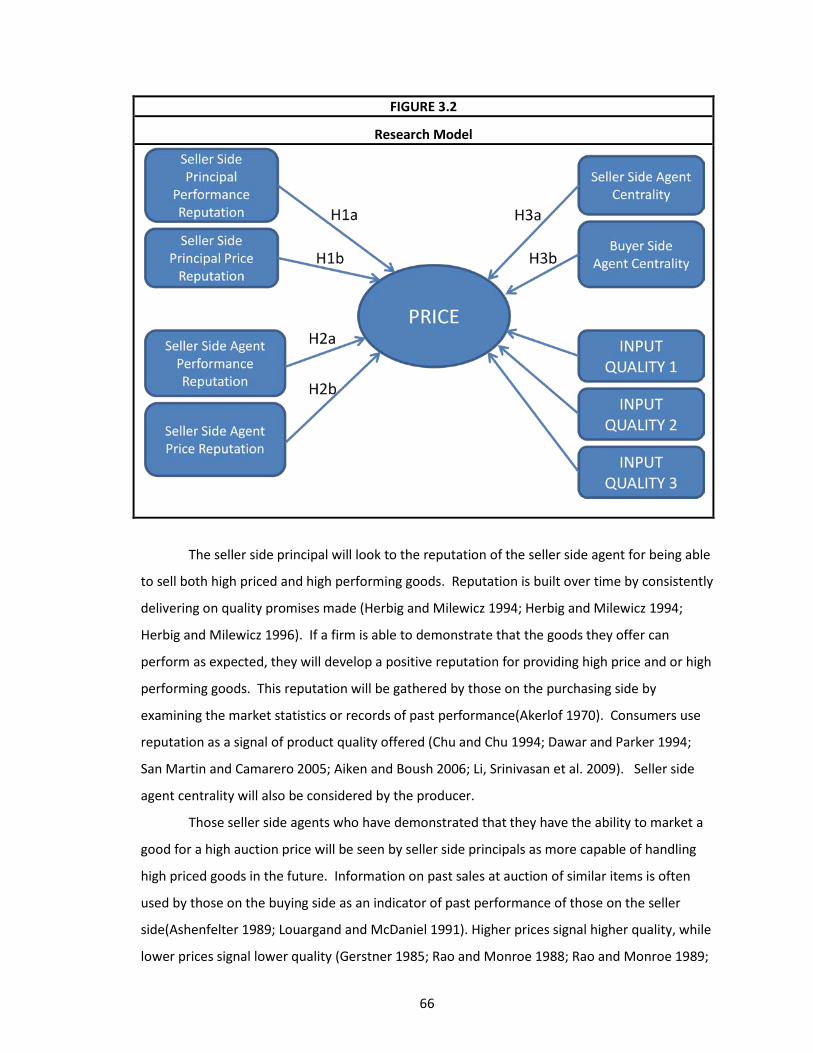
66
FIGURE 3.2
Research Model
The seller side principal will look to the reputation of the seller side agent for being able
to sell both high priced and high performing goods. Reputation is built over time by consistently
delivering on quality promises made (Herbig and Milewicz 1994; Herbig and Milewicz 1994;
Herbig and Milewicz 1996). If a firm is able to demonstrate that the goods they offer can
perform as expected, they will develop a positive reputation for providing high price and or high
performing goods. This reputation will be gathered by those on the purchasing side by
examining the market statistics or records of past performance(Akerlof 1970). Consumers use
reputation as a signal of product quality offered (Chu and Chu 1994; Dawar and Parker 1994;
San Martin and Camarero 2005; Aiken and Boush 2006; Li, Srinivasan et al. 2009). Seller side
agent centrality will also be considered by the producer.
Those seller side agents who have demonstrated that they have the ability to market a
good for a high auction price will be seen by seller side principals as more capable of handling
high priced goods in the future. Information on past sales at auction of similar items is often
used by those on the buying side as an indicator of past performance of those on the seller
side(Ashenfelter 1989; Louargand and McDaniel 1991). Higher prices signal higher quality, while
lower prices signal lower quality (Gerstner 1985; Rao and Monroe 1988; Rao and Monroe 1989;
67
Lichtenstein, Ridgway et al. 1993). The seller side agent who has developed a positive
reputation by fulfilling the signaling promises of being able to consign high priced goods will
subsequently be able to obtain goods on consignment from seller side principals with a higher
base cost. These goods with a higher base cost will bring more money at auction, reaping
benefit for both the producer and the consignor, who is paid on commission as percentage of
final sale price (Blood-Horse Publications 2004).
While seller side principals will consider the consignor’s reputation in their ability to sell
high priced goods, they will also consider their reputation for selling high performing goods.
While price is shown to be a signal of quality prior to purchase, true quality is determined after
purchase and use of the good. High performance is determined once the product is in use. This
particular market of study lends a unique situation to study. In this market, no one, including
the seller side principal, seller side agent, buyer side agent, or buyer side principal can know to
what quality standards the good will actually perform. Simply because a product is composed
of high priced, high performing inputs, there are no guarantees that the product will actually
perform to high standards. So, the seller side principal will consider the reputation of the seller
side agent for selling high performing goods, not just high priced goods. Reputation is built over
time by consistently delivering on quality promises made (Herbig and Milewicz 1994; Herbig and
Milewicz 1994; Herbig and Milewicz 1996). If a firm is able to demonstrate that the goods they
offer can perform as expected, they will develop a positive reputation for providing high price
and or high performing goods. This reputation will be gathered by those on the purchasing side
by examining the market statistics, or records of past performance(Akerlof 1970). Information
on past sales at auction of similar items is often used by those on the buying side as an indicator
of past performance of those on the seller side(Ashenfelter 1989; Louargand and McDaniel
1991). Consumers use reputation as a signal of product quality offered (Chu and Chu 1994;
Dawar and Parker 1994; San Martin and Camarero 2005; Aiken and Boush 2006; Li, Srinivasan et
al. 2009). A seller side agent who can develop a reputation for selling high performing goods
may signal that they have a good “eye”, the ability to discern which products might actually be
high quality performers, not just high priced sellers.
Since the marketplace is a social process, where participants look to the actions of
others to determine what actions they should subsequently take (e.g. White 1981; White 1981;
Granovetter 1985; Podolny 1993), seller side principals will want to consign their products with
a seller side agent who is known to be an active and important participant in the marketplace.
Centrality is one way of measuring the activity of an actor in the marketplace. Centrality is a

68
way of assessing which nodes have the most potential control of communication (Freeman
1978/79; Wasserman and Faust 1994). Seller side principals will want to consign their goods
with a seller side agent who is deeply involved in the marketplace, in the “thick of things”.
These more central seller side agents will have more contact with more marketplace
participants and will have access to more information about the actions taking place amongst
the participants. Involvement in many flows of information will allow for these market
participants to keep aware of new developments, and to control the flow of information,
money, and other resources (Van Den Bulte and Wuyts 2007). On the other hand, those that
are less central will be peripheral to the network and will be isolated from involvement with
many others (Freeman 1978/79).
Seller side agents with relatively higher centrality will be able to use their knowledge of
new developments and control the flow of information, money, and resources in the
marketplace and be able to obtain goods with a higher base cost. These goods are more
desirable, as goods with a higher base cost should sell for more money at auction. Seller side
agents make a commission on each good that they sell, so it is desirable to obtain higher prices
for goods at auction. These central agents will leverage their control and connections to obtain
these goods which should sell for higher prices.
One of the buyer side agents, known as buyer side agent 1, serves as the buyer side
principal’s primary advisor in the selection of goods in the marketplace. This agent must make
the choice of which goods to inspect and possibly bid on. Their choices are constrained
primarily by the buyer side principal’s budget of the total dollar amount they wish to spend and
how many products they would like to purchase. Taking into account the budget of the buyer
side principal, buyer side agent 1 will subsequently be influenced by the reputation of the seller
side principal, the reputation of the seller side agent, and the centrality of the seller side agent.
Seller side principals send a signal to the marketplace when they choose which raw
materials from which to construct a good. Higher performing goods, as measured by their
eventual performance, will typically cost more. In markets characterized by the strict limitation
that eventual performance quality of the product cannot be determined by anyone prior to
purchase, market participants must read all available signals to help make their decisions.
Buyer side principals want to avoid making an adverse selection, so they will choose products
from seller side principals that have developed a reputation for successfully offering the type of
goods that they wish to purchase- be they high priced goods that should have a higher residual
value, or high quality goods that should perform to a high standard. Reputation is established
69
by fulfilling signaling promises over time, which implies a long-term investment in maintaining
their perception in the marketplace (Herbig and Milewicz 1994; Herbig and Milewicz 1994;
Herbig and Milewicz 1996).
Market participants look to two main determinants of quality reputation when making
their decisions. One component is the reputation for successfully offering and selling high
priced goods. The second component is the reputation for successfully offering and selling high
performing goods. Performance here is defined as eventual product performance, which
cannot be determined by anyone prior to purchase. Market participants will use past market
statistics as signals of the seller side principal’s ability to offer high priced and/or high
performing goods (Akerlof 1970; Milgrom 1981; Ashenfelter 1989). Over time, seller side
principals increase the equity in their names, along with their reputations, by offering goods
that successfully meet the needs of marketplace participants. Brand name has been shown to
act as a signal of unobservable quality, with higher prices obtained for a name branded product
versus an unnamed product (e.g. Rao and Monroe 1989; Keller 1993; Dawar and Parker 1994;
Erdem and Swait 1998).
Those seller side principals that are able to signal that they have developed a reputation
for providing the type of goods that buyers wish to purchase will attract the attention of more
potential purchasers in the marketplace. More marketplace participants interested in an item
will signal to others that this object is of greater value, and prices will be driven up (e.g. Milgrom
and Weber 1982). Marketplace participants will perceive the performance quality claims as
more credible if they are made by a producer with a strong brand name who has developed a
positive reputation for fulfilling performance claims.
H1a. Seller side principals who have a reputation for producing high performing
products will be associated with higher prices brought at auction.
H1b. Seller side principals who have a reputation for producing high priced products will
be associated with higher prices brought at auction.
Marketplace participants will also look to the reputation of the seller side agents in
considering which products to purchase. The seller side agent’s ability to sell high priced and/or
high performing goods successfully at auction will influence the marketplace participants in
their choices. Here again, it is the reputation, or the long term ability to fulfill signaling

70
promises (Herbig and Milewicz 1994; Herbig and Milewicz 1994; Herbig and Milewicz 1996),
that matters. It is the reputation that signals to buyer side marketplace participants that they
can trust the seller side agent’s signals that the good is worth a high price, knowing that this
seller side agent has successfully offered high quality or high performing goods in the past, and
they can continue to do so in the future. Over time these seller side agents may develop equity
in their brand name, and this brand equity will allow the seller side agent to leverage their name
to provide marketplace participants with assurance that the product offered will live up to its
performance quality claims. Again, the marketplace participants will look to the market
statistics as indicators of the past ability of the consignor to live up to their claims (Akerlof 1970;
Caminal and Vives 1996).
Those seller side agents that are able to signal that they have successfully developed a
reputation for providing the type of goods that buyers wish to purchase will attract the
attention of more potential buyers in the marketplace. More marketplace participants
interested in purchasing an item will signal to others that this object is of greater value, and
prices will be driven up (e.g. Milgrom and Weber 1982). Marketplace participants will perceive
the performance and/or price claims as more credible if they are made by a seller side agent
with a strong brand name who has developed a good reputation for fulfilling quality claims.
H2a. Seller side agents who have a reputation for consigning high performing products
will be associated with higher prices brought at auction
H2b. Seller side agents who have a reputation for consigning high priced products will
be associated with higher prices brought at auction
Seller side principals wish to consign their products with more central seller side agents.
These central seller side agents will obtain higher priced goods to consign for sale in the
marketplace, as seller side principals will perceive that these more central seller side agents will
have the ability to obtain higher prices for their goods by being more “in the thick of things”.
These seller side agents are better able to leverage the social processes of the auction
marketplace and will be more aware of the actions of others because they have more access to
and control of information due to their centrality (e.g. Freeman 1978/79; Wasserman and Faust
1994). These more central seller side agents will have more contact with more marketplace
participants and will have access to more information about the actions taking place amongst

71
the participants. The seller side agent is responsible for reading the market signals to make a
determination of the interest and willingness to pay by buyer side principals, so being in a
central position will help them make more accurate assessments. The access to more
information will allow the seller side agent to predict what price the good will bring at auction.
A seller side agent can raise the expected price of an item at auction by providing an
expert appraisal of its quality because offering market participants a dollar value upon which to
base their valuation can serve as a powerful, credible signal of quality (Milgrom and Weber
1982). The seller side agent will have the ability to provide this appraisal by assessing the base
cost of the item plus information about how many parties on the buyer side are interested in
the item and what those parties might be interested in spending on the item. Centrality will
indicate their ability to have access to and control over this information.
The ability to read and interpret marketplace signals is one of the main duties of the
seller side agent. The seller side principal has contracted with the seller side agent to help them
overcome the problem of adverse selection. In this marketplace, there is imperfect
information. While the seller side principal does know what the base cost of their product is,
they do not know what the product will be worth at auction. In order to know this, they need
to know what the market is willing to pay. This is a case of incomplete information, and to
overcome this problem the principal may purchase information by enlisting the help of an
agent. This information is purchased in order to avoid adverse selection (Eisenhardt 1985;
Eisenhardt 1989). This seller side agent must be an expert on the buyer side agents, knowing a
great deal about what buyer side principals they might be working for and within what price
range they might be interested in spending. They develop relationships over time with these
buyer side agents, and their knowledge and expertise is key in becoming a central participant in
the marketplace.
H3a. Seller side agent centrality will be associated with higher prices brought at auction
The actions of more central buyer side agent #1’s will be observed more closely in the
marketplace by both the seller side agents and the other buyer side agent #1’s. More central
buyer side agent #1’s have access to more information (Freeman 1978/79; Wasserman and
Faust 1994) and thus should be able to make better decisions by being more “in the thick of
things”. Marketplace participants will observe what products the more central buyer side agent
#1’s are interested in. Social contagion theory predicts that actors’ adoption of products is a

72
function of their exposure to the knowledge, attitude, or behavior of other actors in regards to
the product (Coleman, Katz et al. 1966; Van Den Bulte and Lilien 2001; Gladwell 2002). In
particular contagion occurs between people who are in the same group- in this case the group
of buyer side agent #1’s. This group represents a condition where people will see themselves
as socially similar and will find value in similar ideas and behaviors (Burt and Janicik 1996). The
actions of the more central buyer side agent #1’s will be more visible to the group of other
agents, and will exert proportionally more influence (by being more “in the thick of things”)
than the actions of less central buyer side agent #1’s.
The seller side agents will be alerted that a more central buyer side agent #1 is
interested in their goods and will adjust their expectations of what price that good should bring
at auction. Likewise, other buyer side agent #1’s will observe the actions of these more central
buyer side agent #1’s and will infer from those actions that they too should be interested in that
product.
H3b: Buyer side agent centrality will be associated with higher prices brought at
auction.
The research model presented above represents an auction marketplace where
multiple producers consign their product for sale via downstream channel members. At the
other end of the channel, end users of the product enlist the help of expert agents to assist in
their purchase decisions. As such, there are several groups of third-party agents acting in this
market. The focus of this study is on the role of these third-party agents and their effect on
business performance outcomes.
An overall goal of this research is to assess the information obtained through the
qualitative component of this research. Three main themes were identified. The first theme,
that information is tantamount to this marketplace, is assessed overall in the research model.
Support for the research hypotheses will lend support for this theme that informants believed
that the marketplace is focused on information. A second theme is that the informants
believed that the seller side agent of the product did not matter much. Variables included in
this study should allow for an assessment of this allegation, by isolating the attributes of the
products for sale to examine the effect of the seller side agents. Third is that there is a general
denial that it is possible to quantitatively explicate the outcomes of the marketplace.
Informants believed that the un-measureable phenotypic qualities of the products were the
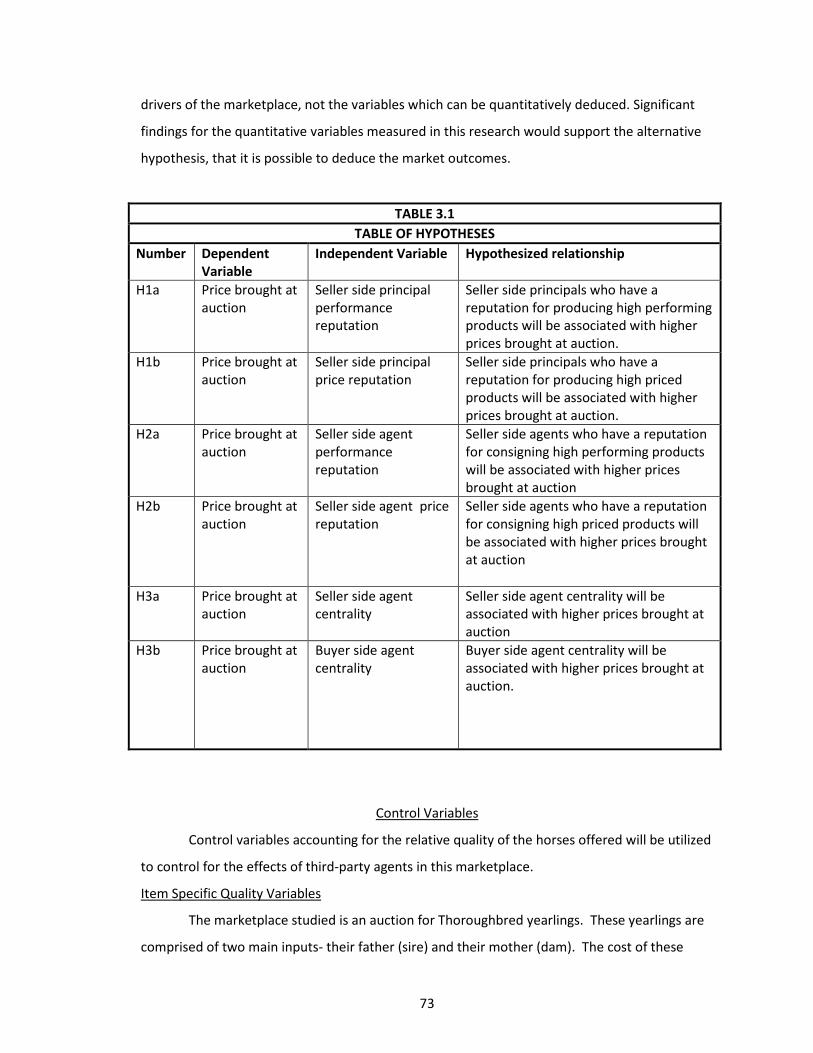
73
drivers of the marketplace, not the variables which can be quantitatively deduced. Significant
findings for the quantitative variables measured in this research would support the alternative
hypothesis, that it is possible to deduce the market outcomes.
TABLE 3.1 TABLE OF HYPOTHESES
Number Dependent Variable
Independent Variable Hypothesized relationship
H1a Price brought at auction
Seller side principal performance reputation
Seller side principals who have a reputation for producing high performing products will be associated with higher prices brought at auction.
H1b Price brought at auction
Seller side principal price reputation
Seller side principals who have a reputation for producing high priced products will be associated with higher prices brought at auction.
H2a Price brought at auction
Seller side agent performance reputation
Seller side agents who have a reputation for consigning high performing products will be associated with higher prices brought at auction
H2b Price brought at auction
Seller side agent price reputation
Seller side agents who have a reputation for consigning high priced products will be associated with higher prices brought at auction
H3a Price brought at auction
Seller side agent centrality
Seller side agent centrality will be associated with higher prices brought at auction
H3b Price brought at auction
Buyer side agent centrality
Buyer side agent centrality will be associated with higher prices brought at auction.
Control Variables
Control variables accounting for the relative quality of the horses offered will be utilized
to control for the effects of third-party agents in this marketplace.
Item Specific Quality Variables
The marketplace studied is an auction for Thoroughbred yearlings. These yearlings are
comprised of two main inputs- their father (sire) and their mother (dam). The cost of these

74
inputs can vary dramatically. Just to breed to some sires can cost close to half a million dollars.
Buyers assess these yearlings based on the on-racetrack performance of their sires, dams, and
extended family members, along with the performance of the yearling’s siblings (half or full).
These individual level variables will be used as control variables in this study. Market traders
look to past auction results for information to determine the value of the object at hand. More
favorable information (higher prices or higher levels of past performance) convey more
favorable information about the quality of the objects being sold (Milgrom 1981; Ashenfelter
1989).
When the seller side principal is making the decision of what raw inputs to combine to
produce a product, they are considering these control variables. An input with higher price and
on-racetrack performance will have a higher procurement cost, raising the base cost of the item
offered for sale at auction.
Chapter Summary
The purpose of this chapter has been to formalize a set of hypotheses that link market
signaling effects to business performance outcomes. The measurement of these variables is
discussed in the next chapter.
Copyright © Emily J. Plant 2010
75
CHAPTER FOUR: RESEARCH METHODOLOGY
Introduction
The purpose of this chapter is to present the methodology employed for testing the
research model developed in the previous chapter. The first section describes the research
setting for the current study. The next section outlines the research design, including sampling
procedures and data collection. Measurement of the research variables will then be
considered. Finally, the analytical procedures for testing the research hypotheses and overall
model will be discussed.
Research Setting
The setting for this study is a distribution channel within the Thoroughbred racing
industry that involves the flow of one-year-old horses from producers to buyers. The equine
sector of United States Agriculture is a multi-billion dollar industry. Around 30 percent of the
approximately 36,000 Thoroughbred foals born annually in North America are born in Kentucky
(The Jockey Club 2009). Until recently, the Thoroughbred industry was Kentucky’s leading cash
crop, with sales in excess of $1 billion in 2007 and with $306 million worth of horseflesh
exported in that same year. The estimated annual economic impact of the industry in Kentucky
is $4 billion. The six percent tax on stallion stud fees alone, which is the cost to breed a mare
(female horse) to a stallion (male horse), earned Kentucky $16 million in 2007 (KTA-KTOB 2009).
Between the two largest auction houses for Thoroughbreds in Kentucky, Keeneland Sales
Company and Fasig-Tipton Sales Company, 9,461 horses were sold for a total of $712,650,700
(Fasig-Tipton 2009; Keeneland Association 2009). The Keeneland September Yearling Sale, the
largest marketplace for Thoroughbred yearlings in the world, sold 3,605 horses for a total of
$327,999,100 in 2008, representing 46 percent of the total dollar volume and 38 percent of
horses sold at auction in Kentucky in 2008 (Keeneland Association 2009). There were 5,555
horses cataloged for the 2008 sale, which represented 15 percent of the total Thoroughbred
foals born in North America in 2007 (The Jockey Club 2009). Buyers and sellers from all over the
world come annually to Lexington in September to purchase yearlings at auction.
Production of these horses begins with the breeder, who is the seller side principal in
this study. This breeder plans a mating between a mare and a stallion. Matings are planned
based on the relative quality of the mare and stallion, as indicated by the pedigree and race

76
record of their families and the past ability of the mare and stallion to produce high-performing
horses. Mares with better pedigrees, race records, and proven ability to produce high-
performing horses are more valuable. Likewise, stallions with better pedigrees, race records,
and proven ability to sire high performing horses will command higher stud fees for their
services. The breeder then consigns the resulting offspring with a consignment agency (seller
side agent), which takes that horse, along with the horses of other producers, and sells them at
auction (figure 4.1).
FIGURE 4.1 Yearling consignor supervising inspection of horses
On the other end of the channel, the end buyer (buyer side principal) enlists the help of
third-party agents to assist its selection of which yearlings to inspect and purchase at auction.
One of these agents, known as the bloodstock agent (buyer side agent #1), is an expert in
evaluating the potential of young horses (figure 4.2).
Yearling Consignor
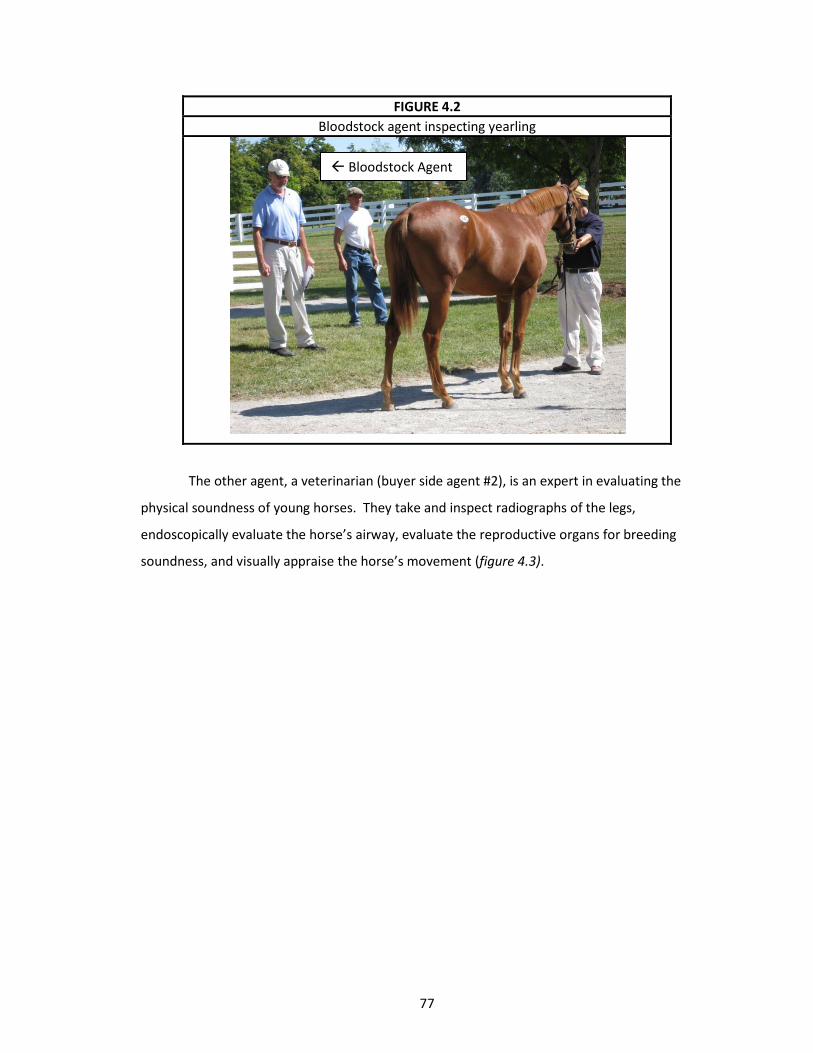
77
FIGURE 4.2 Bloodstock agent inspecting yearling
The other agent, a veterinarian (buyer side agent #2), is an expert in evaluating the
physical soundness of young horses. They take and inspect radiographs of the legs,
endoscopically evaluate the horse’s airway, evaluate the reproductive organs for breeding
soundness, and visually appraise the horse’s movement (figure 4.3).
Bloodstock Agent

78
FIGURE 4.3 Veterinarians taking radiographs of yearling’s legs
These agents render their opinions of the animal in question and report back to the
buyer on their evaluations. Based on the evaluation, decisions are made regarding which
animals the bloodstock agent should bid on at auction on behalf of the buyer. The auction
house takes a 5 percent commission on the final selling price of all horses sold, or 5 percent the
reserve price if the horse does not meet their reserve on the auction block. Bloodstock agents
and consignors typically work on commission, while veterinarians usually receive a fee per
service rendered (Blood-Horse Publications 2004).
The focus of this research is on the effect that these third-party agents have on business
performance outcomes. The particular mechanism of study is the market signaling phenomena
involving these third-party agents as links in the network connecting buyers and sellers. This
channel provides an ideal situation for exploring the role of these third-party agents. In other
channels where third-party agents are active, such as the real-estate market, it is very difficult
to control for variables aside from the agent used which might also affect the selling price of a
house. Even two homes that sell on the same street might not be comparable. For example,
one section of the street might be more desirable than the other, one house might have a
slightly newer roof, one might have newer appliances or higher quality flooring, etc., etc. If the
homes do not sell at the same time of year, one must control for the economic conditions that

79
varied in those two periods of time. In the channel studied here, it is possible to control for
many variables that affect the price of a yearling horse at auction. All horses are housed to be
inspected within the same facility location, and they are all sold within a relatively short 16-day
period. They all sell in the same auction ring. There is a wealth of information available on the
pedigree and race history of the yearling’s family, so data can be collected to control for those
variables. In addition, several companies including The Blood-Horse, The Thoroughbred Times,
and the Jockey Club publish statistical information regarding past sales, making it possible to
conduct this study using high-quality secondary data on the sale.
Research Design
This study utilizes a combination of qualitative and quantitative data. The qualitative
data is utilized to produce a grounded theoretical base for the research, along with providing
additional evidence to support relationships which cannot be quantitatively assessed. This
study will determine if there is a significant relationship between the independent measures of
signaling phenomena and the dependent measures of auction sale price. The use of complete
secondary data to measure the variables of input quality, and the actions of the bloodstock
agent and veterinarian agent eliminates many threats to internal validity, as the data gathered
is considered to be a true and accurate depiction of what took place at the Keeneland
September 2008 Yearling Sale. Variables which cannot be directly observed from pre-existing
data, including those of reputation and centrality, are constructed through the use of
longitudinal data capturing the historical performance of the producers, consignors, and agents.
The use of historical data to account for these variables is supported by the notion that
reputation is considered the ability of an entity to fulfill it’s quality claims over time (Herbig and
Milewicz 1994; Herbig and Milewicz 1994; Herbig and Milewicz 1996).
Sampling Procedures
The sampling frame consists of 3,605 horses cataloged for the Keeneland September
2008 Yearling Sale. This sample represents approximately 64.8% of the total number of items
entered in the sale.
Data Collection
To obtain the information necessary to test the research model, secondary data were
gathered from several different sources. Keeneland Sales results, available on the Keeneland
80
website (Keeneland Association 2008), provided the basic information of which horse sold to
whom and from whom, and for how much. This is the official record that Keeneland compiles
of auction results, and is a true and accurate representation of the results of the auction. This
data was downloaded from the Keeneland website in Excel format.
The published materials containing detailed information about each individual horse in
the sale were obtained from Keeneland (Keeneland Association Inc. 2008), along with The
Thoroughbred Times Buyer’s Guide (Thoroughbred Times 2008). These sources provide the
control variables accounting for each yearling’s pedigree and the performance of their
immediate and extended family, both on the racetrack and in the sales ring. The Keeneland
Catalog (Figure 4.4) allocates one page per yearling offered in the sale. This page contains
documentation of the following information on each yearling: on track performance of the sire,
along with the basic information on the performance of his offspring on the racetrack; racetrack
performance of the dam (and often the extended female family of the dam) along with
information on her foals and their racetrack performance; the “Engagements” each yearling has
(special races the yearling is nominated to); the state and date of birth; and identification of the
consignor.
The Thoroughbred Times Buyer’s Guide (Figure 4.5) expands on the information
contained on the Keeneland Catalog Page. This guide is available for purchase from The
Thoroughbred Times for $185. This guide provides a greater depth of detail on information
regarding the yearling. Information contain here includes the following: the stud fee of the sire
(both in the year the yearling was conceived and the current year); the breeder (buyer side
principal) of the yearling; the dosage index and center of distribution; the sales performance of
sires other offspring; racetrack performance of other Thoroughbreds with the same genetic
cross as the yearling cataloged; the racetrack performance of the yearling’s dam; and the
racetrack performance of the dam’s other offspring. Also included is the price the cataloged
yearling has sold for at auction previously, if applicable.
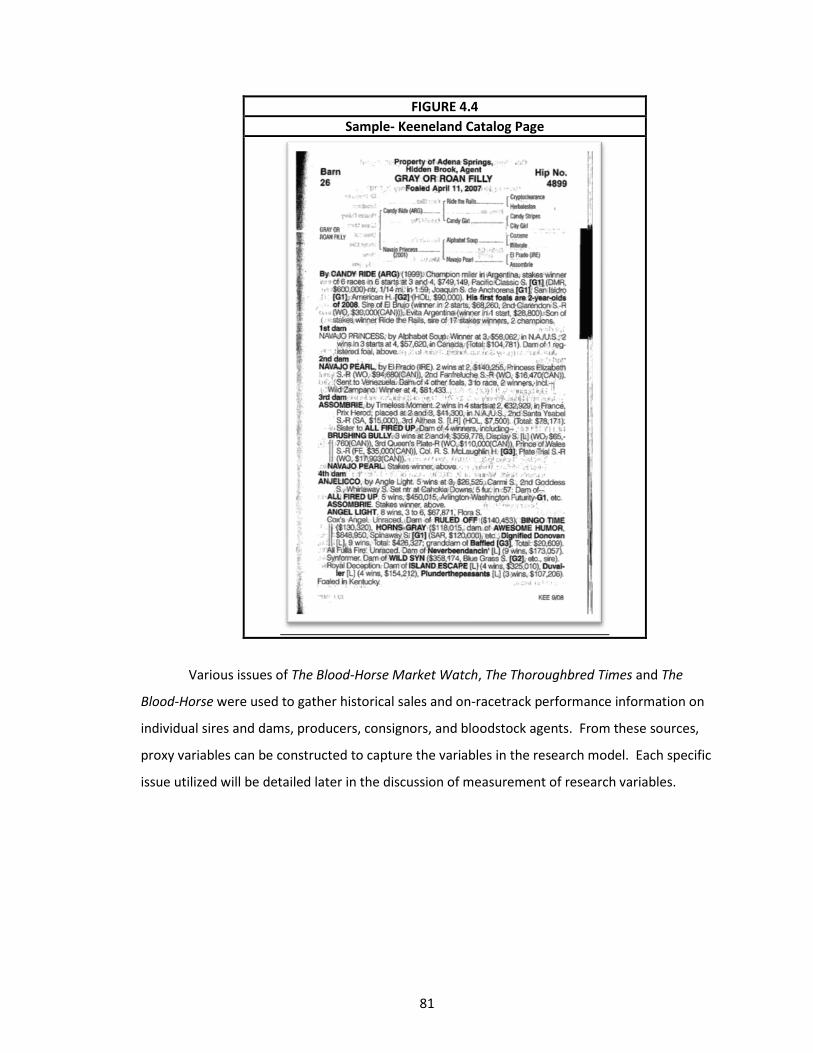
81
FIGURE 4.4 Sample- Keeneland Catalog Page
Various issues of The Blood-Horse Market Watch, The Thoroughbred Times and The
Blood-Horse were used to gather historical sales and on-racetrack performance information on
individual sires and dams, producers, consignors, and bloodstock agents. From these sources,
proxy variables can be constructed to capture the variables in the research model. Each specific
issue utilized will be detailed later in the discussion of measurement of research variables.

82
FIGURE 4.5 Sample- Thoroughbred Times Buyer’s Guide
Measurement of Research Variables
This section will present the set of measures used to examine the research model.
Measures that represent each of the three focal research variables are described first. Then,
the set of measures utilized as control variables is presented. This section concludes with a
discussion of measurement validity and reliability.
Reputation
Reputation, by definition, is determined by the past performance of a firm (Herbig and
Milewicz 1994; Herbig and Milewicz 1994; Herbig and Milewicz 1996). Firms that consistently
are able to deliver successfully on the quality claims that they make will develop positive
reputations in the market. Consumers use market statistics of past results to gather information
regarding the relative performance of a firm (Akerlof 1970; Caminal and Vives 1996). These
83
statistics serve as signals to the marketplace of the firm’s reputation. To measure these
variables, longitudinal data on the past performance of firms in this specific market will be
gathered to determine their reputation. Data will be compiled from several printed sources.
The two leading industry trade publications, The Thoroughbred Times and The Blood-Horse,
publish detailed statistics by sale regarding performance of producers, consignors, and agents.
The Blood-Horse MarketWatch is a specialized publication which provides information and
analysis for the Thoroughbred investor, including statistics on performance of producers,
consignors, and agents beyond what is available in the trade publications. Complete data on
past sales results of the Keeneland September Yearling Sale is available through the Keeneland
Association. These sales data includes information on the agents and consignors for every
horse sold at Keeneland in the year prior to the 2008 sale.
There are two components of reputation- price reputation and performance reputation.
These two components align with the notion that there are two basic uses for a Thoroughbred
racehorse. The first is to race them and win money on the racetrack, and the second is to breed
them and sell or race their offspring. While more expensive horses are not guaranteed to win
more money on the racetrack, they are likely to hold a higher residual value (as a breeding
animal). This can roughly be compared to the residual value of, say, a high-end sports car
compared to an economy car. The high-end sports car costs more in the beginning, but is likely
to also be worth more upon resale. So, buyers and their agents will consider the reputation of
consignors and producers for offering animals that sell for a high price, and also the ability of
those horses to perform on the racetrack. For example, there is a farm called “Monticule” that
acts as both a breeder and consignor of yearlings. This farm has developed a reputation for
quality both through the racetrack and sales ring performance of their yearlings. Monticule
bred 2008 Kentucky Derby and Preakness winner Big Brown. These high profile wins served as
evidence that the Thoroughbreds bred and sold by Monticule were worthy of the high prices
they brought in the sales ring. As of this year, Monticule is the leading yearling consignor by
average price, and the farm is also ranked eighth on the list of leading consignors by percentage
of stakes winners (The Blood-Horse MarketWatch 2009). Contrast this reputation with a
consignor who does not have any past performance to represent their yearlings, such as a
consignor who is just entering the market and does not have any past sales or racetrack
performance to their name. For example Woodford Thoroughbreds will be offering their first
September yearling consignment this year at Keeneland.
84
Price Reputation
Consignor and Producer
Consignor price reputation will be measured using historical sales data from Keeneland
September Yearling Sale results from 2007. Producer price reputation will be measured based
on the historical sales results of the Keeneland September yearling sale for the producer.
Average sale price will be used to gauge the results of the consignor. The average price
is used to rank the relative price outcomes of consignors in publications such as the
“Thoroughbred Times Today”, which is published on a daily basis throughout the sale. The
Blood-Horse MarketWatch also publishes a yearly list of the relative performance of consignors,
ranking them by average price (The Blood-Horse MarketWatch 2009). This data was gathered
from the Jockey Club Information Systems database, the worldwide clearinghouse for data on
the Thoroughbred Industry. Statistics of every registered Thoroughbred are recorded by The
Jockey Club, the breed registry for Thoroughbred horses in the United States, Canada, and
Puerto Rico. Precise record keeping in the Jockey Club Information Systems database is
paramount, as they are the industry source for information. Every time a registered
Thoroughbred runs in a race, is sold at public auction, or produces a foal, the information is
contained here. Experience in the marketplace indicates that buyer side marketplace
participants are regularly exposed to these published statistics, and will consider them when
assessing the yearlings offered for sale.
Producer price ranking is not readily available through published sources. The average
price for horses bred by producers and sold at the 2007 sale was manually compiled by
referencing the breeder names from the 2007 Thoroughbred Times Buyers Guide
(Thoroughbred Times 2007) with the complete sales results from the 2007 Keeneland
September Yearling Sale.
Performance Reputation
Consignor
Performance statistics for consignors were gathered from The Blood-Horse
MarketWatch. The Blood-Horse MarketWatch publishes a yearly listing of the racetrack
performance of yearlings that consignors have sold at auction (Russo 2008). This list includes all
consignors who have offered at least 20 horses for sale over the three-year period considered
(2004-2006). Of the total sample of 3,605 transactions, 233 individual horses were sold by
consignors who had not offered at least 20 horses for sale over the time period from 2004-
85
2006, representing approximately 6.4%. Statistics included in this listing include: number of
yearlings offered on consignment; the number that were actually sold; average price of
yearlings sold; average earnings of yearlings sold; the number and percentage of runners from
the total number of yearlings offered (horses who have run in at least one race); number and
percentage of winners; number and percentage of two-year-old winners; number and
percentage of stakes winners; number and percentage of stakes horses; number and
percentage of graded stakes winners; number and percentage of graded stakes winners;
number and percentage of horses who have won over $100,000; the Average Earnings Index of
the yearlings; and the average number of starts per yearling. Stakes races represent an upper
level of competition. These races offer tougher competition and higher purse amount to be
won. The percentage of stakes winners is used as a representation of consignor performance
reputation, as this statistic is often the one touted by consignors in their advertisements
(Monticule 2008).
Producer
To capture producer reputation for producing high-performing horses a ranking of
leading breeders as published by Equineline.com will be used. This list is published weekly and
ranks producers by total dollars won. The list from September 3, 2008 was utilized, capturing
performance just up to the start of the Keeneland September sale (Equineline.com 2008).
Equineline.com is widely read by industry participants, so marketplace participants will be
exposed to these rankings and will use them as signals of the ability of a producer to breed high-
performing horses. The hierarchy of this list of the top 300 breeders is a signal to the
marketplace of the producer’s ability to produce high-performing horses. The top 300 breeders
in North America are the upper echelon of producers of Thoroughbreds, and as such the
majority of producers who bred the yearlings for sale at the 2008 Keeneland September are not
included on this list. Total dollar value of earnings was divided by the number of races started
by horses bred per producer, giving a metric of earnings per starter. Of the total 3,605 of
individual yearlings sold, 61% were produced by breeders who were not included in the list of
the top 300 breeders for 2008. The data for these rankings as published on the Equineline.com
website is compiled from the Jockey Club’s Equibase Company LLC. This company, which
operates under The Jockey Club, is the Thoroughbred industry’s Official database for racing
information.
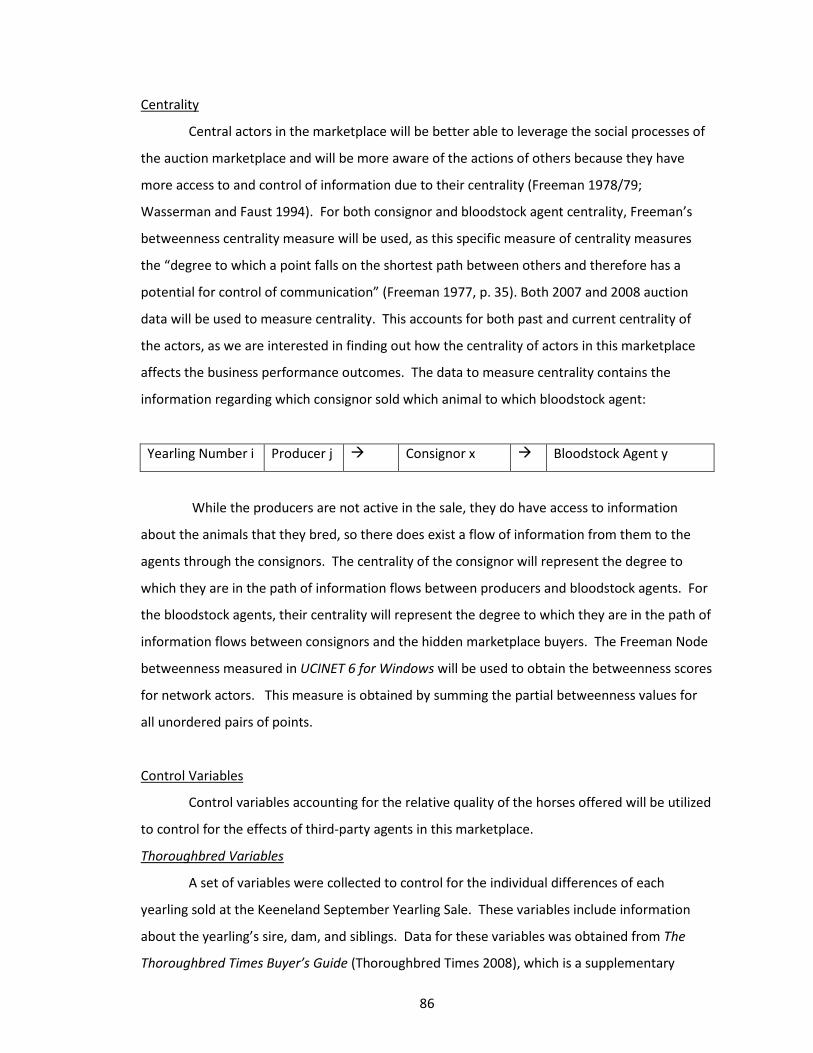
86
Centrality
Central actors in the marketplace will be better able to leverage the social processes of
the auction marketplace and will be more aware of the actions of others because they have
more access to and control of information due to their centrality (Freeman 1978/79;
Wasserman and Faust 1994). For both consignor and bloodstock agent centrality, Freeman’s
betweenness centrality measure will be used, as this specific measure of centrality measures
the “degree to which a point falls on the shortest path between others and therefore has a
potential for control of communication” (Freeman 1977, p. 35). Both 2007 and 2008 auction
data will be used to measure centrality. This accounts for both past and current centrality of
the actors, as we are interested in finding out how the centrality of actors in this marketplace
affects the business performance outcomes. The data to measure centrality contains the
information regarding which consignor sold which animal to which bloodstock agent:
Yearling Number i Producer j Consignor x Bloodstock Agent y
While the producers are not active in the sale, they do have access to information
about the animals that they bred, so there does exist a flow of information from them to the
agents through the consignors. The centrality of the consignor will represent the degree to
which they are in the path of information flows between producers and bloodstock agents. For
the bloodstock agents, their centrality will represent the degree to which they are in the path of
information flows between consignors and the hidden marketplace buyers. The Freeman Node
betweenness measured in UCINET 6 for Windows will be used to obtain the betweenness scores
for network actors. This measure is obtained by summing the partial betweenness values for
all unordered pairs of points.
Control Variables
Control variables accounting for the relative quality of the horses offered will be utilized
to control for the effects of third-party agents in this marketplace.
Thoroughbred Variables
A set of variables were collected to control for the individual differences of each
yearling sold at the Keeneland September Yearling Sale. These variables include information
about the yearling’s sire, dam, and siblings. Data for these variables was obtained from The
Thoroughbred Times Buyer’s Guide (Thoroughbred Times 2008), which is a supplementary
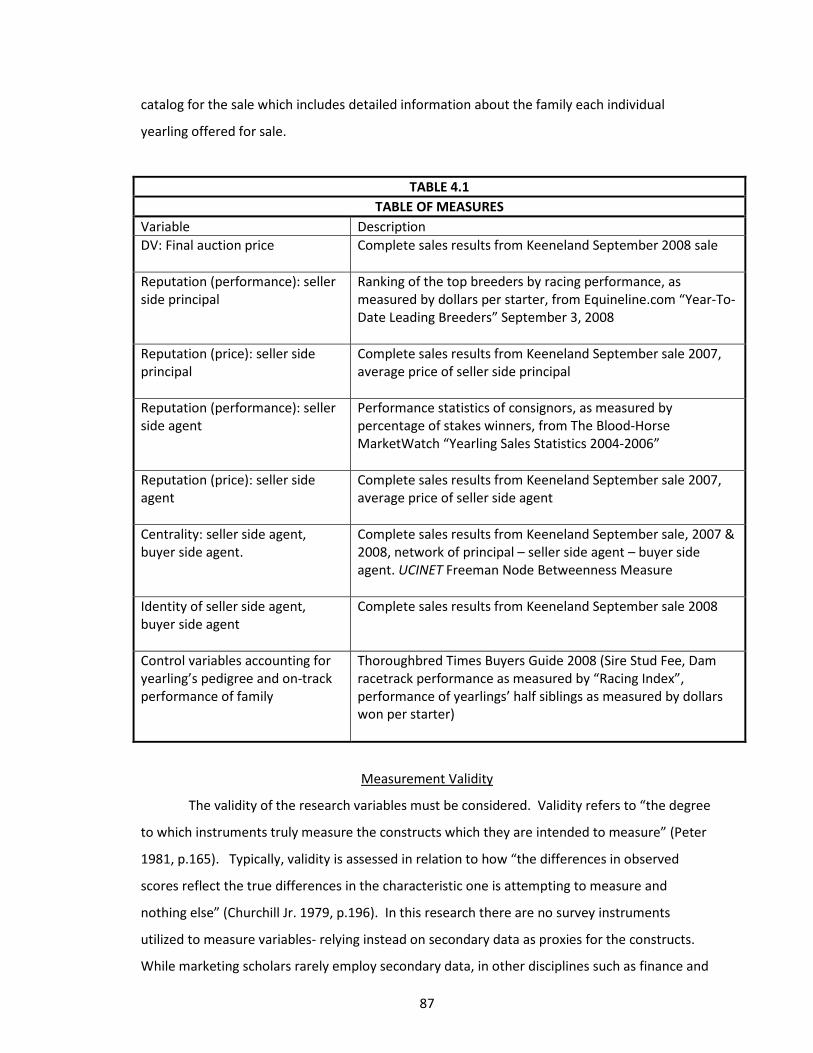
87
catalog for the sale which includes detailed information about the family each individual
yearling offered for sale.
TABLE 4.1 TABLE OF MEASURES
Variable Description DV: Final auction price
Complete sales results from Keeneland September 2008 sale
Reputation (performance): seller side principal
Ranking of the top breeders by racing performance, as measured by dollars per starter, from Equineline.com “Year-To-Date Leading Breeders” September 3, 2008
Reputation (price): seller side principal
Complete sales results from Keeneland September sale 2007, average price of seller side principal
Reputation (performance): seller side agent
Performance statistics of consignors, as measured by percentage of stakes winners, from The Blood-Horse MarketWatch “Yearling Sales Statistics 2004-2006”
Reputation (price): seller side agent
Complete sales results from Keeneland September sale 2007, average price of seller side agent
Centrality: seller side agent, buyer side agent.
Complete sales results from Keeneland September sale, 2007 & 2008, network of principal – seller side agent – buyer side agent. UCINET Freeman Node Betweenness Measure
Identity of seller side agent, buyer side agent
Complete sales results from Keeneland September sale 2008
Control variables accounting for yearling’s pedigree and on-track performance of family
Thoroughbred Times Buyers Guide 2008 (Sire Stud Fee, Dam racetrack performance as measured by “Racing Index”, performance of yearlings’ half siblings as measured by dollars won per starter)
Measurement Validity
The validity of the research variables must be considered. Validity refers to “the degree
to which instruments truly measure the constructs which they are intended to measure” (Peter
1981, p.165). Typically, validity is assessed in relation to how “the differences in observed
scores reflect the true differences in the characteristic one is attempting to measure and
nothing else” (Churchill Jr. 1979, p.196). In this research there are no survey instruments
utilized to measure variables- relying instead on secondary data as proxies for the constructs.
While marketing scholars rarely employ secondary data, in other disciplines such as finance and

88
economics, secondary data proxies are widely accepted and even preferred over self-report
scale measures (Day and Montgomery 1999). Procedures for assessing the validity of multi-
item scales are well-established (Churchill Jr. 1979), but guidelines for assessing the validity of
secondary data proxies are less established. Some literature, such as Houston (2004), present
guidelines for assessing the validity of secondary data. Secondary data provides several benefits
over traditional self-report measures, as they represent actual decisions and outcomes
conducted by genuine decision-makers in their natural environment. Secondary data can also
avoid sampling biases that are inherent in research where key informant sampling is used.
Since it is rarely used as independent variables in marketing research, secondary data proxies
can provide multimethod triangulation (Campbell and Fiske 1959) to other research findings
gathered through the use of surveys or experiments.
In the case of secondary data, validity addresses the credibility of the data, ensuring
that the data is an accurate representation of what actually occurred. This study utilizes
multiple sources of secondary data and the reliability of each will be addressed in turn. First is
the data cataloging the results of the Keeneland September sale. The 2008 data forms the basis
for this study, containing the information of the seller side agent, buyer side agent, and dollar
amount of auction transaction for each transaction. This same information is gathered for the
previous year of the sale- 2007. This prior year data is used to assess longitudinal performance
of the marketplace. This data is obtained directly from the Keeneland corporation website and
downloaded into Microsoft Excel. It is of great importance that these records are a true and
accurate representation of the transactions that occurred during the sale, as this data is what is
recorded to the Jockey Club Information Systems databases. The Jockey Club Information
Systems databases are the worldwide clearinghouse for information on the sales and racing
performance of Thoroughbreds. The Thoroughbred industry including individual participants
(such as owners, breeders, trainers, or veterinarians) wishing to research performance,
Thoroughbred farms who breed and race horses, and publications such as The Blood-Horse and
the Thoroughbred Times utilize the Jockey Club Information Systems databases for information.
Other secondary sources of information utilized in this study, including several issues of The
Blood-Horse MarketWatch publication, utilize these databases as their data source. The
Thoroughbred-Times references Equibase Company LLC, which is under the same umbrella (The
Jockey Club of North America) of ownership as The Jockey Club Information Systems. The
Jockey Club is the breed registry for Thoroughbred horses in the United States, Canada, and
Puerto Rico.

89
Houston (2004) lays out a three-stage process for assessing the construct validity of
secondary data proxies. In the first stage, the domain of the construct is specified, following the
same pattern as laid out in Churchill (1979). This study uses the theory of market signaling as
defined in Kirmani and Rao (2000) within the context of a marketplace as a social process where
third party expert agents are market drivers (Zuckerman 1999). Signals are marketing activities
that transmit information beyond the activity itself, exposing the unobservable message within
the message. Quality in this marketplace cannot be observed prior to purchase, so agents must
use market signals to determine the interest in and willingness to pay for the items that are
available for sale. Agents send and receive signals through their actions and, through the
aggregation of the signals, a determination of the true value of an item can be made
(Ashenfelter 1989; Klemperer 1999). The domain is the marketing channel of an auction for
heterogeneous goods.
In the second stage, the ability of the indicator to measure the construct is assessed.
Traditional methods for assessing reliability and unidimensionality are not applicable when
using secondary data proxies as indicators of a construct. Instead, the quality of the indicator
must lie within the evaluation of content validity. Several industry experts were asked to
evaluate the validity of the chosen measures, and these experts confirmed that the secondary
measures were indeed valid indicators of the constructs (Sweezey 2009; Rosenberg 2010).
The third stage is to assess the fit of the measure within a theoretically specified
network of constructs. This is undertaken once the data has been collected and analyzed to
“assess whether the measure of the focal construct relates in the manner specified to the other
constructs” (Houston 2004, p. 159). In studies such as this where theory testing is the focus one
method to assess nomological validity to examine simple correlations (Houston and Johnson
2000).
If average sale price for seller side principals and seller side agents is a valid measure of
price reputation, these two measures should correlate positively with one another. The prices
received at auction reflect on both the seller side principal and seller side agent, as they are
partners in the single transaction. Examination of the correlation table reveals positive (r =
.275, p < .000). Likewise, the variables capturing racing performance of the seller side principals
and their seller side agent should be positively correlated, as the eventual performance of the
thoroughbreds bred by the principals and sold by the agents should reflect upon each other.
The correlation table confirms this posited relationship (r = .172, p < .000).

90
Analytical Procedures
This section will provide an overview of the analytical procedures used to test the
proposed research model. For the network-based calculations of centrality, initial calculations
will be performed using UCINET 6.0 for Windows (Borgatti, Everett et al. 2010). This program is
designed specifically for applications of network analysis. PASW Statistics 18 (SPSS Inc. 2009)
will be used to perform multivariate regression to test the research model. Next, and overview
of the procedures used for testing the hypotheses is discussed.
Data Analysis
Before regression can be employed, the data must be prepared and screened (Kline
2005). The data must be assessed for normality (that the error terms are normally distributed,
homoscedasticity (that there is constant variance of the error terms), independence of error
terms (that the error terms are uncorrelated), and the presence of outliers . These assumptions
will be tested by conducting statistical tests and examining the graph plots in PASW Statistics
18.0 (SPSS Inc. 2009).
Once this procedure has been completed multivariate regression will be employed to
test the fit of the proposed model.
Multiple Regression Analysis
Multiple regression analysis is a widely used method to test a dependence relationship
between a set of independent variables and a single dependent variable (Hair, Anderson et al.
1998; Lattin, Carrol et al. 2003). This technique models the relationship as a linear combination
of independent variables that correspond to the dependent variable. It describes the
relationship and also offers indication of how strong that relationship is as captured by the
model.
There are several steps involved in the design of a multiple regression analysis. First,
power analyses must be employed to determine the appropriate sample size. Power in multiple
regression refers to “the probability of detecting as statistically significant specific or a
regression coefficient at a specified significance level for a specific sample size” (Hair, Anderson
et al. 1998, p. 165). The recommended power level as specified in Hair et al. (1998) is 80
percent . With a sample size of well over 1,000 (3,605) and 9 independent variables, the
minimum that can be found statistically significant is .02. With a very large sample size,
caution must be taken in interpreting results, as almost any relationship is statistically
significant.
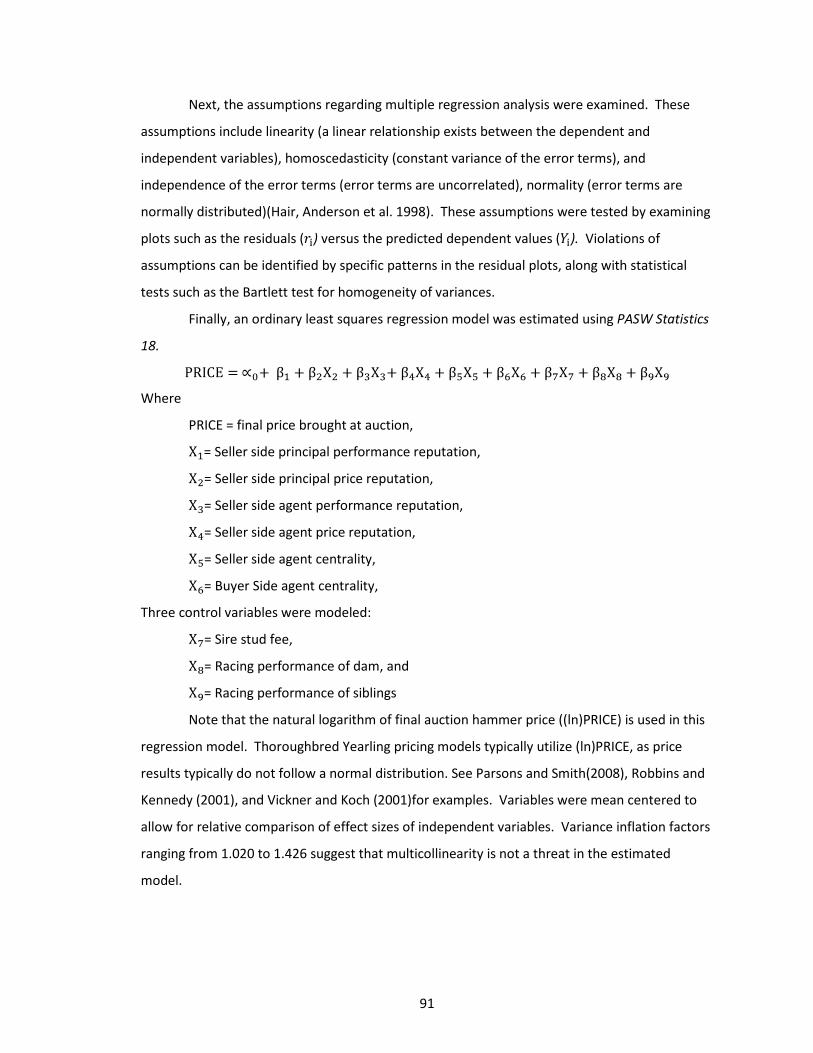
91
Next, the assumptions regarding multiple regression analysis were examined. These
assumptions include linearity (a linear relationship exists between the dependent and
independent variables), homoscedasticity (constant variance of the error terms), and
independence of the error terms (error terms are uncorrelated), normality (error terms are
normally distributed)(Hair, Anderson et al. 1998). These assumptions were tested by examining
plots such as the residuals ( ) versus the predicted dependent values ( ). Violations of
assumptions can be identified by specific patterns in the residual plots, along with statistical
tests such as the Bartlett test for homogeneity of variances.
Finally, an ordinary least squares regression model was estimated using PASW Statistics
18.
Where
PRICE = final price brought at auction,
= Seller side principal performance reputation,
= Seller side principal price reputation,
= Seller side agent performance reputation,
= Seller side agent price reputation,
= Seller side agent centrality,
= Buyer Side agent centrality,
Three control variables were modeled:
= Sire stud fee,
= Racing performance of dam, and
= Racing performance of siblings
Note that the natural logarithm of final auction hammer price ((ln)PRICE) is used in this
regression model. Thoroughbred Yearling pricing models typically utilize (ln)PRICE, as price
results typically do not follow a normal distribution. See Parsons and Smith(2008), Robbins and
Kennedy (2001), and Vickner and Koch (2001)for examples. Variables were mean centered to
allow for relative comparison of effect sizes of independent variables. Variance inflation factors
ranging from 1.020 to 1.426 suggest that multicollinearity is not a threat in the estimated
model.

92
Chapter Summary
The purpose of this chapter has been to present the set of methods that will be used to
test the effects of market signaling phenomena on business performance outcomes. Secondary
data from the Keeneland 2008 September Yearling Sale are collected to investigate the role of
third-party agents as links in the network connecting buyers and sellers and their effect on the
dependent variable of auction sale price. Key variables investigated include price and
performance reputation, centrality, and the actions of third-party agents. Control variables
which account for the specific qualities of the individual animals in the sale are included to
isolate the effects of these agents. Significance of the overall model and its regression
coefficients are examined and interpreted in relation to the hypothesized research model, and
the results are discussed in detail in the following chapter.
Copyright © Emily J. Plant 2010
93
CHAPTER FIVE: RESULTS
Introduction
The purpose of this chapter is to present the results of this study. The chapter begins
with a discussion of the sample. Several different sources of secondary data are employed
here. These openly available published sources were selected as representative of the
information that would typically be available to marketplace principals and agents to use in
planning interactions in this unique live auction marketplace. Subsequently, a report of the
procedures used to prepare the data is presented. The sample represents a percentage of the
total number of products transacted in this marketplace where the principals and agents are
operating. Finally, the results are presented.
Sample
Hypotheses are tested in the context of an auction for Thoroughbred yearlings. Data
was collected from the Keeneland September 2008 yearling sale, which is held annually at the
Keeneland Racetrack and Sales Company in Lexington, Kentucky. This is the largest individual
marketplace for this product in the world. In 2008, 3,605, out of a total 9,095 yearling’s sold in
North America, were sold at the Keeneland September sale, with transactions totaling
$327,999,100 out of the total gross revenues of $468,296,939. In 2008, 5,555 yearlings were
entered in the sale. A total of 760 horses entered into the sale were never presented at the
auction ring for sale, eliminating them from the sample. Another 1,190 horses did not bring a
bid for the minimum reserve amount at auction, classifying them as “reserve not attained”.
These horses were also excluded from the sample, as they were not engaged in a sale
transaction through the live auction. This left a final sample of 3,605, or 64.89% of the total
population of products registered for sale in the auction.
Data Preparation
All data for this study was compiled from published sources containing information
about the entities in the marketplace- seller side principals, seller side agents, and buyer side
agents and their principals. Some of this information is available for free; other sources must be
purchased. The Keeneland Corporation provides the complete results of their sale for
download in spreadsheet format from their website (Keeneland Association 2008) for free. The
94
data provides a unique numerical identifier for each yearling entered into the sale, along with
identification of the yearling’s seller side agent and if a sale is recorded as completed for the
item, the identification of the buyer side agent and the price at which the transaction was
recorded as complete.
Control variables accounting for the relative quality of each auction item (yearling) input
were obtained from the Thoroughbred Times Buyer’s Guide (Thoroughbred Times 2008). The
Thoroughbred Times Buyer’s Guide is available for purchase for a price of $185. Three classes of
variables were drawn from this source. First is the “stud fee” of the yearlings father, which is
the cost of breeding a mare to that particular stallion to produce a foal. This fee is typically the
first method of classifying yearling quality- better stallions have higher stud fees. Next is the
racing performance of the yearling’s dam. This is measured by the “Racing Index” (RI), which is
“based on the average earnings per start for all runners in the United States, Canada, England,
Ireland, France, Italy, Germany, Puerto Rico, Hong Kong, Australia, Argentina, Japan, and United
Arab Emirates. RI is determined by calculating the average earnings per start, divided into
males and females, of all starters in each individual country, and the average for each individual
year is by definition 1.00” (Thoroughbred Times 2008, p. 4). Horses with higher RI performed to
a higher standard than those with a lower RI. Finally, the total earnings of the yearling’s half
siblings (other foals born to the yearling’s dam) were totaled and divided by the number of half
siblings. This variable controls for the relative quality of the yearling’s half siblings, which, along
with the quality of the sire and dam, is used to gauge the relative quality of that yearling in
comparison to others. All data was coded into a Microsoft Excel database.
Data from the 2007 Keeneland yearling sale was also downloaded from the Keeneland
Association website. Variables for price reputation of the seller side agent (average price) and
seller side principal (average price) were tabulated from these databases. The data containing
details about leading breeders (seller side principal performance reputation) was downloaded
directly from the equineline.com website and included into the master Microsoft Excel
database. Likewise, the data from the Blood-Horse Marketwatch (Russo 2008) on performance
of seller side agents was manually entered into this master database. The manually entered
data was checked for error, with 25% (900) of the sample checked against the published data to
ensure accuracy. Seventeen errors were found, leading to an error rate of 1.8%.
From this master Microsoft Excel database, data for calculation of the centrality
measures was constructed. The name of the seller side principal, the seller side agent, and the
buyer side agent were pulled from the database, along with the sale price. This data was then

95
imported into Ucinet 6.0 for Windows and converted into a valued matrix of ties between
market participants for further analysis. This network was analyzed using the Freeman Node
Betweenness measure. This measure for any individual node is calculated by assessing the
proportion of ties linking two other nodes which pass through the node in question.
Betweenness is defined as “the share of times that a node i needs a node k (whose centrality is
being measured) in order to reach a node j via the shortest path” (Freeman 1978/79; Borgatti
2005, p. 60). The measure assesses the activity of the node in question and is often considered
a measure of the importance or prominence in a network (Van Den Bulte and Wuyts 2007). The
scores from this measure were exported from the Ucinet 6.0 program and then input into the
master Microsoft Excel database. Finally, all variables from the Microsoft Excel database were
transferred to PASW Statistics 18.0 for further analysis.
TABLE 5.1 Variables
Variable Description DV: Final auction price
(PRICE) dollar value of sale
Reputation (performance): seller side principal
(SSP_PERF_REP: seller side principal performance reputation) total dollars won by horses bred by principals year to date/ divided by total number of starters year to date- dollars/starter
Reputation (price): seller side principal
(SSP_$REP: seller side principal price reputation) average sales price of yearlings bred by principal and sold at Keeneland September sale 2007
Reputation (performance): seller side agent
(SSA_PERF_REP: seller side agent performance reputation) percentage of stakes winners from total number of yearlings sold by seller side agent from 2004 to 2006
Reputation (price): seller side agent
(SSA_$REP: seller side agent price reputation) average price of yearlings sold by seller side agent at Keeneland September yearling sale, 2007
Centrality: seller side agent, buyer side agent.
(SSA_CENT: seller side agent centrality) valued betweenness centrality, as calculated by Ucinet 6.0 (BSA_CENT: buyer side agent centrality) valued betweenness centrality, as calculated by Ucinet 6.0
Assumptions
All variables in the study were screened to assess the fit of the responses to a normal
distribution. Data normality is a fundamental assumption in all forms of multivariate analysis

96
(Hair, Anderson et al. 1998). Each variable was assessed for normality, linearity,
homoscedasticity, and independence of error terms using histograms, stem-and-leaf plots,
normal probability plots, and measures of skewness and kurtosis. Variables including price, sire,
dam, siblings, ssp_perf_rep, ssp_$rep, ssa_perf_rep, ssa_$rep, ssa_cent,and bsa_cent exhibited
excessive skewness and/or kurtosis. Procedures for remedying nonnormality (e.g. Curran, West
et al. 1995; Hair, Anderson et al. 1998) were followed, and the offending variables were
transformed prior to their use in subsequent analysis. Examination of the plots of the offending
variables indicated the use of logarithmic transformations for price, sire, dam, siblings,
ssp_perf_rep, ssa_perf_rep, ssa_cent,and bsa_cent . Distributions of ssp_$rep, ssa_$rep
necessitated the use of a square-root transformation. All variables in the model achieved
acceptable levels of normality after transformation. One variable, siblings, exhibits slightly high
values of kurtosis-- 2.764 which is just outside the Hair’s (1998) guidelines of +/- 2.58.
Examination of further evidence (i.e. histograms, stem-and-leaf plots, probability plots) indicate
that distribution is acceptably close to normality.
Descriptive Statistics for Focal Research Variables
The purpose of this section is to report descriptive statistics for the variables used in
this study. First, reputation study variables will be described. Then, measures used to assess
network centrality will be presented. All descriptive statistics presented herein are based on
raw data.
Reputation
The reputation variables collected include those representing the seller side principal
and seller side agent. These are further classified into performance reputation and price
reputation.
Performance Reputation
Seller Side Principal
Seller side principal performance reputation was taken from a published report of
dollars won by yearling breeders for the year to date up to the time of the Keeneland yearling
sale. This list is restricted to the top 300 leading breeders in North America, and as such this
variable has many seller side principals for which there is no information-- 61.7% of the
population, or 2,223 total sale transactions. While this leaves many entities with a score of zero
for seller side principal reputation, the very fact that a particular principal is or is not on the list
97
is a source of information. If the principal is included on this list of leading breeders, it is telling
of its place in the market as a leading participant. If it is not, then it is a more minor player, with
not as much performance reputation in the marketplace. Maximum dollars per starter for a
principal in the sample is $1,047,2541 with a mean of $37,158 and a standard deviation of
$51,691. Minimum dollars per starter is $2,088.
Seller Side Agent
Seller side agent performance reputation is a measure of the percentage of stakes
winners that resulted from yearlings sold by seller side agents in the years 2004 to 2006 and
racing in the time period of January 1, 2005 through June 5, 2008. This list is restricted to those
seller side agents that offered at least 20 yearlings for sale during this time period. The
percentage of stakes winners is a figure often touted by seller side agents in promoting their
ability to sell high performing products (Figures 5.2 – 5.3). There were a total of 283 sale
transactions where the seller side agent had no past performance reputation, and were coded
zero stakes winners. The maximum percentage of stakes winners for seller side agents was .13,
with a mean of .051 and a standard deviation of .023.
Price Reputation
Seller Side Agent
Seller side agent price reputation is measured based on the average selling price for
that agent for the prior year of the Keeneland September yearling sale. The average selling
price for agents is a commonly used measure to assess the relative performance of those
agents. This metric is published in the industry trade publications such as The Thoroughbred
Times (Figure 5.1), The Blood-Horse, and The Blood-Horse Marketwatch (e.g., Russo 2008;
Thoroughbred Times 2008; The Blood-Horse MarketWatch 2009). This variable was drawn from
the official Keeneland sales results for the 2007 sale (Keeneland Association 2007), representing
the reputation of the agent in this marketplace. While the results included the complete history
of sales, there were several seller side agents transacting in the marketplace in the year of study
(2008) who had not transacted there before. This is not missing data per se, but rather a zero
score for reputation. There were a total of 84 sale transactions where the seller side agent was
assigned a zero for price reputation. The maximum average sale price for seller side agents was
$400,000, with a mean of $104,193 and a standard deviation of $57,151.
Seller Side Principal

98
Like seller side agent price reputation, seller side principal price reputation was
calculated based on the results of the prior-year Keeneland September yearling sale. The
principal names were obtained from the Thoroughbred Times Buyer’s Guide (Thoroughbred
Times 2007), and input into the master database containing sales results. A total of 912 sale
transactions were conducted by seller side principals that had no prior year price reputation to
draw from, giving them a price reputation of zero. The maximum average price for seller side
principals was $1,296,667, with a mean of $81,744 and a standard deviation of $102,651.
TABLE 5.2
Descriptive Statistics for Reputation Variables
N Minimum Maximum Mean Std. Deviation
SSP_PERF_REP 3605 0.00 19,248,406.00 1,413,656.38 3,565,573.22
SSP_$REP 3605 0.00 1,296,667.67 81,744.51 102,651.30
SSA_PERF_REP 3605 0.00 108.00 29.311 33.38
SSA_$REP 3605 0.00 400,000.00 104,193.12 57,151.79
Centrality
The network measure of Freeman Betweenness Centrality was calculated for both the
seller side agent and the buyer side agent. Data from the 2007 and 2008 Keeneland September
yearling sale were compiled for this measure, representing both the present and near-past
network position of each marketplace participant considered as a whole, giving a more
enduring and complete representation of that participant’s position relative to just assessing
the present year or past year singularly. This centrality calculation utilized valued ties which
were not directed, meaning that a tie is indicated between two parties regardless of the
direction of the tie. For example, even though in this scenario there are parties on the buyer
side who purchase products from those on the seller side, the ties measured do not account for
the direction of the transaction from seller to buyer. This measure for any individual node is
calculated by assessing the proportion of ties linking two other nodes which pass through the
node in question. Betweenness is defined as the share of times that a node i needs a node k
(whose centrality is being measured) in order to reach a node j via the shortest path (Freeman
1978/79; Borgatti 2005, p. 60). The measure assesses the activity of the node in question and is
often considered a measure of the importance or prominence in a network (Van Den Bulte and
Wuyts 2007).

99
Seller Side Agent
Maximum betweenness centrality for seller side agents was 1,736,599, with a mean of
479,576 and a standard deviation of 528,983.
Buyer Side Agent
Maximum betweenness centrality for buyer side agents was 221,504, with a mean of
26,763 and a standard deviation of 42,545.
TABLE 5.3
Descriptive Statistics for Centrality Variables
N Minimum Maximum Mean Std. Deviation
SSA_CENT 3605 1.00 1,736,599.38 478,576.94 528,983.19
BSA_CENT 3605 1.00 221,504.91 26,763.92 42,545.89
Descriptive Statistics for Control Variables
This section reports descriptive statistics for the control variables used in this study.
These variables control for the relative quality of the inputs of the item offered for sale. Inputs
of the parentage and siblings of the yearling in question are included.
Sire
Stud fee for 2008 captures the influence of the quality of the sire side input of the
auction item (yearling) in question. Sire stud fee is a publicly advertised price which is the cost
for the female horse (dam) owner to breed to that particular sire to produce a foal. Keeneland
sales company uses sire stud fee as one of the main bases for placing yearlings in the sale, with
higher priced stud fees occurring in earlier books (Blood-Horse Publications 2004). There were
202 items sold that had no stud fee for 2008 associated with them. These sires could be
deceased or pensioned from stud duty. The last known stud fee for these stallions was used in
this model. Maximum sire stud fee in this sample is $300,000, with a mean of 91,026 and a
standard deviation of 53,780.
Dam
While the price of the sire stud fee is an important variable in assessing the base quality
of the item in question, the quality of the dam is also important. The quality of the dam is
measured here by the maximum Racing Index she received while in her racing career. This is a
widely used statistic to compare the overall performance of race horses, and is published in the
Thoroughbred Times Buyer’s Guide. The maximum Racing Index for dams in this sample was 63,
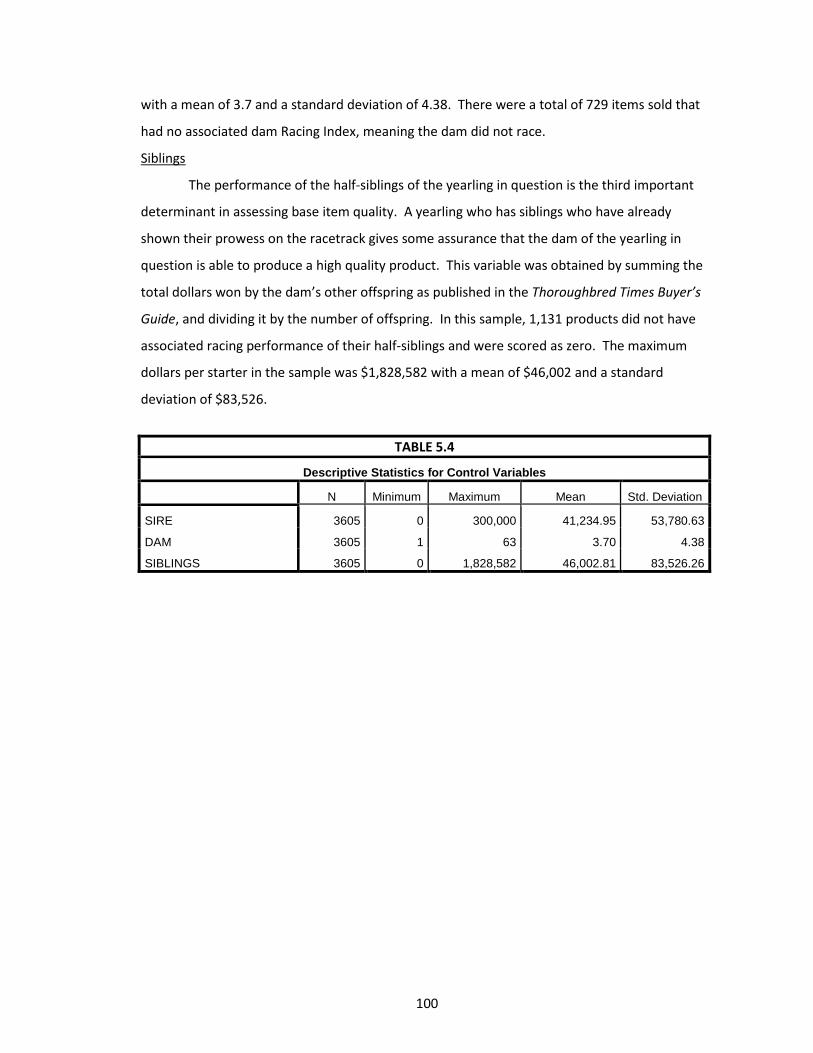
100
with a mean of 3.7 and a standard deviation of 4.38. There were a total of 729 items sold that
had no associated dam Racing Index, meaning the dam did not race.
Siblings
The performance of the half-siblings of the yearling in question is the third important
determinant in assessing base item quality. A yearling who has siblings who have already
shown their prowess on the racetrack gives some assurance that the dam of the yearling in
question is able to produce a high quality product. This variable was obtained by summing the
total dollars won by the dam’s other offspring as published in the Thoroughbred Times Buyer’s
Guide, and dividing it by the number of offspring. In this sample, 1,131 products did not have
associated racing performance of their half-siblings and were scored as zero. The maximum
dollars per starter in the sample was $1,828,582 with a mean of $46,002 and a standard
deviation of $83,526.
TABLE 5.4
Descriptive Statistics for Control Variables
N Minimum Maximum Mean Std. Deviation
SIRE 3605 0 300,000 41,234.95 53,780.63
DAM 3605 1 63 3.70 4.38
SIBLINGS 3605 0 1,828,582 46,002.81 83,526.26
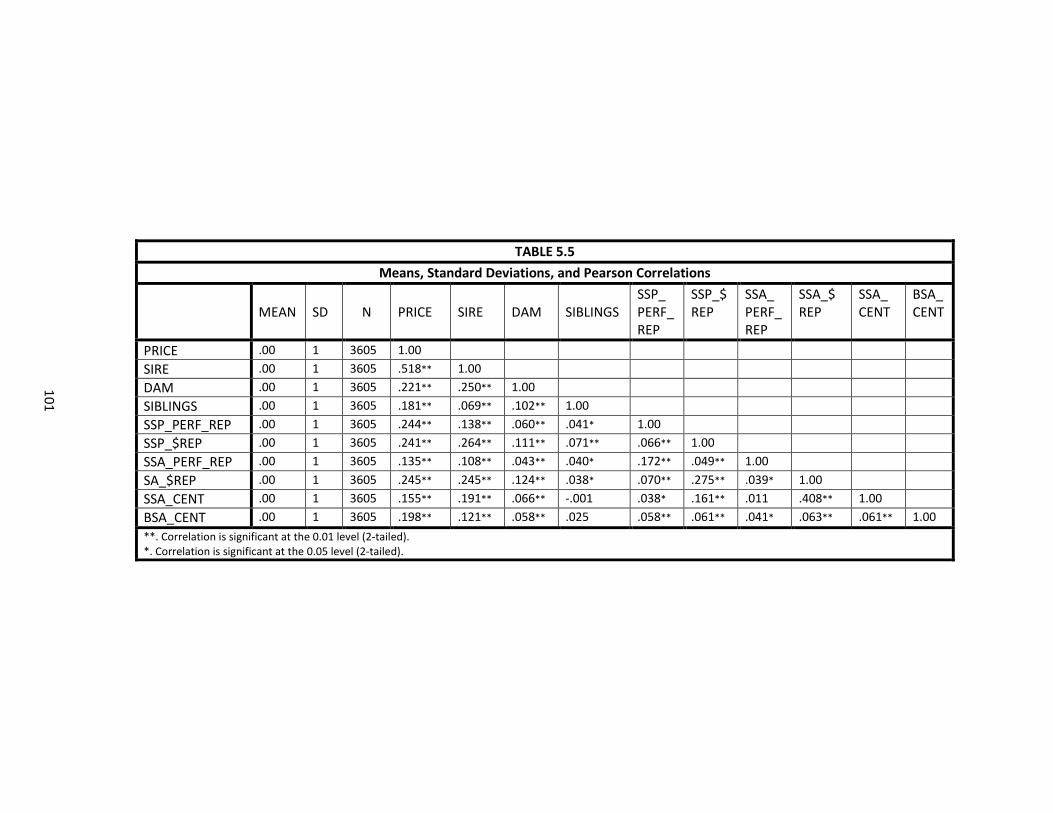
TABLE 5.5
Means, Standard Deviations, and Pearson Correlations
MEAN
SD
N
PRICE
SIRE
DAM
SIBLINGS
SSP_ PERF_ REP
SSP_$ REP
SSA_ PERF_ REP
SSA_$ REP
SSA_ CENT
BSA_CENT
PRICE .00 1 3605 1.00
SIRE .00 1 3605 .518** 1.00
DAM .00 1 3605 .221** .250** 1.00
SIBLINGS .00 1 3605 .181** .069** .102** 1.00
SSP_PERF_REP .00 1 3605 .244** .138** .060** .041* 1.00
SSP_$REP .00 1 3605 .241** .264** .111** .071** .066** 1.00
SSA_PERF_REP .00 1 3605 .135** .108** .043** .040* .172** .049** 1.00
SA_$REP .00 1 3605 .245** .245** .124** .038* .070** .275** .039* 1.00
SSA_CENT .00 1 3605 .155** .191** .066** -.001 .038* .161** .011 .408** 1.00
BSA_CENT .00 1 3605 .198** .121** .058** .025 .058** .061** .041* .063** .061** 1.00
**. Correlation is significant at the 0.01 level (2-tailed). *. Correlation is significant at the 0.05 level (2-tailed).
101
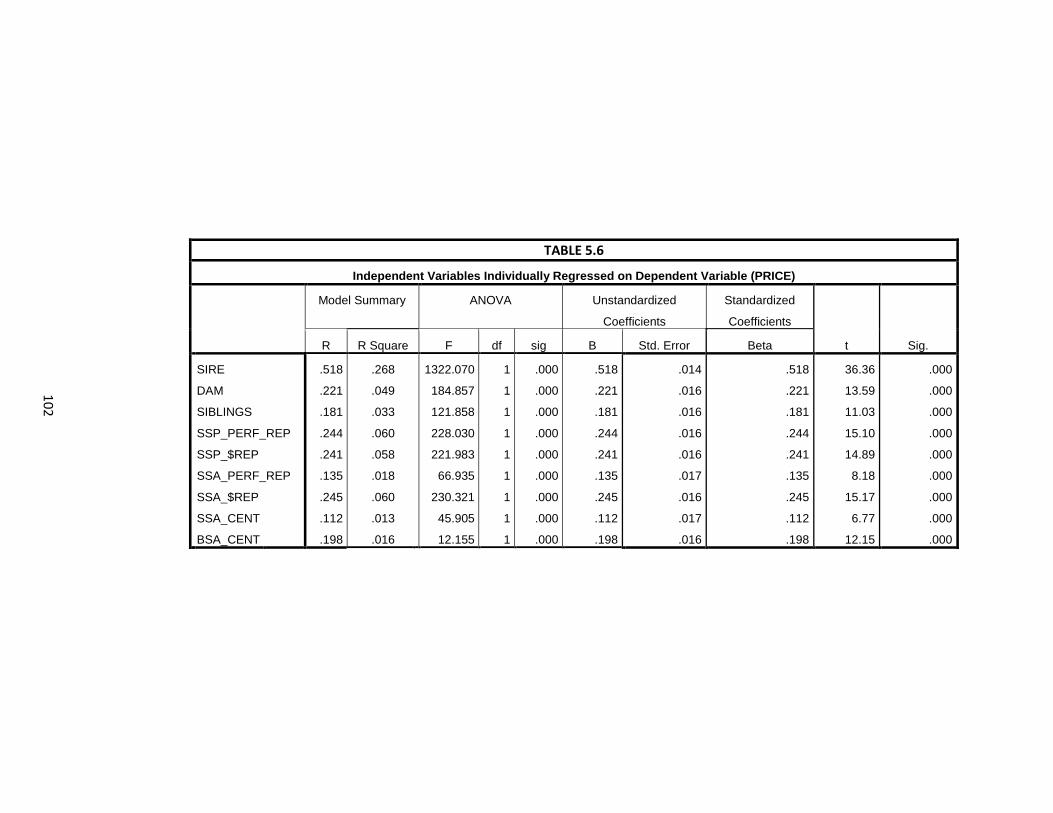
TABLE 5.6
Independent Variables Individually Regressed on Dependent Variable (PRICE)
Model Summary ANOVA Unstandardized
Coefficients
Standardized
Coefficients
t Sig. R R Square F df sig B Std. Error Beta SIRE
DAM
SIBLINGS
SSP_PERF_REP
SSP_$REP
SSA_PERF_REP
SSA_$REP
SSA_CENT
BSA_CENT
.518
.221
.181
.244
.241
.135
.245
.112
.198
.268
.049
.033
.060
.058
.018
.060
.013
.016
1322.070
184.857
121.858
228.030
221.983
66.935
230.321
45.905
12.155
1
1
1
1
1
1
1
1
1
.000
.000
.000
.000
.000
.000
.000
.000
.000
.518
.221
.181
.244
.241
.135
.245
.112
.198
.014
.016
.016
.016
.016
.017
.016
.017
.016
.518
.221
.181
.244
.241
.135
.245
.112
.198
36.36
13.59
11.03
15.10
14.89
8.18
15.17
6.77
12.15
.000
.000
.000
.000
.000
.000
.000
.000
.000
102
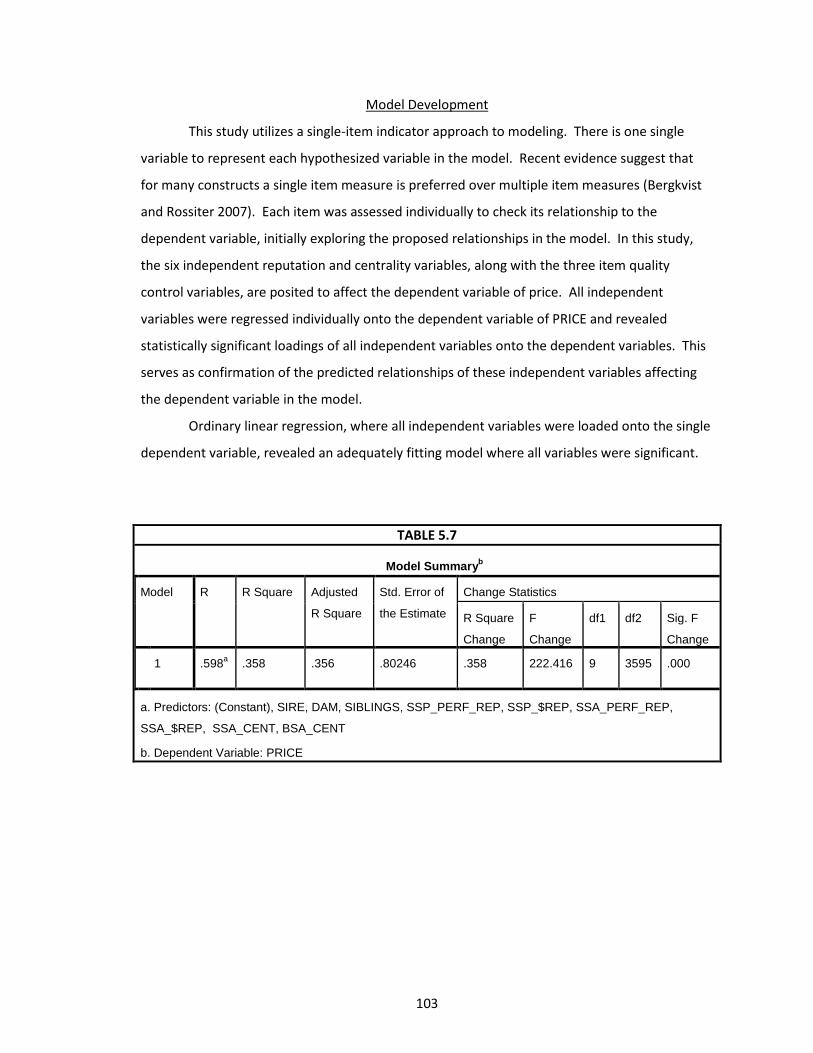
103
Model Development
This study utilizes a single-item indicator approach to modeling. There is one single
variable to represent each hypothesized variable in the model. Recent evidence suggest that
for many constructs a single item measure is preferred over multiple item measures (Bergkvist
and Rossiter 2007). Each item was assessed individually to check its relationship to the
dependent variable, initially exploring the proposed relationships in the model. In this study,
the six independent reputation and centrality variables, along with the three item quality
control variables, are posited to affect the dependent variable of price. All independent
variables were regressed individually onto the dependent variable of PRICE and revealed
statistically significant loadings of all independent variables onto the dependent variables. This
serves as confirmation of the predicted relationships of these independent variables affecting
the dependent variable in the model.
Ordinary linear regression, where all independent variables were loaded onto the single
dependent variable, revealed an adequately fitting model where all variables were significant.
TABLE 5.7
Model Summaryb
Model R R Square Adjusted
R Square
Std. Error of
the Estimate
Change Statistics
R Square
Change
F
Change
df1 df2 Sig. F
Change
1 .598a .358 .356 .80246 .358 222.416 9 3595 .000
a. Predictors: (Constant), SIRE, DAM, SIBLINGS, SSP_PERF_REP, SSP_$REP, SSA_PERF_REP,
SSA_$REP, SSA_CENT, BSA_CENT
b. Dependent Variable: PRICE
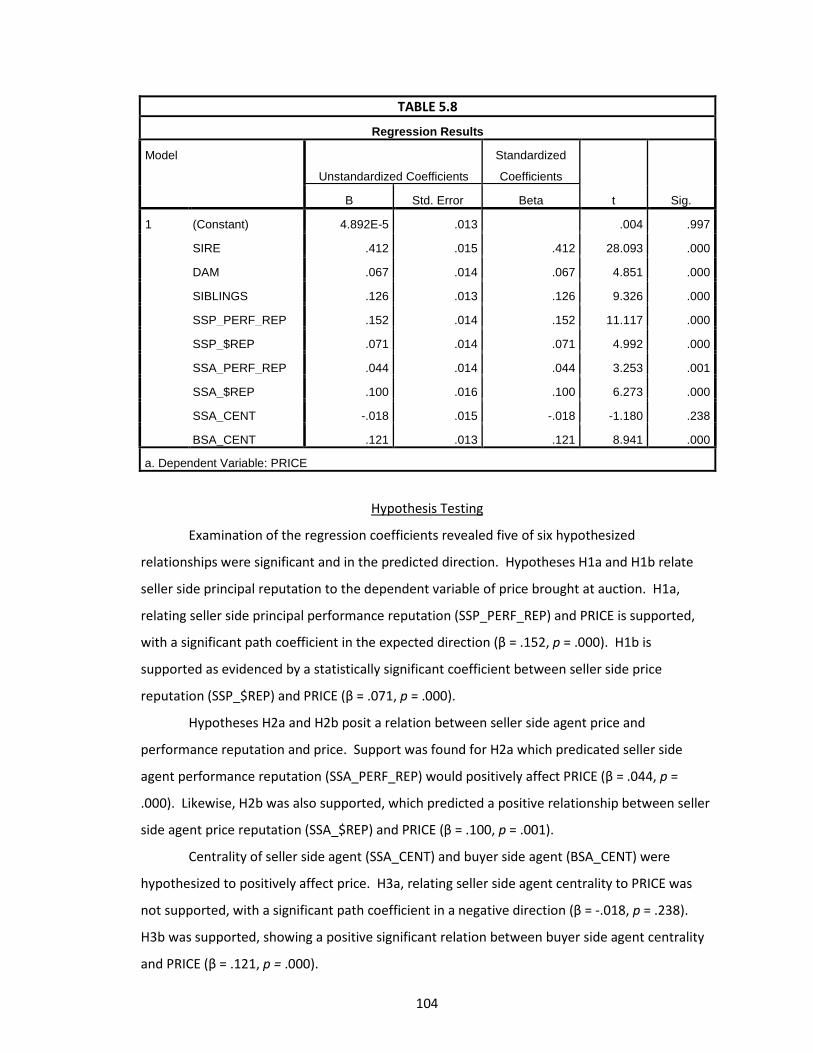
104
TABLE 5.8
Regression Results
Model
Unstandardized Coefficients
Standardized
Coefficients
t Sig. B Std. Error Beta
1 (Constant) 4.892E-5 .013 .004 .997
SIRE .412 .015 .412 28.093 .000
DAM .067 .014 .067 4.851 .000
SIBLINGS .126 .013 .126 9.326 .000
SSP_PERF_REP .152 .014 .152 11.117 .000
SSP_$REP .071 .014 .071 4.992 .000
SSA_PERF_REP .044 .014 .044 3.253 .001
SSA_$REP .100 .016 .100 6.273 .000
SSA_CENT -.018 .015 -.018 -1.180 .238
BSA_CENT .121 .013 .121 8.941 .000
a. Dependent Variable: PRICE
Hypothesis Testing
Examination of the regression coefficients revealed five of six hypothesized
relationships were significant and in the predicted direction. Hypotheses H1a and H1b relate
seller side principal reputation to the dependent variable of price brought at auction. H1a,
relating seller side principal performance reputation (SSP_PERF_REP) and PRICE is supported,
with a significant path coefficient in the expected direction (β = .152, p = .000). H1b is
supported as evidenced by a statistically significant coefficient between seller side price
reputation (SSP_$REP) and PRICE (β = .071, p = .000).
Hypotheses H2a and H2b posit a relation between seller side agent price and
performance reputation and price. Support was found for H2a which predicated seller side
agent performance reputation (SSA_PERF_REP) would positively affect PRICE (β = .044, p =
.000). Likewise, H2b was also supported, which predicted a positive relationship between seller
side agent price reputation (SSA_$REP) and PRICE (β = .100, p = .001).
Centrality of seller side agent (SSA_CENT) and buyer side agent (BSA_CENT) were
hypothesized to positively affect price. H3a, relating seller side agent centrality to PRICE was
not supported, with a significant path coefficient in a negative direction (β = -.018, p = .238).
H3b was supported, showing a positive significant relation between buyer side agent centrality
and PRICE (β = .121, p = .000).
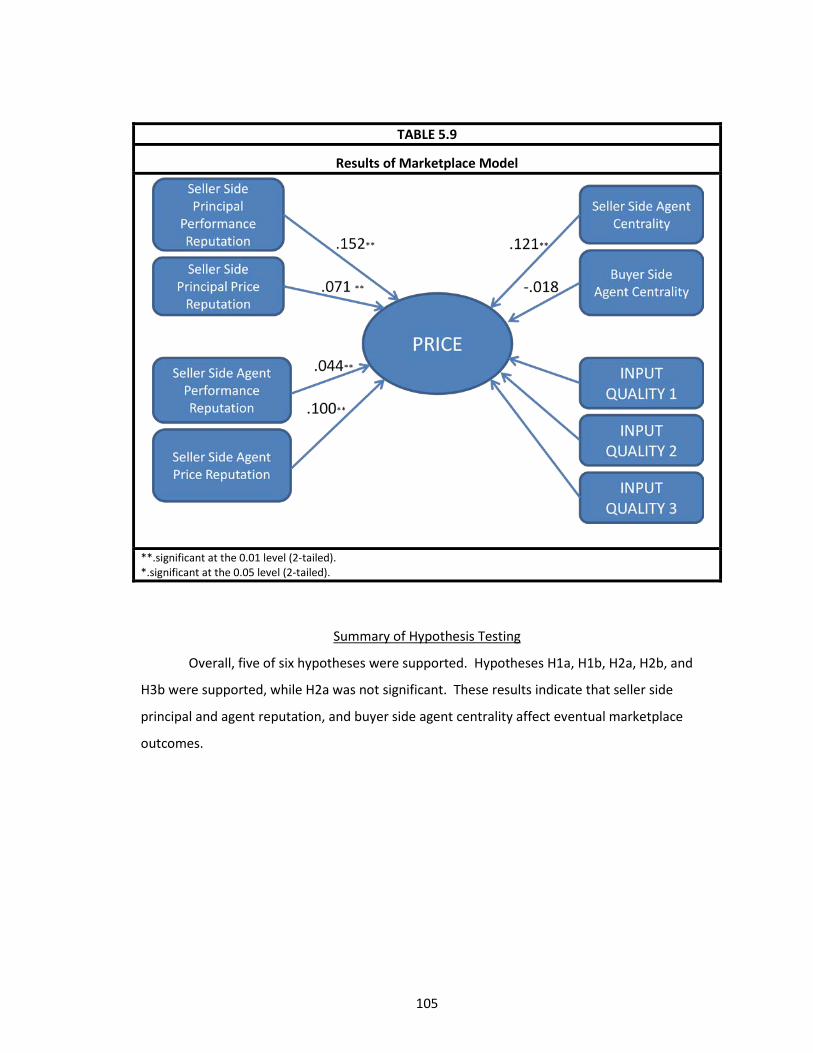
105
TABLE 5.9
Results of Marketplace Model
**.significant at the 0.01 level (2-tailed). *.significant at the 0.05 level (2-tailed).
Summary of Hypothesis Testing
Overall, five of six hypotheses were supported. Hypotheses H1a, H1b, H2a, H2b, and
H3b were supported, while H2a was not significant. These results indicate that seller side
principal and agent reputation, and buyer side agent centrality affect eventual marketplace
outcomes.
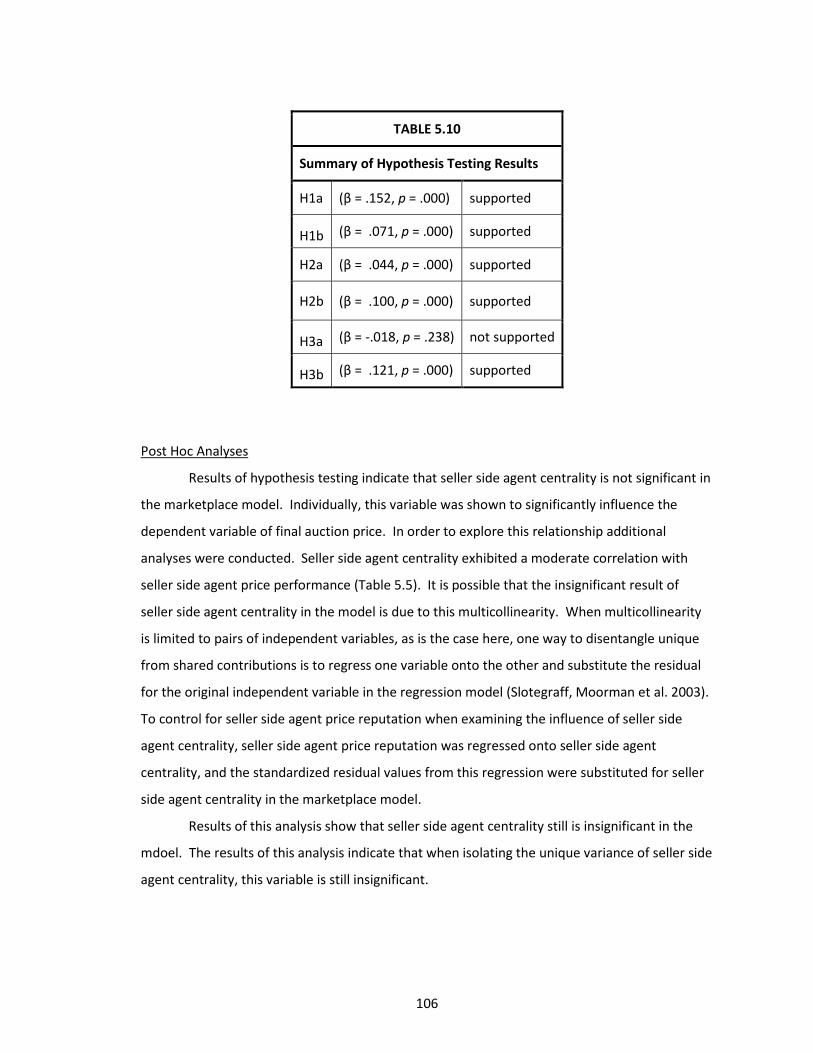
106
Post Hoc Analyses
Results of hypothesis testing indicate that seller side agent centrality is not significant in
the marketplace model. Individually, this variable was shown to significantly influence the
dependent variable of final auction price. In order to explore this relationship additional
analyses were conducted. Seller side agent centrality exhibited a moderate correlation with
seller side agent price performance (Table 5.5). It is possible that the insignificant result of
seller side agent centrality in the model is due to this multicollinearity. When multicollinearity
is limited to pairs of independent variables, as is the case here, one way to disentangle unique
from shared contributions is to regress one variable onto the other and substitute the residual
for the original independent variable in the regression model (Slotegraff, Moorman et al. 2003).
To control for seller side agent price reputation when examining the influence of seller side
agent centrality, seller side agent price reputation was regressed onto seller side agent
centrality, and the standardized residual values from this regression were substituted for seller
side agent centrality in the marketplace model.
Results of this analysis show that seller side agent centrality still is insignificant in the
mdoel. The results of this analysis indicate that when isolating the unique variance of seller side
agent centrality, this variable is still insignificant.
TABLE 5.10
Summary of Hypothesis Testing Results
H1a (β = .152, p = .000) supported
H1b (β = .071, p = .000) supported
H2a (β = .044, p = .000) supported
H2b (β = .100, p = .000) supported
H3a (β = -.018, p = .238) not supported
H3b (β = .121, p = .000) supported
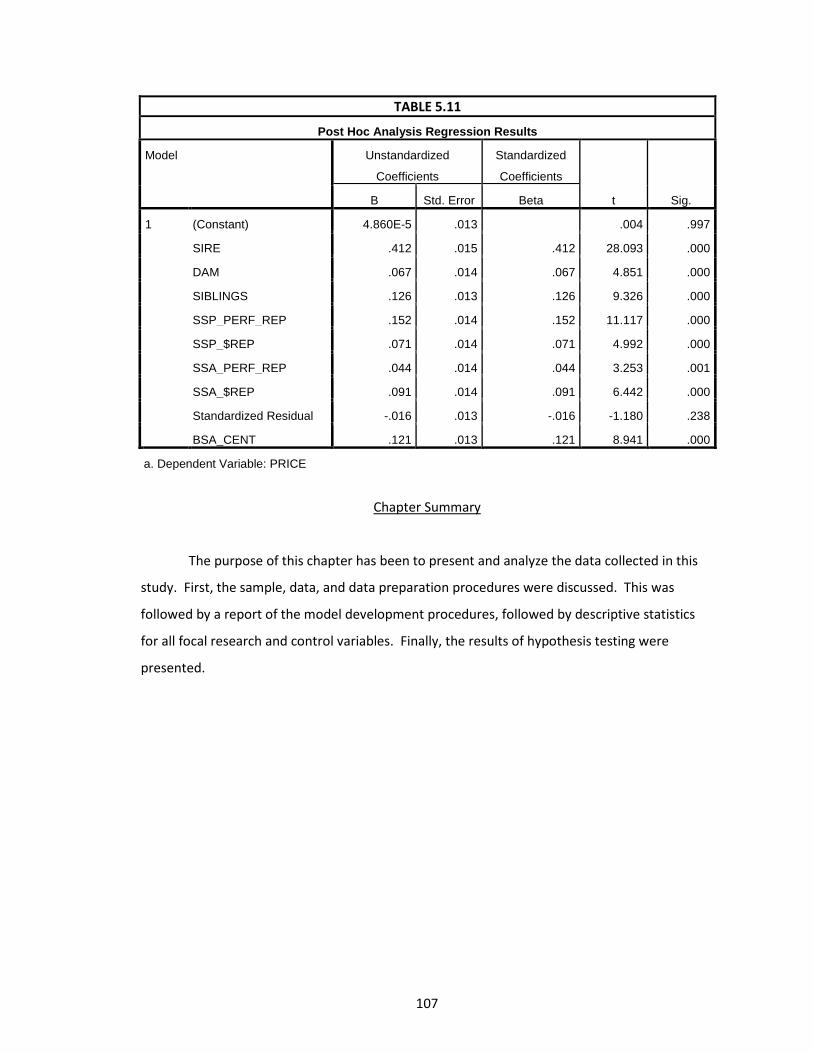
107
TABLE 5.11
Post Hoc Analysis Regression Results
Model Unstandardized
Coefficients
Standardized
Coefficients
t Sig. B Std. Error Beta
1 (Constant) 4.860E-5 .013 .004 .997
SIRE .412 .015 .412 28.093 .000
DAM .067 .014 .067 4.851 .000
SIBLINGS .126 .013 .126 9.326 .000
SSP_PERF_REP .152 .014 .152 11.117 .000
SSP_$REP .071 .014 .071 4.992 .000
SSA_PERF_REP .044 .014 .044 3.253 .001
SSA_$REP .091 .014 .091 6.442 .000
Standardized Residual -.016 .013 -.016 -1.180 .238
BSA_CENT .121 .013 .121 8.941 .000
a. Dependent Variable: PRICE
Chapter Summary
The purpose of this chapter has been to present and analyze the data collected in this
study. First, the sample, data, and data preparation procedures were discussed. This was
followed by a report of the model development procedures, followed by descriptive statistics
for all focal research and control variables. Finally, the results of hypothesis testing were
presented.
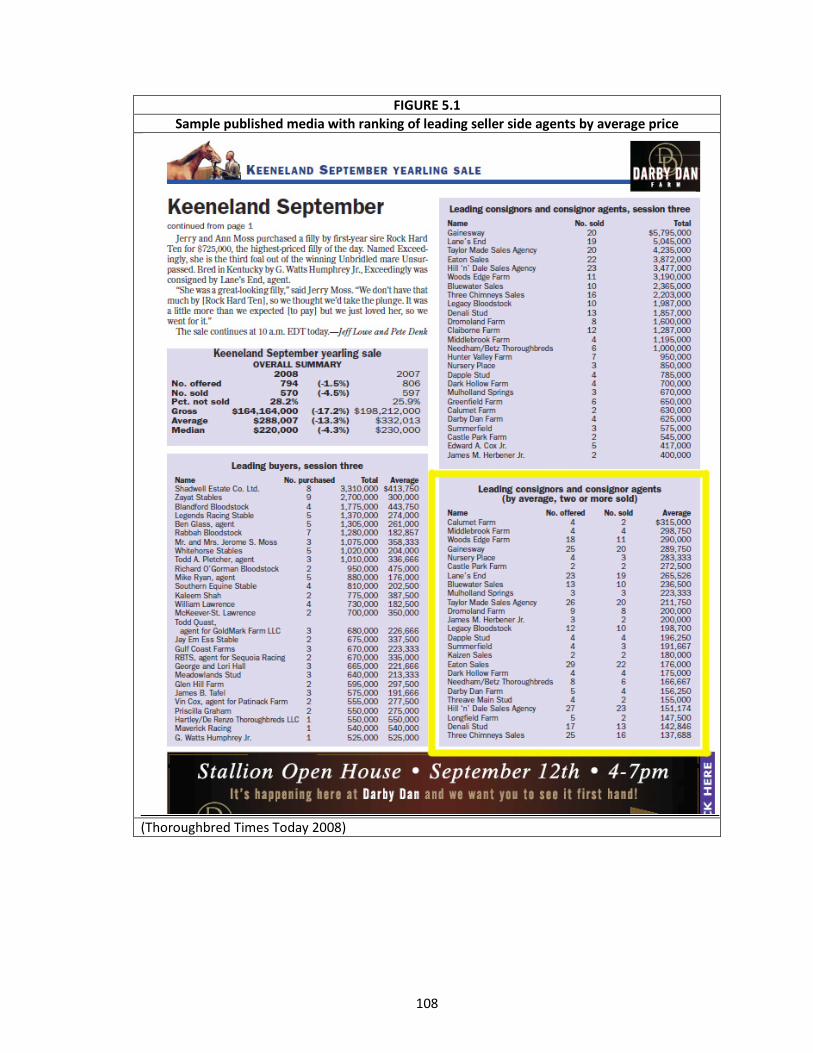
108
FIGURE 5.1 Sample published media with ranking of leading seller side agents by average price
(Thoroughbred Times Today 2008)

109
FIGURE 5.2 Sample published media- seller side agent promoting percentage of stakes winners
(Monticule 2008)

110
FIGURE 5.3 Sample published media- seller side agent promoting percentage of stakes winners
(Vinery 2008)
Copyright © Emily J. Plant 2010
111
CHAPTER SIX: DISCUSSION
Introduction
The purpose of this chapter is to discuss the research implications. First, theoretical and
managerial implications will be discussed. The chapter then concludes with the research
limitations and future research directions.
Theoretical implications
Signaling
Signals convey information to marketplace participants regarding the unobservable
quality of a product. Whenever quality is unobservable prior to purchase, there is the risk of
adverse selection. Adverse selection, which is also known as the problem of hidden
information, occurs pre-contractually when the principal is unable to verify ahead of time that
the agent has the desired skills and qualities. Problems of hidden information also occur in the
consumer marketplace when the consumer is unable to verify the quality of a good prior to
purchase. The sending, receiving, and interpretation of signals are potential ways to overcome
the problem of adverse selection. In general, there is a lack of empirical evidence for signaling
hypotheses (Boulding and Kirmani 1993; Caves and Greene 1996; Erdem and Swait 1998; San
Martin and Camarero 2005; Biswas, Dutta et al. 2006; Erdem, Swait et al. 2006), particularly
that which links signaling to business performance outcomes.
This research provides empirical evidence for signaling hypotheses, demonstrating that
reputation serves as a marketplace signal to convey unobservable information about products
offered for sale. Buyers in a marketplace look to the price and performance reputation of seller
side principals and agents for signals to indicate which products are most desirable. Those
seller side principals and agents who can send credible signals will be rewarded in the
marketplace with higher prices for their goods.
Evidence indicates that participants on the buyer side of the marketplace will look to
the reputation of both the seller (seller side agent) and manufacturer (seller side principal) of
the good. Seller side principals who have a reputation for producing products with a higher
average price and seller side agents who have a reputation for selling products with a higher
average price are both associated with higher prices brought at auction. Seller side principal
and agent reputation for selling high performing goods also shows a positive association with

112
price. This supports previous findings that reputation is seen by consumers as a signal of
product quality, and that manufacturers can signal product quality by selling through a
reputable retailer (e.g., Chu and Chu 1994; Dawar and Parker 1994).
This research examines signaling beyond the dyad, examining the influence of signals
throughout the entire network of buyers and sellers in the marketplace. There are many
situations where a signal does not affect just one sender and one receiver; multiple
constituencies may be aware of and react to a given signal. A limited number of studies have
considered agency relationships beyond the dyadic level (e.g., Anderson, Hakansson et al. 1994;
Rindfleisch and Moorman 2001; Dahlstrom and Ingram 2003). This study incorporates the
actions of seller side principals, seller side agents, and buyer side agents when examining the
marketplace signals and provides a new perspective and better vantage point from which to
test signaling theory. In a marketplace where buyer and seller do not actually meet, it is
impossible to hypothesize about their relationship without considering it in a network context.
Social Networks in Marketing
A key tenent of this network approach is that it allows for the testing of the effect of
network positioning on business performance outcomes. Markets are social processes where
observation of the actions of other participants is critical in determining interest. More
interested parties indicates that a product carries a higher valuation (Rothkopf 1969). The seller
side agent is posited to use their position in the marketplace to gather and utilize information
about buyer side interest in order to obtain the highest possible price for their goods. These
agents can look to records of past marketplaces to determine the past behavior of the buyer
side participants and infer possible future behavior (Milgrom 1981; Ashenfelter 1989). In
addition, buyer side agents look to the actions of others to determine what actions they should
take (White 1981; White 1981; Granovetter 1985; Podolny 1993). Those buyer side agents that
are more central will have more access to information and will be more visible in the
marketplace. They will be conducting many transactions with many different parties, and their
actions will serve as a visible signal to the other agents. Buyer side agents will use the bidding
action of others in consideration of their willingness to pay for a good. More bidders willing to
bid more money indicates positive information regarding the quality of the good (Milgrom and
Weber 1982). The more central buyer side agents are more active and prominent in the
marketplace, and their actions will thus be the most visible. Likewise, seller side agents will be
more aware of the actions of these more central buyer side agents and can use information

113
regarding which products they are interested in to possibly foster interest from other buyer side
agents. This theory is supported in this research as buyer side agents with relatively higher
centrality measures are associated with relatively higher prices paid for goods at auction.
Managerial implications
Managers should consider the reputation of the companies with which they enter into
partnership and look beyond the dyad to the broader network of companies with which they
are transacting. Buyers read marketplace signals to determine their willingness to pay for
goods, and this includes signals from both the retailer itself and the manufacturer of the good.
Likewise, manufacturers must also be aware of the reputation of the retailer through which
they are selling their goods. Consumers read marketplace signals to provide evidence of
unobservable quality, and this perceived quality can affect overall revenues for a firm.
Second, managers should be aware of their relative position in the marketplace and
take this position into consideration when making decisions. This study suggests that those on
the buying side must be cautious when displaying their intentions to purchase as this could lead
to negative consequences in the form of higher prices. As other buyers find out what products
a more central buyer is interested in, they too will become interested in that product. Seller
side agents can potentially leverage information of buyer side interest to foster interest from
other participants on the buyer side. Competition when attempting to make a purchase can
drive up prices as more people compete for the same resource.
Limitations and Future Research
The limitations of this research should be noted. First, this study is limited in data
available for constructing reputation variables. Reputation is established by fulfilling signaling
promises over time (Herbig and Milewicz 1994; Herbig and Milewicz 1996), which implies a
long-term measurement time frame. Ideally, long term measures tracing back multiple years
would be utilized for the study. However this information is limited by the fact that complete
information is not available prior to the year 2007. The researcher had to manually gather
much of the data, and so the data is limited to the year when the researcher began to collect
this data. Additionally, some information is not available through any published means, forcing
reliance on limited information contained in published sources. For example, data on principal
performance reputation was limited to the top 300 seller side principals as ranked by total
dollars earned through racing for the year, limiting the number of principals for which complete

114
data is available. This presents an opportunity for future research, as the researcher can
continue to collect the relevant data moving forward from 2007 and revisit the study
hypotheses with more complete data.
Second, the data is limited by the hidden nature of some parties transacting in the
marketplace. The true identity of the buyer side principal is unknown, so the network is
calculated based on the seller side principal, the seller side agent, and the buyer side agent.
This is not entirely limiting as the buyer side agent is the entity actually transacting visibly in the
marketplace, so it is their actions and not the actions of the buyer side agent that will serve as
signals to the rest of the marketplace. Likewise, the data only records the network of
completed transactions. This does not capture other parties that were interested in an item or
who was actually involved in bidding- only the final details of who won the auction. Items
which were offered for sale but did not meet the minimum price for a sale (reserve not
attained) are also not included.
Finally, there is no way to control for the non-phenotypic qualities of the items offered
for sale. These are living creatures who are assessed for quality based not only on the variables
which can be quantified but also those that are impossible to measure. A product may be
comprised of expensive and highly desirable inputs, but if it is flawed in physical structure this
will affect the sale price. Controlling for these qualities is extremely difficult if not impossible.
Every marketplace participant has different guidelines for what physical traits they consider
desirable. Likewise, they all have different limitations on physical flaws that are undesirable.
Future research may attempt to control for these qualities by drawing on the researcher
experience in the marketplace to make expert judgment regarding the overall physical qualities
of the item in question.
Future research should employ samples from other auction marketplaces to assess if
these results are generalizable to other populations. Although this study uses the sample of the
largest marketplace in the world for this item so as to get a robust sample, other smaller
markets for this good may operate through different mechanisms. There are multiple other
marketplaces for this same good operating throughout the United States and abroad, and these
marketplaces could be tested for replication. Additionally, a sample could be drawn from a
similar open marketplace for another type of good.
This study will continue longitudinally to follow the eventual racing performance
outcomes of the agents in this study. The on-track racing performance of the yearlings in this

115
study will be tracked and included in the model to examine the selection performance of the
buyer side agents.
Conclusion
The purpose of this research has been to examine signaling in a network marketplace.
Using data collected from the world’s single largest marketplace for thoroughbred yearlings,
this study demonstrates that signals sent by entities in the marketplace have an effect on
business performance outcomes. One type of signal specifically examined is reputation. Seller
side principals and agents who have a reputation for producing or selling high-priced goods will
be rewarded in the marketplace with relatively higher prices for their goods. Seller side agents
who have a reputation for selling high performing goods will likewise be rewarded. Finally,
buyer side agents who are more central in the marketplace will pay relatively higher prices for
goods due to their visibility and prominence in the marketplace. Although this research
provides important theoretical and managerial implications, additional research is needed to
further explore marketplace signaling effects on business performance outcomes.
Copyright © Emily J. Plant 2010

116
REFERENCES
Acharya, S. (1988). "A Generalized Econometric Model and Tests of a Signalling Hypothesis with Two Discrete Signals." Journal of Finance 43(2): 413-429. Achrol, R. S. (1997). "Changes in the Theory of Interorganizational Relations in Marketing: Toward a Network Paradigm." Journal of the Academy of Marketing Science 25(1): 56-71. Achrol, R. S. and P. Kotler (1999). "Marketing in the Network Economy." Journal of Marketing 63(4): 146-163. Achrol, R. S., T. Reve, et al. (1983). "The Environment of Marketing Channel Dyads: A Framework for Comparative Analysis." The Journal of Marketing 47(4): 55-67. Aiken, K. D. and D. M. Boush (2006). "Trustmarks, Objective-Source Ratings, and Implied Investments in Advertising: Investigating Online Trust and the Context-Specific Nature of Internet Signals." Journal of the Academy of Marketing Science 34(3): 308-323. Akerlof, G. A. (1970). "The Market for "Lemons": Quality Uncertainty and the Market Mechanism." Quarterly Journal of Economics 84(3): 488-500. Amaldoss, W. and S. Jain (2005). "Pricing of Conspicuous Goods: A Competitive Analysis of Social Effects." Journal of Marketing Research 42(1): 30-42. Anderson, E. and R. L. Oliver (1987). "Perspectives on Behavior-Based Versus Outcome-Based Salesforce Control Systems." Journal of Marketing 51(4): 76-88. Anderson, J. C., H. Hakansson, et al. (1994). "Dyadic Business Relationships Within a Business Network Context." Journal of Marketing 58(4): 1. Antia, K. D. and G. L. Frazier (2001). "The Severity of Contract Enforcement in Interfirm Channel Relationships." Journal of Marketing 65(4): 67-81. Ariely, D. and I. Simonson (2003). "Buying, Bidding, Playing, or Competing? Value Assessment and Decision Dynamics in Online Auctions." Journal of Consumer Psychology 13(1/2): 113-123. Asch, S. (1953). Group Dynamics. New York, N.Y., Harper and Row. Ashenfelter, O. (1989). "How Auctions Work for Wine and Art." Journal of Economic Perspectives 3(3): 23-36. Bavelas, A. (1951). "An Experimental Approach to Organizational Communication." Personnel 27: 366-71. Bearden, W. O. and M. J. Etzel (1982). "Reference Group Influence on Product and Brand Purchase Decisions." Journal of Consumer Research 9(2): 183-194. Bearden, W. O., R. G. Netemeyer, et al. (1989). "Measurement of Consumer Susceptibility to Interpersonal Influence." Journal of Consumer Research 15(4): 473-481.
117
Beauchamp, M. A. (1965). "An Improved Index of Centrality." Behavioral Science 10: 161-63. Benjamin, B. A. and J. M. Podolny (1999). "Status, Quality, and Social Order in the California Wine Industry." Administrative Science Quarterly 44(3): 563-589. Bergen, M., S. Dutta, et al. (1992). "Agency Relationships in Marketing: A Review of the Implications and Applications of Agency and and Related Theories." Journal of Marketing 56(3): 1-24. Bergkvist, L. and J. R. Rossiter (2007). "The Predictive Validity of Multiple-Item Versus Single-Item Measures of the Same Constructs." Journal of Marketing Research 44: 175-184. Bernard, H. R. (2006). Research Methods in Anthropology: Qualitative and Quantitative Approaches. Lanham, MD, AltaMira Press. Biles, D. B. (2008) The Green Monkey Retired. Bloodhorse.com Biswas, A., S. Dutta, et al. (2006). "Low Price Guarantees as Signals of Lowest Price: The Moderating Role of Perceived Price Dispersion." Journal of Retailing 82(3): 245-257. Block, R. (2005). "Blu-Ray vs HD DVD: State of the Division." Retrieved 2/19/2008, from http://www.engadget.com/2005/09/19/blu-ray-vs-hd-dvd-state-of-the-s-union-s-division/. Blood-Horse Publications (2004). Authoritative Guide to Auctions. Lexington, KY, Eclipse Press. Bloom, M. and G. T. Milkovich (1998). "Relationships Among Risk, Incentive Pay, and Organizational Performance." Academy of Management Journal 41(3): 283-297. Borgatti, S. P. (2005). "Centrality and Network Flow." Social Networks 27(1): 55-71. Borgatti, S. P., M. G. Everett, et al. (2010). UCINET 6 for Windows, version 6.272. Natick, Analytic Technologies. Boulding, W. and A. Kirmani (1993). "A Consumer-Side Experimental Examination of Signaling Theory: Do Consumers Perceive Warranties as Signals of Quality?" Journal of Consumer Research 20(1): 111-123. Bowling, A. T. (1996). Horse Genetics. Wallingford, CAB International. Bristor, J. M. (1988). "Coalitions in Organizational Purchasing: An Application of Network Analysis." Advances in Consumer Research 15: 563-568. Bristor, J. M. and M. J. Ryan (1987). "The Buying Center Is Dead, Long Live the Buying Center." Advances in Consumer Research 14(1): 255-258. Brown, J. J. and P. H. Reingen (1987). "Social Ties and Word-of-Mouth Referral Behavior." Journal of Consumer Research 14(3): 350-362.
118
Burt, R. S. (1992). Structural Holes: The Social Structure of Competition. Cambridge, MA, Harvard University Press. Burt, R. S. and G. Janicik (1996). Social Contagion and Social Structure. Networks in Marketing. D. Iacobucci. Thousand Oaks, Sage Publications. Buzby, J. C. and E. L. Jessup (1994). "The Relative Impact of Macroeconomic and Yearling Specific Variables in Determining Thoroughbred Yearling Price." Applied Economics 26(1): 1-8. Caminal, R. and X. Vives (1996). "Why Market Shares Matter: An Information-Based Theory." RAND Journal of Economics 27(2): 221-239. Campbell, D. T. and D. W. Fiske (1959). "Convergent and Discriminant Validation by the Multitrait-Multimethod Matrix." Psychological Bulletin 56(2): 81-105. Caves, R. E. and D. P. Greene (1996). "Brands' Quality Levels, Prices, and Advertising Outlays: Empirical Evidence on Signals and Information Costs." International Journal of Industrial Organization 14(1): 29-52. Chezum, B. and B. S. Wimmer (1997). "Roses or Lemons: Adverse Selection in the Market for Thoroughbred Yearlings." Review of Economics & Statistics 79(3): 521-526. Chezum, B. and B. S. Wimmer (2000). "Evidence of Adverse Selection from Thoroughbred Wagering." Southern Economic Journal 66(3): 700-714. Chu, W. and W. Chu (1994). "Signaling Quality by Selling through a Reputable Retailer: an Example of Renting the Reputation of Another Agent." Marketing Science 13(2): 177-189. Churchill Jr., G. A. (1979). "A Paradigm for Developing Better Measures of Marketing Constructs." Journal of Marketing Research 16(1): 64-73. Coleman, J., E. Katz, et al. (1966). Medical Innovation: A Diffusion Study. New York, Bobbs-Merrill. Commer, M. J. (1991). "The Effect of Nonphenotypic Data on Thoroughbred Prices in the Mid-Atlantic Market." The Professional Animal Scientist 7(1): 18-24. Curran, P. J., S. G. West, et al. (1995). Structural Equation Models with Nonnormal Variables: Problems and Remedies. Structural Equation Modeling: Concepts, Issues, and Applications. R. H. Hoyle. Thousand Oaks, CA, Sage Publications. Czepiel, J. A. (1974). "Word-of-Mouth Processes in the Diffusion of a Major Technological Innovation." Journal of Marketing Research 11(2): 172-180. Dahlstrom, R. and R. Ingram (2003). "Social Networks and the Adverse Selection Problem in Agency Relationships." Journal of Business Research 56(9): 767.
119
Dawar, N. and P. Parker (1994). "Marketing Universals: Consumers' use of Brand Name, Price, Physical Appearance, and Retailer Reputation as Signals of Product Quality." Journal of Marketing 58(2): 81-95. Dawar, N. and M. Sarvary (1997). "The Signaling Impact of Low Introductory Price on Perceived Quality and Trial." Marketing Letters 8(3): 251-259. Day, G. S. and D. B. Montgomery (1999). "Charting New Directions for Marketing." Journal of Marketing 63(1): 3-13. De Wulf, K., G. Odekerken-Schroder, et al. (2001). "Investments in Consumer Relationships: A Cross-Country and Cross-Industry Exploration." Journal of Marketing 65(4): 33-50. Degenne, A. and M. Forse (1999). Introducing Social Networks. London, England, Sage Publishers. Desai, P. S. (2000). "Multiple Messages to Retain Retailers: Signaling New Product Demand." Marketing Science 19(4): 381-389. Eisenhardt, K. M. (1985). "Control: Organizational and Economic Approaches." Management Science 31(2): 134-149. Eisenhardt, K. M. (1989). "Agency Theory: An Assessment and Review." Academy of Management Review 14(1): 57-74. Equineline.com (2008). "Year-To-Date Leading Breeders Through September 1, 2008." Retrieved September 2, 2008, 2008. Erdem, T. and J. Swait (1998). "Brand Equity as a Signaling Phenomenon." Journal of Consumer Psychology 7(2): 131-157. Erdem, T., J. Swait, et al. (2006). "Brands as Signals: A Cross-Country Validation Study." Journal of Marketing 70(1): 34-49. Fasig-Tipton (2009). "2008 Results Archive." from http://www.fasigtipton.com/results/2008/index.asp. Figlewski, S. (1979). "Subjective Information and Market Efficiency in a Betting Market." Journal of Political Economy 87(1): 75-88. Frazier, G. L. and W. M. Lassar (1996). "Determinants of Distribution Intensity." Journal of Marketing 60(4): 39-51. Freeman, L. C. (1977). "A Set of Measures of Centrality BASed on Betweenness." Sociometry 40(1): 35-41. Freeman, L. C. (1978/79). "Centrality in Social Networks." Social Networks 1: 215-239.
120
Frenzen, J. and K. Nakamoto (1993). "Structure, Cooperation, and the Flow of Market Information." Journal of Consumer Research 20(3): 360-375. Friedman, B. M. and W. J. Maier (1999). "The Future of Monetary Policy: The Central Bank as an Army with Only a Signal Corps?" International Finance 2(3): 321-338. Gerstner, E. (1985). "Do Higher Prices Signal Higher Quality?" Journal of Marketing Research 22(2): 209-215. Ghosh, M. and G. John (2000). "Experimental Evidence for Agency Models of Salesforce Compensation." Marketing Science 19(4): 348-365. Gladwell, M. (2002). The Tipping Point: How Little Things Can Make a Big Difference. New York, Back Bay Books. Glaser, B. G. and A. L. Strauss (1967). The Discovery of Grounded Theory: Strategies for Qualitative Research. Piscataway, NJ, Transaction Publishers. Goffman, E. (1951). "Symbols of Class Status." The British Journal of Sociology 2(4): 294-304. Goodwin, C. (1994). "Professional Vision." American Anthropologist 96(3): 606-633. Granovetter, M. (1985). "Economic Action and Social Structure: The Problem of Embeddedness." The American Journal of Sociology 91(3): 481-510. Gregory, A., J. Matatko, et al. (1997). "Detecting Information from Directors' Trades: Signal Definition and Variable Size Effects." Journal of Business Finance & Accounting 24(3/4): 309-342. Gu, F. F., K. Hung, et al. (2008). "When Does Guanxi Matter? Issues of Capitalization and Its Dark Side." Journal of Marketing 72(1): 12-28. Gupta, S., D. C. Jain, et al. (1999). "Modeling the Evolution of Markets with Indirect Network Externalities: An Application to Digital Television." Marketing Science 18(3): 396. Hair, J. F., R. E. Anderson, et al. (1998). Multivariate Data Analysis. Upper Saddle River, New Jersey, Prentice-Hall, Inc. Heath, C. and P. Luff (2007). "Ordering Competition: The Interactional Accomplishment of the Sale of Art and Antiques at Auction." The British Journal of Sociology 58(1): 63-85. Heckerman, D. L. (1996). The Mystery of Yearling Buying. The Blood-Horse. Lexington, KY, Blood-Horse Publications. 72: 4942-4948. Heckerman, D. L. (1996). Stakes Winners in Abundance. The Blood-Horse. Lexington, KY, Blood-Horse Publications. 72: 3216-3220. Heide, J. B. (2003). "Plural Governance in Industrial Purchasing." Journal of Marketing 67(4): 18-29.
121
Heide, J. B. and G. John (1988). "The Role of Dependence Balancing in Safeguarding Transaction-Specific Assets in Conventional Channels." Journal of Marketing 52(1): 20-35. Henderson, G. R., D. Iacobucci, et al. (1998). "Brand diagnostics: Mapping branding effects using consumer associative networks." European Journal of Operational Research 111(2): 306-327. Henderson, G. R., D. Iacobucci, et al. (2002). "Using Network Analysis to Understand Brands." Advances in Consumer Research 29(1): 397-405. Herbig, P. and J. C. Milewicz (1994). "Market Signalling and Its Role in Business-to-Business Communications." Marketing Intelligence and Planning 12(4): 27-31. Herbig, P. and J. C. Milewicz (1994). "Marketing Signals in Service Industries." Journal of Services Marketing 8(2): 19-35. Herbig, P. and J. C. Milewicz (1996). "Market Signalling: A Review." Management Decision 34(1): 35-45. Hilger, J., G. Rafert, et al. (2007). Expert Opinion and the Demand for Experience Goods: An Experimental Approach, University of California, Berkeley: 1-32. Hill, S., F. Provost, et al. (2006). "Network-Based Marketing: Identifying Likely Adopters via Consumer Networks." Statistical Science 21(2): 256-276. Houser, D. and J. Wooders (2006). "Reputation in Auctions: Theory, and Evidence from eBay." Journal of Economics & Management Strategy 15(2): 353-369. Houston, M. B. (2004). "Assessing the Validity of Secondary Data Proxies for Marketing Constructs." Journal of Business Research 57(2): 154-161. Houston, M. B. and S. A. Johnson (2000). "Buyer-Supplier Contracts versus Joint Ventures: Determinants and Consquences of Transaction Structure." Journal of Marketing Research 37(1): 1-15. Houston, M. B., B. A. Walker, et al. (2001). "Cross-Unit Competition for a Market Charter: The Enduring Influence of Structure." Journal of Marketing 65(2): 19-34. Hunt, S. D. and R. M. Morgan (1995). "The Comparative Advantage Theory of Competition." Journal of Marketing 59(2): 1-15. Hutt, M. D., P. H. Reingen, et al. (1988). "Tracing Emergent Processes in Marketing Strategy Formulation." Journal of Marketing 52(1): 4-19. Iacobucci, D. (1996). Networks in Marketing. Thousand Oaks, CA, Sage Publications. Ingram, P. and J. A. C. Baum (1997). "Chain Affiliation and the Failure of Manhattan Hotels." Administrative Science Quarterly 42(1): 68-103.
122
Jap, S. D. and E. Anderson (2003). "Safeguarding Interorganizational Perfromance and Continuty Under Ex Post Opportunism." Management Science 49(12): 1684-1701. Jensen, M. C. and W. H. Meckling (1976). "Theory of the Firm: Managerial Behavior, Agency Costs and Ownership Structure." Journal of Financial Economics 3(4): 305-360. Joseph, K. and V. J. Richardson (2002). "Free Cash Flow, Agency Costs, and the Affodability Method of Advertising Budgeting." Journal of Marketing 66(1): 94-107. Kamins, M. A., X. Dreze, et al. (2004). "Effects of Seller-Supplied Prices on Buyers' Product Evaluations: Reference Prices in an Internet Auction Context." Journal of Consumer Research 30(4): 622-628. Kandel, E. and N. D. Pearson (1995). "Differential Interpretation of Public Signals and Trade in Speculative Markets." Journal of Political Economy 103(4): 831-872. Kane, A. J., C. W. McIlwraith, et al. (2003). "Radiographic Changes in Thoroughbred Yearlings. Part 2: Associations with Racing Performance." Equine Veterinary Journal 35(4): 366-374. Kane, A. J., R. D. Park, et al. (2003). "Radiographic Changes in Thoroughbred Yearlings. Part 1: Prevalence at the Time of the Yearling Sales." Equine Veterinary Journal 35(4): 354-365. Karungu, P., M. Reed, et al. (1993). "Macroeconomic Factors and the Thoroughbred Industry." Journal of Agriculture and Applied Economics 25(1): 165-173. Keeneland Association (2007). "Keeneland Sales Results, 2007 September Yearling Sale." Retrieved 10/1/2008, 2008, from http://ww2.keeneland.com/sales/lists/sale/results.aspx?SaleId=200902. Keeneland Association (2008). "Keeneland Sales Results, 2008 September Yearling Sale." Retrieved 10/1/2008, 2008, from http://ww2.keeneland.com/sales/lists/sale/results.aspx?SaleId=200902. Keeneland Association (2009). "Yearly Sales Recap." Retrieved 4/15/2009, 2009, from http://ww2.keeneland.com/sales/lists/copy/recap.aspx. Keeneland Association Inc. (2008). 2008 September Yearling Sale. Lexington, KY, Keeneland Association Inc. 1-8. Keller, K. L. (1993). "Conceptualizing, Measuring, Managing Customer-Based Brand Equity." Journal of Marketing 57(1): 1-22. Kilduff, M. and D. Krackhardt (1994). "Bringing the Individual Back In: A Structural Analysis of the Internal Market for Reputation in Organizations." Academy of Management Journal 37(1): 87-108. Kirmani, A. and A. R. Rao (2000). "No Pain, No Gain: A Critical Review of the Literature on Signaling Unobservable Product Quality." Journal of Marketing 64(2): 66-79.

123
Kirmani, A. and P. Wright (1989). "Money Talks: Perceived Advertising Expense and Expected Product Quality." Journal of Consumer Research 16(3): 344-353. Kirmani, A. and P. Wright (1993). "Procedural Learning, Consumer Decision Making, and Marketing Communication." Marketing Letters 4(1): 39-48. Klemperer, P. (1999). "Auction Theory: A Guide to the Literature." Journal of Economic Surveys 13(3): 227-286. Klemperer, P. (2002). "What Really Matters in Auction Design." Journal of Economic Perspectives 16(1): 169-189. Kline, R. B. (2005). Principles and Practice of Structural Equation Modeling. New York, NY, The Guilford Press. Knoke, D. and J. H. Kuklinski (1982). Network Analysis. Beverly Hills, CA, Sage Publications. Kothandaraman, P. and D. T. Wilson (2001). "The Future of Competition." Industrial Marketing Management 30(4): 379-389. Krafft, M. (1999). "An Empirical Investigation of the Antecedents of Sales Force Control Systems." Journal of Marketing 63(3): 120-134. KTA-KTOB (2009). "Industry Facts." Retrieved 4/15/2009, 2009, from http://www.kta-ktob.com/IndustryFacts.aspx. Lattin, J., J. D. Carrol, et al. (2003). Analyzing Multivariate Data. Pacific Grove, CA, Thompson Learning. Lawrence, R. G. (1970). An Econometric Analysis of Changes in Quarter Horse Prices, 1950 through 1967. Unpublished PhD dissertation. College Station, TX, Texas A&M University. Leana, C. R. and H. J. I. Van Buren (1999). "Organizational Social Capital and Employment Practices." Academy of Management Review 24(3): 538-555. Lehmann, D. R. (2004). "Metrics for Making Marketing Matter." Journal of Marketing 68(4): 73-75. Lesh, D. (1978). A Treatise on Thoroughbred Selection. New York, J. A. Allen & Company Limited. Li, S., K. Srinivasan, et al. (2004). The Role of Quality Indicators in Internet Auctions: An Empirical Study. Pittsburgh, PA, Tepper School of Business, Carnegie Mellon University: 1-46. Li, S., K. Srinivasan, et al. (2009). "Internet Auction Features as Quality Signals." Journal of Marketing 73(1): 75-92. Lichtenstein, D. R., N. M. Ridgway, et al. (1993). "Price Perceptions and Consumer Shopping Behavior: A Field Study." Journal of Marketing Research 30(2): 234-245.

124
Louargand, M. A. and J. R. McDaniel (1991). "Price Efficiency in the Art Auction Market." Journal of Cultural Economics 15(2): 53-65. Louis, H. and D. Robinson (2005). "Do Managers Credibly Use Accruals to Signal Private Information? Evidence from the Pricing of Discretionary Accruals Around Stock Splits." Journal of Accounting & Economics 39(2): 361-380. Louis, H. and H. White (2007). "Do Managers Intentionally use Repurchase Tender Offers to Signal Private Information? Evidence from Firm Financial Reporting Behavior." Journal of Financial Economics 85(1): 205-233. Mayhew, B. H. (1980). "Structuralism versus Individualism: Part 1: Shadowboxing in the Dark." Social Forces 59(2): 335-375. Melnik, M. I. and J. Alm (2005). "Seller Reputation, Information Signals, and Prices for Heterogeneous Coins on eBay." Southern Economic Journal 72(2): 305-328. Merton, R. and A. K. Rossi (1953). Reference Group Theory and Social Mobility New York, N.Y., Free Press. Milgrom, P. R. (1981). "Rational Expectations, Information Acquisition, and Competitive Bidding." Econometrica 49(4): 921-943. Milgrom, P. R. and R. J. Weber (1982). "A Theory of Auctions and Competitive Bidding." Econometrica 50(5): 1089-1122. Mishra, D. P., J. B. Heide, et al. (1998). "Information Asymmetry and Levels of Agency Relationships." Journal of Marketing Research 35(3): 277-295. Möller, K. K. and A. Halinen (1999). "Business Relationships and Networks: Managerial Challenge of Network Era." Industrial Marketing Management 28(5): 413-427. Money, R. B., M. C. Gilly, et al. (1998). "Explorations of National Culture and Word-of-Mouth Referral Behavior in the Purchase of Industrial Services in the United States and Japan." Journal of Marketing 62(10): 76-87. Monticule (2008). Monticule: Making Our Mark. The Blood-Horse. Lexington KY, The Blood-Hose: 4315. Moorthy, S. and K. Srinivasan (1995). "Signaling Quality with a Money-Back Guarantee: The Role of Transaction Costs." Marketing Science 14(4): 442-466. Murry, J. P. J. and J. B. Heide (1998). "Managing Promotion Program Participation Within Manufacturer-Retailer Relationships." Journal of Marketing 62(1): 58-68. Neibergs, J. S. (2001). "A Hedonic Price Analysis of Thoroughbred Broodmare Characteristics." Agribusiness 17(2): 299-314.
125
Neibergs, J. S. and R. Thalheimer (1997). "Price Expectations and Supply Response in the Thoroughbred Yearling Market." Journal of Agriculture and Applied Economics 29(2): 419-435. Nelson, P. (1970). "Information and Consumer Behavior." Journal of Political Economy 78(2): 311-329. Nygaard, A. and R. Dahlstrom (2002). "Role Stress and Effectiveness in Horizontal Alliances." Journal of Marketing 66(2): 61-82. Palmatier, R. W., S. Gopalakrishna, et al. (2006). "Returns on Business-to-Business Relationship Marketing Investments: Strategies for Leveraging Profits." Marketing Science 25(5): 477-496. Parsons, C. and I. Smith (2008). "The Price of Thoroughbred Yearlings in Britain." Journal of Sports Economics 9(1): 43-66. Pesendorfer, W. and J. M. Swinkels (2000). "Efficiency and Information Aggregation in Auctions." American Economic Review 90(3): 499-525. Peter, J. P. (1981). "Construct Validity: A Review of Basic Issues and Marketing Practices." Journal of Marketing Research 18(2): 133-145. Phillips, L. W., D. R. Chang, et al. (1983). "Product Quality, Cost Position and Business Performance: A Test of Some Key Hypotheses." Journal of Marketing 47(2): 26-43. Podolny, J. M. (1993). "A Status-based Model of Market Competition." American Journal of Sociology 98(4): 829-872. Podolny, J. M. (2001). "Networks as the Pipes and Prisms of the Market." American Journal of Sociology 107(1): 33-60. Porter, M. E. (1980). Competitive Strategy. New York, NY, Free Press. Porter, M. E. (1985). Competitive Advantage: Creating and Sustaining Superior Performance. New York, N.Y., Free Press. Prabhu, J. and D. W. Stewart (2001). "Signaling Strategies in Competitive Interaction: Building Reputations and Hiding the Truth." Journal of Marketing Research 38(1): 62-72. Rao, A. R. (2005). "The Quality of Price as a Quality Cue." Journal of Marketing Research 42(4): 401-405. Rao, A. R. and M. E. Bergen (1992). "Price Premium Variations as a Consequence of Buyers' Lack of Information." Journal of Consumer Research 19(3): 412-423. Rao, A. R., Q. Lu, et al. (1999). "Signaling Unobservable Product Quality Through a Brand Ally." Journal of Marketing Research 36(2): 258-268. Rao, A. R. and K. B. Monroe (1988). "The Impact of Prior Knowledge on the Price-Perceived Quality Relationship." Journal of Consumer Research 15(2): 253-264.

126
Rao, A. R. and K. B. Monroe (1989). "The Effect of Price, Brand Name, and Store Name on Buyers' Perceptions of Product Quality : An Integrative Review." Journal of Marketing Research 26(3): 351-357. Rao, A. R. and K. B. Monroe (1996). "Causes and Consequences of Price Premiums." Journal of Business 69(4): 511-535. Reingen, P. H. (1987). "A word-of-mouth network." Advances in consumer research 14(1): 213-217. Reingen, P. H., B. L. Foster, et al. (1984). "Brand Congruence in Interpersonal Relations: A Social Network Analysis." Journal of Consumer Research 11(3): 771-783. Reingen, P. H. and J. B. Kernan (1986). "Analysis of Referral Networks in Marketing: Methods and Illustration." Journal of Marketing Research 23(4): 370-378. Richard, A., E. Bruns, et al. (2000). Genetics of performance traits. Genetics of the Horse. A. T. Bowling and A. Ruvinsky. United Kingdom, CABI Publishing: 411-438. Richins, M. L. (1994). "Special Possessions and the Expression of Material Values." Journal of Consumer Research 21(3): 522-533. Rindfleisch, A. and C. Moorman (2001). "The Acquisition and Utilization of Information in New Product Alliances: A Strength-of-Ties Perspective." Journal of Marketing 65(2): 1-18. Rindfleisch, A. and C. Moorman (2003). "Interfirm Cooperation and Customer Orientation." Journal of Marketing Research 40(4): 421-436. Ritter, T. (1999). "The Networking Company: Antecedents for Coping with Relationships and Networks Effectively." Industrial Marketing Management 28(5): 467-479. Robbins, M. and P. E. Kennedy (2001). "Buyer Behaviour in a Regional Thoroughbred Yearling Market." Applied Economics 33(8): 969-977. Robertson, T. S., J. Eliashberg, et al. (1995). "New Product Announcement Signals and Incumbent Reactions." Journal of Marketing 59(3): 1-15. Ronchetto, J. A. J., M. D. Hutt, et al. (1989). "Embedded Influence Patterns in Organizational Buying Systems." Journal of Marketing 53(4): 51-62. Ronchetto Jr, J. A., M. D. Hutt, et al. (1989). "Embedded Influence Patterns in Organizational Buying Systems." Journal of Marketing 53(4): 51-62. Rosenberg, D. (2010). Measures of reputation of seller and buyer side agents. E. J. Plant. Lexington, KY. Rosenman, R. E. and W. W. Wilson (1991). "Quality Differentials and Prices: Are Cherries Lemons?" Journal of Industrial Economics 39(6): 649-658.

127
Ross, W. T. J., E. Anderson, et al. (1997). "Performance in Principal-Agent Dyads: The Causes and Consequences of Perceived Asymmetry of Commitment to the Relationship." Management Science 43(5): 680-704. Rotfeld, H. J. and K. B. Rotzoll (1976). "Advertising and Product Quality: Are Heavily Advertised Products Better?" Journal of Consumer Affairs 10(1): 33-47. Rothkopf, M. H. (1969). "A Model of Rational Competitive Bidding." Management Science 15(7): 362-373. Russo, J. (2008). Leading Indicators. The Blood-Horse MarketWatch. Lexington, KY, Blood-Horse Publications. 22. Russo, J. (2008). Racing Results by Consignor. The Blood-Horse Marketwatch. Lexington, KY, Blood-Horse Publications. 22. Sabidussi, G. (1966). "The Centrality Index of a Graph." Psychometrika 31: 581-603. San Martin, S. and C. Camarero (2005). "Consumer Reactions to Firm Signals in Asymmetric Relationships." Journal of Service Research 8(1): 79-97. Sarin, S. and V. Mahajan (2001). "The Effect of reward Structures on the Performance of Cross-Functional Product Development Teams." Journal of Marketing 65(2): 35-53. Schmalensee, R. (1978). "A Model of Advertising and Product Quality." Journal of Political Economy 86(3): 485-503. Scott, J. P. (2000). Social Network Analysis: A Handbook. Newberry Park, CA, SAGE Publications. Shapiro, C. (1982). "Consumer Information, Product Quality, and Seller Reputation." Bell Journal of Economics 13(1): 20-35. Shiv, B., Z. I. V. Carmon, et al. (2005). "Placebo Effects of Marketing Actions: Consumers May Get What They Pay For." Journal of Marketing Research 42(4): 383-393. Sirdeshmukh, D., J. Singh, et al. (2002). "Consumer Trust, Value, and Loyalty in Relational Exchanges." Journal of Marketing 66(1): 15-37. Sirsi, A. K., J. C. Ward, et al. (1996). "Microcultural Analysis of Variation in Sharing of Causal Reasoning about Behavior." Journal of Consumer Research 22(1): 345-372. Skinner, S. J. and J. P. Guiltinan (1985). "Perceptions of Channel Control." Journal of Retailing 61(4): 65. Slotegraff, R. J., C. Moorman, et al. (2003). "The Role of Firm Resources in Returns to Market Deployment." Journal of Marketing Research 40(3): 295-309.

128
Sorescu, A., V. Shankar, et al. (2007). "New Product Preannouncements and Shareholder Value: Don't Make Promises You Can't Keep." Journal of Marketing Research 44(3): 468-489. Spence, A. M. (1974). Market Signaling: Information Structure of Job Markets and Related Phenomena. Cambridge, MA, Harvard University Press. SPSS Inc. (2009). PASW Statistics 18. Chicago, SPSS Inc an IBM Company. Srinivasan, R., G. L. Lilien, et al. (2004). "First in, First out? The Effects of Network Externalities on Pioneer Survival." Journal of Marketing 68(1): 41-58. Stern, L. W. and T. Reve (1980). "Distribution Channels as Political Economies: A Framework for Comparative Analysis." Journal of Marketing 44(3): 52-64. Suter, T. A. and D. M. Hardesty (2005). "Maximizing earnings and price fairness perceptions in online consumer-to-consumer auctions." Journal of Retailing 81(4): 307-317. Sweezey, T. W. (2009). Measures of reputation of seller and buyer side agents. E. J. Plant. Lexington, KY. Tellis, G. J. and B. Wernerfelt (1987). "Competitive Price and Quality under Asymmetric Information." Marketing Science 6(3): 240-253. Thakor, A. V. (1982). "An Exploration of Competitive Signalling Equilibria with "Third Party" Information Production: The Case of Debt Insurance." Journal of Finance 37(3): 717-739. The Blood-Horse MarketWatch (2009). Yearling Sales Statistics, 2004-2006. The Blood-Horse MarketWatch. Lexington KY, The Blood-Horse. June 2009. The Jockey Club (2009). "Annual North American Registered Foal Crop." Retrieved 3/3/2009, 2009, from http://www.jockeyclub.com/factbook.asp?section=12. The Jockey Club (2009). "Breeding Statistics 2006/2007." from http://www.jockeyclub.com/information.asp?reportrequest=LF. Thiruvenkadan, A. K., N. Kandasamy, et al. (2009). "Inheritance of racing performance of Thoroughbred horses." Livestock Science 121: 308-326. Thoroughbred Times (2007). Thoroughbred Times Buyer's Guide. T. Times. Lexington, KY, Thoroughbred Times Co. Inc. 1-8. Thoroughbred Times (2008). Racing Leaders for 2008. Lexington KY, Thoroughbred Times. Thoroughbred Times (2008). Thoroughbred Times Buyer's Guide. T. Times. Lexington, KY, Thoroughbred Times Co. Inc. 1-8. Thoroughbred Times Today (2008). Leading consignors and consignor agents (by average, two or more sold). Thoroughbred Times Today. Lexington KY, Thoroughbred Times.

129
Tversky, A. and D. Kahneman (1974). "Judgment and Uncertainty: Heuristics and Biases." Science 185(4157 ): 1124-1131. Van Den Bulte, C. (2007). Social Networks in Marketing. Cambridge, MA, Marketing Science Institute. Van Den Bulte, C. and Y. V. Joshi (2007). "New Product Diffusion with Influentials and Imitators." Marketing Science 26(3): 400-424. Van Den Bulte, C. and G. L. Lilien (2001). Two Stage Partial Observability Models of Innovation Adoption. Working Paper, Wharton School, University of Pennsylvania. Van Den Bulte, C. and S. Wuyts (2007). Conceptual Toolkit. Social Networks and Marketing. Cambridge, Marketing Science Institute. Van Hoogmoed, L. M., J. R. Snyder, et al. (2003). "Retrospective Evaluation of Equine Prepurchase Examinations Performed 1991-2000." Equine Veterinary Journal 35(4): 375-381. Vickner, S. S. and S. I. Koch (2001). "Hedonic Pricing, Information, and the Market for Thoroughbred Yearlings." Journal of Agribusiness 19(2): 173-189. Vinery (2008). Vinery: According to TBH Marketwatch. The Blood-Horse. Lexington KY, The Blood-Hose: 4318. Ward, J. C. and P. H. Reingen (1990). "Sociocognitive Analysis of Group Decision Making Among Consumers." Journal of Consumer Research 17(3): 245-262. Wasserman, S. and K. Faust (1994). Centrality and Prestige. Social Network Analysis. New York, New York, Cambridge University Press. Wasserman, S. and K. Faust (1994). Social Network Analysis: Methods and Applications. Cambridge, MA, Cambridge University Press. Wathne, K. H., H. Biong, et al. (2001). "Choice of Supplier in Embedded Markets: Relationship and Marketing Program Effects." Journal of Marketing 65(2): 54-66. Wathne, K. H. and J. B. Heide (2004). "Relationship Governance in a Supply Chain Network." Journal of Marketing 68(1): 73-89. White, H. C. (1981). "Production Markets as Induced Role Structures." Sociological Methodology 12(1): 1-57. White, H. C. (1981). "Where do Markets Come From?" The American Journal of Sociology 87(3): 517-547. White, H. C. (2002). Markets from Networks. Socioeconomic Models of Production. Princeton, N.J., Princeton University Press. Williamson, O. E. (1975). Markets and Hierarchies

130
New York, N.Y., Free Press. Williamson, O. E. (1979). "Transaction-Cost Economics: The Governance of Contractual Relations." Journal of Law & Economics 22(2): 233-261. Williamson, O. E. (1981). "The Economics of Organization: The Transaction Cost Approach." American Journal of Sociology 87(3): 548-577. Williamson, O. E. (1985). Transaction cost economics: The governance of contractual arrangements. New York, Free Press. Wimmer, B. S. and B. Chezum (2003). "An Empirical Examination of Quality Certification in a 'Lemons Market.'." Economic Inquiry 41(2): 279-292. Wuyts, S., S. Stremersch, et al. (2004). "Vertical Marketing Systems for Complex Products: A Triadic Perspective." Journal of Marketing Research 41(4): 479-487. Zhao, H. (2000). "Raising Awareness and Signaling Quality to Uninformed Consumers: A Price-Advertising Model." Marketing Science 19(4): 390-396. Zuckerman, E. W. (1999). "The Categorical Imperative: Securities Analysts and the Illegitimacy Discount." American Journal of Sociology 104(5): 1398-1438. Zuckerman, E. W. (2004). "Structural Incoherence and Stock Market Activity." American Sociological Review 69(3): 405-432.

131
VITA
EMILY JANE PLANT Place of Birth: Louisville Kentucky USA. May 13, 1981
EDUCATION
Ph.D University of Kentucky, School of Management Marketing, expected May 2010 Dissertation Title: “Market Signaling Effects on Business Performance Outcomes”
Information asymmetry occurs when all parties in a transaction do not have
access to the same level of information. As information asymmetry increases, adverse selection problems may increase. Signaling is a successful method marketers use to overcome the problem of information asymmetry in a marketplace. A marketing signal is an activity which provides information beyond the activity itself and reveals insights into the unobservable, such as the intention, motives, goals, or internal situation. This research will examine the manner by which buyers, sellers, and their third-party agents signal to the marketplace their opinions of the most desirable products. The role of the third-party agents in shaping the financial business performance outcomes of the marketplace is of particular interest.
Committee:
Dr. Robert Dahlstrom Chair, Professor of Marketing Dr. Steven Skinner Professor of Marketing Dr. Stephen Borgatti Professor of Management Dr. C. Jill Stowe Professor of Agricultural Economics
M.B.A. Xavier University May 2006 B.S. Indiana University Marketing, May 2003 Book Chapter
Dahlstrom, Robert, Arne Nygaard, and Emily Plant: “Exploring the Role of Governance in Sustainable Franchised Distribution Channels”, forthcoming in Engineering Earth: The Impacts of Mega-Engineering Projects, edited by Stanley Brunn.
Conference Papers and Presentations
Marineau, Josh, Ajay Mehra, and Emily Plant (2008). “What’s A Friend When You Have Thousands? The Implications of Online Social Networking for Social Network Theory,” Proceedings of the International Network for Social Network Analysis Conference, St. Pete Beach, FL.

132
Plant, Emily (2009). “The Price of Dreams: An Examination of the Market for Thoroughbred Yearlings,” proceedings of the Southeastern Marketing Symposium, Tuscaloosa, AL. Plant, Emily (2009). “Market Signaling Effects on Business Performance Outcomes,” proceedings of the International Network for Social Network Analysis Conference, San Diego, CA.
Other Published Paper Plant, Emily, Lee Meyer (2009). “Dead Stock Disposal- Solutions and Future Programs” Published in “Kentucky Farm Bureau Policy Development Brief, July 2009”.
GRANTS/EXTERNAL FUNDING AND AWARDS University of Kentucky Von Allmen Center for Green Marketing Research Grant, 2009- “The Problem of Unwanted Horses” Carol Martin Gatton Doctoral Student Fellowship 2006-2007, 2008-2009, 2009-2010 Luckett Fellowship 2008-2009, 2009-2010
SERVICE AND PROFESSIONAL ACTIVITIES Reviewer, “Marketing Gag or Value Creating Strategy: How does Sustainability Impact Store Choice in Retail?” Journal of Retailing Student working group committee member for University of Kentucky Equine Initiative Marketing research consultant for NEST modular homes Lead Author, Kentucky Farm Bureau policy paper: “Dead Animal Removal: Solutions and Future Programs”, May 2009. Student Member, Links International Center for Research on Social Networks in Business.
Student Researcher, Defense Threat Reduction Agency Project: “Combating Weapons of Mass Destruction, Basic Research”.