Embed Size (px)
Citation preview

An Empirical Analysis of the Relation between the Board of Director Composition andFinancial Statement FraudAuthor(s): Mark S. BeasleySource: The Accounting Review, Vol. 71, No. 4 (Oct., 1996), pp. 443-465Published by: American Accounting AssociationStable URL: http://www.jstor.org/stable/248566 .
Accessed: 08/09/2013 15:13
Your use of the JSTOR archive indicates your acceptance of the Terms & Conditions of Use, available at .http://www.jstor.org/page/info/about/policies/terms.jsp
.JSTOR is a not-for-profit service that helps scholars, researchers, and students discover, use, and build upon a wide range ofcontent in a trusted digital archive. We use information technology and tools to increase productivity and facilitate new formsof scholarship. For more information about JSTOR, please contact [email protected].
.
American Accounting Association is collaborating with JSTOR to digitize, preserve and extend access to TheAccounting Review.
http://www.jstor.org
This content downloaded from 142.3.100.23 on Sun, 8 Sep 2013 15:13:22 PMAll use subject to JSTOR Terms and Conditions

THE ACCOUNTING REVIEW Vol. 7 1, No. 4 October 1996 pp. 443-465
An Empirical Analysis of the
Relation Between the Board
of Director Composition and
Financial Statement Fraud
Mark S. Beasley North Carolina State University
ABSTRACT: This study empirically tests the prediction that the inclusion of larger proportions of outside members on the board of directors significantly reduces the likelihood of financial statement fraud. Results from logit regression analysis of 75 fraud and 75 no-fraud firms indicate that no-fraud firms have boards with significantly higher percentages of outside members than fraud firms; however, the presence of an audit committee does not significantly affect the likelihood of financial statement fraud. Additionally, as outside director ownership in the firm and outside director tenure on the board increase, and as the number of outside directorships in other firms held by outside directors decreases, the likelihood of financial statement fraud decreases.
Key Words: Audit committees, Board of director composition, Corporate gover- nance, Financial statement fraud.
Data Availability: Data for this paper come from public sources. A list of sample firms is available from the author upon request.
This paper is from my dissertation completed at Michigan State University. I am grateful for helpful comments from my dissertation committee, Al Arens (Chairman), Mary Bange, Frank Boster and Kathy Petroni. I also want to thank Joe Anthony, Karen Pincus, Dewey Ward, two anonymous reviewers, and workshop participants at Auburn, Florida State, Georgetown, Illinois, Michigan State, North Carolina State, Penn State, Tennessee, Wisconsin-Madison, the 1994 AAA annual meeting, and the 1995 AAA mid-year auditing section meeting. The significant financial support provided by the Institute of Internal Auditors Research Foundation is gratefully acknowledged.
Submitted JuIly 1995. Accepted April 1996.
Editor's Note: This paper is the winner of the 1995 AAA Competitive Manuscript Award.
443
This content downloaded from 142.3.100.23 on Sun, 8 Sep 2013 15:13:22 PMAll use subject to JSTOR Terms and Conditions

444 The Accounting Review, October 1996
I. INTRODUCTION
T his study empirically examines the relation between board of director composition and the occurrence of financial statement fraud. Fama and Jensen (1983) theorize that the board of directors is the highest internal control mechanism responsible for monitoring the
actions of top management. They argue that outside directors have incentives to carry out their monitoring tasks and not to collude with top managers to expropriate stockholder wealth, so the inclusion of outside directors increases the board's ability to monitor top management effectively in agency settings arising from the separation of corporate ownership and decision control. Because there are wide variations among firms in the degree of representation of outside members on boards of directors (Baysinger and Butler 1985), this study examines variations in board of director cosmposition to test empirically the prediction that the inclusion of outside members on the board helps reduce occurrences of financial statement fraud.
Existing empirical research provides evidence about the importance of including outside directors on the board for purposes of monitoring management in acute agency settings other than those involving financial statement fraud. In management buyouts, shareholder wealth increases when boards are dominated by outside directors (Lee et al. 1992); firms resisting greenmail payments have more outside directors relative to boards of firms not resisting greenmail payments (Kosnik 1987, 1990); expenditures on salaries are negatively related to the percentage of outside members on the board of director (Brickley and James 1987); and turnover of chief executive officers for poorly performing firms is highest with boards of directors having high proportions of outside directors (Weisbach 1988). While these studies support the prediction that board of director composition is related to the board's effectiveness at reducing agency costs, none has examined board of director composition in the context of financial statement fraud.
The relation between board of director composition and occurrences of financial statement fraud is particularly important to the accounting profession, because accountants have a responsibility to identify situations where financial statement fraud has a greater likelihood of occurring. Auditing standards explicitly require auditors to provide reasonable assurance that material financial statement fraud is detected (paragraph .08 of AICPA Statement on Auditing Standards (SAS) No. 53, The Auditor's Responsibility to Detect and Report Errors and Irregularities (AICPA 1989a)). Palmrose (1987) notes that financial statement fraud accounts for about half the litigation cases against auditors.
Auditors are required by AICPA SAS No. 55, Consideration of the Internal Control Structure in a Financial Statement Audit (paragraph .20)(AICPA 1988b), to obtain a "sufficient knowledge of the control environment to understand management's and the board of director's [emphasis added] attitude, awareness and actions concerning the control environment." Even though this requirement exists, auditing professional standards, particularly the "red flag" indicators of financial statement fraud described in SAS No. 53, are silent as to board of director characteristics that may affect the board' s ability to monitor management for the prevention of financial statement fraud. The lack of explicit guidance about board characteristics in the professional standards may be attributed to the lack of empirical evidence in prior management fraud research. Studies in that body of research, such as Loebbecke et al. (1989) and Bell et al. (1991), note the significance of "weak internal control environments" that allow management to carry out such fraud. Given that little is known about the nature of these "weak internal control environments," particularly board governance, this study examines whether board composition differs for firms experiencing financial statement fraud from those not experiencing such fraud. Evidence on this relationship may provide important insights for accounting professionals who seek to identify circumstances where the risks of financial statement fraud are increased.
This study tests the prediction that the proportion of outsiders on the board of director is lower for firms experiencing financial statement fraud than for no-fraud firms. Outside directors are
This content downloaded from 142.3.100.23 on Sun, 8 Sep 2013 15:13:22 PMAll use subject to JSTOR Terms and Conditions

Beasley-Board of Director Composition and Financial Statement Fraud 445
defined to be all non-employee directors. The research methodology uses logit cross-sectional regression analysis to examine differences in board of director composition between 75 fraud and 75 no-fraud firms that are similar in size, industry, national exchange where common stock is traded, and time period. More importantly, the regression analysis controls for differences in motivations for management to commit financial statement fraud and for conditions that enable management to override board monitoring to carry out the fraud.
This study's definition of financial statement fraud is limited to two types. The first type includes occurrences where management intentionally issues materially misleading financial statement information to outside users. The second type includes occurrences of misappropria- tions of assets by top management. Top management includes the chairperson, vice chairperson, chief executive officer, president, chief financial officer and treasurer. As noted in paragraph .03 of SAS No. 53, these two types of fraud represent intentional misstatements or omissions of amounts or disclosures in financial statements.
The empirical results confirm the predicted relation between board of director composition and the occurrence of financial statement fraud. The results show that no-fraud firms have significantly (p < .01) higher percentages of outside directors than fraud firms. Additional analysis indicates that the empirical tests are not sensitive to the definition of outside directors used. Furthermore, because boards of directors often delegate responsibility for oversight of the financial statement reporting process to an audit committee, additional tests are performed to consider whether the presence of an audit committee significantly affects the likelihood of financial statement fraud. Results indicate that board composition continues to differ signifi- cantly across fraud and no-fraud firms even after controlling for the presence of an audit committee. Interestingly, no-fraud firms are not significantly more likely to have an audit committee, and the interaction of board composition with audit committee presence does not significantly affect the likelihood of financial statement fraud. A separate analysis of a sub- sample of firms having audit committees indicates that there is no significant difference in audit committee composition across fraud and no-fraud firms. These results suggest that board composition, rather than audit committee presence or composition, plays a greater role in reducing the likelihood of financial statement fraud.
Supplemental analysis of the sample firms is performed to determine whether certain characteristics of outside directors affect the likelihood of financial statement fraud. As the level of stock ownership in the firm held by outside directors increases, as outside director tenure on the board increases, and as the number of directorship responsibilities on other corporate boards held by outside directors decreases, the likelihood of financial statement fraud decreases. Additionally, as board size decreases, the likelihood of financial statement fraud decreases.
The current study continues as follows. Section II develops the underlying theory to motivate the hypothesized predictions about board of director composition, audit committee presence and the occurrence of financial statement fraud. Section IHI describes the sample selection process. Section IV details the research design, and section V contains the empirical results of the study. Section VI concludes the study.
II. THEORY AND HYPOTHESES DEVELOPMENT An important function of the board of director is to minimize costs that arise from the
separation of ownership and decision control of the modern-day corporation (Fama and Jensen 1983).1 The board of director receives its authority for internal control and other decisions from
I Fama (1980), Fama and Jensen (1983), Williamson (1984) and Shleifer and Vishny (1986) note that there are both external and internal corporate governance mechanisms designed to minimize divergences that arise from the separation of ownership and decision control. This study focuses on one internal corporate governance mechanism: the board of directors.
This content downloaded from 142.3.100.23 on Sun, 8 Sep 2013 15:13:22 PMAll use subject to JSTOR Terms and Conditions

446 The Accounting Review, October 1996
stockholders of corporations. This delegation occurs because stockholders generally diversify their risks by owning securities in numerous firms (Fama 1980). and such diversification creates a free-rider problem where no individual stockholder has a large enough incentive to devote resources to ensure that management is acting in the stockholders' interests (Grossman and Hart 1980).
Fama and Jensen (1983) theorize that the stockholders' delegation of responsibility for internal control to the board of director makes the board the apex of decision control within both large and small corporate organizations. Although the board delegates most decision manage- ment functions and many decision control functions to top management, the board retains ultimate control over top management. Such control includes the board's right to ratify and monitor important decisions, and to choose, dismiss and reward important decision agents. The board of director assumes responsibility for establishing an appropriate control system within the firm and monitoring top management's compliance with this system.
Fama (1980) and Fama and Jensen (1983) suggest that the composition of individuals who serve on the board of director is an important factor in creating a board that is an effective monitor of management actions. While noting the importance of having both inside (i.e., management) and outside (i.e., nonmanagement) members on the board of director, they argue that the board's effectiveness in monitoring management is a function of the mix of insiders and outsiders who serve.
Fama (1980) and Fama and Jensen (1983) argue that it is natural for the most influential members of the board to be the internal managers, because they have valuable specific information about the organization's activities that is obtained from internal mutual monitoring of other managers. Such information assists the board in being an effective device for decision control. As a result, Fama (1980) and Fama and Jensen (1983) expect the board to include several of the organization's top managers.
However, the board is not effective at decision control unless it limits the decision discretion of individual top managers. Williamson (1984) notes that, because managers have huge informational advantages due to their full-time status and insider knowledge, the board of director can easily become an instrument of management, thereby sacrificing the interests of stockholders. Domination by top management on the board of director can lead to collusion and transfer of stockholder wealth (Fama 1980). As a result, corporate boards generally include outside members who act as arbiters in disagreements among internal managers and ratify decisions that involve serious agency problems (Fama and Jensen 1983). The findings of Rosenstein and Wyatt (1990) suggest that stockholders value the inclusion of outside directors on boards as evidenced by a positive abnormal stock return when outside directors are added to boards. Trends in practice also suggest there is a perceived value in the role played by outside directors. The percentage of outsiders present on boards of directors is increasing with outside directors comprising a board majority of 94 percent of manufacturing firms polled in 1992 compared to 86 percent in 1989 and 71 percent in 1972 (Wall Street Journal 1993b).
Fama (1980) and Fama and Jensen (1983) hypothesize that the viability of the board as an internal control mechanism is enhanced by the inclusion of outside directors because outside directors have incentives to develop reputations as experts in decision control because the external market for their services prices them according to their performance as outside directors. They argue that most outside directors of corporations are either managers or important decision agents in other corporations. The value of their human capital depends primarily on their performance as internal decision managers in other organizations. Outside directors use their directorships to signal to external markets for decision agents that ( 1) they are decision experts,
This content downloaded from 142.3.100.23 on Sun, 8 Sep 2013 15:13:22 PMAll use subject to JSTOR Terms and Conditions

Beasley-Board of Director Composition and Financial Statement Fraud 447
(2) they understand the importance of decision control, and (3) they can work with such decision control systems. Empirical research highlights the existence of an external market for corporate directors that punishes individuals for poor performance as directors. Kaplan and Reishus (1 990) find that top managers in poorly performing firms (e.g., dividend reducing firms) have fewer opportunities to serve as outside directors for other firms. Gilson ( 1990) finds that directors who leave boards of distressed firms hold approximately one-third fewer directorships three years after their departures than the number of directorships they held at the time of their resignation.
The national stock exchanges specify certain audit committee requirements which, in turn, affect board of director composition.2 In June 1978, the New York Stock Exchange (NYSE) established a requirement that firms have audit committees composed entirely of independent directors. (An independent director is one who is not a part of current management.) The other exchanges are less strict. The American Stock Exchange (AMEX) recommends, but does not require, audit committees composed entirely of independent directors. In 1987, the National Association of Securities Dealers (NASDAQ) established a requirement that listed firms have audit committees with at least a majority of independent directors.
Accounting regulators and standards-setters often discuss the significance of the board of director as an internal control mechanism for the prevention of financial statement fraud. The AICPA's (1987) Report of the National Commission on Fraudulent Financial Reporting, the AICPA (1993) Special Report: Issues Confronting the Accounting Profession, and the AICPA's (1994) Strengthening The Professionalism of the IndependentAuditor contain recommendations calling for changes in board composition to enhance the board's independence for purposes of minimizing occurrences of financial statement fraud. In the wake of the banking crisis, the Federal Deposit Insurance Corporation (FDIC) implemented new audit committee composition require- ments mandating the inclusion of independent directors who, for certain large insured depository institutions, must include individuals with banking or financial expertise.
The financial press documents a perceived relation between board of director composition and the occurrence of financial statement fraud. For example, the New York Times (1993) reported that following an occurrence of material fraudulent financial reporting, the Leslie Fay Company announced the election of two additional outside members "to give its board a more independent character." And, the Wall Street Journal (1993) reported that outside board members of Clayton Home Inc. resigned, highlighting their concern about the firm's failure to investigate a possible financial statement related fraud.
Fama's (1980) and Fama and Jensen's (1983) theory regarding board composition, prior empirical research and the various recommendations for board of director reform suggest that having a higher percentage of outside directors increases the board' s effectiveness as a monitor of management. Therefore, this study empirically tests the following hypothesis:
Hi: The proportion of outside members on the board of director is lower for firms experiencing financial statement fraud than for no-fraud firms.
The above hypothesis is based on the definition of an outside director that includes all non- employee directors, consistent with the requirements of the national stock exchanges. A number of corporate governance researchers note, however, that the traditional distinction between inside and outside directors may fail to account for the actual and potential conflicts of interests between outside directors and the corporations they serve (Mace 1986; Patton and Baker 1987; Hermalin
2 As discussed later, this study also considers the effects of having an audit committee.
This content downloaded from 142.3.100.23 on Sun, 8 Sep 2013 15:13:22 PMAll use subject to JSTOR Terms and Conditions

448 The Accounting Review, October 1996
and Weisbach 1988, 1991; Lee et al. 1992; Shivdasani 1993; Vicknair et al. 1993). These researchers commonly classify outside directors into one of two categories: "independent directors" and "grey directors." An independent director is an outside director who has no affiliation with the firm other than the affiliation from being on the board of director. In contrast, grey directors are outside directors who have some non-board affiliation with the firm. Grey directors are a potential source of violation of board independence because of their other affiliations with management. While they are not current employees of the firm, and thus are considered to be outside directors, grey directors' independence may be impaired by being relatives of management, consultants and suppliers of the firm, outside attorneys who perform legal work for the firm, retired executives of the firm and investment bankers (Gilson 1990; Shivdasani 1993). Vicknair et al. (1993) find that 74 percent of NYSE firms have at least one grey director on the audit committee.
Fama's (1980) and Fama and Jensen's (1983) theory regarding board composition would predict that higher percentages of independent directors increase the board's effectiveness as a monitor of management. Therefore, this study empirically tests the following hypothesis:
H2: The proportion of independent members on the board of director is lower for firms experiencing financial statement fraud than for no-fraud firms.
Often the board of director delegates the responsibility for the oversight of financial reporting to an audit committee (AICPA 1987; SAS No. 53; AICPA 1988a; AICPA 1993). Pincus et al. (1989) note that audit committees are viewed as monitoring mechanisms that are voluntarily employed in high agency cost situations to improve the quality of information flow between principal and agent. They note that the audit committee enhances the board of director' capacity to act as a management control by providing more detailed knowledge and understanding of financial statements and other financial information issued by the company. The existence of an audit committee can be perceived as indicating higher quality monitoring and should have a significant effect on reducing the likelihood of financial statement fraud. Therefore, this study empirically tests the following hypothesis:
H3: Boards of directors offirms experiencing financial statementfraud are less likely to have an audit committee than boards of directors of no-fraud firms.
III. SAMPLE SELECTION AND DESCRIPTION
The sample used to test this hypothesis consists of 150 publicly traded firms. Seventy-five of the 150 firms represent the "fraud firms" because each of these firms had an occurrence of financial statement fraud publicly reported during the period 1980-1991. Each of the fraud firms is matched with a no-fraud firm, creating a choice-based sample of 75 fraud and 75 no-fraud firms.
Fraud Firm Selection
The financial statement fraud sample is limited to publicly traded firms because the study examines information only available in proxy statements and financial statements filed with the SEC. Two sources were used to identify these firms. The first source is Accounting and Auditing Enforcement Releases (AAERs) issued by the SEC. A firm reported in an AAER is included as a sample fraud firm if the SEC accused top management of violating Rule 10(b)-5 of the 1934 Securities Exchange Act (the 1934 Act). Rule l 0(b)-5 requires the intent to deceive, manipulate or defraud. The second source of fraud firms is the Wall Street Journal Index ( WSJ Index) caption of "Crime-White Collar Crime." In most cases, the firms identified in the WSJ Index are also
This content downloaded from 142.3.100.23 on Sun, 8 Sep 2013 15:13:22 PMAll use subject to JSTOR Terms and Conditions

Beasley-Board of Director Composition and Financial Statement Fraud 449
reported in AAERs. Those fraud firms reported by the WSJIndex, but not in an AAER, were added to the sample as fraud firms.
The AAERs and the WSJ Index appear to be reasonable sources for identifying financial statement fraud occurrences for two reasons. First, almost all of the applicable AAERs contain a disclosure that management personnel involved in the financial statement fraud consented to the final judgment action imposed by the SEC. Feroz et al. (1991) note that the SEC only pursues cases where the probability of SEC success is high and where the allegations involve material violations. Second, for fraud firms identified by review of the WSJ Index, management personnel involved have either resigned, been terminated, or been indicted by a grand jury. Management's consent, resignation, termination or indictment disclosed by these two sources suggest a high level of seriousness of the fraud allegation. To the extent that financial statement fraud occurrences identified in AAERs and the WSJ Index are not representative of the population of financial statement fraud occurrences, the implications of this study are limited.
A fraud firm identified from these two sources is included in the sample if the appropriate proxy and financial statement data are available in the fiscal year preceding the first occurrence of the financial statement fraud. Such proxy and financial statement data were hand collected from the Q-Data SEC Files (the Q Files) which are on microfiche. Information about the specific financial reporting periods affected by the financial statement fraud was obtained from the AAER or applicable articles in the Wall Street Journal.
These two sources provide a sample of 75 fraud firms for examination. As noted in figure 1, 67 of the 75 fraud firms are from the review of 1982-1991 AAERs, which include AAERs #1-#348. The remaining eight fraud firms are from the review of the 1980-1991 WSJ Index. AAERs and the WSJ Index issues after 1991 were not reviewed to allow a sufficient period of time to verify that the related comparison group of no-fraud firms (as described later) have not experienced financial statement fraud. Figure 1 reconciles the number of AAERs issued from 1982 through 1991 to the number of sample fraud firms included in this study.
Sixty-seven (89.3%) of the 75 fraud firms experienced fraudulent financial reporting and eight firms (10.3%) experienced misappropriations of assets. This proportion is consistent with the findings of the National Commission on Fraudulent Financial Reporting (AICPA 1987) which determined that 87 percent of the SEC enforcement actions in 1982-1986 dealt with fraudulent financial reporting.
FIGURE 1 Identification of 75 Fraud Firms
Number of Accounting and Auditing Enforcement Releases (AAERs) 1982-1991 348
Less: * AAERs not involving financial statement fraud (e.g., unintentional misapplication of GAAP)
or AAERs expanding other AAERs (e.g., duplicate AAERs for same firm) (198) * AAERs affecting firms with no available proxy or financial statement data (64) * AAERs affecting banks or insurance firms experiencing financial statement fraud (16) * AAERs affecting firms where no matching no-fraud firm can be identified (3)
Subtotal of fraud firms identified by reviewing AAERs 67
Add: Allegations of financial statement fraud reported by the Wall Street Journal but not reported in an AAER 8
Total number of fraud firms included in study 75
This content downloaded from 142.3.100.23 on Sun, 8 Sep 2013 15:13:22 PMAll use subject to JSTOR Terms and Conditions

450 The Accounting Review, October 1996
Comparing Fraud Firms to No-Fraud Firms
To create a comparison group, no-fraud firms were identified that are similar to the fraud firms in size, industry, national stock exchange and time period. Each fraud firm was matched with a no-fraud firm based on the following requirements:
1. Stock Exchange. The common stocks of a fraud firm and its matched no-fraud firm trade on the same national stock exchange (NASDAQ, AMEX, NYSE).
2. Firm Size. All firms within the particular national stock exchange category, per the annual COMPUSTAT tape that are in the same industry (see step 3) as the fraud firm, were selected if those firms are similar in firm size. Firms are considered similar in firm size if the current market value of common equity is withi ?30 percent of the current market value of common equity for the fraud firm in the year preceding the year of the financial statement fraud.3 4
3. Industry. All firms identified in steps 1 and 2 were reviewed to identify a no-fraud firm within the same four-digit SIC code as the fraud firm. The no-fraud firm selected was the one that had a current market value of common equity closest to the current market value of common equity of the fraud firm (or total assets if market data were not available). If no four-digit SIC code firm match was identified, the same procedure was performed to identify a firm with the same three-digit SIC code. If no three-digit match was identified, the same procedures were performed to identify a two-digit SIC code match.5
4. Time Period. A no-fraud firm identified in steps 1 through 3 was included in the final sample if proxy and financial statement data are available for the time period used to collect data from the proxy and financial statements of the related fraud firm.
Table 1 shows that the fraud and no-fraud firms do not differ significantly based on total assets, net sales and current market value of common stock. Also, fraud and no-fraud firms match closely based on national stock exchange, industry and time period.
More importantly, the fraud and no-fraud firms should ideally be similar in the likelihood of a financial statement fraud occurrence. Loebbecke et al. (1989) note that financial statement fraud occurs when managers in positions of authority and responsibility in the entity are of a character that would allow them to commit a fraud knowingly. Loebbecke et al. (1989) note that financial statement fraud is most likely to occur in firms where management has sufficient motivation to commit the fraud and conditions exist within the firm that allow a material management fraud to be carried out.
This study controls for differences in motivational and conditional factors identified in Loebbecke et al. (1989) that are also known to affect board composition, because their omission may otherwise create a correlated omitted variable bias.6 The specific control variables included
3Kaplan and Reishus (1990) create a comparison sample using a cutoff of ? 50 percent. While this study's use of ? 30 percent may appear as a large range, most of the fraud firms and related no-fraud firms are within ? 20 percent. Given that the mean market value of common equity of the fraud firms is $127.6 million, the related control firm size could range from $89.3 million to $165.9 million. There is no reason to believe that such a range has a significant effect on board characteristics.
4 For 25 of the 75 fraud firms, no-fraud firms were matched on total assets because market value information is not available on the COMPUSTAT tape or in the Daily Stock Price Record for the fraud firm.
5 Twenty-four of the 75 fraud firms were matched with no-fraud firms within the same two-digit SIC code category. Results reported in this paper do not differ between firms matched at the two-digit level versus firms matched at the three and four-digit levels.
6 The Loebbecke et al. (1989) model also includes factors related to management's attitude or willingness to commit financial statement fraud. Due to the sample selection techniques used to identify fraud firms for this study, management
(Continued)
This content downloaded from 142.3.100.23 on Sun, 8 Sep 2013 15:13:22 PMAll use subject to JSTOR Terms and Conditions

Beasley-Board of Director Composition and Financial Statement Fraud 451
TABLE 1 Matching of Fraud Firms and No-Fraud Firms
($ in thousands)
Fraud-Firms No-Fraud Firms Mean Mean
[Median] [Median] (Standard Deviation) (Standard Deviation)
Total Assets $103,192 $79,626 [11,130] [12,487]
(316,734) (221,187) n=75 n=75
Net Sales $102,285 $93,078 [13,0431 [12,9361
(262,875) (257,451) n=75 n=75
Current Market $127,630 $124,590 Value of Equitya [26,563] [23,660]
(263,370) (257,690) n=50 n=50
Stock Traded on: NASDAQ 62 62 AMEX 4 4 NYSE 9 9
Match Based On: 4 Digit SIC Codes 19 3 Digit SIC Codes 32 2 Digit SIC Codes 24
75
First Year of Fraud: 1979 3 1982 9 1985 11 1988 3 1980 6 1983 13 1986 5 1989 6 1981 3 1984 4 1987 11 1990 1
75 a Market price information was available for 50 of the 75 fraud firms. Thus, no-fraud firms were matched based on current
market value of equity for those 50 firms. For the remaining 25 fraud firms, no-fraud firms were matched based on total assets.
Note: Paired t-tests for means and Wilcoxon matched-pair sign-rank test for medians were performed to determine whether fraud and no-fraud firms differ significantly based on Total Assets, Net Sales, or Current Market Value of Equity. No statistically significant differences exist.
in this study are identified in section IV, which describes the logit regression analysis used to test the hypothesis.
The identification of no-fraud firms will result in some misclassification if a firm classified as a no-fraud firm had an occurrence of financial statement fraud that has yet to be detected. To
(Footnote 6 continued) for all of the fraud firms has an attitude (or willingness) sufficient to commit financial statement fraud given that fraud has occurred at those firms. However, this study is unable to control for differences in management attitudes for the sub- set of no-fraud firms. To the extent that such differences, if any, relate to board composition, a limitation of this study exists.
This content downloaded from 142.3.100.23 on Sun, 8 Sep 2013 15:13:22 PMAll use subject to JSTOR Terms and Conditions

452 The Accounting Review, October 1996
minimize this likelihood, the WSJ Index from 1980 through early 1994 and all AAERs were reviewed to verify that there was no report of a financial statement fraud for each no-fraud firm.
IV. RESEARCH DESIGN
The research design of this study involves logit cross-sectional regression analysis. Logit regression is used because the dependent variable, FRAUD, is dichotomous (see Stone and Rasp 1991). The estimation is based on a choice-based sample in which 50 percent of the firms have experienced financial statement fraud and 50 percent have not experienced financial statement fraud. While there are no available estimates of the number of publicly traded firms experiencing financial statement fraud, it is very likely that the true rate of firms experiencing financial statement fraud (as defined in this study) within the total population of publicly traded firms is less than 50 percent. Therefore, the one-to-one matching process used in this study differs from a pure random sampling approach.
Maddala (1991) states that logit regression analysis is the appropriate procedure where disproportionate sampling from two populations (i.e., the fraud and no-fraud firm populations) occurs. He notes that "The coefficients of the explanatory variables are not affected by the unequal sampling rates from the two groups. It is only the constant term that is affected." Correcting for the bias in the constant term is only important if the logit analysis is being used to obtain parameter estimates for purposes of developing a predictive model (Palepu 1986). It is not the purpose of this study to develop a predictive model of fraud, so bias in the constant term has no effect on the analysis and logit regression is appropriate for testing the hypotheses.
The following logit cross-sectional regression model is used to test the hypothesized relation between board of director composition and occurrences of financial statement fraud described in Hi:
FRA UD, = ax+fl%OUTSIDE,+fl2GROWTH1+T3jROUBLE1+f34AGEPUB, +J3MGTOWNBD +(1CEOTENURE)+7BOSS+PBLOCKHLDj+E; (1)
where i = firm 1 through 150;
FRAUD = a dummy variable with a value of one when a firm is alleged to have experienced financial statement fraud and a value of zero otherwise;
%OUTSIDE = the percentage of the board members who are non-employee directors;
GROWTH = the average percentage change in total assets for two years ending before the year of the financial statement fraud;
TROUBLE = a dummy variable with a value of one when the firm has reported at least three annual net losses in the six-year period preceding the first year of the financial statement fraud and a value of zero otherwise;7
AGEPUB = the number of years the firm's stock has traded on a national stock exchange;
MGTOWNBD = the cumulative percentage of ownership in the firm held by insiders (e.g., managers) who serve on the board;
This measure is consistent with the financial trouble measure used in DeAngelo and DeAngelo (1990) and DeAngelo et al. (1994). A supplemental test using a different measure for TROUBLE that reflects the number of consecutive years since the last reported annual net loss, if any, during the previous six-year period produces results that are unchanged from those reported in section V. Thus, the supplemental test does not support the belief that the recency of an annual net loss, rather than the number of annual net losses, provides an incentive for management to act fraudulently.
This content downloaded from 142.3.100.23 on Sun, 8 Sep 2013 15:13:22 PMAll use subject to JSTOR Terms and Conditions

Beasley-Board of Director Composition and Financial Statement Fraud 453
CEOTENURE = the number of years that the CEO has served as a director;
BOSS = a dummy variable with a value of one if the chairperson of the board holds the managerial positions of CEO or president and a value of zero otherwise;
BLOCKHLD = the cumulative percentage of outstanding common stock shares held by blockholders holding at least 5 percent of such shares and who are not affiliated with management. Blocks held by family trusts, company employee stock ownership plans and retirement plans are excluded because the voting rights associated with those shares are generally controlled by top management; and
e = the residual.
The variable of interest in this study is %OUTSIDE, which represents the percentage of the total number of board members who are considered outside directors. The definition of outside director used in this study is consistent with that used by the national stock exchanges. That definition treats all directors who are not currently employed by the firm as an outside director and treats all current employees as inside (i.e., management) directors. A negative and significant coefficient on this variable would support the hypothesized prediction about board of director composition and the occurrence of financial statement fraud.
Seven control variables that relate to motivational and conditional factors identified in Loebbecke et al. (1989) are included in the logit model because they are also known to affect board of director composition. GROWTH controls for differences in the extent of firm growth between fraud and no-fraud firms because Loebbecke et al. (1989) and Bell et al. (1991) note that one of the most significant "red flag" fraud indicators is the presence of rapid company growth. They state that if the company has been experiencing rapid growth, management may be motivated to misstate the financial statements during a downturn to give the appearance of stable growth. The extent of rapid company growth is also associated with board of director composition because needed modifications to rules, procedures and internal control mechanisms, including board of director composition, often lag behind high growth periods. Warner et al. (1988) find the lag between firm performance and management change can be up to two years.
TROUBLE controls for differences in the degree of financial health between fraud and no- fraud firms. Loebbecke et al. (1989) and Bell et al. (1991) note that poor financial performance often causes management to place undue emphasis on earnings and profitability, thereby increasing the likelihood of financial statement fraud. Baysinger and Butler's (1985) results indicate that the degree of financial health also affects board composition because firms with above average financial performance have higher percentages of outside directors than firms with below average performance. Gilson (1990) finds that a firm's financial distress is also associated with board composition changes with boards shifting to higher numbers of directors who are creditors and blockholders subsequent to the onset of financial distress.
AGEPUB controls for differences in the length of time that the firm's common stock has traded in public markets. The National Commission on Fraudulent Financial Reporting (AICPA 1987, 29) notes that new public companies have a proportionately greater risk of financial statement fraud because management is especially pressured to meet earnings expectations. Additionally, the longer a company has traded in public markets, the more likely it has made changes to comply with requirements of the public markets, including requirements affecting board composition.
MGTOWNBD controls for differences in the extent of common stock ownership in the firm held by top management serving on the board as a director. Ownership by management directors
This content downloaded from 142.3.100.23 on Sun, 8 Sep 2013 15:13:22 PMAll use subject to JSTOR Terms and Conditions
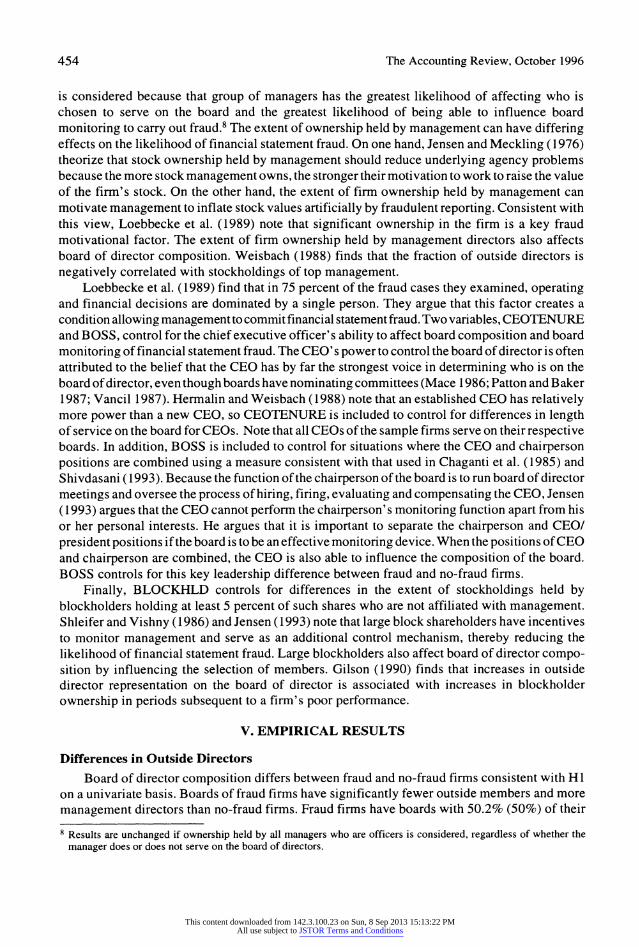
454 The Accounting Review, October 1996
is considered because that group of managers has the greatest likelihood of affecting who is chosen to serve on the board and the greatest likelihood of being able to influence board monitoring to carry out fraud.8 The extent of ownership held by management can have differing effects on the likelihood of financial statement fraud. On one hand, Jensen and Meckling (1976) theorize that stock ownership held by management should reduce underlying agency problems because the more stock management owns, the stronger their motivation to work to raise the value of the firm's stock. On the other hand, the extent of firm ownership held by management can motivate management to inflate stock values artificially by fraudulent reporting. Consistent with this view, Loebbecke et al. (1989) note that significant ownership in the firm is a key fraud motivational factor. The extent of firm ownership held by management directors also affects board of director composition. Weisbach (1988) finds that the fraction of outside directors is negatively correlated with stockholdings of top management.
Loebbecke et al. (1989) find that in 75 percent of the fraud cases they examined, operating and financial decisions are dominated by a single person. They argue that this factor creates a condition allowing management to commit financial statement fraud. Two variables, CEOTENURE and BOSS, control for the chief executive officer's ability to affect board composition and board monitoring of financial statement fraud. The CEO's power to control the board of director is often attributed to the belief that the CEO has by far the strongest voice in determining who is on the board of director, even though boards have nominating committees (Mace 1986; Patton and Baker 1987; Vancil 1987). Hermalin and Weisbach (1988) note that an established CEO has relatively more power than a new CEO, so CEOTENURE is included to control for differences in length of service on the board for CEOs. Note that all CEOs of the sample firms serve on their respective boards. In addition, BOSS is included to control for situations where the CEO and chairperson positions are combined using a measure consistent with that used in Chaganti et al. (1985) and Shivdasani (1993). Because the function of the chairperson of the board is to run board of director meetings and oversee the process of hiring, firing, evaluating and compensating the CEO, Jensen (1993) argues that the CEO cannot perform the chairperson's monitoring function apart from his or her personal interests. He argues that it is important to separate the chairperson and CEO/ president positions if the board is to be an effective monitoring device. When the positions of CEO and chairperson are combined, the CEO is also able to influence the composition of the board. BOSS controls for this key leadership difference between fraud and no-fraud firms.
Finally, BLOCKHLD controls for differences in the extent of stockholdings held by blockholders holding at least 5 percent of such shares who are not affiliated with management. Shleifer and Vishny (1986) and Jensen (1993) note that large block shareholders have incentives to monitor management and serve as an additional control mechanism, thereby reducing the likelihood of financial statement fraud. Large blockholders also affect board of director compo- sition by influencing the selection of members. Gilson (1990) finds that increases in outside director representation on the board of director is associated with increases in blockholder ownership in periods subsequent to a firm's poor performance.
V. EMPIRICAL RESULTS
Differences in Outside Directors
Board of director composition differs between fraud and no-fraud firms consistent with Hi on a univariate basis. Boards of fraud firms have significantly fewer outside members and more management directors than no-fraud firms. Fraud firms have boards with 50.2% (50%) of their
x Results are unchanged if ownership held by all managers who are officers is considered, regardless of whether the manager does or does not serve on the board of directors.
This content downloaded from 142.3.100.23 on Sun, 8 Sep 2013 15:13:22 PMAll use subject to JSTOR Terms and Conditions
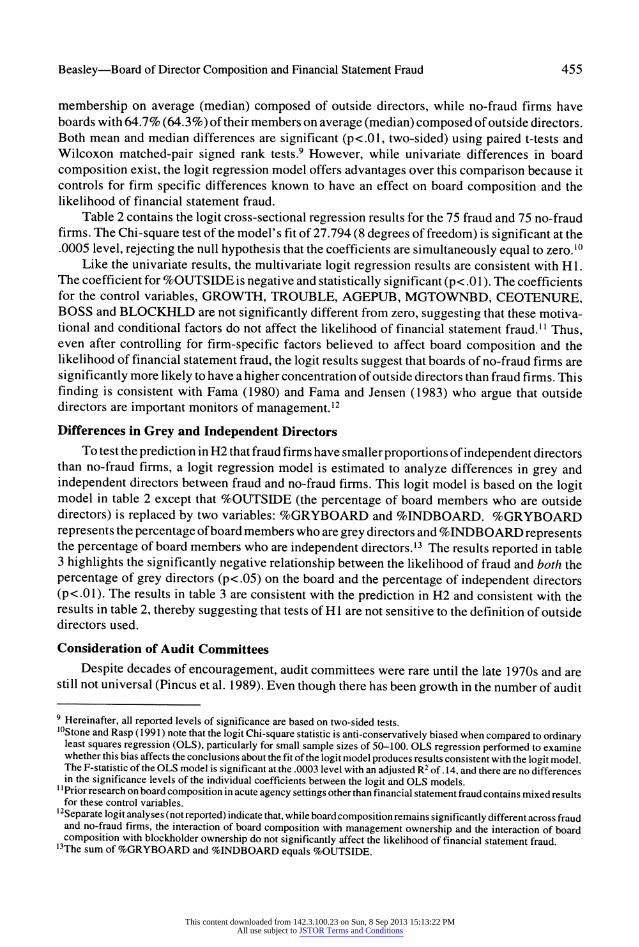
Beasley-Board of Director Composition and Financial Statement Fraud 455
membership on average (median) composed of outside directors, while no-fraud firms have boards with 64.7% (64.3%) of their members on average (median) composed of outside directors. Both mean and median differences are significant (p<.01, two-sided) using paired t-tests and Wilcoxon matched-pair signed rank tests.9 However, while univariate differences in board composition exist, the logit regression model offers advantages over this comparison because it controls for firm specific differences known to have an effect on board composition and the likelihood of financial statement fraud.
Table 2 contains the logit cross-sectional regression results for the 75 fraud and 75 no-fraud firms. The Chi-square test of the model's fit of 27.794 (8 degrees of freedom) is significant at the .0005 level, rejecting the null hypothesis that the coefficients are simultaneously equal to zero.'0
Like the univariate results, the multivariate logit regression results are consistent with H 1. The coefficient for %OUTSIDE is negative and statistically significant (p< .0 1). The coefficients for the control variables, GROWTH, TROUBLE, AGEPUB, MGTOWNBD, CEOTENURE, BOSS and BLOCKHLD are not significantly different from zero, suggesting that these motiva- tional and conditional factors do not affect the likelihood of financial statement fraud." l Thus, even after controlling for firm-specific factors believed to affect board composition and the likelihood of financial statement fraud, the logit results suggest that boards of no-fraud firms are significantly more likely to have a higher concentration of outside directors than fraud firms. This finding is consistent with Fama (1980) and Fama and Jensen (1983) who argue that outside directors are important monitors of management.'2
Differences in Grey and Independent Directors
To test the prediction in H2 that fraud firms have smallerproportions of independent directors than no-fraud firms, a logit regression model is estimated to analyze differences in grey and independent directors between fraud and no-fraud firms. This logit model is based on the logit model in table 2 except that %OUTSIDE (the percentage of board members who are outside directors) is replaced by two variables: %GRYBOARD and %INDBOARD. %GRYBOARD represents the percentage of board members who are grey directors and %INDBOARD represents the percentage of board members who are independent directors. 13 The results reported in table 3 highlights the significantly negative relationship between the likelihood of fraud and both the percentage of grey directors (p<.05) on the board and the percentage of independent directors (p<.01). The results in table 3 are consistent with the prediction in H2 and consistent with the results in table 2, thereby suggesting that tests of HI are not sensitive to the definition of outside directors used.
Consideration of Audit Committees
Despite decades of encouragement, audit committees were rare until the late 1 970s and are still not universal (Pincus et al. 1989). Even though there has been growth in the number of audit
9 Hereinafter, all reported levels of significance are based on two-sided tests. '0Stone and Rasp (1991) note that the logit Chi-square statistic is anti-conservatively biased when compared to ordinary
least squares regression (OLS), particularly for small sample sizes of 50-100. OLS regression performed to examine whether this bias affects the conclusions about the fit of the logit model produces results consistent with the logit model. The F-statistic of the OLS model is significant at the .0003 level with an adjusted R2 of.14, and there are no differences in the significance levels of the individual coefficients between the logit and OLS models.
"Prior research on board composition in acute agency settings other than financial statement fraud contains mixed results for these control variables.
12Separate logit analyses (not reported) indicate that, while board composition remains significantly different across fraud and no-fraud firms, the interaction of board composition with management ownership and the interaction of board composition with blockholder ownership do not significantly affect the likelihood of financial statement fraud.
13The sum of %GRYBOARD and %INDBOARD equals %OUTSIDE.
This content downloaded from 142.3.100.23 on Sun, 8 Sep 2013 15:13:22 PMAll use subject to JSTOR Terms and Conditions

456 The Accounting Review, October 1996
TABLE 2 Outside Director Logit Regression Results
75 Fraud Firms Matched with 75 No-Fraud Firms
FRA UDi=a+,%OUTSIDEj+,2GROWTHi+,3TROUBLEj+,4AGEPUBi
+,l5MGTOWNBDi+P6CEOTENURE,+P7BOSSi+P8BLOCKHLDi+
Independent Predicted Estimated Standard Coefficients Variable Relation Coefficients Errors T-Statistics
00 INTERCEPT none 2.661 1.126 2.36**
Board Composition: % of Outside Directors
f31 %OUTSIDE - -4.432 1.318 -3.36***
Control Variables
/32 GROWTH none .111 .146 .76 /33 TROUBLE none .428 .453 .94 /34 AGEPUB none -.046 .036 -1.28
ASs MGTOWNBD none -.979 1.217 -.80
/36 CEOTENURE none -.014 .027 -.52 /37 BOSS none .579 .476 1.22
168 BLOCKHLD none -.901 1.594 -.57
Pseudo R2 .15
Chi-Square Test of Model's Fit 27.794 (p=.0005) (8 degrees of freedom)
**, *** Statistically significant at less than the .05, .01 level, based on two-sided tests. FRAUD = a dummy variable with a value of one when a firm is alleged to have experienced financial
statement fraud and a value of zero otherwise. %OUTSIDE = the percentage of the board members who are non-employee directors. GROWTH = the average percentage change in total assets for two years ending before the year of the
financial statement fraud. TROUBLE = a dummy variable with a value of one when a firm has reported at least three annual net
losses in the six-year period preceding the first year of the financial statement fraud and a value of zero otherwise.
AGEPUB = the number of years the firm's stock has traded on a national stock exchange. MGTOWNBD = the cumulative percentage of ownership in the firm held by insiders (e.g., managers) who
serve on the board. CEOTENURE = the number of years that the CEO has served as a director. BOSS = a dummy variable with a value of one if the chairperson of the board holds the managerial
positions of CEO or president and a value of zero otherwise. BLOCKHLD = the total percentage of outstanding shares of blockholders who hold at least 5 percent of
outstanding shares and are not affiliated with management. ? = the residual.
This content downloaded from 142.3.100.23 on Sun, 8 Sep 2013 15:13:22 PMAll use subject to JSTOR Terms and Conditions

Beasley-Board of Director Composition and Financial Statement Fraud 457
TABLE 3 Grey and Independent Director Logit Regression Results
75 Fraud Firms Matched with 75 No-Fraud Firmsa
Independent Predicted Estimated Standard Coefficients Variable Relation Coefficients Errors T-Statistics
B0 INTERCEPT none 2.822 1.152 2.45**
Board Composition: % of Outside Directors
8,I %GRYBOARD - -3.299 1.444 -2.28***
/32 %INDBOARD - -5.466 1.462 -3.74
Control Variables
/3 GROWTH none .112 .146 .77 /34 TROUBLE none .249 .469 .53 /35 AGEPUB none -.051 .037 -1.38
/36 MGTOWNBD none -1.380 1.248 -1.11 /37 CEOTENURE none -.019 .028 -.68
/38 BOSS none .822 .504 1.63
,(89 BLOCKHLD none -.931 1.677 -.56
Pseudo R2 .17
Chi-Square Test of Model's Fit 31.285 (p=.0003) (9 degrees of freedom)
**, *** Statistically significant at less than the .05, .01 level, based on two-sided tests. a The results in this table are based on the logit regression model in table 2 except that the variable
%OUTSIDE was replaced with the following two variables:
%GRYBOARD = the percentage of board members who are grey directors. Grey directors represent all outside directors who are related to management, consultants/suppliers to the firm, outside attorneys who perform legal work for the firm, retired executives of the firm, or investment bankers because they are not viewed as being independent of management.
%INDBOARD = the percentage of the board members who are considered "independent" directors-an outside director who has no tie to the firm outside his/her role as director. Independent directors represent all outside directors excluding grey directors.
committees, Pincus et al. (1989) report that a followup study on the implementation of the National Commission on Fraudulent Financial Reporting recommendations finds that companies continue not to use audit committees. Review of the sample firms included in this study indicates that only 63 percent of the no-fraud firms and 41 percent of the fraud firms have an audit committee.14 For the subset of firms having an audit committee, the mean (median) size of no- fraud firm audit committees is 2.7 (3.0) directors while the mean (median) size of fraud firm audit committees is 1.8 (2.0) directors.
14All but two of the firms without audit committees are listed on NASDAQ. The year of the financial statement fraud for most, but not all, of the NASDAQ firms not having an audit committee precedes the year (1987) NASDAQ implemented an audit committee requirement. Even so, the subsequent analysis provides useful evidence about the effectiveness of audit committees in reducing the likelihood of financial statement fraud.
This content downloaded from 142.3.100.23 on Sun, 8 Sep 2013 15:13:22 PMAll use subject to JSTOR Terms and Conditions

458 The Accounting Review, October 1996
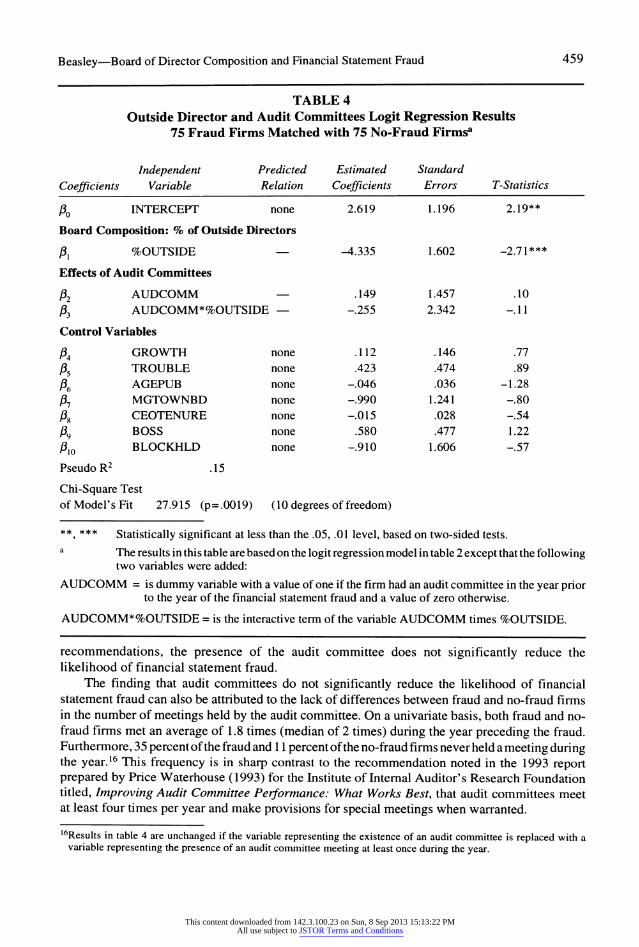
To examine whether the presence of an audit committee is associated with a reduced likelihood of fraudulent behavior, as predicted by H3, the variable AUDCOMM is added to the logit model in table 2. AUDCOMM is a dummy variable with a value of one if the sample firm has an audit committee in the year prior to the fraud and a value of zero otherwise. Additionally, because many of the board composition reform proposals (e.g., AICPA National Commission on Fraudulent Financial Reporting 1987; AICPA Public Oversight Board 1993, 1994) and the requirements of the national stock exchanges call for greater inclusion of outside directors on audit committees, the presence of an audit committee indirectly affects board composition if outside directors are added to the board to serve on the audit committee. Given that more no-fraud firms than fraud firms have audit committees, the presence of an audit committee may bias board composition for no-fraud firms in a direction consistent with HI. Therefore, to examine whether the interaction of audit committee presence with board composition affects the likelihood of financial statement fraud, the interactive variable of AUDCOMM*%OUTSIDE is also added to the logit model in table 2.
Results from this additional logit regression analysis are presented in table 4. Consistent with HI, the coefficient on %OUTSIDE continues to be negative and significant (p<.01). However, the results in table 4 are not consistent with H3, given that the presence of an audit committee has no significant effect on the likelihood of financial statement fraud, as evidenced by the insignificant coefficient on AUDCOMM (p= .92). Furthermore, the interaction of audit commit- tee presence with board composition does not affect the likelihood of financial statement fraud, as indicated by the insignificant coefficient on the interactive variable AUDCOMM*%OUTSIDE (p=.9 1). Thus, the results in table 4 suggest that board composition, rather than the presence of an audit committee, is significantly more likely to reduce the likelihood of financial statement fraud, and tests of HI are not affected significantly by the presence of an audit committee. This finding is consistent with the report by Sommer (1991) noting that there is considerable anecdotal evidence that many, if not most, audit committees fall short of doing what are generally perceived as their duties.
To explore why audit committees do not significantly reduce the likelihood of financial statement fraud, additional analysis is performed. As noted previously, board governance reform proponents argue that audit committees are more effective in carrying out their duties if they are largely (if not entirely) composed of outside directors. To examine whether audit committee composition differs significantly between fraud and no-fraud firms, a sub-sample of fraud and no-fraud firms that have audit committees is examined. Only those pairs of fraud and matched no- fraud firms where both the fraud and no-fraud firms have an audit committee in place are included in the sub-sample. As a result, the sub-sample is relatively small-26 fraud and 26 no-fraud firms. On a univariate basis, the no-fraud firms have significantly (p=.03) higher average percentages of outside directors on the audit committee (94 percent) compared to fraud firms (84 percent). However, results (not separately reported) based on a multivariate logit regression analysis indicate that audit committee composition does not have a significant effect on the likelihood of fraud (p=.24) after controlling for factors known to affect the likelihood of financial statement fraud and board composition.'5 The logit model examined for the sub-sample firms (n = 52) is similar to the model shown in table 2 except that audit committee composition (%OUTAC) rather than board composition (%OUTSIDE) is examined. While audit committees for fraud and no- fraud firms are heavily composed of outside directors, consistent with many board reform
15Results are likely affected by the relatively small sample size of 26 fraud and 26 no-fraud firms.
This content downloaded from 142.3.100.23 on Sun, 8 Sep 2013 15:13:22 PMAll use subject to JSTOR Terms and Conditions
Beasley-Board of Director Composition and Financial Statement Fraud 459
TABLE 4 Outside Director and Audit Committees Logit Regression Results
75 Fraud Firms Matched with 75 No-Fraud Firmsa
Independent Predicted Estimated Standard Coefficients Variable Relation Coefficients Errors T-Statistics
P0 INTERCEPT none 2.619 1.196 2.19**
Board Composition: % of Outside Directors
,8 I %OUTSIDE -4.335 1.602 -2.71***
Effects of Audit Committees
132 AUDCOMM .149 1.457 .10 /33 AUDCOMM*%OUTSIDE -.255 2.342 -.11
Control Variables
134 GROWTH none .112 .146 .77
/35 TROUBLE none .423 .474 .89
/36 AGEPUB none -.046 .036 -1.28 137 MGTOWNBD none -.990 1.241 -.80
138 CEOTENURE none -.015 .028 -.54 1p9 BOSS none .580 .477 1.22
010 BLOCKHLD none -.910 1.606 -.57
Pseudo R2 .15
Chi-Square Test of Model's Fit 27.915 (p=.0019) (10 degrees of freedom)
* *,*** Statistically significant at less than the .05, .01 level, based on two-sided tests. a The results in this table are based on the logit regression model in table 2 except that the following
two variables were added:
AUDCOMM = is dummy variable with a value of one if the firm had an audit committee in the year prior to the year of the financial statement fraud and a value of zero otherwise.
AUDCOMM*%OUTSIDE = is the interactive term of the variable AUDCOMM times %OUTSIDE.
recommendations, the presence of the audit committee does not significantly reduce the likelihood of financial statement fraud.
The finding that audit committees do not significantly reduce the likelihood of financial statement fraud can also be attributed to the lack of differences between fraud and no-fraud firms in the number of meetings held by the audit committee. On a univariate basis, both fraud and no- fraud firms met an average of 1.8 times (median of 2 times) during the year preceding the fraud. Furthermore, 35 percent of the fraud and I 1 percent of the no-fraud firms never held a meeting during the year.'6 This frequency is in sharp contrast to the recommendation noted in the 1993 report prepared by Price Waterhouse (1993) for the Institute of Internal Auditor's Research Foundation titled, Improving Audit Committee Performance: What Works Best, that audit committees meet at least four times per year and make provisions for special meetings when warranted.
16Results in table 4 are unchanged if the variable representing the existence of an audit committee is replaced with a variable representing the presence of an audit committee meeting at least once during the year.
This content downloaded from 142.3.100.23 on Sun, 8 Sep 2013 15:13:22 PMAll use subject to JSTOR Terms and Conditions

460 The Accounting Review, October 1996
Supplemental Analysis of Other Board Characteristics
The empirical results reported in tables 2, 3, and 4 are all consistent with the hypothesis that the presence of non-employee directors on the board increases board monitoring activities that help reduce the likelihood of financial statement fraud. As previously noted, fraud firms have boards composed of 50.2% outside directors on average whereas no-fraud firms have boards composed of 64.7% outside directors. Given that the mean (median) board size of fraud firms is 6.2 (6.0) compared to 6.7 (6.0) for no-fraud firms, the difference in monitoring effectiveness between fraud and no-fraud firm boards is largely accounted for by having one additional (on average) outside director on no-fraud firm boards. Perhaps, in addition to a greater number of outside directors on no-fraud firm boards, certain characteristics of individuals who serve as outside directors on no-fraud firm boards also help reduce the likelihood of financial statement fraud. Other than the greater presence of outside directors on the board of no-fraud firms relative to fraud firms, little is known about characteristics of those outside directors who serve. Prior experiences as director and incentives for monitoring management likely affect their performance on a particular board. A supplemental logit analysis is performed to obtain additional knowledge about how certain characteristics of outside directors affect the likelihood of financial statement fraud. This supplemental analysis is based on a logit model similar to the one in table 2 except that it also includes three characteristics of outside directors:
OUTOWNBD: representing the cumulative percentage of common stock shares of the firm held by outside directors.
OUTTENURE: representing the average tenure of outside directors on the board.
DIRECTSHIP: representing the average number of directorships in other firms held by outside directors.
Jensen ( 1993) argues that encouraging outside directors to hold substantial equity interest in the firm would provide better incentives for monitoring top management. Mace (1986) and Patton and Baker ( 1987) believe that a director with a sizeable stake in the firm is more likely to question and challenge management's proposals. Shivdasani (1993) finds that outside directors in hostile takeover target firms (i.e., firms subject to disciplinary takeover) have significantly lower ownership stakes in the firm, which is consistent with the view that equity ownership in the firm provides outside directors with greater incentives to monitor. The variable OUTOWNBD is included in the supplemental logit model to determine whether the extent of outside director ownership in the firm affects the likelihood of financial statement fraud.
The outside director's lack of seniority on the board likely affects his/her ability to scrutinize top management. On the one hand, more senior members on the board of director are less susceptible to group pressures to conform. Consistent with this view, Kosnik (1990) finds that outside directors are significantly more likely to resist greenmail payments as their average board tenure increases. On the other hand, outside directors with longer tenures on the board are more likely to be entrenched with top management and new directors are more likely to be independent and vigilant. The variable OUTTENURE is included to determine whether board tenure of outside directors significantly affects the likelihood of financial statement fraud.
Fama (1980) notes that incentives for outside directors to monitor management are provided by the market for outside directors. Outside directors have incentives to be good monitors because being directors of well-run companies signals value to the external market which rewards them with additional directorships. Under this line of reasoning, the number of additional outside directorships held by each outside director serves as a measure of the director's reputation as a
This content downloaded from 142.3.100.23 on Sun, 8 Sep 2013 15:13:22 PMAll use subject to JSTOR Terms and Conditions

Beasley-Board of Director Composition and Financial Statement Fraud 461
monitor. Consistent with this view, Shivdasani (1993) finds that outside directors of hostile takeover firms have significantly fewer additional directorships in other firms thereby suggesting that outside directors of hostile targets are less reputed monitors. In contrast, as Morck et al. ( 1988) note, monitoring of top officers requires time and effort. As the number of additional directorships on other firm boards increases, demands on the individual board member's time decrease the amount of time available for the director to fulfill monitoring responsibilities at a single firm. The variable DIRECTSHIP is included in the supplemental logit model to determine whether the number of additional directorships held by outside directors significantly affects the likelihood of financial statement fraud.
In addition to examining these three characteristics of outside directors, the supplemental logit analysis also examines whether board size significantly affects the likelihood of financial statement fraud. Jensen (1993) believes that a smaller board of director plays a controlling function whereas a larger board of director is easier for the CEO to control. In contrast, Chaganti et al. (1985) believe large boards are valuable for the breadth of their services. They find that firms filing for Chapter 11 bankruptcy protection have smaller boards than non-failed firms, suggesting that a larger board is more effective in preventing corporate failure. Some may expect board size and firm size to be highly correlated thereby suggesting little likelihood that board size differs across fraud and no-fraud firms because fraud and no-fraud firms were matched based on firm size. However, given the Pearson correlation coefficient of only .49 between board size and total assets, the variable BOARDSZ is included in the supplemental analysis to determine whether board size significantly affects the likelihood of financial statement fraud.
Table 5 presents the results from the supplemental logit regression model. Not only do the results continue to support H I with the significant (p< .01) negative coefficient for %OUTSIDE, but the results indicate that certain characteristics of outside directors significantly affect the likelihood of financial statement fraud.
The negative and significant (p=.08) coefficient for OUTOWNBD suggests that as the level of ownership of the firm's common stock held by outside directors increases, the likelihood of financial statement fraud decreases. This result is consistent with the view that increases in outside directors' ownership in the firm strengthen incentives for outside directors to monitor manage- ment for the prevention of financial statement fraud. The negative and significant (p=.05) coefficient for OUTT'lENURE suggests that as the number of years of board service for outside directors increases, the likelihood of financial statement fraud decreases. This result is consistent with the view that the years of service increase the outside directors' ability to monitor management effectively for the prevention of financial statement fraud. The positive and significant (p=.008) coefficient for DIRECTSHIP indicates that as outside directors of fraud firms hold more directorship responsibilities in other firms, the likelihood of financial statement fraud increases. This result is consistent with the view that additional directorships held by outside directors of fraud firms distract those outside directors from their monitoring responsibilities, thereby increasing the likelihood of financial statement fraud. 17 Separate piecewise logit analysis (not reported) indicates that when the number of directorships in other firms exceeds 2.0, financial statement fraud is more likely; however, when the number of other directorships is less than 2.0, there is no significant effect on the likelihood of financial statement fraud.
'7One might expect that the number of additional directorships is highly correlated with the outside director's age. However, the Pearson correlation coefficient of DIRECTSHIP and OUTDIRAGE (average age of outside directors) is .32. Also, consideration of differences of OUTDIRAGE on an univariate basis and in a multivariate logit model similar to the one in table 5 shows no significant difference in age while DIRECTSHIP remains significantly different across fraud and no-fraud firms.
This content downloaded from 142.3.100.23 on Sun, 8 Sep 2013 15:13:22 PMAll use subject to JSTOR Terms and Conditions

462 The Accounting Review, October 1996
TABLE 5 Supplemental Analysis of Outside Director Characteristics and Board Size
Logit Regression Results 75 Fraud Firms Matched with 75 No-Fraud Firmsa
Independent Predicted Estimated Standard Coefficients Variable Relation Coefficients Errors T-Statistics
180 INTERCEPT none 2.073 1.240 1.67*
Board Composition: % of Outside Directors
18l %OUTSIDE -5.060 1.458 3.47***
Characteristics of Outside Directors
182 OUTOWNBD none -3.532 2.016 -1.75* f33 OUTENURE none -.135 .070 -1.93* f34 DIRECTSHIP none .668 .250 2.67*** Board Size
As BOARDSZ none .157 .092 1.71*
Control Variables
I86 GROWTH none .004 .134 .03 f57 TROUBLE none .759 .506 1.50 P8 AGEPTUB none -.025 .042 -.60 fB9 MGTOWNBD none -.488 1.372 -.36
,B30 CEOTENURE none .015 .035 .43
P,11 BOSS none .234 .514 .46
P12 BLOCKHLD none -1.700 1.780 -.96 Pseudo R2 .24
Chi-Square Test of Model's Fit 41.998 (p=.0001) (12 degrees of freedom)
* 7*** Statistically significant at less than the .10, .01 level, based on two-sided tests.
a The results in this table are based on the logit regression model in table 2 except that the following four variables were added:
OUTOWNBD = the cummulative percentage of outstanding common stock shares held by outside directors.
OUTTENURE = the mean number of years that outside directors have served on the board of direc- tors.
DIRECTSHIP = the mean number of additional directorships held by outside directors.
BOARDSZ = the number of members on the board of directors.
In addition to certain characteristics of outside directors, the size of the board also significantly affects the likelihood of financial statement fraud. The positive and significant (p=.09) coefficient on BOARDSZ indicates that as board size increases the likelihood of financial statement fraud increases. This result is consistent with Jensen's (1993) view that smaller boards provide more of a controlling function than do larger boards.
This content downloaded from 142.3.100.23 on Sun, 8 Sep 2013 15:13:22 PMAll use subject to JSTOR Terms and Conditions

Beasley-Board of Director Composition and Financial Statement Fraud 463
VI. CONCLUSIONS
The empirical results of this study confirm the prediction that the proportion of outside members on the board of director is lower for firms experiencing financial statement fraud compared to no-fraud firms. Results from logit regression models that control for cross-sectional differences in important firm-specific characteristics suggest that the inclusion of outside members on the board of director increases the board's effectiveness at monitoring management for the prevention of financial statement fraud. The results also indicate that board composition, rather than audit committee presence, is more important for reducing the likelihood of financial statement fraud. Finally, the supplemental analysis shows that not only does board composition significantly affect the likelihood of financial statement fraud, but board size and certain outside director characteristics also affect the likelihood of financial statement fraud.
While the results reported in this study confirm many of the board of director composition reform proposals suggested by groups such as the National Commission on Fraudulent Financial Reporting and the AICPA's Public Oversight Board, additional research is warranted. Little knowledge exists about processes of boards, particularly information describing how differing levels of board composition affect the nature of board activities. Insight about the processes outside directors use to exert control over board activities, including the nature of issues discussed, information presented to the board, and the frequency of formal and informal (e.g., conference calls) meetings, would contribute to existing knowledge. Furthermore, given that the results do not confirm previous recommendations supporting the effectiveness of audit commit- tees for the prevention of financial statement fraud, additional study is needed to provide increased understanding of issues related to the nature and processes unique to audit committees, similar to those board specific issues previously noted. Such knowledge would contribute to increased understanding of how audit committees effectively fulfill their financial reporting oversight responsibilities. Finally, while the supplemental analysis included in this study highlights certain outside director characteristics that help reduce the likelihood of financial statement fraud, additional study of other individual director characteristics, such as differences in personality, management style, and other behavioral characteristics, may be warranted.
REFERENCES American Institute of Certified Public Accountants, National Commission on Fraudulent Financial
Reporting (AICPA). 1987. Report of the National Commission on Fraudulent Financial Reporting. New York, NY: AICPA.
. 1988a. The Auditor's Responsibility to Detect and Report Errors and Irregularities. Statement on Auditing Standards No. 53. New York: AICPA.
. 1988b. Consideration ofthe Internal Control Structure in Financial StatementAudit. Statement on Auditing Standards No. 55. New York: AICPA.
. The Public Oversight Board. 1993. Special Report: Issues Confronting the Accounting Profession. Stamford, CT: AICPA. * 1994. Strengthening The Professionalism of the Independent Auditor. Stamford, CT: AICPA.
Baysinger, B. D., and H. N. Butler. 1985. Corporate governance and the board of directors: Performance effects of changes in board composition. Journal of Law, Economics, and Organization 1 (Fall): 101-124.
Bell, T. B., S. Szykowny, and J. J. Willingham. 1991. Assessing the likelihood of fraudulent financial reporting: A cascaded logit approach. Working paper, KPMG Peat Marwick, Montvale, NJ.
Brickley, J. A., and C. M. James. 1987. The takeover market, corporate board composition, and ownership structure: The case of banking. The Journal of Law and Economics 30 (April): 161-180.
Chaganti, R. S., V. Mahajan, S. Sharma. 1985. Corporate board size, composition, and corporate failures in retailing industry. Journal of Management Studies 22 (July): 400-417.
This content downloaded from 142.3.100.23 on Sun, 8 Sep 2013 15:13:22 PMAll use subject to JSTOR Terms and Conditions

464 The Accounting Review, October 1996
DeAngelo, H., and L. DeAngelo. 1990. Dividend policy and financial distress: An empirical investigation of troubled NYSE firms. The Journal of Finance XLV (December): 1415-1431.
and D. J. Skinner. 1994. Accounting choice in troubled companies. Journal ofAccounting and Economics 17: 113-143.
Fama, E. F. 1980. Agency problem and the theory of the firm. Journal of Political Economy 88: 288-308.
, and M. C. Jensen. 1983. Separation of ownership and control. Journal of Law and Economics 26 (June): 301 - 325.
Feroz, E. H., K. Park, and V. S. Pastena. 1991. The financial and market effects of the SEC's accounting and auditing enforcement releases. Journal of Accounting Research 29 (Supplement): 107-142.
Gilson, S. C. 1990. Bankruptcy, boards, banks, and blockholders: Evidence on changes in corporate ownership and control when firms default. Journal of Financial Economics 27: 355-387.
Grossman, S. J., and 0. D. Hart. 1980. Takeover bids, the free-rider problem, and the theory of the corporation. The Bell Journal of Economics 2 (Spring): 42-64.
Hermalin, B., and M. S. Weisbach. 1988. The determinants of board composition. The Rand Journal of Economics 19 (Winter): 589-606.
, and . 1991. The effects of board composition and direct incentives on firm performance. Financial Management 20 (Winter): 101-112.
Jensen, M. C. 1993. The modem industrial revolution, exit, and the failure of internal control systems. The Journal of Finance XLVIII (July): 831-880.
, and W. H. Meckling. 1976. Theory of the firm: Managerial behavior, agency costs and ownership structure. Journal of Financial Economics 3: 305-360.
Kaplan, S. N., and D. Reishus. 1990. Outside directorships and corporate performance. Journal of Financial Economics 27: 389-410.
Kosnik, R. D. 1987. Greenmail: A study of board performance in corporate governance. Administrative Science Quarterly 32: 163-185.
. 1990. Effects of board demography and directors' incentives on corporate greenmail decisions Academy of Management Journal 33: 129-150.
Lee, C. I., S. Rosenstein, N. Rangan, and W. N. Davidson III. 1992. Board composition and shareholder wealth: The case of management buyouts. Financial Management 21: 58-72.
Loebbecke, J. K., M. M. Eining, and J. J. Willingham. 1989. Auditors' experience with material irregularities: Frequency, nature, and delectability. Auditing: A Journal of Practice & Theory 9 (Fall): 1-28.
Mace, M. L. 1986. Directors: Myth and Reality. Boston, MA: Harvard Business School Press.
Maddala, G. S. 1991. A perspective on the use of limited-dependent and qualitative variables models in
accounting research. The Accounting Review 66 (October): 788-807. Morck, R., A. Shleifer, and R. W. Vishny. 1988. Management ownership and market valuation:-An empirical
analysis. Journal of Financial Economics 20: 293-315. New York Times. 1993. Leslie Fay names 2 new outside directors. (April 30). Palepu, K. 1986. Predicting takeover targets: A methodological and empirical analysis. Journal of
Accounting and Economics 8 (March): 3-35. Palmrose, Z. V. 1987. Litigation and independent auditors: The role of business failures and management
fraud. Auditing: A Journal of Practice & Theory 6 (Spring): 90-103. Patton, A., and J. Baker. 1987. Why do not directors rock the boat? Harvard Business Review 65
(November): 10-12. Pincus, K. V., M. Rusbarsky, and J. Wong. 1989. Voluntary formation of corporate audit committees among
NASDAQ firms. Journal of Accounting and Public Policy 8: 239-265. Price Waterhouse. 1993. Improving Audit Committee Performance: What Works Best. Altamonte Springs,
FL: Institute of Internal Auditors Research Foundation. Rosenstein, S., and J. G. Wyatt. 1990. Outside directors, board independence, and shareholder wealth.
Journal of Financial Economics 26: 175-191. Shivdasani, A. 1993. Board composition, ownership structure, and hostile takeovers. Journal ofAccounting
This content downloaded from 142.3.100.23 on Sun, 8 Sep 2013 15:13:22 PMAll use subject to JSTOR Terms and Conditions

Beasley-Board of Director Composition and Financial Statement Fraud 465
and Economics 16: 167-198. Shleifer, A., and R. W. Vishny. 1986. Large shareholders and corporate control. Journal of Political
Economy 95: 461-488. Sommer, A. A., Jr. 1991. Auditing audit committees: An educational opportunity for auditors. Accounting
Horizons (June): 91-93. Stone, M., and J. Rasp. 1991. Tradeoffs in the choice between Logit and OLS for accounting choice studies.
The Accounting Review 66 (January): 170-187. 1993b. Business bulletin column. (August 19).
Vancil, R. 1987. Passing the Baton: Managing the Process of CEO Succession. Boston, MA: Harvard Business School Press.
Vicknair, D., K. Hickman, and K. C. Carnes. 1993. A note on audit committee independence: Evidence from the NYSE on "grey" area directors. Accounting Horizons 7 (March): 53-57.
Wall Street Journal. 1993a. Two Clayton Homes directors resign in dispute over Tennessee tax probe. (August 18).
Warner, J. B., R. L. Watts, and K. H. Wruck. 1988. Stock prices and top management changes. Journal of Financial Economics 20: 461-492.
Weisbach, M. S. 1988. Outside directors and CEO turnover. Journal of Financial Economics 20: 431-460. Williamson, 0. E. 1984. Corporate governance. The Yale Law Journal 93: 1197-1230.
This content downloaded from 142.3.100.23 on Sun, 8 Sep 2013 15:13:22 PMAll use subject to JSTOR Terms and Conditions