Embed Size (px)
Citation preview
1
An Empirical Evaluation of Samurdhi Program1
Elena Glinskaya, the World Bank
Executive summary
Social assistance programs can play an important role in reducing poverty. However, these programs are costly and impose a financial burden that must be covered by taxation or debt. Moreover, they can affect people’s economic behavior by distorting their incentives. In addition, any social assistance program must compete with other government social spending (such as basic education and health) and other government programs that alleviate poverty. Sri Lanka has a long history of social programs, and of food subsidies in particular. The most recent poverty alleviation program, Samurdhi, was introduced in 1995. The program claims almost 1 percent of the gross domestic product (GDP) or roughly half of all welfare expenditures, excluding expenditures on education and health, and is the largest welfare program presently operating in the country. This program was conceived by the Government of Sri Lanka to alleviate poverty and create opportunities for the youth, women, and the disadvantaged. The bulk of program resources is distributed as transfers of consumption grants to households, with eligibility determined by means testing.2 In 1998, the household eligibility threshold was set at approximately one-third of the national poverty line. In the same year, the Central Bank reported the program covering 50 percent of households in the country while poverty rate was 20 percent already in 1990. This outcome alone suggests that many non-poor households receive Samurdhi grants. A thorough investigation of the design, operations, and outcomes of the program is therefore warranted. The Samurdhi program has three major components. The first is the provision of a consumption grant transfer (food stamp) to eligible households. This component claims 80 percent of the total Samurdhi budget. The second component of Samurdhi is a savings and credit program operated through so-called Samurdhi banks, and loans meant for entrepreneurial and business development. The third component is rehabilitation and development of community infrastructure through workfare and social (or human) development programs. Samurdhi has additional features. First, beneficiaries of highest consumption grants pay premium to finance a social insurance program available to all eligible households. Second, the same beneficiaries contribute 20 percent of the value of their stamps in lieu of “forced savings.” These “savings” are unavailable for withdrawal for five years. Third, program administrators are considered among the beneficiaries of Samurdhi and eight percent of the total budget is allocated for their salaries. Fourth, so-called “cooperative” stores are the sole places where stamps could be exchanged for goods. These stores belong to a de facto government-managed distribution network, administered by the Ministry of Co-operatives and Development.
1 This paper was prepared as a background paper for Sri Lanka Poverty Assessment, Report No 22-535-CE.
2Means testing requires individual assessment of the means (income) of intended beneficiaries. Only an applicant with income falling below a certain threshold is eligible.
2
This paper presents an empirical evaluation of the targeting outcomes of Samurdhi program. It uses data from three sources. The first is the 1999 Sri Lanka Integrated Survey (SLIS). This survey is based on a multistage stratified random sample and was carried out by the Sri Lanka Business Development Centre (SLBDC). The second source is a qualitative examination of key antipoverty programs at the household and community levels. This is based on a series of research instruments using methods of rapid rural appraisal and participatory rural appraisal that elicit the views of community members, particularly those who are economically disadvantaged. The third source is government documents and research reports prepared by various agencies. Households with low relative welfare are more likely to receive Samurdhi assistance; that is, the program’s incidence is progressive. However, Samurdhi misses almost 40 percent of households ranked in the lowest expenditure quintile, while a substantial number of households with higher relative welfare receive Samurdhi consumption grants and other forms of Samurdhi assistance. Around 44 percent of the total Samurdhi transfer budget is spent on households from the third, fourth, and fifth quintiles--those who are well-off in relative terms. These targeting outcomes of Samurdhi are inferior to the outcomes of targeted programs in other countries and are in fact comparable with the outcomes of untargeted systems (such as primary health care or primary education).3 The allocation of benefits across provinces corresponds to poverty rates. The poorer districts and provinces receive more Samurdhi funds in per capita terms. It is the identification of the poor on the ground that is less successful. Moreover, poor provinces are less effective in reaching their poor than richer provinces. Analysis of the probability of receiving Samurdhi grants in a multifactorial framework indicates that factors that generally correspond to the notion of low welfare--large household size, low income, disability, landlessness, no access to electricity or latrines--are associated with a higher probability of Samurdhi receipt. However, after control for income, place of residence, and other factors, there are still substantial and significant differences in the probability of being a Samurdhi recipient by ethnic status. Qualitative results suggest that other characteristics of households such as party affiliation or voting preferences also influence allocation of Samurdhi consumption grants. These patterns indicate that targeting errors are not random, but rather reflect flaws in the design of the program that allow for the deliberate omission of certain groups of vulnerable individuals. Based on the empirical analysis of the distributional outcomes, Samurdhi does not emerge as an efficient transfer program. It is modestly successful in reaching the intended beneficiaries, but it transfers a large portion of its resources to the nonpoor. Moreover, the nonrandomness of its targeting errors indicates that the program would need extensive redesign in order to improve its efficiency.
3Based on a review of targeting outcomes of 47 social programs in Grosh, M. “Administering Targeted Social Programs in Latin America. From Platitudes to Practice”.
3
Table of Contents 1. Introduction............................................................................................................................................... 7
1.1 Background ............................................................................................................................... 7 1.2 Objectives of the study, data sources, and organization of the paper ........................................ 8
2. The Samurdhi program ............................................................................................................................. 9
2.1 Goals and functions.................................................................................................................... 9 2.2 Components ............................................................................................................................. 11
2.2.1 Youth employment (employment of animators or niyamakas)................................ 12 2.2.2 Provision of consumption grants (“food stamps”) .................................................. 13 2.2.3 Provision of social insurance ................................................................................... 14 2.2.4 Forced savings ......................................................................................................... 14 2.2.5 Voluntary savings and Samurdhi banking services ................................................. 14 2.2.6 Credit programs ....................................................................................................... 15 2.2.7 Social development programs.................................................................................. 16 2.2.8 Capital projects ........................................................................................................ 16
3. Effectiveness of Samurdhi program components ................................................................................... 16
3.1 Distributional outcomes of food transfers................................................................................ 19 3.2 Who does and does not receive Samurdhi food stamps? ......................................................... 23
3.3 Impact on household welfare ................................................................................................................ 26 3.4 Distributional outcomes of the nonfood Samurdhi components.............................................. 27
4. Drawbacks of the Samurdhi program ..................................................................................................... 29
4.1 Efficiency issues ...................................................................................................................... 29 4.2 Suitability of the Samurdhi program for poverty evaluation ................................................... 31
5. Conclusions............................................................................................................................................. 32 6. References............................................................................................................................................... 33
1. Introduction 1.1 Background Sri Lanka has achieved impressive results in the area of human development. Life expectancy and child mortality rates are comparable with those of the developed countries. Literacy rates are high among both men and women. These outcomes are a consequence of the good social policies implemented at the early stage.4 Nevertheless, consumption poverty remains high, and after a considerable decline between 1985 and 1990 poverty rates remained at 25 percent in the mid 1990s. The Samurdhi program of social assistance was launched in 1995. By the end of the 1990s it was fully functioning in 21 out of 25 districts5. It is financed by general revenue and claims about half of the total welfare budget (excluding education and health), or almost 1 percent of gross domestic product (US$139 million in 1999). Table 1.1 lists Sri Lanka's social programs in 1999 and their budgets, and Samurdhi emerges as the largest social assistance program.
Table 1.1 Social Transfers and Social Expenditure, 1999 Social transfers million
Sri Lanka rupees percent of the
sub-total percent
of the total Samurdhi (transfer component only) 8,145 58.20 12.05 Fertilizer subsidy 1,451 10.37 2.15 Refugees 2,661 19.01 3.94 Other 1,739 12.42 2.57 Sub-total 13,996 100.00 20.70 Other social expenditures Pensions 20,723 30.65 Education 22,231 32.89 Health 10,651 15.76 Total 67,601 100
Source: Central Bank of Sri Lanka and IMF This program was conceived by the government of Sri Lanka to alleviate poverty. The bulk of program resources are distributed as transfers of consumption grants to households, with eligibility determined by means testing. In 1998, the household eligibility threshold was set at approximately one-third of the national poverty line. In the same year, the Central Bank reported the program covering 50 percent of
4The first food aid program--a rice ration--was introduced in 1939 under British rule. After gaining independence, the government of Sri Lanka maintained food distribution and in the 1950s even had a program of distributing 2 kilos of rice per person per month free of charge. Between 1966 and 1979 expenditures on various food subsidy programs amounted to 2–6 percent of GNP, or 8–17 percent of total government expenditures. In 1978 government policy shifted to providing food stamps, and these outlays accounted for 1–3 percent of GNP between 1979 and 1984. Between 1989 and 1995 Janasaviya was the country's main program of social assistance.
5The program is still not in full operation in Jaffna,Mannar,and Killinochi districts.
5
households in the country, while poverty rate was 20 percent already in 1990. This outcome alone suggests that many nonpoor households receive Samurdhi grants. This poverty alleviation program appears to transfer considerable resources for the private consumption of the nonpoor. Therefore, it is important to understand the program's design, operations, and outcomes and to assess its impact on the welfare of different strata of the population. Ultimately, it is necessary to understand whether the program is an effective vehicle to achieve its goals. 1.2 Objectives of the study, data sources, and organization of the paper This paper presents a description of the structure of Samurdhi and examines its design and targeting outcomes. In light of these results, the paper intends to stimulate a discussion of whether this program is an effective vehicle for reducing vulnerability and poverty alleviation. The paper uses data from three sources. The first source is the Sri Lanka Integrated Survey (SLIS). This survey is based on a multistage stratified random sample and was carried out by the Sri Lanka Business Development Centre (SLBDC). SLIS is the first household survey since 1982 that collected information on the war-affected areas of the North-East. This paper is based on a half of the sample collected between October 1999 and January 2000 across all provinces. During this period 2,600 households were surveyed. The survey instrument consists of household, community, and price questionnaires, administered to households and community informants. Social benefit modules collected information about receipts of Samurdhi food stamps, other Samurdhi assistance items such as social insurance, loan and credit payments, and receipts of various agricultural and business equipment and assets. These modules also cover information on respondents’ participation in savings and credit groups, as well as their receipts of other social transfers.6 The second source is a qualitative examination of key antipoverty programs at the household and community levels. A series of research instruments based on rapid rural appraisal and participatory rural appraisal have been developed as means of eliciting the views of community members, particularly those who are economically disadvantaged. This paper draws mostly on information collected in the exercises on People’s Perceptions of Poverty Alleviation Programs. Household heads from poor homes were asked to describe the government-, donor-, and NGO-supported poverty alleviation programs operating in their locality; to assess the performance of these programs and their usefulness in the struggle to exit poverty. The third source is government documents and various research reports. The paper is organized as follows. Section 2 describes the components of the Samurdhi program. Section 3.1 presents targeting outcomes of Samurdhi and the other public transfer programs and private arrangements. It also assesses the targeting efficiency of Samurdhi allocations both within and between provinces. Section 3.2 investigates the relationship between characteristics of households (income, education of the household head, demographic structure, living conditions) and the probability of transfer grant receipt. The impact of Samurdhi transfers on the distribution of income and expenditure are
6 That is, government and private pensions, disability payments, and widows' and orphans' benefits. Information on other assistance programs such as Integrated Rural Development Program (IRDP), Employers Provided Fund, and Employers Trust Fund (EPF/ETF) is also collected in the social benefit module.
6
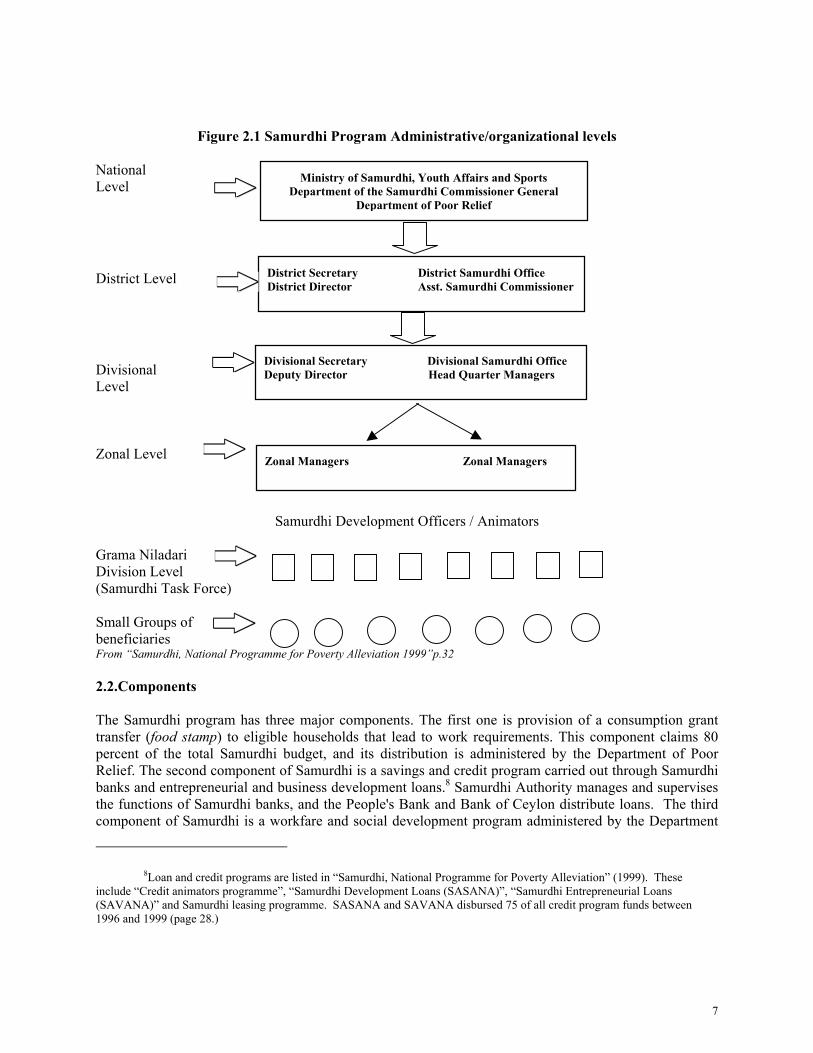
presented in Section 3.3, and the distribution of Samurdhi social insurance and credit services is analyzed in Section 3.4. Section 4 discusses the design and outcomes of Samurdhi, focusing on its shortcomings. The more general issue of whether such a transfer program is an effective approach for tackling poverty in the country is also raised in Section 4. Section 5 concludes. 2. The Samurdhi program 2.1 Goals and functions Samurdhi was launched by an act of Parliament of the Democratic Socialist Republic of Sri Lanka in 1995. This law stipulated that the main functions of the Samurdhi National Programme are to improve “the economic and social conditions of youth, women and disadvantaged groups of the society by – (a) broadening their opportunities for income enhancement and employment; (b) integrating them into economic and social development activities; (c) linking family level economic activities with community development projects at village, district, divisional and provincial levels; (d) mobilizing their participation in the planning and management of projects and schemes for their upliftment; (e) fostering co-operation among them, promoting savings amongst them and assisting them to obtain credit facilities; (f) facilitating the delivery of inputs and services of Government departments, public corporations, local authorities, private sector organizations and non-governmental organizations to beneficiaries of the programme, and to implement the programme so formulated and other programmes of the Government for poverty alleviation.”7 The administration of the program was given to the Ministry of Samurdhi, Youth, and Sports. Three departments within the ministry coordinate various Samurdhi functions: the Department of Poor Relief, the Department of the Commissioner General of Samurdhi, and Samurdhi Authority. There are district, divisional, and zonal-level Samurdhi authorities. (The structure of Samurdhi administration is depicted in Figure 2.1.)
7From “Parliament of the Democratic Socialist Republic of Sri Lanka. Samurdhi Authority of Sri Lanka Act, No 30 of 1995.” Certified on 11th December , 1995.
7
Figure 2.1 Samurdhi Program Administrative/organizational levels National Level
District Level Divisional Level Zonal Level
Samurdhi Development Officers / Animators Grama Niladari Division Level (Samurdhi Task Force) Small Groups of beneficiaries From “Samurdhi, National Programme for Poverty Alleviation 1999”p.32 2.2.Components The Samurdhi program has three major components. The first one is provision of a consumption grant transfer (food stamp) to eligible households that lead to work requirements. This component claims 80 percent of the total Samurdhi budget, and its distribution is administered by the Department of Poor Relief. The second component of Samurdhi is a savings and credit program carried out through Samurdhi banks and entrepreneurial and business development loans.8 Samurdhi Authority manages and supervises the functions of Samurdhi banks, and the People's Bank and Bank of Ceylon distribute loans. The third component of Samurdhi is a workfare and social development program administered by the Department
8Loan and credit programs are listed in “Samurdhi, National Programme for Poverty Alleviation” (1999). These include “Credit animators programme”, “Samurdhi Development Loans (SASANA)”, “Samurdhi Entrepreneurial Loans (SAVANA)” and Samurdhi leasing programme. SASANA and SAVANA disbursed 75 of all credit program funds between 1996 and 1999 (page 28.)
Ministry of Samurdhi, Youth Affairs and Sports Department of the Samurdhi Commissioner General
Department of Poor Relief
District Secretary District Samurdhi Office District Director Asst. Samurdhi Commissioner
Divisional Secretary Divisional Samurdhi Office Deputy Director Head Quarter Managers
Zonal Managers Zonal Managers
8
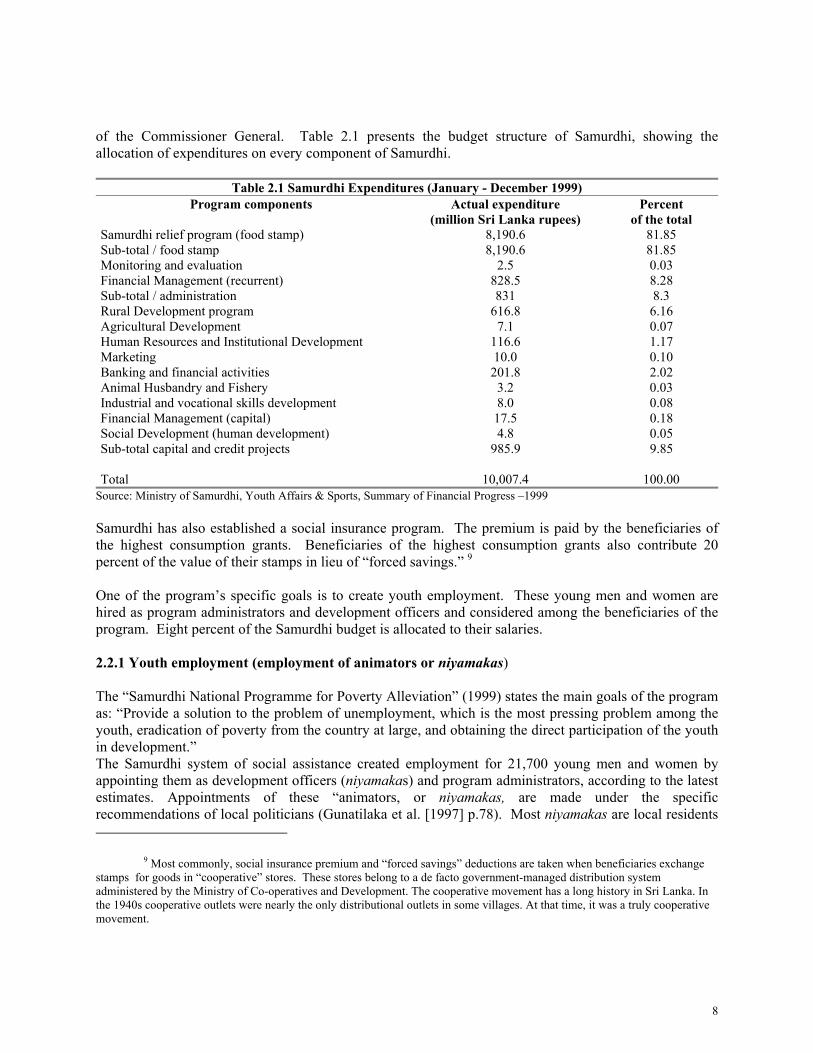
of the Commissioner General. Table 2.1 presents the budget structure of Samurdhi, showing the allocation of expenditures on every component of Samurdhi.
Table 2.1 Samurdhi Expenditures (January - December 1999) Program components Actual expenditure
(million Sri Lanka rupees) Percent
of the total Samurdhi relief program (food stamp) 8,190.6 81.85 Sub-total / food stamp 8,190.6 81.85 Monitoring and evaluation 2.5 0.03 Financial Management (recurrent) 828.5 8.28 Sub-total / administration 831 8.3 Rural Development program 616.8 6.16 Agricultural Development 7.1 0.07 Human Resources and Institutional Development 116.6 1.17 Marketing 10.0 0.10 Banking and financial activities 201.8 2.02 Animal Husbandry and Fishery 3.2 0.03 Industrial and vocational skills development 8.0 0.08 Financial Management (capital) 17.5 0.18 Social Development (human development) 4.8 0.05 Sub-total capital and credit projects 985.9 9.85 Total 10,007.4 100.00
Source: Ministry of Samurdhi, Youth Affairs & Sports, Summary of Financial Progress –1999 Samurdhi has also established a social insurance program. The premium is paid by the beneficiaries of the highest consumption grants. Beneficiaries of the highest consumption grants also contribute 20 percent of the value of their stamps in lieu of “forced savings.” 9 One of the program’s specific goals is to create youth employment. These young men and women are hired as program administrators and development officers and considered among the beneficiaries of the program. Eight percent of the Samurdhi budget is allocated to their salaries. 2.2.1 Youth employment (employment of animators or niyamakas) The “Samurdhi National Programme for Poverty Alleviation” (1999) states the main goals of the program as: “Provide a solution to the problem of unemployment, which is the most pressing problem among the youth, eradication of poverty from the country at large, and obtaining the direct participation of the youth in development.” The Samurdhi system of social assistance created employment for 21,700 young men and women by appointing them as development officers (niyamakas) and program administrators, according to the latest estimates. Appointments of these “animators, or niyamakas, are made under the specific recommendations of local politicians (Gunatilaka et al. [1997] p.78). Most niyamakas are local residents
9 Most commonly, social insurance premium and “forced savings” deductions are taken when beneficiaries exchange stamps for goods in “cooperative” stores. These stores belong to a de facto government-managed distribution system administered by the Ministry of Co-operatives and Development. The cooperative movement has a long history in Sri Lanka. In the 1940s cooperative outlets were nearly the only distributional outlets in some villages. At that time, it was a truly cooperative movement.
9
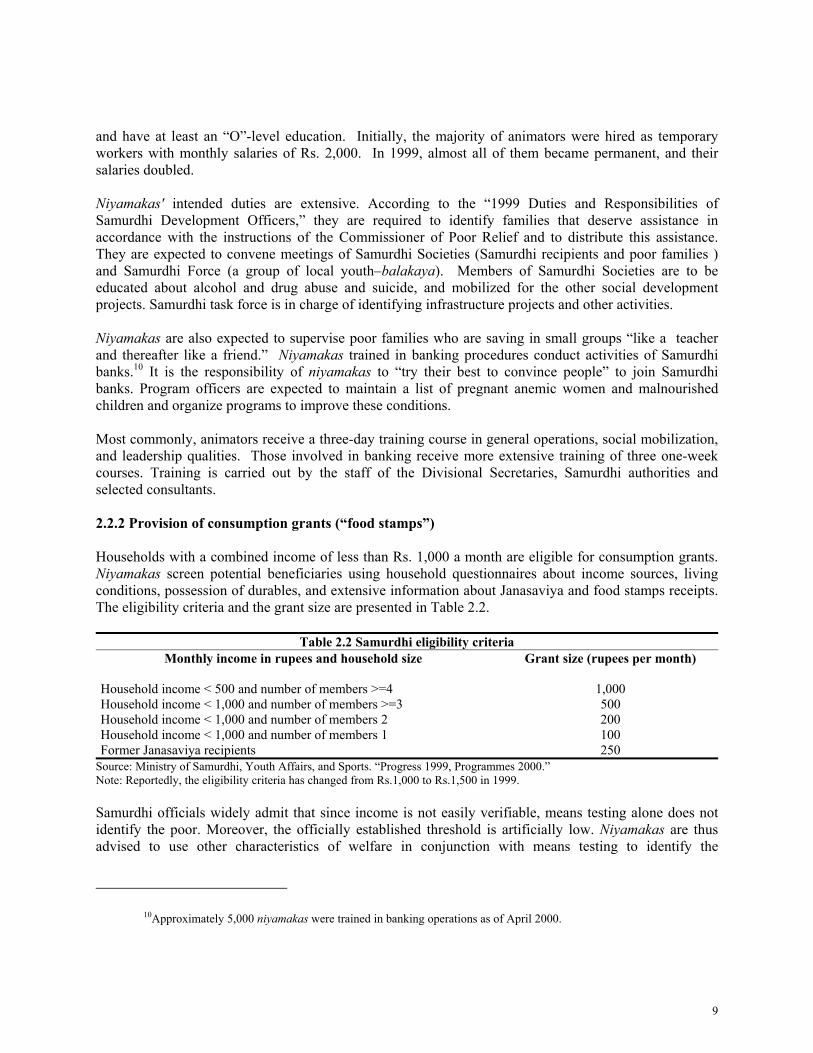
and have at least an “O”-level education. Initially, the majority of animators were hired as temporary workers with monthly salaries of Rs. 2,000. In 1999, almost all of them became permanent, and their salaries doubled. Niyamakas' intended duties are extensive. According to the “1999 Duties and Responsibilities of Samurdhi Development Officers,” they are required to identify families that deserve assistance in accordance with the instructions of the Commissioner of Poor Relief and to distribute this assistance. They are expected to convene meetings of Samurdhi Societies (Samurdhi recipients and poor families ) and Samurdhi Force (a group of local youth–balakaya). Members of Samurdhi Societies are to be educated about alcohol and drug abuse and suicide, and mobilized for the other social development projects. Samurdhi task force is in charge of identifying infrastructure projects and other activities. Niyamakas are also expected to supervise poor families who are saving in small groups “like a teacher and thereafter like a friend.” Niyamakas trained in banking procedures conduct activities of Samurdhi banks.10 It is the responsibility of niyamakas to “try their best to convince people” to join Samurdhi banks. Program officers are expected to maintain a list of pregnant anemic women and malnourished children and organize programs to improve these conditions. Most commonly, animators receive a three-day training course in general operations, social mobilization, and leadership qualities. Those involved in banking receive more extensive training of three one-week courses. Training is carried out by the staff of the Divisional Secretaries, Samurdhi authorities and selected consultants. 2.2.2 Provision of consumption grants (“food stamps”) Households with a combined income of less than Rs. 1,000 a month are eligible for consumption grants. Niyamakas screen potential beneficiaries using household questionnaires about income sources, living conditions, possession of durables, and extensive information about Janasaviya and food stamps receipts. The eligibility criteria and the grant size are presented in Table 2.2.
Table 2.2 Samurdhi eligibility criteria Monthly income in rupees and household size Grant size (rupees per month)
Household income < 500 and number of members >=4 1,000 Household income < 1,000 and number of members >=3 500 Household income < 1,000 and number of members 2 200 Household income < 1,000 and number of members 1 100 Former Janasaviya recipients 250
Source: Ministry of Samurdhi, Youth Affairs, and Sports. “Progress 1999, Programmes 2000.” Note: Reportedly, the eligibility criteria has changed from Rs.1,000 to Rs.1,500 in 1999. Samurdhi officials widely admit that since income is not easily verifiable, means testing alone does not identify the poor. Moreover, the officially established threshold is artificially low. Niyamakas are thus advised to use other characteristics of welfare in conjunction with means testing to identify the
10Approximately 5,000 niyamakas were trained in banking operations as of April 2000.
10
beneficiaries.11 After one-time identification, a list of potential beneficiaries was compiled and displayed in public places. The grievances were considered by balakaya. Households identified as beneficiaries receive a set of stamps every six months, and the stamps are validated for use at cooperative stores at the beginning of each month. The stamp allotment for each month is represented in stamps of several denominations. For example, households receiving a Rs. 500 grant receive one stamp of Rs. 125, one stamp of Rs. 175, and one of Rs. 200. In principle the Rs. 175 stamp can be cashed in Samurdhi banks, but in practice banks are reluctant to do so. The Rs. 200 and Rs. 175 stamps can be exchanged for goods in cooperative stores, and Rs. 125 must be surrendered at the store to be divided among the forced savings program and social insurance program, as described below. Contributing “voluntary” labor is a mandatory requirement for Samurdhi beneficiaries. The amount of labor required depends on the size of the grant. A household receiving Rs. 500, for example, is expected to contribute 4–5 man-days of labor to community development projects. When a household's income exceeds Rs. 2,000 and remains as such for more than six months or when a household member finds employment, the household must exit from the program.12 If a household changes its place of residence, the household loses its entitlement to Samurdhi. The household must be tested and enrolled at a new location, and there is reluctance to enroll new beneficiaries. Eligible extended families residing in one dwelling usually receive only one grant. 2.2.3 Provision of social insurance Recipients of Rs. 1,000, Rs. 500, and Rs. 250 grants have Rs. 25 withdrawn for the Samurdhi social security fund. These funds are used to pay social security claims to Samurdhi beneficiaries in case of birth, marriage, illness, and death. Birth allowances are Rs. 2,000 for the first and second child, the marriage allowance is Rs. 3,000, and the death allowance is Rs. 5,000. Administratively, the collected funds are withheld as follows: half of the collected funds are left with the division and the other half are transferred to the Department of the Commissioner General. If the amount kept in the division is not enough to cover the claims, additional funds are requested and transferred back. 2.2.4 Forced savings Recipients of Rs.1,000 and Rs. 500 grants have Rs. 200-worth and Rs. 100-worth respectively of stamps withdrawn in lieu of forced savings. The cooperative store is responsible for sending these stamps, along with the names of the beneficiaries, to the office of the divisional secretary.13 The secretary, in turn,
11Difficulties of income verification and usefulness of other welfare indicator in determining eligibility are discussed in Ratnayake (1999) “Proposed Entry and Exit Criterion to the Food Stamp Scheme.” Ministry of Samurdhi, Youth Affairs and Sports. It is not clear whether the use of other welfare indicators is enforced.
12Exit criteria are described in Tennakoon, M U A (1998) “Samurdhi Programme in Poverty Alleviation” p9. Family members of military personnel are exempted from this rule.
13In some villages or urban dwellings the exchange of stamps for goods in cooperative stores is not enforced. Beneficiaries can deposit their stamps in the Samurdhi banks and withdraw these amounts after some time, usually after one month. In these cases Samurdhi banks collect insurance and forced savings deductions.
11
compiles a list of names, and respective amounts are “deposited” in the savings accounts in the People's Bank or Bank of Ceylon in the Samurdhi investment account. At present, these “savings” cannot be withdrawn nor used as collateral, nor accessed in any other way.14 2.2.5 Voluntary savings and Samurdhi banking services Small group savings is “encouraged” among Samurdhi recipients. Gunatilaka et al. (1997) report members as being “herded into groups” by niyamakas. Savings could be used for rotating credit or depositing in Samurdhi banks. Account holders have passbooks where all transactions are listed. Samurdhi banks are established as cooperatives, and to become a member a Samurdhi beneficiary must purchase a Rs. 500 share. Nonmembers can establish accounts, but only members are eligible for Samurdhi banks loans. There are different types of accounts, with the deposits being available for withdrawal at different times and earning different interests. (For example, children's deposits are available for withdrawal only when a child reaches eighteen years of age. Mothers' deposits and group savings deposits can be withdrawn at any time.) Most of the deposit base comes from the small group savings. Samurdhi banks issue loans to members mostly for agricultural and self-employment activities. Repayment begins from the date the loan is issued. Income-generating loans are available at 3 percent per month (as of April 2000), consumption loans are offered at a lower rate. Normally, half of the funds and assets of a Samurdhi bank are invested in treasury bills and security bills earning 11–12 percent interest per year. The other half is made available as loans. Samurdhi niyamakas act as bank staff. Premises are built by beneficiaries, and equipment is provided by the Samurdhi Authority. The board of directors usually consists of members of balakayas. A typical bank would have about fifteen members from each balakaya on its board. Samurdhi banks are not supervised or audited by the Central Bank and do not fall under the Finance Act. Supervision and auditing is carried out by the Samurdhi Authority. There are no uniform rules governing the financial instruments of these banks. Loan insurance, for example, ranges from 1 to 4 percent of the amount of a loan among individual banks. Banks may make other deductions when disbursing these loans (for example, for the group insurance fund, for the common fund for write-offs of unrecovered loans, etc.). Deposits are not insured by the Government of Sri Lanka.
14verbal communications, Ministry of Samurdhi, Youth Affairs, and Sports.
12
2.2.6 Credit programs Credit program funds are made available for Samurdhi beneficiaries though the People's Bank and the Bank of Ceylon. Several credit programs are available to Samurdhi participants: two major ones–Samurdhi Development Credit Scheme (SASANA) and Samurdhi Enterprise Credit Scheme (SAVANA)--and other smaller ones: leasing, Samurdhi animators credit program, and RANA (an experimental loan scheme). SASANA offers development loans at an annual interest rate of 10 percent (1999), and the standard loan size is Rs. 2,500–10,000. SAVANA offers entrepreneurship loans for starting new enterprises and maintaining existing ones at the same interest rate. Loan sizes range from Rs. 10,000 to 50,000. The Samurdhi Authority manages the flow of funds, and Samurdhi niyamakas oversee loan repayment. Actual disbursement of these funds is done through the local offices of the People's Bank and the Bank of Ceylon. 2.2.7 Social development programs The Department of the Commissioner General administers a number of mostly human development programs. The programs include “illiteracy elimination”; Samurdhi scholarships; programs for the aged, disabled, destitute, and alcoholics; and narcotics prevention programs. Some funds are also available for secondary and religious education and health needs. Training camps for Samurdhi officers are also financed from this program. 2.2.8 Capital projects Small scale projects aim to rehabilitate and develop local infrastructure. These projects are typically small-scale efforts (gravel a road, reroof a school, build a ditch) for which 80 percent of funds are issued by the Samurdhi Authority. The remaining 20 percent must come in the form of labor contributions by beneficiaries.15 These projects are identified and mobilized by the niyamakas, and labor is contributed by Samurdhi recipients. Actual supervision of the projects is carried out by the divisional secretary office. Large-scale projects are fully financed through the Samurdhi Commissioner department. These projects are done partially to provide off-season employment in the villages. They might be executed by a third party, but Samurdhi beneficiaries are expected to be hired for these works. Concentrated in the dry zones and rural areas, these projects involve such tasks as repairing irrigation canals, dams, public wells, small-scale water supplies, roadways, and bridges.
15When there are no projects, the labor requirement is not enforced.
13
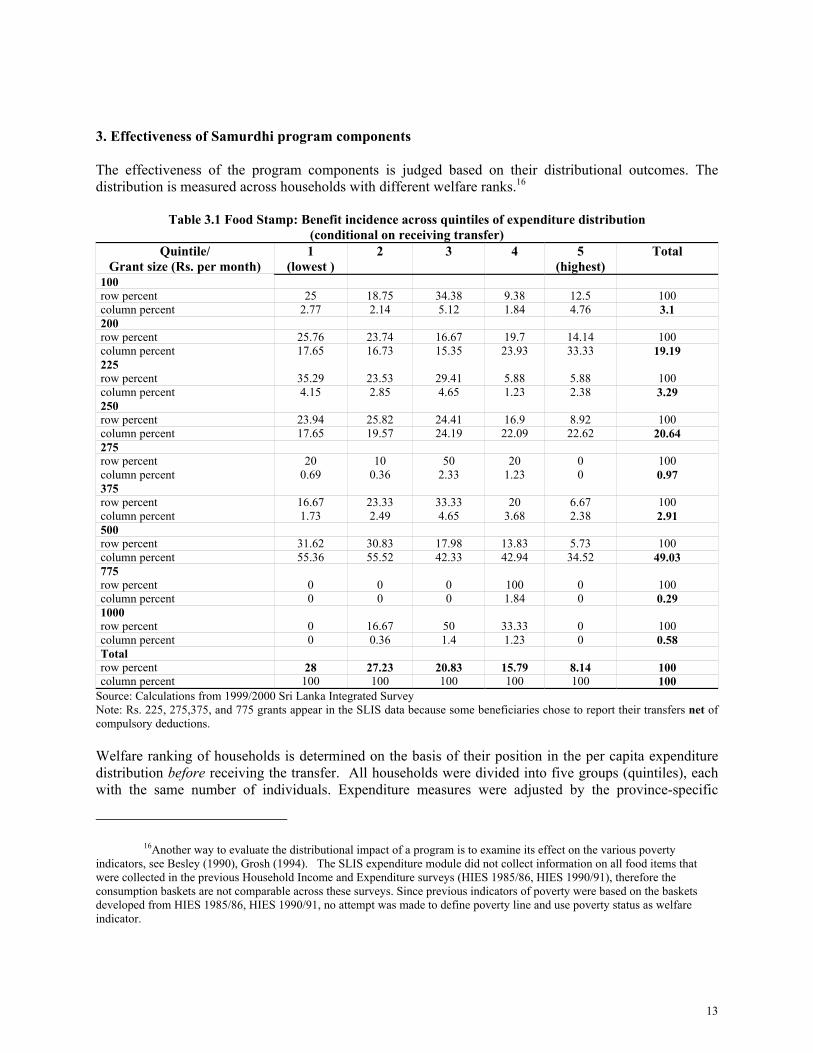
3. Effectiveness of Samurdhi program components The effectiveness of the program components is judged based on their distributional outcomes. The distribution is measured across households with different welfare ranks.16
Table 3.1 Food Stamp: Benefit incidence across quintiles of expenditure distribution (conditional on receiving transfer)
Quintile/ Grant size (Rs. per month)
1 (lowest )
2 3 4 5 (highest)
Total
100 row percent 25 18.75 34.38 9.38 12.5 100 column percent 2.77 2.14 5.12 1.84 4.76 3.1 200 row percent 25.76 23.74 16.67 19.7 14.14 100 column percent 17.65 16.73 15.35 23.93 33.33 19.19 225 row percent 35.29 23.53 29.41 5.88 5.88 100 column percent 4.15 2.85 4.65 1.23 2.38 3.29 250 row percent 23.94 25.82 24.41 16.9 8.92 100 column percent 17.65 19.57 24.19 22.09 22.62 20.64 275 row percent 20 10 50 20 0 100 column percent 0.69 0.36 2.33 1.23 0 0.97 375 row percent 16.67 23.33 33.33 20 6.67 100 column percent 1.73 2.49 4.65 3.68 2.38 2.91 500 row percent 31.62 30.83 17.98 13.83 5.73 100 column percent 55.36 55.52 42.33 42.94 34.52 49.03 775 row percent 0 0 0 100 0 100 column percent 0 0 0 1.84 0 0.29 1000 row percent 0 16.67 50 33.33 0 100 column percent 0 0.36 1.4 1.23 0 0.58 Total row percent 28 27.23 20.83 15.79 8.14 100 column percent 100 100 100 100 100 100
Source: Calculations from 1999/2000 Sri Lanka Integrated Survey Note: Rs. 225, 275,375, and 775 grants appear in the SLIS data because some beneficiaries chose to report their transfers net of compulsory deductions. Welfare ranking of households is determined on the basis of their position in the per capita expenditure distribution before receiving the transfer. All households were divided into five groups (quintiles), each with the same number of individuals. Expenditure measures were adjusted by the province-specific
16Another way to evaluate the distributional impact of a program is to examine its effect on the various poverty indicators, see Besley (1990), Grosh (1994). The SLIS expenditure module did not collect information on all food items that were collected in the previous Household Income and Expenditure surveys (HIES 1985/86, HIES 1990/91), therefore the consumption baskets are not comparable across these surveys. Since previous indicators of poverty were based on the baskets developed from HIES 1985/86, HIES 1990/91, no attempt was made to define poverty line and use poverty status as welfare indicator.
14
indices representing differences in the cost of living of the low-income populations. Calculation of these indices is not presented here but is available upon request. Households from the lowest quintile (or lowest two quintiles, when specified) are referred to as “poor.” Table 3.1 presents the distribution of the food transfer payment in the SLIS sample, among the Samurdhi recipients, by the size of the welfare grant. The Rs. 500 grant appears to be the most often paid to households, with almost 50 percent of Samurdhi beneficiaries reporting receipt of this grant. More than 60 percent of all Rs.500 grants are accrued to the two lowest quintiles. 3.1 Distributional outcomes of food transfers
Forty percent of all households in the sample reported receiving Samurdhi food assistance. The incidence of Samurdhi is more progressive than any of Sri Lanka's other functioning systems of public transfer, with the exception of the small program of donor assistance. It is also more progressive than the existing net of private transfers. However, Samurdhi misses 36 percent of the households ranked in the lowest expenditure quintile, while it reaches a large number of households with higher relative welfare. Around 40 percent of the total Samurdhi consumption budget is spent on households from the third, fourth, and fifth quintiles--that is, those that are well-off in relative terms. These targeting outcomes of Samurdhi are comparable with the outcomes of untargeted systems, such as primary health care or primary education. An examination of allocation within and between provinces reveals that while allocation across provinces is done well in accordance with the poverty rates, targeting on the ground is less successful. In poor provinces Samurdhi is less effective in reaching the poor than in richer provinces.
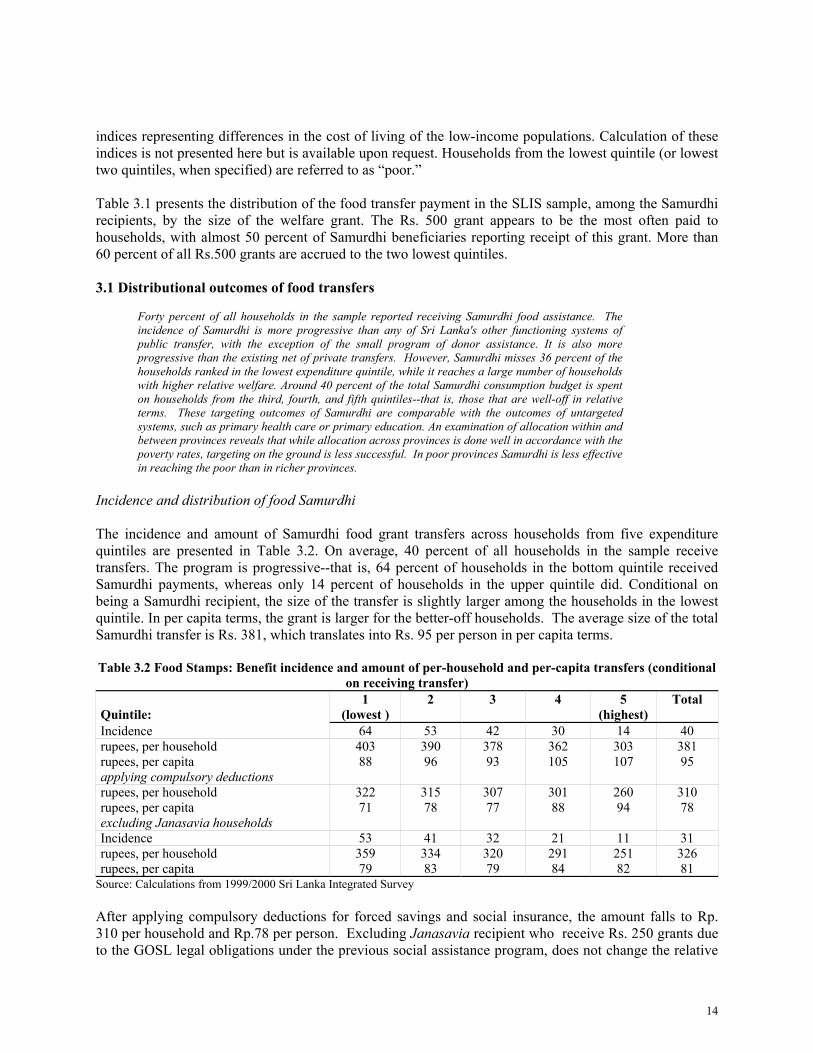
Incidence and distribution of food Samurdhi The incidence and amount of Samurdhi food grant transfers across households from five expenditure quintiles are presented in Table 3.2. On average, 40 percent of all households in the sample receive transfers. The program is progressive--that is, 64 percent of households in the bottom quintile received Samurdhi payments, whereas only 14 percent of households in the upper quintile did. Conditional on being a Samurdhi recipient, the size of the transfer is slightly larger among the households in the lowest quintile. In per capita terms, the grant is larger for the better-off households. The average size of the total Samurdhi transfer is Rs. 381, which translates into Rs. 95 per person in per capita terms. Table 3.2 Food Stamps: Benefit incidence and amount of per-household and per-capita transfers (conditional
on receiving transfer) Quintile:
1 (lowest )
2 3 4 5 (highest)
Total
Incidence 64 53 42 30 14 40 rupees, per household 403 390 378 362 303 381 rupees, per capita 88 96 93 105 107 95 applying compulsory deductions rupees, per household 322 315 307 301 260 310 rupees, per capita 71 78 77 88 94 78 excluding Janasavia households Incidence 53 41 32 21 11 31 rupees, per household 359 334 320 291 251 326 rupees, per capita 79 83 79 84 82 81
Source: Calculations from 1999/2000 Sri Lanka Integrated Survey After applying compulsory deductions for forced savings and social insurance, the amount falls to Rp. 310 per household and Rp.78 per person. Excluding Janasavia recipient who receive Rs. 250 grants due to the GOSL legal obligations under the previous social assistance program, does not change the relative
15
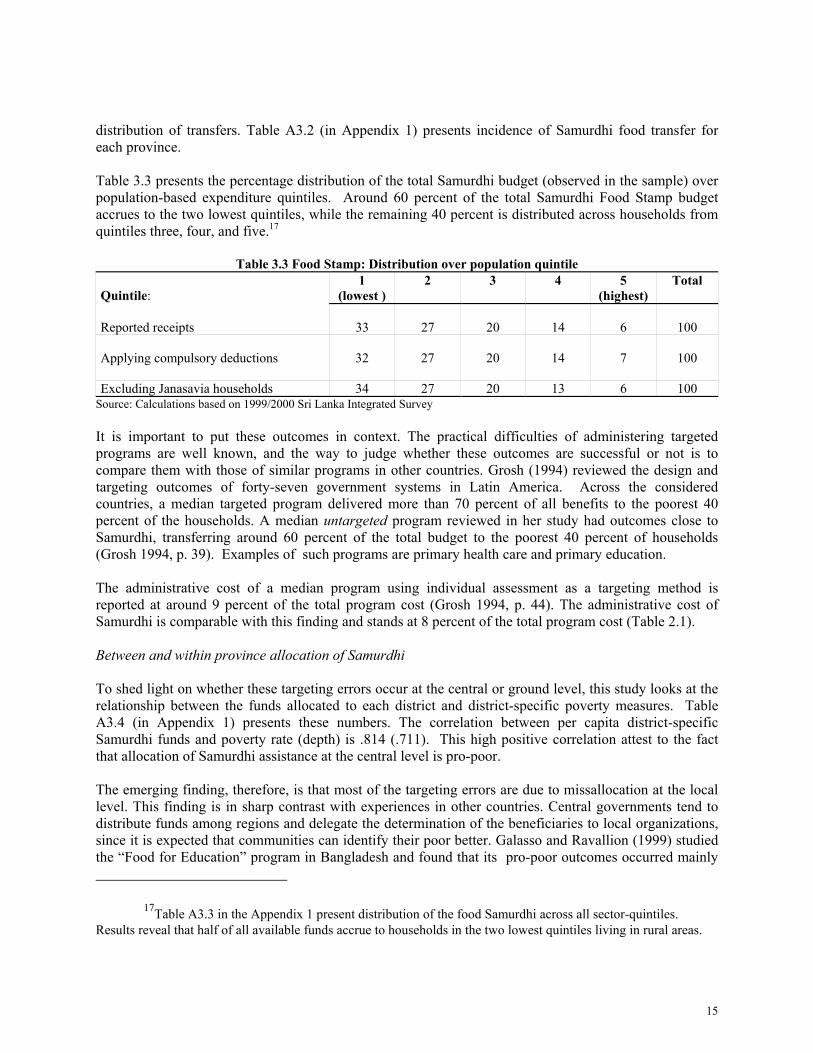
distribution of transfers. Table A3.2 (in Appendix 1) presents incidence of Samurdhi food transfer for each province. Table 3.3 presents the percentage distribution of the total Samurdhi budget (observed in the sample) over population-based expenditure quintiles. Around 60 percent of the total Samurdhi Food Stamp budget accrues to the two lowest quintiles, while the remaining 40 percent is distributed across households from quintiles three, four, and five.17
Table 3.3 Food Stamp: Distribution over population quintile Quintile:
1 (lowest )
2 3 4 5 (highest)
Total
Reported receipts 33 27 20 14 6 100 Applying compulsory deductions 32 27 20 14 7 100 Excluding Janasavia households 34 27 20 13 6 100
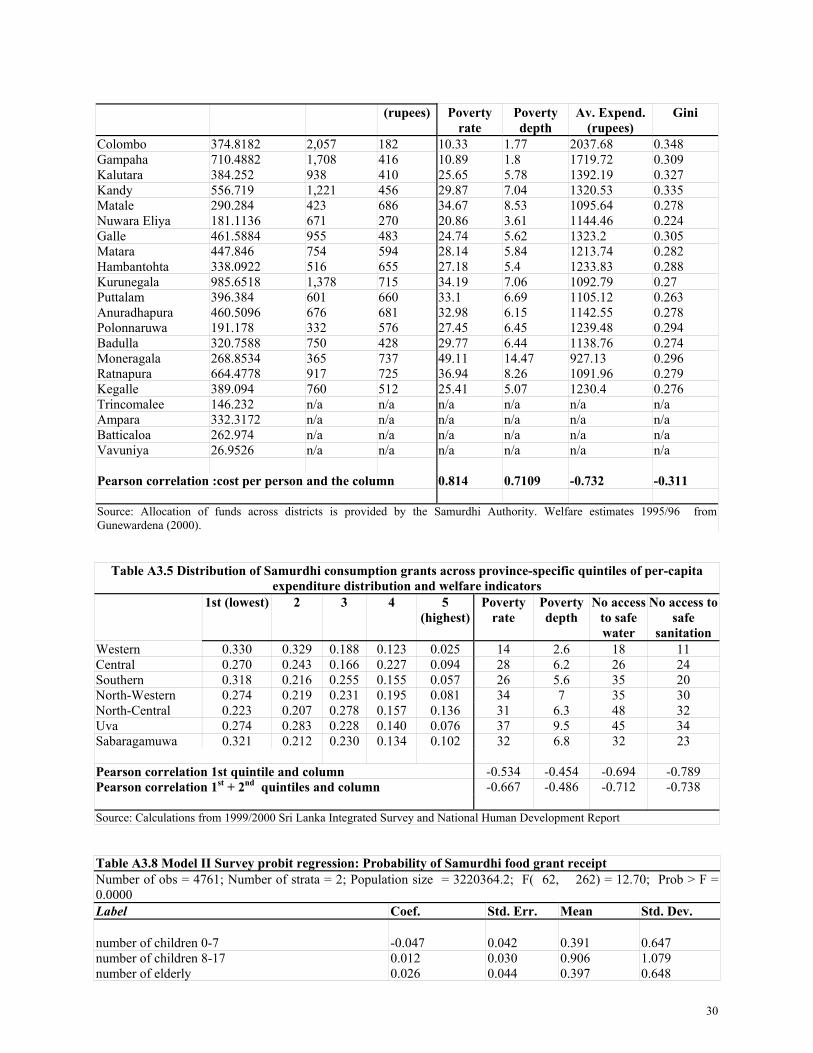
Source: Calculations based on 1999/2000 Sri Lanka Integrated Survey It is important to put these outcomes in context. The practical difficulties of administering targeted programs are well known, and the way to judge whether these outcomes are successful or not is to compare them with those of similar programs in other countries. Grosh (1994) reviewed the design and targeting outcomes of forty-seven government systems in Latin America. Across the considered countries, a median targeted program delivered more than 70 percent of all benefits to the poorest 40 percent of the households. A median untargeted program reviewed in her study had outcomes close to Samurdhi, transferring around 60 percent of the total budget to the poorest 40 percent of households (Grosh 1994, p. 39). Examples of such programs are primary health care and primary education. The administrative cost of a median program using individual assessment as a targeting method is reported at around 9 percent of the total program cost (Grosh 1994, p. 44). The administrative cost of Samurdhi is comparable with this finding and stands at 8 percent of the total program cost (Table 2.1). Between and within province allocation of Samurdhi To shed light on whether these targeting errors occur at the central or ground level, this study looks at the relationship between the funds allocated to each district and district-specific poverty measures. Table A3.4 (in Appendix 1) presents these numbers. The correlation between per capita district-specific Samurdhi funds and poverty rate (depth) is .814 (.711). This high positive correlation attest to the fact that allocation of Samurdhi assistance at the central level is pro-poor. The emerging finding, therefore, is that most of the targeting errors are due to missallocation at the local level. This finding is in sharp contrast with experiences in other countries. Central governments tend to distribute funds among regions and delegate the determination of the beneficiaries to local organizations, since it is expected that communities can identify their poor better. Galasso and Ravallion (1999) studied the “Food for Education” program in Bangladesh and found that its pro-poor outcomes occurred mainly
17Table A3.3 in the Appendix 1 present distribution of the food Samurdhi across all sector-quintiles. Results reveal that half of all available funds accrue to households in the two lowest quintiles living in rural areas.
16
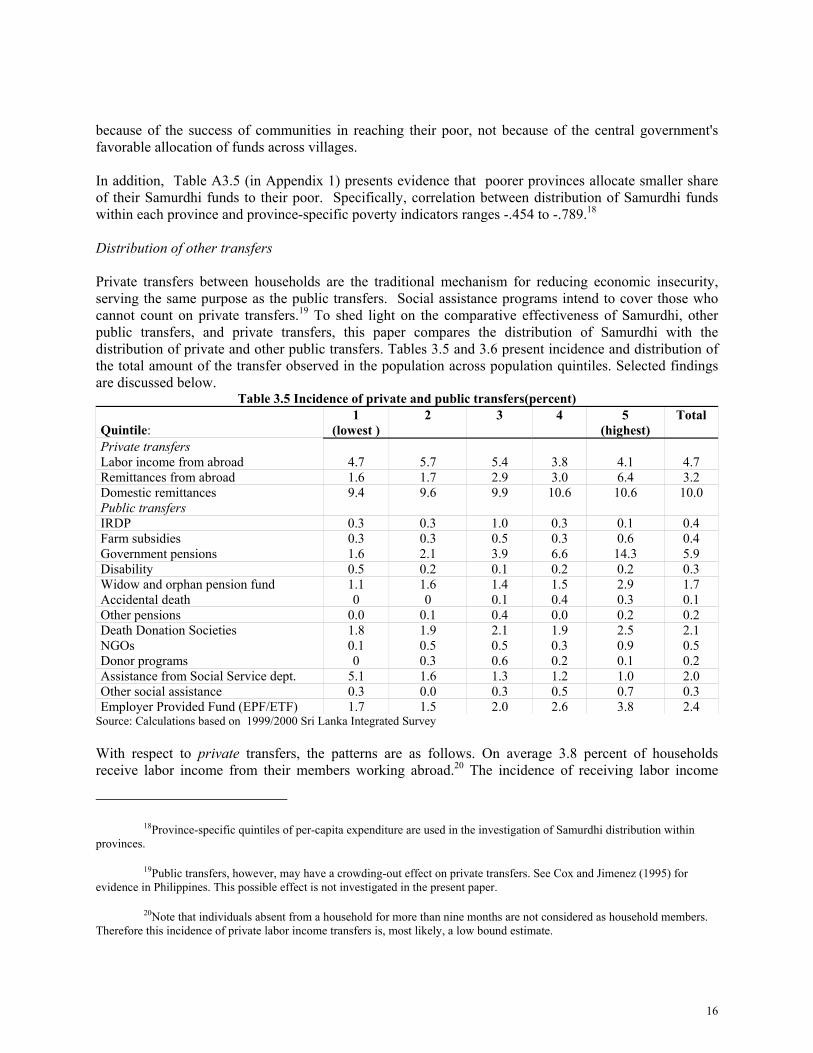
because of the success of communities in reaching their poor, not because of the central government's favorable allocation of funds across villages. In addition, Table A3.5 (in Appendix 1) presents evidence that poorer provinces allocate smaller share of their Samurdhi funds to their poor. Specifically, correlation between distribution of Samurdhi funds within each province and province-specific poverty indicators ranges -.454 to -.789.18 Distribution of other transfers Private transfers between households are the traditional mechanism for reducing economic insecurity, serving the same purpose as the public transfers. Social assistance programs intend to cover those who cannot count on private transfers.19 To shed light on the comparative effectiveness of Samurdhi, other public transfers, and private transfers, this paper compares the distribution of Samurdhi with the distribution of private and other public transfers. Tables 3.5 and 3.6 present incidence and distribution of the total amount of the transfer observed in the population across population quintiles. Selected findings are discussed below.
Table 3.5 Incidence of private and public transfers(percent) Quintile:
1 (lowest )
2 3 4 5 (highest)
Total
Private transfers Labor income from abroad 4.7 5.7 5.4 3.8 4.1 4.7 Remittances from abroad 1.6 1.7 2.9 3.0 6.4 3.2 Domestic remittances 9.4 9.6 9.9 10.6 10.6 10.0 Public transfers IRDP 0.3 0.3 1.0 0.3 0.1 0.4 Farm subsidies 0.3 0.3 0.5 0.3 0.6 0.4 Government pensions 1.6 2.1 3.9 6.6 14.3 5.9 Disability 0.5 0.2 0.1 0.2 0.2 0.3 Widow and orphan pension fund 1.1 1.6 1.4 1.5 2.9 1.7 Accidental death 0 0 0.1 0.4 0.3 0.1 Other pensions 0.0 0.1 0.4 0.0 0.2 0.2 Death Donation Societies 1.8 1.9 2.1 1.9 2.5 2.1 NGOs 0.1 0.5 0.5 0.3 0.9 0.5 Donor programs 0 0.3 0.6 0.2 0.1 0.2 Assistance from Social Service dept. 5.1 1.6 1.3 1.2 1.0 2.0 Other social assistance 0.3 0.0 0.3 0.5 0.7 0.3 Employer Provided Fund (EPF/ETF) 1.7 1.5 2.0 2.6 3.8 2.4
Source: Calculations based on 1999/2000 Sri Lanka Integrated Survey With respect to private transfers, the patterns are as follows. On average 3.8 percent of households receive labor income from their members working abroad.20 The incidence of receiving labor income
18Province-specific quintiles of per-capita expenditure are used in the investigation of Samurdhi distribution within provinces.
19Public transfers, however, may have a crowding-out effect on private transfers. See Cox and Jimenez (1995) for evidence in Philippines. This possible effect is not investigated in the present paper.
20Note that individuals absent from a household for more than nine months are not considered as household members. Therefore this incidence of private labor income transfers is, most likely, a low bound estimate.
17
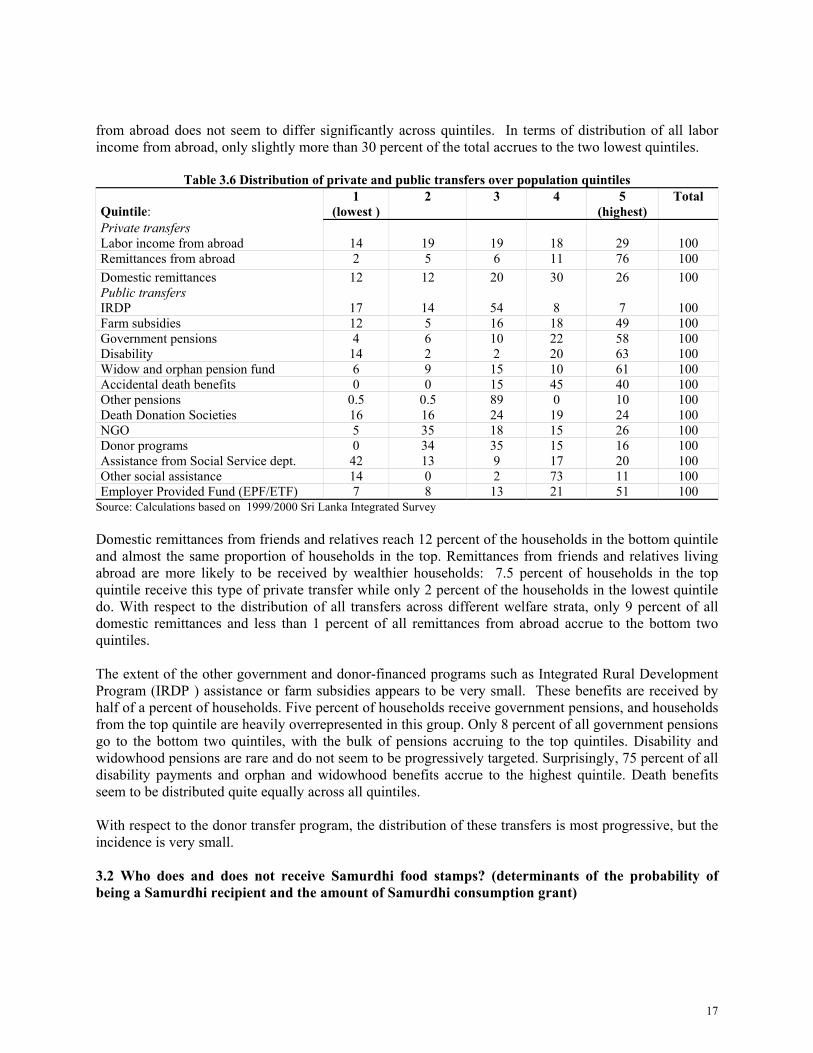
from abroad does not seem to differ significantly across quintiles. In terms of distribution of all labor income from abroad, only slightly more than 30 percent of the total accrues to the two lowest quintiles.
Table 3.6 Distribution of private and public transfers over population quintiles Quintile:
1 (lowest )
2 3 4 5 (highest)
Total
Private transfers Labor income from abroad 14 19 19 18 29 100 Remittances from abroad 2 5 6 11 76 100 Domestic remittances 12 12 20 30 26 100 Public transfers IRDP 17 14 54 8 7 100 Farm subsidies 12 5 16 18 49 100 Government pensions 4 6 10 22 58 100 Disability 14 2 2 20 63 100 Widow and orphan pension fund 6 9 15 10 61 100 Accidental death benefits 0 0 15 45 40 100 Other pensions 0.5 0.5 89 0 10 100 Death Donation Societies 16 16 24 19 24 100 NGO 5 35 18 15 26 100 Donor programs 0 34 35 15 16 100 Assistance from Social Service dept. 42 13 9 17 20 100 Other social assistance 14 0 2 73 11 100 Employer Provided Fund (EPF/ETF) 7 8 13 21 51 100
Source: Calculations based on 1999/2000 Sri Lanka Integrated Survey Domestic remittances from friends and relatives reach 12 percent of the households in the bottom quintile and almost the same proportion of households in the top. Remittances from friends and relatives living abroad are more likely to be received by wealthier households: 7.5 percent of households in the top quintile receive this type of private transfer while only 2 percent of the households in the lowest quintile do. With respect to the distribution of all transfers across different welfare strata, only 9 percent of all domestic remittances and less than 1 percent of all remittances from abroad accrue to the bottom two quintiles. The extent of the other government and donor-financed programs such as Integrated Rural Development Program (IRDP ) assistance or farm subsidies appears to be very small. These benefits are received by half of a percent of households. Five percent of households receive government pensions, and households from the top quintile are heavily overrepresented in this group. Only 8 percent of all government pensions go to the bottom two quintiles, with the bulk of pensions accruing to the top quintiles. Disability and widowhood pensions are rare and do not seem to be progressively targeted. Surprisingly, 75 percent of all disability payments and orphan and widowhood benefits accrue to the highest quintile. Death benefits seem to be distributed quite equally across all quintiles. With respect to the donor transfer program, the distribution of these transfers is most progressive, but the incidence is very small. 3.2 Who does and does not receive Samurdhi food stamps? (determinants of the probability of being a Samurdhi recipient and the amount of Samurdhi consumption grant)
18
There are large disparities in Samurdhi coverage of households with the same real income across provinces and types of settlements. Households residing in urban middle income neighborhoods, irrigation colonies and estates are least likely to receive food grants. Indicators most commonly found among families with low welfare--large household size, low income, disability, landlessness, and no access to latrine or electricity--are associated with a higher probability of Samurdhi receipt. The probability of being a Samurdhi recipient differs significantly by ethnic status. Qualitative results unambiguously suggest that other characteristics such as party affiliation and voting patterns also influenced allocation of Samurdhi consumption grants. These patterns indicate that targeting errors are nonrandom, but rather reflect flaws in the design of the program that allow for the deliberate omission of certain groups of individuals.
Multifactorial analysis Because a large portion of low-income households are missed, it is important to shed light on the characteristics of households that do and do not receive Samurdhi. This paper addresses this issue in a multifactorial framework and presents a series of models relating the characteristics of households to their probability of being selected as a Samurdhi beneficiary. It starts with a model relating exogenous demographic and geographical characteristics of households, as well as their pretransfer income, to the probability of Samurdhi receipt (Model I).21 Further, a model with the same outcome and with a larger set of factors normally associated with low welfare (possession of land and durables, type of electricity used, access to latrines, presence of chronically sick members, and others) is estimated (Model II). All estimations are presented for the country excluding the North-East province since Samurdhi was introduced much later there and may still not be functioning fully. Estimation results of Model I are presented in Table 3.7 and Model II in Table A3.8 (in Appendix 1). Results are discussed below.
21It is understood that pretransfer income is not an exogenous characteristics and might be effected by the unobservables affecting the probability of selection. There might also be other behavioral responses of participation that lead to changes in income. All these considerations are ignored for now.
19
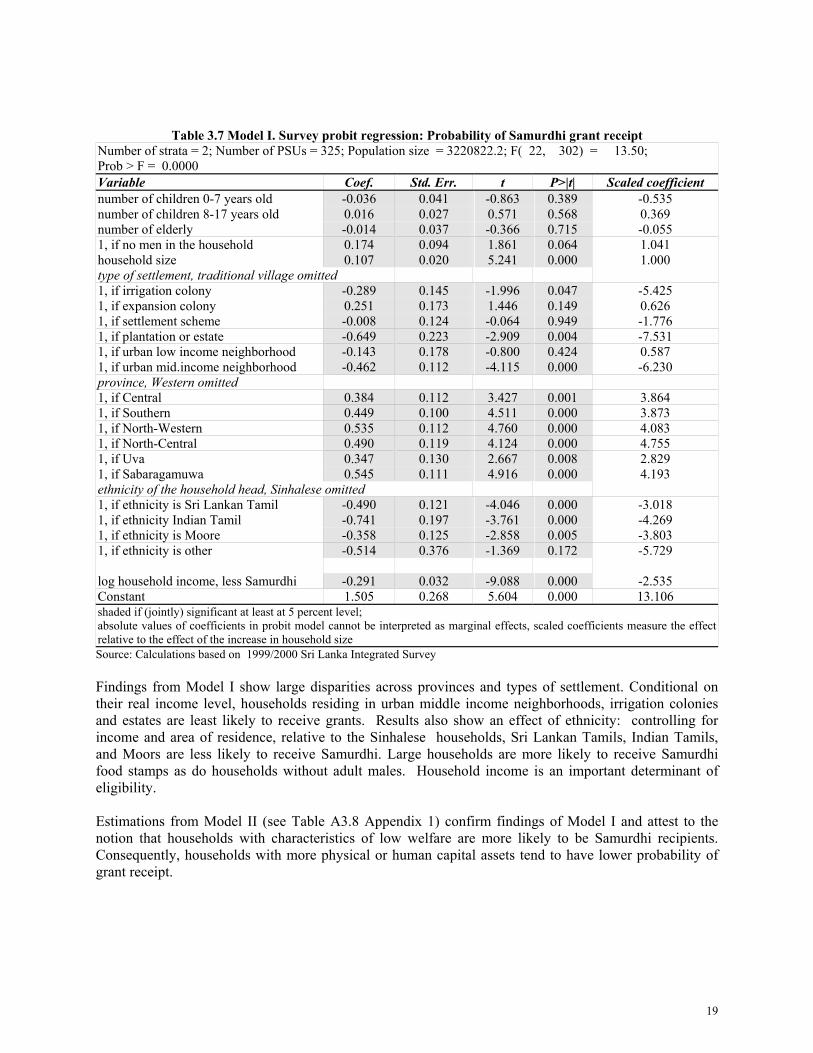
Table 3.7 Model I. Survey probit regression: Probability of Samurdhi grant receiptNumber of strata = 2; Number of PSUs = 325; Population size = 3220822.2; F( 22, 302) = 13.50; Prob > F = 0.0000 Variable Coef. Std. Err. t P>|t| Scaled coefficient number of children 0-7 years old -0.036 0.041 -0.863 0.389 -0.535 number of children 8-17 years old 0.016 0.027 0.571 0.568 0.369 number of elderly -0.014 0.037 -0.366 0.715 -0.055 1, if no men in the household 0.174 0.094 1.861 0.064 1.041 household size 0.107 0.020 5.241 0.000 1.000 type of settlement, traditional village omitted 1, if irrigation colony -0.289 0.145 -1.996 0.047 -5.425 1, if expansion colony 0.251 0.173 1.446 0.149 0.626 1, if settlement scheme -0.008 0.124 -0.064 0.949 -1.776 1, if plantation or estate -0.649 0.223 -2.909 0.004 -7.531 1, if urban low income neighborhood -0.143 0.178 -0.800 0.424 0.587 1, if urban mid.income neighborhood -0.462 0.112 -4.115 0.000 -6.230 province, Western omitted 1, if Central 0.384 0.112 3.427 0.001 3.864 1, if Southern 0.449 0.100 4.511 0.000 3.873 1, if North-Western 0.535 0.112 4.760 0.000 4.083 1, if North-Central 0.490 0.119 4.124 0.000 4.755 1, if Uva 0.347 0.130 2.667 0.008 2.829 1, if Sabaragamuwa 0.545 0.111 4.916 0.000 4.193 ethnicity of the household head, Sinhalese omitted 1, if ethnicity is Sri Lankan Tamil -0.490 0.121 -4.046 0.000 -3.018 1, if ethnicity Indian Tamil -0.741 0.197 -3.761 0.000 -4.269 1, if ethnicity is Moore -0.358 0.125 -2.858 0.005 -3.803 1, if ethnicity is other -0.514 0.376 -1.369 0.172 -5.729 log household income, less Samurdhi -0.291 0.032 -9.088 0.000 -2.535 Constant 1.505 0.268 5.604 0.000 13.106 shaded if (jointly) significant at least at 5 percent level; absolute values of coefficients in probit model cannot be interpreted as marginal effects, scaled coefficients measure the effect relative to the effect of the increase in household size Source: Calculations based on 1999/2000 Sri Lanka Integrated Survey Findings from Model I show large disparities across provinces and types of settlement. Conditional on their real income level, households residing in urban middle income neighborhoods, irrigation colonies and estates are least likely to receive grants. Results also show an effect of ethnicity: controlling for income and area of residence, relative to the Sinhalese households, Sri Lankan Tamils, Indian Tamils, and Moors are less likely to receive Samurdhi. Large households are more likely to receive Samurdhi food stamps as do households without adult males. Household income is an important determinant of eligibility. Estimations from Model II (see Table A3.8 Appendix 1) confirm findings of Model I and attest to the notion that households with characteristics of low welfare are more likely to be Samurdhi recipients. Consequently, households with more physical or human capital assets tend to have lower probability of grant receipt.
20
Specifically, households with disabled or chronically sick members are more likely to receive Samurdhi assistance. Households owning livestock and other assets are less likely to receive assistance. Land ownership and ownership of land title are the significant determinant of assistance grants. Relative to households that own more than 1 acre of land, households without any land and households owning less then 1 acre of land are more likely to receive Samurdhi. Households that have land title are less likely to receive assistance. Results show some evidence that households without proper documentation--that is, those who possess no identification card--are more likely to be left out of Samurdhi. Migration status seems not to be related to the probability of Samurdhi receipt: there are no significant differences across households that settled at their present place of residence at different times. The probabilities of grant receipt differ significantly by the occupation of the household head. Households headed by farm laborers are most likely to receive assistance. Government and private salaried employees, as well as retirees, are the least likely to receive any Samurdhi transfer. Households with members in the military are more likely to receive food stamps. An increase in years of education lowers the probability of grant receipt. Housing conditions appear to be associated with the probability of receipts. Households with access to no latrines or only communal latrines are more likely to receive assistance than households with private latrines. Energy source also seems to be an important correlate of receiving Samurdhi. Households that use kerosene for lighting and or have no sources of lighting are more likely to receive Samurdhi than households with access to electricity. Large differences across provinces and types of settlements remain. The effect of ethnicity stays significant even after accounting for these other observed characteristics. There may be several explanations for the relatively poor targeting of the Tamil and Moor population. Apart from the possible prejudice of certain niyamakas, the language barrier might be a factor, as Tamil niyamakas work only in the North-East. There are only a few Tamil-speaking (mostly Muslim) animators in the rest of the country. Party affiliation and voting patterns are impossible to measure in a quantitative survey. Anecdotally, however, these appear to be the primary determinants of the benevolence of Samurdhi officers and consequently grant receipt. Findings from the People’s Perceptions of Poverty Alleviation Programs of the qualitative survey corroborate this anecdotal evidence. Box 1 presents the results.
Box 1. Peoples perceptions of Samurdhi selection procedures The selection of beneficiaries to Samurdhi was universally reported to be biased according to political affiliation.The primary abuse appears to be the inclusion of large numbers of ineligible households as a reward for politicalloyalty to the governing party. In many of the villages visited by the qualitative teams, half or more than half ofthe village households were found to be receiving Samurdhi benefits. For instance, in a fishing village respondents stated that a man with two machine boats was selected because he hadstrong influence with the ruling party. Discussions with the Samurdhi niyamaka revealed that the niyamaka too felt that the relevant person was not qualified to receive Samurdhi benefits but that he had to accommodate himbecause he was so close to an influential local politician. Reports were heard of party organizers attracting voters to the party with the promise of Samurdhi benefits. In some villages eligible Samurdhi recipients who are not supporters of the ruling party were told that if they venturedto vote in an upcoming election, they would be removed from the Samurdhi lists and their benefits would be terminated. Source: People’s Perceptions of Poverty, qualitative survey. See Parker and Silva (2000) for research methodology.
21
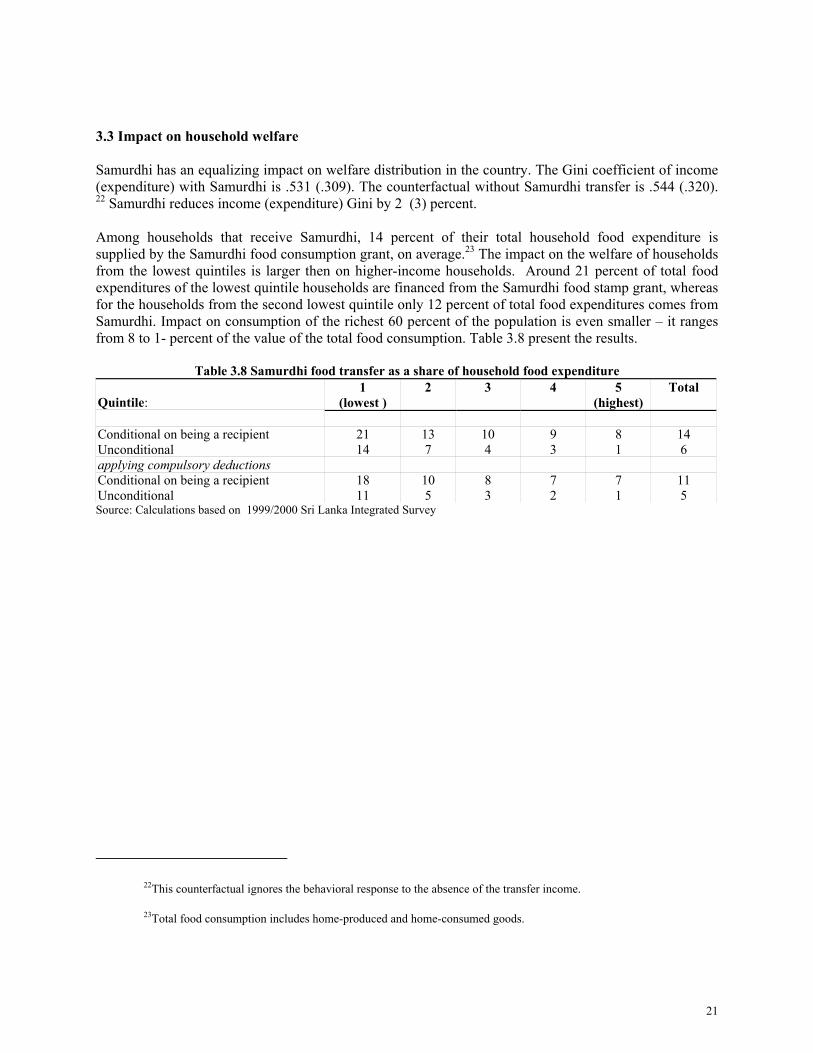
3.3 Impact on household welfare Samurdhi has an equalizing impact on welfare distribution in the country. The Gini coefficient of income (expenditure) with Samurdhi is .531 (.309). The counterfactual without Samurdhi transfer is .544 (.320). 22 Samurdhi reduces income (expenditure) Gini by 2 (3) percent. Among households that receive Samurdhi, 14 percent of their total household food expenditure is supplied by the Samurdhi food consumption grant, on average.23 The impact on the welfare of households from the lowest quintiles is larger then on higher-income households. Around 21 percent of total food expenditures of the lowest quintile households are financed from the Samurdhi food stamp grant, whereas for the households from the second lowest quintile only 12 percent of total food expenditures comes from Samurdhi. Impact on consumption of the richest 60 percent of the population is even smaller – it ranges from 8 to 1- percent of the value of the total food consumption. Table 3.8 present the results.
Table 3.8 Samurdhi food transfer as a share of household food expenditure
Quintile:
1 (lowest )
2 3 4 5 (highest)
Total
Conditional on being a recipient 21 13 10 9 8 14 Unconditional 14 7 4 3 1 6 applying compulsory deductions Conditional on being a recipient 18 10 8 7 7 11 Unconditional 11 5 3 2 1 5 Source: Calculations based on 1999/2000 Sri Lanka Integrated Survey
22This counterfactual ignores the behavioral response to the absence of the transfer income.
23Total food consumption includes home-produced and home-consumed goods.
22
3.4 Distributional outcomes of the nonfood Samurdhi components (social insurance compensations, provision of access to credit)
The distribution of Samurdhi bank loans and social insurance is less progressive (less pro-poor) than that of food Samurdhi, and the size of the nonfood Samurdhi transfers is regressive. Rich participants are more likely to receive social insurance compensation than the poor, and their grants are considerably larger than those of the poor. Samurdhi savings groups organize nearly a quarter of all households. Households from the lower welfare strata are three times more likely to belong and save with one of these groups. At the same time, households from the higher income strata are more likely to receive loans from Samurdhi banks.
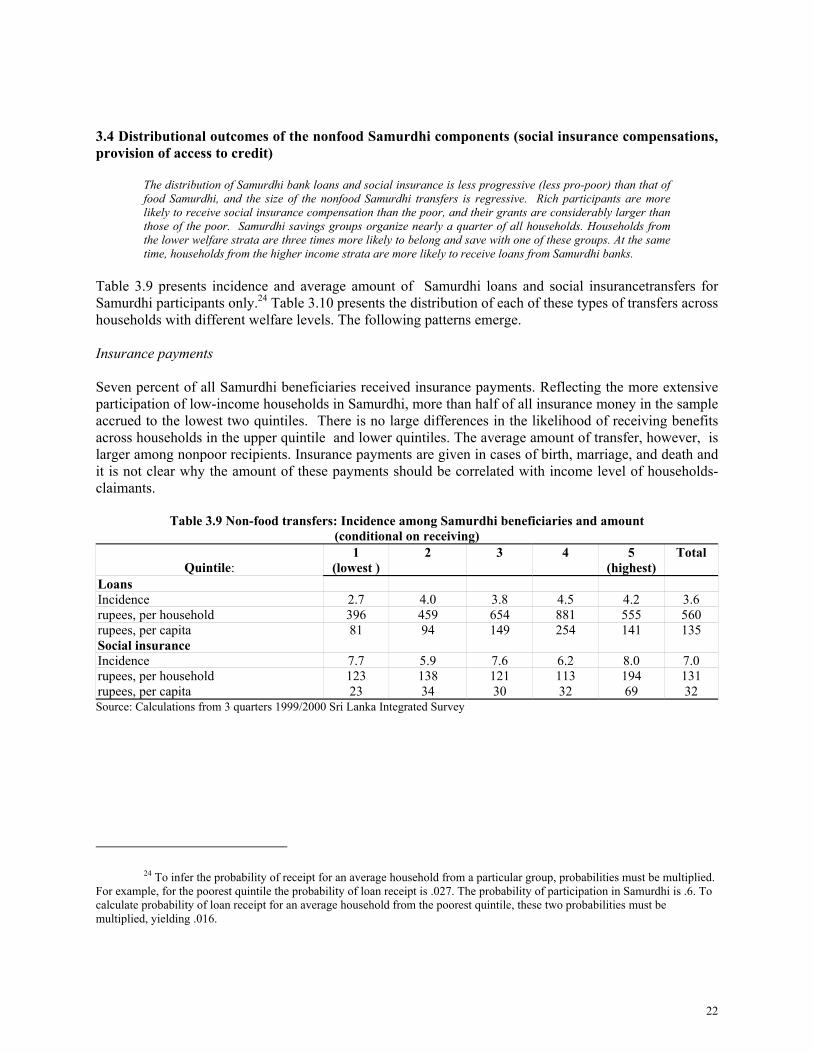
Table 3.9 presents incidence and average amount of Samurdhi loans and social insurancetransfers for Samurdhi participants only.24 Table 3.10 presents the distribution of each of these types of transfers across households with different welfare levels. The following patterns emerge. Insurance payments Seven percent of all Samurdhi beneficiaries received insurance payments. Reflecting the more extensive participation of low-income households in Samurdhi, more than half of all insurance money in the sample accrued to the lowest two quintiles. There is no large differences in the likelihood of receiving benefits across households in the upper quintile and lower quintiles. The average amount of transfer, however, is larger among nonpoor recipients. Insurance payments are given in cases of birth, marriage, and death and it is not clear why the amount of these payments should be correlated with income level of households-claimants.
Table 3.9 Non-food transfers: Incidence among Samurdhi beneficiaries and amount (conditional on receiving)
Quintile:
1 (lowest )
2 3 4 5 (highest)
Total
Loans Incidence 2.7 4.0 3.8 4.5 4.2 3.6 rupees, per household 396 459 654 881 555 560 rupees, per capita 81 94 149 254 141 135 Social insurance Incidence 7.7 5.9 7.6 6.2 8.0 7.0 rupees, per household 123 138 121 113 194 131 rupees, per capita 23 34 30 32 69 32 Source: Calculations from 3 quarters 1999/2000 Sri Lanka Integrated Survey
24 To infer the probability of receipt for an average household from a particular group, probabilities must be multiplied. For example, for the poorest quintile the probability of loan receipt is .027. The probability of participation in Samurdhi is .6. To calculate probability of loan receipt for an average household from the poorest quintile, these two probabilities must be multiplied, yielding .016.
23
Table 3.10 Non-food transfers: Distribution over population quintiles
Quintile:
1 (lowest )
2 3 4 5 (highest)
Total
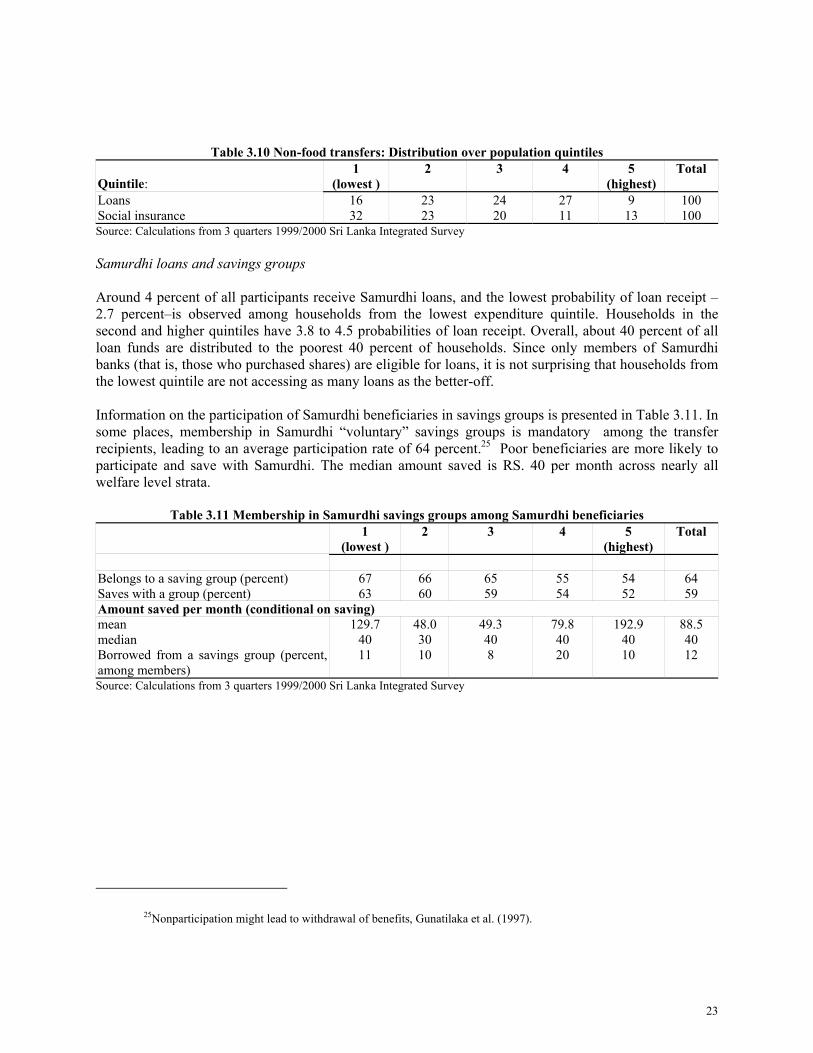
Loans 16 23 24 27 9 100 Social insurance 32 23 20 11 13 100 Source: Calculations from 3 quarters 1999/2000 Sri Lanka Integrated Survey Samurdhi loans and savings groups Around 4 percent of all participants receive Samurdhi loans, and the lowest probability of loan receipt –2.7 percent–is observed among households from the lowest expenditure quintile. Households in the second and higher quintiles have 3.8 to 4.5 probabilities of loan receipt. Overall, about 40 percent of all loan funds are distributed to the poorest 40 percent of households. Since only members of Samurdhi banks (that is, those who purchased shares) are eligible for loans, it is not surprising that households from the lowest quintile are not accessing as many loans as the better-off. Information on the participation of Samurdhi beneficiaries in savings groups is presented in Table 3.11. In some places, membership in Samurdhi “voluntary” savings groups is mandatory among the transfer recipients, leading to an average participation rate of 64 percent.25 Poor beneficiaries are more likely to participate and save with Samurdhi. The median amount saved is RS. 40 per month across nearly all welfare level strata.
Table 3.11 Membership in Samurdhi savings groups among Samurdhi beneficiaries 1
(lowest ) 2 3 4 5
(highest) Total
Belongs to a saving group (percent) 67 66 65 55 54 64 Saves with a group (percent) 63 60 59 54 52 59 Amount saved per month (conditional on saving) mean 129.7 48.0 49.3 79.8 192.9 88.5 median 40 30 40 40 40 40 Borrowed from a savings group (percent, among members)
11 10 8 20 10 12
Source: Calculations from 3 quarters 1999/2000 Sri Lanka Integrated Survey
25Nonparticipation might lead to withdrawal of benefits, Gunatilaka et al. (1997).
24
4. Drawbacks of the Samurdhi program 4.1 Efficiency issues Based on the empirical analysis of distributional outcomes, Samurdhi transfer program emerges as inefficient program. In the case of a transfer program, efficiency constitutes reaching the objective (transferring to the intended beneficiaries) in the least costly way (minimizing leakage to unintended beneficiaries and administrative cost).26 Targeting is required to reach these objectives, but there are considerations against targeting. These are the administrative and informational costs of targeting, adverse incentives, and political economy. While weighing the costs and benefits of targeting, one must also consider the nature of the good provided (that is, whether the good has private benefits only or some externalities). Samurdhi provides resources for private consumption and is designed as a targeted program. Considerable administrative costs and possibility of incentive distortion are built into program eligibility requirements. But Samurdhi's outcomes in terms of reaching intended beneficiaries and excluding other households are those of untargeted programs. If a program is envisioned as a targeted system, it must not employ a structure that prevents the fair identification of intended beneficiaries.27 Administrative and informational cost The cost of targeting increases with the accuracy of targeting, and targeting involves trade-offs between undercoverage and leakage. A large body of literature exists on both the theoretical underpinnings of the administrative and informational costs of implementation (Besley and Kanbur [1990]) and empirical estimates of the cost of targeting (Grosh [1994]). It is well understood that administrative cost is an increasing function of the accuracy of targeting and that the goal of minimizing leakage might lead to stigma effects and undercoverage. Samurdhi incurs the targeting cost of 8 percent of the total program (see Table 2.1) that is comparable with the administrative cost of other targeted program (Grosh [1994]). The inferior targeting outcomes of Samurdhi cannot, therefore, be explained on the basis of saving on administrative costs. On the contrary, the program employs the administrative capacity but fails to deliver expected outcomes. Substantial undercoverage and leakage errors coexist. The efficiency loss due to these errors is compounded by the nonrandom nature of these errors. Incentive effect
26This is not a definition of efficiency in poverty minimization. If the goal of a social planer is to minimize poverty and she is concerned (as she should be) with the most efficient way of doing so, she has to select from the menu of choices of activities with poverty reduction implications. However, once she decided on the transfer program as [one of ] her poverty alleviation strategies, the problem becomes as described above.
27Efficiency loss also occurs at the stage of exchanging stamps for goods in the “cooperative stores.” The public cost of providing the food stamps appears to be larger than their value for the recipients as prices and quality in the cooperatives stores are reported as inferior to those of private and other government stores (Parker and Silva [2000]).
25
Targeted subsidies change relative prices faced by households and therefore might affect labor-leisure allocation and migration decisions. Literature in both developing and developed counties shows empirical evidence of these effects. Sahn and Alderman (1996) demonstrated that participation in the food stamps program in Sri Lanka reduced labor supply by three to five days. Samurdhi, as means-tested program, has the potential to alter the price of leisure and imposes high marginal taxes on labor income. As it is described in Section 2.2.2 households with income above RS. 2,000 lose benefits. A household also loses its eligibility upon employment of any household member. The Samurdhi incentive scheme has the capacity to deter geographic mobility as well. Political economy Considerations of political economy are described in Sen (1995). In short, a transfer program might have less support from middle- and upper-income constituencies if it renders benefits to the poor only. It is not clear, nevertheless, whether political economy considerations alone can justify the existence of a largely inefficient program that nonrandomly excludes otherwise eligible households with particular characteristics. Nature of the good provided Presumably, a social planner would be less concerned with leakage if consumption of the transferred goods render benefits to the whole society. While subsidizing consumption of those below the poverty level has short-run and long-run implications for the overall use of productive resources, subsidizing nonpoor households has diminishing benefits to society. Weak accountability Efficiency requirements imply that the checks of accountability and transparency must be embedded in the design of a transfer program. Most important, the program should embed an external mechanism for monitoring and evaluation.28 The Samurdhi program appears to lack these. Samurdhi officers are accountable to two authorities, one of whom is a local politician (Gunitalaka et al. [1997]). Thus the people who carry out the program are not free of political influence, and no external checks and balances are present to prevent them from acting on the demands of politicians. The absence of strict rules for program eligibility does not help the cause either. Politicization is embedded in the design and influences both the selection of Samurdhi administrators and the selection of beneficiaries. These design flaws lead to implementation problems and compromise the system of social assistance at large. 4.2 Suitability of the Samurdhi program for poverty evaluation The Samurdhi social assistance program was established to alleviate poverty and create opportunities for youth and the disadvantaged. It does not appear to fulfill this contract. The impact of Samurdhi transfers on poverty alleviation is limited. The food transfer component of the program at best increases the food consumption of an average household in the bottom 40 percent by 7 percent.
28 Principles of monitoring and evaluation are described in “Samurdhi the National Programme for Poverty evaluation” p.32. While higher authorities evaluate the Program’s progress at the national level, there is no external monitoring.
26
The program also creates 20,000 white-collar jobs for previously unemployed youth. This could not be considered as a successful or sustainable scheme for youth employment. It is unlikely that the government could absorb a large portion of the unemployed without serious implications for the budget. The credit and banking components of Samurdhi do not advance the goals of Samurdhi any more than its transfer component. They have limited abilities to reach the poor. As Section 3.4 showed, credit is distributed more favorably toward nonpoor recipients. Moreover, the program's goal of teaching people savings behavior is based on the wrong premise that the poor do not know that saving is “good for them.” Empirical evidence from around the world show that people do not save not because they do not know that it is good for them but mostly because they are too poor to save. 5. Conclusions This paper described the components of the Samurdhi program and evaluated the targeting outcomes of its food stamp, social security, and credit components. Based on empirical evidence, the paper reaches the conclusion that the targeting outcomes of Samurdhi are inadequate. Moreover, the patterns of targeting errors suggest that the program would need extensive redesign in order to improve these outcomes. The next step is to evaluate the impact of this transfer program on the individual behavior. Targeted transfer programs tend to affect individual behavior as they change implicit relative prices of goods. It is widely shown that programs could lead to perverse effects (see Heckman and Robb [1996].) For this reason, any government program must be subjected to rigorous analysis and evaluation.
27
6. References
Atkinson, A. B. 1995. Incomes and Welfare State: Essays on Britain and Europe. Cambridge: Cambridge University Press
Besley, T. 1990 “Means Testing versus Universal Provision in Poverty Alleviation.” Economica 57: 119-29.
Besley, T., and S. Coate. 1992. “Workfare vs. Welfare: Incentive Arguments for Work Requirement in Poverty Alleviation Programs.” American Economic Review 82: 249-61.
Besley, T., and R. Kanbur. 1988. “Food Subsidies and Poverty Alleviation.” Economic Journal 92: 701-19.
Besley , T., and R. Kanbur. 1990. “The Principles of Targeting.” Working Paper. Washington, D.C.: World Bank.
Case and Deaton. 1996. “Large Cash Transfer to the Elderly in South Africa”.NBER Working paper Series. Working paper No 5572.
Datt, G., and D. Gunewardena. 1997. “Some Aspects of Poverty in Sri Lanka: 1985-90” Policy Research Working Paper No 1738. Washington, D.C.: World Bank.
Duties and Responsibilities of Samurdhi Development Officer. Guidebook I. Sri Lanka Samurdhi Authority, Sethsiripaya, Battaramulla.Colombo.
Edirisinghe, N. 1987. The Food Stamp Scheme in Sri Lanka: Costs, Benefits, and Options for Modification. Research Report 58. Washington, D.C.: International Food Policy Research Institute.
Galasso, E., and M. Ravallion. 1999. “Distributional Outcomes of a Decentralized Welfare Program.” Working Paper. Washington, D.C.: World Bank.
Grosh, M. 1994. Administering Targeted Social Programs in Latin America. From Platitudes to Practice World Bank Regional and Sectoral Studies, Washington, D.C.: World Bank.
Gunatilaka, R., et al. 1997. “The Samurdhi Programme: A Preliminary Evaluation.” Colombo: Institute of Policy Studies.
Heckman J. and R. Robb 1996. “Alternative Methods for Evaluating the Impact of Interventions” in Ashenfelter, C.LaLonde (eds.) The economics of training. Theory and measurement. Vol. 1.
Kanbur R. 1987. “Transfer, Targeting, and Poverty.” Economic Policy 4: 112-36, 141-47.
Parliament of the Democratic Socialist Republic of Sri Lanka. “Samurdhi Authority of Sri Lanka Act, No 30 of 1995.” Certified on 11 December, 1995.
Ministry of Samurdhi, Youth Affairs, and Sports. “Progress 1999, Programmes 2000." Report for the Parliament. Colombo.
Ratnayake R M K 1999. “Proposed Entry and Exit Criterion to the Food Stamp Scheme.” Colombo: Ministry of Samurdhi, Youth Affairs, and Sports.
Sahn D. and H. Alderman 1996. “The Effect of Food Subsidies on Labor Supply in Sri Lanka”, Economic Development and Cultural Change. v45 n1 October 1996, pp. 125-45.
28
Samurdhi Authority of Sri Lanka, Monitoring and Evaluation Division. 1999. “Samurdhi National Programme for Poverty Alleviation.” Sethsiripaya Battaramulla.Maharagama: National Youth Centre. Colombo.
Sen A. (1995) “The Political Economy of Targeting”, in Van de Walle D. and K. Nead (eds.) Public Spending and the Poor. Theory and Evidence. The Johns Hopkins University Press. Baltimore and London.
Tennakoon, M U A (1998) “Samurdhi Programme in Poverty Alleviation”.Colombo.
United Nations Development Programme. 1998. National Human Development Report. Regional Dimensions of Human Development.
Van de Walle D. and K. Nead (ed.) 1995. Public Spending and the Poor. Theory and Evidence. The Johns Hopkins University Press. Baltimore and London.
World Bank. 1995. Sri Lanka: Poverty Assessment. Washington, D.C.: World Bank.
29
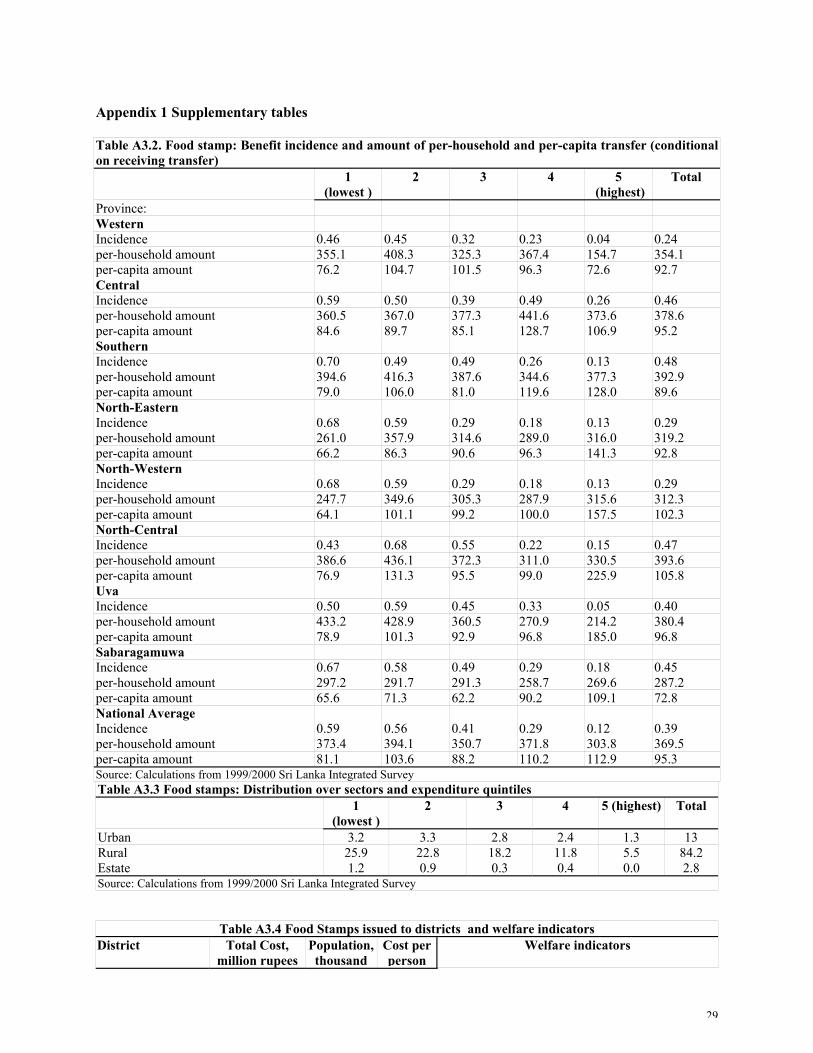
Appendix 1 Supplementary tables Table A3.2. Food stamp: Benefit incidence and amount of per-household and per-capita transfer (conditional on receiving transfer) 1
(lowest ) 2 3 4 5
(highest) Total
Province: Western Incidence 0.46 0.45 0.32 0.23 0.04 0.24 per-household amount 355.1 408.3 325.3 367.4 154.7 354.1 per-capita amount 76.2 104.7 101.5 96.3 72.6 92.7 Central Incidence 0.59 0.50 0.39 0.49 0.26 0.46 per-household amount 360.5 367.0 377.3 441.6 373.6 378.6 per-capita amount 84.6 89.7 85.1 128.7 106.9 95.2 Southern Incidence 0.70 0.49 0.49 0.26 0.13 0.48 per-household amount 394.6 416.3 387.6 344.6 377.3 392.9 per-capita amount 79.0 106.0 81.0 119.6 128.0 89.6 North-Eastern Incidence 0.68 0.59 0.29 0.18 0.13 0.29 per-household amount 261.0 357.9 314.6 289.0 316.0 319.2 per-capita amount 66.2 86.3 90.6 96.3 141.3 92.8 North-Western Incidence 0.68 0.59 0.29 0.18 0.13 0.29 per-household amount 247.7 349.6 305.3 287.9 315.6 312.3 per-capita amount 64.1 101.1 99.2 100.0 157.5 102.3 North-Central Incidence 0.43 0.68 0.55 0.22 0.15 0.47 per-household amount 386.6 436.1 372.3 311.0 330.5 393.6 per-capita amount 76.9 131.3 95.5 99.0 225.9 105.8 Uva Incidence 0.50 0.59 0.45 0.33 0.05 0.40 per-household amount 433.2 428.9 360.5 270.9 214.2 380.4 per-capita amount 78.9 101.3 92.9 96.8 185.0 96.8 Sabaragamuwa Incidence 0.67 0.58 0.49 0.29 0.18 0.45 per-household amount 297.2 291.7 291.3 258.7 269.6 287.2 per-capita amount 65.6 71.3 62.2 90.2 109.1 72.8 National Average Incidence 0.59 0.56 0.41 0.29 0.12 0.39 per-household amount 373.4 394.1 350.7 371.8 303.8 369.5 per-capita amount 81.1 103.6 88.2 110.2 112.9 95.3 Source: Calculations from 1999/2000 Sri Lanka Integrated Survey Table A3.3 Food stamps: Distribution over sectors and expenditure quintiles 1
(lowest ) 2 3 4 5 (highest) Total
Urban 3.2 3.3 2.8 2.4 1.3 13 Rural 25.9 22.8 18.2 11.8 5.5 84.2 Estate 1.2 0.9 0.3 0.4 0.0 2.8 Source: Calculations from 1999/2000 Sri Lanka Integrated Survey
Table A3.4 Food Stamps issued to districts and welfare indicators District Total Cost,
million rupees Population,thousand
Cost per person
Welfare indicators
30
(rupees) Poverty rate
Poverty depth
Av. Expend. (rupees)
Gini
Colombo 374.8182 2,057 182 10.33 1.77 2037.68 0.348 Gampaha 710.4882 1,708 416 10.89 1.8 1719.72 0.309 Kalutara 384.252 938 410 25.65 5.78 1392.19 0.327 Kandy 556.719 1,221 456 29.87 7.04 1320.53 0.335 Matale 290.284 423 686 34.67 8.53 1095.64 0.278 Nuwara Eliya 181.1136 671 270 20.86 3.61 1144.46 0.224 Galle 461.5884 955 483 24.74 5.62 1323.2 0.305 Matara 447.846 754 594 28.14 5.84 1213.74 0.282 Hambantohta 338.0922 516 655 27.18 5.4 1233.83 0.288 Kurunegala 985.6518 1,378 715 34.19 7.06 1092.79 0.27 Puttalam 396.384 601 660 33.1 6.69 1105.12 0.263 Anuradhapura 460.5096 676 681 32.98 6.15 1142.55 0.278 Polonnaruwa 191.178 332 576 27.45 6.45 1239.48 0.294 Badulla 320.7588 750 428 29.77 6.44 1138.76 0.274 Moneragala 268.8534 365 737 49.11 14.47 927.13 0.296 Ratnapura 664.4778 917 725 36.94 8.26 1091.96 0.279 Kegalle 389.094 760 512 25.41 5.07 1230.4 0.276 Trincomalee 146.232 n/a n/a n/a n/a n/a n/a Ampara 332.3172 n/a n/a n/a n/a n/a n/a Batticaloa 262.974 n/a n/a n/a n/a n/a n/a Vavuniya 26.9526 n/a n/a n/a n/a n/a n/a Pearson correlation :cost per person and the column 0.814 0.7109 -0.732 -0.311 Source: Allocation of funds across districts is provided by the Samurdhi Authority. Welfare estimates 1995/96 from Gunewardena (2000).
Table A3.5 Distribution of Samurdhi consumption grants across province-specific quintiles of per-capita expenditure distribution and welfare indicators
1st (lowest) 2 3 4 5 (highest)
Poverty rate
Poverty depth
No access to safe water
No access to safe
sanitation Western 0.330 0.329 0.188 0.123 0.025 14 2.6 18 11 Central 0.270 0.243 0.166 0.227 0.094 28 6.2 26 24 Southern 0.318 0.216 0.255 0.155 0.057 26 5.6 35 20 North-Western 0.274 0.219 0.231 0.195 0.081 34 7 35 30 North-Central 0.223 0.207 0.278 0.157 0.136 31 6.3 48 32 Uva 0.274 0.283 0.228 0.140 0.076 37 9.5 45 34 Sabaragamuwa 0.321 0.212 0.230 0.134 0.102 32 6.8 32 23 Pearson correlation 1st quintile and column -0.534 -0.454 -0.694 -0.789 Pearson correlation 1st + 2nd quintiles and column -0.667 -0.486 -0.712 -0.738 Source: Calculations from 1999/2000 Sri Lanka Integrated Survey and National Human Development Report Table A3.8 Model II Survey probit regression: Probability of Samurdhi food grant receipt Number of obs = 4761; Number of strata = 2; Population size = 3220364.2; F( 62, 262) = 12.70; Prob > F = 0.0000 Label Coef. Std. Err. Mean Std. Dev. number of children 0-7 -0.047 0.042 0.391 0.647 number of children 8-17 0.012 0.030 0.906 1.079 number of elderly 0.026 0.044 0.397 0.648
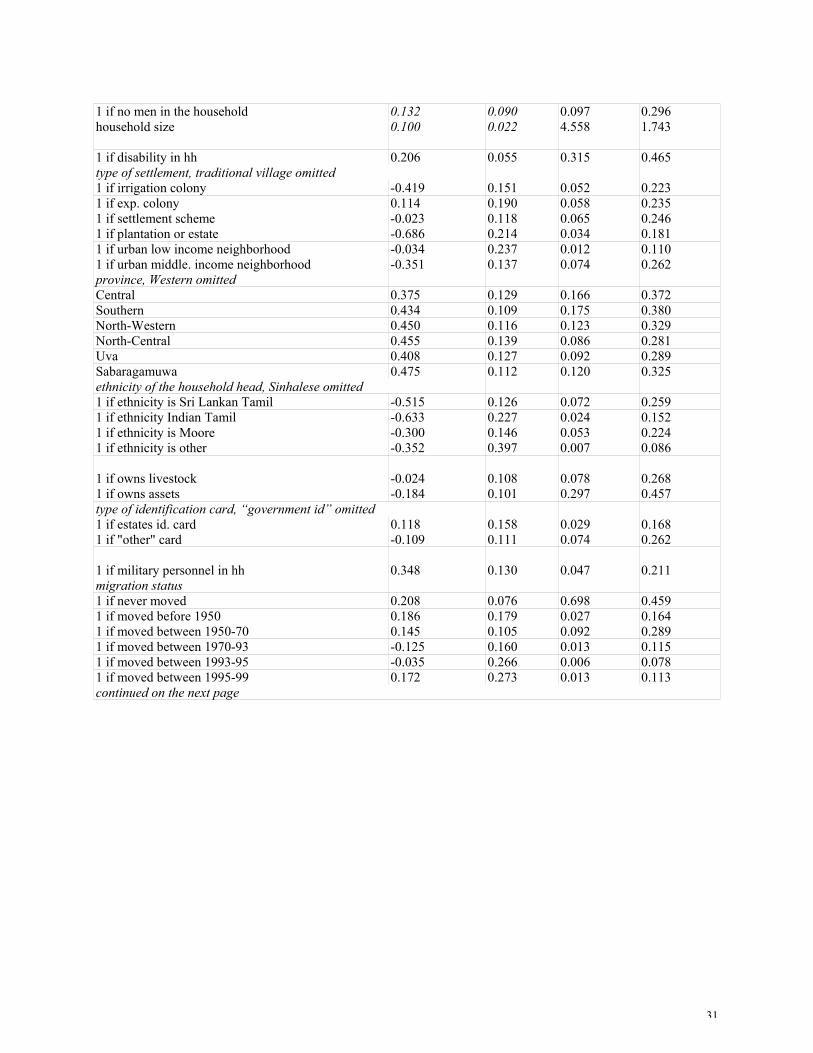
31
1 if no men in the household 0.132 0.090 0.097 0.296 household size 0.100 0.022 4.558 1.743 1 if disability in hh 0.206 0.055 0.315 0.465 type of settlement, traditional village omitted 1 if irrigation colony -0.419 0.151 0.052 0.223 1 if exp. colony 0.114 0.190 0.058 0.235 1 if settlement scheme -0.023 0.118 0.065 0.246 1 if plantation or estate -0.686 0.214 0.034 0.181 1 if urban low income neighborhood -0.034 0.237 0.012 0.110 1 if urban middle. income neighborhood -0.351 0.137 0.074 0.262 province, Western omitted Central 0.375 0.129 0.166 0.372 Southern 0.434 0.109 0.175 0.380 North-Western 0.450 0.116 0.123 0.329 North-Central 0.455 0.139 0.086 0.281 Uva 0.408 0.127 0.092 0.289 Sabaragamuwa 0.475 0.112 0.120 0.325 ethnicity of the household head, Sinhalese omitted 1 if ethnicity is Sri Lankan Tamil -0.515 0.126 0.072 0.259 1 if ethnicity Indian Tamil -0.633 0.227 0.024 0.152 1 if ethnicity is Moore -0.300 0.146 0.053 0.224 1 if ethnicity is other -0.352 0.397 0.007 0.086 1 if owns livestock -0.024 0.108 0.078 0.268 1 if owns assets -0.184 0.101 0.297 0.457 type of identification card, “government id” omitted 1 if estates id. card 0.118 0.158 0.029 0.168 1 if "other" card -0.109 0.111 0.074 0.262 1 if military personnel in hh 0.348 0.130 0.047 0.211 migration status 1 if never moved 0.208 0.076 0.698 0.459 1 if moved before 1950 0.186 0.179 0.027 0.164 1 if moved between 1950-70 0.145 0.105 0.092 0.289 1 if moved between 1970-93 -0.125 0.160 0.013 0.115 1 if moved between 1993-95 -0.035 0.266 0.006 0.078 1 if moved between 1995-99 0.172 0.273 0.013 0.113 continued on the next page
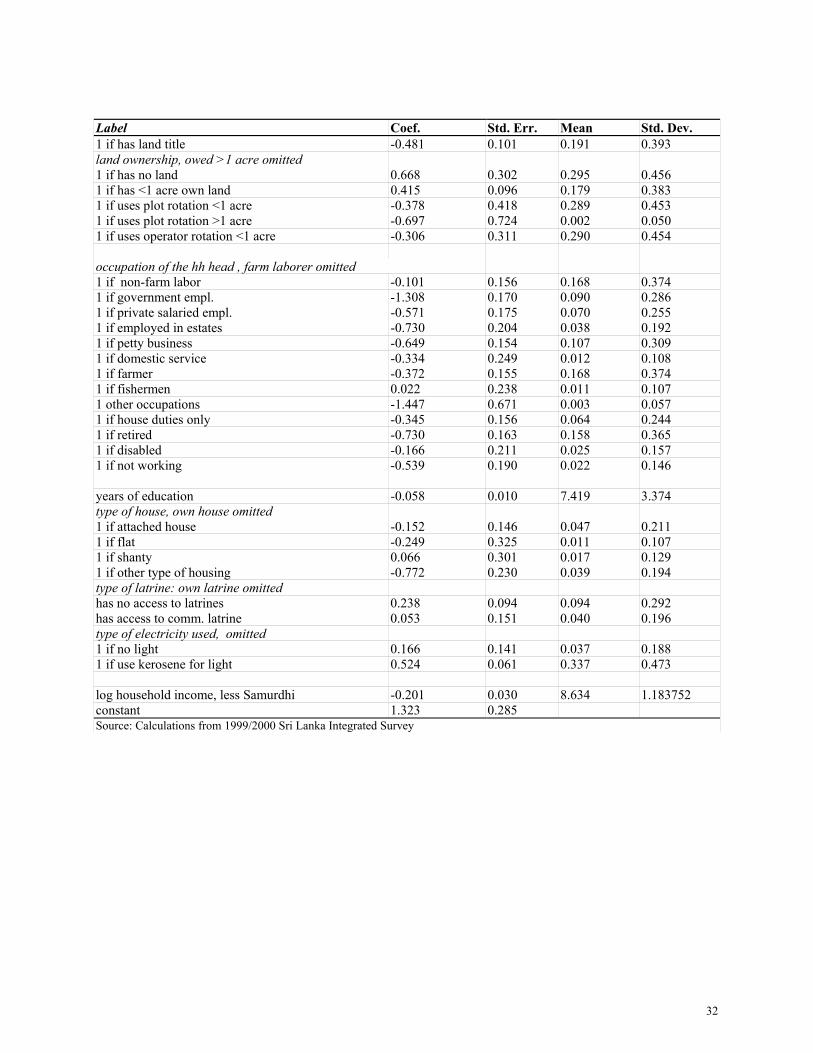
32
Label Coef. Std. Err. Mean Std. Dev. 1 if has land title -0.481 0.101 0.191 0.393 land ownership, owed >1 acre omitted 1 if has no land 0.668 0.302 0.295 0.456 1 if has <1 acre own land 0.415 0.096 0.179 0.383 1 if uses plot rotation <1 acre -0.378 0.418 0.289 0.453 1 if uses plot rotation >1 acre -0.697 0.724 0.002 0.050 1 if uses operator rotation <1 acre -0.306 0.311 0.290 0.454 occupation of the hh head , farm laborer omitted 1 if non-farm labor -0.101 0.156 0.168 0.374 1 if government empl. -1.308 0.170 0.090 0.286 1 if private salaried empl. -0.571 0.175 0.070 0.255 1 if employed in estates -0.730 0.204 0.038 0.192 1 if petty business -0.649 0.154 0.107 0.309 1 if domestic service -0.334 0.249 0.012 0.108 1 if farmer -0.372 0.155 0.168 0.374 1 if fishermen 0.022 0.238 0.011 0.107 1 other occupations -1.447 0.671 0.003 0.057 1 if house duties only -0.345 0.156 0.064 0.244 1 if retired -0.730 0.163 0.158 0.365 1 if disabled -0.166 0.211 0.025 0.157 1 if not working -0.539 0.190 0.022 0.146 years of education -0.058 0.010 7.419 3.374 type of house, own house omitted 1 if attached house -0.152 0.146 0.047 0.211 1 if flat -0.249 0.325 0.011 0.107 1 if shanty 0.066 0.301 0.017 0.129 1 if other type of housing -0.772 0.230 0.039 0.194 type of latrine: own latrine omitted has no access to latrines 0.238 0.094 0.094 0.292 has access to comm. latrine 0.053 0.151 0.040 0.196 type of electricity used, omitted 1 if no light 0.166 0.141 0.037 0.188 1 if use kerosene for light 0.524 0.061 0.337 0.473 log household income, less Samurdhi -0.201 0.030 8.634 1.183752 constant 1.323 0.285 Source: Calculations from 1999/2000 Sri Lanka Integrated Survey