Embed Size (px)
Citation preview
Journal of Economics and Econometrics Vol. 53, No. 1, 2010 pp. 59-89
ISSN 2032-9652 E-ISSN 2032-9660
An Empirical Glimpse on MSEs Four MENA Countries
W. A. RAZZAK ABSTRACT The Economic Research Forum (ERF) produced a one-off survey of micro & small private enterprises (MSE) in a number of Middle East and North African countries (MENA). It contains sufficient information to fit a production function and additional information about the owner’s education type; the scope of the market; and the type of technology. Further, it provides information about perceived constraints to production. We test the effect of these factors on technical progress. We believe that empirical research of policy issues can help promote the making of ‘evidence-based policies’ in the MENA countries. JEL Classification: C13, C21, D24. Keywords: Micro-small Private Enterprise; Production Function; Stochastic Dominance. Weshah Razzak is an Adviser at the Arab Planning Institute. Address: 5834 Safat, 13059 Kuwait City, Kuwait. Email [email protected].
Journal of Economics and Econometrics Vol. 53, No. 1. 60
1 INTRODUCTION
The role of the MSE in development is fuzzy. The contribution to economic and employment growth, and to poverty reduction is questionable because the channels through which MSE affects growth are not well understood and empirical support for them is not at all robust. See Hallberg (2001) and Biggs (2002), and USAID report (2006) for extensive review of the literature.1
Very little is known about MSEs in the Middle East and North Africa countries (MENA) let alone empirical research in this area. Unavailability of data is probably the main problem facing researchers. The ERF published surveys for MSEs.2 We use these data to analyze factors that affect technical progress and eventually output per worker in four MENA countries, three Arabic: Egypt, Morocco, Lebanon, and Turkey. Turkey is a non-Arab country and serves as a control.
The objective is to provide information to policymakers about the factors that potentially have positive effects and those which constraint output per worker in MSEs. Also, shedding light on the relative performance, e.g., Egypt relative to Turkey, might serve as an indicator for productivity level and informs the policymakers. We hope that this paper help promotes research-based policies in the MENA countries.
The ERF data include output, capital expenditures and labour, which enable us to fit a production function to each country. As far as we know the literature on MENA countries does not have any estimates of production function for MSEs.3 Further, the data also allow us to examine: (1) the effect of the scope of the market on output per
1Whether privatising publicly-owned firms increase productivity or not is another serious policy question. Megginson and Netter (2001) is an excellent survey of this literature. There are also a few non-journal article country studies, for example, Veselka M (2005), on Taiwan; the UNCTAD report ITE/TEB/5 about Burkina Faso, Nepal, Samoa and Zambia; Smallbone et al. (2001) about Ukraine and Belarus and Centeno (2001) about Peru.
2“The country data is collected by a country team supervised by as part of ERF’s project on “Promoting Competitiveness in Micro and Small Enterprises in the MENA region” Other outputs of the project for each of the four countries include: a country report (produced as ERF Research Reports) and a policy brief that will soon be available in print and on the website.
3ERF research report series No 0420 by Semsa Ozar, reports an ad-hoc growth equation, not a production function, for Turkey’s MSE.
Weshah A. Razzak 61
worker. We test whether there are different effects on output per worker from selling output in a local market versus a regional, national or international market. (2) The survey identifies several different levels of training of the owner/manager such as formal type of education, technical or vocational training, and an apprenticeship experience. The question is whether the level of skills of the owner/manager affects output per worker. Finally, (3) Does the level of the technology used in production whether traditional, up-to-date, or new technology, affect output per worker?
The survey asks managers and owners of the firm if the followings are considered constraints: (1) securing initial capital; (2) licensing and registration procedures; (3) Labour law; (4) labour inspection; (5) labour costs; (6) meeting environmental requirements; (7) finding qualified workers; (8) retaining qualified workers; (9) availability of raw materials; (10) unutilised capacity; (11) taxes; (12) custom duties; and tax administration procedures. The answer is either a “yes” or a “no” then three levels for each question: easy, medium and high, are identified. We test the insignificance of these constraints on output per worker. Finally, to measure relative performance, we use a series of nonparametric techniques to test whether the levels of output per worker are equal across countries.
The data have shortcomings. We do not examine whether privatisation of publicly-owned firms is the right policy because we do not have data about state-owned enterprises and don’t have information about privatised previously state-owned enterprises. And, surveys used in this paper contain information for one year only. Thus, dynamic analysis of any sort is not applicable, i.e., we cannot examine factors affecting productivity and/ or TFP growth and we are restricted to examining the level of output per worker. Also, the surveys do not provide information about the strata; the primary sampling units, weights…even though they discuss the methodology. For this reason we could not control for sampling design effect.
We found significant differences between the three Arab countries, Egypt, Morocco and Lebanon on one hand, and Turkey on the other. On average, Turkey’s MSEs produce twice as much output and spend twice as much on capital investments. The level of Labour employed is also significantly higher in Turkey. The production functions might exhibit decreasing returns to scale in all Arabic countries, except for Turkey where it exhibits increasing returns. The level of education of
Journal of Economics and Econometrics Vol. 53, No. 1. 62
the owner/manager has no effect on the level of output per worker, except perhaps for Turkey. The effect of technology on production varies across countries. We found that the level of education of the owner/manager and the technology type is insignificant in the Arab countries, but not in Turkey. The effect of market scope varies across countries, but on average, has a significant positive effect on the level of productivity. Finally, we find numerous significant constraints to productivity. The constraints have more or less similar effects on production across countries.
In the next section we describe the data. In section 3 we discuss the methodology. Section 4 includes analysis and estimation results. Section 5 includes final remarks and policy issues.
2 DATA
The surveys are described and analyzed in ERF documents such as Hamdouch (2006), Hamdan (An ERF undated report number 0417) and El — Mahdi (2005) for Morocco, Lebanon and Egypt respectively.
In general, the samples include a number of regions selected to represent metropolitan and rural areas. The primary sampling units were randomly chosen. Each includes a number of primary sampling units from N geographical areas. Then the samples were classified in a number of categories according to densities. Densities were designated according to the mean of firms per building and the primary sampling units were divided into three equal groups: the lowest, medium and high. A stratified random sample of enterprises was selected from the list of enterprises within each primary sampling unit. Then a stratified random sample was selected from each density category within the primary sampling unit. Unfortunately, this information is not reported.
The firms include 1 to 50 workers, which is a typical definition of an MSE. The micro firm employs 1-9 and small firm employs 10-50 or something close to that. The enterprises cover various industries such as manufacturing, services, trade, and other sectors. They include businesses like bakeries, leather and shoemakers, barbers, etc. The surveys exclude agriculture, any non-market activity, domestic services, professionals like lawyers, doctors and accountants, mobile vendors and illegal activities.
Weshah A. Razzak 63
The usable number of observations for Egypt in this paper is 3719 observations. For Morocco we have 4388 observations in total and for Lebanon 644 observations, which is a relatively shorter sample. These samples are smaller that the total number of observations in the surveys because: (1) There are missing observations. (2) We removed double-counted observations probably entered by mistakes. (3) We removed observations with the value of zero. (4) And when a firm leaves some questions unanswered the firm is not included in our sample. (5) We removed firms, which are identified as co-operatives ad kept the private firms only. We deflated output and capital by the CPI of the year of the survey for each country.
The ERF research report series No 0418 (FEM 21-31), p. 6 says that in Egypt, MSEs sectors may account for 97 percent of all firms in Egypt; 81 percent of the informal sector, and employ 2/3 of the workers in the country. The central bureau of statistics reported that 95 percent of the firms in 1998 employ less than 50 workers, i.e., MSEs.
For Turkey we have a sample of 2951 firms. The survey was conducted over 7335 sample units (from 9280 eligible units) between June and September 2001, with a pre-test in February 2001 and a follow up in 2002. However, only 5000 interviews were completed. The sample is national in coverage and is also chosen by stratified, multi-stage systematic sampling method by the Turkish statistical institute (TURKSTAT). Nineteen provinces were firstly chosen, from strata in terms of socioeconomic development level, by weighted probability regarding the number of enterprises in each province. Secondly, 432 Primary Sampling Units, with a minimum of 45 enterprises, were selected according to the geographical areas (Urban/rural).
The survey also excludes enterprises in agriculture, non market activities, illegal activities, production for own personal use, mobile vendors, domestic services, and professional services. The usable number of observations is reduced to 2951 after excluding the number of co-operatives (leaving private firms only), deleting missing observations and null values for labour, output, and capital; and in the dummy variables. Dummy variables which describe custom duties and raw material availability were also removed due to missing values. Capital expenditures as a net asset value from inventory and cash have also some negative observations, which were deleted.
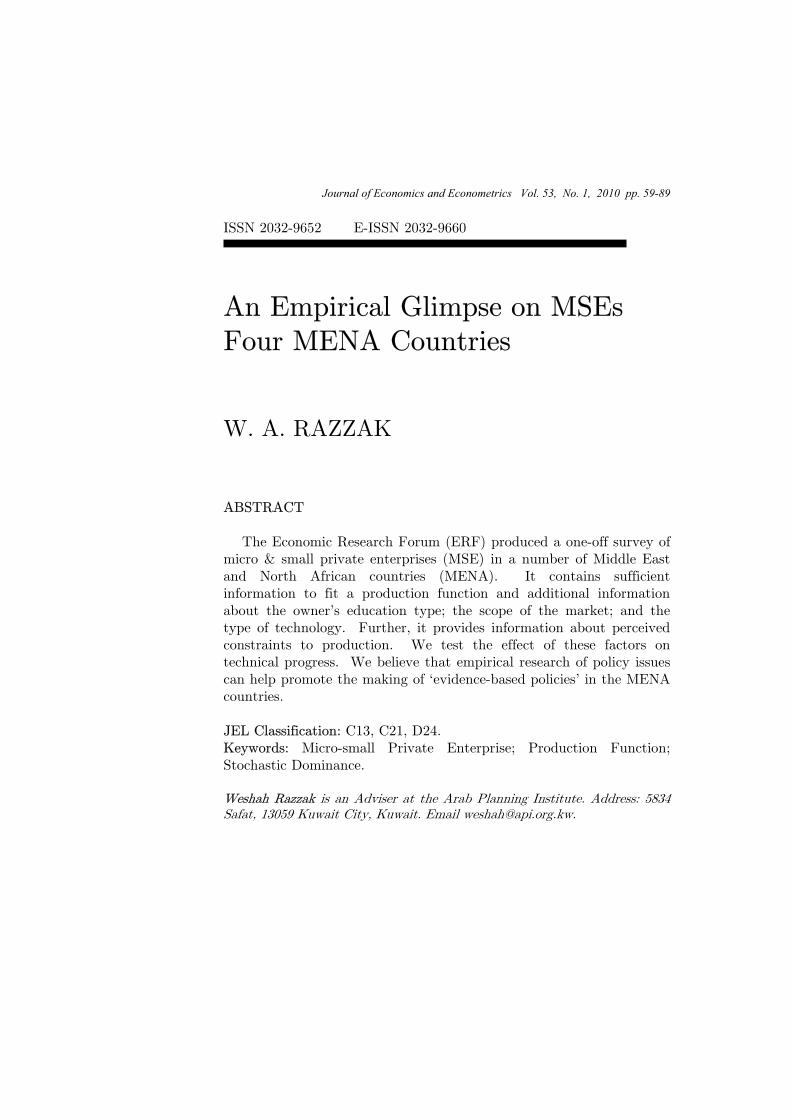
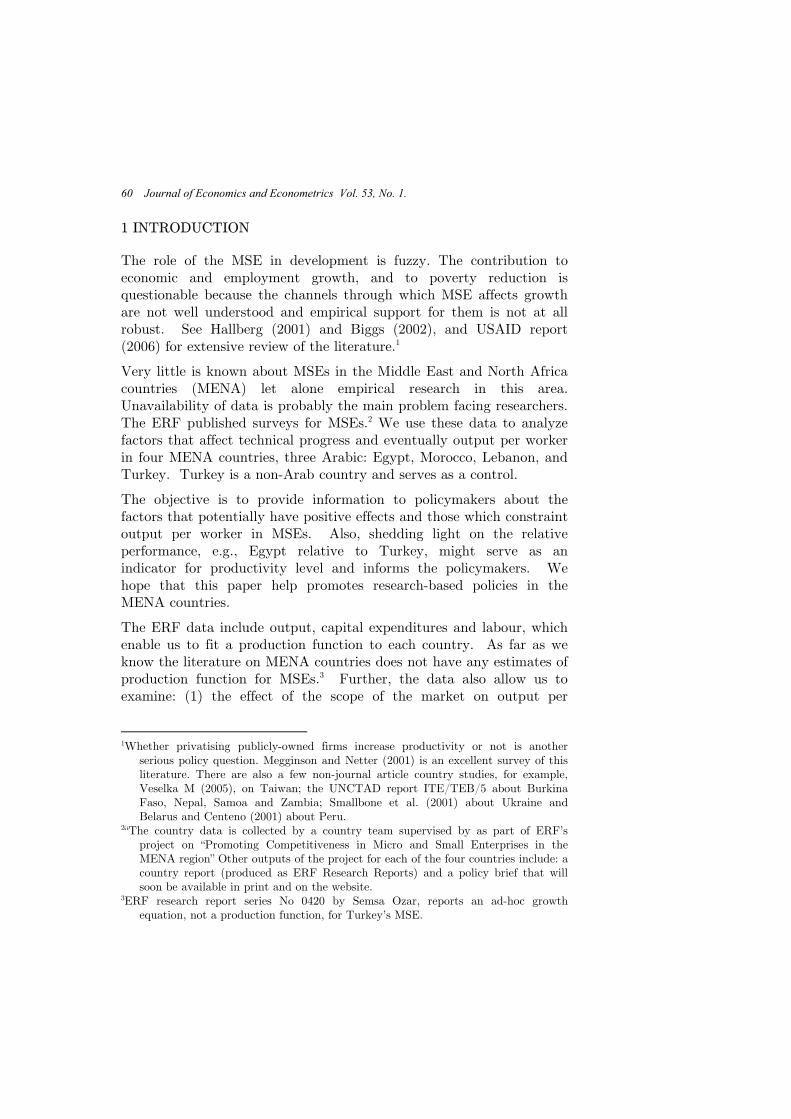
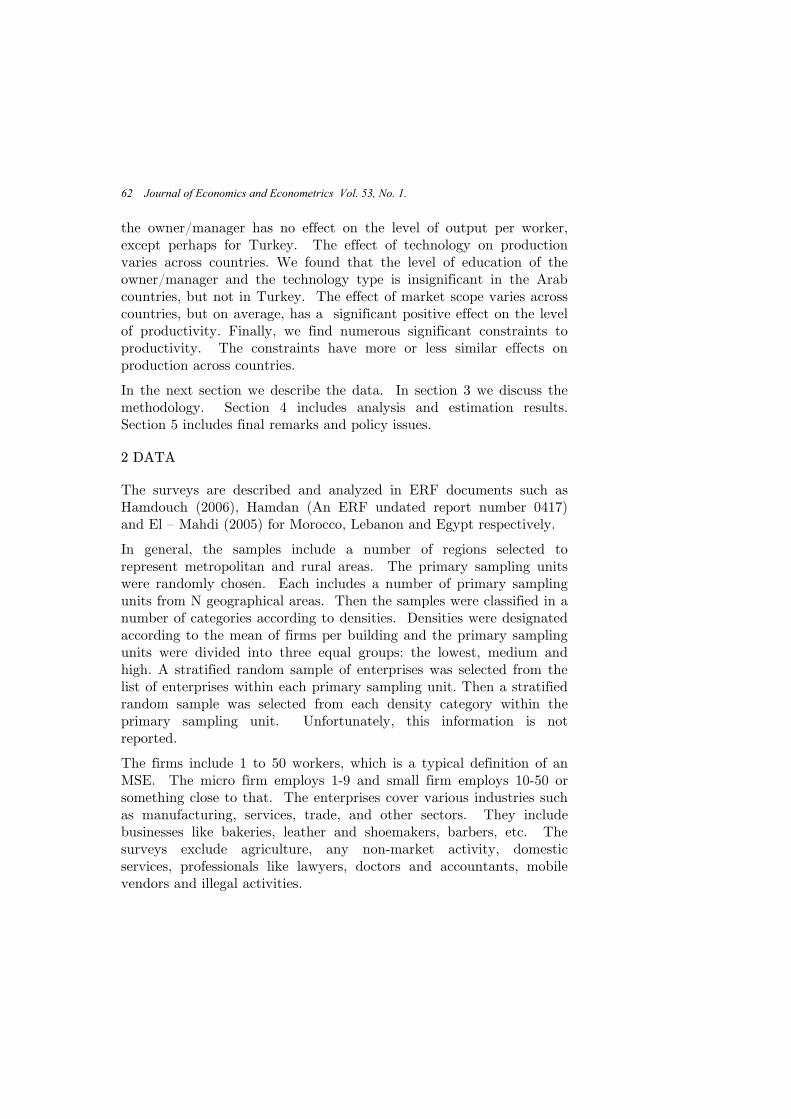
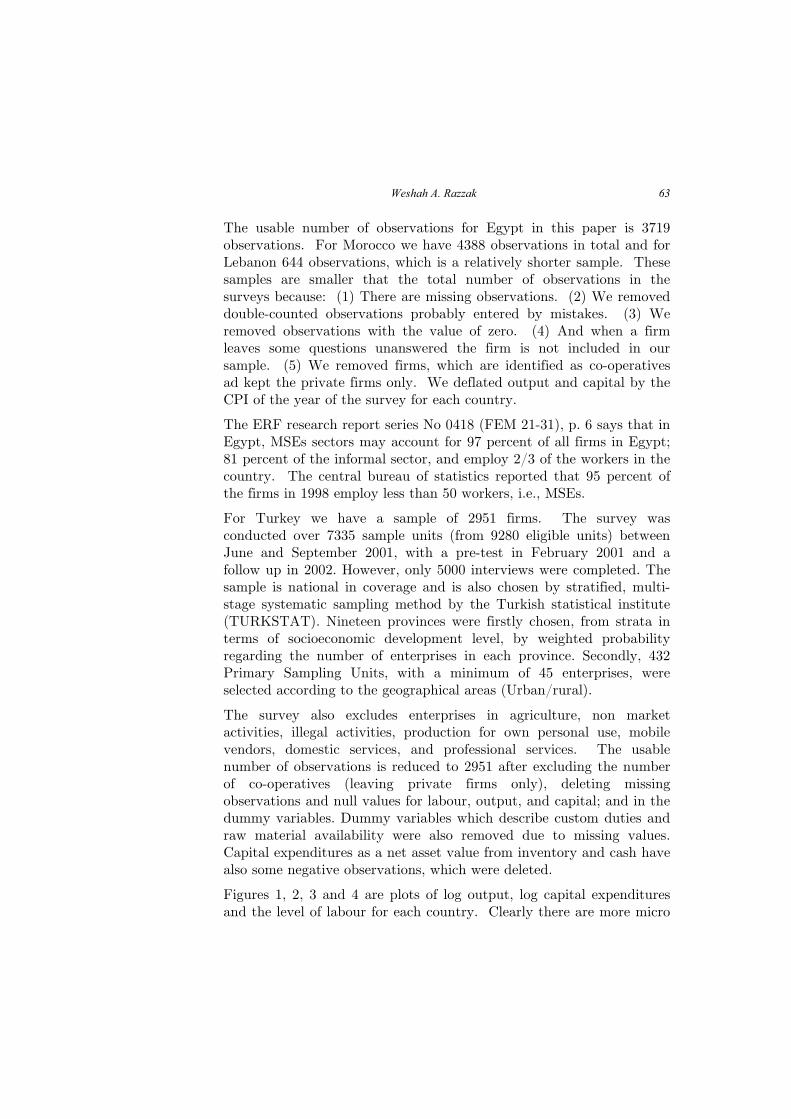
Figures 1, 2, 3 and 4 are plots of log output, log capital expenditures and the level of labour for each country. Clearly there are more micro
Journal of Economics and Econometrics Vol. 53, No. 1. 64
enterprises in the samples (up to 10 workers) than small enterprises (10-50 workers), but for Turkey there are relatively more of the latter.
Figure 1: Egypt Figure 2: Morocco
Morocco seems different from the other two countries. It seems like the data are ordered from low to high employment without any obvious reason. The number of workers increases with the number of
0
4
8
12
16
20
1000 2000 3000
Log Output
0
4
8
12
16
20
1000 2000 3000
Log Capital
0
10
20
30
40
50
1000 2000 3000
Labor
4
8
12
16
20
1000 2000 3000 4000
Log Output
0
4
8
12
16
20
1000 2000 3000 4000
Log Capital
0
10
20
30
40
50
1000 2000 3000 4000
Labor
Weshah A. Razzak 65
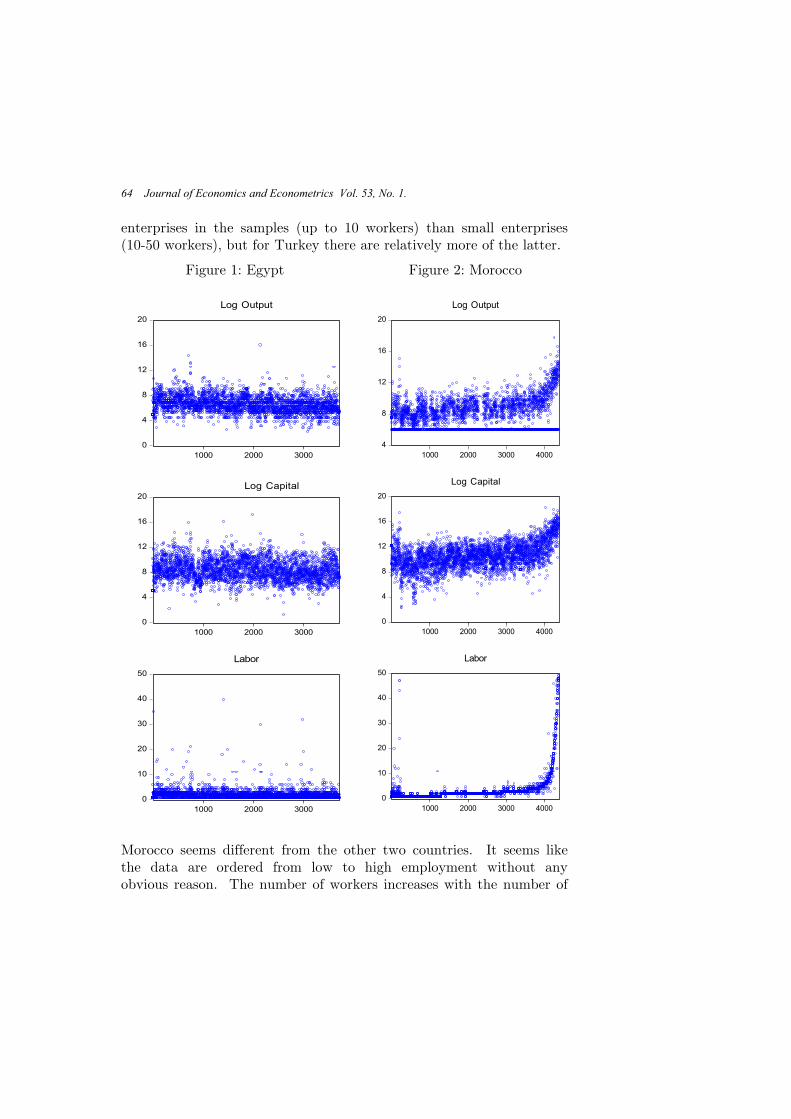
firms on the horizontal axis, and relatively speaking, there are more small size firms than micro firms.
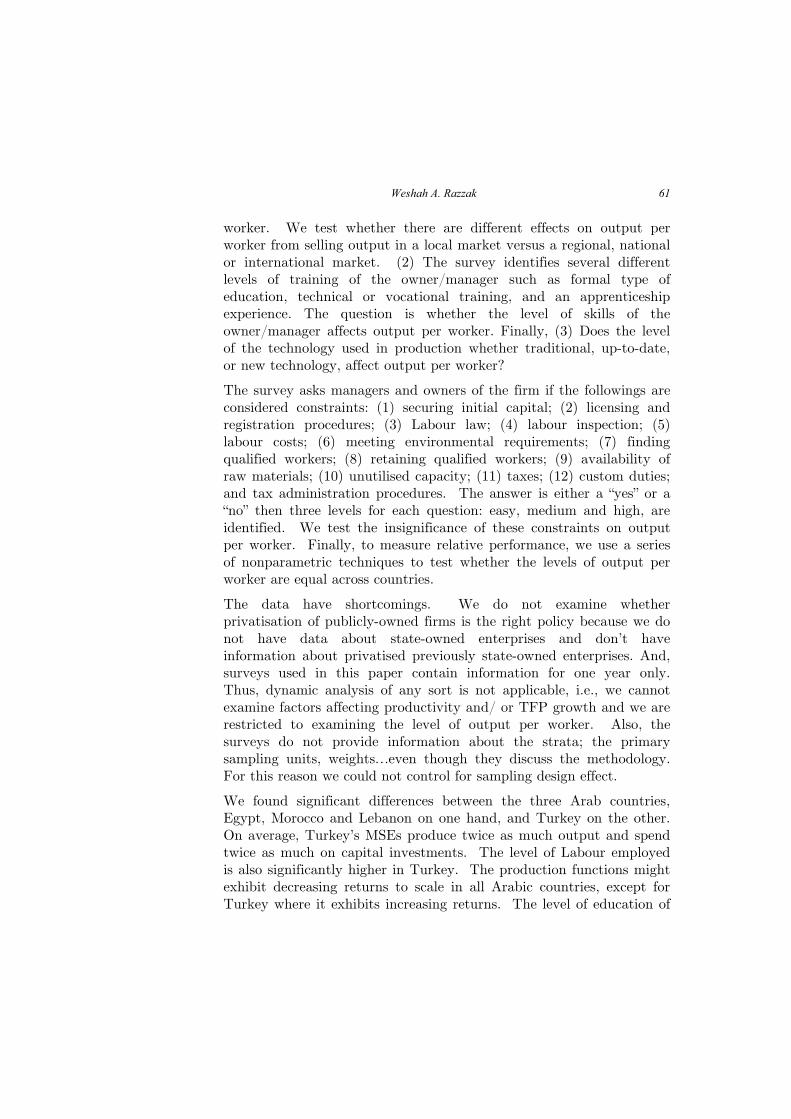
Figure 3: Lebanon Figure 4: Turkey
Log Output
Log Capital Expenditures
Labor
The percentage of firms with one worker is 34.1 percent in Egypt, 24.1 percent in Morocco, 47.6 percent in Lebanon and 15.8 percent in Turkey. Liedholm and Mead (1999) say that productivity seems to increase with the number of employed workers; firms with one worker are less productive than firms with 5 or 10. Although our results seem
4
6
8
10
12
14
100 200 300 400 500 600
Log Output
0
4
8
12
16
100 200 300 400 500 600
Log Capital
0
10
20
30
40
50
100 200 300 400 500 600
Labor
6
8
10
12
14
16
18
20
22
0 1,000 2,000 3,000
4
8
12
16
20
24
0 1,000 2,000 3,000
0
10
20
30
40
50
0 1,000 2,000 3,000
Journal of Economics and Econometrics Vol. 53, No. 1. 66
to be only partially consistent with that. Turkey MSEs are most productive, but Morocco's MSEs are less productive than Egypt and Lebanon despite the fact that the percentage of one-worker firms is relatively smaller.
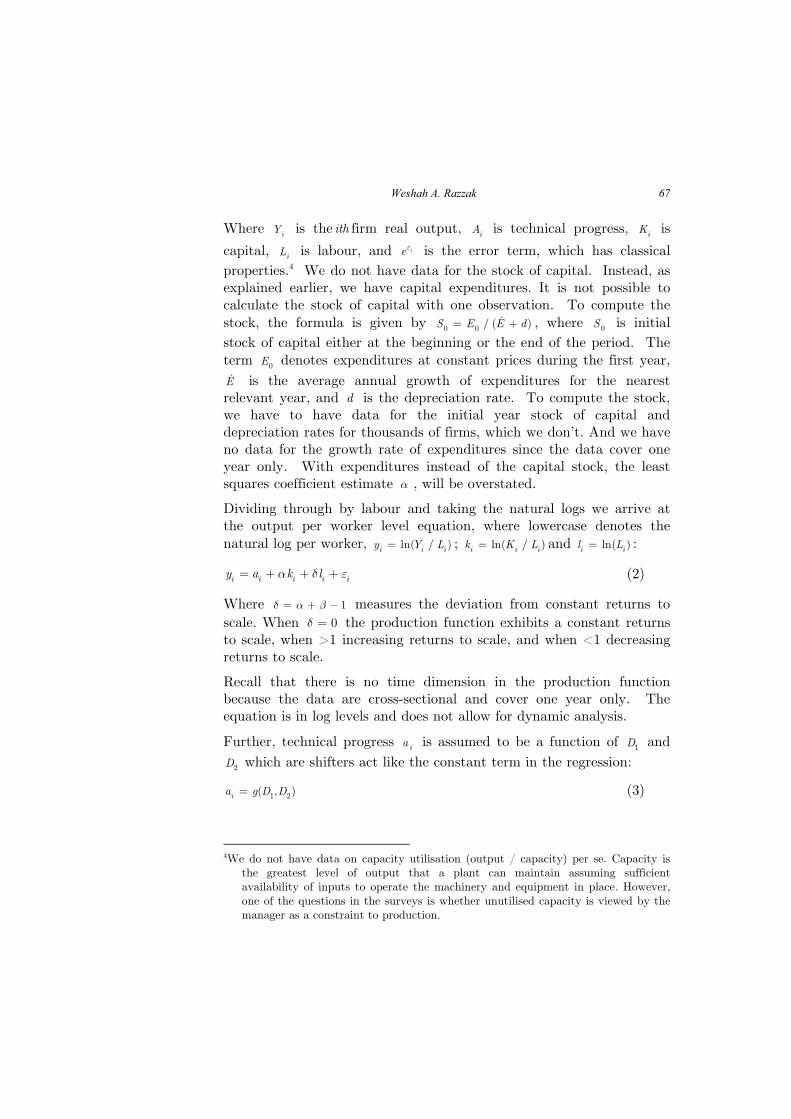
Table 1 Descriptive statistics
Egypt Morocco Output Capital Labour Output Capital Labour Mean 6.6 8.41 0.62 7.75 10.53 0.85 Median 6.6 8.29 0.69 7.57 10.48 0.69 Std. Dev. 1.31 1.66 0.54 1.94 2.07 0.74 Skewness 0.28 0.26 0.64 0.83 0.00 1.41Kurtosis 4.2 3.38 3.93 3.38 4.02 6.02 Jarque-Bera 272.4 67.2 392 540.3 192.01 3130 Probability 0.000 0.000 0.000 0.000 0.0000 0.000 Observations 3719 3719 3719 4388 4388 4388 Lebanon Turkey Output Capital Labour Output Capital Labour Mean 7.48 9.56 0.56 13.07 15.28 1.09Median 7.51 9.82 0.69 13.02 15.17 1.09 Std. Dev. 1.27 1.69 0.67 1.42 2.00 0.76Skewness 0.16 -0.73 1.40 0.22 0.009 0.67Kurtosis 4.93 4.71 5.29 3.81 2.89 3.50Jarque-Bera 103.9 136.3 352 105.5 1.47 257.6Probability 0.000 0.000 0.000 0.000 0.47 0.000Observations 644 644 644 2951 2951 2951Notes: All variables are in natural logarithms.
Table 1 reports descriptive statistics. The means of output, capital expenditures and labour look similar for the three Arab countries and smaller than Turkey. On average, the moments are almost unchanged when we removed a couple of larger firms, firms with large output and capital. The Jarque-Bera is significant, except for, Turkish capital expenditures. it indicates non-normality, which we will be dealing with when we get to the regression analysis later.
3 METHODOLOGY
The Cobb-Douglas is a sensible and simple initial technology to use. We Test the Cobb-Douglas production function, which is given by:
ii i i iY A K L e�� �� (1)
Weshah A. Razzak 67
Where iY is the ith firm real output, iA is technical progress, iK is
capital, iL is labour, and ie� is the error term, which has classical properties.4 We do not have data for the stock of capital. Instead, as explained earlier, we have capital expenditures. It is not possible to calculate the stock of capital with one observation. To compute the stock, the formula is given by 0 0 / ( )S E E d� �� , where 0S is initial stock of capital either at the beginning or the end of the period. The term 0E denotes expenditures at constant prices during the first year, E� is the average annual growth of expenditures for the nearest relevant year, and d is the depreciation rate. To compute the stock, we have to have data for the initial year stock of capital and depreciation rates for thousands of firms, which we don’t. And we have no data for the growth rate of expenditures since the data cover one year only. With expenditures instead of the capital stock, the least squares coefficient estimate � , will be overstated.
Dividing through by labour and taking the natural logs we arrive at the output per worker level equation, where lowercase denotes the natural log per worker, ln( / )i i iy Y L� ; ln( / )i i ik K L� and ln( )i il L� :
i i i i iy a k l� � �� � � � (2)
Where 1� � �� � � measures the deviation from constant returns to scale. When 0� � the production function exhibits a constant returns to scale, when >1 increasing returns to scale, and when <1 decreasing returns to scale.
Recall that there is no time dimension in the production function because the data are cross-sectional and cover one year only. The equation is in log levels and does not allow for dynamic analysis.
Further, technical progress ia is assumed to be a function of 1D and
2D which are shifters act like the constant term in the regression:
1 2( , )ia g D D� (3)
4We do not have data on capacity utilisation (output / capacity) per se. Capacity is the greatest level of output that a plant can maintain assuming sufficient availability of inputs to operate the machinery and equipment in place. However, one of the questions in the surveys is whether unutilised capacity is viewed by the manager as a constraint to production.
Journal of Economics and Econometrics Vol. 53, No. 1. 68
1D is a set of dummy variables. It includes (1) market scope (local, regional, national and international); (2) the manager’s skills level (formal training, vocational and an apprenticeship experience; and (3) the level of technology (traditional, up-to-date, and new). (4) Access to business support. Each dummy takes a value of 1 if the answer is yes and zero otherwise. For example, the manager is asked whether the scope of the market is local. If the answer is yes the dummy takes a value of 1 if not, zero.
The dummy 2D is a set of additional dummy variables that capture the constraints to the production process. These dummy variables are: (1) securing initial capital; (2) licensing and registration procedures; (3) labour law; (4) labour inspection; (5) labour cots; (6) meeting environmental requirements; (7) finding qualified workers; (8) retaining qualified workers; (9) availability of raw materials; (10) unutilised capacity; (11) strong domestic competition from micro enterprises; (12) strong domestic competition from small enterprise; (13) strong domestic competition from large enterprise; (13) strong competition from imports; (14) financial services; (15) other business support services; (16) tax rates; (17) custom duties; and (18) tax administration procedures. Managers are asked if yes or no, and if the answer is YES is the effect easy, medium or high. We design 3 dummy variables: easy, medium and high. The dummy will have a value of 1 for yes and 0 otherwise.
With dummy variables, we estimate:
1 2tani i i iy cons t k l D D� � �� � � � � � (4)
We estimate the regression using Least Squares and the variance-covariance matrix is heteroscedacticity-corrected using the Huber-White and the Newey-West methods.5 The estimated coefficients will be interpreted as averages across all firms. We will also report 1000 repetitions bootstrapped standard errors because of the expected non-normality of residuals we mentioned earlier.
For each constraint, the dummy variables (easy, medium and high) are not correlated. But overall, dummy variables maybe correlated, e.g., dummy for ‘securing initial capital’ and a dummy for ‘taxes’ maybe
5We cannot use other estimators such as GMM because of lack of instruments. Lags cannot be used either because we a cross sectional data with no time dimension.
Weshah A. Razzak 69
correlated. When the dummy variables are perfectly correlated, 1X X�� of the least squares method cannot be computed. Fitting all the dummy variables is not possible. We use a forward stepwise regression. We begin the regression with ln lnk l� and lnl as regressors then we add the set of dummy variables. We begin with 1D : type of technology; type of education of managers; and the scope of the market. We then use F test to test whether each group is significant, i.e., whether for example traditional technology, up-to-date technology and new technology dummy variables are zero. If not, we keep them. We also check the t statistics. We only keep the significant dummy variables. Then we begin by adding three dummy variables at the time from the set 2D . For example, we add tax dummy: easy, medium
and high. If 1X X�� is computable we check the F and t tests. If 1X X�� is not computable, we find and drop the one dummy that causes the singularity and check the rest usingF and t tests. We carry on by adding the next dummy variables from 2D , e.g., ‘securing initial
capital’ (easy, medium, and high). If 1X X�� is computable we check the F and t tests. If 1X X�� is not computable, we find and drop the one dummy that causes the singularity of XX� keeping all previously checked dummy variables unchanged. Normally one dummy variable can cause the singularity of XX� . Then we use F and t tests to check the remaining dummy variables.
Finally, we use nonparametric methods to compare the level of output per worker across the firms and across the countries, i iy l� . We use a variety of tests to test the null hypothesis that the distribution of log output per worker of each of the three Arab countries is equal to the distribution of log output per worker in Turkey.
We choose three nonparametric tests. The first test is the Wilcoxon (1945) Rank Sum test, which is also known as the Mann-Whitney (1947) two-sample statistic. It is a test for assessing whether two samples come from the same distribution. The null hypothesis is that the two samples are drawn from a single population, and therefore their probability distributions are equal. It requires the two samples to be independent, and the observations to be ordinal or continuous measurements, i.e. one can at least say, of any two observations, which is the greater. This test is one of the best-known non-parametric significance tests. It was proposed initially by Wilcoxon (1945), for equal sample sizes, and extended to arbitrary sample sizes and in other
Journal of Economics and Econometrics Vol. 53, No. 1. 70
ways by Mann and Whitney (1947). MWW is virtually identical to performing an ordinary parametric two-sample t test on the data after ranking over the combined samples.6
In general, let 1, mX X� be iid with any distribution function ( )F x , and
1 mY Y� are iid with any distribution function ( )G x . The null hypothesis
is 0 : ( ) ( ), ( , )H F x G x each x� � ��� . However, it is trickier when it comes
to the alternative hypothesis just like the literature on stochastic dominance because the alternative hypothesis could be take different forms. One possible and common form is to assume a shift model like ( ) ( )G x F x� �� , and then the alternative hypothesis is written in terms
of� , as 1 : 0H � . Another version is 2 : ( ) ( ), ( , )H F x G x each x � ���
and with a strict inequality for at least one x . G is said to be stochastically larger thanF . 2H is a larger class of alternatives because
1( , )F G H� implies 2( , )F G H� . The other alternative in terms of Mann — Whitney statistic is 3 : 1 / 2XYH � . These large alternatives regarding the Wilcoxon Rank Sum test are well-documented in the literature, see Randles and Wolfe (1979, p. 130-132).
The second test is the Pearson test, Anderson (1996). It is a nonparametric K-sample test on the equality of median. It tests the null hypothesis that K samples were drawn from populations with the same median. In the case of two samples, the test statistic is distributed chi-squared and calculated with and without a continuity correction. We report only one statistic; fewer more statistics are calculated, but they are not reported because they have the same p values.
6For two independent samples 1, mX X� and 1 nY Y� , Wilcoxon (1945) introduced the linear
rank statistic 1
N
ii m
W R� �
� � where 1 NR R� are the joint rankings of 1 1( , )m nZ X X Y Y �� � � and
N m n� � . Mann and Whitney (1947) proposed the equivalent statistic
1 1
( ),m n
YX j ii j
W I Y X� �
� �� � where I is the indicator function. When there are no ties,
( 1) / 2YXW mn n n W� � � � . There are other versions such as1 1
( ),m n
XY j ii j
W I Y X� �
� � � where
( 1) / 2XYW W n n� � � . Using this latter version, the U statistic estimator 1 1( )XY PY X� � is
1 1
1( )
m nXY
XY j ii j
WI Y X
mn mn�
� �
� � �� . In the presence of ties, the U statistic is modified by
adding ( ) / 2j iI Y X� .
Weshah A. Razzak 71
The third test is the Kolmogorov-Smirnov, which is a well known non-parametric test to test for the equality of distributions. Rejection of the null by this test is probably an indication of the weakness of this test in cases where there are differences in the tail of the distributions. However, it is very powerful for the alternatives that involve clustering in the data.7
Wagner (2006) uses the above mentioned tests to test for first-order stochastic dominance. We are interested in ranking by rejecting the null hypothesis of equality of the distributions. Note that we do not disaggregate by sectors, regions or by micro versus small firms. We do not do that to avoid repetition. The results we will report next are interpreted as averages across firms.
4 RESULTS
4.1 Regression results
A major concern for estimating the production function using survey data is to control of survey design effects. The surveys, as explained earlier were done on stratified samples by industry and geographical areas. However, the published data do not report information about the strata, primary sampling units etc. so we could not use the subcommand ‘svy’ in STATA to run regressions.
Table 2 reports the least squares regression results of equations 2 and 4. The first column lists the explanatory variables. The second and
7The Kolmogorov-Smirnov statistics is (Kolmogorov (1933) and Smirnov (1939), Conover (1999) is not very powerful against differences in the tails of the distributions. It is, however, very powerful for alternative hypotheses that involve clustering in the data. The statistics to evaluate directional hypotheses are
�max ( ) ( )x
D F x G x� � � and �min ( ) ( )x
D F x G x� � � , where ( )F x and ( )G x are the empirical
distribution functions for the sample that we are comparing. The combined statistic is max(| |,| |)D D D� �� . The p value for this statistic can be obtained by evaluating the asymptotic limiting distribution. Let 1n be the sample size for the first sample and 2n is the sample for the second sample. Smirnov (1939) shows that
� 1 2
1 2
1 2 21 2 1 2, 1
lim Pr / ( 1 2 ( 1) exp( 2 )in nn n i
n n n n D z i z�
�
�� �
� � � � � �� . The first five terms form the
approximation aP used in the calculation (see STATA reference book). The exact p value is calculated by a counting algorithm (Gibbons (1971, p. 27-131). A corrected p value was obtained by modifying the asymptotic p value using a numerical approximation technique 1
1 2 1 2 1 2 1 2( ) 1.04 / min( , ) 2.09 / max( , ) 1.35 / ( )aZ P n n n n n n n n�� � � � � � and p value = ( )Z� , where � is the cumulative normal distribution function.
Journal of Economics and Econometrics Vol. 53, No. 1. 72
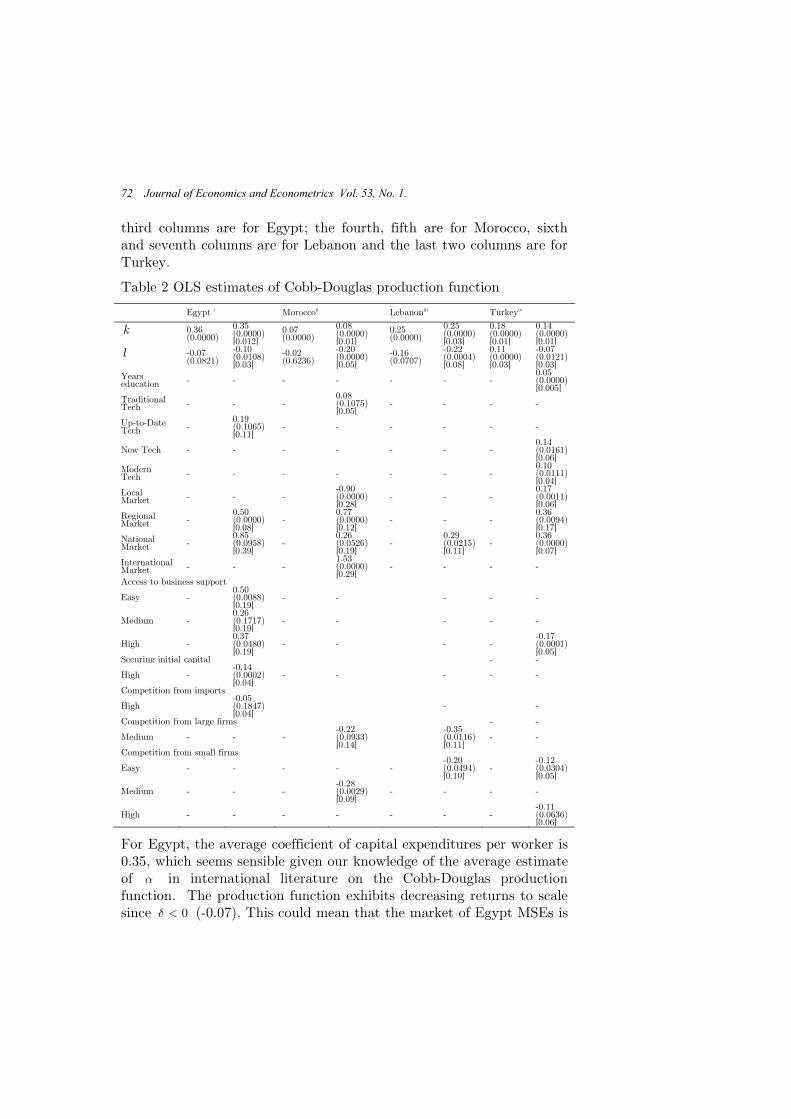
third columns are for Egypt; the fourth, fifth are for Morocco, sixth and seventh columns are for Lebanon and the last two columns are for Turkey.
Table 2 OLS estimates of Cobb-Douglas production function
Egypt i Moroccoii Lebanoniii Turkeyiv
k 0.36 (0.0000)
0.35 (0.0000) [0.012]
0.07 (0.0000)
0.08(0.0000) [0.01]
0.25 (0.0000)
0.25(0.0000) [0.03]
0.18(0.0000) [0.01]
0.14(0.0000) [0.01]
l -0.07 (0.0821)
-0.10 (0.0108) [0.03]
-0.02 (0.6236)
-0.20(0.0000) [0.05]
-0.16 (0.0707)
-0.22(0.0004) [0.08]
0.11(0.0000) [0.03]
-0.07(0.0121) [0.03]
Years education - - - - - - -
0.05(0.0000) [0.005]
Traditional Tech - - -
0.08(0.1075) [0.05]
- - - -
Up-to-Date Tech -
0.19 (0.1065) [0.11]
- - - - - -
New Tech - - - - - - - 0.14(0.0161) [0.06]
Modern Tech - - - - - - -
0.10(0.0111) [0.04]
Local Market - - -
-0.90(0.0000) [0.28]
- - - 0.17(0.0011) [0.06]
Regional Market -
0.50 (0.0000) [0.08]
- 0.77(0.0000) [0.12]
- - - 0.36(0.0094) [0.17]
National Market -
0.85 (0.0958) [0.39]
- 0.26(0.0526) [0.19]
- 0.29(0.0215) [0.11]
- 0.36(0.0000) [0.07]
International Market - - -
1.53(0.0000) [0.29]
- - - -
Access to business support
Easy - 0.50 (0.0088) [0.19]
- - - - -
Medium - 0.26 (0.1717) [0.19]
- - - - -
High - 0.37 (0.0480) [0.19]
- - - - -0.17(0.0001) [0.05]
Securing initial capital - -
High - -0.14 (0.0002) [0.04]
- - - - -
Competition from imports
High -0.05 (0.1847) [0.04]
- -
Competition from large firms - -
Medium - - - -0.22(0.0933) [0.14]
-0.35(0.0116) [0.11]
- -
Competition from small firms
Easy - - - - - -0.20(0.0494) [0.10]
- -0.12(0.0304) [0.05]
Medium - - - -0.28(0.0029) [0.09]
- - - -
High - - - - - - - -0.11(0.0636) [0.06]
For Egypt, the average coefficient of capital expenditures per worker is 0.35, which seems sensible given our knowledge of the average estimate of � in international literature on the Cobb-Douglas production function. The production function exhibits decreasing returns to scale since 0� � (-0.07). This could mean that the market of Egypt MSEs is
Weshah A. Razzak 73
quite small and costly because it needs more than doubling of factor inputs to double output; or it could mean that average MSE in Egypt consistently prices output below marginal cost.
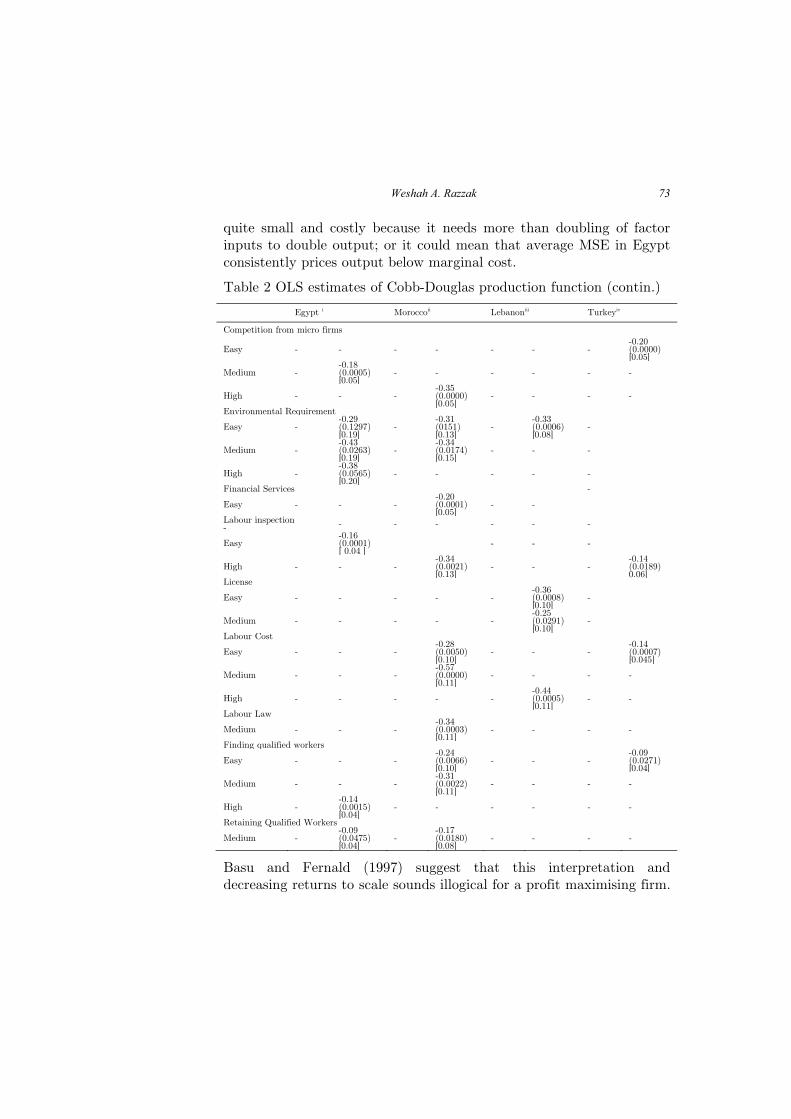
Table 2 OLS estimates of Cobb-Douglas production function (contin.)
Egypt i Moroccoii Lebanoniii Turkeyiv
Competition from micro firms
Easy - - - - - - - -0.20 (0.0000) [0.05]
Medium - -0.18(0.0005) [0.05]
- - - - - -
High - - - -0.35(0.0000) [0.05]
- - - -
Environmental Requirement
Easy - -0.29(0.1297) [0.19]
- -0.31(0151) [0.13]
- -0.33(0.0006) [0.08]
-
Medium - -0.43(0.0263) [0.19]
- -0.34(0.0174) [0.15]
- - -
High - -0.38(0.0565) [0.20]
- - - - -
Financial Services -
Easy - - - -0.20(0.0001) [0.05]
- -
Labour inspection - - - - - - -
Easy -0.16(0.0001) [ 0.04 ]
- - -
High - - - -0.34(0.0021) [0.13]
- - - -0.14 (0.0189) 0.06]
License
Easy - - - - - -0.36(0.0008) [0.10]
-
Medium - - - - - -0.25(0.0291) [0.10]
-
Labour Cost
Easy - - - -0.28(0.0050) [0.10]
- - - -0.14 (0.0007) [0.045]
Medium - - - -0.57(0.0000) [0.11]
- - - -
High - - - - - -0.44(0.0005) [0.11]
- -
Labour Law
Medium - - - -0.34(0.0003) [0.11]
- - - -
Finding qualified workers
Easy - - - -0.24(0.0066) [0.10]
- - - -0.09 (0.0271) [0.04]
Medium - - - -0.31(0.0022) [0.11]
- - - -
High - -0.14(0.0015) [0.04]
- - - - - -
Retaining Qualified Workers
Medium - -0.09(0.0475) [0.04]
- -0.17(0.0180) [0.08]
- - - -
Basu and Fernald (1997) suggest that this interpretation and decreasing returns to scale sounds illogical for a profit maximising firm.
Journal of Economics and Econometrics Vol. 53, No. 1. 74
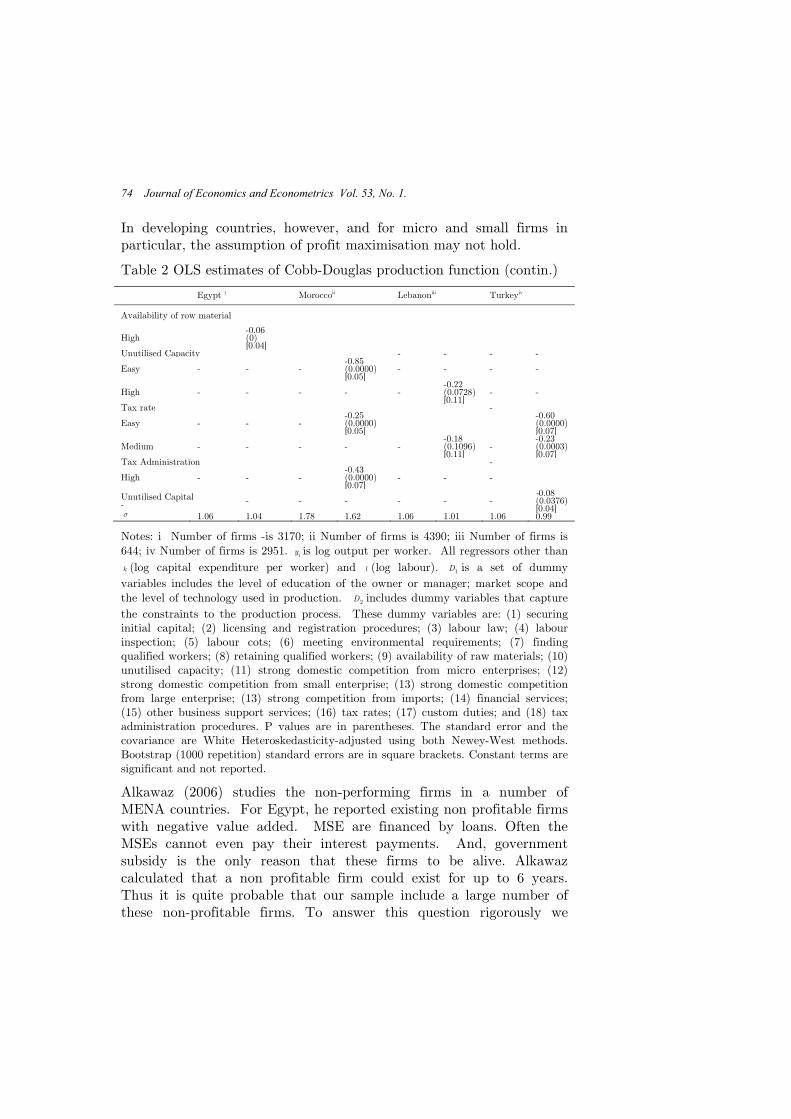
In developing countries, however, and for micro and small firms in particular, the assumption of profit maximisation may not hold.
Table 2 OLS estimates of Cobb-Douglas production function (contin.)
Egypt i Moroccoii Lebanoniii Turkeyiv
Availability of row material
High -0.06 (0) [0.04]
Unutilised Capacity - - - -
Easy - - - -0.85(0.0000) [0.05]
- - - -
High - - - - - -0.22(0.0728) [0.11]
- -
Tax rate -
Easy - - - -0.25(0.0000) [0.05]
-0.60(0.0000) [0.07]
Medium - - - - - -0.18(0.1096) [0.11]
- -0.23(0.0003) [0.07]
Tax Administration -
High - - - -0.43(0.0000) [0.07]
- - -
Unutilised Capital - - - - - - -
-0.08(0.0376) [0.04]
� 1.06 1.04 1.78 1.62 1.06 1.01 1.06 0.99
Notes: i Number of firms -is 3170; ii Number of firms is 4390; iii Number of firms is 644; iv Number of firms is 2951. iy is log output per worker. All regressors other than k (log capital expenditure per worker) and l (log labour). 1D is a set of dummy variables includes the level of education of the owner or manager; market scope and the level of technology used in production. 2D includes dummy variables that capture the constraints to the production process. These dummy variables are: (1) securing initial capital; (2) licensing and registration procedures; (3) labour law; (4) labour inspection; (5) labour cots; (6) meeting environmental requirements; (7) finding qualified workers; (8) retaining qualified workers; (9) availability of raw materials; (10) unutilised capacity; (11) strong domestic competition from micro enterprises; (12) strong domestic competition from small enterprise; (13) strong domestic competition from large enterprise; (13) strong competition from imports; (14) financial services; (15) other business support services; (16) tax rates; (17) custom duties; and (18) tax administration procedures. P values are in parentheses. The standard error and the covariance are White Heteroskedasticity-adjusted using both Newey-West methods. Bootstrap (1000 repetition) standard errors are in square brackets. Constant terms are significant and not reported.
Alkawaz (2006) studies the non-performing firms in a number of MENA countries. For Egypt, he reported existing non profitable firms with negative value added. MSE are financed by loans. Often the MSEs cannot even pay their interest payments. And, government subsidy is the only reason that these firms to be alive. Alkawaz calculated that a non profitable firm could exist for up to 6 years. Thus it is quite probable that our sample include a large number of these non-profitable firms. To answer this question rigorously we
Weshah A. Razzak 75
require employee-employer-linked data to shed light on after-tax profits.8
Regarding the dummy set 1D , we found that the level of education of the owner / manager and technology types do not seem to have significant positive effects on productivity. Up-to-date technology type is significant at the 10 percent level only.
Firms selling their products in local and international markets do not seem to add anything to productivity. The dummy variables that capture local and international markets are insignificant and hence dropped out of the regression. Selling in regional and national markets seems to increase the level of output per worker quite significantly. The sizes of these coefficients are big, 0.50 and 0.85. One interpretation is that MSEs products are likely to appeal to regional and national Egyptian households.
Producers probably receive feedbacks from buyers to improve these products. Access to business support also seems beneficial. All three levels, easy, medium and high seem to affect productivity in a positive way.
The significant dummy variables that represent constraints, i.e., have negative effects are: securing initial capital (access to credit); competition from imports; competition from other micro firms; environmental requirements; labour inspection; and finding and retaining qualified workers. The other constraints (licensing and registration procedures; labour law; availability of raw materials; unutilised capacity; taxes; custom duties; and tax administration procedures) have no significant effect. We do not report them to save space. The literature considers the inability to secure initial capital or credit constraint as a rational for government interventions because this is considered to be a case of a market failure.
Competition from imports has been cited in this literature as a problem to MSE. We do not consider ‘competition from other MSE’ as a constraint to productivity because competition is an important determinant of efficiency. Weak MSE will exit. Efficient MSE will stay, and might have a future.
8A negative coefficient on log labour in the regression might be interpreted as ‘labour surplus’. It means that adding more labour to existing capital has reached a point of decreasing productivity.
Journal of Economics and Econometrics Vol. 53, No. 1. 76
Note, however, that the magnitude of the environmental requirement dummy is very large. These requirements must be stiff such that MSEs find them costly and compliance seems to adversely affect output per worker. Labour inspection also seems to be adversely affecting output per worker. We do not have details on the nature of inspection, but child labour is widespread in the MENA countries.9 When MSE firms are shutdown because of violations of the child labour or the environmental laws, output and productivity plummet. We believe that the policymakers should study the reasons for these negative effects and fix them if there is an interest in promoting MSEs. The coefficient of k , and l seem very stable across regressions. Recall that we use a forward stepwise regression method; the estimated � and � remain stable as we add more dummies to the regressions.
For Morocco, the average coefficient of capital expenditures per worker is relatively small, 0.07. We do not have sufficient amount of information to explain why this coefficient is small. Just like Egypt, the production function exhibits decreasing returns to scale, which has the same interpretations as before. And, just like Egypt, the education of the manager does not seem to matter for output per worker. Traditional technology though has a positive effect, but not other technologies. This is most likely reflecting the nature of the products, which are most likely traditional. Again, Alkawaz (2006) report reasons for non-performing firms in Morocco similar to those of Egypt, where average years of non-performance exceeds 6 years; thus existing non-profitable firms. And, one robust and significant factor across different methods is ‘balance sheet problems.’
9UNICEF publishes numbers about child labour in Egypt. We found some information on the Internet, which we cannot fully reference. Nevertheless, they give an idea about this problem, and they make sense. There are around 11 million children in Egypt. There are 2 to 2.5 million children ages 6 to 15 are working. Approximately 78 percent work in the countryside. Most of them are females. There are 1 to 1.5 million children are employed in agriculture particularly. Between 12 to 14 percent of children in Egypt aged 6-14 are working, part and fulltime. Approximately 21.9 percent of children aged 10-14 are working. Children under 15 comprise 7 percent of total workforce in Egypt. In rural areas, more than 40 percent of children under 14 are working. In urban areas, 16.5 percent of children under 14 are working. Of all working children, 84 percent live in rural areas. Boys make up 29 percent of the child labour force; girls make up 71 percent. Approximately 12 percent of Egyptian households have working children. About 65 percent of child workers are still enrolled in school; 16 percent dropped out and 19 percent never attended. Child worker earns, on average, 1/4 -1/3 of an adult wage. And finally, 22 to 30 percent of the family income is derived from child labour.
Weshah A. Razzak 77
Like Egypt, selling in local markets adversely affects output per worker. Selling in regional, national and international markets, on the other hand, have significant positive effects on output per worker with the coefficient estimates of the international market dummy the largest, 1.53. Razzak (2009) reported that more than 75 percent of Morocco’s exports are destined for Europe.
Moroccan MSEs face fewer more constraints than the Egyptian’s. Competition from large and small firms and from micro firms has negative effect on output per worker. This competition is likely to be an important determinant of efficiency.
Adhering to environmental requirements and labour inspections yields negative effects as explained earlier. Child labour is a serious problem in Morocco just like it is in Egypt.10 Labour and environmental inspectors probably shutdown firms in case of violation sending production to zero.
Unlike Egypt, financial services; labour cots; labour law; unutilised capacity; tax rates; and tax administration have negative effects on output per capita with unutilised capacity having the largest coefficient. Alkawaz (2006) also suggested that “unutilised capacity” is a factor explaining non-performing firms in many Arab countries including Morocco.
On average, small firms are adversely affected by the quality of labour in Morocco. A number of small firms, which produce traditional products, cannot find skilled workers. Retaining these skilled workers is also a significant constraint that adversely affects productivity. One would expect many of the traditional goods and services to suffer when the country is modernising. Technical change in some sectors will impose increasing costs on the traditional and unchanging good and services sector. MSEs also face high costs. Thus, traditional goods and services which have elastic demand curves will either disappear or shrink. When the price goes up people substitute for new, perhaps imported, goods and services; and the traditional industries are
10Lahlou (2008) and the US Department of Labour (2004). Lahlou finds that males dominate the list of child labour. In 1994, 65.5 percent of the population under age 15, are male child workers. Like Egypt they concentrate in rural areas, 88.6 percent of all child workers. One hundred percent of children workers between age 7 and 17 are uneducated. By the end of 1999, the number of children age 7 and 15 who were working in Morocco reached 1.2 millions.
Journal of Economics and Econometrics Vol. 53, No. 1. 78
destroyed eventually. The only hope for MSEs to survive is to increase productivity, Baumol (1967).
Because ‘securing initial capital’ is an important constraint to MSEs, and because we could not find it to be significant in the case of Morocco, we re-estimated the production function with the three dummy variables that represent access to initial capita alone without any other dummy. When we have all three dummy variables (east, medium and high) we fail to invert the product matrixXX� . Only the medium dummy is found to be significant, but significance disappears when all other dummy variables are incorporated.
For Lebanon, The average coefficient of capital expenditures per worker is 0.25. It is slightly smaller than Egypt’s. The estimated �<0, so we interpret that the same way we interpreted Egypt and Morocco’s production functions. Just like Egypt and Morocco we found no effect from the type of the education level of the manager on output per worker. Further, in Lebanon technology types are insignificant. The interpretation of decreasing returns is also similar to our earlier interpretations.
The market scope also plays a positive effect, especially selling at the national level. The effect of the market scope seems to be an important factor in all countries with minor differences. The wider the openness is the higher the productivity level. Selling at local markets is always insignificant or negative.
There are fewer less constraints on the Lebanese output per worker than Morocco and Egypt. The main constraints are competition from large and small firms. Large and small firms may have lower costs of production than MSEs. Satisfying environmental requirement again comes significant. This adds costs to MSEs. Labour cost, licensing, tax rate, and unutilised capacity are significantly negatively affecting productivity level in Lebanon. Interestingly, lack of qualified workers and retaining qualified workers did not come as a significant constraint like they did in the cases of Egypt and Morocco. Would that mean Lebanon has no skill shortages?11 And, ‘securing initial capital’ is found to be insignificant even if we have these dummy variables alone in the
11There are no studies on the labour market in Lebanon. The US Department of State webpage on Lebanon updated January 2009 says that “Lebanon has a high proportion of skilled labour compared with many other Arab countries”. We do not know of the basis of this statement. http://www.state.gov/r/pa/ei/bgn/35833.htm.
Weshah A. Razzak 79
production function regression. It is well-documented that Lebanon’s financial market is relatively efficient, Creane el al. (2004).
Turkey’s average coefficient of capital expenditures per worker is 0.18, which is slightly smaller than that of Lebanon and half that of Egypt’s. Interestingly, the production function exhibits increasing returns to scale with the coefficient 0.11� � . This is quite different from the other Arab countries. When the regression is expanded by adding the dummy variables, the coefficient becomes negative. That could mean that the removal of constraints to MSEs reduces the costs to expanding output per worker. More interestingly and unlike the Arab countries we find that the level of the education of the owner/manager to be significant, especially years of education. Also, new and up-to-date technologies have positive effects something we did not find in the Arab countries. This might explain why average production per worker is relatively higher. These estimates are also consistent with increasing returns. The dummy variables that represent the scope of the market are also significant.
Regarding the constraints to production, inspections; labour cost; quality of labour; competition from small and micro firms; business support; and taxes affect production negatively. Taxes seem to have the largest negative effect on production with a combined effect of -0.83 (-0.60 for Easy and -0.23 for Medium).
We have corrected for heteroscedasticity using the Huber-white and the Newey-West methods and also bootstrapped the residuals. Regarding the endogeneity problem (single equation bias), we applied the Ramsey RESET specification test (omitted variables, incorrect function form, and endogeneity of ik ). The P value for Turkey is
about 0.0169 so the null hypothesis that 2~ (0, )i N I� � is rejected indicating general misspecification. However, with higher polynomials of the fitted values, the P values get bigger and null could not be rejected. The good news is that the test suggests that we cannot reject the null hypothesis all of the Arab countries production functions. The residuals are white-noise in all regressions. To remedy the endogeneity problem in general we need either an IV or a GMM estimator, which are unfortunately untenable given our data.
Journal of Economics and Econometrics Vol. 53, No. 1. 80
For robustness, we also estimated a CES production function. We do not report the results, but they are available upon request.12 Results regarding the signs, the magnitudes and the significance levels of the dummies do not change.
4.2 Nonparametric ranking tests for productivity
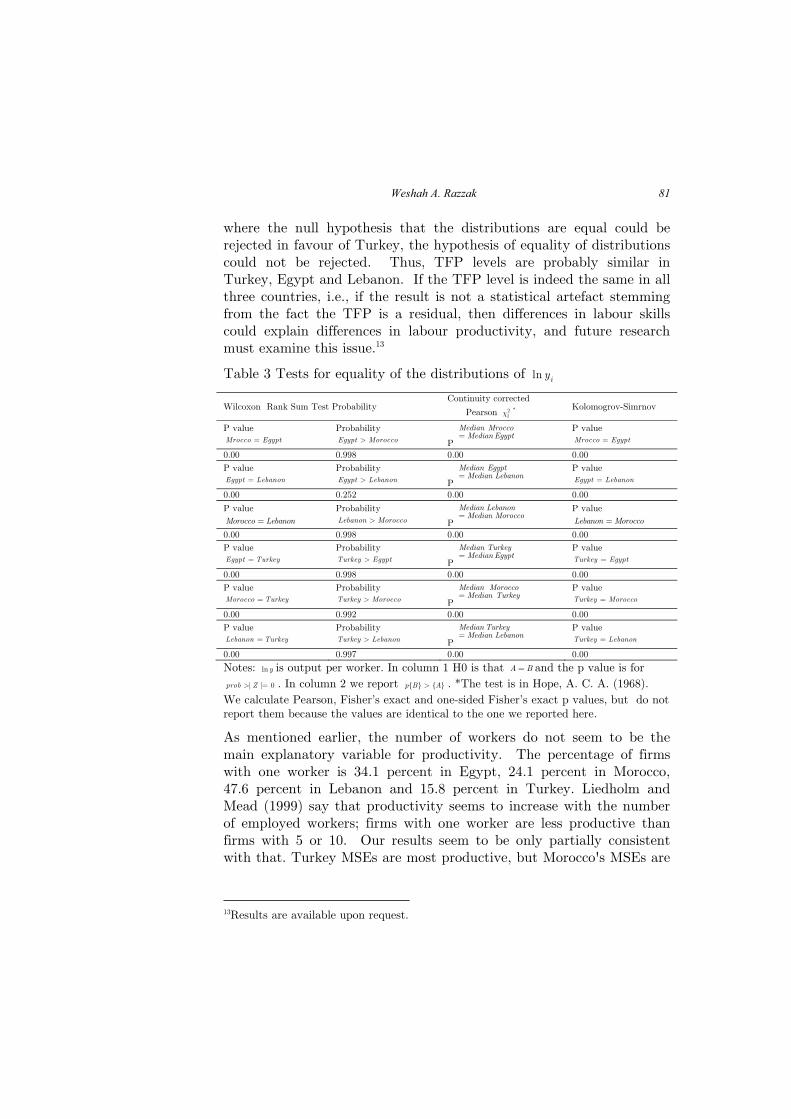
Table 3 reports three test statistics , the Wilcoxon Rank Sum test, the continuity-corrected Pearson test and the Kolomogrov-Smirnov test. We compare pair wise countries. We reject the hypothesis that productivity in Egypt is equal to that of Morocco in favour of the alternative that Egypt’s productivity outranks Morocco’s. The probability that productivity in Egypt is higher than that in Morocco is 0.998. The medians are also unequal. Egypt’s productivity is also unequal to Lebanon, and the probability that Egypt’s productivity is greater than that of Lebanon is 0.252. Lebanon’s productivity exceeds Morocco with a probability 0.998. Turkey’s productivity exceeds all other Arab countries; the hypothesis of equality is rejected by all tests in favour of the alternative that Turkey’s productivity dominates.
The question is why Turkey’s MSEs are — on average — more productive (i.e., higher level of output per worker) than Egypt and Lebanon? We have shown that the production function is increasing returns to scale in Turkey while decreasing returns in the Arab countries. And the mean level of productivity is significantly higher in Turkey. But, to answer this question, perhaps, we need to know something about labour skills and TFP. We examine the level of TFPs, i.e., the residuals. We test for stochastic dominance using the same three tests above. Except for the case of Morocco versus Turkey,
12A CES function like 1/[ (1 ) ]Y K L� � �� �� � �� � � requires no assumptions such as perfect
competition and profit maximisation. Fitting this CES production function to our data is difficult especially because the capital — labour ratios don't vary a lot since most firms in the sample are of the same size. Taking logs, use Taylor series expansion around 0� � , and truncate after the second derivative, Kmenta (1967) shows an estimable CES in a linear form would be
2ln tan ln (1 ) ln 0.5 (1 )(ln ln )Y cons t K L K L� � � � �� � � � � � � . We estimated this linear function
alone and with the dummies 1D and 2D in two separate regressions like those presented in table 2. We found � to be 0.28 and 0.30 in the first and second regressions respectively for Egypt; 0.30 and 0.50 for Lebanon; failed to converge in the case of Morocco (recall that the coefficient of capital was very small in the Cobb-Douglas case); and finally � is 0.6 and 0.48 in Turkey. The dummies were significant, have correct signs and the magnitudes were very similar to those reported in table 2.
Weshah A. Razzak 81
where the null hypothesis that the distributions are equal could be rejected in favour of Turkey, the hypothesis of equality of distributions could not be rejected. Thus, TFP levels are probably similar in Turkey, Egypt and Lebanon. If the TFP level is indeed the same in all three countries, i.e., if the result is not a statistical artefact stemming from the fact the TFP is a residual, then differences in labour skills could explain differences in labour productivity, and future research must examine this issue.13
Table 3 Tests for equality of the distributions of ln iy
Wilcoxon Rank Sum Test Probability Continuity corrected
Pearson 21
* Kolomogrov-Simrnov
P value Mrocco Egypt�
Probability Egypt Morocco P
Median MroccoMedian Egypt�
P value Mrocco Egypt�
0.00 0.998 0.00 0.00 P value Egypt Lebanon�
Probability Egypt Lebanon P
Median EgyptMedian Lebanon�
P value Egypt Lebanon�
0.00 0.252 0.00 0.00 P value Morocco Lebanon�
Probability Lebanon Morocco P
Median LebanonMedian Morocco�
P value Lebanon Morocco�
0.00 0.998 0.00 0.00 P value Egypt Turkey�
Probability Turkey Egypt P
Median TurkeyMedian Egypt�
P value Turkey Egypt�
0.00 0.998 0.00 0.00 P value Morocco Turkey�
Probability Turkey Morocco P
Median MoroccoMedian Turkey�
P value Turkey Morocco�
0.00 0.992 0.00 0.00 P value Lebanon Turkey�
Probability Turkey Lebanon P
Median TurkeyMedian Lebanon�
P value Turkey Lebanon�
0.00 0.997 0.00 0.00
Notes: ln y is output per worker. In column 1 H0 is that A B� and the p value is for | | 0prob Z � . In column 2 we report { } { }p B A . *The test is in Hope, A. C. A. (1968).
We calculate Pearson, Fisher’s exact and one-sided Fisher’s exact p values, but do not report them because the values are identical to the one we reported here.
As mentioned earlier, the number of workers do not seem to be the main explanatory variable for productivity. The percentage of firms with one worker is 34.1 percent in Egypt, 24.1 percent in Morocco, 47.6 percent in Lebanon and 15.8 percent in Turkey. Liedholm and Mead (1999) say that productivity seems to increase with the number of employed workers; firms with one worker are less productive than firms with 5 or 10. Our results seem to be only partially consistent with that. Turkey MSEs are most productive, but Morocco's MSEs are
13Results are available upon request.
Journal of Economics and Econometrics Vol. 53, No. 1. 82
less productive than Egypt and Lebanon despite the fact that the percentage of one-worker firms is relatively smaller.
For MSE, skills are important. Perhaps they are more important than capital because of the nature of production of these firms, e.g., traditional products. But, we have no information about labour skills; the next surveys should provide some information about the education/vocational levels of the workers and not only the manager or the owner of the MSE.
5 FINAL REMARKS
The Cobb-Douglas production seems to produce sensible elasticities. However, we found that the production functions of MSEs in all three Arab countries exhibit decreasing returns to scale, which suggests either (1) that the markets for these products are small, i.e., it requires more than doubling inputs to double output, thus the production process is costly; or (2) that output is consistently priced below the marginal cost. We found some evidence (Alkawaz, 2006), albeit in Arabic language, where quite a large number of firms do not report profits and have negative value added yet still alive in both Egypt and Morocco. These firms are called non-performing firms and basically have been doing so for up to 6 years on average. All these firms were in manufacturing. Thus, the second interpretation of 0� � maybe still valid in developing countries and not as bizarre as Basu, S. and J. G. Fernald, (1997) have suggested.
On the other hand, Turkey’s MSE production function exhibits increasing returns to scale. This might imply that Turkey can double output without doubling the inputs, i.e., less costly than the Arab countries, especially if the constraints to production are dealt with. Related to the interpretation that output has been consistently priced below marginal cost; we found that on average — across firms and countries — the level and type of education of the owner /manager is irrelevant to output per worker in all three Arab countries. But, education of the owner matters for productivity in Turkey. Further, new and up-to-date technologies are only slightly important for output per worker in Egypt, but very important for Turkey.
Also, education of the owner/manager and the level of technology are compliments. In MSE, the owner could be the one who trains workers on the use of traditional or the new technology. The owner’s human
Weshah A. Razzak 83
capital level is an important factor, Klepper (2004). In Morocco, traditional technology is slightly significant and there is no effect for the technology type on output in Lebanon. In traditional businesses, owners rely on experience and traditional technology. Theoretically, Technology induces faster growth. Our data do not allow us to test for growth empirically. It would have been useful for the ERF survey to provide information about the level of education of the workers as a proxy for human capital.
Also on average, selling in local markets adversely affects output per worker; selling in bigger markets positively affects output per capita. Egyptian MSEs benefit from selling in regional and national markets while Morocco’s benefit the most from selling in international markets. Morocco exports to Europe. Razzak (2009) reports that more than 75 percent of Morocco’s exports are destined to Europe. Policy should study ways to provide incentives to increase or widen market scope. Such studies might include: removal of red-tape and obstacles, exports promotions, subsidise participation in national and international trade fares and advertisements, provide information about potential markets, etc.
Regarding the constraints to output per worker, we found that ‘securing initial capital’ (access to credit) to be a significant constraint to output per worker in Egypt only. This market failure, which is usually taken as a rationale for government intervention does not seem to be the case in the Moroccan, Lebanese and the Turkish regressions. The current survey does not have additional information to identify the underlying source of such capital market failure. The banking system in Egypt seems functional. The underlying sources could be Moral Hazard and Adverse Selection. MSEs have a relatively higher exit rates (low survival probability), which makes access to credit difficult even in a fully functional banking system. Further research into this issue is recommended. Turkey’s most significant constraint on MSE is the high tax rates. Arab MSEs do not seem be affected by taxes, most likely because they pay a lump-sum fee instead of taxes.
There is evidence that labour inspection and adherence to environmental requirements are adversely affecting production in Egypt, Morocco and Lebanon. We speculate that the reason is that violators are perhaps forced to shutdown. For example, child labour is widespread in MENA countries. Shutting down production in an MSE when all workers (i.e., 1 to 9) are child labour causes output to fall
Journal of Economics and Econometrics Vol. 53, No. 1. 84
significantly. This is a serious policy challenge in developing countries because governments want to achieve two mutually exclusive goals; comply with international labour laws and in the same time increase productivity. In developed countries such as Japan, New Zealand and Italy, for example, where more than 90 percent of firms are considered small, child labour is never a challenge for MSE policy.
Competition from large, small and other micro firms affects output per worker adversely. Competition from imports and larger businesses is commonly cited in the literature as a problem for MSEs. Larger firms probably have lower costs of production than MSEs. This makes them more competitive. Competition is good for efficiency because uncompetitive MSEs exit the market and only efficient ones stick and survive. There is evidence in the literature (see the USAID, 2006) that survived MSEs seem to be the ones that contribute to economic growth and reduction of poverty. However, competition from other micro firms cannot be considered as problem in theory and the ERF surveyor should drop that question in future surveys.
Egyptian MSEs average output per worker is highly adversely affected by lack of access to business support; securing initial capital (credits); finding qualified (skilled or semi-skilled) labour and retaining them. These latter two factors also affect Morocco rather significantly. Many of the jobs in MSE, e.g., craftsmanship jobs, traditional food/sweet makers, storekeepers…etc, are intergenerational. As these countries modernise and education becomes widespread, traditional businesses suffer from the lack of skilled labour and die off. This is a challenging policy issue, Baumol (1967).
The distribution of log output per worker in Morocco’s MSE is outranked (i.e., stochastically dominated) by log output per worker in all the other countries. The average level of productivity of MSEs in Morocco is relatively lower than the averages of the other countries. Turkey’s MSEs labour productivity (output per worker) dominates all three Arab countries.
We tested whether TFP levels have equal distributions and found no significant differences between Turkey, Egypt and Lebanon. Turkey’s TFP dominate that of Morocco only. If indeed TFP is the same in Turkey, Egypt and Lebanon then differences in labour skills could explain the differences in labour productivity, but we do not have data to test this proposition. Future surveys should provide information
Weshah A. Razzak 85
about labour skills (labour quality) levels and future research should examine this issue.
The decision to promote MSE, or not, depends on the contribution of MSE to overall GDP growth and productivity, and perhaps to employment and poverty reduction. Biggs (2002) and Beck et. al. (2005) found correlation but no causal link between MSE and GDP growth per capita. Instrumental variable regression seems to render the coefficient of MSE insignificant in cross-country growth regressions. Anos-Casero and Udomsaph (2009) say they have evidence of ‘causal’ link between firm’s TFP growth and: infrastructure quality; financial development; governance; labour market flexibility; labour quality; and market competition. This paper cannot shed any light on the growth issue as we said earlier because the data we use are for one year only. However, this might be a good reason for the ERF survey to be repeated every 5 years or so. A piecemeal survey is not useful in general.
The fact that the size of the firm is an endogenous variable (depends on many factors such as the level of human capital, skills, business environment…etc); its relation to GDP per worker adds to the policy challenges. MSE that survives all odds might turn out to play an important role in aggregate economic growth. Klepper (2004) studied historical US data of survived MSEs. He argues that start-up conditions determined the firm’s futures. He found that the ‘human capital’ of initial managers is key to survival. We do not have data on experience, but the level and type of education of owners (managers) turned out to be insignificant.
Many MSEs exit over time as the creative-destruction forces play out in free market economies. Research-based policy approach suggests that it might be advisable that governments in developing countries try to anticipate (estimate) the probability of survival of MSEs and then adopt policies to ensure higher productivity to survived firms. A blanket policy to promote all kinds of MSEs is not advisable.
Journal of Economics and Econometrics Vol. 53, No. 1. 86
REFERENCES
Alkawaz, A. 2006. “Non-Performing Industries in the Arab World.” Arab
Planning Institute, Kuwait. Anderson, G. 1996. “Nonparametric Tests of Stochastic Dominance in Income
Distributions.” Econometrica 64(5): 1183-1193. Anos-Casero and C. Udomsaph. 2009. “What Drives Firm Productivity
Growth?” Policy Research Working Paper 4841. the World Bank — Eastern European and Central Asia Department — Economic Policy Section, Washington, D.C.
Basu, S. and J.G. Fernald. 1997. “Returns to Scale in U.S. Production:
Estimates and Implications.” Journal of Political Economy 105(2): 249-283. Baumol, W. 1967. “Macroeconomics of Unbalanced Growth: The Anatomy of
Urban Crisis.” American Economics Review 57(3): 415-426. Beck, T., A. Demirguc-Kunt, and R. Levine. 2005. “Finances, Firm Size and
Growth.” World Bank Policy Research Working Paper. World Bank, Washington D.C.
Biggs, T. 2002. “Is Small Beautiful and Worth of Subsidy? Literature Review.”
International Finance Corporation Working Paper. World Bank, Washington, D.C.
Centeno, V.P. 2001. “The Role of the Micro Enterprises as Engine of
Economic Development: The Peruvian Case.” Paper presented at the IFUP 4th International Conference in Morocco.
Conover, J.W. 1999. Practical Nonparametric Statistics. 3rd ed. New York:
Wiley. Creane, S., R. Goyal, A. Mushfiq, and R. Sab. 2004. “Financial Sector
Development in the Middle East and North Africa.” IMF working paper 201.
Economic Research Forum (ERF). 2004 - 2005. “Promoting Competitiveness
in the Micro and Small Enterprises Sector in the Middle East and Africa, Final Report.” Consultation and Research Institute, Lebanon.
Weshah A. Razzak 87
El — Mahdi, A. 2005. “Promoting Competitiveness in the Micro and Small Enterprise Sector in MENA.” ERF, Egypt.
Gibbons, J. D. 1971. Nonparametric Statistical Inference. New York:
McGraw-Hill. Hallberg, K. 2001. “A Market-Oriented Strategy for Small and Medium-Scale
Enterprises.” Discussion Paper No. 48. International Finance Corporation. Hamdan, K. “Micro and Small Enterprises in Lebanon.” Research Report
Series No. 0417. ERF, Egypt. Hamdouch, B. 2006. “Dynamisme De La Micro Et Petite Enterprise Au
Maroc.” ERF, Cairo. Hope, A.C.A. 1968. “A simplified Monte Carlo Significance Test Procedure.”
Journal of the Royal Statistical Society. B 30: 582—598. Klepper, S. 2004. “The Geography of Organisational Knowledge.” Carnegie
Mellon University Working Paper. Kmenta, J. 1967. “On Estimation of the CES Production Function.”
International Economic Review 8: 180-189. Kolmogorov, A.N. 1933. “Sulla Determinazione Emprica Di Una Legge Di
Distribuzione.” Giornale Dell’ Istituto Italiano Delgi Attuari 4: 83-91. Lahlou, M. 2009. “Child Labour in Morocco: The Socioeconomic Background
of the Little Maids Phenomenon.” Unpublished Manuscript. Ministry of Planning, Morocco.
Lindholm, C. and D.C. Mead. 1999. Small Enterprises and Economic
Development: The Dynamics of Micro and Small Enterprises. Rutledge. Mann, H.B. and D.R. Whitney. 1947. “On a test of whether one of two
random variables is stochastically larger than the other.” Annals of Mathematical Statistics 18: 50-60.
Megginson, W.L. and J. Nutter. 2001. “From State to Market: A Survey of
Empirical Studies on Privatisation.” Journal of Economic Literature 39: 321-389.
Ozer, S. “Micro and Small Enterprises in Turkey: Uneasy Development.” ERF
Research Report Series No. 0420.
Journal of Economics and Econometrics Vol. 53, No. 1. 88
Randles, R.H. and D.A. Wolfe, 1979. Introduction to the Theory of
Nonparametric Statistics. New York: Wiley. Razzak, W.A. Forthcoming 2009. “Self-Selection Versus Learning-by-
Exporting in Four Arab Countries.” Journal of Applied Business and Statistics.
Smallbone, D., F. Welter, N. Isakova, and A. Slonimski. 2001. “The
Contribution of Small and Medium Enterprises to Economic Development in Ukraine and Belarus: Some Policy Perspectives.” MOCT-MOST: Economic Policy in Transitional Economies 11(3): 253-273
Smirnov, N.V. 1939. “Estimate of Deviation Between Empirical Distribution
Functions in Two Independent Samples (in Russian language).” Bulletin Moscow University 2(2): 3-16.
USAID. 2006. “Micro and Small Enterprises: Unexplained Pathways to
Growth.” Micro Report No.63. UNCTAD. 2005. “Growing Micro and Small Enterprises in LDCs: The
‘Missing Middle’ in LDCs: Why Micro and Small Enterprises are not Growing.” UNCTAD/ITE/TEB/5.
US Department of Labour, Bureau of International Labour Affairs. 2004.
“Laws Governing Exploitative Child Labour Report: Morocco. U.S. Department of Labor.
Veselka, M. 2005. “The Role of Small and Medium-Sised Enterprises Beyond
the Statistics.” South Asia Institute of Heidelberg University, Germany. Wagner, J. 2006. “Exports, Foreign Direct Investment, and Productivity:
Evidence from German Firm Level Data.” Applied Economics Letters 13: 397-402.
Wilcoxon, F. 1945. “Individual comparisons by ranking methods.” Biometrics
Bulletin 1: 80-83.