Embed Size (px)
Citation preview
An Empirical Investigation of an Indicator of Economic Efficiency in the Public Transportation Industry During 1994
Rob Latsha
Submitted to the Department of Political Science Southwest Texas State University
In Partial Fulfillment For the Requirements for the Degree of Masters of Public Administration
POSI 5397
Summer 1998
Approved BY:

Table of Contents . . Lists of Charts and Tables .............................................................................. 11
Chapter One: Introduction and Statement of Purpose Introduction ............................................................................... 1 Research Purpose .................................................................... 5 Organization of the Research .................................................... 6
Chapter Two: Research Setting ............................................................................... Introduction 8
Government Expansion ..................................................... 8 Governments Changing Role in Mass Transit ......................... 9 Typical Components of a Transit Authority's Budget ............ 17
Chapter Three: Review of the Literature Introduction ....... .. ................................................................. 18 History of Public Transportation Economics of Mass Transit ..................................................... 18 Fare as a User Fee ........................................................... 29
...................................... Arguments in favor of Subsidization 30 ............................................ Arguments against Subsidization 33
........................... Results of Subsidization- the Farebox Ratio 35 Hypotheses ................. .. ........................................................ 40
Chapter Four: Methodology Introduction .............................................................................. 41
..................................................................... Research Design 41 .............................................................. ................... Model ... 43
Chapter Five: Analysis of Findings .............................................................................. Introduction 47
................................................................. Correlation Matrix 48 Regression ................................................................................ 48
Chapter Six: Conclusion Introduction .............................................................................. 52
.................................................................................. Summary 52 ............ .......... Strengths and Weaknesses of the Project .... 54
Suggestions for Future Research ............................................. 55 . . B~bl~ography ................................................................................................... 58

Listing of Charts and Tables
Charts Growing Govemments.(2.1) ..................................................... 9 Gross Capital Expenditures for Railways and Utilities(3.1) ............................................................................ 21 Transit Fares and Wages Vs the Operating Ratio(3.2) ............ 22 Transportation Price Indices(3.3) ............................................. 24 Subsidies for Highway Construction(3.4) ................................ 26 Transit Industry Performance(3.5). .......................................... 27
Tables ........................................ History of Mass Transportation(3.1) 19
Correlation Matrix(5.1) ............................................................ 48 .................. Regression Analysis of Farebox Ratio Model(5.2) 48
Chapter One
Introduction and Statement of Purpose
Introduction
Throughout human evolution, technological advancements
bring change. The changes indelibly impact the quality of
life for those living in the era. These improvements often
erase an older technology or alter the typical mode of
operation. The creation of bronze ushered out the stone
age. The invention of the telegraph eliminated the need for
the Pony Express, and similarly, the telephone erased much
of the functionality of the telegraph.
The twentieth century technological advancements have
grown exponentially. Not only are humans modifying their
lots in life, but also they are directly affecting the
environment in which they live. The changes of the twentieth
century created new markets. Like the advancements that
have preceded them, these twentieth century advancements are
also not without corresponding market causalities. One of
these causalities is privately-owned mass transit operators.
Long extinct are the urban neighborhoods of true
convenience in most cities. Modern zoning and suburban
planning have separated industrial areas from commercial and
residential areas. It is very difficult to find any
neighborhood with these three necessities of modern life
within walking distance. If one looks at any transportation
modal split information provided by a metropolitan planning
organization, to go to one's job or to buy groceries, some
form of mechanized transportation is necessary.
While the urban landscape changed, so did the
perception of government's role in the economic welfare of
the country. In the United States, public spending
accelerated in the late 1930s. In an effort to stem the
suffering of American citizen during the Great Depression,
the federal government implemented many programs. These
programs, often referred to as the 'New Deal,' changed the
perception of the general public on the role of government.
The laissez-fairre days of government non-involvement were
over. Government was now viewed as responsible for the
economic welfare of the nation. With the implementation of
the Civilian Conservation Corps as well as the Tennessee
Valley Authority programs, governments in America began to
enter markets in which they had never before directly
participated. This proliferation of direct government
participation in previously private markets has continued.
Currently, in every major American metropolitan area,
there exists some form of government transit authority. To
maintain affordable urban transportation, government
entities have usually taken the role of directly operating
the service. In almost every urban transit system across
the country, some form of subsidy is necessary to insure
that the service is provided. Subsidies typically range
from twenty-five percent to complete subsidization. 1
Urban mass transportation has existed in some form in
2 the United States since the 1864. Originally mass transit
systems were viewed as beacons of progress, civic well-being
and growth. In the late eighteen hundreds, the street car
was beheld as the pinnacle of mass transit. A turn of the
century city-dweller expressed the sentiment well,
If the streetcar could be made self sustaining, we ought as a matter of pride to have them. Nothing contributes more to give a city the appearance and
3 air of general importance than streetcars.
However, this belief in the importance of urban streetcars
did not survive the advent of the internal combustion
I P e d Areas F.xceeding 200.000 Population for the 1994 National -base Report Year. Federal Transit Administration December 1995. p. 2-282. 2 Walker, James Blaine. Years of Ravid Transit 1864-191 2. (1 91 8) p.2. 3 . . As found in Analvsis of E x l a Transit S v m Austin Transit Study, Prepared by the City of Austin in cooperation with USDOT and the Urban Mass Transit Administration (UMTA) ( 1 972) p. 5.
engine. The widespread use of the personal automobile
changed the nature of mass urban transportation.
By the 1940s, the increasing use of the personal
automobile, combined with low-interest, federal new housing
loans, as well as other factors lead to the prolific
increase of "urban sprawl" as well as "urban flight". 4
Controversy in Modern Day Transportation Authorities
Across the country, controversial urban mass
transportation issues have brought transportation providers
and their policy makers into the media limelight. Stories
abound, "Bus Drivers, Mechanics picket Metro" in Houston,
Texas; "Filling the Subways with Pork" in New York; 'BART
Director Pleads Not Guilty Pryor booked, released after
arraignment extortion charges" reported in the San Francisco
Chronicle; 'VIA pays $3 million for a five-acre eyesore" in
San Antonio. From BART in San Francisco to MTA in New York
city, negative publicity seems to be the norm rather than
the unusual.
These terms are defined in the Research Setting Chapter on page 12.

Research Purpose
The purpose of this research is twofold. The first is
to examine the history of public transportation in the
United States and set the basis for the current situation.
The second purpose is an empirical investigation of one
element of economic efficiency (the farebox ratio) of
regional transit authorities and how this is effected by the
environments in which the transportation agencies operate.
The empirical research is explanatory and tests several
hypothesis.
The model tests the six hypotheses. These hypotheses
may suggest an optimal size or optimal parameter of
operation exists to give the transit agency a more efficient
or less subsidized level at which to operate. Depending on
the results, the effects of diminishing return may outweigh
the effects of economies of scale at some point of
operation.
The model to be researched has the farebox ratio as a
function of calculated city density, service area, service
area population, operating expense, fleet size and average
fleet age.
While some literature addressees the basic concepts of
these transit terms, no previous research examines the
relationship between the variables.
Organization of the Research
The research setting of the applied research project is
discussed in Chapter Two. It presents information on the
history of government expansion. It also furnishes the
reader with a brief history of the urban mass transportation
industry.
In the third chapter, the literature pertinent to the
research topic is presented and discussed. The purpose of
this chapter is to present literature that examines the
history of mass transit subsidy as well as some basic
economics associated with urban mass transit and subsidies.
The conceptual framework also is presented, and terms are
defined.
Chapter Four introduces the methodology to be used for
analysis. It also presents the operationalization of the
variables.
Chapter Five presents the findings of the research.
Statistical analysis results are interpreted and discussed.

Chapter Six summarizes the findings and focuses on
reasons why data may not have supported some hypothesis.
Strengths and weaknesses of this research will be discussed
as well as possible improvement for further study.

Chapter Two
Research Setting
Introduction
With special attention paid to the mass transit
industry, this chapter provides information on the expansion
of government. This chapter also describes historical
changes in the mass transportation industry which began as
private transportation companies and evolved to government
subsidized entities.
Local Government Expansion
Excluding school districts, the number of governments
in the United States has been growing this century. From
the 1940s to the 1970s; municipal, town, and county
governments have remained relatively constant in number.
During the same time frame , special district1 governments
have tripled and, in total number, surpassed all other forms
of government, including school districts. Figure 2.1
illustrates the changing number of governments. School
districts have been removed from this graph.
I Special Districts are often the government units that operate as Transportation Authorities.

Figure 2.1
Growing Governments
I 80,000
8 . 60,000 g 'g .;
40,000 f : i = ' 4 20,000 * 8
0 1942 1952 1962 1972 1977
Year
.. - - --
Source : Savas, E. the Public Sector. P. 8
Government Changing Role in Mass Transit
Urban public transportation began in America in the
1800s. New York City was one of the first cities to
experiment with public transportation. The experiment was a
necessity created by the growing city's congestion. The
earliest modes of urban transportation were typically mule-
drawn or cable-drawn trolleys. The pre-existing problems
with congestion and rising population are evidenced in a
prediction from an anonymous futurist. Due to the rising
number of residents in New York City as well as their
reliance on private horse drawn carriages, he foresaw dire
consequences. The congestion led this futurist to predict,
. . . New York City would be abandoned by the 1930s as unsafe for humans . . . the number of horses

necessary to haul all those people (7 million) around would result in a pile of horse manure that would pile to the third-floor window everywhere in Manhattan. 2
Although his belief may have exaggerated the conditions,
changes were necessary to circumvent this impending problem.
One of the changes was the proliferation of mass
transit systems. Unfortunately, the same problem that
confronted individuals desiring to commute plagued early
mass transit systems. There were limited numbers of routes
to get citizens from one point to another. Without
additional roadways, congestion among rival urban
transportation companies would simply replace congestion
from personal transportation.
It was then that government took its first steps toward
regulating urban transportation. Laws were passed to
prevent inefficient congestion among transportation
providers.
The main purpose of the legislation was to insure an orderly extension of routes without unnecessary duplication, while at the same time ensuring that
3 the resultant monopoly powers were not misused.
2 As found in Husted, Bill. "Futurist Can Peer Ahead on the Internet." Austin American Statesman 1996. 3 Black, Ian; Gillie, Richard; Henderson, Richard; Thomas, Terry. a e d Urban Transport. (1975) pp. 10-11.
By passing legislation prohibiting the duplication of routes
and restricting competition, the government practically gave
transportation providers an effective monopoly. Any good
required by most of the members of a community which has a
limited number of suppliers, is subject to monopolistic
abuse. In most cases, fixed fare pricing legislation was
introduced to protect the public.
Unlike today, the turn of the century legislators
designed regulations to protect the public, rather than to
support the industry. "As far as public transport is
concerned, much of the traditional justification for
intervention has been based on the need to restrain the
exercise of monopoly powers."4 Because of the abuses
associated with monopoly power, legislation was passed. Not
only was this legislation designed to protect the public
from the monopolist powers held by the organizations, but
also to insure a more balanced distribution of the routes.
The benefits of early mass transportation were easily
seen. For example, fixed rail that was laid down could be a
boon to any business. Much like an intersection of two
4 Black, Ian; Gillie, Richard; Henderson, Richard; Thomas, Terry. -. (1975) p. 10.
major thoroughfares today, a nearby stop could provide
customers with easy access to a business's goods.
It was clear even then that transport investment impinged on so many spheres of life that the financial costs of a project would not necessarily reflect its true costs -or benefits- to the
5 community.
The impact of public mass transit on a community was so
penetrating, the effects were difficult to measure. Mass
transit regulations targeted at monopoly abuses, would not
last through this century.
With the discovery of electricity, the electric trolley
took the center stage of urban mass transportation. In
Austin, Texas, the electric trolley was implemented in 1891,
6 and it charged the same fare as the mule-drawn trolleys.
The electric trolley dominated urban mass transit until
after World War I, when the personal automobile began to
allow many people freedom to travel widely, quickly and
relatively inexpensively. The demand for mass transportation
fell. The subsequent decline in ridership forced urban
transit organizations to try to become more competitive
They were no longer the only option available to the public.
5 Black, [an; Gillie, Richard; Henderson, Richard; Thomas, Terry. Advanced Urban Transrul. (1975) p. 10. 6 . . The fares were five cents. -is of Exlstlng Transit Systems. Austin Transit Study, Prepared by the City of Austin in cooperation with USDOT and Urban Mass Transit Adminismation (1972) p. 5 .

As transit agencies attempted to remain competitive
with the convenient automobile, they expanded both hours of
operation and numbers of destinations. These actions
typically had the opposite effect.
Because of the increasing imbalance between peak and off-peak demand, efforts to expand service to compete with the automobile increased commuter patronage but reduced profit margins further. 7
This inability to adapt severely hampered the fixed rail
system. By the 1950s, the failure of the private fixed rail
trolley system was all but complete. Most transit
authorities had begun to use buses.
During the 1940s, buses were commonplace among city
streets. Because they did not run on a fixed rail, the
buses offered more flexibility than the streetcars that had
preceded them. If the community population moved within the
city, changing a route no longer required that a track be
removed and relaid. Mass transportation planners merely had
to decide where the bus should go and what time it should be
there. The ability to adapt afforded some longevity to the
self-sufficiency of urban mass transportation. Due to this
new found flexibility, mass transportation had once again
7 Jones, David. Urban Transit Policv: An Economic and Political History. Englewood Cliffs, New Jersey (1985). p. 87.

become economically competitive with the automobile. But
this deceptive competitive era would eventually end,
primarily because the use of its main nemesis, the personal
automobile, was spreading.
The important part of this competition is not solely
the increasing numbers of automobiles, but the effect that
the autos had on the urban landscape. Personal autos allow
citizens more choices for the location of their residence.
Moving to the suburbs to avoid crowded city neighborhoods,
was often the choice of individuals who had the means to do
so. This process is referred to as 'urban flight.'
'Urban sprawl' occurs as developers create new suburbs
in formerly rural areas. These suburbs allow more
individuals to leave the urban areas and lower the density
of an urbanized zone. Both urban sprawl and urban flight
have limiting effects on the efficiency of urban mass
transportation. As population areas become less dense, it
becomes less cost effective for a transit agency to serve
that area.
In the book, B u s a t i o n ulationhe Metro~olitu
w, authors Pickup, et al, refer to higher incomes
leading to increased car ownership and use as the source of

a 'vicious cycle.' This cycle of increased traffic
concentration leads to changes in the economics of bus
operation. Ultimately, this cycle changes in the urban
structure. The three impacts of this cycle are manifested
in very different processes.
Increasing congestion. In the very short term there is increased congestion on the roads, slowing down buses more than cars, making them more unattractive. Changes to the economics of bus operations. Over a slightly longer period of about a year, reduced demand puts financial pressure on operators, forcing them either to increase fares, or reduce service, or both. This makes the public transport service less attractive and drives away more passengers in the following year. Thus, 'cutting services in line with demand' is not a neutral response. A reduction in the vehicle miles run increases waiting times or walking distances for the remaining passengers. Changes to urban structure. In the longer term, over ten years or more, the structure of towns change. The pattern of home and job locations and other activities disperse - much more difficult for a public transport systems to serve. Increasingly, cars become not only desirable, but necessary with a further boost to the spiral. 8
In the United States, there was an extra catalyst that
accelerated the changes in the urban structure. The Federal
Housing Act (FHA) created loans only for new housing, not
for remodeling. These loans made it more attractive for
8 . P~ckup, Laurie; Stokes, Gordon; Meadowcroft, Shirley; Goodwin, Phil; Tyson, Bill; Kenny, Francesca. Bus Dereoulation in the Metropolitan A r m . (1991) p. 16.
homeowners to move out of the central city and build. In
effect, the federal government subsidized urban flight and
encouraged individuals to leave the urban areas.
The death stroke for private urban mass transportation
came in 1964. In an effort to create better urban
transportation, federal legislators passed the Urban Mass
Transit Act(UMTA) of 1964. UMTA offered to subsidize 80% of
mass transportation capital costs as well as a portion of
9 the operating costs to localities. This act helped set up
many regional transit authorities and create the type of
system currently in place. Only the agency's name has
changed; the Urban Mass Transit Administration(UMTA) also
created by the act in 1964, is now titled the Federal
Transit Administration.
9 Seligman, Daniel. "Notes from Underground." Fortune April 8 1991. p. 127.

Typical Components of a Transit Authority's Budget
Similar to a commercial organization, a transportation
agency has sources of income as well as expenses. The
operating expenses may be separated into subcategories such
as salaries/wages/benefits, materials and supplies,
purchased transportation, and other operating expenses.
Unlike a commercial organization, a transportation
agency typically has many different sources of income.
Typically, these funds come from federal assistance, state
funds, local funds and passenger fares. Passenger fares are
the only major source of funds that are not some form of
subsidy.
This chapter gave the reader some basic essentials
regarding urban transportation in the United States. In the
following chapter, an abbreviated history of urban
transportation will be presented. Also in the following
chapter, the changes of the urban form and its contribution
to the inability of urban mass transportation providers to
return profits will be explored.

Chapter Three
Review of the Literature
Introduction
The purpose of this chapter is to present literature
that examines the history of the mass transit subsidy. The
history of mass transit shows a trend of organizations
moving from self-sustaining to becoming more dependent on
subsidies. This chapter also examines reasons to subsidize
and not to subsidize. The existence of the subsidy and the
policies that sustain it have evolved over the last twenty
years. The recovery ratio of mass transit agencies and the
hypotheses surrounding this ratio are introduced.
History of Mass Transportation in the United States
In his book, Urban Transit P u , David Jones
separates the development of American urban transportation
into eight distinct time periods. Each period, he states,
is unique, from the politics to the urban landscape. His
time period distinctions follow in Table 3.1:
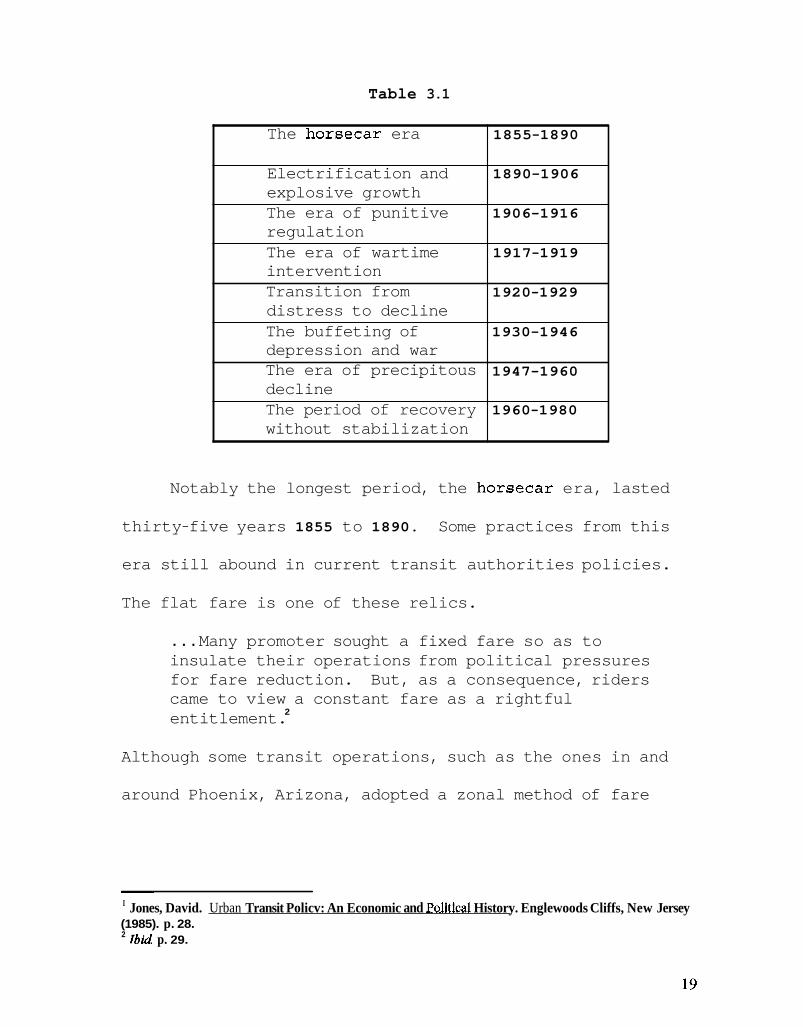
Table 3.1
Notably the longest period, the horsecar era, lasted
The horsecar era
Electrification and explosive growth The era of punitive regulation The era of wartime intervention Transition from distress to decline The buffeting of depression and war The era of precipitous decline The period of recovery without stabilization
thirty-five years 1855 to 1890. Some practices from this
1855-1890
1890-1906
1906-1916
1917-1919
1920-1929
1930-1946
1947-1960
1960-1980
era still abound in current transit authorities policies.
The flat fare is one of these relics.
. . . Many promoter sought a fixed fare so as to insulate their operations from political pressures for fare reduction. But, as a consequence, riders came to view a constant fare as a rightful
2 entitlement.
Although some transit operations, such as the ones in and
around Phoenix, Arizona, adopted a zonal method of fare
I . . Jones, David. Urban Transit Policv: An Economic and Pol~t~cal History. Englewoods Cliffs, New Jersey (1985). p. 28. 2 Ibid p. 29.

charges, the flat fare is still the most common method of
charging passengers regardless of distance traveled
With the electrification of urban transportation
vehicles came rapid growth.
Promoters promised that consolidation of small horse railways into larger traction syndicates would produce economies of scale in management, power generation, and operation, permitting the rationalization of service in a fashion that would simultaneously reduce costs and attract new
3 patronage.
The amount of electrified trackage increased over 1600% from
1890 to 1902. As a percent of the total trackage,
4 electrified increased from 16% to 97%. According to David
Jones this period of expansion lasted approximately sixteen
years from 1890 to 1906. Figure 3.1 illustrates the steady
investment in street railways until 1908.
This investment in rail allowed individuals to move
further from work. "Many turn-of-the-century observers
viewed the inner city . . . as a social menace from which the
masses should make every effort to escape."5 Urban flight
has it's roots in early rail.
3 Jones, David. Urban Transit Policv: An Economic and Political History. Englewoods Cliffs, New Jersey (1985). p. 32. 4 Jones, David. U r b an Transit Policv: An Economic and Political History. Englewoods Cliffs, New Jersey (1985). p. 3 1 . 5 Foster, Mark S. From Streetcar to Superhigbwy: American City Pl- 1900-194Q. Temple University Press. Philadelphia, PA (1981) P.7.

Figure 3.1
Gross Capital Expenditures for Street Railways and Electric Utilities, 1900-1917
Year
' tp 1' . A source : Jones, David. Urban Trans1 o icv, n Economic and Political History. Englewoods Cliffs,
New Jersey (1985). p. 38
During the preceding expansion period, windfall profits were
made, but during the trust-busting period of the Progressive
era this would not go unnoticed. The era of punitive
regulation lasted from 1906 to 1916. The regulations
focused on restricting the monopoly powers that
transportation systems inherently created. Despite these
ordinances, it was during this period in 1908, rail transit
ridership peaked. 6
During the era of wartime intervention from 1917 to
1919, labor problems led to unionization. "By 1920, street
6 Yago, Glenn. The De-. Cambridge University Press, New York (1984). p. 11.

railways ranked among the most heavily unionized industries
with a level of union membership comparable to that found in
7 mining and railroading." In turn, higher wages were
successfully acquired but without corresponding increases in
fares the operating ratio worsened.
Figure 3.2
Transit Fares and Wages vs the Operating Ratio I
1918 1919 Year Operating Ratio
Source : Jones, David. Urban!: An Econom ic and Political History. Englewoods Cliffs,
New Jersey (1985). p. 42
Not only was the worsening operating ratio a problem,
200 0 78
but World War I made some policy makers wary of the
180
160
140
8120 v
insufficiency of the United states' transportation
. 0 76
.. 0 74
.. 0 72 .g
. 0 7 3
infrastructure. "Paralysis of the railroad system in
11 100 .. 068
1 ;; 066 P
t 064
40 0.62
20 . 0 6
0 F a r e s I
responding to the logistics requirements of the World War I
7 Jones, David. Urban Transit Policv: An Economic and Political History. Englewoods Cliffs, New Jersey (1985). p. 43.
gives imperative to a national system of defense highways ."'
The development of a highway system would increase the
mobility of individuals who purchased personal automobiles.
Although the period from 1920 to 1929 is referred to as
the 'Roaring Twenties,' the 1920s were not spectacular for
public transit. In Jones' fifth era, transition from
distress to decline the automobile begins to play
substantial role in the decay in the use of public
transportation. Innovations in the manufacture of
automobiles allowed for mass production and sale to the
general public.
While mass production of automobiles lowered the
purchasing cost, it became easier to establish a motorbus
operation. Compared to the street railway companies, the
motorbus companies of the 1920s had relatively carefree
lives. "Driving, maintenance, and bookkeeping were family
affairs, unencumbered by union agreements, craft
specialization, or strict regulatory o~ersight."~
Figure 3.3 shows the decreasing price index of
purchasing and operating an automobile. It also illustrates
8 as found in Althshuler, Alan. Current Issues in Transpartation Policy. Lexington Books. Lexinton, Massachusetts. (1979). p. 75.
Jones, David. Urban Transit Policv: An Economic and Political w. Englewoods Cliffs, New Jersey (1985). p. 54.

the increase of the transit fare index. This increase is
especially interesting when the preceding graph is taken
into account. Although the fare price index increased, the
operating ratio still declined. It is important to note
that the decreasing relative cost of the automobile afforded
more people the opportunity to buy one. With an auto,
workers were no longer bound to live within walking distance
of their place of employment or a transit line that could
provide access to employment
Figure 3 . 3
Transportation Prlce lndicies
- + Motor V6EIKOperaTng
lndex + k t o r Vehicle Rrchase
Price hdex +Transit Fare lndex
+..Consumer Rice hdex
1 1912 1920 1925 1930 1935 Year
Source: Jones, David. s i s t o r y iti . Englewoods Cliffs, New
Jersey (1985). p. 45
During the period from 1930 to 1946, the United States
experienced a depression and World War 11. According to
David Jones, these events had a buffeting effect on the

impending decline in mass transportation ridership. Public
transportation ridership peaked in 1946, just after World
War 11.
Public transportation, more specifically railway
transit, was also under direct attack. In 1937, there were
62 diesel buses being operated by transportation properties.
General Motors joined with an oil and rubber company to capitalize a transit management organization with the financing necessary to acquire failing streetcar systems and reequip them with diesel buses.
The holding company thus formed-National City Lines- eventually acquired some 100 distressed street railways and converted them to diesel bus operation. By 1940, 75 U.S. transit companies were operating 680 diesel buses. 10
Not only were the transit authorities under direct attack
from General Motors, but also the Federal Highway Act of
1944 eroded its ridership base by making travel by
automobile even more enticing.
After the peak in 1946, transit ridership plummeted
over the next twelve years. Jones refers to this as the era
of precipitous decline. It lasted from 1947 to 1960. Every
four years during this period transit ridership fell over
. . 'O Jones, David. Urban Transit Policv: An Economic and Pol&d-&&~~. Englewoods Cliffs, New Jersey (1985). p. 62.
25

twenty percent. 11 Private mass transit operations were in
shambles
By the early 1950s, electrical transit was largely abandoned and most private transit operators were bankrupt . . . Automobile, rubber and oil companies faced Federal investigation and prosecution for market manipulations that contributed to the elimination of rail transit. 12
While mass transit operations floundered, the subsidies for
highway construction steadily increased.
Figure 3 . 4
Subsidies for Highway Construction
Year 7
I I --
Source: Ruppenthal. Karl. u s in Transvortati~conomic~. Charles E. Merrill Books, Inc. Columbus
Ohio (1965). p. 40
Jones refers to his next era as the period of recovery
without stabilization. This is the time when transit
Transit Policv: An Economic and Po " Jones, David. &ban liti-. Englewoods Cliffs, New Jersey (1985). p. 74. 12 Yago, Glenn. The Decline of Transit. Cambridge University Press, New York (1984). p. 68.
26
operations began to receive subsidies. This period lasted
from 1960 to 1980. Although the decline in ridership
slowed, transit operating deficits only increased.
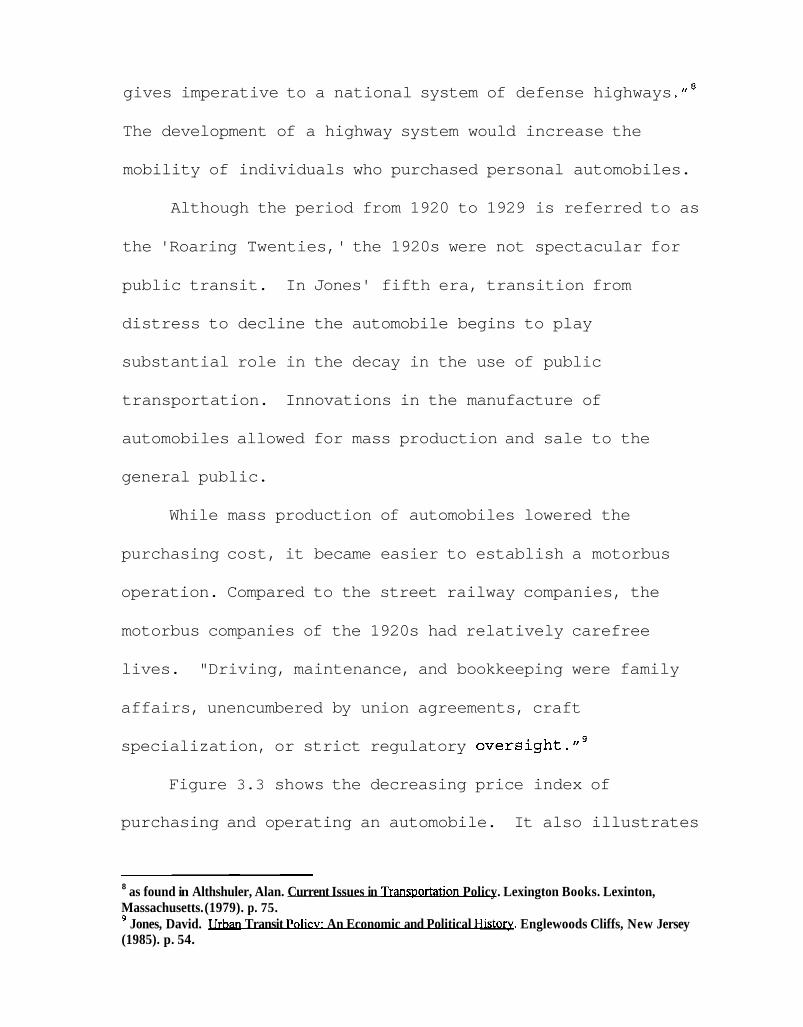
By 1970, US operating deficits were about $2 billion annually, and nearly 90 percent of all operating systems that had existed before World War I1 had gone bankrupt and were municipalized. 13
Figure 3.5 illustrates the increasing portion of cost
alleviated by subsidy.
Figure 3 . 5
- - - - - . - -.
Transit Industry Perfomance
Subsidy per Ride
1970 year 1975
. . Source: Jones, David. urban Transit Policv: An Economic and P-. Englewoods Cliffs, New
Jersey (1985). p. 85
Key Transformations in American Mass Transit Systems
Urban Public Transportation has been in America since
the 1850s. During the 150 years since its inception, mass
13 Yago, Glenn. The Decline of. Cambridge University Press, New York (1984). p. 11.
transit metamorphosed from a mule-drawn rail trolley to
intricate transportation systems that often include varied
types of vehicles such as articulated buses, ferries,
commuter or light-rail systems. During this
sesquicentennial time period, the regulation pertaining to
mass transit changed from regulation to prevent monopolistic
abuse to subsidies to insure existence. These subsidies
illustrate the desire for a public transit option, not
because of its revenue raising capabilities, but because of
its other positive impacts created by providing the service.
Not only has the essence of public transportation changed,
but also the typical rider has changed as well.
Originally, riders were from all walks of life. As
personal transportation became available, accepted and
supported, individuals with the appropriate means began to
choose private transportation. Now, riders are more likely
to be disabled, or poorer, younger, or much older than a
14 typical citizen. Because of these continued declines in
per capita ridership and increasing cost, public
transportation providers require subsidies to maintain
traditional levels of service to their communities
l 4 Ornati, Oscar, A. w a t i o n Needs of the Poor. (1969) p. 42.

F a r e as a U s e r F e e
Farebox revenues on mass transit are a type of user
fee. Customary user fees are charges on governmental goods
or services that traditionally have been free or provided at
minimal cost. Fees charged for camping in public parks,
general administrative searches or library use, are typical
examples of user fees.
With public transportation, fare box revenue originally
covered the cost of operation. As illustrated earlier in
this chapter, the revenue to cost ratio was referred to as
the operating ratio. Now in most transit systems, the
revenues cover a percentage of the total operating
15 revenue. The proportion of revenue generated by the fare
has decreased over time and in some agencies, the revenue
generated by the fare barely covers the full cost of
collecting it.
User fees are criticized because they fail to take into
account the norm of equity. Fees may exclude people with
low incomes from the good or service. "The final condition,
'few unacceptable inequalities,' is the major stumbling
I5 . . Bansit Profiles A g a u e s m Urbanized Areas Exceedin- 200.000 Population for the 1994 National Transit D a t a b a w o r t Ya. Federal Transit Administration December 1995. p. 2-282.

block for general application of fees . . . what is the proper
(efficient) price to charge the poor?"16 Governments of ten
search for a balance between what a public good truly costs
to produce and what would be a fair price.
Arguments in Favor of Subsidization
Many diverse reasons exist for investing in public
transport. The reasons range from individual costs and
rights to societal costs and obligations
Without subsidized public transportation, many
individuals would not be able to move effectively through
their city. The inability to be mobile denies an individual
the opportunity to many venues. Some argue that there is a
fundamental right to mobility, which is not limited
exclusively to transportation to work or shopping. The
inability to afford a car does not make an individual
in£ erior
To avoid traffic, the cost of gasoline, and depreciation on their automobiles, car owners may choose to take the bus. For them, the fee for public transportation is optional. (On the other hand, the fee for public transportation can be considered mandatory for users who do not own cars. l7
l6 Shields, Patricia. "Freud, Efficiency and Pragmatism." Sociefy. p.70. 17 r Fees: C m t Practice. Management Information Service. p.3.

A mass transportation user fee is compulsory to individuals
without other options. Without subsidization, this fee
would need to be increased and would become prohibitive.
Providing access to the disenfranchised is an impact
that most individuals would see as positive. Access does
not merely refer to the ability to go from point A to point
B. Francisco Martinez defines access "as the economic
benefit derived from the interaction between two
activities. "I0 Having transportation available to the
elderly, poor, and disabled, creates access for these groups
to goods, services, or jobs that might not have been readily
available. This benefit gives credence to the ADAPT'S
(American with Disabilities for Attendant Programs Today)
slogan, "To boldly go where everyone has gone before."
A result of the urban changes discussed in Chapter Two
is the transformation of the typical transit rider. The
proliferation of the personal automobile changed the face of
the average rider of public transportation. People unable
to drive cars (old, poor, handicapped, young) as well as
women became the chief users of public transportation.
. . . Even by 1965, the mileage traveled as a car driver, or as a local bus passenger, showed a very
18 Martine? Francisco. "Access: The Transport-Land Use Economic Link." Transportation Research B: Methodology. V29 1995.

substantial age and sex imbalance . . . 8 3 % of total car mileage was driven by men of working age, whereas 7 3 % of passenger miles made by bus were women, the young and the old. 19
During the early years of public transportation, transit
riders were representative of most facets of society. As
the preceding quote illustrated a disparity between working-
age men and the rest of the community utilizing public
transportation grew.
As stated earlier in this chapter, public
transportation riders tend to be either poorer, younger,
much older, or more likely disabled than a typical citizen.
The subsidization of public transportation redistributes
income from richer to poorer. Since the money is earmarked
for transportation, the public can be relatively assured
that it is used properly
The private automobile is deceptively subsidized and
has hidden costs to society
Cheap as they are to drive, cars are enormously costly to society. When the bills are added up-- for pollution, road construction, accidents, and warships in the Persian gulf--the total is between $ 3 0 0 billion and $ 7 0 0 billion a year. Were these costs paid at the pump, gas would be $6 to $11 a
20 gallon.
19 Pickup, Laurie; Stokes, Gordon; Meadowcroft, Shirley; Goodwin, Phil; Tyson, Bill; Kenny, Francesca. Bus Dereeulation in the Metropolitan h. (1991) p. 15. 20 Rauber, Paul. "Key to Gridlock? The free rider goes the way of the free lunch." Sierra. March-April 1994, v79 p. 45.

Subsidization of the personal automobile is more covert than
subsidization of pubic transportation. Difficulties abound
for any government that would try to tackle the hidden
subsidies of personal transportation.
Mass urban transportation can reduce traffic congestion
resulting in many positive externalities. "...Every 50
persons diverted to public transit represent a reduction of
approximately 30 automobiles in the traffic stream, with a
consequent easing of downtown traffic and parking
c~ngestion."~' The reduction in congestion on the roads
during peak travel times produces many positive benefits.
The driving time saved, created by having fewer vehicles on
the road, the reduction of air and noise pollution, as well
as fewer accidents made possible by those absent vehicles
are examples of positive externalities.
Arguments Against Subsidization
Numerous reasons exist for not subsidizing public
transport. The numbers of individuals who are dissatisfied
with taxes and expenditures are growing. A majority of
2' Sheldon, Nancy; Brandwein, Robert. The E c o n o m i c c t of Investments in Public Transit. (1973) p. 3.
states have limitations on taxes and expenditures by local
2 2 governments. "There is nothing wrong with the United
States that a dose of smaller and less intrusive government
would not cure. This conservative viewpoint may have
some validity. Public systems are less efficient. Also it
may be contended that it is not fair for individuals to be
taxed for a good that they do not use. Also, subsidizing
public transportation chokes off potential private
competition. Furthermore, it may be argued that patrons do
not really need public transportation.
Public systems are less efficient and have weak methods
of reducing spending.
. . . Public enterprises in general offer minimal incentives for profitable operation, while those bearing the ultimate cost of inefficiencies (mainly local taxpayers) generally lack the incentives to monitor operations effectively. 2 4
Private companies search for inefficiencies to eliminate
them and become more competitive in the market environment.
Some examples of governmental failures in the public transit
are :
22 Mullins, D.; Joyce, P. "Tax and Expenditure Limitations and State and Local Fiscal Structure: An Empirical Assessment." Public Budgeting & Finance. Spring 1996. p.77. 23 Milton Friedman as found in Brown, Peter C. &&rhe the Public Trust (1991) p.vii. 24 Seligman, Daniel. "Notes from Underground. (Privatizing the local transit system in New York City)". Fortune. April 8, 1991 p. 128.

*Miami's 21-mile rail system has operation costs three times the amount forecast, with only 15 percent of the ridership forecast.
*Los Angeles' $900 million trolley system carries barely more than the ridership of the bus lines that parallel the route.
*Portland's system--built for $215 million--is drawing less than half the passengers forecast.
*In Atlanta, public transit accounted for 20 percent of commuting in 1990, down from 25 percent in 1980, and rail ridership "has ~tagnated."~'
To have projects approved, it is often necessary to have
high forecasted numbers of riders. Because of subsidization
the general public pays for these inaccurate projections.
People who benefit should pay. With subsidization,
persons who do not ride urban transportation are inequitably
forced to pay for the service.
Traneportation riders really do not need it. Although
many disenfranchised groups have direct input into the
transportation agency's planning process, it may be argued
that the individuals are not solely reliant on public
transportation
Few 'transit dependents' are truly carless in the sense that they are unable to share in the auto- mobility of friends, neighbors, or relatives. While many are ride-reliant, few are solely
25 Beardsley, Charles. "Slow Ride on the Fast Mail". Mechanical Engineering. October 1993. p. 4.

dependent on public transportation for personal mobility. 2 6
More people may become transit dependent, as their pool of
friends runs out.
Subsidizing public transportation chokes off potential
competition. Subsidizing public transportation places
private transportation providers at a disadvantage.
On the expenditure side, it is sometimes contended that the current expenditure share is so high that the private sector of the economy has been squeezed in to a position where it has to operate far below its productive potential. This
2 7 a o v m .
No doubt, if government subsidization of public
transportation ended, private taxi companies would be
immediate benefactors.
The scale of government has grown too large. This
argument specifically points to the inability of government
to yield to market pressures as the reason for inefficiency.
This argument suggest that there might be an optimal size of
group receiving service for each unit of government
'production'
26 Jones, David. Urban Transit Policv: An Economic and Political H*. Englewoods Cliffs, New Jersey (1985). p. 98. 27 Organization for Economic Co-operation and Development. Social Policy Studies Social Expenditure 1960-1990 (1985). p. 14
Government service is likely to be inefficient because the production unit must, by definition, be the same size as the consumer unit without regard to the optimal size. Therefore, if the most efficient size for a school system is one that services 50,000 people, then cities with populations of 1,000, 10,000, 100,000 or 1 million would all be inefficient if the each had their own
2 8 school system.
Likewise, if the most efficient size for a public
transportation system is one that services 250,000 people,
then any city with a different population would be
inefficient if it had its own system.
Potential Determinants of the Farebox Ratio
The result of subsidization is the farebox ratio. This
ratio is the percentage of operating expenses that are
covered by fare revenue. Any expense that is not covered by
fare revenue is typically some form of government subsidy.
This research examines the relationship between transit
authority size and the farebox ratio. The model to be
researched has the farebox ratio as a function of calculated
city density, service area, service area population,
operating expense, fleet size and average fleet age.
28 Savas, E. S. -9 the Public Sector. Chatham House Publishers, lnc. Chatham, New Jersey. p. 82.
3 7

The Service Area Population is hypothesized to have a
positive relationship with the farebox ratio. Typically, as
the population increases so does the number of riders and
the resulting fare revenue. "...For rapid transit is
usually argued to be appropriate only for populations
densities in excess of 10,000 (persons) per square mile. ,,29
To get these degrees of densities, there must be vast
numbers of people in the service area.
A negative relationship is expected with the service
area. "The pattern of home and job locations and other
activities disperse - much more difficult for a public
transport systems to serve. "30 Ordinarily, as the service
area is increased, new areas are added with densities not as
compact as the original service area. This expansion should
increase operating cost without adding the same proportion
to the farebox revenue.
The greater a city's density, the less likely that its
population may rely on personal transportation. While every
metropolitan area has shown growth from 1950 to 1990, almost
29 Hilton, George. Federal. American Enterprise Institute for Public Policy Research. Washington DC (1974) P.82. 30 Pickup, Laurie; Stokes, Gordon; Meadowcroft, Shirley; Goodwin, Phil; Tyson, Bill; Kenny, Francesca. Bus Dereeulation in the P&rooolitan Areas. ( I 991) p. 16.

31 every city has lost population. Transit system designs
have not followed this trend.
Most Transit routes are radials focusing on the CBD. Because the dispersion of suburban trip ends, most circumferential bus routes carry few passengers at a high cost per passenger. 32
Historically as urban density has declined, revenues for
public transit have decreased.
Being a component of the farebox ratio, the variable
operating expense is expected to point to some sort of scale
(Savas). The results are expected to indicate that a point
exists where diminishing return outweighs the economies of
scale.
The service fleet has a direct impact on the operating
cost. Operating more buses requires more mechanics to
3 3 handle roadcalls. Conversely, having more buses allows an
agency to provide more service and thus collect more fare
revenue. Similar to the operating expense variable, the
results are expected to indicate in large transit
authorities that diminishing returns outweigh the economies
of scale.
3 1 Matoon, Richard. "Can Alternative Forms of Governance Help Metropolitan Areas?" 32 Black, Alan. p . M c G r a w - H i l l , Inc. St. Louis, Mo. (1995)P.SS. 33 Roadcall or Road Call- Unscheduled maintenance requiring either the emergency repair or service of a piece of equipment in the field or the towing of the unit to the garage or shop. m o r t a t i o n Expressions. US Deparhnent of Transportation, Bureau of Transportation Statistics. Washington DC (1996)
Average fleet age is expected be negatively related to
the farebox ratio. Older vehicles tend to need more
maintenance than newer ones thus increasing operating cost
without adding operating revenue.
The following function describes the model. The
direction of the hypothesed relationship found in
parentheses.
Farebox Ratio= £(Service area population) - (Service area
square miles) + (Calculated city density) - (Operating
Expense) - (Total Fleet) - (age of fleet)
This chapter presented an abridged version of the
history of urban mass transportation providers as well as
some reasons for subsidization of the current operators.
Finally, a model is presented for potentially determining
the farebox ratio. The following chapter will present the
methodology for testing this model.

Chapter Four
Methodology
Introduction
This chapter presents the methodology used to
investigate the hypotheses. The farebox model supplied from
chapter three is tested using regression. This will not be
the first time regression analysis has been done on data
from the Transit Profiles provided by the FTA. Brian
Cromwell used data from the Transit Profiles in his article
"Public Sector Maintenance: the Case of Local Mass-Transit."
Research Design
Published by the Federal Transit Administration (FTA),
the 1994 Transit Profiles Asencies in Urbanized Are=
Fxceeding 200.000 Population furnishes the data used in this
analysis. These data provide a list of all transit
authorities in the United States. Correlation and multiple
regression are used to analyze the data with respect to the
model.
Upon inspection of the raw data listed in appendix one,
it may be noticed that some transit agencies are not
represented. The following transit agencies were given
exemption for 1994: Dallas-Grand Prairie, Dallas-Plano,
Shopper Bus Service, Newburgh-Beacon Bus, New Orleans-St.
Bernard, NW IN-GNS, and NJ-International Bus. 1
Since this data is only for 1994, it provides a cross
section of the public transit industry rather than a
longitudinal study. For this type of analysis, there are
many benefits to using cross sectional data. The analysis
of the cross section data allows comparisons to be made
between a variety of transit authorities. Since the data is
from municipalities all over the United States, the data
avoids problems found with regional bias. The cross
sectional study also looks for evidence of the assumed
hypotheses.
This research is subject to all the constraints of a
cross sectional study. With a cross sectional study the
data may be subject to socioeconomical 'spikes,' such as
increased funds available to transit authorities by the
Intermodal Surface Transportation Act of 1991. It also does
not take into account individual transit agencies local
I Transit Profiles. P. B-2.
decisions, nor does it encompass regional mandates imposed
by state or local governments.
To convert the data to a usable format, certain transit
authorities were eliminated from study. Some agencies do
not collect fares and thus did not generate a farebox ratio.
This was most evident in some sub-contractors and in cities
such as Las Vegas, operated by ATC. After eliminating these
agencies, 165 cases remained.
Model
Multiple regression analysis makes it possible to test
a model. (The following equation represents the model as
operationalized by the variables.) The sign in front of the
independent variables represents the expected direction of
the relationship.
Farebox Ratio= f (SAPOP , SASQMI , OPEREXPS , AVGAGE , CALCDENS , TTFLEET)
( + ( - ) ( - 1 ( - ) ( + I ( - )
The results of the multiple regression analysis are used to
examine the influence of each independent variable on the
f arebox ratio .
Dependent Variable (Farebox Ratio)
The ratio of total fares collected to operating
expenses is the farebox r a t i o . Any farebox ratio less than
one indicates that some form of subsidy must exist to make
up the remainder of the operating expenses. Subtracting the
farebox ratio from one hundred percent produces the
percentage subsidy of operating expenses that a transit
authority receives to operate.
endent VarxiiLcs
Most of the independent variables in the model relate
to some form of transit agency size. The size could be
geographical, fiscal, capital, or population. This analysis
intends to use all of these forms of size. Nearest city
density and average age of vehicles have been added because
of the availability of the data, curiosity, and literature.
The Service Area Population (SAPOP) is the total number
of individuals within the transit agency's jurisdiction.
The service area (SASQMI) is the total number of square
miles within the transit agency's jurisdiction. The
operating expense is the total dollars expended by each
agency to function on a yearly basis. Being a component of
the farebox ratio, operating expense (OPEREXPS) is predicted
to indicate a point of efficient scale of operation.
Average city density (CALCDENS) is a calculated variable.
It gives the aggregate number of people per square mile in
the operating city. Total fleet (TTFLEET) is a capital size
variable. It represents the total number of vehicles
operated by a transit authority. Average fleet age (AVGAGE)
is the average age of the bus fleet.
Multicollinearity
One of the main concerns when executing multiple
regression analysis is multicollinearity. Multicollinearity
exists when two independent variables are highly correlated
with each other. If one variable is not excluded, then its
actual effect on the dependent variable is miscalculated.
To avoid this problem a correlation matrix is created to
determine the correlation coefficients.
Conclusion
This chapter presented the methodology used to
investigate the hypotheses. Almost all variables can be
used 'as is' for the analysis. Regression analysis is
employed to determine the effect of the independent
variables on the farebox ratio. The findings of the
research are be presented in Chapter Five.
Chapter Five
Analyeis of Findings
Introduction
This chapter presents the findings of the research.
The validity, the significance of the model, and the results
of the accuracy of hypotheses representing the farebox ratio
will be presented.
Correlation Matrix
The test to avoid the influence of independent
variables being overstated is the use of the correlation
matrix. If the correlation between two independent
variables is high, then multicollenearity probably exist.
In the correlation matrix developed for this project, a
high correlation existed between two variables. Operating
expense (OPEREXPS) and total fleet (TTFLEET) had a
correlation of .9434, a correlation of one is the highest
correlation possible. This problem could be foreseen
because much of a transit authorities operating expense deal
with the size of the fleet (i.e., numbers of drivers and
mechanics to be hired). The correlation matrix follows in
table 5.1.
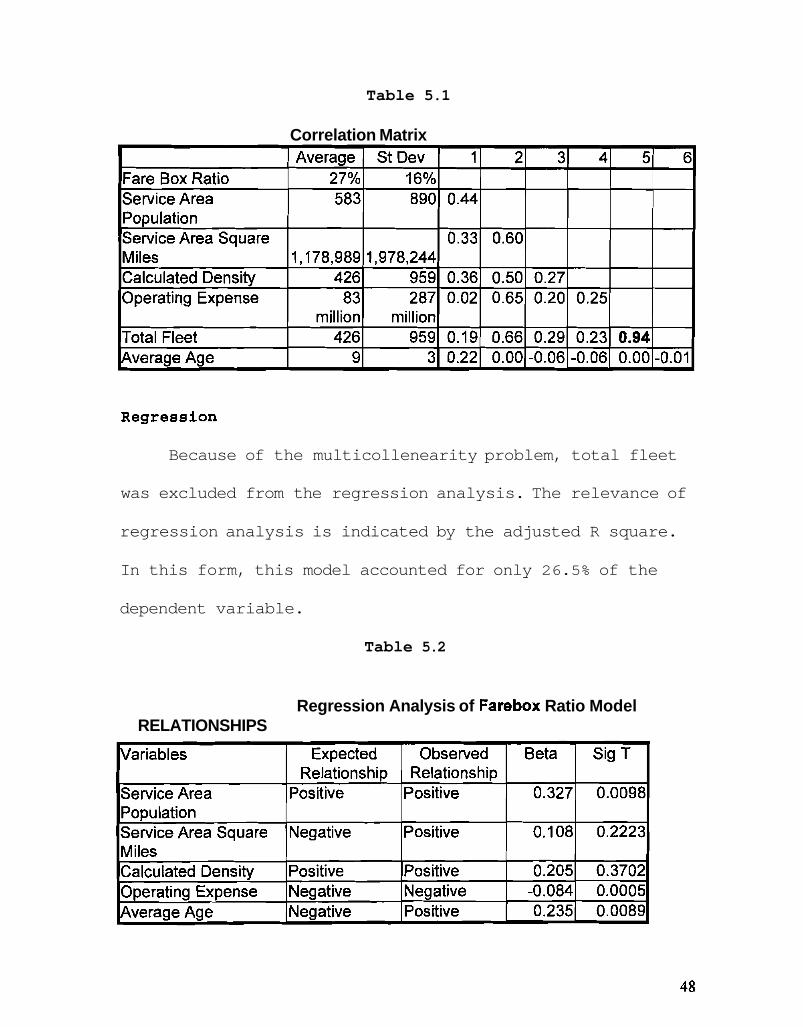
Table 5.1
Correlation Matrix
Regression
Because of the multicollenearity problem, total fleet
was excluded from the regression analysis. The relevance of
regression analysis is indicated by the adjusted R square.
In this form, this model accounted for only 26.5% of the
dependent variable.
Table 5.2
Regression Analysis of Farebox Ratio Model RELATIONSHIPS

Unfortunately, since this model accounted for such a
low portion of the variance, the absolute effect of the
variables was not determined. In this model the most
significant variables were average age, calculated density,
and service area population. Surprisingly, the average age
of the bus fleet was the most significant variable.
The first hypothesis, the percentage subsidy per
transit agency (1-FBR), will be less for Regional Transit
Authorities (RTAs) with a greater calculated density of the
cities in which they operate, was supported. The variable,
calculated density, was the second most significant
variable. The beta coefficient was positive -205.
The second hypothesis, the greater a transit agency's
operating expenses, the more likely that the percentage
subsidy per transit agency is greater was not strongly
supported. Although the beta coefficient was slightly
negative (-.084), the value of the coefficient was not
significant (p = .3702) .
The third hypothesis, The larger the service area the
greater the percentage subsidy per transit agency was not
supported. The sign of the beta coefficient (+.108) was
opposite of the expected value and the significance of this
variable was marginal.
The fourth hypothesis, the greater the service
population the less the percentage subsidy per transit
agency, was weakly supported. This variable had the largest
beta coefficient (.327) ; the significance was relatively
strong (p = .0098) .
Unexpectedly, the variable with the greatest
significance(.0005) was average age. The beta coefficient
was positive (.235), which was the opposite of the
hypothesized relationship between the variables.
An explanation for this finding might be the
regulations regarding ADA compliance, or a transit
authority's excursions into global positioning satellite
technology. Newer buses must be able to accommodate
wheelchair-bound patrons. The complexities of wheelchair
lifts increase the cost through training and retention of
maintenance staff, thus increasing cost. Also simply having
the intricate apparatus increases the likelihood of a
service-stopping breakdown, thus creating more roadcalls as
well as requiring more buses to complete the service.

Conclusion
The results from this model proved to be weaker than
expected. The model only accounted for 26.5% of the
variation in the dependent variable. Surprisingly, the
variable with the greatest influence was shown to have an
opposite relationship than what was hypothesized. In the
final chapter, conclusions are drawn and suggestions for
future research are presented.
Chapter Six
Conclusion
Introduction
In social sciences, correlations tend to be much more
difficult to find due to the myriad of factors that affect
an observation. In this chapter, conclusions are drawn and
suggestions for future research are presented. The model
accounted for 26.4% of the variation in the dependent
variable. This is a relatively insubstantial model.
Surprisingly, the variable with the most influence was shown
to have an opposite relationship than what was hypothesized.
Summary
The first hypothesis, the percentage subsidy per
transit agency (1-FBR), would be less for Regional Transit
Authorities (RTAs) with a greater calculated density of the
cities in which they operate, was supported. Due to the
beta coefficient and the significance of this variable, it
probably should be kept in the model.
The second hypothesis, the greater a transit agency
operating expenses, the more likely that the percentage
subsidy per transit agency is greater was not supported. Due

to the beta coefficient and the lack of significance of
operating expenses, this variable probably could be dropped
from the model.
The third hypothesis, the larger the service area, the
greater the percentage subsidy per transit agency, was not
supported; and it probably could be dropped from the model
or combined with the service area population to create
another variable. However, in the latter case, it is likely
to have multicollinearity problems with the calculated city
density variable.
The fourth hypothesis, the greater the service
population the less the percentage subsidy per transit
agency, was weakly supported. Since this is one of the
three variables with noticeable significance, this variable
should be kept.
Unexpectedly, the variable with the greatest
significance(.0005) was average age of the bus fleet. The
beta coefficient was positive ( . 2 3 5 ) , which was the opposite
of the hypothesized relationship between the variables.
A possible reason for the average age of the vehicles,
having a slightly positive correlation with the farebox
ratio, might be due to the length of existence of some

transit agencies. Although the Urban Mass Transit
Administration started granting moneys to local governments
in 1964, many transit authorities were not created until the
late 1980s or 1990s. There might be a comparative advantage
of operating for a longer period of time. Also newer
vehicles are more likely to be alternative fuel vehicles,
have electronic fareboxes, and/or be wheelchair lift
equipped. If any of these feature malfunctions while the
vehicle is in service, the vehicle will have to be pulled
out of service for repair.
Strengths and Weakneeeee of the Project
The major strength of this research is that it
illustrates the feasibility of creating a model for studying
transit authority operations and expected performance
indicators.
The low significance indicates a problem with either
the variables chosen or the way the data were processed. If
the method of data processing was flawed, the research might
have yielded better results if the data were separated by
region. Different regions of the country may have different
factors influencing ridership and fare revenue. If this was

the case, then the data should be separated, and individual
multiple regression analyses should be run for each area.
The extremely large transit authorities could be removed so
as not to skew the information base.
It is also possible that the variables were not the
best choices. Better variables might exist for prediction;
these potential variables are discussed in the following
section.
Suggestions for Future Research
Transit authorities are ideal agencies for statistical
analysis. Data for the authorities is collected by the FTA
on an annual basis. Records are methodically kept and
presented in published form, with more data soon to be
available via the internet.
A longitudinal study would be ideal, with only the time
required for data entry being preclusive. This might avoid
potential regional factor problems. Using the farebox ratio
as a gauge of efficiency, research involving the total
number of administrative employees or general level of
employee education (Savas) would be interesting as well as
potentially significant.

A number of factors not contained in the FTA report
might also be considered. Both internal (operating) and
external (environmental) factors could be used. One
important factor that may be important to research is the
true city density. The calculated city density (CCD) was
derived from the data from the transit profiles. By using
this data, an average was derived for the entire city.
Since transit agencies' jurisdictions regularly gerrymander
a municipality's territory, this variable may not have been
as significant as possible.
Also, median income of cities should probably be
included in some form. The US Census Department provides
this data.
. . . Travel tends to increase with income, these low income households accounted for only 19 percent of trips made in urban areas. On a modal basis, they accounted for 5 percent of commuter rail trips . . . Although travel increases with income, households will low incomes account for a larger percentage of transit ridership that households
1 with higher incomes.
So operating a transit authority in an area with a lower
income per capita might gain more ridership. To include
this data, a new model is suggested. The proposed model
'~lthshuler, Alan. I n inorans~ortaticnicl. Lexington Books. Lexinton, Massachusetts. 1979. P. 139.
includes a portion of the model tested in this applied
research project as well as a couple other variables.
Farebox Ratio= f (Service area density) - (Total Fleet) +
(age of fleet) - (median household income) + (Base Fare)
- (Vehicles Operated Maximum Service/Vehicles Operated Base
Service)
This research project explored some of the difficulties
in creating a function that will predict economic efficiency
in public transportation operators. Controversy regarding
equity issues and economic efficiency of these operations
will probably continue. Quite possibly this controversy
will be augmented by future work choices such as
telecommuting and varied work hours. The thinning densities
of urban centers will continue to provide challenges to
transportation planners and public administrators.

A Look Ahead: Year 202Q. Proceedings of the conference on long-range trends and requirements for the Nation's Highway and Public Transit Systems. Transportation Research Board. Washington, D.C. 1988.
Althshuler, Alan. Current Issues in Trmsportation Policy. Lexington Books. Lexinton, Massachusetts. 1979.
a - Translt Svstem. Austin Transit Study, Prepared by the City of Austin in cooperation with USDOT and Urban Mass Transit Administration 1972.
Anderson, J. Edwards. -it Systems: Tkorv. - D.c. Heath and Company, Lexington, Massachusetts. 1978.
Beardsley, Charles. "Slow Ride on the Fast Mail". Mechanical Engineering. October 1993.
Black, Alan. Urban Mass Transportation Pl-. McGraw- Hill, Inc. St. Louis, Mo. 1995.
Black, Ian A d v a n c e d U r b a n Lexington Books, Lexington Massachusetts. 1975.
Button, K.J. The Economics of Urban-. Saxon House, Hampshire, England. 1977.
Considine, John J. "Assessment of the Impact of Changes in Transit Systems Using Intervention Analysis" Transportation Research B: Methodology 1988.
Demery, Leroy W., Jr. "Supply-side analysis and verification of ridership forecasts for mass transit capital projects." Journal of the American Planning Association. Summer 1994, v60, n3.
Foster, Mark S. From Streetcar to S-ay: America City Planners and Urban Tramortation. 1900 - 1940 . Temple University Press. Philadelphia, PA 1981.
Frank, Robert. ~croeconomics and Behavior. McGraw-Hill Inc. St. Louis 1991 p 605-608.
Hamilton, Neil; Hamilton, Peter. Governance of P u b h -. Lexington Books, Lexington, Massachusetts. 1981 (ppl-7)
Hibbs, John. Transport for Passenae~. The Institute of Economic Affairs, Westminster, England 1971.
. , Hilton, George. Federal Transit Subs-. American Enterprise Institute for Public Policy Research. Washington D.C. 1974.
Husted, Bill "Futurist Can Peer Ahead on the Internet" Austin American Statesman, 1996.
Jones, David. m a n Transit Policy: An Economic and Political astory
, . . Englewood Cliffs, New Jersey 1985.
Jones, Ian. m a n Transport Ap-. Halsted Press, New York, 1977.
Martinez, Francisco "Access: The Transport-Land use Economic Link." Transportation Research B: Methodology. V29 pp. 457- 470. 1995.
Mattoon, Richard. "Can Alternative Forms of Governance Help Metropolitan Areas?" Economic Perspective November/December 1995.
Mogridge, Martin. "No more mean streets. (future of transportation)" New Statesman and Society. Sept. 1 1995, v8, n386.
Mullins, D.; Joyce, P. "Tax and Expenditure Limitations and State and Local Fiscal Structure: An Emprical Assessment." Pub1 i c Budgeting &Finance. Spring 19 9 6
Organization for Economic Co-operation and Development. Social Policy Studies Social F u t u r e 1960-199Q. Paris, France. 1985.
Ornati, Oscar, A. T r a n s p o r t a t i o n N e e d s New York. 1969.
Pickup, Laurie; Stokes, Gordon; Meadowcroft, Shirley; Goodwin, Phil; Tyson, Bill; Kenny, Francesca.

DereaulatiQn in the Metr0~0UIan Ares. Avery. Brookfield, Vt. 1991.
v R e D ? Tr~ri~y~ortation, A report to the 59th Legislature. Texas Legislative Council. Austin, Texas, December 1964.
Rauber, Paul. "Key to Gridlock? The free rider goes the way of the free lunch." Sierra. March-April 1994, v79.
Ruppenthal, Karl. Issues in Transportation Rc-. Charles E. Merrill Books. Inc. Columbus Ohio 1965.
Ryan, Robert Lee A Data Envelogm~nt w s i s of
Qperatiou. university of Texas dissertation 1994.
. . Savas, E. S. -the. Chatham House Publishers, Inc. Chatham, New Jersey. 1982.
Schulz, David 'Can Transit be Saved?" Prepared for the Chicago Tribune July 1992 found at: http://acns.nwu.edu/pubs/schulz - lhtm.
Seligman, Daniel. "Notes from Underground." Fortune April 8 1991.
Sheldon, Nancy; Brandwein, Robert. Econnmic and Socid Impact of Investments in Public T r d . 1973.
Shields, Patricia. "Cutting Back by Charging More: or What Public Administrators Should Know about the Demand for their Products." Draft prepared for delivery at the national Conference of the American Society for Public Administration. 1983.
Shields, Patricia. "Freud, Efficiency and Pragmatism." Society. January/February 1989.
Talley, Wayne "An Economic Theory of the Public Transit Firm. Transporta tion Research B : Methodology 1988.
Tanzer, Andrew. "All aboard for Privatization: Not only do the Commuter Trains run on time in Hong Kong- the darned

Things Actually make Money with Low Fares." Forbes, Oct. 21, 1996,v158, n10.
Thayer, Fredrick. "Balanced Budgets and Depressions." American Journal o f Economics and Soc io logy , April 1996, v55, n2.
, . on l n an Aulnu - Socletv: - -nu Mobllltv and der Persm. Special report 218. Committee for
the study on improving mobility and safety for older persons. Transportation Research Board. Washington D.C. 1988.
qlt Proflles Auencles In U r b w e d Areas Exceed= 2 0 0 . 0 0 0 P o p u l a t i o n t Database E&p- Federal Transit Administration, Washington D.C. December 1995.
B e r Fees: Current Practices. Management Information Service. P.3.
Walker, James Blaine. Fifty Y-s of EapiiCkmsit 1864- m. Arno Press, New York. 1918.
Winey, Richard; Hatry, Harry. -u the Fffectivon~ss of t services: Transport-. The Urban
Institute, Washington D.C. 1972.
Yago, Glenn. n e Decline of T r a u . Cambridge university Press, New York. 1984.