Embed Size (px)
Citation preview

MPRAMunich Personal RePEc Archive
An Empirical Investigation of GoingPublic Decision of Indian Companies
Manas Mayur and Manoj Kumar
2006
Online at https://mpra.ub.uni-muenchen.de/28685/MPRA Paper No. 28685, posted 7. February 2011 19:44 UTC

Working Paper Series (WPS), Indian Institute of Management, Lucknow WPS Number: 2006-07/06
2
Abstract
This paper examines the determinants of the going public decision of the Indian
companies. A probit regression model is used to analyze the influence of fundamental
financial data of Indian companies on their going public decision. The size, profitability,
age and leverage emerged as the significant determinants of going public decision of
Indian companies. The statistically insignificant relationship between the financing needs
and likelihood of an IPO found in our study is similar to the Pagano et al, 1998, and
contrary to the findings of several other studies done on same issue.
Key Words: Initial Public Offerings, Going public decision, emerging markets, India

Working Paper Series (WPS), Indian Institute of Management, Lucknow WPS Number: 2006-07/06
3
1. Introduction
The last decade had witnessed significant progress in the Indian capital market. During
this period, it graduated into a mature market, to be at par with or even better than the
developed capital markets on certain parameters. At the end of 2003, Standard and Poor’s
(S&P) ranked India as number one in terms of investors and the number of listed
companies.
Primary market is that segment of capital market which actually provides platform to the
companies to raise fresh capital. Indian primary market has emerged as a major source of
finance for the Indian companies. A growing number of companies have been accessing
the primary market for equity capital instead of depending on other modes of funding.
The annual trend in number of Initial Public Offerings (IPOs) and capital raised through
them from the Indian primary market is shown in Table 1. The capital mobilized via IPOs
increased sharply from Rs.1704 crore in 1990-91 to Rs. 13,443 crore in 1993-94.
However the trend declined drastically in the subsequent years till 2003-04 when Indian
companies raised only Rs. 5,732 crores through their IPOs. The condition improved in
2004-05 when Indian companies raised Rs. 25526 crore as compared to Rs. 22145 crore
in preceding year through their IPOs. Number of companies going for IPOs followed the
similar unsteady trend. Whereas a total of 1428 companies went public during 1995-96,
only 62 companies went public in 1997-98. The irregular trend continued in later years
also, when 102 companies went public in 2005-06 as compared to only 14 IPOs in 2002-
03.
A steady level of activity in primary market is necessary for the overall functioning of the
capital market. The volatility in the volume of new issues can affect the liquidity, size
and depth of the capital market which can ultimately affect the investment opportunities
for the investors. Hence it is very important for investors, policy makers, stock exchange
authorities, and finance researchers to understand the determinants of going public
decision. The present study is an attempt in the above direction and its findings are
expected to facilitate a better understanding of the going public decision among the

Working Paper Series (WPS), Indian Institute of Management, Lucknow WPS Number: 2006-07/06
4
various stakeholders and thereby, more number of companies may be motivated to go in
for IPOs.
A traditional view in corporate finance is that companies access the public equity market
via IPOs to raise equity capital to finance their growth. However, recent empirical
evidences have lead researchers to question whether raising equity capital is the only
purpose to do IPO.
There is a growing literature that shows that raising capital through equity market is not
the only reason behind going public2. However, actual motivations illustrated by these
studies differ from each other. In a widely cited study, Pagano et al. (1998) found
rebalancing of capital structure to be a major motive behind going public. Greenwood
(2005) observed that companies do IPO to take the advantage of the period when the
companies in same industry are overvalued. Brau and Fawcett (2006) concluded
acquisition to be a major motivation behind going public. Brau et al. (2005) revealed that
companies do IPO to enhance their reputation in the market. A detailed review of
relevant literature is presented in the next two sections.
The research question of this study is: What are the determinants of going public decision
of the Indian companies? To address the above research question, the fundamental
financial data of selected publicly listed and privately held Indian companies is analyzed
using a probit regression model. This study has certain important departures from the
existing studies. Firstly, the study analyzes the temporal variation in fundamental
financial variables that can potentially affect the going public decision of companies.
None of the existing studies have analyzed the impact of temporal variation in the
fundamental financial variables on the going public decision of companies. Secondly,
data analyzed has comparatively longer time frame compared to existing studies. Thirdly,
the study focuses on the Indian companies which make it distinct from the other study on
emerging markets. Fourthly, study gazes the impact of macro-economic variables viz.,
interest rates, stock market return, stock market indices, liquidity, market to book ratio on
2 We take the meaning of IPO and going public as same.
Working Paper Series (WPS), Indian Institute of Management, Lucknow WPS Number: 2006-07/06
5
the going public decision of companies. Existing studies have included only few of them.
Finally, none of the studies have analyzed the combined impact of firm specific
fundamental financial variables and macro-economic variables on IPO decision of firms.
The remaining part of the paper is organized as follows. Section 2 presents the
theoretical framework of the study. Section 3 summarizes the prior literature on the issue.
The details about the data, model and methodology is presented in section 4. Section 5
analyses the reasons for temporal variation in number of IPOs and rupee amount raised
through IPOs by Indian companies. Finally the discussion on results and conclusion is
provided in section 6 and section 7.
2. Theoretical framework
Starting with the seminal paper of Pagano et al. (1998), numerous studies on IPOs have
analyzed the determinants of firms’ going public decision (Helwege and Packer, 2003;
Boehmer and Ljungqvist, 2004; Chemmanur et al., 2005; Kim and Sung, 2005; Rosen et
al., 2005; Albornoz and Pope, 2004; Brau and Fawcett, 2006 etc.). These studies have
stated several interesting theoretical underpinnings behind firms’ going public decision.
The theoretical framework for present study is given below and is adapted from the above
studies.
Most researchers explain the firms’ IPO decision in terms of associated benefits and costs
of going public, as are summarized in Table 2. First, theories that interpret firms’ IPO
decision in terms of associated benefits of going public are explained. Next, theories that
interpret firms’ IPO decision in terms of associated costs of going public are explained.
Benefits Related Theories
Raising Capital: Most of the theoretical models view companies’ going public decision
as an additional source for raising capital (other than banks and venture capitalists) to
finance their growth and expansion. The opportunity to tap public markets for equity
capital is appealing for high growth firms with large current and future investments that

Working Paper Series (WPS), Indian Institute of Management, Lucknow WPS Number: 2006-07/06
6
may have limited access to other financing alternatives due to high leverage and high
growth (Pagano et al., 1998 and Huyghebaert and Hulle, 2005).
Risk-Sharing and Diversification: Some studies have explained the companies’ going
public decision as risk sharing and diversification vehicle for owners. Huyghebaert and
Hulle (2005) asserted that companies with major investments on current projects for the
future growth tend to be risky. The owners of such high growth companies, therefore,
dislike investing more of their own personal wealth into their companies. Hence they rely
on external finance for funding of their major investments. The time lag between
investments and cash generation makes debt financing unsuitable. The high premium
charged by venture capitalists discourages such risky companies from raising money
through them. Hence IPO offers the most suitable form of financing.
Pagano (1993), Zingales (1995), Stoughton and Zechner (1998), and Chemmanur and
Fulghieri (1999) cites the owner’s desire to divest or diversify their wealth as an
important motive for their decision to go public. Albornoz and Pope (2004) explained
that the owners of a closely-held company tend to have a large investment in their
company and hence are overexposed to the risk. Therefore to minimize the risk
associated with this situation they diversify their risk by doing IPO for their company.
Therefore, the propensity to do IPO should increases with the size of promoter’s stake in
the pre-IPO company.
Lower cost of capital: The tax shields advantage of debt helps in reducing the overall cost
of capital. But a company cannot continuously minimize its overall cost of capital by
employing debt. A point or range is reached beyond which debt becomes more expensive
because of increased risk of excessive debt to creditors as well to shareholders. When the
degree of leverage increases, the risk of creditors increases, and they demand a higher
interest rate and do not grant loan to the company at all, once its debt has reached a
particular level. Further, the excessive amount of debt makes the shareholder’s position
very risky. This has the effect on increasing cost of capital. Thus, up to a point the overall
cost of capital decreases with debt, but beyond that point the cost of capital would start

Working Paper Series (WPS), Indian Institute of Management, Lucknow WPS Number: 2006-07/06
7
increasing. According to Scott (1976) and Modigliani and Miller (1963) companies
conduct a public offering when external equity minimize their cost of capital. Diamond
(1991) and Holmstrom and Tirole (1993) added that raising public equity offers the
opportunity to obtain low cost direct financing without the intervention of financial
intermediaries such as banks or venture capitalists.
Trading on major stock exchanges increases the visibility of the companies. Also a
sufficiently large number of quoted shares help in attracting more number of investors
(e.g. institutional investors). The visibility and popularity amongst the large number of
investors also helps in reducing the cost of capital (Booth and Chua, 1996 and Maug,
1998).
Liquidity: If an owner has raised money through IPO from dispersed investors then he
gains a lot when these investors start exchanging the company’s shares on stock
exchanges where the company gets listed. Listing on major stock exchange provides
liquidity in the stock and makes share trading cheaper (Booth and Chua, 1996 and Bolton
and Von Thadden, 1998). For a private company, trading involves considerable costs. Its
shares can only be traded by an informal search for a counterpart (Pagano et al., 1998).
Therefore, companies may go public to facilitate the trading of their shares via listing
them on formal stock exchanges aftermath to their IPOs.
Monitoring: In a private company, addition of more shareholders on existing one can be
very costly because each new shareholder in turn expends time and effort to check that
the company is a sound investment. Pagano and Roell (1998) emphasized that private
companies owned by large shareholders experience excessive monitoring. A large
shareholder, such as a venture capitalist, would be monitoring the company more closely
than a large group of small investors. Therefore companies would be willing to limit the
stake of large shareholders and dispersing it to small shareholders. But with the addition
of sufficiently many small investors, the cost of process becomes sometimes so large that
the company decides to go public. In a public company expanding the shareholders base
is comparatively inexpensive.
Working Paper Series (WPS), Indian Institute of Management, Lucknow WPS Number: 2006-07/06
8
Windows of opportunity: Myers and Majluf (1984) asserted that managers approve a
public offering only when they perceive their firm to be overvalued. Their argument was
based on the following assumptions: (a) managers act solely for the welfare of existing
shareholders; and (b) managers have superior insider information. Dharan and Ikenberry
(1995) asserted that managers are opportunistic in seeking a new listing domain.
Viewed in the above background, companies apply for listing in a prestigious exchange at
a time when their performance is at the peak, and hence firms have a greater chance of
making a successful listing. Further, companies match their IPO timings with the period
when the companies in same industry are overvalued. More the overvaluation more is
the possibility that a company will go public (Ritter, 1991).
Signaling hypothesis. Asymmetric information leads to a situation where the managers of
the issuing firm are supposed to be better informed than other investors. They signal
positive information through the undervaluation of the stock in the IPO (Allen and
Faulhaber, 1989; Grinblatt and Hwang, 1989; Welch, 1989). Greater underpricing
enables them to raise more capital in the future at more favorable rates. Signaling is
costly because it results in a wealth transfer from initial owners to new investors. The
signaling cost is compensated for by the fact that the subsequent capital issue will be
made at a higher share price. The companies could issue an IPO by proposing to investors
a smaller fraction of their capital initially, with a subsequent issue completely satisfying
their total capital needs. In this context lesser quality firms will not be able to compete
with higher quality firms. The former firms, given that there would be the risk that their
lower quality would be revealed before the capital issue, would prefer to issue the stock
initially at their true price for the exact amount of capital desired.
Publicity: The high visibility of severely discounted IPOs serves as a marketing vehicle for
issuers. Recent theoretical works on IPOs emphasize the benefits of publicity to both
customers and issuers. When companies go in for IPOs, they get publicity that helps them
to reduce the information asymmetry between insiders and outsiders. Their performance

Working Paper Series (WPS), Indian Institute of Management, Lucknow WPS Number: 2006-07/06
9
is visible in their stock price and hence it acts as an instrument for the customers which
can help them in accessing the value of firm (Subramanyam and Titman (1999)
Stoughton, Wong, and Zechner (2001) argue that the decision of a company to go public
may serve as a signal of its high quality to the product market. They proposed a model
where high-quality firms distinguish themselves, and thereby build product market share,
by incurring the indirect cost of underpricing and subjecting themselves to the scrutiny of
secondary market investors engaged in costly information production. In their model,
consumers relate the quality of a company’s products to the market prices of its listed
stocks. Consumers perceive a company’s products to be better if its stock prices are high
and hence, are ready to pay more for its products. Therefore a good company can charge
higher product prices in high market conditions. They showed that firms with higher first-
day returns should gain larger market share in the product market. Helwege and Packer
(2001) argued that these benefits should be higher for companies with a large customer
base. Therefore, there should be a higher propensity to go public in companies belonging
to retail trade sectors.
Cashing out by initial owners: Zingales (1995) and Mello and Parsons (1998) argued that
an IPO creates a public market for the company’s shares so that its initial shareholders
can convert shares into cash at any point of time. Black and Gilson (1998) added that the
IPOs provide venture capitalists an attractive opportunity to harvest their investments into
the risky businesses.
Currency for Mergers and Acquisitions (M&As): Some researchers have highlighted the
role of IPOs in facilitating corporate M&A activities. Zingales (1995) argued that an IPO
can serve as a first step in acquiring a company at an attractive price. Brau, Francis, and
Kohers (2003) supported Zingales (1995) that IPOs can create public shares for a
company which may be used as a “currency” in either acquiring other companies or in
being acquired in a stock deal.

Working Paper Series (WPS), Indian Institute of Management, Lucknow WPS Number: 2006-07/06
10
Costs Related Theories
Information Asymmetry and Adverse Selection Costs: The economics of information is
based on the premise that different parties of a transaction often have different levels of
information about the transaction. Information asymmetry refers to a situation in which
sellers often have superior information than buyers about some aspect of product quality.
Akerlof (1970) pointed that information asymmetry prevails in all markets. He identified
the fact that if the good quality sellers have no means to signal high quality, all products
in the markets are sold at a single price reflecting the average quality level of the market.
This leads to a situation where the high quality sellers have no other choice than to
withdraw from the market because high quality sellers in an information asymmetrical
market have to sell products at lower prices than actual worth of their products.
Ultimately only “lemons” (bad quality products) are sold on the market, which is how
buyers’ also view the products being sold in the market place. This leads to a market
failure situation referred to as “adverse selection”. Leland and Pyle (1977) noted that the
information asymmetry is particularly high in the primary markets. In IPO situations,
investors are generally less informed than the issuers about the true value and quality of
the company doing an IPO. Thus prevailing information asymmetries about the quality of
issuers in IPO market results in adverse selection and should be a factor influencing the
firms’ going public decision (Pagano et al., 1998 and Albornoz and Pope, 2004). They
insisted that information asymmetry adversely affects the average quality of the
companies seeking a new listing and thus affects the price at which their shares can be
sold.
Chemmanur and Fulgheri (1999) predicted that information asymmetry could result in an
IPO price lower than could be raised by selling private equity to a small group of venture
capitalists. They, therefore, argued that adverse selection can work as an obstacle for the
young and small companies which have little track record and low visibility. Rock (1986)
and Welch (1989) ascribed observed under-pricing in the IPOs to the presence of adverse
selection cost.
Working Paper Series (WPS), Indian Institute of Management, Lucknow WPS Number: 2006-07/06
11
Diamond (1991) asserted that the adverse selection problems can be avoided if a
company has visible profitability. A visible profitability can send positive signals to the
investors about the company’s quality, and hence a young company can also think of
accessing public capital market through IPO.
Loss of confidentiality: In most countries, the securities market regulator(s) have more
stringent disclosure requirements for the public companies than the private companies.
Some of the mandatory disclosures to be made by public companies may be internally
sensitive and whose secrecy may be crucial for their competitive advantage3. This may
deter the companies from going public (Campbell, 1979; Yosha, 1995; and Maksimovic
and Pichler, 2001).
Increased possibility of litigations: Possibility of getting entangled into litigations
increases significantly for the public companies. Because litigations are costly,
companies have incentives to avoid them. Hence companies may decide against going
public to minimise the possibility of legal suits (Tinic, 1988).
Higher taxes: Pagano et al. (1998) argued that tax outgo of companies as a fraction of
their operating income should experience a permanent increase in the post IPO period.
They attributed this increase to the close scrutiny of public companies from tax
authorities, reducing their scope for tax elusion and evasion relative to private companies.
Hence profitable companies or companies who are likely to pay more taxes may not like
to go public.
Initial and subsequent expenses: The initial and subsequent expenses associated with IPO
can discourage companies from going public (Bhattacharya and Ritter, 1983 and Ritter,
1987). Some of the major initial costs include: the lead underwriter’s commission; out of
pocket expenses for legal services; accounting services; printing costs; personal
marketing “road show” by managers; ongoing legal, accounting, filing and mailing
3 Public companies are required to release all operating and financial details to the public, at the time of
filing and on the annual basis after IPO. These details include sensitive information about their: markets,
profit margins, Research & Development (R&D) projects, present and future strategy.

Working Paper Series (WPS), Indian Institute of Management, Lucknow WPS Number: 2006-07/06
12
expenses; and other unforeseen expenses. Ritter (1987) observed that approximately 18%
of total proceeds are paid as initial expenses by US companies.
All public companies also have to keep incurring several recurring expenses on an
ongoing basis. Such expenses may include: listing fee to be paid to stock exchange(s),
relatively high annual auditing fees compared to being a private company, high printing
charges of annual reports, high costs of arranging share holders meetings and maintaining
investors’ relations etc.
3. Literature Review
Finance literature documents two major approaches to find out the determinants of going
public decision. The first approach is to examine managerial perceptions of determinants
of going public decision by conducting surveys of companies’ managers. The second
approach is to statistically analyse the: fundamental financial data of companies; and
macro-economic variables to know the determinants of their going public decision. The
results of survey based studies are discussed in first section followed by the discussion on
the results of statistical models.
3.1 Survey-Based Studies
Brau and Fawcett (2006) conducted a managerial survey of 336 CFOs of US firms which
hitherto either (a) had successfully completed their IPO; or (b) had initiated their IPO
process but later on chose to call off their IPO; or (c) were eligible to do an IPO but
decided to remain private. Their survey sample of 336 CFOs was a result of a response
rate of 18.1%. The survey revealed that: the acquisition purpose was a major factor that
motivated US companies to do IPO, issuers timed their IPOs to take advantage of
prevailing market conditions and preservation of decision-making control and ownership
were the main reasons for remaining private. The major strength of their study was their
large survey sample of 336 CFOs. However, the sample was derived from within a
narrow time span of only two years i.e., from 2000 to 2002. Due to the narrow time span
Working Paper Series (WPS), Indian Institute of Management, Lucknow WPS Number: 2006-07/06
13
used for deriving the sample, their study did not allow for variations in managerial
perceptions resulting from changes in market conditions and mechanisms over a larger
time frame.
Burton, Helliar and Power (2006) conducted a survey on managers and intermediaries
associated with going public decision of UK firms. They conducted their study in three
steps. First, personal interview through a semi-structured questionnaire was undertaken
with various parties involved in the IPO process. The interviews were conducted with ten
organizations that had been involved in IPOs. Second, postal questionnaires were sent to
UK companies that had an IPO in last two years. Out of a total of 450 companies, 102
companies responded back, representing a response rate of 23%. Third, information
about the amount that each company had raised and their market capitalization was
obtained through secondary sources. The survey revealed that: the benefit in terms of
increased visibility and reputation associated with IPO had major influence on going
public decision; the need for growth was the most important determinant of timing of the
issues and the biggest difficulty encountered by the managers was to manage both, the
IPO process and the company operations together.
Brau, Ryan and DeGraw (2005) carried out a survey of CFOs of 438 US firms (with
response rate of 44.5%). The sample was divided into pre-Internet bubble (1996-1998)
and post-Internet bubble (2000-2002) IPOs. Due to the anomalous nature of the IPO
market during Internet bubble, the study did not survey firms that went public during the
height of the Internet bubble between 1998 and 2000. They found that : financing of
growth and increase in liquity was two major motivation behind going public decision,
CFOs’ sentiment remained same in bull and bear periods and underwriting fees and
indirect costs related to going public were major concerns for CFOs in IPO.
Marchisio and Ravasi (2001) conducted a survey on family-owned companies of Italy.
The result of the study was based on the responses of 54 family-owned firms (with 73%
response rate) who went public during 1996-2001. The research question of the study
was, “why do family owned firms do IPO?” Specifically, authors investigated strategic
Working Paper Series (WPS), Indian Institute of Management, Lucknow WPS Number: 2006-07/06
14
motives behind going public decision. The survey revealed that beside the usual financial
motives, family-owned firms go public to increase the visibility and to expand and
strengthen the network of relationships that can sustain entrepreneurial activity.
Stanley B. Block (2005) carried out a survey on US firms that went private between
January 2001 and July 2003. Out of a total of 236 firms that went private, 110 firms
participated in the survey (response rate 46.65%). The study investigated the reasons
behind ‘going private’ decision of the firms and found that the following factors can
motivate a company to become private again: (a) the costs associated with being a public
company in terms of pressure and time constraint on top management, (b) absence of
liquidity and (c) threat of delisting by the stock exchange.
Park (1990) carried out a survey on Korean companies. The study showed that the most
important benefit of going public is easy access to a source of funding. The second most
important motivation is gaining market credibility. The survey revealed that fear of loss
of control is considered as one of the critical obstacles for Korean companies.
Eije, Witte and Zwaan (2000) and Gregory K. Ericksen (2000) studied other aspects of
going public decision. In a survey of 27 Dutch public companies, Eije, Witte and Zwaan
(2000) found that IPO caused a tremendous change in organizational variables like
effectiveness, planning and control, capital budgeting, internal communication etc.
Gregory K. Ericksen (2000) added that the IPO is not a short time process. It’s a long
process where the companies who prepare themselves in well advance from the date of
IPO actually perform better.
3.2 Studies Based on Fundamental Financial Data of Companies & Macro-economic
Variables
A number of studies have searched for empirical relationship between the companies’
characteristics and going public decision. Numerous regression models incorporating a
wide variety of explanatory variables have been specified to reveal the determinants of
going public decision. The theoretical costs and benefits associated with going public

Working Paper Series (WPS), Indian Institute of Management, Lucknow WPS Number: 2006-07/06
15
have formed the basis for the models specified. While most of these studies have arrived
at some common determinants for companies’ going public decision, yet there are some
contradictory findings. Further the proxies used to capture the same theoretical
costs/benefits, at times, have varied across different research studies.
Pagano, Panetta and Zingales (1998) investigated the determinants of going public
decisions of Italian companies through a probit model. They compared 69 Italian public
companies, which completed their IPOs between 1982 and 1992, with 12391 Italian
private companies, which were eligible do their IPOs but preferred to remain as private
during the above period. The study analyzed both, the ex-ante characteristics of the
companies and ex-post consequences of IPO on the companies that had an IPO. They
found that the: probability of going public increased with the increase in stock market
valuation of other firms within the same industry and company’s size; financing of
subsequent investment and growth were not amongst the major motivations behind going
public; IPOs helped companies in borrowing cheaply from the banks; and incumbent’s
wealth increased in the post-IPO period.
Chun, Lynch and Smith (2002) adopted the approach of Pagano et al. (1998) and
investigated the factors influencing going public decision for Korean firms. Their sample
consisted of (a) 304 Korean firms which completed their IPOs between 1986 and 1995;
and (b) 1722 Korean firms which remained private during the above period. They also
carried out analysis on sub-samples of: (a) Chaebol or large conglomerate subsidiaries vs.
Independent firms; and (b) financially healthy firms and marginal firms. They found that
the: IPOs are timed to take the advantage of windows of opportunity; financially
marginal firms are more likely to go public to take advantage of windows of opportunity;
a high (low) industry market-to-book value (MTB) increases (decreases) IPO probability;
firms do not go public to fund investment in fixed assets; returns on assets decreased in
the post-IPO period; Chaebol subsidiaries use IPOs to fund takeovers or other equity
investments; Chaebol subsidiaries experienced a fall in interest rates after the IPO which
was consistent with IPO motive of lowering the cost of capital to fund takeovers.

Working Paper Series (WPS), Indian Institute of Management, Lucknow WPS Number: 2006-07/06
16
Breinlinger and Glogova (2002) examined the influence of macro economic factors on
going public decision. Their sample consisted of firms from six European countries
(Austria, Belgium, Denmark, Finland, France and the Netherlands) that went public
between 1980 and 1997. They explored the determinants of IPO volumes through a panel
data analysis of following macroeconomic factors: stock index returns, changes in
savings deposits, GDP growth, interest rates and exchange rates. The authors found that
the overall IPO volume was dependent on stock market returns but the dependence was
not significant for all the stock price levels. Also, except Finland and Austria the
relationship was not significant for other countries. Other factors like changes in savings,
GDP growth, interest rates and exchange rates exhibited non significant influence on IPO
volumes.
Boehmer & Ljungqvist (2004) examined 330 German firms that went public between
1984 and 1995. The result of the study was based on a hazard analysis of factors
influencing the timing of IPOs. Authors argued that the probit and logit models, used by
most of the studies, do not analyze the time factor associated with the variables, which
according to them can be incorporated using a hazard model. The firms were observed
from the date of IPO announcement to the date of their IPO. Following factors were
found to be positively affecting the likelihood of IPO: sales, profit margins (relative to
other firms in its industry) and stock market returns of the firms in the same industry and
uncertainty about the future profitability. To preserve the private benefits of control was
found to be a major motivation behind staying private.
Albornoz and Pope (2004) analyzed 830 public firms that were listed on London Stock
Exchange. The research design of the study was similar to Pagano et.al (1998). They
found that going public decision of companies is related: (a) positively to their size, stock
market valuation of other companies within the same industry; and (b) negatively to their
leverage levels and profitability. Based on the analysis of post-IPO evidences, the study
suggested that ‘financing needs’ and ‘reduction of leverage’ were not the major factors
influencing IPO decisions in the UK.

Working Paper Series (WPS), Indian Institute of Management, Lucknow WPS Number: 2006-07/06
17
Rosen, Smart and Zutter (2005) conducted a sector specific study wherein they
investigated 240 US banks which completed their IPOs between 1981 and 2002. The
advantage of doing a study on banking sector was the easy accessibility of required data
even of the private banks. Unlike the other sectors, both public as well as private banks
are required to disclose their annual financial data to the regulators. Authors found that:
the riskier banks were more likely to go public; the chance of getting acquired increased
the probability of going public; the chance of becoming acquirer also increased the
probability of going public and the banks went public to take the advantage of prevailing
market condition.
Chemmanur, Shan He and Nandy (2005) investigated the relationship between product
market characteristics and probability of going public for a large sample of US firms. The
investigation was based on two types of firms: (a) all those firms that had an IPO between
1972 and 2000 and (b) all those firms that stayed private during the period. A probit
model was used to examine the relationship between the product market characteristics of
firms immediately before going public and its likelihood of going public. The following
characteristics were found to be positively affecting the likelihood of going public: firms
with larger size, sales growth, total factor productivity (TFP), market share, and capital
intensity; firms operating in less competitive and more capital intensive industries; firms
in industries characterized by riskier cash flows; firms with projects that are cheaper for
outsiders to evaluate; firms operating in industries characterized by less information
asymmetry; and firms with greater average liquidity of already listed equity.
Kim and Sung (2005) carried out their study on group-affiliated Korean firms. Their
sample size consisted of: 35 group affiliated firms that had an IPO between 1997 and
2002 and private firms that were eligible for IPO but remained private during the period.
The study hypothesized that following factors increases the probability of going public:
direct share ownership by group-controlling shareholder, (ii) each firm.s contribution to
group control, and (iii) internal capital market. A probit model and a multivariate
regression model were used to analyze the pre IPO firms’ characteristics and

Working Paper Series (WPS), Indian Institute of Management, Lucknow WPS Number: 2006-07/06
18
consequences of IPO on the performance of firms respectively. The analysis showed that
the probability of going public increases for the firms: (a) where group-controlling
shareholder holds high direct share ownership in the firm; (b) where if its contribution to
group control is low; and (c) if it can not benefit from the internal capital market.
Using a large sample of 16,958 IPOs from 38 countries, Kim and Weisbach (2005)
explored the underlying motivations behind going public decision. Their sample
consisted of three types of offerings: (a) IPOs where new primary shares are issued, (b)
IPOs where exclusively secondary shares held by insiders are issued and (c) IPOs with
combination of above two. Authors concluded that capital raising was an important
motive for going public. Their result was based on their following observations. First,
authors observed that maximum proportion of IPOs around the world involved issuance
of primary shares. Second, they observed that IPOs with primary share offerings were
associated with a higher demand for capitals than IPOs with secondary share offerings.
Pin and Wei (2006) studied 383 IPOs of Taiwan, for the sample period of 1989 to 2000.
The probit model used to analyze the determinants of IPOs in the study concluded that:
Taiwan IPOs were not motivated by financing needs or constraints and larger and
profitable firms were more likely to go public.
4. Sample selection, Data and Methodology
The sample for this study was derived from the CMIE Prowess database, which contains
details of 393 IPOs and 3726 private companies4. The sample for probit analysis is
categorized into two groups: (a) IPOs sample; and (b) Private sample. IPOs sample
included all IPOs completed between 1999 and 2005, and sample for private companies
included all those companies that were eligible to do an IPO but remained private during
experiment years.
4 CMIE Prowess database contains the information of 3726 unlisted companies. The sample for private
companies is generated from those unlisted companies who were eligible to do an IPO but were not listed
in any stock exchanges.

Working Paper Series (WPS), Indian Institute of Management, Lucknow WPS Number: 2006-07/06
19
The following criteria were used for constructing the sample for probit analysis, keeping
in view the methodology of this paper. First, the data on IPOs that took place before 1999
was not included. It is to be noted from figure (3-a) that the period of study contains two
bearish and two bullish phase, therefore to include one complete cycle of both the phases
the data on IPOs before 1999 was not taken. Second, merged companies were eliminated.
Third, the probit model used in the study required company level data on certain financial
variables for three years before and after the IPO date. Therefore, such companies were
also excluded where prowess did not provide the required data on the financial variables.
Fourth, the focus of the study was on the determinants of going public decision. Hence
secondary issues5 were not considered in the analysis. The final sample for this study
constituted 150 IPOs and 2000 private companies. The sample selection process
described above eliminated 243 IPOs and 1726 private companies.
Apart from the probit analysis, a trend analysis is also carried out. Trend analysis is
carried out to understand the impact of macro factors on distribution of IPOs. Therefore
the study period for the analysis is stretched out. The data for this purpose are taken from
various issues of annual reports of RBI, and website of BSE and NSE. The sample period
of the analysis is from the year 1989 onwards. The choice of study period is constrained
by data availability on IPO distribution from 1989 onwards only.
Model Specification
The determinants of going public are analyzed through a probit model. Probit model
helps in explaining the occurrence or the non-occurrence of an event which can affect
each of n individuals in a given sample. The binary or boolean variable yi ∈ {0,1} serves
to indicate whether or not the event has affected the ith individual.
If we were to record, for each individual, the value of k variables which influence the
probability of the event, then we could express this probability in the ith instance by,
5 With IPO we meant that stage, after which a company becomes public or it does not remain private
anymore. However secondary issue is done by companies who are already in public domain. Therefore to
have a clear difference between a private and a public company we have excluded secondary issues.

Working Paper Series (WPS), Indian Institute of Management, Lucknow WPS Number: 2006-07/06
20
P (yi = 1) = π (xin , β), ………… (1)
Where xi = [ xi1, ………xik] are the variables and β is a vector of parameters.
It is helpful to consider π as the composition of two mappings:
π = π {h(x)} ………… (2)
The function h = h(x) is often a linear function of the observations which takes the form
of hi = xi β. The function π = π (h) is a distribution function which fulfils the condition
0 (h) 1π≤ ≤ with ( ) 0π −∞ = and ( ) 1π ∞ =
There are three common choices for π (h):
(i) The uniform distribution
π (h) =
0,if 0;
h,if 0 1;
1,if 1 .
h
h
h
≤
≤ ≤ ≤
………… (3)
(ii) The logistic distribution
π (h) =1
h
h
e
e+ ………… (4)
(iii) The normal distribution
π (h) = 2
21
2
hu
e duπ
−
−∞
∫ ………… (5)
Equations (3), (4) & (5), respectively, depict the linear probability model, the logistic
probability or logit model, and the probit model. The advantage of the probit model over
other models is that it is based on a distribution- the normal distribution- for which there
is often a clear statistical interpretation.
Following the theory on factors affecting the probability of going public, size is
considered to be one of the major determinants, for the ith company, δi is size of the
company; and it is assumed that, in the population of these companies, the value ξ =
log(δ ) are distributed normally with a mean of µ and a variance of 2σ . If a company is
selected at random and is having size di, then the probability that it will go public is P (ξ
< xi), where is xi = log di. This is given by

Working Paper Series (WPS), Indian Institute of Management, Lucknow WPS Number: 2006-07/06
21
π (xi) = ( ; , ) .ix
N dξ µ σ ξ−∞
∫ ………… (6)
The integration may be expressed in terms of standard normal density function N (u:0,1),
P(ξ i < xi ) with ξ i ~ N (µ, 2σ )
Is equal to
( )i ii i
xP h
ξ µ µξ
σ σ
− −= < = with ui ~ N (0,1)
Moreover the variable h, which is corresponds to the size of ith company, can be written
as
hi = ix µ
σ
− = β 0 + β 1 xi, ………… (7)
where β 0 = µ
σ
− and β 1 =
1
σ
The function π (x) with x = log (d) also indicates the fraction of a sample of companies
which could be expected to go public if all companies have same size d.
Let yi = 1 if the ith companies goes public and yi = 0 if it is private. Then the situation of
the company is summarized by writing
Yi = i i
i i
0,if or, equivalently, d ;
1, if or, equivalently, .
i i
i i
x
x d
ξ δ
ξ δ
≤ ≤
< < ………… (8)
For simplicity we show the estimation of the model with individual data,
If we have a sample of companies (yi, xi) ; i = 1, ……,n where yi ∈ {0,1} for all i. Then,
assuming that the events affecting the individuals are statistically independent and taking
π i = π (xi, β) to represent the probability that the event will affect the ith company, we
can represent the likelihood function for the sample as
1
1 1
L(β) (1 ) ( ) (1 )1
i i i
n ny y yi
i i i
i i i
ππ π π
π−
= =
= − = −−
∏ ∏ ………… (9)
This is the product of n point binomials. The log of the likelihood function is given by

Working Paper Series (WPS), Indian Institute of Management, Lucknow WPS Number: 2006-07/06
22
1 1
log log( ) log(1 )1
n ni
i i
i ii
L yπ
ππ= =
= + −−
∑ ∑ ………… (10)
Differentiating log L with respect to βj, which is the jth element of the parameter vector
β, yields
1 1
log 1
β (1 ) β 1 β
n ni i i
i ij i i j i j
yL π π
π π π= =
∂ ∂∂= −
∂ − ∂ − ∂∑ ∑
= 1
.(1 ) β
ni i i
i i i
y π π
π π=
− ∂
− ∂∑
or, 1log
{ }β 1 β
i i i
j i i j
y yL π
π π
− ∂∂= −
∂ − ∂∑ ………… (11)
On differentiating again,
22
2 2
1
1 1log{ } { } .
β β 1 β β (1 ) β β
i i i i i i i
i ij k i i j k i j k
y y y yL π π π
π π π π
− ∂ − ∂ ∂∂= − − +
∂ − ∂ − ∂ ∂∑ ∑ ………… (12)
The expected value of the expression above is found by taking E (yi) = π i. On taking
expectation, the first term of the RHS vanishes and the second term is simplified, with the
result that
2 log 1( )β β (1 ) β β
i i
ij k i i j k
LE
π π
π π
∂ ∂∂=
∂ − ∂ ∂∑ ………… (13)
The maximum likelihood estimates are the values which satisfy the conditions
log (β)0
β
L∂=
∂ ………… (14)
To solve this equation requires an iterative procedure. The Newton-Raphson procedure
could be used to solve this equation.

Working Paper Series (WPS), Indian Institute of Management, Lucknow WPS Number: 2006-07/06
23
Determinants of Going Public
Based on the relevant theoretical framework and empirical literature, a probit model is
specified below.
π (IPOit) = π ( β1Size
i,t-1 + β
2Age
i,t-1 + β
3Prft
i,t-1 + β
4Discl
i,t-1 + β
5Levr
i,t-1 + β
6Risk
i,t-1 +
β7Sgrwth
i,t-1 + β
8Capexp
i,t-1 + β
9Ccrdt
i,t-1 + β
10Indst ) ………… (15)
The nomenclature of dependent variable is ‘IPO’, a dummy variable, which equals 1 if
the company is publicly held and 0 if the company is a private in a particular year. The
explanatory variables are: the size, age, profitability, industry, level of disclosures,
leverage, risk, sales growth, capital expenditure and cost of credit for the included
companies. Detailed definitions of all variables and expected relationships of explanatory
variables with the dependent variable are presented in Table 5a.
Individual companies are indexed i: for each year t, in the sample. At any time t, the
sample includes all companies which are private at that point in time, and the companies
which go public (had an IPO) in that year. After a company goes public, that company is
dropped from the sample
The analysis is carried out for both – (a) each individual year, in order to find out the
temporal variations; and (b) for pooled sample, in order to find out the overall impact.
The pooled sample is formed by combining the data of each individual year.
4. Trends and features of IPOs in India
The annual trend in the number of IPOs and capital raised by Indian companies through
IPOs are shown in Figure 4 (a-b). The figures show that between 1996 and 2000, number
of IPOs and amount raised through these IPOs declined drastically. IPOs activity shot up
again in 2000-01. The time period of 2001-03 witnessed a steep decline in the IPOs
activity. The IPOs activities accelerated again after 2003.

Working Paper Series (WPS), Indian Institute of Management, Lucknow WPS Number: 2006-07/06
24
Figure 3 (a-b) shows the behaviour of Indian stock index (BSE SENSEX) between 1989
and 2006. It is evident from the Figures 3(a-b) and Figures 4(a-b) that Indian companies
time their IPOs to take advantage of bullishness in the stock prices and returns. The
observation supports the view of Loughran et al. (1994), Ljungqvist, (1995), Rees (1997)
and Rydqvist and Hogholm (1995) that the issuers time their IPOs with the prevailing
market condition.
Surge in the number of IPOs can be seen as a consequence of the high interest rate also.
The changes in interest rate have a bearing on the welfare of investors. As the interest
rate goes up, the market price of existing competitive (fixed income) securities falls, and
vice versa. Fig (3.c) reports the year-by-year fluctuations in the interest rates from 1993
onwards. Annual (Gross) Redemption Yield on long term Government of India Securities
is taken as a proxy for the interest rates. The figure reveals that the surge in IPO follows
the hike in the interest rate and vice versa. For the sample, the interest rate is highest in
1993-94 following which we have maximum number of IPOs in 1994-96. The trend
declines sharply during 1997-2000 resulting in a steep decline in the number of IPOs.
Similar pattern is observed for the period 2000-05.
Another stock market indicator that strongly affects the distribution of IPOs is annual
average ‘market to book ratio’. It can be seen from the figure (3.d) that the trend in IPOs
strongly follows the movement in the ‘market to book ratio’. The pattern is consistent
with windows of opportunity hypothesis. A detailed discussion on this hypothesis is
already given in literature review section.
The graphical relationship between ‘liquidity’ calculated as turnover ratio and
distribution of IPOs is consistent with the existing theories (see figure 3.e). The increased
liquidity in stock market should have a favourable impact on the going public decisions
of companies. It can decrease the transaction cost of the capital market. Actually the
relationship between stock market and primary market activities is a two-way
relationship. The liquidity in the stock market also depends on the number of issues in
primary market. The more the number of issues and instruments in primary market, more
Working Paper Series (WPS), Indian Institute of Management, Lucknow WPS Number: 2006-07/06
25
are the instruments available in secondary market. It is apparent from the figure that the
liquidity in the stock market has gone up during 1995-96. It rose sharply during 2000-03.
The figure shows that for the initial years of sample the IPO distribution is influenced by
the liquidity. However, the period 2000-02 presents a very indistinct relationship. Again
in final years of the sample period the trend for number of IPOs shows a coherent
relationship with liquidity.
5. Results
The discussion on results is divided into two sections. First, the descriptive statistics of
the variables are described. Second, the results obtained through probit analysis are
described.
Summary Statistics
Industry wise distribution of IPO sample are shown in figures 1 & 2, indicates that the
majority of IPO companies belongs to manufacturing industry (46%), followed by
services industry (42 %). The initial impression is that companies belonging to financial
services industry are more reluctant to go public. In past recent years, there is a growth in
IPOs from banking sector. The descriptive statistics of variables are reported in Tables 3
and 4. Table 3 provides a chronological comparison of publicly held companies and
private companies included in the sample. Table 4 depicts the summary of the pooled
sample.
The summary statistics shows that the average size of company in IPO sample is bigger
than private sample. The mean size for IPO sample has increased considerably from 1999
to 2005, whereas for private sample, the increase in not much. In 2002 the mean size of
IPO sample is more than three times bigger than private sample.
Working Paper Series (WPS), Indian Institute of Management, Lucknow WPS Number: 2006-07/06
26
Statistics shows that the average age at which companies do IPO is 14 years (Table 4).
The mean age for IPO sample has increased from 10 years in 1999 to 22 years in 2005.
The overall mean age for IPO sample is lower than private sample.
The overall mean score of profitability measured as return on net worth for IPO sample is
eight times greater than private sample. The difference between the profitability of both
the sample is noticeable. In 1999 the average profitability of IPO sample is 31 times
greater than the private sample, and in 2004 it is nearly 11 times greater than private
sample.
The ratio ‘corporate tax to sales’ is used as a measure for the ‘company’s level of
disclosures’. The summary statistics for level of disclosures shows that the average ratio
for private sample is three times greater than IPO sample. The differences between the
scores across the time periods are not distinct. The initial impression is that companies
with high ratio of disclosure are reluctant to go public.
On an average the Private companies are more leveraged than IPO companies. In 2000,
the private companies are six times more leveraged than IPO companies, and in 2002 and
2003 it is three times more. The mean score for both the sample is markedly different for
all the time periods.
The initial impression is that Indian IPOs are not strongly motivated by financing needs,
as the average growth in sales for Private sample is more than that of IPO sample. There
is not much difference in the level of capital expenditure for both the sample. Sales
growth for private sample is almost double than the IPO companies. The table reports
that the overall average score of Cost of credit for IPO sample is five times greater than
private sample. The difference is apparent for all the time periods. Statistics of risk shows
that overall IPO companies are ten times riskier than private companies. The mean score
for the risk is always higher for IPO sample. It indicates that risky companies are more
likely to go public. Summary statistics of variables like ‘Return on net worth’ and ‘Cost
of credit’ show a great fluctuation across the time period.

Working Paper Series (WPS), Indian Institute of Management, Lucknow WPS Number: 2006-07/06
27
Probit analysis
The results of Maximum likelihood estimate of probit model are presented in Table 5b.
Estimates of pooled sample6 are listed in first column, and chronological estimates of
model are listed in second column. The analysis is done for each year (1999 to 2005).
However due to less number of IPOs, the model could not be estimated for 2002. The
estimated value of log likelihood, pseudo R2, dummy variable for ‘Industry’ is also
reported in the table.
The results in Table 5b indicate that Size and probability of going public is positively
related. A standard deviation increase in size increases the probability of going public by
more than 2 times of sample average probability of going public. The relationship does
remain positive for all the years; however it is not significant for 2001. In general, the
relationship is statistically significant. This result is consistent with the findings of
several earlier empirical studies (Pagano et. al., 1998; Helwege and Packer, 2003;
Chemmanur et al., 2005; Kim and Sung, 2005; Rosen et al., 2005, Albornoz and Pope,
2004).
The age of companies is found to be negatively related to their probability of going
public. A standard deviation increase in age reduces the probability of going public by 30
percent of sample average probability. This result is similar to the findings of Boehmer
and Ljungqvist (2004), who used age of companies to be proxy for the uncertainty in
their future profitability7. They argued that the younger companies would be more
uncertain about their future profitability and hence would be more interested in going
public. However, above result is in contrast to the findings of Chemmanur and Fulghieri
(1995); Rock (1986); and Welch (1989).
Another proxy for risk calculated as the ratio of intangible assets to total assets is also
analyzed. The assumption is that higher the ratio more risky a company is. In accordance
6 The pooled sample consists of combination of all cross-sectional and time series data used in the study.
7 See Pastor and Veronesi (2003)

Working Paper Series (WPS), Indian Institute of Management, Lucknow WPS Number: 2006-07/06
28
with a priori expectation, the relationship obtained is positive and significant for the
pooled sample. On time scale the relationship is significant in 2000 and 2005.
As shown in Table 5b, probability of going public is positively related to ‘Profitability’
measured in terms of ‘Return on net worth’. The relationship is positive and significant
for all the time periods. An increase of one standard deviation in profitability corresponds
to 13 percent increase in sample average probability. The result has been supported by a
major chunk of studies. The lower of adverse selection cost could be one possible reason
behind this finding.
Leverage and probability of going public is found to be negatively related. Table 5b
shows that the relationship is negative across all the columns. Except 2003 and 2005 the
relationship is statistically significant for other time periods. The result support the views
expressed by Pagano et. al. (1998), Helwege and Packer (2003) and Kim and Sung
(2005). The negative relationship shows that highly leveraged companies prefer to remain
as private.
The study use ratio of ‘corporate tax (paid) to total sales’ to be the proxy for the
company’s level of disclosures. The relationship was found to be negative. The overall
idea is that companies would like to pay less amount of corporate tax. Going public
requires companies to disclose more financial information which result into higher
payment of taxes by them.
In contrast to earlier studies, the estimate shows that the relationship between growth in
sales and probability is not significant for any time period. Another variable taken as a
proxy for growth is capital expenditure. The relationship found is positive but except
1999 it is not significant in any of the columns.
The study used ‘cost of credit’ as a proxy to show the effect of going public on
bargaining power of a company with the banks. It is calculated as a ratio of interest
payment to total bank borrowings. On a priori basis, the relationship was expected to be

Working Paper Series (WPS), Indian Institute of Management, Lucknow WPS Number: 2006-07/06
29
positive i.e. higher the ratio higher is the propensity to bargain for lower interest rate. As
expected, the relationship emerges as positive for all the time periods. However the
relationship is not significant. The positive relationship shows that companies with higher
ratio are more likely to go public. Variable ‘Industry’ is taken as a dummy variable. It is
apparent from the table that coefficient for ‘Manufacturing’ and ‘Services’ industries are
significant, which indicate that companies from manufacturing and services industries are
more likely to go public.
6. Conclusion
The study provides an analysis of the determinants of going public decision of Indian
companies. The company level determinants are addressed through a probit model. In
addition the effect of macro level determinants viz., interest rates, stock market return,
stock market indices, liquidity and market to book ratio, on the distribution IPO were also
examined. The summary statistics of variables shows that some of the determinants are
year specific. Hence to find out the effect of year specific determinants, the analysis is
carried out for individual years also.
Based on the probit model, size, profitability, age and leverage emerge as the significant
determinants of going public decision. The magnitude of the effect of size on probability
of going public indicates relatively strong relationship between the two.
The statistically insignificant relationship between the financing needs and likelihood of
an IPO is contrary to the findings of most of the existing studies. The study finds strong
evidence that Indian IPOs are not motivated by financing needs or constraints.
The most other results of this study are consistent with the existing IPO theories. The
negative and statistically significant relationship between age and probability of IPO
suggests that companies go in for IPO at much younger stage. Younger companies are
more risky and less certain about their future profitability. Another variable used in the
analysis is ‘ratio of intangible assets to total assets’ which also proxy risks. The positive
Working Paper Series (WPS), Indian Institute of Management, Lucknow WPS Number: 2006-07/06
30
and statistically significant relationship of this ratio with likelihood of going public
clearly shows that risk aversion is one of the major motivations behind Indian IPOs.
The study finds that the larger and profitable companies are more likely to go public. The
negative relationship between leverage and dependent variable shows that the companies
are not motivated by reduction of leverage. Study also provide support for, though not
conclusively, cost of credit, cost of disclosure, owners’ diversification desire, listing
costs, liquidity and market timings as factors influencing IPO decision. Industry captured
through a dummy variable shows that companies from manufacturing and services
sectors are more likely to go public.
The graphical study of IPO distribution and macro level factors suggest that the IPO
distribution is correlated with Sensex movement, in terms of return and price, price to
book ratio of sensex and liquidity in BSE. The analysis also shows that there is a lag
difference between the movements in interest rate and annual number of IPOs.
The results for Indian market are expected to be useful to other emerging countries also
due to resemblances in socio-economic conditions of all the emerging countries.
However the findings of this study are subjected to several limitations. The findings of
study could be further refined in the following ways. In this study, the usage of ‘sales
growth and capital expenditure’ as proxies for ‘the need of financing and growth’ is
debatable. In future the analysis can be done using better proxies also. The study included
the information for pre IPO factors only. The scope of study could be increased by adding
those factors which are post IPO and can motivate a company to do IPO like increase in
performance, merger and acquisition activities, cash out of venture capitalists etc.

Working Paper Series (WPS), Indian Institute of Management, Lucknow WPS Number: 2006-07/06
31
References
1) Allen, F., Faulhaber, G., (1999), “Signaling by underpricing in the IPO market,”
Journal of Financial Economics, Vol. 23, pp.303–323
2) Ang, J., and J. Brau (2003), “Concealing and confounding adverse signals: Insider
wealthmaximizing behavior in the IPO process”, Journal of Financial Economics
Vol. 40, pp. 149-172.
3) Belén Gill de Albornoz & Peter F. Pope (2004), “The Determinants Of The Going
Public Decision: Evidence From The U.K”, Working Papers. Series AD 2004-22,
Instituto Valenciano de Investigaciones Económicas, S.A. (Ivie).
4) Bhattacharya, S., and Ritter, J.R., 1983, “Innovation and Communication:
Signaling with Partial Disclosure,” Review of Economic Studies Vol. 50, pp. 331-
346.
5) Black, B.S. and R. J. Gilson (1998), “Venture capital and the structure of capital
markets: Banks versus stock markets”, Journal of Financial Economics, Vol. 47,
pp. 243-277.
6) Block Stanley B. (2004), “The Latest Movement to Going Private: An Empirical
Study”, Journal of Applied Finance, Vol. 14, No. 1.
7) Boehmer, E., and A. Ljungqvist (2004), “On the decision to go public: Evidence
from privately-held firms,” mimeo, New York University
8) Bolton, Patrick and Ernst von Thadden (1998), “Blocks, Liquidity and Corporate
Control”, Journal of Finance Vol. 53, pp. 1-25.
9) Booth, J.R., Chua, L. (1996), “Ownership dispersion, costly information and IPO
underpricing” Journal of Financial Economics Vol. 41, pp. 291-310.
10) Brau, J., B. Francis, and N. Kohers (2003), “The choice of IPO versus takeover:
Empirical evidence”, Journal of Business Vol. 76, pp. 583-612.
11) Brau, James C. and Stanley E. Fawcett (2006), “Initial public offerings: An
analysis of theory and practice”, Journal of Finance Vol. 61, pp. 399-436.
12) Brau, J.D., Ryan, P.A., and DeGraw, I. (2005), “Rationale Applied in the IPO
Process: Evidence from Chief Financial Officers”, working paper.
13) Breinlinger, L. and E. Glogova (2002), “Determinants of Initial Public Offerings:
A European Time- Series Cross-Section Analysis”, Financial Stability Report 3,
Oesterreichische Nationalbank, Vienna, 87–106
14) Carter, R.B., and S. Manaster (1990), “Initial Public Offerings and Underwriter
Reputation”, Journal of Finance Vol. 45, pp. 1045-1067.
15) Campbell, Tim (1979), “Optimal Investment Financing Decisions and the Value
of Condentiality”, Journal of Financial and Quantitative Analysis Vol. 14, pp.
913-24.
16) Chemmanur T., He S. and Nandy D. (2005), “The Going Public Decision and the
Product Market: Empirical Evidence”, Working paper, Boston College.
17) Chemmanur, T. J. and P. Fulghieri (1999), “A Theory of the going-public
decision”, Review of Financial Studies Vol. 12, pp. 249-279.
18) Clementi, Gian Luca (2002) “IPOs and the growth of firms,” Working paper,
New York University.
19) DeGeorge, F. and R. Zeckhauser (1993), “The Reverse LBO Decision and Firm
Performance: Theory and Evidence”, Journal of Finance, Vol. 48, pp. 1323-49.
Working Paper Series (WPS), Indian Institute of Management, Lucknow WPS Number: 2006-07/06
32
20) Demers E., Lewellen K.(2003), “The Marketing Role of IPOs: Evidence from
Internet stocks”, Journal of Financial Economics”, Vol. 68, pp. 413-437.
21) Diamond, Douglas (1991), “Monitoring and reputation: The choice between bank
loans and privately placed debt”, Journal of Political Economy Vol. 99, pp. 689-
721
22) Eije, J.H. von & Witte, M.C. de & Zwaan, A.H. van der (2000), “IPO-related
organizational change and long-term performance”, Research Report 00A19,
University of Groningen, Research Institute SOM (Systems, Organisations and
Management).
23) Fischer, C. (2000), “Why do companies go public? Empirical evidence from
Germany’s Neuer Markt”, Working paper Munich University, May 2000.
24) Greenwood, Robin (2005), “Short- and long-term demand curves for stocks:
Theory and evidence on the dynamics of arbitrage”, Journal of Financial
Economics Vol. 75, pp. 607-649.
25) Grinblatt, M., Hwang, C., 1989, “Signaling and the pricing of unseasoned new
issue,” Journal of Finance, Vol. 44, pp. 393–420.
26) Helwege, Jean, and Packer, Frank (2003) “The decision to go public: evidence
from mandatory SEC filings of private firms,” Working paper, Ohio State
University.
27) Holmstrom, B. and J. Tirole (1993) “Market Liquidity and Performance
Monitoring,” Journal of Political Economy, Vol. 101, pp. 678-709.
28) Huyghebaert, N. and C.V. Hulle (2005), “Structuring the IPO: Empirical evidence
on the portions of primary and secondary shares,” Journal of Corporate Finance,
Vol. 12, no.2, 296-320
29) Ibbotson, R.G. (1975), “Price Performance of Common Stock New Issues”,
Journal of Financial Economics Vol. 2, pp. 235-272.
30) Jensen, M., and Meckling, W. (1976) “Theory of the Firm: Managerial Behavior,
Agency Costs, and Ownership Structure,” Journal of Financial Economics, Vol.
3, pp. 305-360.
31) Johann Burgstaller (2005), “When and why do Austrian companies issue
shares?”, Economics working papers 2005-03, Department of Economics,
Johannes Kepler University Linz, Austria Journal of Finance, Vol. 47, no. 5, pp.
2035–53.
32) Kadlec, G. B. And J. J. McConnell (1994), “The Effect of Market Segmentation
and Liquidity on Asset Prices: Evidence from Exchange Listings”, Journal of
Finance Vol. 49, pp. 611-636
33) Karmakar, M. (2002), “Initial Public Offerings: Underpriced or Fads? A Penny in
Whose Pocket?”, The ICFAI Journal of Applied Finance, Vol. 8, No. 6,
November, pp. 5 – 18.
34) Kim, W. and M. Weisbach (2005) “Do Firms Go Public to Raise Capital?”
Working Paper 11197, National Bureau of Economic Research, March
35) Kim, Woochan and Sung, Taeyoon (2005), “What Makes Group – Affiliated
Firms Go Public?”, KDI School of Public Policy & Management Paper No. 05-10
Available at SSRN: http://ssrn.com/abstract=691721

Working Paper Series (WPS), Indian Institute of Management, Lucknow WPS Number: 2006-07/06
33
36) Leland, H.E., and D.H. Pyle (1977), “Informational Asymmetries, Financial
Structure, and Financial Intermediation”, Journal of Finance, Vol. 32, pp. 371-
387.
37) Logue, D. (1973), “Premia on Unseasoned Equity Issues, 1965-69”, Journal of
Economics and Business Vol. 25, pp. 133-141.
38) Loughran, T., Ritter, J.R. and K. Rydqvist, (1994), “Initial Public Offerings:
International Insights”, Pacific-Basis Finance Journal, Vol.2, pp. 165 – 199.
39) Madhusoodanan, T.P., and M. Thiripalraju (1997),” Underpricing in Initial Public
Offeirngs: The Indian Evidence”, Vikalpa, Vol. 22, No. 4, October-December, pp.
17-30.
40) Maksimovic, V. and P. Pichler (2001), “Technological innovation and initial
public offerings”, Review of Financial Studies Vol. 14, pp. 459-494.
41) Marchisio, G., Ravasi, D. (2001) “Family Firms and the Decision to go Public: a
Study of Italian IPOs”, SDA Bocconi Working Paper 45
42) Mello, S. and Parsons E. (1998), “Going Public and the Ownership Structure of
the Firm”, Journal Of Financial Economics Vol. 49, pp. 79-109.
43) Mikkelson, Wayne H., Partch, M. Megan and Shah, Kshitij (1997) “Ownership
and operating performance of companies that go public”, Journal of Financial
Economics Vol. 44, pp. 281-307.
44) Mittoo, U.R. (1992), “Additional Evidence on Integration in the Canadian Equity
Market”, Journal of Finance, Vol. 47, No. 5, pp. 2035-53
45) Modigliani, F. and M. Miller (1963), “Corporate income taxes and the cost of
capital: A correction”, American Economic Review Vol. 53, pp. 433-43.
46) Myers, S. C. and N. S. Majluf (1984), “Corporate financing and investment
decisions when firms have information that investors do not have”, Journal of
Financial Economics Vol. 13, pp. 187-221.
47) Myers, S. C. (1984), “The capital structure puzzle”, Journal of Finance Vol. 39,
pp. 575-592.
48) Narasimhan, M.S. and L.V. Ramana(1995), “Pricing of Initial Public Offerings:
The Indian Experience with Equity Issues”, The ICFAI Journal of Applied
Finance, Vol. 1, No. 1, January, pp. 26 – 39.
49) Pagano, M. (1993), “The Flotation of Companies on the Stock Market: A
Coordination Failure Model”, European Economic Review Vol. 37, pp. 1101–
1125.
50) Pagano, M., F. Panetta, and L. Zingales (1998), “Why do companies go public?
An empirical analysis”, Journal of Finance Vol. 53, pp. 27-64.
51) Pagano, M. and A. Roell (1998) “The Choice of Stock Ownership Structure:
Agency Costs, Monitoring, and the Decision to Go Public”, Quarterly Journal of
Economics, Vol. 113, pp. 187-225.
52) Pandey Ajay & Kumar G. Arun, (2001), "Relative Effectiveness of Signals in
IPOs in Indian Capital Markets", IIMA Working Papers 2001-09-03, Indian
Institute of Management Ahmedabad, Research and Publication Department
53) Pandey Ajay, (2005), “Initial Returns, Long Run Performance and Characteristics
of Issuers: Differences in Indian IPOs Following Fixed Price and Book building
Processes” IIMA Working Papers 2005-01-07, Indian Institute of Management
Ahmedabad, Research and Publication Department
Working Paper Series (WPS), Indian Institute of Management, Lucknow WPS Number: 2006-07/06
34
54) Park, H.J., 1990, “Survey on the Determinants for the Initial Public Offering,”
mimeo, April
55) Pastor, L., Veronesi, P.(2003), “Stock valuation and learning about profitability”
Journal of Finance Vol. 58, pp. 1749–1789
56) Pollock, D.S.G., “Models with limited dependent variables (Chapter 5)”,
Econometric Theory (Online teaching course),
http://qmw.ac.uk/~ugte133/courses/mesomet/05MESMET.PDF, 10/8/2006.
57) Pannemans, S. (2002), “Going Public: Opportunism or Necessity? Empirical
Evidence from Belgian IPOs”, Eunip Conference.
58) Rao K.S., Murthy M.R. & Ranganathan K.V.K.(1999), “Some Aspect of the
Indian Stock Market in the post-liberalization Period” Journal of Indian School of
Political Economy, Vol. 11, No. 4, .
59) Rees, W.P. (1997), “The Arrival Rate of Initial Public Offerings in the UK”,
European Financial Management, Vol. 3, pp. 45-62.
60) Ritter, J. R. (1987), “The costs of going public”, Journal of Financial Economics,
Vol. 18, pp. 269-281.
61) Ritter, J.R. (1984), “The Hot Issue Market of 1980”, Journal of Business Vol. 57,
pp. 215-240.
62) Ritter, Jay R. (1991), “The Long Run Performance of Initial Public Offerings.”
Journal of Finance, Vol. 42, pp. 365-394
63) Rock, Kevin (1986),”Why New Issues are Underpriced?”, Journal of Financial
Economics, Vol. 15, pp. 187-212.
64) Rosen, Richard J., Smart, Scott B. and Zutter, Chad J.(2005), “Why Do Firms Go
Public? Evidence from the Banking Industry”, Available at SSRN:
http://ssrn.com/abstract=686473.
65) Rydqvist, K. and K. H¨ogholm (1995), “Going public in the 1980s: Evidence
from Sweden”, European Financial Management Vol. 1, pp. 287–315.
66) Saudagaran,S. (1998), “An Empirical Study of Selected Factors Influencing the
Decision to List on Foreign Stock Exchange”, Journal of International Business
Studies Vol. 19, pp. 101-127.
67) Scott, J.H. (1976), “A theory of optimal capital structure”, Bell Journal of
Economics Vol. 7, pp. 33-54.
68) Shen, Yang-Pin and Peihwang Wei (2006), “Why Do Companies Choose to Go
IPOs? New Results Using Data from Taiwan’, No 2005-07, Working Paper,
University of New Orleans, Department of Economics and Finance.
69) Shah, A. (1995), “The Indian IPO market: Empirical facts”, Social Science
Research Network (www.ssrn.com).
70) Smith, Stephen C., Hesuk, Chun and Lynch Merrill (2002), “New Issues in
Emerging Markets:Determinants, Effects, and Stock Market: Performance of
IPOs in Korea”, No. 02-17, Global Management Research Working Paper, School
of Business and Public Management, George Washington University.
71) Stein, Jeremy C. (1989), “Efficient capital markets, inefficient firms: a model of
myopic corporate behavior”, Quarterly Journal of Economics Vol. 104, pp. 655-
669
72) Stanley B. Block (2004), “The Latest Movement to Going Private: An Empirical
Study” Journal of Applied Finance, Vol. 14, No. 1.

Working Paper Series (WPS), Indian Institute of Management, Lucknow WPS Number: 2006-07/06
35
73) Stoughton, Neal M., and Josef Zechner (1998), “IPO mechanisms, monitoring and
ownership structure”, Journal of Financial Economics Vol. 49, pp. 45-78.
74) Stoughton, Neal M., Kit Pong Wong, and Josef Zechner (2001), “IPOs and
product quality”, Journal of Business Vol. 74, pp. 375-408.
75) Subramanyam, A., and Sheridan Titman (1999), “The going public decision and
the development of financial markets”, Journal of Finance Vol. 54, pp. 1045-
1082.
76) Welch, Ivo (1989), “Seasoned offerings, imitation costs, and the underpricing of
initial public offerings”, Journal of Finance Vol. 44, pp. 421-449.
77) Yosha, O. (1995), “Information Disclosure Costs and the Choice of Financing
Source”, Journal of Financial Intermediation, Vol. 4, pp. 3-20.
78) Zingales, L. (1995), “Insider ownership and the decision to go public”, Review of
Economic Studies, Vol. 60, pp. 425-448.

Working Paper Series (WPS), Indian Institute of Management, Lucknow WPS Number: 2006-07/06
36
Tables
Table 1
Number of IPOs and Amount raised by Indian Companies from 1989 to 2006 Following table shows the annual trend in number of public issues between 1989 and 2006. The trend in
rupee amounts mobilized through public issues is also presented in the table. The table is constructed on the
basis of data provided by Prime Database.
Year
No. of Issues
Amount (Rs.crore)
1989-90
1990-91
1991-92
1992-93
1993-94
1994-95
1995-96
1996-97
1997-98
1998-99
1999-00
2000-01
2001-02
2002-03
2003-04
2004-05
2005-06
187
141
196
528
770
1,343
1,428
753
62
32
65
124
19
14
35
34
102
2,793
1,704
1,898
6,252
13,443
13,312
11,822
11,687
3,061
7,911
7,673
6,618
6,423
5,732
22,145
25,526
23,676
Table2
A Summary of Theoretical Framework for Going Public Decisions
Following table summarizes the discussion of theoretical works presented in theoretical framework of
present study. Benefit related theories are listed first, followed by cost related theories. Research studies
proposing relevant theories in their paper are also listed in the table.
A. Benefit Related Theories
Theories Research Studies
1.Raising capital Loughran et al., 1994; Pagano et al., 1998; Subrahmanyam and
Titman, 1999 and Huyghebaert and Hulle, 2005.
2. Risk sharing and diversification Pagano, 1993; Zingales, 1995, Stoughton and Zechner, 1998, and
Chemmanur and Fulghieri, 1999.
3. Lowering of cost of capital Scott, 1976; Modigliani and Miller, 1963, Diamond, 1991;
Holmstrom and Tirole, 1993; Booth and Chua, 1996 and Maug, 1998.
4. Liquidity Booth and Chua, 1996; Bolton and Von; Pagano et al., 1998 and
Thadden, 1998.
5. Monitoring Pagano and Roell,1998
6. Windows of opportunity Myers and Majluf, 1984; Dharan and Ikenberry, 1995 and Ritter,1991
7. Signaling Allen and Faulhaber, 1989; Grinblatt and Hwang, 1989 and Welch,
1989.
8. Getting publicity Subramanyam and Titman, 1999 and Stoughton et. al., 2001.
9. Cashing-out of insiders Zingales, 1995 and Mello and Parsons, 1998 and Black and Gilson,
1998.
10. Optimal way to transfer
control
Zingales (1995)
B. Costs related theories
1. Information Asymmetry and
Adverse Selection Costs
Akerlof, 1970; Leland and Pyle, 1977; Rock (1986); Welch (1989)
and Chemmanur and Fulgheri (1999)
2. Loss of confidentiality
(Increased Monitoring)
Campbell, 1979; Tinic, 1988; Yosha, 1995 and Maksimovic and
Pichler, 2001
3. Initial and subsequent expenses Bhattacharya and Ritter, 1983 and Ritter, 1987

Working Paper Series (WPS), Indian Institute of Management, Lucknow WPS Number: 2006-07/06
37
Table 3
Summary statistics
This table summarizes the descriptive statistics of variables. IPO sample contains all those companies that
went public during 1999-2005. Private sample consists of all those companies that were eligible for doing
IPO but decided to not to do IPO in the experiment year. The table provides the temporal statistics of all the
variables. Definition and calculation of variables are discussed in methodology section. The summary
statistics describe the number of observation, mean, median and standard deviation of the variables.
Private sample IPO sample
N Mean Median
Standard
deviation N Mean Median
Standard
deviation
Size
1999 628 587.80 29.24 2380.92 10 337.51 28.09 894.42
2000 522 694.46 35.93 2724.07 31 134.34 16.68 283.63
2001 628 588.64 38.27 2733.62 4 46.56 32.90 48.93
2002 764 660.25 38.12 3149.47 4 20270.18 4263.58 34704.75
2003 1570 568.23 33.33 3641.76 10 9563.96 97.71 16208.14
2004 1844 553.00 34.25 3666.65 22 4270.58 118.35 13329.46
2005 2002 623.11 37.93 4004.54 65 8141.92 105.24 25741.47
Age
1999 628 28.01 20 22.86 10 10.92 7 9.70
2000 522 29.52 22 22.65 31 8.90 7 4.74
2001 628 29.61 22.00 22.07 4 10 9 7.83
2002 764 28.94 21 22.02 4 25.51 8 39.55
2003 1570 23.98 17 20.40 10 20.40 10.50 23.47
2004 1844 23.72 17 19.98 22 18.82 16 16.67
2005 2002 24.11 17 19.83 65 22.71 15 24.65
Return on net worth
1999 628 0.83 7.13 60.85 10 30.59 35.23 15.37
2000 522 -3.90 7.92 130.16 31 24.50 22.76 26.03
2001 628 0.49 7.23 118.78 4 36.11 44.69 18.26
2002 764 -2.99 7.97 107.92 4 17.08 13.91 22.13
2003 1570 5.98 6.61 223.07 10 32.07 33.84 8.87
2004 1844 3.83 5.57 61.06 22 39.75 21.14 88.78
2005 2002 4.46 6.25 63.30 65 20.16 22.31 38.47
Level of Disclosures
1999 628 0.02 0.01 0.05 10 0.03 0.02 0.03
2000 522 0.02 0.01 0.05 31 0.01 0.01 0.03
2001 628 0.02 0.01 0.05 4 0.02 0.02 0.01
2002 764 0.01 0.01 0.05 4 0.08 0.03 0.12
2003 1570 0.02 0.01 0.06 10 0.01 0.01 0.01
2004 1844 0.03 0.01 0.23 22 0.02 0.01 0.02
2005 2002 0.05 0.01 0.69 65 0.01 0.01 0.01
Leverage
1999 628 2.50 0.99 8.60 10 0.42 0.44 0.31
2000 522 5.98 1.02 69.18 31 0.97 0.57 1.21
2001 628 2.50 0.99 8.60 4 0.12 0.12 0.13

Working Paper Series (WPS), Indian Institute of Management, Lucknow WPS Number: 2006-07/06
38
2002 764 2.94 0.93 12.53 4 0.44 0.23 0.61
2003 1570 2.09 0.68 6.80 10 0.89 0.93 0.45
2004 1844 3.20 0.62 31.62 22 1.04 0.64 1.72
2005 2002 6.89 0.6 123.25 65 3.01 0.74 13.52
Risk
1999 628 0.01 0 0.02 10 0.09 0.04 0.13
2000 522 0.01 0 0.01 31 0.02 0 0.07
2001 628 0.01 0 0.02 4 0.01 0.01 0.01
2002 764 0.01 0 0.03 4 0 0 0
2003 1570 0.008 0 0.05 10 0.02 0 0.08
2004 1844 0.009 0 0.05 22 0.01 0 0.03
2005 2002 0.009 0 0.05 65 0.01 0 0.07
Sales
Growth
1999 628 393.85 12.32 6495.15 10 134.61 81.39 160.8
2000 522 112.15 4.43 1385.61 31 218.51 59.43 468.81
2001 628 393.85 12.32 6495.15 4 194.91 85.89 243.17
2002 764 115.68 11.95 1350.79 4 14.55 12.49 75.53
2003 1570 108.80 9.05 1623.74 10 110.79 19.53 262.93
2004 1844 308.98 10.75 7216.77 22 98.16 25.27 238.11
2005 2002 268.99 13.30 6940.75 65 120.01 71.61 186.06
Capital
expenditure
1999 628 0.52 0.53 0.21 10 0.70 0.74 0.13
2000 522 0.54 0.55 0.22 31 0.63 0.66 0.23
2001 628 0.52 0.53 0.21 4 0.72 0.76 0.12
2002 764 0.53 0.55 0.21 4 0.69 0.87 0.42
2003 1570 0.58 0.60 0.24 10 0.45 0.53 0.29
2004 1844 0.59 060 0.24 22 0.60 0.60 0.22
2005 2002 0.59 0.59 0.24 65 0.54 0.55 0.22
Cost of
credit
1999 628 24.84 0.26 267.19 10 0.24 0.24 0.20
2000 522 6.60 0.31 61.52 31 1.87 0.21 5.86
2001 628 24.84 0.26 267.19 4 0.22 0.11 0.30
2002 764 12.19 0.25 152.08 4 0.45 0 0.91
2003 1570 12.81 0.22 190.95 10 1.8 0.38 4.8
2004 1844 27.64 0.18 809.55 22 1.50 0.14 3.53
2005 2002 28.67 0.16 503.97 65 10.60 0.14 76.27

Working Paper Series (WPS), Indian Institute of Management, Lucknow WPS Number: 2006-07/06
39
Table 4
Summary statistics Table below provides the descriptive statistics of pooled sample. The sample has been formed by
combining the cross-sectional and time series data. IPO sample contains total companies that went public
during study period (1999-2005). Private sample consists of all those companies that remained private
through out the study period.
Tables 5 (a-b)
Probit Model
Equation (15) shows the probit model used in our analysis. The effect of the variables on the likelihood of
going public is estimated by a probit model. The estimation method is maximum likelihood. The dependent
variable is 0 if the company is private and 1 on the year of IPO. The sample for private companies consists
of only those companies that satisfy the IPO requirements. Definition of variables are discussed Table 5a.
Results from probit analysis are given in Table 5b
Table 5a
Probit Model: Definition of Independent variables
Variables Definition and calculation Expected
relationship
Size Lagged value of natural logarithm of total asset +
Age Natural logarithm of age of companies at time ‘i’ from date of their
incorporation
+/-
Profitability Lagged value of Return on net worth (RONW) which is calculated as
Net income divided by Net worth
+/-
Level of
Disclosures
Lagged value of ratio of corporate tax and total sales of a company -
Leverage Lagged value of ratio of total debt over total assets +/-
Risk Lagged value of ratio of intangible assets to total assets +
Capital
expenditure
Lagged value of capital employed over total assets +
Sales growth Average of growth in sales in last three years +
Cost of credit Ratio of annual interest payment and total borrowings from bank +
Industry Dummy variable for industry.
IPO sample Private sample
N Mean Median
Standard
deviation n Mean Median
Standard
deviation
Size 148 3362.33 44.770 11966.94 8000 598.73 35.42 3492.42
Age 148 14.76 9 16.80 8000 25.57 18 20.96
Return on
net 148 25.17 23.3 46.81 8000 3.23 6.69 123.72
Level of
Disclosures 148 0.01 0.006 0.03 8000 0.03 0.01 0.31
Leverage 148 1.84 0.63 9.06 8000 3.92 0.75 66.19
Risk 148 0.01 0 0.06 8000 0.007 0 0.04
Sales
growth 148 117.23 51.04 266.6 8000 216.23 9.89 5273.16
Capital
exp 148 0.58 0.59 0.24 8000 0.57 0.58 0.23
Cost of
credit 148 107.98 0.15 1140.24 8000 22.59 0.21 518.4
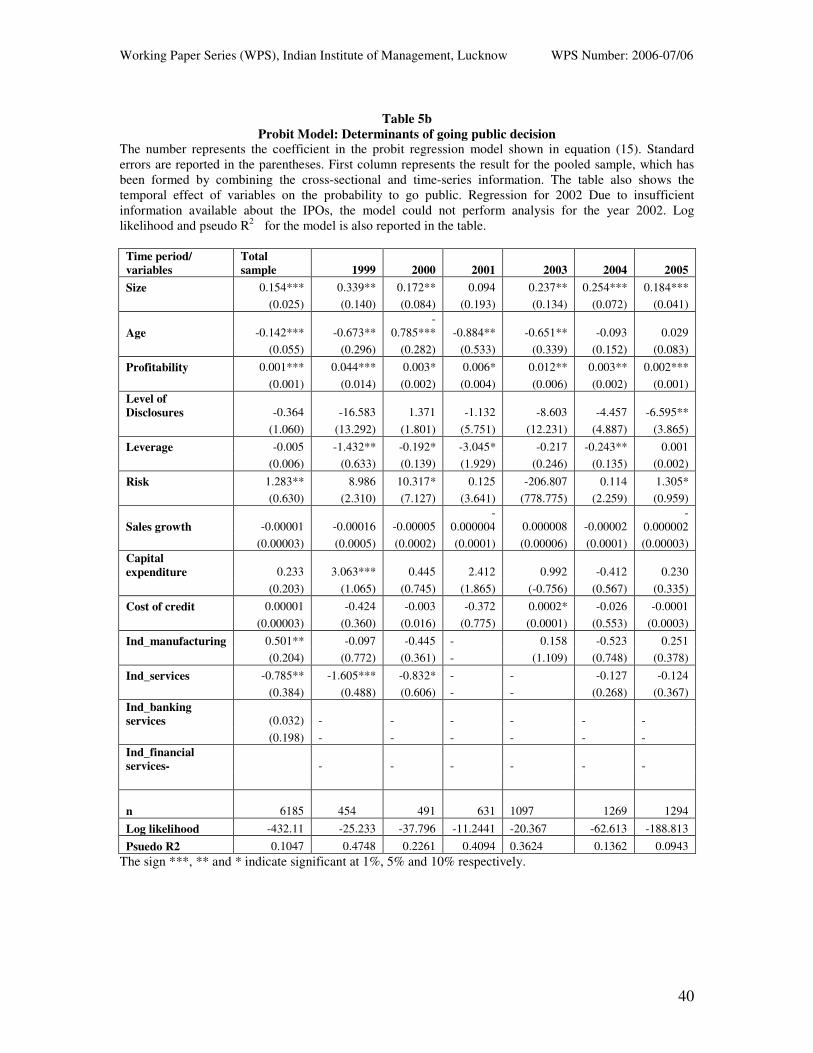
Working Paper Series (WPS), Indian Institute of Management, Lucknow WPS Number: 2006-07/06
40
Table 5b
Probit Model: Determinants of going public decision The number represents the coefficient in the probit regression model shown in equation (15). Standard
errors are reported in the parentheses. First column represents the result for the pooled sample, which has
been formed by combining the cross-sectional and time-series information. The table also shows the
temporal effect of variables on the probability to go public. Regression for 2002 Due to insufficient
information available about the IPOs, the model could not perform analysis for the year 2002. Log
likelihood and pseudo R2
for the model is also reported in the table.
Time period/
variables
Total
sample 1999 2000 2001 2003 2004 2005
Size 0.154*** 0.339** 0.172** 0.094 0.237** 0.254*** 0.184***
(0.025) (0.140) (0.084) (0.193) (0.134) (0.072) (0.041)
Age -0.142*** -0.673**
-
0.785*** -0.884** -0.651** -0.093 0.029
(0.055) (0.296) (0.282) (0.533) (0.339) (0.152) (0.083)
Profitability 0.001*** 0.044*** 0.003* 0.006* 0.012** 0.003** 0.002***
(0.001) (0.014) (0.002) (0.004) (0.006) (0.002) (0.001)
Level of
Disclosures -0.364 -16.583 1.371 -1.132 -8.603 -4.457 -6.595**
(1.060) (13.292) (1.801) (5.751) (12.231) (4.887) (3.865)
Leverage -0.005 -1.432** -0.192* -3.045* -0.217 -0.243** 0.001
(0.006) (0.633) (0.139) (1.929) (0.246) (0.135) (0.002)
Risk 1.283** 8.986 10.317* 0.125 -206.807 0.114 1.305*
(0.630) (2.310) (7.127) (3.641) (778.775) (2.259) (0.959)
Sales growth -0.00001 -0.00016 -0.00005
-
0.000004 0.000008 -0.00002
-
0.000002
(0.00003) (0.0005) (0.0002) (0.0001) (0.00006) (0.0001) (0.00003)
Capital
expenditure 0.233 3.063*** 0.445 2.412 0.992 -0.412 0.230
(0.203) (1.065) (0.745) (1.865) (-0.756) (0.567) (0.335)
Cost of credit 0.00001 -0.424 -0.003 -0.372 0.0002* -0.026 -0.0001
(0.00003) (0.360) (0.016) (0.775) (0.0001) (0.553) (0.0003)
Ind_manufacturing 0.501** -0.097 -0.445 - 0.158 -0.523 0.251
(0.204) (0.772) (0.361) - (1.109) (0.748) (0.378)
Ind_services -0.785** -1.605*** -0.832* - - -0.127 -0.124
(0.384) (0.488) (0.606) - - (0.268) (0.367)
Ind_banking
services (0.032) - - - - - -
(0.198) - - - - - -
Ind_financial
services- - - - - - -
n 6185
454 491 631 1097 1269 1294
Log likelihood -432.11 -25.233 -37.796 -11.2441 -20.367 -62.613 -188.813
Psuedo R2 0.1047 0.4748 0.2261 0.4094 0.3624 0.1362 0.0943
The sign ***, ** and * indicate significant at 1%, 5% and 10% respectively.

Working Paper Series (WPS), Indian Institute of Management, Lucknow WPS Number: 2006-07/06
41
FIGURES
Figure 1
Industry wise distribution of IPOs
This figure depicts the industry wise distribution of IPOs on time scale. ‘y axis’ denotes number of IPOs
and ‘x axis’ shows the time period. The companies are classified into four industries- manufacturing,
services, financial services and banking services. All four industries are shown by four different textures.
(Source: CMIE Prowess)
0
5
10
15
20
25
30
35
1999 2000 2001 2002 2003 2004 2005
Time period
IPO
s
Manufacturing Services Financial Services Banking Services
Figure 2 Figure below illustrates the industry wise distribution of total IPO sample. Manufacturing and services
sector share a major portion of IPO sample whereas number of IPOs is least from the financial services
companies. (Source: CMIE Prowess)
Manufacturing
Services
Financial Services
Banking Services
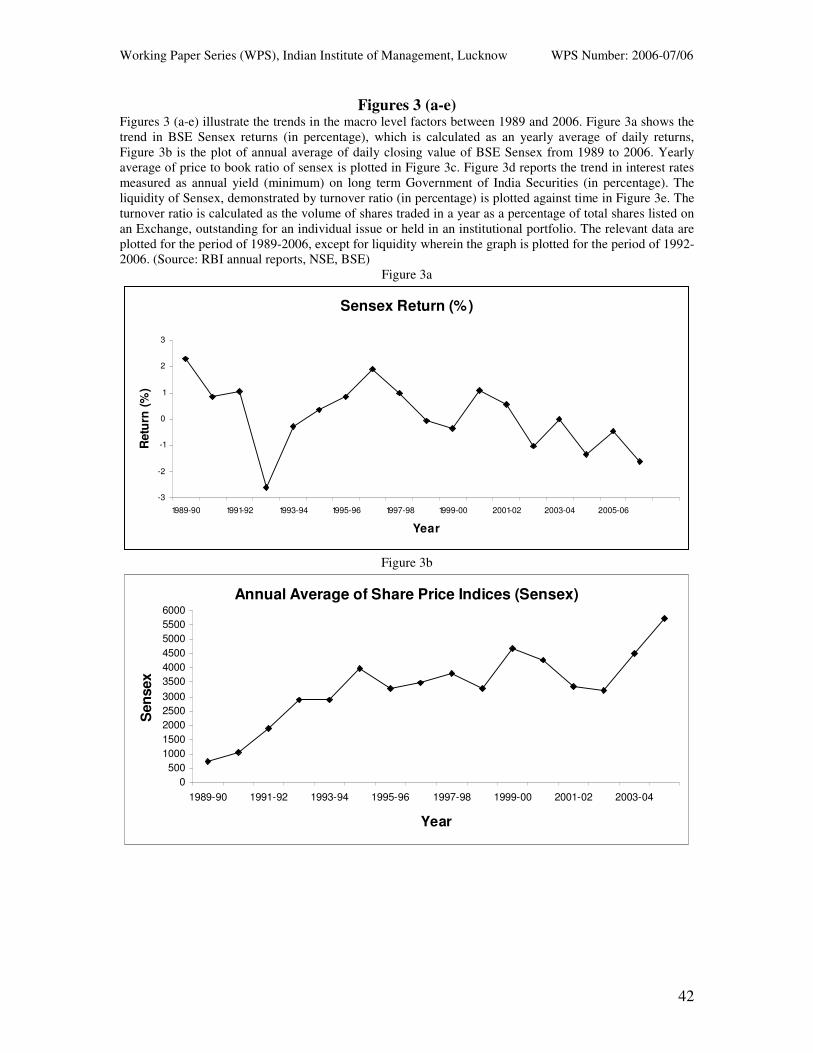
Working Paper Series (WPS), Indian Institute of Management, Lucknow WPS Number: 2006-07/06
42
Figures 3 (a-e) Figures 3 (a-e) illustrate the trends in the macro level factors between 1989 and 2006. Figure 3a shows the
trend in BSE Sensex returns (in percentage), which is calculated as an yearly average of daily returns,
Figure 3b is the plot of annual average of daily closing value of BSE Sensex from 1989 to 2006. Yearly
average of price to book ratio of sensex is plotted in Figure 3c. Figure 3d reports the trend in interest rates
measured as annual yield (minimum) on long term Government of India Securities (in percentage). The
liquidity of Sensex, demonstrated by turnover ratio (in percentage) is plotted against time in Figure 3e. The
turnover ratio is calculated as the volume of shares traded in a year as a percentage of total shares listed on
an Exchange, outstanding for an individual issue or held in an institutional portfolio. The relevant data are
plotted for the period of 1989-2006, except for liquidity wherein the graph is plotted for the period of 1992-
2006. (Source: RBI annual reports, NSE, BSE)
Figure 3a
Sensex Return (%)
-3
-2
-1
0
1
2
3
1989-90 1991-92 1993-94 1995-96 1997-98 1999-00 2001-02 2003-04 2005-06
Year
Retu
rn (
%)
Figure 3b
Annual Average of Share Price Indices (Sensex)
0
500
1000
1500
2000
2500
3000
3500
4000
4500
5000
5500
6000
1989-90 1991-92 1993-94 1995-96 1997-98 1999-00 2001-02 2003-04
Year
Sen
sex

Working Paper Series (WPS), Indian Institute of Management, Lucknow WPS Number: 2006-07/06
43
Figure 3c
Sensex Price to Book Ratio (Yearly Average)
4.35
4.4
4.45
4.5
4.55
4.6
4.65
4.7
4.75
4.8
4.85
1989-90 1991-92 1993-94 1995-96 1997-98 1999-00 2001-02 2003-04 2005-06
Year
Rati
o
Figure 3d
Annual (gross) Long Term Yield of Government of India
Securities (%)
0
2
4
6
8
10
12
14
1989-90 1991-92 1993-94 1995-96 1997-98 1999-00 2001-02 2003-04 2005-06
Year
Yie
ld (
%)

Working Paper Series (WPS), Indian Institute of Management, Lucknow WPS Number: 2006-07/06
44
Figure 3e
Liquidity (BSE)
0
20
40
60
80
100
120
140
160
180
200
1989-90 1991-92 1993-94 1995-96 1997-98 1999-00 2001-02 2003-04 2005-06
Year
Tu
rno
ver
rati
o (
%)
Figure 4 (a-b)
Number of IPOs and Amount raised by Indian Companies from 1989 to 2006
Figure 4a pictures the distribution of number of IPOs by Indian companies from 1989 to 2006. Axis ‘y’
denotes the annual figure of number of IPOs and axis ‘x’ denotes the time period. The annual trend in
capital raised through the IPOs is plotted in figure 4b.
Figure 4 a
IPOs
0
200
400
600
800
1000
1200
1400
1600
1989-90 1991-92 1993-94 1995-96 1997-98 1999-00 2001-02 2003-04 2005-06
Year
IPO
s

Working Paper Series (WPS), Indian Institute of Management, Lucknow WPS Number: 2006-07/06
45
Figure 4 b
Amount Raised through IPOs
0
5,000
10,000
15,000
20,000
25,000
30,000
1989-90 1991-92 1993-94 1995-96 1997-98 1999-00 2001-02 2003-04 2005-06
Year
Am
ou
nt
(cro
res)