Embed Size (px)
Citation preview

Global Finance Journal 24 (2013) 153–170
Contents lists available at ScienceDirect
Global Finance Journal
j ourna l homepage: www.e lsev ie r .com/ locate /gf j
An empirical study of bank efficiency in Chinaafter WTO accession
Haiyan Yin a,⁎, Jiawen Yang b, Jamshid Mehran a
a Indiana University South Bend, United Statesb The George Washington University, United States
a r t i c l e i n f o
⁎ Corresponding author at: 1700 Mishawaka Ave., SoE-mail address: [email protected] (H. Yin).
1 See Yao, Jiang, Feng, and Willenboackel (2007), Bfor China's banking reform and restructuring.
2 The Big Four includes the Industrial and Commerand the Agricultural Bank of China (ABC).
1044-0283/$ – see front matter © 2013 Elsevier Inc.http://dx.doi.org/10.1016/j.gfj.2013.07.001
a b s t r a c t
Available online 16 July 2013
This paper documents the technical efficiency of Chinese banksover 1999–2010. With stochastic frontier analysis, we find that Chinesebanks are about 18% more efficient in generating lending assets thanprofits.We also observe an upward trend of bank efficiency after China'sentry to WTO in 2001. The improvement of bank efficiency is mostprominent for the largest banks with substantial state ownership.We also find that majority state-owned banks are least efficient; wellcapitalized banks are less efficient; bank efficiency decreases with banksize at the lower end, but banks gain efficiency and realize economies ofscalewhenbank size grows large enough;more fee-generating businessreduces efficiency; better management improves efficiency.© 2013 Elsevier Inc. All rights reserved.
JEL classification:G21D24O53
Keywords:Bank efficiencyChinaBank characteristicsWTO accession
1. Introduction
China's banking industry has gone through structural reforms and significant changes in the past twodecades.1 In the mid-1990s, the four specialized state-owned banks (often referred to as the “Big Four” inthe banking industry in China) started their transformation from policy banks to commercial banks.2
China's intent to join the World Trade Organization (WTO) was a major impetus for further reformsin the banking industry. In 1999, the historically accumulated policy-induced non-performing loansfrom the Big Four were peeled off from their balance sheets. In subsequent years, the Chinesegovernment injected new capital to these banks and took further actions to reduce their non-performing loans. By July 2010, all the previously state-owned commercial banks have gone through
uth Bend, IN 46530, United States. Tel.: +1 574 5204885; fax: +1 574 5204866.
erger, Hasan, and Zhou (2009) and Barth, Zhou, Arner, Hsu, and Wang (2007)
cial Bank of China (ICBC), China Construction Bank (CCB), Bank of China (BOC),
All rights reserved.
154 H. Yin et al. / Global Finance Journal 24 (2013) 153–170
initial public offering (IPO) in various markets and become share-holding commercial bankingcorporations.3 With the fifth largest commercial bank – Bank of Communications – included, the fivelargest commercial banks – the “Top Five” – are still dominating the banking industry in Chinawith about halfof industry assets. Non-state-owned national stock-holding commercial banks (referred to as “joint-stock”commercial banks in Chinese publications), and city (regional) commercial banks have become moreprevalent and have seen increasing market share. The city commercial banks were formed by consolidatingformer local urban cooperatives. Same as the joint-stock commercial banks, city commercial banks operate ona pure commercial basis focusing on profit maximization and market share.
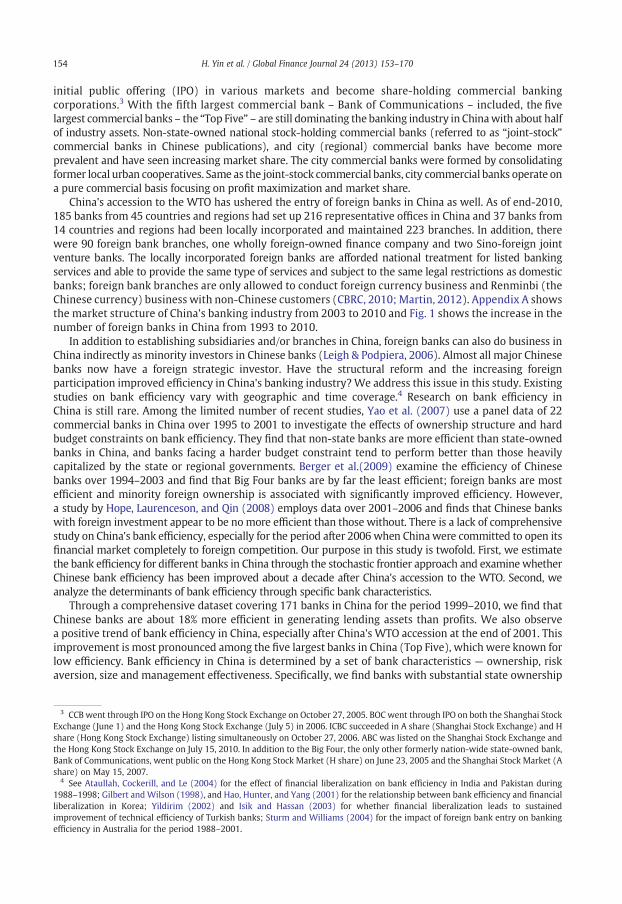
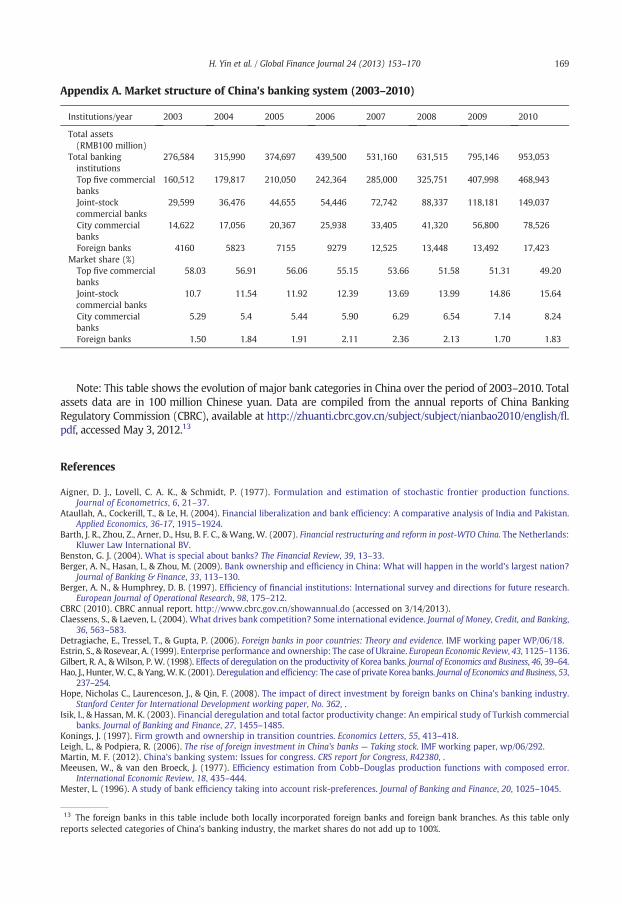
China's accession to the WTO has ushered the entry of foreign banks in China as well. As of end-2010,185 banks from 45 countries and regions had set up 216 representative offices in China and 37 banks from14 countries and regions had been locally incorporated and maintained 223 branches. In addition, therewere 90 foreign bank branches, one wholly foreign-owned finance company and two Sino-foreign jointventure banks. The locally incorporated foreign banks are afforded national treatment for listed bankingservices and able to provide the same type of services and subject to the same legal restrictions as domesticbanks; foreign bank branches are only allowed to conduct foreign currency business and Renminbi (theChinese currency) business with non-Chinese customers (CBRC, 2010; Martin, 2012). Appendix A showsthe market structure of China's banking industry from 2003 to 2010 and Fig. 1 shows the increase in thenumber of foreign banks in China from 1993 to 2010.
In addition to establishing subsidiaries and/or branches in China, foreign banks can also do business inChina indirectly as minority investors in Chinese banks (Leigh & Podpiera, 2006). Almost all major Chinesebanks now have a foreign strategic investor. Have the structural reform and the increasing foreignparticipation improved efficiency in China's banking industry?We address this issue in this study. Existingstudies on bank efficiency vary with geographic and time coverage.4 Research on bank efficiency inChina is still rare. Among the limited number of recent studies, Yao et al. (2007) use a panel data of 22commercial banks in China over 1995 to 2001 to investigate the effects of ownership structure and hardbudget constraints on bank efficiency. They find that non-state banks are more efficient than state-ownedbanks in China, and banks facing a harder budget constraint tend to perform better than those heavilycapitalized by the state or regional governments. Berger et al.(2009) examine the efficiency of Chinesebanks over 1994–2003 and find that Big Four banks are by far the least efficient; foreign banks are mostefficient and minority foreign ownership is associated with significantly improved efficiency. However,a study by Hope, Laurenceson, and Qin (2008) employs data over 2001–2006 and finds that Chinese bankswith foreign investment appear to be nomore efficient than those without. There is a lack of comprehensivestudy on China's bank efficiency, especially for the period after 2006 when Chinawere committed to open itsfinancial market completely to foreign competition. Our purpose in this study is twofold. First, we estimatethe bank efficiency for different banks in China through the stochastic frontier approach and examine whetherChinese bank efficiency has been improved about a decade after China's accession to the WTO. Second, weanalyze the determinants of bank efficiency through specific bank characteristics.
Through a comprehensive dataset covering 171 banks in China for the period 1999–2010, we find thatChinese banks are about 18% more efficient in generating lending assets than profits. We also observea positive trend of bank efficiency in China, especially after China's WTO accession at the end of 2001. Thisimprovement is most pronounced among the five largest banks in China (Top Five), which were known forlow efficiency. Bank efficiency in China is determined by a set of bank characteristics — ownership, riskaversion, size and management effectiveness. Specifically, we find banks with substantial state ownership
3 CCB went through IPO on the Hong Kong Stock Exchange on October 27, 2005. BOC went through IPO on both the Shanghai StockExchange (June 1) and the Hong Kong Stock Exchange (July 5) in 2006. ICBC succeeded in A share (Shanghai Stock Exchange) and Hshare (Hong Kong Stock Exchange) listing simultaneously on October 27, 2006. ABC was listed on the Shanghai Stock Exchange andthe Hong Kong Stock Exchange on July 15, 2010. In addition to the Big Four, the only other formerly nation-wide state-owned bank,Bank of Communications, went public on the Hong Kong Stock Market (H share) on June 23, 2005 and the Shanghai Stock Market (Ashare) on May 15, 2007.
4 See Ataullah, Cockerill, and Le (2004) for the effect of financial liberalization on bank efficiency in India and Pakistan during1988–1998; Gilbert andWilson (1998), and Hao, Hunter, and Yang (2001) for the relationship between bank efficiency and financialliberalization in Korea; Yildirim (2002) and Isik and Hassan (2003) for whether financial liberalization leads to sustainedimprovement of technical efficiency of Turkish banks; Sturm and Williams (2004) for the impact of foreign bank entry on bankingefficiency in Australia for the period 1988–2001.

0
50
100
150
200
250
300
350
400
1993 1997 2001 2003 2004 2005 2006 2007 2008 2009 2010
76
175190 192 188 207
224
274
311338
360
Number of Foreign Banks in China
Fig. 1. The growth of foreign-funded banks in China. This chart shows the number of foreign-funded banks in China across year.Foreign-funded banks include head offices of locally incorporated banks, branches and subsidiaries of locally incorporated banks, foreignbank branches and sub-branches for the years before 2004. The number of banks excludes sub-branches for the years 2004–2010, whichcontributes to the slight drop in the number from 2003 to 2004.Data are compiled from annual reports of China Banking Regulatory Commission (CBRC), available at http://www.cbrc.gov.cn/showannual.do, accessed 5/3/2012.
155H. Yin et al. / Global Finance Journal 24 (2013) 153–170
(Top Five) are less efficient than other banks. More risk-averse banks are observed to be associated withlower efficiency scores than more risk-seeking banks that use more borrowed funds (deposits) for theirloans. We find non-linear relationship between bank size and efficiency. Bank efficiency decreases with banksize at the lower end, but banks gain efficiency when bank size grows large enough and realize economies ofscale. When banks rely heavily on other fee-generating businesses (e.g., insurance, investment, etc.), theybecome less efficient andwe fail tofind evidence of economies of scope. Finally, we observe thatmanagementeffectiveness is a determinant of bank efficiency. As expected, better management improves bank efficiency.
This paper contributes to the literature by providing themost recent evidence on Chinese bank efficiency.Our data covers the period 1999–2010 while none of the existing studies has the recent coverage of abouta decade after China's accession to WTO, especially after 2006 when China's banking industry becamecompletely open. This recent coverage allows us to include in our analysis foreign banks, which are rarelycovered in the existing literature. We also test the determinants of bank efficiency, which includes bankownership, risk preference, size, business structure, and management effectiveness.
The remainder of the paper is organized as follows. We describe the methodology and data in Section 2.The estimates of technical efficiency of different bank categories are presented and discussed in Section 3.Our analysis of the determinants of technical efficiency is conducted in Section 4. Robustness check is discussedin Section 5. The final section concludes.
2. Methodology and data
2.1. Measurement of bank efficiency
Different measures of bank efficiency have been used in the literature. Commercial banks' net interestmargins and/or overhead costs are widely used when evaluating bank efficiency. For example, Micco,Panizza, and Yanez (2007) use these two measures to examine whether the entry of foreign banks playsa useful role in making domestic banks more efficient for 119 countries over 1995–2002.
Banks' technical efficiency has drawn much attention in recent studies. Technical efficiency of a firmrefers to its ability to transform a given amount of input into the maximum level of output or minimizeinput to obtain a given amount of output. It is a relative concept in the sense that it measures the distanceof a firm's performance from the best-practice frontier that represents the optimal utilization of resources.Different techniques have been applied in bank efficiency studies to estimate the best-practice frontierand then the technical efficiency score of a bank. According to Berger and Humphrey (1997), who providea survey of 130 studies on the efficiency of financial institutions, there are five estimation approaches

156 H. Yin et al. / Global Finance Journal 24 (2013) 153–170
that can be classified into two categories: parametric and nonparametric techniques. The parametrictechniques include the stochastic frontier approach (SFA), the distribution free approach (DFA), andthe thick frontier approach (TFA). The nonparametric techniques include data envelopment analysis(DEA) and free disposal hull (FDH). Each of these approaches has its strengths and weakness. One majordifference between parametric and nonparametric approach is that the parametric techniques need tospecify a functional form for the production, profit or cost function, while the nonparametric techniquesimpose less restrictions on the frontier and the frontier is based on the given dataset rather than a specificfunction. One major disadvantage of the parametric approach is that the pre-specified functional form forefficiency frontier may result in inaccurate efficiency measurement (Berger & Humphrey, 1997). Althoughnonparametric approach can avoid thismisspecification issue, its assumption of no randomerrors in influencingbank performance may lead to omitted errors in the efficiency estimates. The stochastic frontier model allowsboth inefficiency andmeasurement error. As our dataset covers 171banks over 12 years, therewill be significantvariations of efficiencies across different kinds of banks in different time periods. This implies that the effectof random errors cannot be ignored, therefore in this paper we follow Yao et al. (2007) and use stochasticfrontier analysis to examine the bank efficiency of China.
The stochastic frontier model was first proposed by Aigner, Lovell, and Schmidt (1977) and Meeusenand van den Broeck (1977) in the context of production function estimation. A stochastic productionfrontier model can be specified as
5 Theis no di
lnyit ¼ f xit ;βð Þ þ vit−uit ;i ¼ 1;…;N; t ¼ 1;…; T ð1Þ
yit is the observed output of producer i at time t, xit and β are vectors of inputs and the
wherecorresponding coefficients, respectively. vit is a zero-mean random error that describes random shocksaffecting the production process, and uit N 0 is the effect of technical inefficiency and is assumed to have ahalf-normal distribution.5 If we exclude the inefficiency term uit from Eq. (1), we getlnyit ¼ f xit ;βð Þ þ vit : ð2Þ
Eq. (2) is the production function for a fully efficient firm at time t. It defines the stochastic frontier of theproduction function. As a firm's efficiency is less than or equal to the efficiency of a fully efficient firm, thenon-negative uit in Eq. (1) guarantees that the observed log of output, ln yit, is bounded below the frontier.The value of 100 ∗ uit is the percentage bywhich output can be increased to reachmaximumoutput potentialusing the same inputs. The score of technical efficiency (TE) can be expressed as
TEit ¼ exp −uitf g ð3Þ
Eit represents the ratio of observed output of producer i at time t to maximum output potential.
and TTherefore TE is within the range of [0, 1]. When TEit = 1, the i-th firm obtains maximum feasible outputat time t; when TEit b 1, there is a shortfall in efficiency — the firm does not reach its maximum feasibleoutput.The banking industry is different from manufacturing firms in that it does not produce physical goodsbut intermediation services that are difficult to identify. How to measure inputs and outputs of banks anddetermine the best-practice frontier therefore becomes a critical issue in bank efficiency studies. There aretwo broad approaches to measure bank inputs and outputs in the current literature: the productionapproach and the intermediation approach. The production approach treats a bank as a firm that producesdeposit and loan accounts. The best measure of output under the production approach should be thenumber of deposits and loan transactions. One drawback of this approach is that the individualtransaction data are usually not publicly available, which make this approach difficult to implement inempirical studies. The other is the intermediation approach that emphasizes the intermediationfunction of banks — channel funds from depositors to borrowers. With the intermediation approach,bank loans and investments are considered output while deposit, labor and capital serve as inputs.
re are several different assumptions on the distribution of uit, such as half-normal, truncated normal, and exponential. Therescussion in the literature on which distribution assumption is better, although half-normal distribution is most widely used.

157H. Yin et al. / Global Finance Journal 24 (2013) 153–170
Due to data availability, we adopt the intermediation approach to measure bank inputs. Bank inputsare defined as fixed assets, deposit and equity.6 For outputs, we use two alternative measures. We firstfocus on banks' objective tomaximize its profit andmeasure bankoutputwith the book value of pre-tax profit(the profit model). Thenwe assume that banks' objective is to channel funds from depositors to creditors anduse book value of loans as a proxy for bank output (the loan model).7
Based on the foregoing discussion, we use the Cobb–Douglas production function and specify ourempirical model as follows:
6 Wecorrelatincludethat moobserva
7 Wenot allo
8 Net9 See
ln profitit or loanitð Þ ¼ β0 þ β1 ln fixed assetitð Þ þ β2 ln deposititð Þþβ3 ln equityitð Þ þ year dummiest þ vit−uit
ð4Þ
subscripts i and t denote banks and time, respectively.8 We add year dummies in the model to avoid
whereany estimation biases that may arise due to potential changes in banking performance due to technologicalprogress or changes in the economic and regulatory environments.2.2. Data
Our dataset covers all commercial banks in China over 1999–2010 that are available in Bankscope. Weselect 1999 as our starting year for two considerations. First, the Asian financial crisis of 1997 and 1998adversely affected the performance of banks in China. The low efficiency for those years does not representthe typical performance of a bank.9 Second, asmentioned earlier, the historically accumulated policy-inducednon-performing loans (NPLs)were removed from the Big Four in 1999, marking the beginning of the Big Fourto perform as market-driven commercial banks. Our sample is an unbalanced panel which includes financialdata of 171 banks (133 Chinese banks and 38 foreign-funded banks) during the period of 1999–2010 fromBankscope. For comparison of the technical efficiency of different banks, we categorize all banks in China intofour groups: banks with substantial state ownership — state-owned banks or Top Five, national joint-stockcommercial banks (joint-stock banks), city commercial banks (domestic local banks), and foreign-fundedbanks. Table 1 presents the number of banks in each category in the sample. As is shown in Table 1, thenumber of banks in the sample increased since 1999 until 2007 which is followed by a slight drop. It is notedthat the number of foreign-funded banks has been increasing for the whole sample period. Especially thereis a big jump from 10 foreign banks in 2006 to 25 in 2007, which attributes to the complete opening-up ofChina's banking sector in 2006 according to China's commitment to WTO. The summary statistics of majorinput and output variables across years are reported in Table 2.
3. Results and discussion
3.1. Evidence of technical inefficiency
We use the maximum-likelihoodmethod to estimate the parameters of the empirical model and reportthe results in Table 3. Column (1) presents the regression results of the profit model. It shows that banks'pre-tax profit is positively related to all the input variables — fixed assets, deposits, and equity. All thecoefficients are statistically significant at 1% level. The estimated coefficients for fixed assets, deposits andequity measure their elasticity with respect to bank profits. Equity has the largest elasticity at 0.570,followed by deposit at 0.359 and fixed assets at 0.109. The reported likelihood-ratio (LR) tests whetherthere is technical inefficiency component in the model. It is a test of the null hypothesis H0: σu
2 = 0
do not include labor in our inputs based on the following reasons: first, our data shows that labor and fixed assets are highlyed with correlation coefficient of 0.92, the multicolinearity issue would be serious if labor and fixed assets were bothd in the model. Second, as is observed by Yao et al. (2007), labor is not a significant determinant of bank output in China givenst banks are overstaffed. Third, many banks do not report labor data in China. Missing labor data would reduce the number oftions by more than 50% if labor was included in the model and the result would be less robust.don't use book value of loans and investment to measure bank output because the specific frontier production model doesw multi-outputs.loan is total loan minus loan loss reserve.Yao et al. (2007).

Table 1Number of banks in the sample.
Year State-owned (top five) banks Joint-stock banks Domestic local banks Foreign-funded banks All sample
1999 5 9 10 8 322000 5 9 15 7 362001 5 9 16 5 352002 5 9 25 6 452003 5 9 29 6 492004 5 11 39 6 612005 5 11 57 8 812006 5 12 80 10 1072007 5 12 85 25 1272008 5 12 71 27 1152009 5 12 70 30 1172010 5 12 48 30 95
Note: This table shows the number of commercial banks in China with data available in Bankscope from 1999 to 2010.Policy banks, investment banks and the central bank are excluded from the sample. There are 171 different banks in the sample withfrequency of occurrence ranging from 1 to 12. Therefore, the dataset is an unbalanced panel.
158 H. Yin et al. / Global Finance Journal 24 (2013) 153–170
against the alternative hypothesis H1: σu2 N 0. The LR test result in column (1) rejects the null and confirms
that there exists inefficiency when banks in China transform inputs into profit.With loan as a measure of output, the signs of the estimated coefficients as reported in column (2)
of Table 3 are consistent with that of the profit model and all coefficients are positive and statisticallysignificant at 1% level, as expected. The estimated coefficients for fixed assets, deposit and equity are 0.135,0.406 and 0.504, respectively. Fixed assets and deposit have a stronger impact, but equity has a weaker
Table 2Summary statistics of the variables in the stochastic frontier model.Data are obtained from Bankscope.
Year Pre-tax profit Loan Fixed assets Deposit Equity
1999 Mean 3.669 7.936 4.522 8.150 6.069N 32 32 32 26 33
2000 Mean 3.734 7.997 4.615 8.242 6.016N 32 36 36 31 37
2001 Mean 3.484 7.949 4.498 7.831 5.764N 35 35 35 31 36
2002 Mean 3.216 7.756 4.250 7.694 5.320N 44 45 43 42 45
2003 Mean 3.295 7.926 4.279 7.907 5.463N 48 49 48 46 49
2004 Mean 3.434 7.787 3.980 7.866 5.270N 57 61 60 59 60
2005 Mean 3.635 7.690 3.811 7.834 5.319N 76 81 81 79 80
2006 Mean 3.479 7.499 3.501 7.621 5.225N 105 107 106 105 107
2007 Mean 4.034 7.778 3.552 7.820 5.682N 122 127 127 125 126
2008 Mean 4.656 8.278 3.924 8.475 6.331N 112 115 115 115 115
2009 Mean 4.659 8.512 4.024 8.767 6.648N 114 117 116 117 117
2010 Mean 5.352 8.974 4.415 9.292 7.214N 92 95 94 95 95
Total Mean 4.066 8.051 3.986 8.198 5.939N 869 900 893 871 900
Note: This table reports the mean and number of observations ofmajor input and output variables. Pre-tax profit and loan are alternativemeasures of bank output; fixed assets, deposits and equity are bank inputs. All the data are in logarithm of million U.S. dollars.

Table 3Estimates of the profit and loan models.
(1) (2)
Pre-tax profit Loan
Intercept −2.654⁎⁎⁎ 1.142⁎⁎⁎
(0.178) (0.126)Fixed assets 0.109⁎⁎⁎ 0.135⁎⁎⁎
(0.029) (0.019)Deposit 0.359⁎⁎⁎ 0.406⁎⁎⁎
(0.030) (0.022)Equity 0.570⁎⁎⁎ 0.504⁎⁎⁎
(0.024) (0.018)No. of observations 824 855LR test 49.98 (p-value = 0) 8.55 (p-value = 0.002)Sigma_u 0.783 0.344Sigma_v 0.395 0.331Lambda 1.980 1.039
Note: This table presents the regression results of the stochastic frontier model with different measurement of bank output— profitand loan. Profit is measured with pre-tax profit of banks; loan refers to net loan which is defined as total bank loan net of loan lossreserve. Yeardummy variables are included in the regressionswith year 1999 as the omitted variable. Fixed assets, deposit and equityare measures of bank inputs. All variables are in natural logarithms except for the year dummies. Sigma_u is the standard deviationof inefficiency term and Sigma_v is the standard deviation of random noise. Lambda is the ratio of standard deviation of thehalf-normal inefficiency term and random noise, that is Sigma_u/Sigma_v. Data are obtained from Bankscope. Standard errors inparentheses.⁎ Denotes significance at 10%.
⁎⁎ Denotes significance at 5%.⁎⁎⁎ Denotes significance at 1%.
159H. Yin et al. / Global Finance Journal 24 (2013) 153–170
impact than in the profit model. Similar to the results with the profit model, the LR test also confirms thepresence of a one-sided error component which represents the technical inefficiency in the loan model.
3.2. Trend of technical efficiency
Table 4 reports the estimated technical efficiency scores of banks in China over 1999–2010 with boththe profit model (panel A) and the loan model (panel B). The average level of technical efficiency over thesample period is 0.597 with the profit model and 0.778 with the loan model, leaving a gap with the bestpossible frontier of 40.3% and 22.2%, respectively. The higher efficiency score with the loan model thanthat with the profit model indicates that banks in China are more efficient in transforming bank inputs intoloan than into profit. This can be justified by the fact that on average Chinese banks are far less profitablethan those in more advanced economies.10 In addition, Chinese banks are renowned for the large amountof non-performing loans, but we do not take into consideration the quality of loan when we use loan tomeasure bank output, that is, the output loan includes both good quality loans and non-performing loans.Therefore, we need to be careful when interpreting the higher efficiency score with the loan model. Forrobustness check purpose, we exclude non-performing loan and use normal loan only tomeasure bank outputas is discussed in Section 5, and find that the average efficiency scorewith the loanmodel is 0.748, which is still15% higher than that with the profit model.
As is shown in both Table 4 and Fig. 2, of the four bank categories, the joint-stock banks are the mostefficient, followed by domestic local banks. The efficiency score of the other two categories, banks withmajority state ownership (Top Five) and foreign-funded banks, are lower than that of joint-stock banksand regional banks, although the rank varies with the model. With the profit model, banks with majoritystate ownership are more efficient than foreign-funded banks, yet the loan model indicates otherwise.
Fig. 3 shows the general trend of bank efficiency in China from 1999 to 2010. We observe an upwardtrend in efficiency score since 2001with the profit model; with the loan model, the upward trend starts
10 See Yao et al. (2007).

Table 4Technical efficiency score of banks in China (1999–2010).Data are obtained from Bankscope.
Total State-owned(top five) banks
Joint-stockbanks
Domestic localbanks
Foreign-fundedbanks
Year Mean N Mean N Mean N Mean N Mean N
Panel A: profit model1999 0.556 26 0.495 5 0.710 3 0.565 10 0.525 82000 0.583 27 0.532 5 0.730 4 0.534 13 0.642 52001 0.548 31 0.398 5 0.650 5 0.568 16 0.529 52002 0.569 38 0.476 4 0.642 6 0.585 22 0.499 62003 0.587 43 0.609 4 0.636 6 0.597 27 0.478 62004 0.590 52 0.597 4 0.655 7 0.599 35 0.462 62005 0.605 72 0.571 5 0.572 8 0.604 51 0.668 82006 0.594 101 0.540 5 0.572 8 0.581 78 0.736 102007 0.598 118 0.583 4 0.610 10 0.616 84 0.516 202008 0.613 112 0.576 5 0.564 12 0.634 71 0.583 242009 0.606 113 0.671 5 0.650 12 0.656 70 0.437 262010 0.612 91 0.655 5 0.656 12 0.680 48 0.458 26Total 0.597 824 0.558 56 0.626 93 0.615 525 0.527 150
Panel B: loan model1999 0.773 26 0.826 5 0.857 3 0.785 10 0.694 82000 0.771 31 0.801 5 0.838 4 0.798 15 0.655 72001 0.775 31 0.755 5 0.822 5 0.799 16 0.672 52002 0.766 39 0.751 4 0.809 6 0.795 23 0.623 62003 0.773 44 0.736 4 0.828 6 0.792 28 0.656 62004 0.775 56 0.731 4 0.784 8 0.791 38 0.692 62005 0.779 77 0.722 5 0.822 8 0.785 56 0.733 82006 0.776 103 0.698 5 0.782 9 0.782 79 0.767 102007 0.777 123 0.666 4 0.784 10 0.770 84 0.814 252008 0.781 115 0.706 5 0.806 12 0.781 71 0.787 272009 0.784 116 0.752 5 0.824 12 0.784 70 0.773 292010 0.782 94 0.760 5 0.816 12 0.775 48 0.781 29Total 0.778 855 0.744 56 0.810 95 0.783 538 0.756 166
Note: This table shows the technical efficiency score of banks in China over the period 1999–2010. The reported efficiency scorerepresents the observed output as measured by pre-tax profit or loan as a percentage of best-practice output implied by thepre-specified production model. Higher technical efficiency indicates that the bank's performance is closer to the best-practicefrontier and the bank is more efficient in transforming inputs into output.
160 H. Yin et al. / Global Finance Journal 24 (2013) 153–170
from year 2002. That is, in general, the banking system in China has gained efficiency since it joined WTOin 2001 and committed to liberalize its banking system according to a predetermined schedule. The risingcompetition pressure over the time period tends to increase bank efficiency. Competition in China'sbanking sector comes from both inside and outside. Financial reform in China has increased the number ofdomestic banks dramatically, from the big state-owned banks only at the beginning of China's economicreform to more than three thousand banking institutions as of 2010.11 Since the end of 2001, the entryof foreign-funded banks in China has created unprecedented competition pressure on domestic banks.Domestic banks have to improve efficiency in order to succeed or even survive. Among the benefitsof foreign bank presence, foreign banks could provide a good source of training in banking and financefor locally employed people and technology transfer when these employees leave to work for domesticorganizations (Benston, 2004). With more skilled employees, banks' inputs are supposed to be transformedinto outputs in a more efficient way. Countries with greater foreign bank entry have been found to be morecompetitive (Claessens & Laeven, 2004).
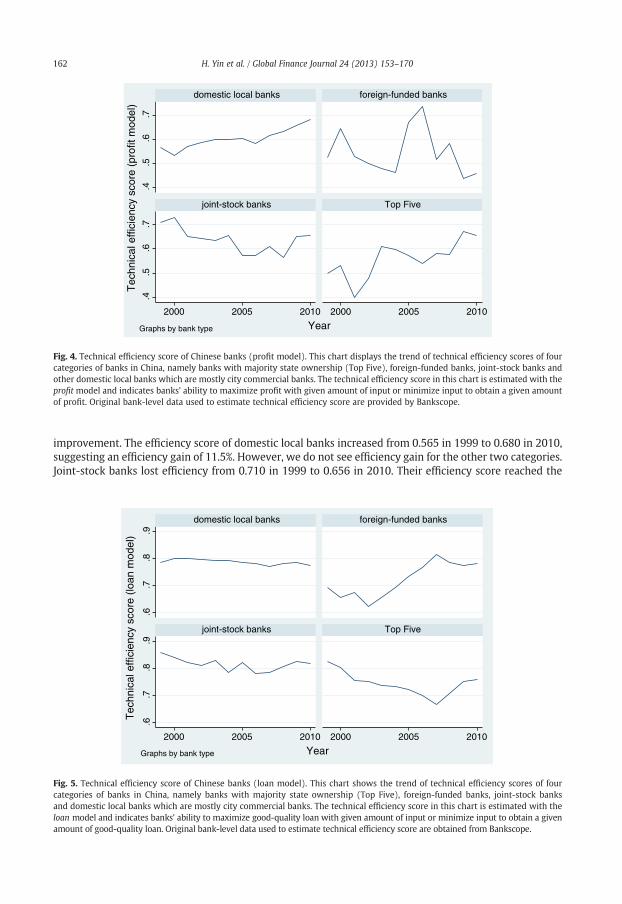
Figs. 4 and 5 depict the trend of technical efficiency of each individual bank category. The technicalefficiency score in Fig. 4 is estimated with the profit model and that in Fig. 5 is estimated with the loanmodel. With before-tax profit as a measure of bank output, Fig. 4 shows a different path for each bank
11 See the annual reports of China Banking Regulatory Commission (CBRC), available at http://zhuanti.cbrc.gov.cn/subject/subject/nianbao2010/english/1.pdf, accessed on May 31, 2012.

0 .2 .4 .6
profit model
joint-stock banks
domestic local banks
Top Five
foreign-funded banks
0 .2 .4 .6 .8
loan model
joint-stock banks
domestic local banks
foreign-funded banks
Top Five
Mean technical efficiency score1999-2010
Fig. 2. Mean technical efficiency score of Chinese banks (1999–2010). This figure shows the average technical efficiency score ofthe four bank categories in China for the sample period 1999–2010. No matter the model used to estimate the efficiency score,joint-stock banks are the most efficient followed by domestic local banks. However, the results from the profit model indicate thatTop Five is more efficient than foreign-funded banks in generating profit, and the loan model shows that foreign-funded banks aremore efficient than Top Five in generating loans.
161H. Yin et al. / Global Finance Journal 24 (2013) 153–170
category. Top Five and domestic local banks have experienced an obvious efficiency gain over the sampleperiod, especially after 2001. The improvement in bank efficiency is more pronounced for Top Five whichwere renowned for their low efficiency before. In 1999, Top Five was the least efficient category withan efficiency score of 0.495, while the efficiency score went up to 0.655 in 2010, indicating a 16%
.55
.6.6
5.7
.75
.8
2000 2005 2010
Year
Tec
hnic
al e
ffici
ency
sco
re
profit model loan model
Fig. 3. Trend of bank efficiency in China (1999–2010). This chart shows the trend of bank efficiency in China for the sample period1999–2010. With profit model, we see an upward trend in efficiency score since 2001; with loan model, the upward trend startsfrom year 2002.
.4.5
.6.7
.4.5
.6.7
2000 2005 2010 2000 2005 2010
domestic local banks foreign-funded banks
joint-stock banks Top Five
YearGraphs by bank type
Tec
hnic
al e
ffici
ency
sco
re (
prof
it m
odel
)
Fig. 4. Technical efficiency score of Chinese banks (profit model). This chart displays the trend of technical efficiency scores of fourcategories of banks in China, namely banks with majority state ownership (Top Five), foreign-funded banks, joint-stock banks andother domestic local banks which are mostly city commercial banks. The technical efficiency score in this chart is estimated with theprofit model and indicates banks' ability to maximize profit with given amount of input or minimize input to obtain a given amountof profit. Original bank-level data used to estimate technical efficiency score are provided by Bankscope.
162 H. Yin et al. / Global Finance Journal 24 (2013) 153–170
improvement. The efficiency score of domestic local banks increased from 0.565 in 1999 to 0.680 in 2010,suggesting an efficiency gain of 11.5%. However, we do not see efficiency gain for the other two categories.Joint-stock banks lost efficiency from 0.710 in 1999 to 0.656 in 2010. Their efficiency score reached the
.6.7
.8.9
.6.7
.8.9
2000 2005 2010 2000 2005 2010
domestic local banks foreign-funded banks
joint-stock banks Top Five
YearGraphs by bank type
Tec
hnic
al e
ffici
ency
sco
re (
loan
mod
el)
Fig. 5. Technical efficiency score of Chinese banks (loan model). This chart shows the trend of technical efficiency scores of fourcategories of banks in China, namely banks with majority state ownership (Top Five), foreign-funded banks, joint-stock banksand domestic local banks which are mostly city commercial banks. The technical efficiency score in this chart is estimated with theloan model and indicates banks' ability to maximize good-quality loan with given amount of input or minimize input to obtain a givenamount of good-quality loan. Original bank-level data used to estimate technical efficiency score are obtained from Bankscope.

Table 5Summary statistics of bank efficiency determinants.Original data are obtained from Bankscope.
Variable N Mean SD Min Max
Capital ratio 891 1.857 0.725 −0.635 4.469Asset 900 8.707 2.034 3.766 14.525Asset squared 900 79.952 38.116 14.182 210.964Fee-based asset share 856 0.421 0.130 0.003 0.908Overhead 836 1.226 0.517 0.040 4.499
Note: This table reports the summary statistics of major bank efficiency determinants. Capital ratio is the logarithm of the ratio ofequity/assets in percentage used to measure risk preference; asset is the logarithm of total assets in million U.S. dollars that measuresbank size; fee-based asset share refers to the share of other earning assets in total earning assets and is used to approximate thelevel of business diversification. Overhead stands for overhead expenses as a percentage of total assets and is used as a proxy formanagement effectiveness.
163H. Yin et al. / Global Finance Journal 24 (2013) 153–170
lowest point in 2008 with 0.564 and started to pick up in 2009. However, despite the downward trend,joint-stock banks are still the most efficient category with an average efficiency of 0.626 (see Table 4),2.9% higher than the sample mean efficiency score. It is noted that the efficiency gap between Top Five andjoint stock banks has been diminishing due to the efficiency gain of Top Five and efficiency loss for thejoint-stock banks. In 1999, joint-stock banks had an efficiency score of 0.710 which is higher than thatof Top Five by the amount of 0.215, while in 2010 the efficiency gap basically disappeared. Fig. 4 showsa volatile efficiency path for foreign-funded banks. The efficiency score of foreign-funded banks reacheda top point in 2006, followed by a sharp drop in 2007. A plausible explanation for the drop is that thelarge increase in the number of new foreign banks (see Table 1) following the market opening-up in 2006drove down the performance of the entire category.12 Newly-established foreign banks tend to have lowefficiency due to the unfamiliarity of new market and other operational obstacles. The young age of mostforeign-funded banks in the sample can also explain the low efficiency of foreign-funded banks in 2009and 2010.
When we emphasize banks' intermediation function of channeling funds from depositors to creditors,the efficiency gain with the loan model is not as pronounced as that with the profit model, although bothTable 4 and Fig. 3 show an upward trend in efficiency after 2002. When we look into the trend for eachbank category in Fig. 5, we see the only category that seems to have gained efficiency is the foreign-fundedbanks. There is no obvious upward trend for the other three bank categories. To summarize, we findthat joint-stock banks are the most efficient bank category in China over the sample period, although wedo not observe efficiency gain for this category; Top Five and domestic local banks became more efficientin generating profits, but did not gain efficiency in transforming inputs into loan. In general, foreign-fundedbanks are becoming more efficient in generating earning assets, but not for generating profits. This maybe due to the high start-up cost for foreign banks that just enter the newmarket, such asmarketing cost, costsof establishing business relationships, branch network, training employees and others.
4. Determinants of technical efficiency
Our analysis of the estimated efficiency score shows a generally upward trend of bank efficiencywith some fluctuations and variations in efficiency among different banks. In this section, we examine thedeterminants of bank efficiency by regressing the technical efficiency scores on various bank characteristicsthat are believed to affect bank efficiency.
12 According to the predetermined schedule, China is committed to opening up its banking industry completely to foreigncompetition in 2006, when foreign banks were allowed to conduct both foreign currency and local currency (RMB) business. Manyforeign banks entered Chinese market after the restrictions were lifted up in 2006.

164 H. Yin et al. / Global Finance Journal 24 (2013) 153–170
First, we examine the effect of bank ownership. It has been widely documented in the literature thatownership is an important determinant of firm performance. However, there is also controversial evidenceon the relationship between ownership and performance. Some studies have compared the performanceof public and private companies in transition economies but failed to find conclusive evidence that privately-owned firms outperform firms with public ownership (Estrin & Rosevear, 1999; Konings, 1997). Similarly, inthe banking literature, the relationship between bank performance and ownership is not clear. With banklevel data that covers approximately 50,000 observations for 119 countries over the 1995–2002 period,Miccoet al. (2007) find that state-owned banks are less cost-efficient than private banks in developing countries.However, with country-level data, Detragiache, Tressel, andGupta (2006)find that developing countrieswitha large presence of state-owned banks have more cost-efficient banking systems.
In bank efficiency studies, it is observed that private banks have a higher mean efficiency score thanpublic banks, which supports the arguments for rapid privatization (Taci & Zampieri, 1998; Yao et al., 2007).Berger et al. (2009) alsofind that Big Four banks in China are the least efficient and foreign banks are themostefficient over 1994–2003; and minority foreign ownership significantly improves bank efficiency in China.With amore updated and comprehensive dataset for banks in China,we re-examine the relationship betweenbank ownership and technical efficiency.
Second, banks' risk preferencemight explain the discrepancies in efficiency. Banks do not channel fundsonly from depositors to creditors. A supplement of deposits that are used by banks to finance its loans isfinancial capital. As argued by Mester (1996), a risk-averse bank might choose to fund its loans with a higherratio of capital to deposits while a risk-seeking bankmight usemore borrowedmoney (deposits) to finance itsloans. Since the cost of capital ismore expensive than deposits, a risk-averse bank that uses a higher proportionof capital tends to have a lower estimated efficiency. It can also be justified that risk-averse banks tends tobe more cautious in loan making and spend more resources on credit analysis and other risk managementactivities, which may result in lower efficiency as well.
Third, we test the effect of bank size. Larger banks are believed to have economies of scale and be moreefficient in using inputs than smaller banks. They also could be less efficient than smaller banks if they aretoo large. With stochastic frontier approach and 56 Polish banks, Opiela (2000) observes that there are fewer100% efficient banks among small banks than among large banks, suggesting the existence of economy of scalein the Polish banking sector. We investigate whether economies of scale exist in the banking sector of China.
Fourth, we test the effect of business activities on bank efficiency. With the development of financialsector, banks are involved in more business activities than the traditional deposit-taking-and-loan-makingbusiness. With a more diversified business structure, there might be economies of scope in bank efficiency.We use the share of other earning assets than loan in total earning assets to measure level of businessdiversification of Chinese banks. Higher share of other earning assets in total earning assets indicates morereliance on fee generating business and less reliance on traditional loan-making business and more businessdiversification.
Lastly, we investigate how management is associated with bank efficiency. Banks with more effectivemanagement tends to be more efficient in transforming bank inputs into profits or loans. Bank overheadexpense as a percentage of total assets is used to approximate management effectiveness.
The general form of the regression equation is
TEit ¼ δ0 þXn
j¼1
δ j � bank characteristicsþ eit ð5Þ
TEit represents technical efficiency score for bank i at time t, δ0 is the constant term and δj (j = 1, 2…n)
whereare the coefficient estimates for bank characteristics discussed and eit is the error term. We do not include timefixed effects in the model to avoid time adjustment twice given that the efficiency scores are already adjustedfor sample years.Table 5 presents the summary statistics of the bank characteristics discussed above and Table 6 reportsthe regression results of bank efficiency on bank characteristics. Panels A and B of Table 6 are the resultswith the profit and loan models, respectively.
In Table 6, Foreign-funded banks, joint-stock banks and domestic local banks are binary dummies forforeign-funded banks, joint-stock banks and regional domestic banks, respectively, with Top Five being

Table 6The effect of bank characteristics on bank efficiency (level).Data are obtained from Bankscope.
(1) (2) (3) (4)
Panel A. Profit model Panel B. Loan model
Joint-stock banks 0.068⁎⁎ 0.131⁎⁎⁎ 0.066⁎⁎⁎ 0.086⁎⁎⁎
(0.027) (0.039) (0.013) (0.011)Domestic local banks 0.058⁎⁎ 0.181⁎⁎⁎ 0.039⁎⁎⁎ 0.100⁎⁎⁎
(0.023) (0.045) (0.010) (0.013)Foreign-funded banks −0.031 0.148⁎⁎⁎ 0.013 0.158⁎⁎⁎
(0.025) (0.051) (0.012) (0.014)Capital ratio −0.046⁎⁎⁎ −0.068⁎⁎⁎
(0.013) (0.004)Asset −0.091⁎⁎⁎ −0.016⁎⁎
(0.026) (0.007)Asset squared 0.006⁎⁎⁎ 0.001⁎⁎⁎
(0.001) (0.000)Fee-based asset share −0.062 −0.360⁎⁎⁎
(0.043) (0.012)Overhead −0.064⁎⁎⁎ −0.012⁎⁎⁎
(0.012) (0.003)Constant 0.558⁎⁎⁎ 0.984⁎⁎⁎ 0.744⁎⁎⁎ 1.006⁎⁎⁎
(0.022) (0.113) (0.010) (0.032)N 824 804 855 820R-sq 0.048 0.114 0.051 0.650
Note: This table shows the regression results of the effect of bank characteristics on bank efficiency. Dependent variable is thetechnical efficiency score estimated with profit model (panel A) or loan model (panel B). Panel A reports the results when bankefficiency is estimated with profit model and panel B presents the results with loan model. Foreign-funded banks, joint-stock banksand domestic local banks are binary dummies for foreign-funded banks, joint-stock banks and regional domestic banks, respectively,with Top Five — banks with majority state ownership being the omitted category. Capital ratio is the logarithm of the ratio of equity/assets in percentage used to measure risk preference; asset is the logarithm of total bank assets in million US dollars that measuresbank size; fee-based asset share refers to the share of other earning assets in total earning assets and is used to approximate the level ofbusiness diversification. Overhead stands for overhead expenses as a percentage of total assets and is used as a proxy for managementeffectiveness. Standard errors are in parentheses.⁎ Denotes significance at 10%.
⁎⁎ Denotes significance at 5%.⁎⁎⁎ Denotes significance at 1%.
165H. Yin et al. / Global Finance Journal 24 (2013) 153–170
the omitted category. Columns (1) and (3) of Table 6 show that the magnitude and signs of the coefficientsfor the bank category dummies are consistent with what we find in Table 4 and Fig. 2. The positivecoefficients indicate that joint-stock banks and domestic local banks are significantly more efficient thanTop Five; although we observe that foreign funded banks are less efficient with the profit model, butare more efficient with the loan model than Top Five in Table 4 and Fig. 2, the efficiency difference isnot statistically significant according to columns (1) and (3) of Table 6. When we control for other bankspecific variables, columns (2) and (4) indicate that all the other three bank categories are significantlymore efficient than the banks with substantial state ownership — Top Five, which is consistent with whatYao et al. (2007) find with a sample of 22 banks in China that covers the period 1996–2001. This resultsuggests that ownership structure is an important variable in explaining the variations of bank efficiency.
We follow the literature and use capital ratio to approximate risk preference with high capital ratiorepresenting that a bank is more risk averse. Variable Capital ratio is the logarithm of the ratio of equity/assets in percentage. As reported in Table 6, no matter the model used, banks that are well capitalized andare more reluctant to take risk are less efficient in generating profit and/or lending assets than those thatare more risk-taking.
We use bank asset to measure bank size. Variable asset is the logarithm of total bank assets in millionU.S. dollars, and asset squared is the square of variable asset. The negative coefficients for bank size variableasset in columns (2) and (4) show that larger banks are less efficient than smaller banks. However, the

166 H. Yin et al. / Global Finance Journal 24 (2013) 153–170
positive coefficients for the quadratic term of bank size indicate non-linear relationship between bankefficiency and size. When bank size becomes large enough, the efficiency will improve and banks realizeeconomies of scale. For robustness check purpose, we exclude the quadratic term from the regression anddo observe positive relationship betweenbank size and efficiencywith the loanmodel, although the relationshipis not significant with the profit model.
Fee-based asset share refers to the share of other earning assets in total earning assets and is used toapproximate the level of business diversification. Bankswith higher fee-based asset share rely less on traditionalloan-making business and are more diversified. The negative coefficients with the loan model imply that morediversified banks are less efficient in generating loans, which is against the argument of economies of scope.With the profit model, the sign of the coefficient is also negative, but not statistically significant.
We use overhead to proxy for bank management effectiveness. Variable overhead is defined as a bank'soverhead expense as a percentage of total assets. The negative coefficients for overhead variables showstrong evidence that better management increases bank efficiency.
5. Robustness check
To make sure that the reported results are robust, we conduct a few robustness check. First, we followBerger et al. (2009) and use the efficiency rank based on an ordering of the banks' efficiency levels in
Table 7The effect of bank characteristics on bank efficiency (rank).Data are obtained from Bankscope.
(1) (2) (3) (4)
Panel A. Profit model Panel B. Loan model
Joint-stock banks 0.118⁎⁎ 0.234⁎⁎⁎ 0.344⁎⁎⁎ 0.409⁎⁎⁎
(0.049) (0.070) (0.048) (0.050)Domestic local banks 0.119⁎⁎⁎ 0.325⁎⁎⁎ 0.167⁎⁎⁎ 0.332⁎⁎⁎
(0.040) (0.082) (0.040) (0.057)Foreign-funded banks −0.026 0.282⁎⁎⁎ 0.161⁎⁎⁎ 0.634⁎⁎⁎
(0.045) (0.092) (0.044) (0.064)Capital ratio −0.094⁎⁎⁎ −0.270⁎⁎⁎
(0.023) (0.016)Asset −0.182⁎⁎⁎ −0.148⁎⁎⁎
(0.047) (0.033)Asset squared 0.010⁎⁎⁎ 0.008⁎⁎⁎
(0.003) (0.002)Fee-based asset share −0.190⁎⁎ −1.208⁎⁎⁎
(0.077) (0.053)Overhead −0.084⁎⁎⁎ −0.062⁎⁎⁎
(0.022) (0.014)Constant 0.416⁎⁎⁎ 1.319⁎⁎⁎ 0.326⁎⁎⁎ 1.856⁎⁎⁎
(0.038) (0.205) (0.038) (0.141)N 824 804 855 820R-sq 0.042 0.092 0.062 0.544
Note: This table shows the regression results of the effect of bank characteristics on bank efficiency. Dependent variable is thetechnical efficiency rank estimated with profit model (panel A) or loan model (panel B). Panel A reports the results when bankefficiency is estimated with profit model and panel B presents the results with loan model. Foreign-funded banks, joint-stock banksand domestic local banks are binary dummies for foreign-funded banks, joint-stock banks and regional domestic banks, respectively,with Top Five — banks with majority state ownership being the omitted category. Capital ratio is the logarithm of the ratio of equity/assets in percentage used to measure risk preference; asset is the logarithm of total bank assets in million US dollars that measuresbank size; fee-based asset share refers to the share of other earning assets in total earning assets and is used to approximate the levelof business diversification. Overhead stands for overhead expenses as a percentage of total assets and is used as a proxy formanagement effectiveness. Standard errors are in parentheses.⁎ Denotes significance at 10%.
⁎⁎ Denotes significance at 5%.⁎⁎⁎ Denotes significance at 1%.

167H. Yin et al. / Global Finance Journal 24 (2013) 153–170
each year. With the formula (orderit − 1) / (nt − 1), where orderit is the place in ascending order of theith bank in the tth year in terms of its efficiency level and nt is the number of banks in year t, the ranks areconverted to a uniform scale over [0, 1]. Thus, the bank i's efficiency rank in year t gives the proportion ofthe other sample banks in tth year with a lower efficiency level, i.e., a bank with a rank of 0.60 in year timplies that 60% of other banks in China have an efficiency level lower than the bank. The bank withthe highest efficiency score in year t has a rank value 1, and the bank with the lowest efficiency score hasa rank value 0. Although efficiency levels are more accurate than ranks because the levels account forthe measured distance from the best-practice frontier, efficiency ranks have the benefit of being morecomparable across years. The ranks follow the same uniform [0, 1] distribution while the distributions ofefficiency levels may vary with the economic environment over time. The two efficiency measures havepros and cons and neither is superior to the other.
We replicate the regressions in Table 6 with bank efficiency rank as defined above, and report theresults in Table 7. The results with bank efficiency rank are consistent with the findings with efficiencylevel discussed in Table 6. With the profit model, column (1) shows that Top Five is less efficient than boththe joint-stock banks and domestic local banks, but the efficiency difference with foreign-funded banks arenot statistically significant, while with the loan model, column (3) indicates that Top Five is less efficientthan all the other categories in the bank sector of China. When bank specific variables are controlled incolumns (2) and (4), the findings in Table 7 are the same as that in Table 6 in terms of the signs andsignificance of all the coefficients. We conclude that Top Five banks are the least efficient compared withother bank categories; risk-averse banks with more capital are less efficient than risk-taking banks that areless capitalized; there exists a non-linear relationship between bank efficiency and size — bank efficiencydeteriorates with bank size at the lower end, but banks gain efficiency when the size grows big enoughand realize economy of scale; banks that rely more on fee-generating business are less efficient, which isagainst the arguments for economies of scope; and better management contributes to higher bankefficiency.
Second, as is argued byWeill (2003), since the technical efficiency score falls into the interval between 0and 1, making the dependent variable a limited dependent variable, a Tobit rather than an OLS regressionmodel may bemore appropriate. As a robustness check, we replicate Tables 6 and 7with the Tobit model andobserve the same results as reported with the OLS regression model.
Third, we use loan as one of the measurements of bank output in the stochastic frontier analysis,but we do not distinguish between normal loan and non-performing loan. Given the large amountof non-performing loan in Chinese banks' balance sheet, it is worthwhile to check if excludingnon-performing loan and only considering normal loan in the analysis will make a difference. We findsupportive evidence of bank inefficiency in China's banking sector. The average efficiency score is about0.748, suggesting that on average, banks generate about 74.8% of the normal loans that the best-practicebank in the sample would make under the same conditions. As is expected, this efficiency score is lowerthan that estimated with total loan (i.e., 0.778). We also test the effect of bank characteristics on bankefficiency with the efficiency score estimated with good quality loan, and find similar results as reportedin Table 6.
6. Summary and conclusions
This paper documents the technical efficiency of Chinese banks over 1999–2010, a period duringwhich China's banking sector experienced substantial structural reform. With the stochastic frontieranalysis technique and intermediation approach, we estimate the technical efficiency score of 171Chinese banks for each year of the sample period with two alternative models. The profit modelassumes that a bank is a firm whose objective is to maximize its profit and use pre-tax profit as ameasure of bank output. The loan model emphasizes the intermediation function of banks and usesloan as bank output. With the profit model, the average bank technical efficiency score is 0.597 overthe sample period, implying that on average, the observed bank profit is 59.7% of that on thebest-practice frontier. Similarly, the estimated technical efficiency of 0.778 with the loan modelsuggests that on average, banks generate 77.8% of the loan that the best-practice bank in the samplewould make under the same conditions. Given the large amount of non-performing loan in the bankingsector of China, we are cautious about making the conclusion that Chinese banks are more efficient in

168 H. Yin et al. / Global Finance Journal 24 (2013) 153–170
generating lending assets than profits based on the higher efficiency score with the loan model.For robustness purpose, we exclude non-performing loan from our analysis and use normal loan onlyin the loan model. The efficiency score of 0.748 is still much higher than that from the profit model (i.e.,0.597). Therefore, we are safe to say that Chinese banks are more efficient in transforming inputs intolending assets than profits.
China gained access to WTO in 2001 and was obligated to open its banking sector to foreigncompetition according to a predetermined schedule. In preparation for the expected competition,China has carried out substantial structural reform since the end of last century. We find that China'sbanking sector in general has gained efficiency during the sample period, especially for the post-WTOperiod. We further classify the sample into four categories: the largest five banks with significant stateownership — Top Five, joint-stock banks, domestic local banks and foreign-funded banks, and findthat the joint-stock banks are the most efficient, followed by domestic local banks. Top Five is slightlymore efficient than foreign-funded banks with the profit model, but less efficient with the loan modelin the categorical analysis. However, the efficiency difference between Top Five and foreign banks arenot statistically significant. We further look into the efficiency trend for each bank category andobserve different pictures. With the profit model, we see an obvious upward efficiency trend over theperiod for Top Five and domestic local banks, but that is not the case for joint-stock banks andforeign-funded banks, which do not show efficiency gain during the period. Consequently, eventhough on average, joint stock banks are the most efficient category, the efficiency differencesbetween bank categories become narrower over time. It is encouraging to see that Top Five, which arewell known for their low efficiency, have almost the same efficiency score with the most efficientjoint-stock banks in 2010 (0.655 vs. 0.656). With the loan model, foreign-funded banks are the onlycategory that shows obvious efficiency gain during the period. In sum, the efficiency gain intransforming inputs into profits over the period mainly comes from the efficiency improvement of TopFive and domestic local banks; the efficiency gain in generating lending assets are attributable to theefficiency gain of foreign-funded banks.
We then investigate what bank characteristics are associated with bank efficiency. We findthat banks with majority state ownership are less efficient than other commercial banks, whichis consistent with the existing evidence in the literature. We use capital ratio to measure riskpreference and find that banks with higher capital ratio are less efficient, suggesting that banks thatare reluctant to take risk are less efficient than those risk-seeking banks. We see size effect in thisstudy and find that there exists a non-linear relationship between bank efficiency and size. Bankefficiency declines with bank size at the lower end. But when bank size grows large enough, banksbecome more efficient and realize economies of scale. We find that banks that rely heavily on fee-generating businesses (e.g., investment, insurance, etc.) are less efficient than banks that focus ontraditional loan-making business, and fail to find evidence of economies of scope. Finally, we find thatbanks with better management are more efficient.
This paper contributes to the literature in several important aspects. First, it provides evidenceon bank efficiency in China before and after China's accession to the WTO. It covers a critical periodduring which Chinese banks were facing an unprecedented competition pressure from foreignbanks. Second, this study employs a comprehensive dataset that covers different categories ofbanks in China, including 38 foreign banks. The previous studies do not have much coverageon foreign banks in China. The most recent coverage of this study, especially the period after2006 when the Chinese markets were completely open to foreign banks, allows us to includeforeign banks in our analysis. Such a broad coverage provides more credible assessment of bankperformance in China. Third, related to the first, our study allows an assessment of the effect ofChina's accession to the WTO on China's bank efficiency. China's entry to the WTO obligates Chinato liberalize its banking system and open its door to foreign banks. Whether domestic banks areable to survive the competition depends on whether domestic banks can improve their efficiency.Twelve years of coverage of our study allows us to see the trend of bank efficiency in China andcompare bank efficiency of different banks. Fourth, we provide a cross-sectional analysis ofdeterminants of bank efficiency and identify a set of specific bank characteristics that contribute tobank efficiency. The results of this study will benefit policy makers, bank regulators, managers andinvestors.
169H. Yin et al. / Global Finance Journal 24 (2013) 153–170
Appendix A. Market structure of China's banking system (2003–2010)
Institutions/year 2003 2004 2005 2006 2007 2008 2009 2010
Total assets(RMB100 million)
Total bankinginstitutions
276,584 315,990 374,697 439,500 531,160 631,515 795,146 953,053
Top five commercialbanks
160,512 179,817 210,050 242,364 285,000 325,751 407,998 468,943
Joint-stockcommercial banks
29,599 36,476 44,655 54,446 72,742 88,337 118,181 149,037
City commercialbanks
14,622 17,056 20,367 25,938 33,405 41,320 56,800 78,526
Foreign banks 4160 5823 7155 9279 12,525 13,448 13,492 17,423Market share (%)
Top five commercialbanks
58.03 56.91 56.06 55.15 53.66 51.58 51.31 49.20
Joint-stockcommercial banks
10.7 11.54 11.92 12.39 13.69 13.99 14.86 15.64
City commercialbanks
5.29 5.4 5.44 5.90 6.29 6.54 7.14 8.24
Foreign banks 1.50 1.84 1.91 2.11 2.36 2.13 1.70 1.83
Note: This table shows the evolution of major bank categories in China over the period of 2003–2010. Totalassets data are in 100 million Chinese yuan. Data are compiled from the annual reports of China BankingRegulatory Commission (CBRC), available at http://zhuanti.cbrc.gov.cn/subject/subject/nianbao2010/english/fl.pdf, accessed May 3, 2012.13
References
Aigner, D. J., Lovell, C. A. K., & Schmidt, P. (1977). Formulation and estimation of stochastic frontier production functions.Journal of Econometrics, 6, 21–37.
Ataullah, A., Cockerill, T., & Le, H. (2004). Financial liberalization and bank efficiency: A comparative analysis of India and Pakistan.Applied Economics, 36-17, 1915–1924.
Barth, J. R., Zhou, Z., Arner, D., Hsu, B. F. C., &Wang, W. (2007). Financial restructuring and reform in post-WTO China. The Netherlands:Kluwer Law International BV.
Benston, G. J. (2004). What is special about banks? The Financial Review, 39, 13–33.Berger, A. N., Hasan, I., & Zhou, M. (2009). Bank ownership and efficiency in China: What will happen in the world's largest nation?
Journal of Banking & Finance, 33, 113–130.Berger, A. N., & Humphrey, D. B. (1997). Efficiency of financial institutions: International survey and directions for future research.
European Journal of Operational Research, 98, 175–212.CBRC (2010). CBRC annual report. http://www.cbrc.gov.cn/showannual.do (accessed on 3/14/2013).Claessens, S., & Laeven, L. (2004). What drives bank competition? Some international evidence. Journal of Money, Credit, and Banking,
36, 563–583.Detragiache, E., Tressel, T., & Gupta, P. (2006). Foreign banks in poor countries: Theory and evidence. IMF working paper WP/06/18.Estrin, S., & Rosevear, A. (1999). Enterprise performance and ownership: The case of Ukraine. European Economic Review, 43, 1125–1136.Gilbert, R. A., &Wilson, P. W. (1998). Effects of deregulation on the productivity of Korea banks. Journal of Economics and Business, 46, 39–64.Hao, J., Hunter,W. C., & Yang,W. K. (2001). Deregulation and efficiency: The case of private Korea banks. Journal of Economics and Business, 53,
237–254.Hope, Nicholas C., Laurenceson, J., & Qin, F. (2008). The impact of direct investment by foreign banks on China's banking industry.
Stanford Center for International Development working paper, No. 362, .Isik, I., & Hassan, M. K. (2003). Financial deregulation and total factor productivity change: An empirical study of Turkish commercial
banks. Journal of Banking and Finance, 27, 1455–1485.Konings, J. (1997). Firm growth and ownership in transition countries. Economics Letters, 55, 413–418.Leigh, L., & Podpiera, R. (2006). The rise of foreign investment in China's banks — Taking stock. IMF working paper, wp/06/292.Martin, M. F. (2012). China's banking system: Issues for congress. CRS report for Congress, R42380, .Meeusen, W., & van den Broeck, J. (1977). Efficiency estimation from Cobb–Douglas production functions with composed error.
International Economic Review, 18, 435–444.Mester, L. (1996). A study of bank efficiency taking into account risk-preferences. Journal of Banking and Finance, 20, 1025–1045.
13 The foreign banks in this table include both locally incorporated foreign banks and foreign bank branches. As this table onlyreports selected categories of China's banking industry, the market shares do not add up to 100%.

170 H. Yin et al. / Global Finance Journal 24 (2013) 153–170
Micco, A., Panizza, U., & Yanez, M. (2007). Bank ownership and performance: Does politics matter? Journal of Banking and Finance, 31,219–241.
Opiela, T. (2000). Assessing the evaluation of Polish commercial banks. Paper, No. 18, Warsaw: National Bank of Poland.Sturm, J., & Williams, B. (2004). Foreign bank entry, deregulation and bank efficiency: Lessons from the Australian experience.
Journal of Banking and Finance, 28, 1775–1799.Taci, A., & Zampieri, E. (1998). Efficiency in the Czech banking sector. CERGE_EI discussion paper, No. 4/98, Prague: Charles University.Weill, L. (2003). Banking efficiency in transition economies. The Economics of Transition, 11, 569–592.Yao, S., Jiang, C., Feng, G., & Willenboackel, D. (2007). WTO challenges and efficiency of Chinese banks. Applied Economics, 39, 629–643.Yildirim, C. (2002). Evolution of banking efficiency within an unstable macroeconomic environment: The case of Turkish commercial
banks. Applied Economics, 34, 2289–2301.