Embed Size (px)
Citation preview

XVI Annual Conference Proceedings January, 2015
ISBN no. 978-81-923211-7-2 http://www.internationalconference.in/XVI_AIC/INDEX.HTM Page 898
AN EMPIRICAL STUDY ON ASSESSING QUALITY OF HEALTH - CARE
SERVICES OFFERED BY PRIVATE HOSPITALS USING SERVQUAL
MODEL
Dr. Manish Madan Mr. Nitin Goel
Associate Professor Assistant Professor
Rukmini Devi Institute of Advanced Studies Rukmini Devi Institute of Advanced Studies
Abstract
Purpose:There has been a slow but sure shift in the way health care delivery is being perceived,
by both providers and patients. Patients aredemanding better quality of health care delivery both
for the in-patient services, outpatient services or evenpreventive care.Health care is a rapidly
growing sector which has gained much attention from researchers andpractitioners worldwide.
Due to tremendously increasing cost, many hospitals attempt to adopt qualityinitiatives such as
lean and/or Six Sigma to improve their service operations. Implementing such
processimprovement efficiently and effectively would ultimately help in delivering the highest
value to customers.Many studies add that in addition to its positive implications on patient
retention and loyalty, patient satisfaction influences the rate of patient compliance with physician
advice and the healing process of patients
Design/Methodology/Approach:Descriptive research has been applied, describes data and
characteristics about the population or phenomenon being studied. The researchers have used
primary data through self-constructed structured Questionnaire and as far as the secondary data
is concerned that was obtained from web sites, journals etc.Structured questionnaire was
constructed to interview the patients admitted in different private hospitals on 23 different
parameters on Likert‘s five point scale, which was later reduced to five factors by using the
statistical technique of factor analysis.
Findings:It is found that various statements like Physical Facilities are visually appealing,
Appearance of doctors and staff of hospital are neat and professional, Obtain feedback and keep
the patients informed and Staff and doctors of hospital understand the specific needs of the
patients were found to be significant.

XVI Annual Conference Proceedings January, 2015
ISBN no. 978-81-923211-7-2 http://www.internationalconference.in/XVI_AIC/INDEX.HTM Page 899
Research Limitations/Implications:The study focuses on general problems faced by patients in
the private hospitals. There might be certain more variables as one patient is satisfied on
particular aspect but another may not on that particular aspect.
Key Words:Patients Satisfaction, Satisfaction of Patients in Private Hospitals, Condition of
Private Hospitals.
INTRODUCTION
Like any country that opens its economy, India has in the last 15years seen much change in
theway business and industries as a whole deal with consumer demand and expectation with
regard to qualityof service and goods being sold - this is especially evident in the health care
sector. There has been a slow but sure shift in the way health care delivery is being perceived, by
both providers and patients. Patients aredemanding better quality of health care delivery both for
the in-patient services, outpatient services or evenpreventive care.Health care is a rapidly
growing sector which has gained much attention from researchers andpractitioners worldwide.
Due to tremendously increasing cost, many hospitals attempt to adopt qualityinitiatives such as
lean and/or Six Sigma to improve their service operations. Implementing such
processimprovement efficiently and effectively would ultimately help in delivering the highest
value to customers.Many studies add that in addition to its positive implications on patient
retention and loyalty, patient satisfaction influences the rate of patient compliance with physician
advice and the healing process of patients (Calnan, 1988).Evidence in both the manufacturing
and services industries indicatesthat quality is a key determinant of market share and return on
investmentas well as cost reduction (Parasuraman,Zeithaml, and Berry 1985). Two forms of
quality arerelevant to service-providing organizations: technical quality and functionalquality
(Gronroos 1984).
Research suggests that service organizations share various commonalitiesin the service delivery
process both within and across industries(Zeithaml, Berry, and Parasuraman 1988). For
example, theintangible nature of services dictates that, unlike products, most servicesare
produced and consumed at the same time. This characteristicincreases the importance of the
provider-consumer relationship as wellas the potential for variation in service quality.Therefore,
the purpose of this article is to report the results of astudy that examined the usefulness of the

XVI Annual Conference Proceedings January, 2015
ISBN no. 978-81-923211-7-2 http://www.internationalconference.in/XVI_AIC/INDEX.HTM Page 900
SERVQUAL scale for assessingpatients' perceptions of service quality in the hospital
environment.At the practical level, the representativeness of the SERVQUAL itemsas they relate
to hospital services was assessed. In addition to contentappropriateness, the length of the scale
was a major consideration forthe population under study, in this case former patients of a
hospital.The scale was subjected to extensive reliability and validity assessment.
The difference between private and public sector organization is well documented inthe
literature. These differences are largely environmental– the situation in which these
organizations operate. The private sector is consideredmore efficient compared to public sector
owing to different incentives, market orientationand a decentralized business model. These
fundamental differencesprovide strategic advantages leading to private sector growth and
profitability.Nevertheless, these advantages are costly.Several tools have been developed to
measurepatients‘ perceptions and expectations, but SERVQUALinstrument developed by
Parasuraman et al. (1988) is themost widely used tool. While the findingsof some studies
confirm the five generic qualitydimensions of SERVQUAL (Babakus and Mangold, 1992),
others either identified less number ofdimensions or used a modified version of theinstrument
and identified additional dimensions(Reidenback and Sondifer-Smallwood, 1990). Haywood-
Farmer and Stuart (1988) concluded that SERVQUALwas inappropriate for measuring
professional servicequality since it excluded the dimensions for ―careservice‖, ―service
customization‖ and ―knowledge of theprofessional‖.
SERVQUAL
According to Parasuraman, Zeithaml and Berry (1985,1988,1991,1994),regardless of the type
of service, consumers basically use the same criteria toassess quality. Service quality is a general
opinion the client forms regarding itsdelivery, which is constituted by a series of successful or
unsuccessfulexperiences. Managing gaps in service will help the company improve its
quality.But gaps are not the only means clients use to judge a service.
These dimensions arebriefly commented below:
(1) Reliability:is the company reliable in providing the service? Does itprovide as promised?
Reliability reflects a company‘s consistency andcertainty in terms of performance. Reliability is
the most importantdimension for the consumer of services;

XVI Annual Conference Proceedings January, 2015
ISBN no. 978-81-923211-7-2 http://www.internationalconference.in/XVI_AIC/INDEX.HTM Page 901
(2) Tangibility:how are the service provider‘s physical installations,equipment, people and
communication material? Since there is nophysical element to be assessed in services, clients
often trust thetangible evidence that surrounds it when making their assessment;
(3)Responsibility:are company employees helpful and capable of providingfast service? It is
responsible for measuring company and employeereceptiveness towards clients;
(4) Assurance:are employees well-informed, educated, competent andtrustworthy? This
dimension encompasses the company‘s competence,courtesy and precision; and
(5)Empathy:this is the capacity a person has to experience another‘sfeelings. Does the service
company provide careful and personalizedattention?
These elements clearly have a highly subjective factor linked to theperson who perceives the
service. The SERVQUAL scale (questionnaire) has two sections: one to mapclient expectations
in relation to a service segment and the other to mapperception in relation to a certain service
company. Theoriginal SERVQUAL scale uses 22 questions to measure the five dimensions
ofservice quality: Reliability, Tangibility, Security, Empathy and Responsibility.Quality is
measured as performance minus expectations for each pair ofquestions and the summary score
across all questions was the measure of quality.Parasuraman et al. (1988) also tested their
SERVQUAL scale for reliability andvalidity. The major test of reliability is coefficient alpha of
Cronbach´s Alpha.The coefficient α is best conceptualized with the average of all possiblesplit
half reliabilities for a set of items. Split half reliability is the reliabilitybetween two parts of a test
or instrument where those two parts are halves of thetotal instrument. The coefficient α measures
the extent of internal consistencybetween or correlation among, the set of questions making up
each of the fivedimensions, such as the five reliability questions. The suggested cut-off point
forcoefficient alpha values is 0.70 indicating that the scale exhibits desirable levelsof internal
consistency. High reliabilities, such as 0.90 or above, are favorable.Since the industries under
investigation represented a cross section of industries, which vary long key dimensions used to
classify services (Lovelock, 1981, 1983), many researchers concluded that the findings are also
likely to be of relevance to medical services.
The gaps can be subdivided into gaps on the marketer and consumer sides:
Gap 1:is the difference between consumer expectations and management perceptions of
consumer expectations.

XVI Annual Conference Proceedings January, 2015
ISBN no. 978-81-923211-7-2 http://www.internationalconference.in/XVI_AIC/INDEX.HTM Page 902
Gap 2:is the difference between management perceptions of consumer expectations and service
quality specifications.
Gap 3:is the difference between service quality specifications and the service actually delivered.
Gap 4:is the difference between service delivery and what is communicated about the service to
consumers.
Gap 5:is on the consumer side, and it shows the difference between a consumer‗s actual and
perceived quality of service.
With regard to gap 5, service quality determinants used by consumers do not tend to vary
substantially across service industries and were classified into 10 key categories: reliability,
responsiveness, competence, access, courtesy, communication, credibility, security,
understanding/knowing the customer and tangibles then later summarized to five (Parasuraman
et al., 1985). Then the SERVQUAL, a 22item instrument for assessing customer perceptions of
service quality in service and retailing organizations was developed. The reliabilities and factor
structures indicate that the final 22item scale and its five dimensions have sound and
psychometric properties. There was also strong support for SERVQUAL validity (Parasuraman
et al., 1988).
CUSTOMER SATISFACTION STUDIES IN HEALTHCARE
Because of increasing competition and more demanding consumers, servicequality has become a
watchword for virtually all businesses and in the medical field in particular due to the high
importance of excellent service quality in a field where poor servicequality could ultimately lead
to morbidity. However, quality is difficult to measure for service providers in the medical
fieldHealthcare service quality have been regarded as a multidimensional construct.It has been
envisioned to be composed of two main parts: quality as perceived by theconsumer and quality
in fact. Although many researchers argue the point that the 'real' quality of a service cannot be
accurately portrayed in patient's perceptions, however patients will always continue to draw their
own conclusions about the quality of the service. In healthcare especially, perception for the
patient is the reality and it is the perceived quality as opposed to the actual or absolute quality
that is important for healthcare professionals to manage. This is the basis on which consumers
make purchase, repurchase and recommendation decisions (Paul, 2003).

XVI Annual Conference Proceedings January, 2015
ISBN no. 978-81-923211-7-2 http://www.internationalconference.in/XVI_AIC/INDEX.HTM Page 903
Donabedien (1992) states that the research concluded that health care is conceived as consisting
mainly of two parts, a technical task and an interpersonalexchange and envisaged an ideal
whereby practitioner and patient together engage in a search for the most appropriate solution
(thus jointly engaging in the production of care). Another research was not in favorof medical
services being driven by market forces and suggests that a costeffective practice should view
patients not as consumers in episodic relationships but as co-producers in continuing
relationships (Murfin et al., 1995).Cartwright (1986) found that men and women were
equallysatisfied with their doctors, younger people were more critical than older people as well
as the existence of an inverse relationship between social class and satisfaction.
REVIEW OF LITERATURE
SERVICE QUALITY IN HEALTHCARE INDUSTRY
Understanding service quality is indispensable for service providers aspiring to attractand retain
customers. Quality of goods, measured objectively byindicators such as durability, defects,
reliability, etc. is difficult to replicate in serviceenvironments (Parasuraman et al., 1988). In the
service industry, quality definitionstend to focus on meeting customer requirements and how
well service providers meettheir expectations, usually by an encounterbetween customer and
service contact person. Service quality is defined as ―a globaljudgment or attitude relating to the
overall excellence or superiority of the service‖(Parasuraman et al., 1988). One common way
is to conceptualize service qualityas a customer‘s overall service quality evaluation is by
applying a disconfirmationmodel – the gap between service expectations and performance
(Cronin and Taylor,1992;Parasuraman et al., 1991).
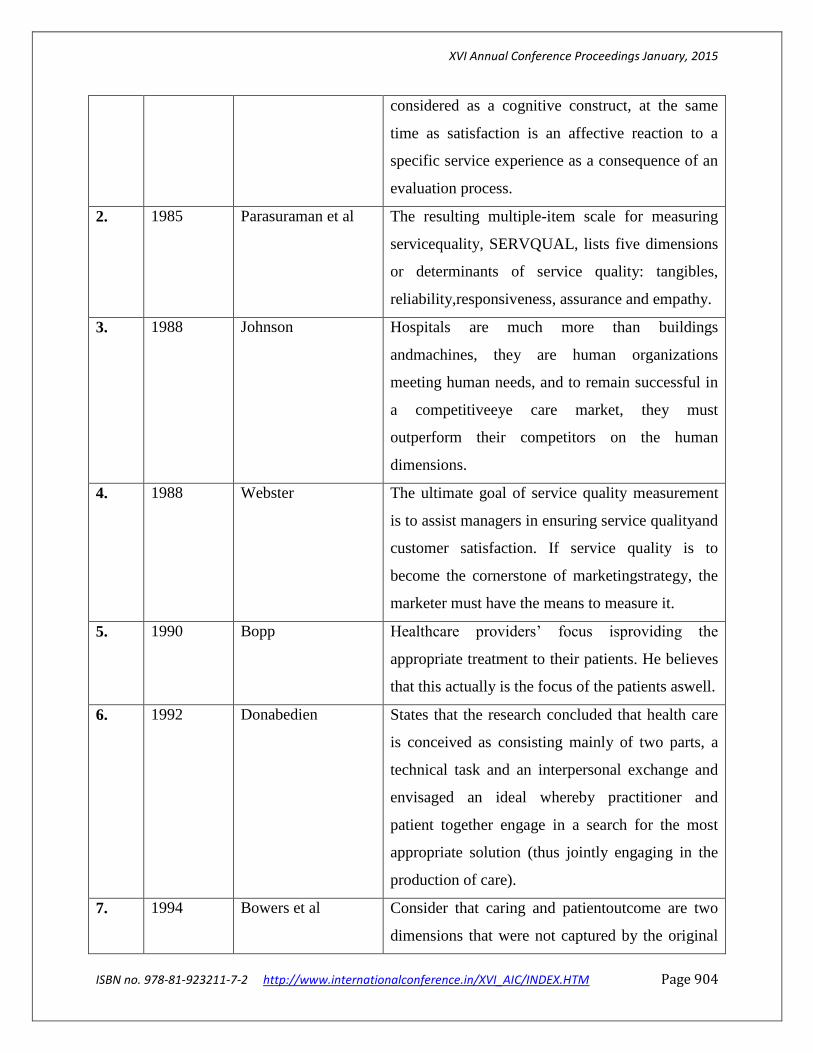
Table 1: Contribution of Researchers
S.NO. YEAR AUTHOR FINDINGS
1. 1981 Oliver He sees satisfaction as clients' emotional feelings
concerning a particular consumption experience.
By this Oliver means that satisfaction is a
consequence of a mental assessment and
evaluation of what clients experience and the
resulting outcome of the services provided. This
therefore implies that perceived service quality is
XVI Annual Conference Proceedings January, 2015
ISBN no. 978-81-923211-7-2 http://www.internationalconference.in/XVI_AIC/INDEX.HTM Page 904
considered as a cognitive construct, at the same
time as satisfaction is an affective reaction to a
specific service experience as a consequence of an
evaluation process.
2. 1985 Parasuraman et al The resulting multiple-item scale for measuring
servicequality, SERVQUAL, lists five dimensions
or determinants of service quality: tangibles,
reliability,responsiveness, assurance and empathy.
3. 1988 Johnson Hospitals are much more than buildings
andmachines, they are human organizations
meeting human needs, and to remain successful in
a competitiveeye care market, they must
outperform their competitors on the human
dimensions.
4. 1988 Webster The ultimate goal of service quality measurement
is to assist managers in ensuring service qualityand
customer satisfaction. If service quality is to
become the cornerstone of marketingstrategy, the
marketer must have the means to measure it.
5. 1990 Bopp Healthcare providers‘ focus isproviding the
appropriate treatment to their patients. He believes
that this actually is the focus of the patients aswell.
6. 1992 Donabedien States that the research concluded that health care
is conceived as consisting mainly of two parts, a
technical task and an interpersonal exchange and
envisaged an ideal whereby practitioner and
patient together engage in a search for the most
appropriate solution (thus jointly engaging in the
production of care).
7. 1994 Bowers et al Consider that caring and patientoutcome are two
dimensions that were not captured by the original

XVI Annual Conference Proceedings January, 2015
ISBN no. 978-81-923211-7-2 http://www.internationalconference.in/XVI_AIC/INDEX.HTM Page 905
SERVQUAL scale.They suggest that caring
involves human interaction during healthcare,
while patientoutcome reflects relief from pain and
suffering following treatment.
8. 1995 Tountas et al The main goals of the reform were the separation
of private and public sector, the empowerment of
public health sector, the development of primary
care, increases in public spending on health,
decentralization, reorganization of hospitals,
improvements in manpower policy, efficiency,
equity in terms of equal accessibility and social
control.
9. 1998 Sixam et al. Explained satisfaction as the state of pleasure or
contentment with an action, event or service and it
is determined considerably by the expectations of
customers and their experiences.
10. 1998 Jun et al Carried out focus group discussion and came out
with eleven dimensions as appropriate for
assessing service quality in healthcare settings.
The dimensions were named as "courtesy",
"tangibles", "reliability", "communication",
"competence", "reliability", "understanding
customer", "access" "patient outcomes"
"responsiveness", "caring", and "collaboration".
11. 1998 Hill and McCrory Measured service quality conceptualized as
(perceptions minus importance) at Belfast
maternity hospitals. They tested perceptions and
importance of clinical and non-clinical service
factors from both the patient‗s and the staff‗s sides.
They concluded that perceptions of previous
patients were significantly more positive than first-

XVI Annual Conference Proceedings January, 2015
ISBN no. 978-81-923211-7-2 http://www.internationalconference.in/XVI_AIC/INDEX.HTM Page 906
time patients. Hygiene/cleanliness ranked as one of
the top most important issues in the hospital while
patients were disinclined to be judgmental
aboutclinical staff since they often felt unqualified
to judge clinical expertise.
12. 1999 Kotler and
Armstrong
Patient satisfaction is considered the in the last
stage of the buyer decision process which is
constituted of need recognition, information
search, evaluation of alternatives, purchase
decision and the post-purchase behavior.
13. 2002 De Man et al Analyzed patients‗ and personnel‗s perception of
service quality in nuclear medicine organizations
and compared the perceptions of patients‗ and
personnel. They also examined the importance of
the different service quality dimensions by
studying their relationship to patient satisfaction.
Their results showed that the original five
dimensions of SERVQUAL were not confirmed.
Patients considered tangibles and assurance as one
dimension while empathy was divided into
empathy and convenience. Personnel perceived
service quality as less good than patients except for
empathy. Patient‗s perceptions of service quality
correlated strongly with satisfaction especially for
reliability and tangibles-assurance.
14. 2007 Karassavidou and
Glaveli
Despite efforts and reforms, healthcare
organizations operating in the public sector in
Grece are still experiencing low trust on the part
of the patients in terms of the quality of care
provided and of the degree of responsiveness to
patients' needs. People hoping to receive high
XVI Annual Conference Proceedings January, 2015
ISBN no. 978-81-923211-7-2 http://www.internationalconference.in/XVI_AIC/INDEX.HTM Page 907
service quality tend to prefer private hospitals or
even travel abroad. Thus, NHS Hospitals in Greece
are undergoing pressure to improve their quality
and compete effectively. Pressures both from the
government and the general public which in its
vast majority have low income and realise that
they have no alternative to turn to.
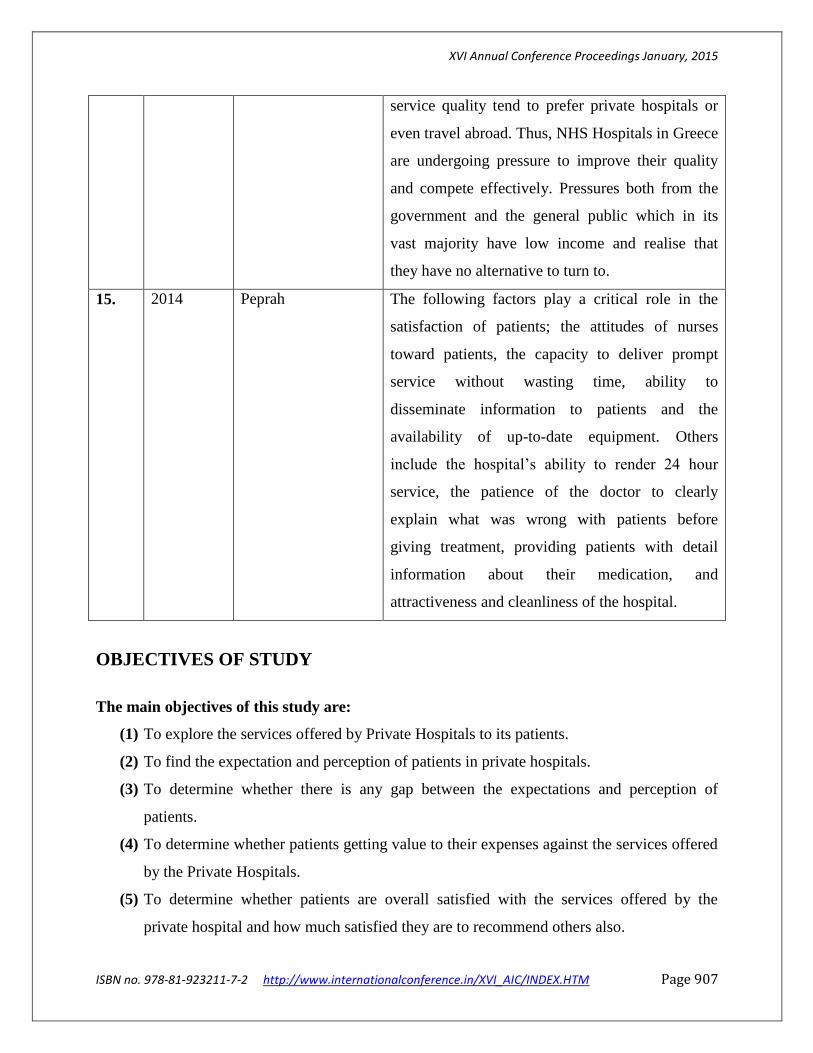
15. 2014 Peprah The following factors play a critical role in the
satisfaction of patients; the attitudes of nurses
toward patients, the capacity to deliver prompt
service without wasting time, ability to
disseminate information to patients and the
availability of up-to-date equipment. Others
include the hospital‘s ability to render 24 hour
service, the patience of the doctor to clearly
explain what was wrong with patients before
giving treatment, providing patients with detail
information about their medication, and
attractiveness and cleanliness of the hospital.
OBJECTIVES OF STUDY
The main objectives of this study are:
(1) To explore the services offered by Private Hospitals to its patients.
(2) To find the expectation and perception of patients in private hospitals.
(3) To determine whether there is any gap between the expectations and perception of
patients.
(4) To determine whether patients getting value to their expenses against the services offered
by the Private Hospitals.
(5) To determine whether patients are overall satisfied with the services offered by the
private hospital and how much satisfied they are to recommend others also.

XVI Annual Conference Proceedings January, 2015
ISBN no. 978-81-923211-7-2 http://www.internationalconference.in/XVI_AIC/INDEX.HTM Page 908
RESEARCH METHODOLOGY
The main concern of this research paper is to identify the factors affecting the quality of services
being offered by the private hospital to its patients in Delhi and NCR. In order to generate the
dimensions of quality a SERVQUAL model is used with certain modifications as per
requirements. For the collection of data a structured questionnaire is used and in order to analyze
the data SPSS version 17.0 is used.Total of 122 questionnaires were sent and out of 100 were
used for analysis as they were fully filled. Thus the response rate is found to be 81.96%. The
sampling technique used here is stratified random sampling. Five point likert‘s scale is used here
in the questionnaire. The questionnaire related to demographic profile was also added to make
the study more explorative and descriptive.
DATA ANALYSIS
The data collected through structured questionnaire is analyzed using SPSS 17.0 version. The
various statistical tools used in the analysis of data are SERVQUAL model, t – test and ANOVA.
Expectation and Perception of services in the healthcare industry provided by the private
hospitals are calculated on eight dimensions i.e. Tangibility, Reliability, Responsiveness,
Empathy, Assurance, Courtesy, Communication and Understanding the customer and 23 factors
on five point likert scale. The Reliability analysis is done for all the 23 factors on eight
dimensions and the value of cronbach‘s alpha is found to be 0.724, which is well above 0.6.
DEMOGRAPHIC PROFILE OF PATIENTS
Table 2: Demographic profile - Gender
GENDER PERCENTAGE
Male 72 72%
Female 28 28%
Table 3: Demographic profile – Educational Qualifications
EDUCATIONAL QUALIFICATION PERCENTAGE
Upto Schooling 23 23%
Graduate 59 59%

XVI Annual Conference Proceedings January, 2015
ISBN no. 978-81-923211-7-2 http://www.internationalconference.in/XVI_AIC/INDEX.HTM Page 909
Post Graduate and more 18 18%
Table 4: Demographic Profile – Age Group
AGE GROUP (IN YEARS) PERCENTAGE
Below 25 24 24%
25 to 50 48 48%
50 & Above 28 28%
Table 5: Demographic Profile – Income Group
INCOME GROUPS (P.A.) PERCENTAGE
Less than Rs. 3,00,000 20 20%
Rs. 3,00,000 to Rs. 5,00,000 38 38%
Rs. 5,00,000 & Above 42 42%
SERVQUAL MODEL FOR IDENTIFYING SERVICE QUALITY GAPS
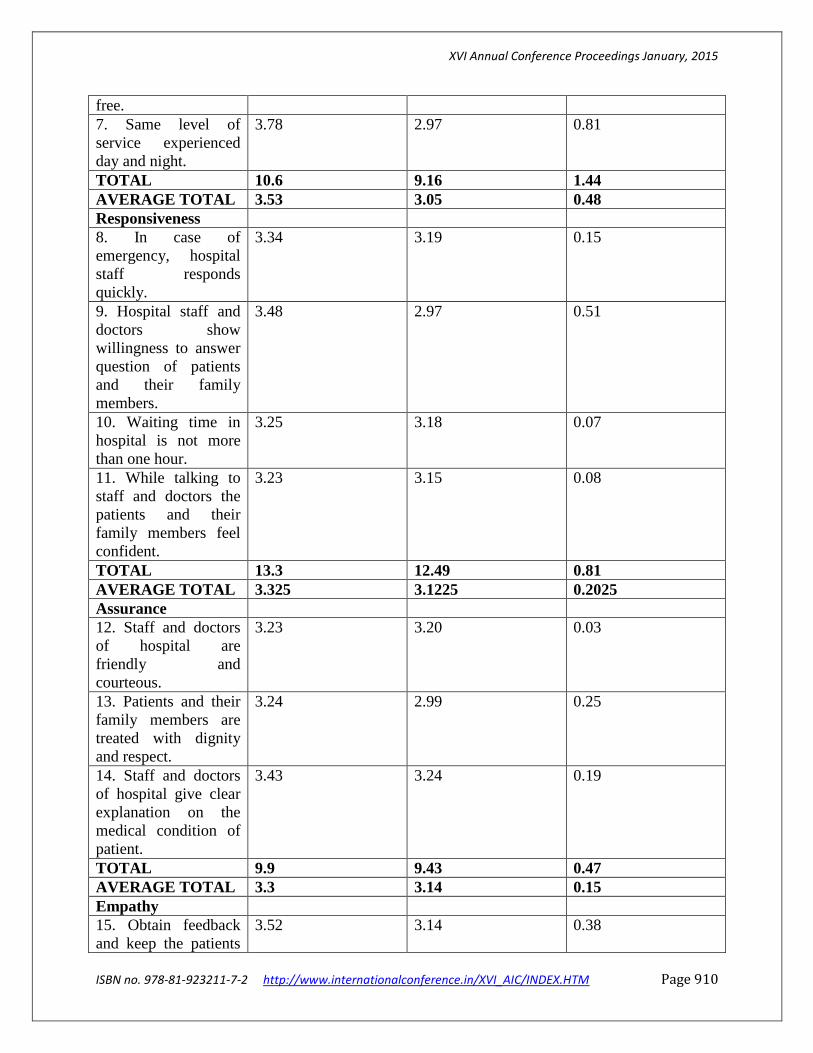
Table 6: SERVQUAL Model for finding the gaps between Perceptions and Expectations
DIMENSIONS PERCEPTION(P) EXPECTATION(E) P – E
Tangibility
1. Physical Facilities
are visually appealing.
3.17 3.06 0.11
2. Appearance of
doctors and staff of
hospital are neat and
professional.
3.12 2.95 0.17
3. Written materials
are easy to
understand.
3.68 2.89 0.79
4. Modern equipments
are available in the
hospital.
3.25 3.15 0.1
TOTAL 13.22 12.05 1.17
AVERAGE TOTAL 3.305 3.0125 0.2925
Reliability
5. Services performed
by staff and doctors of
hospital as promised.
3.49 3.20 0.29
6. Documents are fast
to retrieve and error
3.33 2.99 0.34
XVI Annual Conference Proceedings January, 2015
ISBN no. 978-81-923211-7-2 http://www.internationalconference.in/XVI_AIC/INDEX.HTM Page 910
free.
7. Same level of
service experienced
day and night.
3.78 2.97 0.81
TOTAL 10.6 9.16 1.44
AVERAGE TOTAL 3.53 3.05 0.48
Responsiveness
8. In case of
emergency, hospital
staff responds
quickly.
3.34 3.19 0.15
9. Hospital staff and
doctors show
willingness to answer
question of patients
and their family
members.
3.48 2.97 0.51
10. Waiting time in
hospital is not more
than one hour.
3.25 3.18 0.07
11. While talking to
staff and doctors the
patients and their
family members feel
confident.
3.23 3.15 0.08
TOTAL 13.3 12.49 0.81
AVERAGE TOTAL 3.325 3.1225 0.2025
Assurance
12. Staff and doctors
of hospital are
friendly and
courteous.
3.23 3.20 0.03
13. Patients and their
family members are
treated with dignity
and respect.
3.24 2.99 0.25
14. Staff and doctors
of hospital give clear
explanation on the
medical condition of
patient.
3.43 3.24 0.19
TOTAL 9.9 9.43 0.47
AVERAGE TOTAL 3.3 3.14 0.15
Empathy
15. Obtain feedback
and keep the patients
3.52 3.14 0.38

XVI Annual Conference Proceedings January, 2015
ISBN no. 978-81-923211-7-2 http://www.internationalconference.in/XVI_AIC/INDEX.HTM Page 911
informed.
16. Staff and doctors
of hospital understand
the specific needs of
the patients.
3.45 3.16 0.29
TOTAL 6.97 6.3 0.67
AVERAGE TOTAL 3.485 3.15 0.335
Courtesy
17. Staff and doctors
look busy and rude
when patients and
their family members
ask questions.
3.22 3.15 0.07
18. Staff and doctors
observe consideration
to the property and
values of patients.
3.49 3.15 0.34
TOTAL 6.71 6.3 0.41
AVERAGE TOTAL 3.355 3.15 0.205
Communication
19. During customer‘s
contacts service point,
staff listens to
problem and
demonstrates
understanding and
concern.
3.34 3.20 0.14
20. Staff able to
explain clearly to a
particular query.
3.37 3.19 0.18
21. Staff members call
if a scheduled
appointment is
missed.
3.17 3.13 0.04
TOTAL 9.88 9.52 0.36
AVERAGE TOTAL 3.29 3.17 0.12
Understanding the
Patients
22. Staff recognizes
the regular patients.
3.19 3.06 0.13
23. Staff is flexible
enough to
accommodate to
patient‘s schedule.
3.24 3.17 0.07
TOTAL 6.43 6.23 0.2
AVERAGE TOTAL 3.215 3.115 0.1

XVI Annual Conference Proceedings January, 2015
ISBN no. 978-81-923211-7-2 http://www.internationalconference.in/XVI_AIC/INDEX.HTM Page 912
SERVQUAL
TOTALS
77.01 71.48 5.53
SERVQUAL
AVERAGE
3.34 3.10 0.24
From the above Servqual Model, it is observed that there is a requirement of improvement in all
the 23 factors on service quality aspects. There are certain factors where the service quality gap
is more than 0.5 i. e. more than 10 % as the scale taken here is five point Likert‘s scale. The
factors which have more than 0.5 service quality gap are written materials are easy to
understand, same level of service experienced day and night, and staff and doctors show
willingness to answer question of patients and their family members. Same level of service at all
times of the day and staff willingness to answer customer‘s questions are critical here. The factor
‗easy to understand written materials‘ is not that critical as written material is in medicinal terms
and decision makers here are different from the users.
t- TEST AND ANOVA TEST FOR DEMOGRAPHIC COMPARISON
The t- test is used here for the Gender wise comparison of data and Anova is used for age,
education and income wise comparison of data.
Table 7: t – Test and Anova Test
DIMENSIONS GENDER AGE EDUCATION INCOME
Tangibility 0.487 0.114 0.878 0.076
Reliability -0.925 0.091 0.246 0.055
Responsiveness 1.026 1.168 0.093 0.773
Assurance -0.009 0.159 0.998 0.778
Empathy 2.419* 0.119 0.550 3.246*
Courtesy 0.167 0.817 1.326 0.076
Communication -0.939 0.500 0.142 1.479
Understanding the
Patients
1.152 2.234* 0.145 0.761
To achieve a significance level of 0.05 for a two-sided test, the absolute value of the test statistic
(|z|) must be greater than or equal to the critical value 1.96.

XVI Annual Conference Proceedings January, 2015
ISBN no. 978-81-923211-7-2 http://www.internationalconference.in/XVI_AIC/INDEX.HTM Page 913
From table 7, it is observed that there is a significant difference of gender in the empathy factor
out of the eight factors, only empathy factor has a significant difference between male and
female while other factors in the gender have no significant difference in gender. Thus in other
factors except empathy patients do not have significant difference in males and females. If we
observe the mean values males are more satisfied than female in terms of empathy factors on
which the management of hospitals needs to pay more attention.
If we observe in the age group there is also a significant difference in understanding the patients
and again the empathy factor in the Income group has a significant difference.
PAIRED SAMPLE T-TEST STATISTICS
Table 8: Paired Sample t- test
DIMENSIONS t- value p - value
Tangibility
1. Physical Facilities are visually appealing. 2.24 .027*
2. Appearance of doctors and staff of hospital are
neat and professional. 2.18 .031*
3. Written materials are easy to understand. 4.52 .000
4. Modern equipments are available in the
hospital. 7.32 .000
Reliability
5. Services performed by staff and doctors of
hospital as promised. 6.54 .000
6. Documents are fast to retrieve and error free. 7.95 .000
7. Same level of service experienced day and
night. 7.51 .000
Responsiveness
8. In case of emergency, hospital staff responds
quickly. 6.87 .000
9. Hospital staff and doctors show willingness to
answer question of patients and their family
members.
6.45 .000

XVI Annual Conference Proceedings January, 2015
ISBN no. 978-81-923211-7-2 http://www.internationalconference.in/XVI_AIC/INDEX.HTM Page 914
10. Waiting time in hospital is not more than one
hour. 5.08 .000
11. While talking to staff and doctors the patients
and their family members feel confident. 6.58 .000
Assurance
12. Staff and doctors of hospital are friendly and
courteous. 6.37 .000
13. Patients and their family members are treated
with dignity and respect. 5.05 .000
14. Staff and doctors of hospital give clear
explanation on the medical condition of patient. 6.39 .000
Empathy
15. Obtain feedback and keep the patients
informed. 7.24 .060
16. Staff and doctors of hospital understand the
specific needs of the patients. 6.84 .079*
Courtesy
17. Staff and doctors look busy and rude when
patients and their family members ask questions. 7.94 .000
18. Staff and doctors observe consideration to the
property and values of patients. 5.81 .000
Communication
19. During customers contacts service point, staff
listen to problem and demonstrate understanding
and concern.
9.55 .000
20. Staff able to explain clearly to a particular
query. 8.58 .000
21. Staff members call if a scheduled appointment
is missed. 8.62 .000
Understanding the Patients
22. Staff recognize the regular patients. 5.84 .000
23. Staff is flexible enough to accommodate to
patient‘s schedule. 8.24 .000
Above table 8, represent the significant difference between the perception and expectation of
services on all the dimensions and statements. Various statements like Physical Facilities are

XVI Annual Conference Proceedings January, 2015
ISBN no. 978-81-923211-7-2 http://www.internationalconference.in/XVI_AIC/INDEX.HTM Page 915
visually appealing, Appearance of doctors and staff of hospital are neat and professional, Obtain
feedback and keep the patients informed and Staff and doctors of hospital understand the specific
needs of the patients were found to be significant at 5% level of significance. It canbe concluded
here that there is a significant difference between the patients'expectations and perceptions at the
95 per cent confidence level. However, for all theother statements, there is a statistical
significance of _ <.01, which illustrates astatistically significant gap between the patients'
perceptions and expectations ofservice at the 99 per cent confidence level.
REGRESSION ANALYSIS
Regression analysis is done to analyze and generalize the results and is being done to find the
relationship between certain dimensions and variables. Here in the Regression Analysis all the
factors i.e. Tangibility, Reliability, Responsiveness, Assurance, Empathy, Courtesy,
Communication and Understanding the Patients are taken as the independent variables while
other factors i.e. value for expenses paid, satisfaction with the experience andwillingness to
recommend are serving as the dependent variables.The data is being represented below. All the
dimensions i.e. Tangibility, Reliability, Responsiveness, Assurance, Empathy, Courtesy,
Communication and Understanding the Patients are regressed against one another to check the
problem of multicollinearity. In all cases, no significant multicollinearity exists betweenthe
dimensions.
Table 9: The Correlates of Patients Value (in terms of money spended)
DIMENSIONS Beta t sig
Tangibility 0.87 0.766 0.139
Reliability 0.07 0.101 0.912
Responsiveness 0.370 2.883 0.000
Assurance 0.034 0.388 0.291
Empathy 0.064 0.562 0.568
Courtesy 0.431 0.642 0.451
Communication 0.042 0.561 0.349
Understanding the Patients 0.08 0.127 0.927
R 0.863

XVI Annual Conference Proceedings January, 2015
ISBN no. 978-81-923211-7-2 http://www.internationalconference.in/XVI_AIC/INDEX.HTM Page 916
R Square 0.765
R Square (Adj)
0.660
ANOVA
Table 10: Anova Table
Model Sum of
Squares
df Mean Square F sig
Regression 51.23 5 10.233 6.239 .000
Residual 147.13 96 1.64
Total 198.35 101
The above table 10, illustrates that there is a strong correlation of 0.863 between dimensions and
value in terms of money spended by the patients in the private hospitals. It means there is a
strong positive correlation between the service dimensions and the value in terms of money
spended. The value of adjusted R2 is 0.660 this is being taken as it is a case of multiple
correlation where dimensions itself can correlate and affect the line of best fit which clearly
indicates that 66% variances in value in terms of money spended are explained by the service
quality dimensions. From the Anova table it is clear that the service quality dimensions are
significant to explain the value in terms of money spended as the significant value is less that 1%
level of significance. The beta factor is higher in case of Tangibility and then in Empathy, it
means the private hospitals has to concentrate more on this service quality dimension tangibility
and empathy as theseare the most important dimensions for predicting the perception of patients
regarding value in terms of money spended.
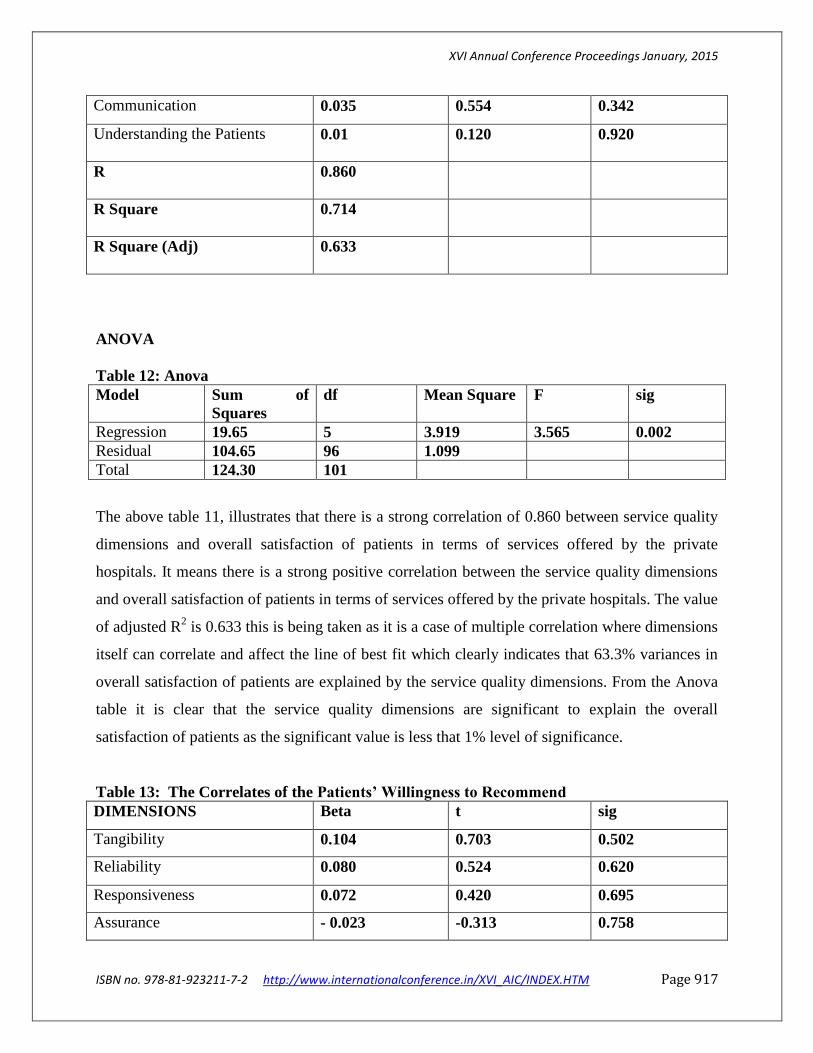
Table 11: The Correlates of Patient Satisfaction with the Experience
DIMENSIONS Beta t sig
Tangibility 0.117 0.943 0.348
Reliability 0.062 0.516 0.605
Responsiveness 0.173 1.270 0.207
Assurance - 0.057 -0.559 0.576
Empathy 0.149 1.170 0.245
Courtesy 0.424 0.635 0.444
XVI Annual Conference Proceedings January, 2015
ISBN no. 978-81-923211-7-2 http://www.internationalconference.in/XVI_AIC/INDEX.HTM Page 917
Communication 0.035 0.554 0.342
Understanding the Patients 0.01 0.120 0.920
R 0.860
R Square 0.714
R Square (Adj)
0.633
ANOVA
Table 12: Anova
Model Sum of
Squares
df Mean Square F sig
Regression 19.65 5 3.919 3.565 0.002
Residual 104.65 96 1.099
Total 124.30 101
The above table 11, illustrates that there is a strong correlation of 0.860 between service quality
dimensions and overall satisfaction of patients in terms of services offered by the private
hospitals. It means there is a strong positive correlation between the service quality dimensions
and overall satisfaction of patients in terms of services offered by the private hospitals. The value
of adjusted R2 is 0.633 this is being taken as it is a case of multiple correlation where dimensions
itself can correlate and affect the line of best fit which clearly indicates that 63.3% variances in
overall satisfaction of patients are explained by the service quality dimensions. From the Anova
table it is clear that the service quality dimensions are significant to explain the overall
satisfaction of patients as the significant value is less that 1% level of significance.
Table 13: The Correlates of the Patients’ Willingness to Recommend
DIMENSIONS Beta t sig
Tangibility 0.104 0.703 0.502
Reliability 0.080 0.524 0.620
Responsiveness 0.072 0.420 0.695
Assurance - 0.023 -0.313 0.758

XVI Annual Conference Proceedings January, 2015
ISBN no. 978-81-923211-7-2 http://www.internationalconference.in/XVI_AIC/INDEX.HTM Page 918
Empathy 0.176 1.214 0.245
Courtesy 0.427 0.638 0.447
Communication 0.038 0.557 0.345
Understanding the Patients 0.04 0.123 0.923
R 0.828
R Square 0.803
R Square (Adj)
0.729
ANOVA
Table 14: Anova
Model Sum of
Squares
df Mean Square F sig
Regression 14.09 5 2.807 1.960 0.001
Residual 136.58 96 1.432
Total 150.67 101
The above table 13,illustrates that there is a strong correlation of 0.828 between service quality
dimensions and willingness to recommend. It means there is a strong positive correlation
between the service dimensions and willingness to recommend. The value of adjusted R2 is 0.729
this is being taken as it is a case of multiple correlation where dimensions itself can correlate and
affect the line of best fit which clearly indicates that 72.9% variances in willingness to
recommend are explained by the service quality dimensions. From the Anova table it is clear that
the service quality dimensions are significant to explain the overall satisfaction of patients as the
significant value is less that 1% level of significance.
CONCLUSION
It is to concluded that here the private hospitals are performing sufficiently well in terms of the
dimensions of the service quality model. The higher gap score is argued in terms of patients‘ lack
of experience and knowledge to judge certain dimensions. Therefore, to some extent the gaps
may be inevitable, and the issue of `experience'comes into the equation, which has been

XVI Annual Conference Proceedings January, 2015
ISBN no. 978-81-923211-7-2 http://www.internationalconference.in/XVI_AIC/INDEX.HTM Page 919
previously raised as one of SERVQUAL'slimitations ( Buttle, 1996). As each of the dimensions
of the SERVQUAL model containing twenty three statements tested significantly the private
hospitals could adopt a corporate policydrive to improve quality across the board.However, a
more focused approach may beto focus on those areas considered to be of most relative
importance as perceivedamong the sample. From the data collected, it was discovered that the
there are certain factors where the service quality gap is more than 0.5 i. e. more than 10 % as the
scale taken here is five point Likert‘s scale. The factors which have more than 0.5 service quality
gap are written materials are easy to understand, same level of service experienced day and
night, and staff and doctors show willingness to answer question of patients and their family
members. Same level of service at all times of the day and staff willingness to answer customer‘s
questions are critical here. The factor ‗easy to understand written materials‘ is not that critical as
written material is in medicinal terms and decision makers here are different from the users.It is
observed that there is a significant difference of gender in the empathy factor out of the eight
factors, only empathy factor has a significant difference between male and female while other
factors in the gender have no significant difference in gender. Various statements like Physical
Facilities are visually appealing, Appearance of doctors and staff of hospital are neat and
professional, Obtain feedback and keep the patients informed and Staff and doctors of hospital
understand the specific needs of the patients were found to be significant at 5% level of
significance.
LIMITATIONS OF STUDY
It is recommended that more research should be undertaken amongst the patients in private
hospitals on a global basis. Such kind of research will provide the fruitful data and results can be
used in comparing the services being provided by the private hospitals.
REFERENCES
(1) Babakus, E., and Mangold, W. G. (1992). Adapting the SERVQUAL Scale to Hospital
Services: An Empirical Investigation.Health Services Research, 26 (6), 767-786.

XVI Annual Conference Proceedings January, 2015
ISBN no. 978-81-923211-7-2 http://www.internationalconference.in/XVI_AIC/INDEX.HTM Page 920
(2) Calnan, M. (1988). Lay Evaluation of Medicine. International Journal of Health Services,
18, 311 – 322.
(3) Cartwright, A. (1986). A Depressing Pursuit of Quality.British Medical Journal, 292, 84–97.
(4) De Man, S., Gemmel, P., Vleric P., and Dierchx, R. (2002). Patient's and Personnel's
Perceptions of Service Quality and Patient Satisfaction in Nuclear Medicine.European
Journal of Nuclear Medicine, 29(9), 1109-1117.
(5) Donabedian, A. (1992).Quality Assurance in Health Care: Consumers Role.Quality in Health
Care, 1, 247-25l.
(6) Cronin, J.J. Jr., and Taylor, S.A. (1992).Measuring Service Quality: A Re-Examination and
Extension.Journal of Marketing, 56, 55—68.
(7) Gronroos, C. (1984). A Service Quality Model and its Marketing Implications.European
Journal of Marketing, 18(4), 36-44.
(8) Haywood-Framer, J., and Staurt, F. (1988).Measuring the Quality of Professional Services‖ in
The Management of Service Operations proceedings from the Third Annual Conference of
the UK Operations Management Association, R Johnston, ed. London: University of
Warwick.
(9) Hill, F.M., and McCrory, M.L. (1997).An Attempt to Measure Service Quality at Belfast
Maternity Hospital: Some Methodological Issues and Results.Total Quality Management,
8(5), 15 – 31.
(10) Lovelock, C.H. (1981).Towards a Classification of Services, In: Theoretical Development in
Marketing, (Eds) Lamb, C. and Dunne, P., Chicago, American Marketing Association, 72-
76. Lovelock, C.H. (1983). Classifying Services to Gain Strategic Marketing
Insights.Journal of Marketing, 47, 9-20.
(11) Murfin, E. (1995).Perceived Service Quality and Medical Outcome: An Interdisciplinary
Review and Suggestions for Future Research.Journal of Marketing Management, 11, 97-
117.
(12) Oliver, L. (1981).A Cognitive model of Antecedents and Consequences of Satisfaction
Decisions.Journal of Marketing Research, 17, 460-469.
(13) Parasuraman, A., Zeithaml, V.A. and Berry, L. (1985). A Conceptual Model of Service
Quality and Its Implications for Future Research.Journal of Marketing, 49, 41-50.

XVI Annual Conference Proceedings January, 2015
ISBN no. 978-81-923211-7-2 http://www.internationalconference.in/XVI_AIC/INDEX.HTM Page 921
(14) Paul, P. (2003).What is the Best Approach for Measuring Service Quality of periodontists?
Clinical Research and Regulatory Affairs, 20(4), 457-468.
(15) Peprah, R.A.(2014).Measuring Customer Satisfaction: Fact and Artefact.Journal of the
Academy of Marketing Science, 20, 61-71.
(16) Reidenbach, R. E., and Sandifer-Smallwood, B. (1990). Explaining Perception of Hospital
Operations by a Modified SERVQUAL Approach. Journal of Health Care Marketing,
10(4), 47-55.
(17) Webster, C. (1989).Can consumers be Segmented on the Basis of their Service Quality
Expectations? Journal of Service Marketing, 3(2), 19-32.
(18) Zeithaml, V.A., Berry L.L., and Parasuraman, A. (1988).Communication and Control
Processes in the Delivery of Service Quality.Journal of Marketing, 52, 358.