Embed Size (px)
Citation preview

AN ENERGY AND ECONOMIC EFFICIENCY COMPARISON OF THE BUILDING
ENVELOPE OF AN APARTMENT BUILDING IN ANKARA,
TURKEY
A THESIS SUBMITTED TO
THE GRADUATE SCHOOL OF NATURAL AND APPLIED SCIENCES
OF
MIDDLE EAST TECHNICAL UNIVERSITY
BY
MUSTAFA IBRAHIM SAEED AHMED SHORBAGI
IN PARTIAL FULFILLMENT OF THE REQUIREMENTS
FOR
THE DEGREE OF MASTER OF SCIENCE
IN
BUILDING SCIENCE IN ARCHITECTURE
JUNE 2014


iii
Approval of the thesis:
AN ENERGY AND ECONOMIC EFFICIENCY COMPARISON OF THE
BUILDING ENVELOPE OF AN APARTMENT BUILDING IN ANKARA,
TURKEY
submitted by MUSTAFA IBRAHIM SAEED AHMED SHORBAGI in partial
fulfillment of the requirement for the degree of Master of science in Building
Science, Department of Architecture, Middle East Technical University by,
Prof. Dr. Canan Özgen ____________________
Dean, Graduate School of Natural and Applied Sciences
Prof. Dr. Güven Arif Sargin ____________________
Head of Department, Architecture
Inst. Dr. A.Berrin Çakmakli ____________________
Supervisor, Department of Architecture, METU
Examining Committee Members:
Inst. Dr. Funda Baş Bütüner
Department of Architecture, METU ____________________
Inst. Dr. A.Berrin Çakmakli
Department of Architecture, METU ____________________
Prof. Dr. Soofia Tahira Elias Özkan
Department of Architecture, METU ____________________
Asst. Prof. Dr. Ayşegül Tereci
Department of Architecture, KTO, Karatay ____________________
Inst. Dr. İdil Ayçam
Department of Architecture, Gazi University ____________________
Date: 27 / 06 / 2014

iv
I hereby declare that all information in this document has been obtained and
presented in accordance with academic rules and ethical conduct. I also declare
that, as required by these rules and conduct, I have fully cited and referenced
all material and results that are not original to this work.
Name, Last Name: Mustafa Ibrahim Saeed, Ahmed Shorbagi
Signature: ______________

v
ABSTRACT
AN ENERGY AND ECONOMIC EFFICIENCY COMPARISON OF THE
BUILDING ENVELOPE OF AN APARTMENT BUILDING IN ANKARA,
TURKEY
Ahmed Shorbagi, Mustafa Ibrahim Saeed
M.S., in Building Science, Department of Architecture
Supervisor: Dr. Ayşem Berrin Zeytun Çakmaklı
June 2014, 321 pages
The main aim of this thesis is to study the energy and the economic performance of
the building envelope of an apartment floor consisting of three flats in Etlik, Ankara.
Three flats namely flat-1 facing South-West, flat-2 facing South-East and flat-3
facing North are considered. Three different glazing window types namely ISICAM
KLASIK, ISICAM SINERJI and ISICAM SINERJI 3+ with different thermal
transmittance values are investigated as well as the Base Case wall section, four wall
sections involving Aerated Autoclaved Concrete Blocks, four wall sections involving
Heavyweight Concrete Blocks and four wall sections involving Lightweight
Concrete Blocks. The wall sections applied are of different configurations one
without insulation and the remaining three are having insulation on the exterior,
sandwiched and in the interior. Both the initial investment and operation costs of all
these alternatives are found and a performance sequence is obtained to find out the
most efficient alternative. In terms of the glazing window units, the most efficient
alternative both energy wise and economy wise is ISICAM SINERJI 3+ for flat-1
and flat-2. The result for flat-3 is an exception because it received the least solar
energy making the ISICAM KLASIK glazing unit the most efficient. When
considering both the energy and economy performance of the wall sections, the most
efficient are those with insulation in the exterior and interior for both the AAC

vi
Blocks and Lightweight Concrete Blocks. This is mainly due to the low conductivity
values of AAC blocks followed by the Lightweight Concrete Blocks.
Keywords: Building Envelope, Design Builder, Energy and Economic Performance

vii
ÖZ
ANKARA, ETLİK’ TEKİ BİR BİNANIN DIŞ YAPI KAPUĞU
MALZEMELERININ ENERJİ VE EKONOMİK VERİMLİLİKLERİNİN
KARŞILAŞTIRILMASI
Ahmed Shorbagi, Mustafa Ibrahim Saeed
Yüksek Lisans,Yapı Bilimleri, Mimarlık Bölümü
Tez Yöneticisi: Dr. Ayşem Berrin Zeytun Çakmaklı
Haziran 2014, 321 sayfa
Bu tezin ana hedefi Ankara, Etlik’teki üç daireli bir binanin diş yapı kapuğu
malzemelerının enerji ve ekonomik performansının değerlendirilmesidir. Üç dairenin
konumları belirtildiği gibidir: Daire 1 Güneybatı cepheli; Daire 2 Güneydoğu cepheli
ve Daire 3 kuzey cepheli. Yapılan ilk değerlindermelerde üç farklı tip doğrama tespit
edilmiştir: ISICAM KLASİK, ISICAM SİNERJİ ve ISICAM SİNERJİ 3+. Her üç
doğrama çeşidinin farklı ısı iletkenlik değerleri bulunmaktadır. Bunun yanısıra,
cephe duvarları da farklılık göstermektedir. Dört duvarda gazbeton blok, dört
duvarda ağır beton blok ve diğer dört duvarda da hafif beton blokla imalat yapıldığı
gözlenmiştir. Duvar kesitlerinde farklı yalıtım uygulamaları da tespit edilmiştir.
Hiçbir yalıtım uygulanmayan duvarın yanısıra, diğer üç duvar tipinde dıştan yalıtım
ve sandviç duvar tespit edilmiştir. Duvarların iç yüzleriyle ilgili araştırma devam
etmektedir. Bu alternatiflerin yıllık enerji performansı, ilk yatırım maliyeti ve hem de
işletme maliyetleri tespit edilmiş ve performans etkisi elde edilerek en verimli
alternatif bulunmuştur. Dış cephe doğramaları arasında 1 ve 2 numaralı dairelerde
bulunan ISICAM SİNERJİ 3+’ın enerji ve ekonomi açısından en verimli olduğu
tespit edilmiştir. 3 numaralı dairede bulunan ISICAM KLASİK doğramalar en az
güneş ışığına maruz kaldığı için istisnai olarak tespit edilmiştir. Aksi takdirde söz
konusu doğramalar en verimli olarak belirlenebilecekti. Duvar kesitleri enerji ve
ekonomik performansları açısından ele alındığında, gazbeton ve hafif beton blok

viii
duvarların en vermli oldukları belirlenmiştir. Bu tespitin temel sebebi, gazbetonun ve
takip eden hafif beton blokların düşük iletkenlik.
Anahtar kelimeler: Dış yapı kapuğu, Design Builder, Enerji ve Ekonomik
Performans

ix
To my Family, Friends and all my Teachers

x
ACKNOWLEDGMENTS
I would like to express my deepest gratitude to my advisor Inst. Dr. Ayşem Berrin
Zeytun Çakmaklı for her guidance, advice, criticism, encouragements and insight
throughout the research.

xi
TABLE OF CONTENTS
ABSTACT…………………………………………………………………………...v
ÖZ………………………………………………………………………………….vii
ACKNOWLEDGMENTS…………………………………………………………..x
TABLE OF CONTENTS…………………………………………………………...xi
LIST OF TABLES………………………………………………………………..xvii
LIST OF FIGURES………………………………………………………….…..xxiii
CHAPTERS
1. INTRODUCTION…………………………………………………..………1
1.1 Argument………………………..……………………...……..............1
1.2 Aim and Objective………………………………………….................2
1.3 Procedure…………………………………….………………..............4
1.4 Disposition………………………………………………………………...4
2. LITERATURE SURVEY…………………………………………..............7
2.1 Energy Conservation and Consumption………………………………7
2.1.1 Global Warming ………...........................................................9
2.1.2 Kyoto Protocol………………………………………............10
2.1.3 Statistics in Turkey ….............................................................11
2.2 Passive Design Principles...........................................................................13
2.2.1 Orientation ………………………………………………......17
2.2.2 Ventilation…………………………………………………...19
2.2.3 Thermal Comfort ……………………………………………19
2.2.4 The Building Envelope ………...................................................22
2.2.4.1 Windows (Openings)……………………………….32
2.2.4.2 Window Frames……………………………………50
2.2.4.3 Masonry Walls……………………………..............52
2.2.4.4 Wall System (Autoclaved Aerated
concrete (AAC) Block).............................................56
2.2.4.5 Plasters and Renders….............................................58

xii
2.2.4.6 Insulation………………………...………………...59
2.3 Thermal Simulation………………………….....................................71
2.4 Life Cycle Cost Analysis……………………………………………73
3. MATERIAL AND METHODOLOGY……………………………………75
3.1 Material…………………………………………………..………….75
3.1.1 Windows Under Investigation…………………..……………..81
3.1.2 Wall Sections Under Investigation……….……………………83
3.2 Ankara Climate…………………………..…………………………..88
3.2.1 Ankara Climatic According to Climate Consultant…………..88
3.3 Methodology………………………………………………………...89
3.3.1 Method……………………………………………………......90
4. RESULTS AND DISCUSSION…………………………………………..95
4.1 Comparing Monthly Heat Gains Through the Different
Glazing Windows in Flat-1, Flat-2 and Flat-3………………............95
4.2 Comparing Monthly Heat Load Production by the Heating System
Through All the Different Wall Sections in Flat-1, Flat-2 and
Flat-3…………………………………………………..…………….97
4.3 Comparing Yearly Heat Gains Through the Different Glazing
Windows in Flat-1, Flat-2 and Flat-3…………...….........................103
4.4 Comparing Yearly Heat Load Production by the Heating System
Through All the Different Wall Sections in Flat-1, Flat-2 and
Flat-3……………………………………………………………….104
4.5 Percentages (%) of Heat Gains and Losses Through the Window
Glazings in Flat-1, Flat-2, Flat-3…………………………………...107
4.6 Percentages (%) of Heat Losses through the Wall Sections in
Flat-1, Flat-2, Flat-3………………………………………………..109
4.7 Initial capital investment calculation……………………….................113
4.8 Operation cost calculation……………………….……....................122
4.9 Comparing the Initial Investment and Operation Costs of Glazing
Units in Flat-1, Flat-2, Flat-3…………..…......................................122

xiii
4.10 Comparing the Initial Investment and Operation Costs of the Wall
Sections in Flat-1, Flat-2, Flat-3………….…..............................................124
5. CONCLUSION………………………………………………...……..….131
REFERENCES……………………………………………………………………139
BIBLIOGRAPHY………………………………………………………………...161
APPENDICES
A. QUESTIONNAIRES FLAT-1, FLAT-2 AND FLAT-3………………….169
B. DIFFERENT CONSTRUCTION SYSTEM UNDER INVESTIGATION
(BS EN ISO 6946)………………………………………………………...193
C. DIFFERENT INSULATION MATERIALS UNDER INVESTIGATION
(URALITA)………………………………………………………………195
D. DIFFERENT WINDOW FRAMES UNDER INVESTIGATION
(BS EN ISO 6946)………………………………………………………..197
E. ORIGINAL EXTERNAL WALL SYSTEM (SECTION BASE CASE)..199
F. HVAC TEMPLATE (DESIGN BUILDER)……………………………..201
G. LIGHTING TEMPLATE (DESIGN BUILDER)………………………...203
H. GLAZING TEMPLATES (DESIGN BUILDER)…..……………………205
I. PROPOSED EXTERNAL WALL SYSTEM (SECTIONS 1A, 1B,
1C AND 1D)……………………………………………………………...207
J. PROPOSED EXTERNAL WALL SYSTEM (SECTIONS 2A, 2B,
2C AND 2D)……………………………………………………………...209
K. PROPOSED EXTERNAL WALL SYSTEM (SECTIONS 3A, 3B,
3C AND 3D)……………………………………………………………...211
L. ORIGINAL FLAT ROOF SYSTEM…………………………………….213
M. ORIGINAL AND PROPOSED PITCHED ROOF SYSTEM…………...215
N. ORIGINAL AND PROPOSED INTERNAL PARTITION SYSTEM…..217
O. ORIGINAL SEMI-EXPOSED WALL SYSTEM (BASE CASE)……….219
P. PROPOSED SEMI-EXPOSED WALL SYSTEM (SECTIONS 1A,
1B, 1C AND 1D)……………………………………………………….....221
Q. PROPOSED SEMI-EXPOSED WALL SYSTEM (SECTIONS 2A,
2B, 2C AND 2D)………………………………………………….............223

xiv
R. PROPOSED SEMI-EXPOSED WALL SYSTEM (SECTIONS 3A,
3B, 3C AND 3D)…………………………………………………….........225
S. ORIGINAL AND PROPOSED SEMI-EXPOSED CEILING SYSTEM...227
T. ORIGINAL AND PROPOSED SEMI-EXPOSED FLOOR SYSTEM…. 229
U. ORIGINAL AND PROPOSED GROUND FLOOR SYSTEM………….231
V. ORIGINAL AND PROPOSED EXTERNAL FLOOR SYSTEM…….…233
W. ORIGINAL AND PROPOSED INTERNAL FLOOR SYSTEM………..235
X. ORIGINAL SUB-SURFACES WALL SYSTEM (BASE CASE)……….237
Y. ORIGINAL AND PROPOSED SUB-SURFACES INTERNAL
WALL SYSTEM…………………………………………………………...239
Z. ORIGINAL AND PROPOSED SUB-SURFACES ROOF SYSTEM……241
AA. PROPOSED SUB-SURFACES WALL SYSTEM (SECTIONS 1A,
1B, 1C AND 1D)………………………………………………………..243
BB. PROPOSED SUB-SURFACES WALL SYSTEM (SECTIONS 2A,
2B, 2C AND 2D)………………………………………………………...245
CC. PROPOSED SUB-SURFACES WALL SYSTEM (SECTIONS 3A,
3B, 3C AND 3D)………………………………………………………...247
DD. ORIGINAL AND PROPOSED SUB-SURFACES EXTERNAL
AND INTERNAL DOOR SYSTEMS………………………………….249
EE. ORIGINAL AND PROPOSED INTERNAL THERMAL MASS
SYSTEMS………………………………………………………………251
FF. COMPONENT BLOCKS SHADING AND REFLECTION
SYSTEMS……………………………………………………………...253
GG. AIR TIGHTNESS………………………………………………………255
HH. WINDOW OPENING SYSTEM……………………………………….257
II. DOOR OPENING SYSTEM…………………………………………...259
JJ. INTERIOR WINDOW SYSTEM………………………………………261
KK. ROOF WINDOW / SKYLIGHT SYSTEM…………………………….263
LL. VENT OPENING SYSTEM……………………………………………265
MM. OCCUPANCY SCHEDULES FOR FLATS-1, FLAT-2 AND
FLAT-3…………………………………………………………………267

xv
NN. PRODUCTION UNITS PER MASON ACCORDING TO
BLOCK WEIGHT………………….…………………………………..269
OO. TYPE OF CONCRETE BLOCKS, DIMENSIONS, PRICES
AND PRODUCTION DAYS IN TURKISH LIRAS………………….271
PP. SKILLED TECHNICAL STAFF (MASONS) AVERAGE
MONTHLY PAY………………………………………...……………..273
QQ. THE MASONS SALARY FOR THE CONSTRUCTION OF THE
BUILDING ENVELOPE FOR ONE FLOOR INCLUDING
FLATS-1, FLAT-2 AND FLAT-3……………...………………………275
RR. COMPARING ENERGY CONSUMPTIONS THROUGH
GLAZING UNITS IN THE INVESTIGATED FLATS………………..277
SS. COMPARING ENERGY CONSUMPTIONS THROUGH THE
WALL SECTIONS IN THE INVESTIGATED FLATS………………..279
TT. PERCENTAGES (%) OF HEAT GAINS AND LOSSES
THROUGH THE GLAZING ALTERNATIVES IN FLAT-1,
FLAT-2 AND FLAT-3………………………………………………….281
UU. PERCENTAGES (%) OF HEAT GAINS AND LOSSES
THROUGH THE WALL SECTIONS IN FLAT-1, FLAT-2
AND FLAT-3…………………………………………………….……...285
VV. MONTHLY HEAT GAINS TRANSMITTED THROUGH THE
THREE GLAZING ALTERNATIVES IN FLAT-1, FLAT-2
AND FLAT-3…........................................................................................289
WW. MONTHLY HEAT LOAD PRODUCTION OF THE HEATING
SYSTEM IN FLAT-1, FLAT-2 AND FLAT-3 IN KWH………………291
XX. PERCENTAGE HEAT LOSSES AND HEAT GAINS FOR THE
GLAZING WINDOWS AND HEAT LOSSES THROUGH ALL
WALL SECTIONS FOR FLAT-1, FLAT-2 AND FLAT-3…………….293
YY. HOLLOW CMU CHARACTERISTICS……………………………….309
ZZ. SAMPLE CALCULATIONS…………………………………………..311

xvi
AAA. ANKARA CLIMATE: 1) DRY BULB TEMPERATURE AND
RELATIVE HUMIDITY; 2) SUN SHADING CHART
(DECEMBER 21st TO JUNE 21
st); SUN SHADING CHART
(JUNE 21st TO DECEMBER 21
st); WIND WHEEL……………………313
BBB. MONTHLY HEAT LOAD PRODUCTION BY THE HEATING
SYSTEM FOR ALL THE WALL SECTIONS IN THE
INVESTIGATED FLAT-1, FLAT-2 AND FLAT-3 (KWH)……………..317

xvii
LIST OF TABLES
TABLES
Table 1 Distribution of the expected energy usage within the different fields
against the years in % (WEC-TNC, 1995); (Bolattürk, 2006).)........……….11
Table 2 Energy usage division within buildings in percentage (%)
(Çengel, 1998); (Bolattürk, 2006).).….…………………….…….................13
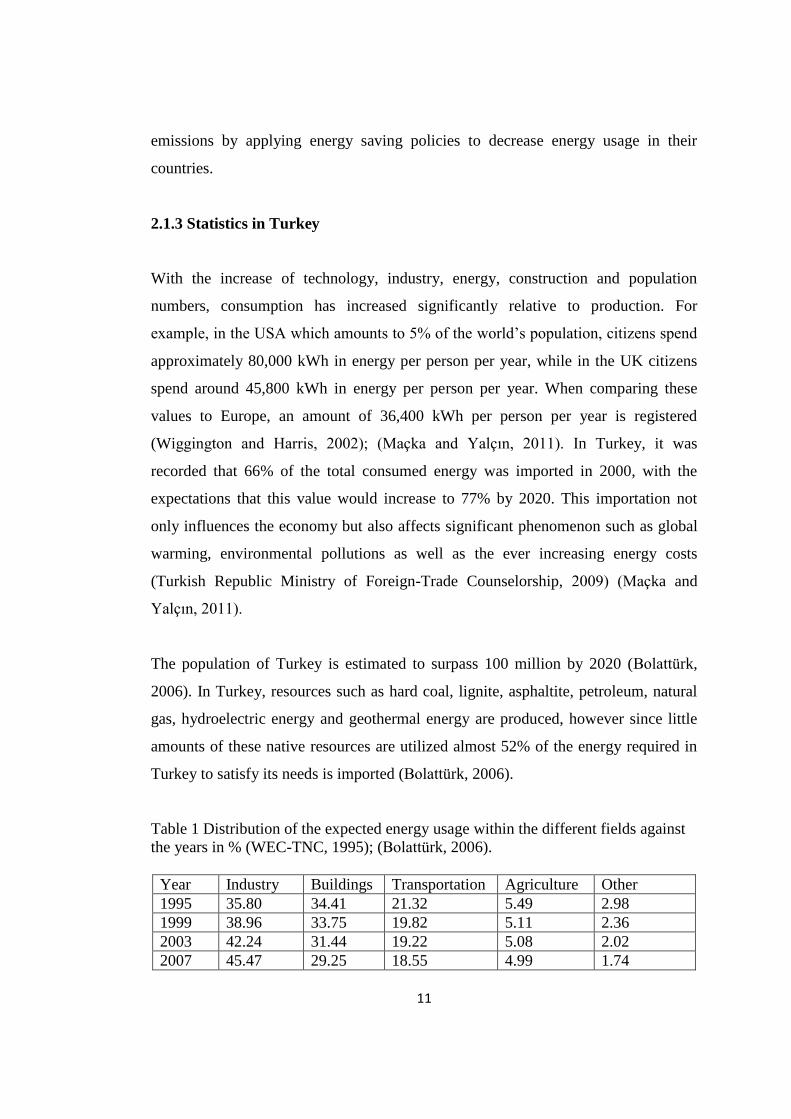
Table 3 Thermal mass for various materials (Baggs and Mortensen, 2006).…..........29
Table 4 Heat conductivities (k) of gases used in double and triple windows
(Çetiner and Özkan, 2004).…………………………………………………40
Table 5 U-value and SHGC of a double glazing with and without Low-e coating
(http://www.adelaidecitycouncil.com, Last Accessed 11 / 11 / 2013)...........48
Table 6 Product Dimensions of AAC Masonry Blocks (www.akg-gazbeton.com,
Last Accessed 05 / 03 / 2014).........................................................................57
Table 7 The Properties of Glass Wool (http://www.izocam.com.tr, Last Accessed
15 / 03 / 2014).................................................................................................69
Table 8 Characteristics of used materials of the case study…………………………82
Table 9 The zonal and window size information (Keçiören
Municipality)………………………………………………………………..87
Table 10 Ankara climatic details (Turkish State Meteorological Service)………….88
Table 11 The factors used in the Initial Investment and Operation Costs
Estimation.…………………………………………………………………94
Table 12 The Three Window Alternatives Under Investigation Square-Meter
Unit Costs (Trakya (http://www.trakyacam.com.tr/, Last Accessed
18 / 03 / 2014)............................................................................................114
Table 13 Flat-1 Total Block Costs (http://www.corumbloktugla.com/,(Last
Accessed 20 / 03 / 2014) (www.akggazbeton.com, Last
Accessed 05 / 03 / 2014), (http://www.escsi.org/, Last
Accessed 23 / 03 / 2014)………................................................................115

xviii
Table 14 Flat-2 Total Block Costs (http://www.corumbloktugla.com/,(Last
Accessed 20 / 03 / 2014) (www.akggazbeton.com, Last
Accessed 05 / 03 / 2014), (http://www.escsi.org/, Last
Accessed 23 / 03 / 2014)………………....................................................116
Table 15 Flat-3 Total Block Costs (http://www.corumbloktugla.com/,(Last
Accessed 20 / 03 / 2014) (www.akggazbeton.com, Last
Accessed 05 / 03 / 2014), (http://www.escsi.org/, Last
Accessed 23 / 03 / 2014)………………....................................................117
Table 16 Flat-1 Total Insulation Costs (http://www.izocam.com.tr, Last
Accessed 15 / 03 / 2014)............................................................................118
Table 17 Flat-2 Total Insulation Costs (http://www.izocam.com.tr, Last
Accessed 15 / 03 / 2014)…………………………………………………119
Table 18 Flat-3 Total Insulation Costs (http://www.izocam.com.tr, Last
Accessed 15 / 03 / 2014)…………………………………………………120
Table 19 The Glazing Areas of The Three Alternatives Under
Investigation (m2)……………………………………………………….121
Table 20 The total initial capital investment for the glazing units in the
flats (TL)…………………………………………………………………121
Table 21 The total initial capital investment for the Wall Sections in the
flats (TL)…………………………………………………………………121
Table 22 Annual energy prices of the glazings of the case study
flats (TL)…………………………………………………………………122
Table 23 Annual energy prices of the wall sections of the case study flats (TL)…..122
Table 24 Initial Investment and Operation Costs of Flat-1 Glazing
Alternatives (TL)…………………………………………………………123
Table 25 Initial Investment and Operation Costs of Flat-2 Glazing
Alternatives (TL)…………………………………………………………123
Table 26 Initial Investment and Operation Costs of Flat-3 Glazing
Alternatives (TL)…………………………………………………………124
Table 27 Initial Investment and Operation Costs of Flat-1 Wall
Sections Base, 1A, 1B, 1C, and 1D (TL)……………….………………..124

xix
Table 28 Initial Investment and Operation Costs of Flat-1 Wall
Sections 2A, 2B, 2C, and 2D (TL)……………………………………….124
Table 29 Initial Investment and Operation Costs of Flat-1 Wall
Sections 3A, 3B, 3C, and 3D (TL)……………………………………….125
Table 30 Initial Investment and Operation Costs of Flat-2 Wall
Sections Base, 1A, 1B, 1C, and 1D (TL)………………………………...125
Table 31 Initial Investment and Operation Costs of Flat-2 Wall
Sections 2A, 2B, 2C, and 2D (TL)……………………………………….125
Table 32 Initial Investment and Operation Costs of Flat-2 Wall
Sections 3A, 3B, 3C, and 3D (TL)……………………………………….125
Table 33 Initial Investment and Operation Costs of Flat-3 Wall
Sections Base, 1A, 1B, 1C, and 1D (TL)………………………………...126
Table 34 Initial Investment and Operation Costs of Flat-3 Wall
Sections 2A, 2B, 2C, and 2D (TL)…………………….…………………126
Table 35 Initial Investment and Operation Costs of Flat-3 Wall
Sections 3A, 3B, 3C, and 3D (TL)…………………….…………………126
Table 36 A comparison of percentages (%) of total initial investment
and operation costs of the glazing units according to
Isicam Klasik in Flat-1, Flat-2 and Flat-3……………….………………130
Table 37 A comparison of percentages (%) of total initial investment
and operation costs of the wall sections according to
the base section in Flat-1, Flat-2 and Flat-3………...……………………130
Table 38 A comparison of the energy efficiency and economy
efficiency of the investigated wall sections…………..………………….131
Table 39 Ranking by the total energy efficiency of the investigated wall
sections for all the three flats……………………………………………..132
Table 40 Ranking by the total economy efficiency of the investigated wall
sections for all the three flats……………………………………………..133
Table 41 Ranking by both the total energy efficiency and economy efficiency
of the investigated wall sections for all the three flats…………..……….134

xx
Table 42 A comparison of the energy efficiency and economy efficiency
of the investigated glazing units………………………………..………...135
Table 43 Ranking by the total energy efficiency of the investigated
glazing alternatives for all the three flats………………………….…......135
Table 44 Ranking by the total economic efficiency of the investigated
glazing alternatives for all the three flats……………………….………..135
Table 45 Ranking by both the total energy and economic efficiency
of the investigated glazing alternatives for all the three flats…………….136
Table 46 Different Construction System Under Investigation (BS EN ISO 6946)...191
Table 47 Different Insulation Materials Under Investigation (Uralita)…………….193
Table 48 Different Window Frames Under Investigation………………………….195
Table 49 Original External Wall System (Section Base Case)……………………..197
Table 50 HVAC Template (Design Builder)……………………………………….199
Table 51 Lighting Template (Design Builder)……………………………………..201
Table 52 Glazing Template (Design Builder) – Part-1…………………………….203
Table 52 (Continued) Glazing Template (Design Builder) – Part-2……………….204
Table 53 Proposed External Wall System (Section 1A, 1B, 1C and 1D)………….205
Table 54 Proposed External Wall System (Sections 2A, 2B, 2C and 2D)…………207
Table 55 Proposed External Wall System (Sections 3A, 3B, 3C and 3D)…………209
Table 56 Original Flat Roof System………………………………………………..211
Table 57 Original and Proposed Pitched Roof System…………………………….213
Table 58 Original and Proposed Internal Partition System………………………...215
Table 59 Original Semi-Exposed Wall System (Base Case)……………………….217
Table 60 Proposed Semi-Exposed Wall System (Sections 1A, 1B, 1C and 1D)…..219
Table 61 Proposed Semi-Exposed Wall System (Sections 2A, 2B, 2C and 2D)…..221
Table 62 Proposed Semi-Exposed Wall System (Sections 3A, 3B, 3C and 3D)…..223
Table 63 Original and Proposed Semi-Exposed Ceiling System…………………..225
Table 64 Original and Proposed Semi-Exposed Floor System…………………….227
Table 65 Original and Proposed Ground Floor System……………………………229
Table 66 Original and Proposed External Floor System…………………………...231
Table 67 Original and Proposed Internal Floor System……………………………233

xxi
Table 68 Original Sub-Surfaces Wall System (Base Case)………………………...235
Table 69 Original and Proposed Sub-Surfaces Internal Wall System……………...237
Table 70 Original and Proposed Sub-Surfaces Roof System………………………239
Table 71 Proposed Sub-Surfaces Wall System (Sections 1A, 1B, 1C and 1D)……241
Table 72 Proposed Sub-Surfaces Wall System (Sections 2A, 2B, 2C and 2D)……243
Table 73 Proposed Sub-Surfaces Wall System (Sections 3A, 3B, 3C and 3D)……245
Table 74 Original and Proposed Sub-Surfaces External and Internal Door
Systems…………………………………………………………………...247
Table 75 Original and Proposed Internal Thermal Mass Systems…………………249
Table 76 Component Blocks Shading and Reflection Systems……………………251
Table 77 Air Tightness……………………………………………………………..253
Table 78 Window Opening System………………………………………………..255
Table 79 Door Opening System……………………………………………………257
Table 80 Interior Window System…………………………………………………259
Table 81 Roof Window / Skylight System…………………………………………261
Table 82 Vent Opening System…………………………………………………….263
Table 83 Flat-1 Occupancy Schedule………………………………………………265
Table 84 Flat-2 Occupancy Schedule………………………………………………266
Table 85 Flat-3 Occupancy Schedule……………………………………………....266
Table 86 Production Units Per Mason According to Block Weight……………….267
Table 87 Type of Concrete Blocks, Dimensions, Prices and Production Days in
Turkish Liras……………………………………………………………..269
Table 88 Skilled Technical Staff (Masons) Average Monthly Pay………………..271
Table 89 The Masons Salary For the Construction of the Building Envelope
for One Floor Including Flats 1, 2 and 3…………………………………273
Table 90 The energy consumption through the glazing units in the flat-1…………275
Table 91 The energy consumption through the glazing units in the flat-2…………275
Table 92 The energy consumption through the glazing units in the flat-3…………275
Table 93 The energy consumption through the Wall Sections in the Flat-1……….277
Table 94 The energy consumption through the Wall Sections in the Flat-2……….278
Table 95 The energy consumption through the Wall Sections in the Flat-3……….278

xxii
Table 96 The heat losses (kWh) through the three window options in Flat-1
obtained from the simulation results according to windows types………279
Table 97 The heat losses (kWh) through the three window options in Flat-2
obtained from the simulation results according to windows types………279
Table 98 The heat losses (kWh) through the three window options in Flat-3
obtained from the simulation results according to windows types………280
Table 99 The heat gains (kWh) through the three window options in Flat-1
obtained from the simulation results according to windows types………280
Table 100 The heat gains (kWh) through the three window options in Flat-2
obtained from the simulation results according to windows types……..280
Table 101 The heat gains (kWh) through the three window options in Flat-3
obtained from the simulation results according to windows types……..181
Table 102 The heat losses (kWh) through the wall sections of Flat-1……………..183
Table 103 The heat losses (kWh) through the wall sections of Flat-2……………..184
Table 104 The heat losses (kWh) through the wall sections of Flat-3……………..184
Table 105 The heat gains (kWh) through the wall sections in Flat-1……………...185
Table 106 The heat gains (kWh) through the wall sections in Flat-2……………...185
Table 107 The heat gains (kWh) through the wall sections in Flat-3……………...186
Table 108 The Monthly Heat Gains Transmitted Through the Three Glazing
Alternatives in Flat-1……………………………………………………187
Table 109 The Monthly Heat Gains Transmitted Through the Three Glazing
Alternatives in Flat-2……………………………………………………187
Table 110 The Monthly Heat Gains Transmitted Through the Three Glazing
Alternatives in Flat-3……………………………………………………187
Table 111 The Monthly Heat Load Production of The Heating System in Flat-1…189
Table 112 The Monthly Heat Load Production of The Heating System in Flat-2…190
Table 113 The Monthly Heat Load Production of The Heating System in Flat-3…190
Table 114 The image, dimensions, density, weight, block per cube, fire ratings of
a number of available hollow concrete masonry units
(http://www.superiorblockcorp.com), Last Accessed 12 / 12 /2013)……......309

xxiii
LIST OF FIGURES
FIGURES
Figure 1 Different factors influencing buildings (Persson, 2006).…………………….8
Figure 2 Yearly CO2 quantities in the atmosphere (Saydam, 2000)………………...10
Figure 3 Rates of energy use per sector in Turkey (2001) (Source: TÜBİTAK,
2003); (Yıldız, 2008) (MTOE = Tonne of oil equivalent)………………….12
Figure 4 Estimated rates of energy use per sector in Turkey (2010) (Source:
TÜBİTAK, 2003); (Yıldız, 2008) (MTOE = Tonne of oil equivalent).…...12
Figure 5 Orientation (http://www.ecowho.com, Last Accessed 04 / 01 / 2014)…….18
Figure 6 ASHRAE comfort zone (ASHRAE Handbook, 1997)…………………….22
Figure 7 Factors that influence the building envelope design
(Oral et. al., 2004)…………………………………………………………..26
Figure 8 Thermal Mass (http://www.britishprecast.org,
Last Accessed 26 / 04 / 2014)………………………………………………28
Figure 9 Different factors related windows (Persson, 2006)………………………...33
Figure 10 Typical features of windows (http://www.wbdg.org,
Last Accessed 18 / 11 / 2013)……………………………………………..41
Figure 11 Different Tints (http://www.wbdg.org, Last Accessed 18 / 11 / 2013)…..44
Figure 12 Energy Distribution for Double Glazing Clear Glass
(http://www.commercialwindows.org, Last Accessed 10 / 11 / 2013)…...46
Figure 13 Energy Distribution for Double Clear Glass with Low-e coating
(http://www.cl-windows-doors.com/glazing,
Last Accessed 10 / 11 / 2013)……………………………………………..….47
Figure 14 Energy distribution for Triple Clear Glass (http://www.bettaglaze.co.uk,
Last Accessed 11 / 11 / 2013)…………………………………………….49
Figure 15 Energy distribution for Triple Clear Glass with Low-e Coating
(http://www.greenspec.co.uk, Last Accessed 13 / 11 / 2013)…………….50
Figure 16 Hollow Concrete Blocks (Ramachandran, 2013)………………………...54

xxiv
Figure 17 Aerated Autoclaved Concrete (Aroni et. al., 1993)
(www.akg-gazbeton.com, Last Accessed 05 / 03 / 2014)………………...57
Figure 18 Aerated Autoclaved Concrete - close-up view (Aroni et. al, 1993)………57
Figure 19 Thermal regions of 81 cities for Turkey (Ankara being numbered as
city 6 in region 3) (TS 825 Standard)……………………………………..60
Figure 20 Thermal Transmittance requirements according to (TS 825 Standard)…..61
Figure 21 Classification of the most used insulating materials
(Papadopoulos, 2005)………………………………………………...66
Figure 22 The thermal transmittance of several common insulation materials
with five centimeter thicknesses compared to the thermal
transmittance of a concrete block (Al-Homoud, 2004).…………………..67
Figure 23 Percentage consumption of insulation materials in Europe and Turkey
(Society of Polystyrene Manufacturers, 2003)……………………………68
Figure 24 İzocam Cephepan or Façade insulation (http://www.izocam.com.tr,
Last Accessed 15 / 03 / 2014)……………………….…………………….69
Figure 25 İzocam Wall Board or Mid-wall insulation
(http://www.izocam.com.tr, Last Accessed 15 / 03 / 2014)……………....70
Figure 26 İzocam Optimum Wall or Interior insulation
(http://www.izocam.com.tr, Last Accessed 15 / 03 / 2014)………………70
Figure 27 Apartment photograph (14 / 11 / 2013)…………………………………..75
Figure 28 Apartment first floor plan (Keçiören Municipality)……………………...76
Figure 29 Project section details (Keçiören Municipality)…………………………..77
Figure 30 Flat-1 South-Western perspective (Design Builder)……………………...78
Figure 31 Flat-1 Interior zone details (Design Builder)……………………………..78
Figure 32 Flat-2 South-Eastern perspective (Design Builder)………………………79
Figure 33 Flat-2 Interior zone details (Design Builder)……………………………..79
Figure 34 Flat-3 Northern Eastern perspective (Design Builder)…………………...80
Figure 35 Flat-3 Interior zone details (Design Builder)……………………………..80
Figure 36 Aerated Autoclaved Concrete Blocks for four different Wall
System Sections and The Base Case Section……………………………..84

xxv
Figure 37 Hollow Heavyweight Concrete Blocks for four different Wall
System Sections and The Base Case Section……………………………..85
Figure 38 Hollow Lightweight Concrete Blocks for four different Wall
System Sections and The Base Case Section……………………………..86
Figure 39 Monthly temperature range within Ankara according
to Climate Consultant………………………………………………….....89
Figure 40 Monthly heat gains through the three window glazing alternatives
in the investigated flat-1, flat-2, flat-3 kWh……………………………..96
Figure 41 Monthly heat load production by the heating system for some
Wall Sections in the investigated flat-1 kWh……………………………100
Figure 42 Monthly heat load production by the heating system for some
Wall Sections in the investigated flat-2 kWh……………………………101
Figure 43 Monthly heat load production by the heating system for some
Wall Sections in the investigated flat-3 kWh……………………………102
Figure 44 Yearly heating gains through the three window glazing alternatives
in the investigated flat-1, flat-2 and flat-3- kWh/y……………………..103
Figure 45 Yearly heating load production of the Wall Sections- Base, 1A, 1B,
1C, 1D, 2A, 2B, 2C, 2D, 3A, 3B, 3C, 3D units in flat-1, kWh / year…..104
Figure 46 Yearly heating load production of the Wall Sections- Base, 1A, 1B,
1C, 1D, 2A, 2B, 2C, 2D, 3A, 3B, 3C, 3D units in flat-2, kWh / year…..105
Figure 47 Yearly heating load production of the Wall Sections- Base, 1A, 1B,
1C, 1D, 2A, 2B, 2C, 2D, 3A, 3B, 3C, 3D units in flat-3, kWh / year…..106
Figure 48 Heat losses (%) through the three window glazing alternatives
in flat-1, flat-2 and flat-3 obtained from the simulation results…………107
Figure 49 Heat gains (%) through the three window glazing alternatives
in flat-1, flat-2 and flat-3 obtained from the simulation results…………109
Figure 50 Heat losses (%) through all the Wall System Sections in flat-1
obtained from the simulation results…………………………………….110
Figure 51 Heat losses (%) through all the Wall System Sections in flat-2
obtained from the simulation results…………………………………….111

xxvi
Figure 52 Heat losses (%) through all the Wall System Sections in flat-3
obtained from the simulation results…………………………………….113
Figure 53 The summation of initial investment and operation costs of the
Investigated three window glazing units in Flat-1, Flat-2, Flat-3 (TL)…123
Figure 54 Total initial investment and operation costs of the investigated
the wall sections Base, 1A, 1B, 1C, 1D, 2A, 2B, 2C, 2D, 3A, 3B,
3C, 3D in Flat-1 (TL)……………………………………………………127
Figure 55 Total initial investment and operation costs of the investigated
the wall sections Base, 1A, 1B, 1C, 1D, 2A, 2B, 2C, 2D, 3A, 3B,
3C, 3D in Flat-2 (TL)…………………………………………………...128
Figure 56 Total initial investment and operation costs of the investigated
the wall sections Base, 1A, 1B, 1C, 1D, 2A, 2B, 2C, 2D, 3A, 3B,
3C, 3D in Flat-3 (TL)……………………………………………………129
Figure 57 Heat losses (%) through the three window glazing options in flat-1
obtained from the simulation results…………………………………….293
Figure 58 Heat losses (%) through the three window glazing options in flat-2
obtained from the simulation results…………………………………….294
Figure 59 Heat losses (%) through the three window glazing options in flat-3
obtained from the simulation results…………………………………….295
Figure 60 Heat Gains (%) through the three window glazing options in flat-1
obtained from the simulation results…………………………………….296
Figure 61 Heat Gains (%) through the three window glazing options in flat-2
obtained from the simulation results…………………………………….297
Figure 62 Heat Gains (%) through the three window glazing options in flat-3
obtained from the simulation results…………………………………….298
Figure 63 Heat losses (%) through the Wall Sections Base and 1A in flat-1
obtained from the simulation results…………………………………….299
Figure 64 Heat losses (%) through the Wall Sections 1B, 1C, 1D, 2A, 2B,
2C, 2D in flat-1 obtained from the simulation results…………………..300
Figure 65 Heat losses (%) through the Wall Sections 3A, 3B, 3C and 3D
in flat-1 obtained from the simulation results…………………….…….301

xxvii
Figure 66 Heat losses (%) through the Wall Sections Base and 1A in flat-2
obtained from the simulation results……………………………………302
Figure 67 Heat losses (%) through the Wall Sections 1B, 1C, 1D, 2A, 2B,
2C, 2D in flat-2 obtained from the simulation results……………...........303
Figure 68 Heat losses (%) through the Wall Sections 3A, 3B, 3C and 3D
in flat-2 obtained from the simulation results…………………………...304
Figure 69 Heat losses (%) through the Wall Sections Base and 1A in flat-3
obtained from the simulation results…………………………………….305
Figure 70 Heat losses (%) through the Wall Sections 1B, 1C, 1D, 2A, 2B,
2C, 2D in flat-3 obtained from the simulation results…………………...306
Figure 71 Heat losses (%) through the Wall Sections 3A, 3B, 3C and 3D
in flat-3 obtained from the simulation results…………...………………307
Figure 72 Dry Bulb Temperature and Relative Humidity Within Ankara
According to Climate Consultant………………………………………..315
Figure 73 Sun Shading Chart (December 21st to June 21
st) Within Ankara
According to Climate Consultant………………………………………..316
Figure 74 Sun Shading Chart (June 21st to December 21
st) Within Ankara
According to Climate Consultant………………………………………..317
Figure 75 Wind Wheel Within Ankara According to Climate Consultant………...317
Figure 76 Monthly heat load production by the heating system for all the
Wall Sections in the investigated flat-1 kWh…………...………………319
Figure 77 Monthly total heat loads produced by all the Wall Sections in
the investigated flat-2 kWh………………………………………..……320
Figure 78 Monthly total heat loads produced by all the Wall Sections in the
investigated flat-3 kWh…………………………………………………321

xxviii

1
CHAPTER 1
INTRODUCTION
The introduction part of this thesis puts forward the main arguments that are to be
investigated, followed by the aims and objectives set out in the thesis. In addition to
these, the procedure and methodology that is implemented is mentioned and finally
the disposition which describes the different chapters within the thesis is added.
1.1 Argument
In the past, much of the worldly energy was wasted especially in different buildings.
Thus, the introduction of new regulations by different countries regarding the energy
potential of construction systems became common in an attempt to control wasted
energy and conserving it as well as reducing the burning of energy resources that
may release pollutants in the form of CO2 that may harm the environment and
increase global warming.
Turkey is a developing country which has been influenced by little consideration to
energy conservation. Since Turkey imports a lot of the energy it consumes, the need
to save it has become an important issue. Therefore, importance was given to the
construction systems in terms of energy conservation by the release of new energy
related regulations that would help much in the reduction of the increasingly needed
energy usage throughout Turkey. Thus, both interior thermally suitable environment
and interior occupant thermal comfort could be achieved.
From all of Turkey, the City of Ankara has been selected for this thesis study
because it is the capital of Turkey and many improvements in construction had to be
done to modernize it and avoid the old habit of constructing inefficiently. At the
same time since dwellings of all types ranging from villas, dormitories and

2
apartments etc. are the most buildings in demand due to the rising population of
Ankara, dwellings have to be constructed in modern energy efficient ways.
In this thesis, the case study building is a typically newly constructed apartment
residential building, designed and built after energy efficiency regulations have been
issued. This apartment could be considered as a base case for all newly constructed
building.
By the study of the above mentioned apartment in the temperate cold dominated
climate of Ankara and the application of some proposed opaque and transparent
building envelope options, the most energy efficient alternatives would be
recommended.
1.2 Aim and Objective
The main aim of this thesis is to test several building envelope systems that would
influence the energy and the economic efficiency of the design. By means of a
summation of the initial investment and operation costs and a comparison of yearly
energy loads obtained with the usage of an energy oriented computer simulation
program, the performance of few window types as well as a number of different wall
systems will be tested.
Another aim is to investigate and compare the performance of the same three typical,
conventional and common window systems which are available in the market. They
represent different window glazing alternatives used throughout the years of glazing
technology performance. Ranging from a basic window glazing type with a relatively
high thermal transmittance of 2.715 W/m2.k which was chosen as the base case
alternative, to a window glazing type with a reasonably low thermal transmittance of
1.548 W/m2.k lower than the standard required minimum and finally a high
performance glazing window type with a thermal transmittance of 0.778 W/m2.k.

3
Included in this investigation are three different block materials namely Aerated
Autoclaved Concrete Blocks, Heavyweight Concrete Blocks and Lightweight
Concrete Blocks which have different characteristics of heat conductivity. This
property of the blocks influences the heat transfer through the total wall system
sections to be tested. The influence of this property on the interiors of the apartment
will be tested for all wall system sections under investigation with the results being
obtained from the simulation program Design Builder.
Another important aim is to test the absence of insulation in all the three different
block wall system sections to see its effect on the opaque building envelope and to
find out its importance in the cold climate of Ankara.
As an attempt to find alternative block materials to be used in wall system sections,
this thesis deals with the basic originally used wall system section and investigates
the efficiency of the three different construction wall systems namely Aerated
Autoclaved Concrete Blocks, Heavyweight Concrete Blocks and Lightweight
Concrete Blocks. Here, the important factor which is to be investigated is the
distribution and location of the insulation layer. It is tested by either locating the
insulation to the outside of the exterior wall or sandwiched between block wall layers
or located inside the exterior wall. Studies have been implemented to decide which
location is the most efficient location. This thesis also attempts to clarify this issue by
means of understanding and comparing the simulation undertaken using the
computer program Design Builder.
In addition to the energy and economic efficiency performance investigation of the
three glazing window alternatives and the different wall system sections, an
orientation energy comparison of the first floor of three different flats-1, 2 and 3 that
face South-West, South-East and North respectively is investigated. The influence of
the solar energy caused by the prevailing sun from the morning to the evening
passing from dawn’s eastern sun to the mid-days southern sun through to the western
setting sun is analyzed from the results of the simulation.

4
According to these aims, the objectives are not only to reduce the release of
pollutants such as CO2 produced by the burning of fossil fuels used in heating the
interiors but also to reduce the energy spent by the mechanical equipment that is used
for heating during the winter in the temperate cold dominant climate of Ankara.
1.3 Procedure
Thanks to computer technology, energy performance of buildings could be simulated
before construction. This advantageous capability is something which was not easily
known in the past. By means of simulation of the location, climate and weather,
orientation, shape of the building, building materials with their material
specifications, windows with their different sizes and different specification, as well
as different wall configurations, architects and builders are able to simulate the
thermal performance of the building that is to be built. The main approach of this
thesis is to use a thermally oriented software named Design builder to study the
opaque and transparent parts of the building envelope. The main source of data for
this thesis is the digital “EPW file for Ankara City” which is the digital climatic
source typical to Ankara City.
Moreover, the benefits of this computer program are made use of in this thesis to
investigate different alternatives of the opaque and transparent components of the
building envelope namely three different glazing window types and different wall
system types. They are analyzed in terms of both energy and economy efficiency. As
a result, the most energy and economic efficient alternatives are selected and the best
alternatives are recommended for usage in the market.
1.4 Disposition
The thesis consists of five chapters whose contents are described as documented in
the following paragraphs:

5
Chapter-1 includes the introduction of the thesis. It states the argument, the aim and
objectives, the procedure of thesis as well as the disposition of the various chapters
being consequently mentioned.
Chapter 2 constitutes of a literature survey covering the thesis’ main issues. Some
information regarding both energy conservation and consumption are mentioned.
Then information about global warming and the Kyoto protocol are mentioned
followed by some statistics about Turkey. Then details about passive design
principles, orientation and ventilation are noted followed by information regarding
the building envelope and some of related characteristics that influence it are
mentioned next including thermal comfort. Important details about windows and
related characteristics, followed by information regarding different glazing types and
window frames are mentioned. Next, information regarding masonry concrete blocks
and autoclaved aerated concrete blocks are considered followed by details about
plasters and renders, as well as the important topic of insulation. Then details
regarding glass wool insulation are given followed by information regarding building
energy simulation. The final part related to the main topic of this thesis in chapter 2
are details regarding the life cycle cost analysis, initial investment and operation cost.
Chapter 3 discusses the material, Ankara climate and methodology followed in the
thesis. First of all, a photograph of case study apartment is given. The typical first
floor plan is documented together with a partial section indicating the important
specifications of the building followed by the procedure. Here, the window and wall
specifications under investigation are tabulated. The second part includes
information of Ankara climate obtained from Climate Consultant program. And
finally the methodology and method of simulation is mentioned and clarified.
Chapter 4 deals with the results obtained after the computer simulations. The
resulting data from the graphs and tables of the simulation are obtained first of all
then they would be analyzed and discussed.

6
Chapter 5 compares and discusses the proposed energy and economic efficiency
which was dealt in the investigation of the building envelope together with
conclusions related to the results gathered.

7
CHAPTER 2
LITERATURE SURVEY
The literature survey of this thesis mentions the topics of energy conservation and
consumption, with additional information regarding global warming and the Kyoto
Protocol and its importance in reducing CO2 pollution in the world. Energy
conservation important statistics from the other parts of the world and Turkey are
also mentioned followed by information regarding passive design principles,
orientation, ventilation and thermal comfort. Then, the building envelope’s opaque
and transparent components such as windows and wall components with their
influential characteristics such the thermal transmittance are mentioned. Glazing
types, window frames, masonry walls including AAC, heavyweight concrete blocks
and lightweight concrete blocks details are given. Finally, information about
insulation, thermal simulation, life cycle cost analysis and initial investment and
operation costs are added.
2.1 Energy Conservation and Consumption
Those factors affecting the performance of buildings are shown in figure 1 below.
The main necessary functions of buildings are to provide both shelter and safety.
Moreover, a building should also provide electricity for lighting and electrical
appliances, provide interior heating and cooling, provide fresh air by means of
ventilation as well as fulfilling the occupant’s water requirements. Other functions
such as design and exterior aesthetics are also important. Furthermore, the effect of
surrounding trees and other buildings in the energy outcomes and shading the
building are also significant. Besides all these factors, the climate plays a major role
in influencing the total yearly energy calculations of buildings and in this thesis
dwellings, are given the main importance (Persson, 2006).

8
There are many different types of residential buildings. The main types are listed
namely as detached and semi-detached houses, terraced houses as well as apartment
block houses. In temperate cold climates, such as in Ankara, heating requirements
are more than cooling requirements in residential buildings and proper windows that
allow solar gains but also prevent heat loss are recommended. Since people spend
most of their time within these buildings, it is a necessity to make them comfortable
and healthy. Here, the most important energy components are the occupants, the
heating system, the ventilating system, the building envelope’s thermal insulation,
walls and windows (Persson, 2006).
Figure 1 Different factors influencing buildings (Persson, 2006).
In terms of energy, designing a building efficiently at the start could be beneficial
along its life span. For example, the usage of suitable thermal insulation saves
reasonable amounts of energy in addition to the avoidance of thermal bridges over
the life span of the building. In addition, an efficient ventilation system with an
exhaust heat recovery system as well as the application of energy efficient windows
could replace the usage of a supporting separate heating system (Persson, 2006).

9
Applying proper window glazing systems to buildings, interior thermal comfort
could be achieved by reducing energy consumption. Moreover, much energy is
necessary to maintain comfortable indoor temperatures (Omer, 2008); (Jindal et al.,
2013).
Energy conservation depends on several parameters namely location on earth,
orientation of the building, building shape, thermo-physical and optical features of
the building envelope, size of the building, accommodation type whether residential
or commercial, the distance between buildings as well as the natural ventilation
arrangement (Berköz et al., 1995); (Bostancıoğlu and Telatar, 2013).
The facts that more people will live in smaller houses and the population number will
rise, both will lead to the construction of new power plants to satisfy their energy
needs. A rising fact is the need of designing more sustainable and eco-friendly
houses and buildings. Therefore, starting immediately from today the need to reduce
energy consumption is important not only for future house designs but also for the
retrofitting of existing ones (Atikol et al., 2008).
2.1.1 Global Warming
The major harm to the environment is the global warming or the greenhouse effect
that releases CO2, C, CFCs, halons, N2O, ozone and peroxyacetylnitrate to the
atmosphere, in an increasing manner. As a result, these gases, lead to the trapping of
heat radiated from the earth’s surface, thus increasing the earth’s temperature. For
example the earth’s surface temperature was raised by a value of 0.6°C within the
period of the last hundred years with the result of an increase of 20 cm to the sea
levels. These changes have negative influences such as the release of CO2 that result
to 50% of the greenhouse effect (Dincer and Rosen, 1999); (Dincer, 1999); (Çomaklı
and Yüksel, 2004). Figure 2 shows the increasing of CO2 concentration since
industrial revolution (Saydam, 2000); (Çomaklı and Yüksel, 2004).

10
In addition to the above, the spreading of deserts, the land erosion, the sea pollution,
the loss of animal and plant species as well as general destruction of soils are other
harmful effects to the environment.
Figure 2 Yearly CO2 quantities in the atmosphere (Saydam, 2000).
2.1.2 Kyoto Protocol
Due to fast depletion of fuel energy resources and the pollution they cause, the
control and management of energy consumption should be given great importance.
Some aims agreed upon at the Kyoto Protocol were to reduce energy consumption by
20%, reduce carbon emissions by 20% as well as to make sure that 20% of the total
energy production is consumed from renewable energy resources by the year 2020 as
compared to the values agreed upon in 1990 (Calis, 2009); (Bostancıoğlu and
Telatar, 2013).
In buildings, the conserving of energy is very important in improving their thermal
performance. Based on the agreements decided after the Kyoto protocol,
governments around the world acted consequently and tried to reduce greenhouse gas
11
emissions by applying energy saving policies to decrease energy usage in their
countries.
2.1.3 Statistics in Turkey
With the increase of technology, industry, energy, construction and population
numbers, consumption has increased significantly relative to production. For
example, in the USA which amounts to 5% of the world’s population, citizens spend
approximately 80,000 kWh in energy per person per year, while in the UK citizens
spend around 45,800 kWh in energy per person per year. When comparing these
values to Europe, an amount of 36,400 kWh per person per year is registered
(Wiggington and Harris, 2002); (Maçka and Yalçın, 2011). In Turkey, it was
recorded that 66% of the total consumed energy was imported in 2000, with the
expectations that this value would increase to 77% by 2020. This importation not
only influences the economy but also affects significant phenomenon such as global
warming, environmental pollutions as well as the ever increasing energy costs
(Turkish Republic Ministry of Foreign-Trade Counselorship, 2009) (Maçka and
Yalçın, 2011).
The population of Turkey is estimated to surpass 100 million by 2020 (Bolattürk,
2006). In Turkey, resources such as hard coal, lignite, asphaltite, petroleum, natural
gas, hydroelectric energy and geothermal energy are produced, however since little
amounts of these native resources are utilized almost 52% of the energy required in
Turkey to satisfy its needs is imported (Bolattürk, 2006).
Table 1 Distribution of the expected energy usage within the different fields against
the years in % (WEC-TNC, 1995); (Bolattürk, 2006).
Year Industry Buildings Transportation Agriculture Other
1995 35.80 34.41 21.32 5.49 2.98
1999 38.96 33.75 19.82 5.11 2.36
2003 42.24 31.44 19.22 5.08 2.02
2007 45.47 29.25 18.55 4.99 1.74

12
Figure 3 Rates of energy use per sector in Turkey (2001) (Source: TÜBİTAK, 2003);
(Yıldız, 2008); (MTOE = Ton of oil equivalent).
Energy is consumed by four major fields namely agriculture, transportation,
residential and industrial. Table 1 above, figure 3 above and figure 4 below shows
the division of the energy usage within the different fields for the period from 1995
to 2010 in percentages (WEC-TNC, 1995); (Bolattürk, 2006). From table 1 above, it
could be concluded that from all the sectors, the industrial field consumes the most
energy followed by the residential sector.
Figure 4 Estimated rates of energy use per sector in Turkey (2010) (Source:
TÜBİTAK, 2003); (Yıldız, 2008); (MTOE = Ton of oil equivalent).

13
From all the sectors mentioned in table 1, figure 3 and figure 4, residential buildings
consume a lot of energy in most countries. In Turkey, nearly 25-30% of the energy
expenditure is consumed in the residential building sector (Büyükalaca and Bulut,
2004). Therefore, energy efficient building design should be considered. In Turkey,
space heating accounts for approximately twice the energy used for water heating,
freezing food refrigeration and cooking within residents. Within buildings in Turkey,
almost 82% of the energy is used for heating. In a typical building the energy losses
are divided as follows: 40% through external walls, 30% through windows, 17%
through doors, 7% through the roof, and 6% through floors (Arıcı and Karabay,
2010). Therefore, the usage of thermal insulation within built structures saves energy
as well as reduces unwanted pollutants released by burning fossil fuels (Kaynaklı,
2008).
In many countries, the energy used for heating interiors consumes the most of the
energy expenditure. For example, space heating accounts for 40% of the entire
energy used in houses as could be seen in table 2 below (Çengel, 1998); (Bolattürk,
2006).
Table 2 Energy usage division within buildings in percentage (%) (Çengel, 1998);
(Bolattürk, 2006).
Space
heating
Water
heating
Air condition
ventilation
Lighting
illumination
Cooling
freezing
Other
Houses 40 17 7 7 12 17
Commercial 32 5 22 25 - 16
From table 2 above, it is concluded that the need for effective thermal protection is
very important in decreasing energy consumption that is used to heat interiors in the
residential sector. As mentioned earlier, the application of thermal insulation results
in the reduction in fuel consumption, unwanted pollutants emitted by burning fossil
fuels, as well as increasing thermal comfort obtained from the minimization of heat
losses from buildings (Bolattürk, 2006).

14
2.2 Passive Design Principles
The fundamental objective of interior environmental comfort in both winter and
summer as well as day and night is to know the energy efficient necessities of
architectural concepts. First of all, the local climatic conditions should be understood
whether temperate, hot or cold, dry or humid. Since in this study the concerned city
is Ankara (Turkey) which displays a temperate climate, the architectural design
should be compact so that as little heat energy as possible is lost to the exterior.
Moreover, the south facing façade should utilize maximum sun heat energy specially
since Ankara has a cold dominated climate which means that winter is more
dominant than summer. Mechanical heating is required during the winter while
natural ventilation is required during the summer. If this ventilation is not enough in
summer, then mechanical cooling could be a possible option.
As mentioned earlier, in Turkey 80% of the energy is used to provide interior
comfort (Kavak, 2005); (Bektaş et. al, 2008). This high percentage of energy usage is
due mostly to the existence of so many old buildings and the negligence of passive
design awareness that reduce energy consumption that otherwise cause the release of
pollutants due to the usage of high amounts of fossil fuels (Bektaş and Aksoy, 2005);
(Bektaş et. al, 2008). As a necessity, it is therefore required that energy consumption
should be reduced for countries like Turkey which imports much of the energy it
consumes. Even though Turkey possesses much solar energy, almost no buildings
use this passive solar technique to its advantage (Dilmaç and Kesen, 2003); (Bektaş
et. al, 2008).
In order to achieve interior comfort and to conserve energy, proper design of the
building envelope is a major factor. Passive heating conditions of the building
envelope influenced by the opaque components, for example walls, and transparent
components namely windows involves heat flow that changes indoor air and interior
surface temperatures (Oral, 2000).

15
A passive design is one in which the thermal energy flow occurs by natural means. In
other words, no external energy is needed for it to function. A part of passive design
is to minimize heat loss by using multiple-glazed windows, and energy efficient
insulation in the exterior and interior of walls, floors, roof and foundation. The
advantage of passive design over fuel using conventional design is that it is
nonpolluting, non-depleting of resources and even though costly in the beginning it
has a low operating cost in the long run. Proper original construction of the design
process together with its post occupancy operation are two important factors of
passive design. In such a construction, it is important that the building envelope is air
tight something which is achieved with sealed openings (Ogle and John, 1995).
The main factors that determine heat flow towards the interior of buildings are
external conditions namely temperature, wind speed and exposure to sun rays, the
area of exposure namely the building envelope and the heat transmission namely
through the building wall and window system (Ogle and John, 1995).
In addition, when designing buildings, the most important factor to consider is its
suitability to climate. An energy conscious designer must consider the local climate,
outside temperature, wind, humidity and insolation. After proper consideration of
climate analysis, the best choice of interior comfort conditions and the best strategies
to be applied in achieving comfort should be selected. In different regions, buildings
will have different shapes, materials, orientations and envelope characteristics (Hirst
et al., 1986).
Especially in cold climates, the design uses the sun energy to achieve thermal
comfort in winter. Most people prefer an indoor air temperature of between 18°C and
30°C and a range of relative humidity between 20% and 80%. Unwanted cold air
movements, uncontrolled cold or hot interior surfaces and average radiant
temperature conditions created by large glazing areas all affect comfort (ASHRAE
Handbook, 1997).

16
Passive design strategies give the designer means to achieve comfort and reduce
energy expenditure by the usage of natural methods. If not provided, mechanical
means for heating and cooling in winter and summer should be implemented, that
use fuel to achieve these comfort conditions (Krigger and Chris, 2009).
A large window glazing in the southern façade is beneficial for maximum
interception of maximum solar radiation in winter while during summer this sun
radiation may be reduced by means of curtains. Window location and size is the main
factor that influences the energy consumption of the building. Windows located
without consideration to sun light may be a source of heat loss or heat gain to the
building.
Heat loss through the window is usually the same whenever it is located. Therefore,
it is advantageous to locate windows where heat gain from sun radiation is more than
heat loss in winter, for example on the southern façade, southern-eastern façade and
southern-western façade (Mazria, 1979).
Wind flow around any building depends on its orientation, its relation with the
surrounding buildings, plan shape, its height when compared to surrounding
buildings, roughness of the terrain that direct wind towards it as well as the
architectural features that increase wind flow towards it such as cantilevers on the
façade.
Thermal mass with its potential of avoiding or reducing interior overheating has
received more attention lately. In the past, this potential of thermal mass was
minimally considered when used in passive solar design which works with the
building’s orientation, glazing type and size as well as the provision of shading.
Thermal mass is an important factor in passive design. The characteristic of thermal
mass allows dwellings constructed with concrete and masonry blocks to use their
passive solar qualities year round. During summer thermal mass construction helps

17
in absorbing and storing heat existing during the day, thus lowering the interior
temperatures and reducing interior overheating during the day. This stored heat may
be removed by natural or mechanical ventilation during the night. On the other hand,
during the winter the thermal mass absorbs the solar energy transmitted through the
walls in the south façade, and then slowly releasing the heat into the interior at night
thus maintaining warm spaces. The process of heat absorption and release occurring
during the winter is similar to that process in summer with the exception that during
the winter nights heat does not escape because the windows are kept closed.
2.2.1 Orientation
The importance of energy saving has increased with the increase of heating in
buildings, the cost spent in its production and the pollutants released by the fuels that
burn to achieve it. As a result, it is recommended that the building design parameters
used in saving energy should also reduce conventional energy usage. Both the
interior and exterior environmental conditions are related and affect one another. In
order to provide interiors which are climatically comfortable building parameters
namely the orientation of the building envelope, the building shape, and the
insulation together should be considered by the designer (Aksoy and Inalli, 2006).
According to a study by Mingfang in 2002, the best orientation for both winter and
summer is the southern one, since winter solar heat gain and summer solar heat
control could be achieved. In his study, the solar control in summer for different
geometrical shapes was investigated and the best shape that produces the optimum
solar control was a rectangular shape (Mingfang, 2002); (Aksoy and Inalli, 2006).
A study by Lin in 1981 indicated that the energy consumption within building is
dependent on the building shape. He found that in cold climates the larger the area of
the exterior facing surface of a building, the more energy is required for heating. As a
result, he concluded that the minimum exterior facing surfaces provided the optimum
energy expenditure in cold climates (Lin, 1981); (Aksoy and Inalli, 2006).

18
Since the sun rises in the east, the flat spaces under study benefit from the morning
sun in winter as shown in figure 5 below. In this eastern side, the morning and
afternoon sun heat passes through the envelope and windows, thus maintaining a
comfortable interior temperature in winter. During summer though, natural
ventilation removes this eastern heat by the allowance of air circulation by the
opening of interior windows and doors (Waterfield, 2007).
Figure 5 Orientation (http://www.ecowho.com, Last Accessed 04 / 01 / 2014).
The western facing architectural spaces only benefit when the evening sun’s heat
penetrates the western windows, doors and envelope. Thus, suitable comfort
temperatures in the air tight flat is maintained during the winter month and if this
comfort is not achieved, interiors could be heated by mechanical means
(Kachadorian, 1997).
In the northern side, where the least sun penetrates, a mechanical heating system
should be turned on during the winter and the windows should be used for light
allowance. During the summer, the windows of the northern facing flat and interior
doors are opened for the sake of natural ventilation and cooling to achieve interior
spaces comfort (Kachadorian, 1997).

19
2.2.2 Ventilation
Within buildings, ventilation occurs through openings such as windows or ventilators
by means of natural driving forces. By the effect of pressure distribution on the
building envelope as well as the location of the different windows in the interior, the
air flows. As the pressure distribution acts as the ventilation driving force, the
characteristics of the window openings account for the air flow resistance not
forgetting other factors (Rousseau and Mathews, 1996).
The factors that cause air flow within the interiors are the wind induced pressures on
the building envelope and also the pressures caused by differences in interior and
exterior air temperatures. Wind induced pressures are caused by the geometry of the
building, the wind speed, the orientation of the building with regard to the wind
direction as well as the surrounding environment (Rousseau and Mathews, 1996).
2.2.3 Thermal Comfort
Interior environment thermal comfort is the most important factor for occupants. To
achieve this much artificial energy for heating the interiors is necessary especially in
cold climates. Furthermore, to achieve interior thermal comfort and decrease heating
energy consumption parameters such as building form and building envelope should
be considered mutually at early design stages (Oral and Yılmaz, 2003).
The shape of the building as well as the thermal transmittance or overall heat transfer
coefficient (U-value) of the building envelope affect the loss of heat through it to
achieve interior thermal comfort and heating energy conservation (Oral and Yılmaz,
2002).
Provision for suitable interior temperatures and dwellers comfort should be
considered. Thermal comfort is achieved when the state of mind of the occupants is
satisfied within the thermal dwelled zone (ASHRAE, 1981); (Oral and Yılmaz,

20
2002). In cold climates, if thermal satisfaction is not achieved within the occupied
zones, then provision of artificial heat would be required. Since more energy is used
to fulfill this artificial heating, energy sources are depleting rapidly. Thus, energy
conservation has become a major subject in developing countries such as Turkey.
Energy consumption of buildings in the form of heating is a major issue in Turkey.
To decrease this form of energy consumption, a regulation was released, as shall be
discussed later, in April 1998 (TS 825, 1998); (Oral and Yılmaz, 2002). This
regulation recommended that architects construct buildings that maintain an upper
limit of yearly heat loss. Even though this new regulation was a significant step to
conserve energy, it is still insufficient in affecting design parameters to achieve
thermal comfort and total heating energy conservation (Oral and Yılmaz, 2002).
Climate comfort in interiors is the most important biological requirement for its
occupants and must be maintained in order for the users to be healthy and productive
(Manioğlu and Yılmaz, 2006).
An interior could be described as a passive system if comfort could be achieved
without the usage of mechanical means. However, for climates where there is
changeable diurnal climate, additional mechanical heating would be necessary for the
winter months of the year since designed passive systems would not be enough to
heat the interiors (Yılmaz, 1990); (Energy in architecture, 1994); (Manioğlu and
Yılmaz, 2006). In such a case where a mechanical heating system becomes
necessary, the energy load consumed would be related to the thermal behavior of
non-mechanical passive heating system represented by the building envelope. The
building envelope, which is the major parameter of this passive heating system, is
also the barrier between both the interior and exterior environments and is thus the
means through which heat flows into and out of interior. Therefore, the building
envelope not only determines the interior climatic environment but also the extra
energy released by additional mechanical system (Selamet, 1995); (ASHRAE, 1981);
(Manioğlu and Yılmaz, 2006).

21
Changeable diurnal climates cause intermittent heating system operation, leading to
different amounts of interior energy stored and released by the building envelope and
the different thermal behavior within the building (Lechner, 1991); (Manioğlu and
Yılmaz, 2006).
Thus, the quantity of additional energy is dependent on the thermo-physical
characteristics of the building envelope as well as the operation period of the heating
system. The builder who designs the dwelling should investigate and select the most
economical building envelope and operation period options according to the required
heating demand daily period. To achieve a minimum cost value from among the
different options, an economic analysis should be done and the most energy efficient
and economical alternative should be selected (Manioğlu and Yılmaz, 2006).
It is an important function for buildings to provide thermal and visual comfort
(Hunn, 1996); (Jaber and Ajib, 2011). The main aim of the designer is to design
buildings that would achieve interior thermal comfort throughout the entire period of
the year (Goulding et.al., 1992); (Jaber and Ajib, 2011). Moreover, windows play a
major role in achieving both psychological and environmental needs. Suitable
window glazing could produce low heating and cooling energy outputs, thus being an
important source that cause psychological benefits (Menzies and Wherrett, 2005);
(Jaber and Ajib, 2011).
Internationally, the aspect of interior thermal comfort is standardized according to
energy balance (static models), for example the ASHRAE standard. According to
this standard the temperature range within which comfort is achieved was between
20 and 27°C. Figure 6 below shows the winter and summer limits that must be
maintained in order to achieve thermally comfortable interior for the occupants.
The international ASHRAE standard is acceptable as a defining reference of the
thermal comfort zone worldwide (Hays et.al, 1995); (ASHRAE Handbook, 1997).

22
Figure 6 ASHRAE comfort zone (ASHRAE Handbook, 1997).
2.2.4 The Building Envelope
As mentioned earlier, there are several environmental factors within interiors that
determine thermal comfort namely temperature, air flow, lighting, noise and
humidity. In addition, the presence of the building envelope is to keep the interior
environment within acceptable limits (Hutcheon and Handegord, 1989); (Rivard
et.al., 1995). As a protective barrier, the building envelope may achieve thermal
comfort by means of energy efficiency, cost, durability, and other performance
criteria (Gowri, 1990). According to Hutcheon, 1963 a number of necessities
required to be fulfilled by the building envelope are proper heat flow, proper air flow
and proper sunlight and radiation as well as being economical.
These factors not only apply for walls but also for other parts of the building
envelope elements such as roofs and window openings. To obtain energy efficient

23
performance and quality, the above mentioned necessities have to be treated and
designed holistically during the early stages. Since they are all inter related such
efficient design is a complex task (Gowri, 1990).
The building envelope includes four subsystems namely; the roof, the windows, the
walls, floors and contact to ground. These subsystems are made of many components
and different materials with different characteristics (Krigger and Chris, 2009)
Buildings that control energy loss during winter as well as reduce energy gain during
summer are the most ideal in reducing heating and cooling needs. To achieve energy
efficiency in a new building the plan, design and construction should be energy
efficient. For residential buildings, energy loss and gain through the exterior
envelope are the most important energy occurrences (Krigger and Chris, 2009).
The more the temperature differences between the interiors and exteriors, the more is
the expectancy from the building envelope in achieving the necessary degree of
comfort. Thus the need to select the proper building envelope components is
required. To achieve this, the following should be included:
1) Insulation to controls heat flow,
2) Glazings that permit light and view but at the same time also control heat
flow between the exterior and the interior,
According to a study by Balcomb in 1978, the suitable glazing area used in south
facing walls as well as proper thermal insulation applied to the wall and roof
components were used to maintain a building thermally comfortable by comparing
the direct solar gain concept through the south facing windows. He combined
thermal insulation and thermal mass in the south wall and evaluated solar energy
gain during the day time as well as the night time (Balcomb, 1978); (Jindal et al.,
2013).

24
A number of studies by several authors Persson et. al. in 2006, Nielsen et. al. in
2000, and Sujoy et. al., in 2009 have investigated extensively the energy
performance of glazings and windows while considering various parameters like
window size, the thermal transmittance (U-value) and total solar energy
transmittance (g-value) etc. of the building envelope (Persson et al. 2006); (Nielsen
et. al., 2000); (Sujoy et al., 2009); (Jindal et al., 2013)
Several studies by Çomaklı and Yüksel in 2003, Şişman et al. in 2007 and Mahlia et
al. in 2007 investigated the effect of the thickness of insulation on the external
surface of walls and roof for energy saving (Çomaklı and Yüksel, 2003); (Şişman et
al., 2007); (Mahlia et al., 2007); (Jindal et al., 2013).
Since much of the world’s energy is used in the building sector resulting in
greenhouse gas emissions, an increase in the demand to achieve energy efficiency of
buildings is also necessary. Thus concepts such as passive houses and zero emission
buildings were introduced. As mentioned earlier, an important part of the
achievement of building energy efficiency is thermal insulation. In addition to old
insulation materials, new thermal insulation materials with lower thermal
conductivities and increasing thicknesses that could be installed within the building
envelope are increasingly being created. On the other hand, thicker walls are not
recommended since they are economically costly, wasting useful interior area,
increasing transport quantities, requiring architectural regulations and other
disadvantageous architectural limitations, causing unnecessary waste of materials as
well as causing change in already followed construction techniques (Jelle, 2011).
The economy of the building envelope in term of cost may be divided into three
ways during the different periods of the design and construction. They include:
1) The initial capital investment construction costs for the design, manufacturing
and construction stage,

25
2) The usage costs including the annual energy expenditure costs,
3) The maintenance costs which include cleaning, repairing of the window
glazing and the other envelope parts during their usage life. This also includes
their replacement costs after the usage life have expired.
Air temperature is usually the most important factor determining comfort. Outdoor
temperature changes depending on the season, the climate and the time of day. If the
building envelope is not air tight, heat is lost in winter and gained in summer.
Heating and cooling systems create comfort by adding or subtracting heat (Hirst et
al., 1986).
The building envelope leaks at edges, corners, openings and joints between the
building materials. In addition, thermal energy leaks also occur through insulation,
mechanical and electrical components which form the main defects of the building
envelope. Heat flows through the building envelope by two means namely
transmission and air leakage. Both occur through floors, exterior walls, windows and
exterior doors (Hirst et al., 1986).
When compared to other building envelope components, windows have a major
impact on comfort due to their low resistance and high solar transmittance compared
to other building envelope components. By means of radiation windows cause
sensitive human bodies and interiors to heat during the winter in cold climates.
On the other hand, during winter cold air is collected in the interior of the cold
window glazing leading this air to move downwards resulting to cool convective
currents. Further, air leakage adds to the energy problem losses or gains of the
windows. In summer heat through windows heats the interiors leading to increase of
interior temperatures and thus causing discomfort (Hirst et al., 1986).

26
The rate of heat flow or thermal conductivity of a material depends on the materials
molecules to send and receive heat. Glass is a good conductor of heat. Insulation
materials such as air or gases (argon), with tiny air gaps, are poor heat conductors.
Not all materials absorb thermal radiation. They may reflect or transmit it. This
ability of reflectance and transmittance depend on the composition of the surface.
Glass allows visible solar radiation while absorbing thermal (infrared long
wavelength radiation) that it intercepts when special provisions such as low-e
coatings are applied (Mazria, 1979).
The building envelope should be designed to provide for several characteristics
namely environmental, technological, socio-cultural, functional and aesthetical as
shown in the figure 7 below. When considering the environmental factors namely
heat, light, and sound the thermal, visual and acoustical parameters are accounted
for. The thermal parameter is concerned with the control of the interior and exterior
climatic conditions, while the visual parameter is concerned with ability to see the
exterior and allow light. As for the acoustical parameter the concern is to maintain a
quieter interior (Oral et. al., 2004).
Figure 7 Factors that influence the building envelope design (Oral et. al., 2004).

27
Part of the physical environmental characteristic is thermal transmittance which may
be defined as the heat flow over a period of time through a unit surface area once the
difference in temperature between the two concerned surfaces is one degrees Kelvin.
It is the reciprocal of the total resistances of all the components of the material
concerned as well as the interior and exterior air film resistances. Thermal
transmittance is also known as the overall Heat Transfer Coefficient, U-value with
the units W/m2-K (Btu/h-ft2-F) (Al-Homoud, 2005).
Specific heat is the quantity stating the amount of heating energy needed to add to
the temperature of a certain mass of any substance by a known amount. The lower
the specific heat of a material, the faster it heats up and the faster it cools down. On
the other hand, the higher the specific heat of a material, the slower it heats up and
the slower it cools down. In cold climates, materials with high specific heat values
are better because during the day heat is absorbed slowly thus maintaining a warmer
interior until late hours of the day when the material cools slowly. Insulation
materials have high specific heat values (Hirst et al, 1986).
The true density may be defined as the ratio of a mass of a material to the volume
occupied by this same mass. Moreover, the factors that density depends on are
temperature and pressure. An increase in pressure of a substance decreases its
volume and thus increases its density. An increase in temperature of a substance
(with a few exceptions) decreases its density by increasing its volume. The lower the
density of a construction material, the lower is its thermal conductivity because of
higher distance between molecules that transfer the energy, thus the material is
characterized as an insulation material. Thus, the good insulation material namely
Expanded polystyrene (EPS) has a low density (Lowell, 1991).
Thermal mass is used because of its importance in both winter and summer. In
winter, when the thermal energy stored by a wall system during the sunny daylight
hours is released towards the interior during the late hours of the day or night, energy
for heating is reduced. During the sunny daylight hours of the summer, heat is stored
by the wall system with thermal mass characteristic leading to a time lag or heat

28
transfer delay until late hours of the day or night as shown in figure 8 below (Hall,
2010).
For example, heavyweight concrete masonry block, with its higher density and
higher heat capacity, have a higher thermal mass when compared to lightweight
concrete masonry blocks. This influences their behavior in summer and winter. In
summer the choice of heavyweight concrete masonry results in cooler interiors
during the day when compared to light weight concrete. Excess heat may be removed
by means of either natural or mechanical ventilation (ASHRAE 90.1.American
Society of Heating, Refrigerating and Air-Conditioning Engineers, Inc., 2004 &
2007).
Figure 8 Thermal Mass (http://www.britishprecast.org,Last Accessed 26 / 04 / 2014).
The denser the material, the less air is trapped and thus the higher is its thermal mass.
As such concrete has a high thermal mass when compared to Autoclaved Aerated
Concrete (AAC) which has moderate to low thermal mass and a low insulation value
as shown in table 3 below (Baggs and Mortensen, 2006).
29
Table 3 Thermal mass for various materials (Baggs and Mortensen, 2006).
Material Thermal Mass
Concrete 2060
Autoclaved aerated concrete 550
Thermal mass also has a significant influence during the night when the outdoor
temperatures are lower than the interior temperatures especially in summer. Here the
interiors may be cooled by means of natural night ventilation. Moreover, this
ventilation helps in removing the convective heat from the mass elements.
Another means of removing convective heat during the night may be the usage of
ceiling fans. The implementation of ceiling fans is useful in adding to the interior air
circulation and also increasing the convective heat transfer coefficient which helps in
the reduction of the heat collected by massive walls at night (Baer, 1983); (Balaras,
1996). Another function of the building envelope in cold climates is to maintain high
thermal transmittance at night and low thermal transmittance during the day.
Together both ventilation and thermal mass act as a passive cooling system that may
be utilized to preserve the interior environment thus maintaining interior thermal
comfort as well as providing acceptable indoor air quality (IAQ). Ventilation has
three functions namely to improve indoor air quality, to provide interior occupant
cooling and finally to cool the thermal mass of the building (La Roche and Milne,
2004) (Zhou et al., 2008). The last function of ventilation works by the heat storage
of interior and exterior mass during the day’s hot duration and it’s release later in the
day (Yam and Zheng, 2003); (Zhou et al., 2008). Moreover, natural ventilation is a
good method to remove interior air pollutants and provide an acceptable indoor air
quality. As a result, collectively ventilation and thermal mass could lower capital,
operational, and maintenance costs, obtain a sustainable building and improve the
indoor air quality (Zhou et al., 2008).
30
The optical and thermo-physical characteristics of the building envelope also affect
the passive heating function of its elements namely the opaque (walls) and
transparent (windows) components. Optical properties are:
1) Absorptivity which is the ability of the building envelope to absorb
heat,
2) Transmissivity which is the ability of the window to transmit heat. It
is not valid for opaque components, and
3) Reflectivity which is the ability of the building envelope to reflect
heat.
The thermo-physical properties are:
1) Overall heat transfer coefficient or thermal transmittance (U value),
2) Transparency ratio (TR), (TR = window area / facade area).
To achieve thermal comfort by using minimum additional mechanical heating
energy, architects should design the building envelope in such a way so as to have
the suitable thermo-physical properties (Overall heat transfer coefficient or thermal
transmittance) for the local climate. Under these passive heating design conditions of
the opaque and transparent components of the building envelope, interior air and
surface temperatures change with the change of heat flow. The change of heat flow is
therefore the function of the thermo-physical characteristics of the opaque and
transparent components of the building envelope, and thus these characteristics
determine the interior climate as well as additional mechanical heating energy. Put in
another way these thermo-physical characteristics affect the heating load within the
immediate space. Moreover, when the mechanical heating or cooling remains
switched off, hourly change in interior air temperature becomes relative to the solar
energy gain through the window. In addition, the surface temperature of the glazing
which has different qualities when compared to the other building envelope surfaces
has a major influence on the interior thermal comfort. Therefore, the optical and the

31
thermo-physical characteristics of different windows have a major influence on the
interior thermal comfort as well as the supplementary mechanical heating or cooling
(Yılmaz, 1987); (Oral, 2000).
At the section of the exterior wall of the building envelope different temperature
profiles occur during any instant of a 1-day period. These temperature profiles
depend on the interior temperature, the exterior temperature and the thermo-physical
properties of the wall. During the 1-day period the outside temperature changes
periodically causing new different temperature profiles at any moment of time during
the day. During this transient procedure, a heat wave flows through the wall from the
exterior to the interior. Here the amplitude of the heat wave indicates the temperature
values, while the wavelength of the heat wave indicates the time that these
temperatures occur. The amplitude of the heat wave at the exterior surface of the wall
has a value of solar radiation and convection occurring in between the exterior wall
surface and the exterior air. During the transmission of the heat wave through the
wall, its amplitude decreases according to the thermo-physical characteristics of the
wall materials. This amplitude continues to have a lower value as it passes through
the wall when compared to its value in the exterior surface. The time the heat wave
takes to cross through from the exterior surface to the interior surface is called the
“time lag” while the decreasing ratio in the value of the amplitude during this process
is called the “decrement factor” (Duffin, 1984). Time lag and decrement factors are
significant properties in the determination of the heat storage capabilities of any
material. Different time lag and decrement values could be obtained with different
thicknesses of wall materials and their thermo-physical properties (Asan, 2000). The
heat storage in wall structures may be explained by two characteristics namely time
lag and decrement factor.
“Temperature profiles on the wall exposed to periodic solar radiation and
varying outdoor air temperature are assumed to be propagated as
sinusoidal waves. When a sinusoidal temperature is propagated through
the wall from outdoor surface to indoor surface, its amplitude
gradually decreases in a manner that depends on the thermo-physical
properties of the wall materials.” (Özel and Pıhtılı, 2007).

32
In buildings, the effect of thermal mass must be considered when located in the four
different façades to achieve the desirable time lag (Lechner, 1991); (Balaras, 1996).
For example, in cold climates it is important to mention that both the North and East
orientations could perform without the need for time lag since immediate heat energy
is required to be transmitted to the interior. However, for both the South and West
façades a time lag of eight hours is enough for the heat energy to delay its
transmission from midday until the late evening hours something which is beneficial
in summer.
In recently conducted studies by the author Asan in 2000, the effects of the wall’s
thermo-physical properties, insulation position and thickness on time lag and
decrement factor were investigated (Asan, 2000).
It was shown that thermo-physical properties, thickness and position of wall
materials have a very profound effect on the time lag and decrement factor. These
studies were parametric in nature and most of the results came out from these work
were practical. (Asan and Sancaktar, 1998); (Asan, 1998); (Asan, 2000).
On the other hand, thermal mass and thermal insulation, together, are significant
because they influence the total thermal performance of a building (Hopkins et.al.,
1979); (Balaras, 1996).
2.2.4.1 Windows (Openings)
Since windows are important parts of the building envelope which have significant
effect on the energy performance, they have to be chosen with care (Urbikain and
Sala, 2009). Within building envelopes, the windows are the main source of thermal
losses to the exterior. In cold climates, an amount of 10% to 25% of the heat loss is
transmitted through windows to the exterior (Ismail, 2003).

33
Windows being an important component of the building’s energy system transmit
solar radiation and thus cause thermal losses. The improvement in window
technology has helped in reducing heat losses from interiors in cold climates.
(Persson, 2006).
Windows are available with great variety. To choose a specific window for an
application many factors have to be considered. These factors may be seen in the
figure 9 below. Windows allow light and exterior views, block heat radiation, resist
fire and could affect the aesthetics of the exteriors. However, the windows’ behavior
on energy efficiency as part of the building envelope is considered in this thesis. This
does not mean that the other factors are not important (Persson, 2006).
Figure 9 Different factors related windows (Persson, 2006).
In cold climates, window technology may cause them to function in two main ways
namely by the application of low emissivity (low-e) coated glazing that save energy
by reducing thermal losses and the application of solar control glazing that prevents
solar heat gain into the building. Totally, windows should provide for high
transmittance of visual light without reducing the effect of the above two mentioned
capabilities. This is possible by constructing optically selective window glazings that
allow some of the radiation and reflect another part. This gives window glazings an

34
important property since solar radiation consist of not only visual light but also heat
radiation in the form of long-wave infrared radiation (Persson, 2006).
The application of different types of glazing tints can block the sun rays. They
decrease the visible light transmittance as well as some of the heat radiation,
however these tinted glazings have no low emissivity characteristics (Persson, 2006).
In efficient design, the selection of a window glazing not only depends on the
application of a suitable coating combined with low thermal transmittance, but also
on the window size, orientation and the proper usage of shading devices. The
selection of large windows not only cause heat losses in cold climates during the
winter and nights, but also cause more solar heat energy gain during sunny periods
when compared to gains of a well-insulated wall (Persson, 2006).
In Turkey, the usage of large window glazing areas increased leading to the need to
the usage of more double pane window glazings. An important factor that affects the
energy efficiency of the double pane window glazing is the thickness of the air or
inert gas cavity which has a considerable effect on the energy losses through the
window. Therefore, the optimum thickness should be used within the double pane
window (Aydın, 2000).
According to TS 825 which is the Turkish standard for the minimum U-Value
(thermal transmittance) the transparent part of the building envelope, the window,
remains much higher than the remaining opaque part. The TS 825 regulation
attempts to solve the long prevailing problem of energy conservation within
residential buildings.
In addition to being an important parameter where heat is lost in winter, glazing is
also concerned with significant solar energy gains in summer (Manz, 2003).
Much research has been studied regarding glazing technology. The researches
focused on reducing the heat transmission through glazings to decrease the need for

35
heat and to achieve thermal comfort within interiors in cold climates. Topics such as
low emissivity coatings, gas fillings, spacers, evacuated cavities were considered in
the following investigations by (Manz, 2008); (Braeuer, 1999); (Collins and Simko,
1998); (Weinlaeder et al., 2005); (Ng and Collins, 2005); (Eames, 2008); (Manz,
2003);
Nielson et al. in 2000 showed an easy way to find the total energy gains of glazing
and compare the energy performances of different types of glazing and windows.
Khaled in 1998 investigated the ways of controlling the sizes of windows to achieve
passive heating, cooling, and illumination in hot arid regions. Oral and Yılmaz
presented a methodology for building form factor that provides minimum loss of heat
that is transmitted through the building exterior (Oral and Yılmaz, 2003).
A number of investigations have been undertaken that helped builders in choosing
the best window options in buildings. An investigation by Apte et al. in 2003 found
that when windows with low-e were applied in many US climates around forty
percentage of energy could be used (Apte et al., 2003)
Pyeongchan et.al. in their investigation in 2012 simulated several window options
within residential buildings in two cities namely Inchon and Ulsan is South Korea.
They investigated the window-to-wall ratios, U-value and SHGC values of several
window options and compared their impact on heating, cooling and total energy
usage in the two cities that represented two different climates in South Korea. The
results showed that with the addition of characteristics to the windows neutral and
positive energy influences could be obtained to the interiors specifically for the
temperate weather of Inchon. It was also found that high levels of SHGC are
preferable for windows designed in residential buildings of large windows in mild
climates. In Korean window standards, there is provision for U-value but non for
SGHC. Moreover, it was obvious that a better energy performance was obtained
when double glazing with low-e coating was used in residential buildings when
contrasted to plain double glazing. A life-cycle cost analysis of a number of windows

36
concluded that double clear glazed windows with low-e and a cavity filled with
argon gas were economical for dwellings in South Korea and were therefore
recommended to be used for the standard code. In the other triple, glazing windows
with low-e that produced higher energy savings and carbon reductions however were
not economical for usage in dwellings in South Korea.
According to Arasteh et al. in 2006 and Freire et al. in 2011, the window percentage
for suitable energy composition for heating and cooling according to HVAC
standards in the US were twenty four percent for dwellings and thirty two percent for
commercial buildings (Arasteh et al., 2006); (Freire et al., 2011).
Moreover, according to Florides et al. in 2002 and Freire et al. in 2011, yearly
cooling energy savings of about twenty four percentage of a properly insulated
residence could be obtained once a double-glazed window with low-e when
contrasted to a clear-glazed window (Florides et al., 2002); (Freire et al., 2011).
Works in the last few years by, e.g. Askar et al. in 2001, Omar and Al-Ragom in
2002, Bahaj et al. in 2008, Loutzenhiser et al. in 2008, Poirazis and Blomsterberg in
2008, Perez and Capeluto in 2009, Papaefthimiou et al. in 2009, Tanaka et al. in
2009, Urbikain and Sala in 2009 and Freire et al. in 2011, increase the knowledge
and choice of high performance window glazings that could be used in buildings.
There have been several other studies on the energy efficiency and cost analysis of
different windows units. Karlsson et al. in their paper in 2001 further improved a
simple model for yearly energy balance of windows by considering their solar
radiation and heat losses. They used hourly meteorological data to find out the total
energy heat flow through the windows by means of knowing the solar radiation,
outside dry bulb temperature, and the windows’ optical and thermal performance. By
using only the balance temperature as an initial input, the model implemented
compared different advanced windows in different buildings, orientations and
geographical locations. One example, held in a typical mid-Swedish climate was the

37
evaluation of the energy balance and cost efficiency of a number of window
combinations within a building (Karlsson et al., 2001); (Maçka and Yalçın, 2011).
Çetiner and Özkan in their study in 2005 investigated an energy and economic
efficiency procedure for different single-glazed and double-glazed building envelope
configurations of a 30 floored office block in Istanbul. By following a number of
steps such as some aims / limitations, a process of performance criteria and optional
alternative solutions, a building model including thermal-optical properties, heat
gains/losses, total energy loads and life cycle costs measured by using a software
simulation, and finally concluding with a comparison of energy efficiencies and an
exploration of efficient optional alternatives. From their results, they found that when
comparing the most efficient double-glazed façade to that of the most efficient
single-glazed façade the advantage was for the double-glazed option by a percentage
of about 22.845. They also found that the most cost effective single-glazed option
was about 24.68% more efficient than that of the most cost effective double-glazed
option (Çetiner and Özkan, 2005); (Maçka and Yalçın, 2011).
In 2008, Maçka developed the Win-Energy 1.0 software to measure the thermal
performance effects and energy loads on different window options. The study
involved the investigation of eight widow options of single-pane glass installed in
different double-glazed and triple-glazed units, all experimented in different Turkish
climatic regions (Maçka, 2008); (Maçka and Yalçın, 2011).
In 2009, Urbikain et al. in their study suggested three ways in calculating the heating
loads and energy savings obtained by the testing of different window options of a
residential building. The first method investigated the measuring of the energy loss
of the windows considering only the climatic conditions. The second method
involved the influence of the windows on the energy from the heating system by
considering the climatic conditions and building type. The third and final method
was the usage of software namely TRNSYS16 and WINDOWS5 to obtain energy
simulation results. These three energy oriented methods were applied to ten window

38
types with different orientations and window-to-wall ratios. The first method resulted
in insufficient heating saving values within the building. The second method resulted
in similar conclusions as the simulation third method, with the exception of the
results obtained for the case of the solar control or spectral-selective glazing
(Urbikain et al., 2009); (Macka and Yalçın, 2011).
The introduction of double-paned windows to glazing to buildings is one way in
reducing heat losses from interiors (Korpela et al., 1982); (Wright, 1996); (Karabay
and Arıcı, 2012). The stagnant air layer filing the cavity of the double-paned window
prevents heat flow into the interiors. Increasing this air cavity beyond a certain limit
provides a negative effect by initiating convective currents and thus increasing heat
transfer (Aydın, 2000); (Çengel, 2003); (Karabay and Arıcı, 2012). In order to be
able to increase the air cavity triple-paned and quadruple-paned windows have been
introduced recently (Robinson and Littler, 1993); (Roos and Karlsson, 1994); (Manz
et. al., 2006); (Fang et. al., 2010); (Manz, 2008); (Karabay and Arıcı, 2012). Further
energy savings may be achieved with the replacement of this stagnant air layer by
inert gasses such as argon, krypton or xenon (Reilly et. al., 1990); (Weir and Muneer,
1998) (Karabay and Arıcı, 2012) or by aerogel (Reim et al., 2002); (Jensen et al.,
2004); (Schultz et al., 2005); (Karabay and Arıcı, 2012).
According to a study in 1999, Larrson et al. investigated the combination of few of
these considered window design options and designed a high performance window
glazing. This super window was tested for efficiency. They found that the window’s
specification influence on the building interior is dependent on its characteristics, its
orientation, and the climatic conditions. (Larrson et al., 1999); (Karabay and Arıcı,
2012).
Another research by Perrson et al. in 2006 studied the effect of the size of windows
in Sweden and their energy performance of properly insulated buildings with the
usage of a progressive building simulation software. They concluded that if the long-
established methods to create lower energy were replaced by the addition of larger

39
north facing windows better lighting could be obtained if triple-glazed windows were
used (Perrson et al., 2006); (Karabay and Arıcı, 2012).
According to a research in 2010 by Hassouneh et al., the effect of window glazings
in many of Amman’s residences and how they influence energy performance was
tested. By developing a simulation software using ASHRAE tables and applying it to
their investigation, they concluded that glazing area within building could be
increased in the case that energy efficient windows were used (Hassouneh et al.,
2010); (Karabay and Arıcı, 2012).
According to a study by Sullivan and Selkowitz in 1985, an investigation was
undertaken to analyze single, double and triple paned window glazings in terms of
their energy efficiency in hot and humid, hot and dry, temperate and cold climates of
the USA (Sullivan and Selkowitz, 1985); (Jaber and Ajib, 2011).
According to a study by Rousseau in 1988, an investigation involving double and
triple glazed windows which accommodates two and three panes of glass
respectively with an air or inert gas layers between their panes was undertaken.
These double or triple glazed windows provide more thermal resistance when
compared to single pane windows. The reason for this is that the air or inert gas layer
prevented the heat flow towards the interior, while the single pane windows did little
to hinder the heat flow exchange (Rousseau, 1988); (Jaber and Ajib, 2011).
As mentioned earlier, glazing (windows) add to the high energy losses from the
interiors. For this reason, there is a high demand from the energy designer (architect
or HVAC engineer) to design the residents according to the local outside climatic
environment so as to keep both the interior spaces suitable for living and the
occupants comfortable. To achieve this comfort, windows which are double glazed
and triple glazed are first tested before being recommended for installation in the
residential building.

40
Also building designers know that windows like triple glazing not only have the
property of being highly insulating but also have low solar transmittance. This fact is
important in summer were the window allows for reduced solar gains into the interior
and reduce energy loads for cooling. However, in winter such reduction in solar
gains into the interior overcomes the decrease of thermal losses and thus increases
the need for energy in the form of heating (Gasparella, 2011).
Table 4 Heat conductivities (k) of gases used in double and triple windows (Çetiner
and Özkan, 2004).
Gases k value (W/m x K)
Air 0.02730
Argon 0.01772
Krypton 0.00949
Xenon 0.00569
With technology, window glazings have improved by the additions of cavities that
act as thermal buffer zones that resists heat propagation (Çetiner and Özkan, 2004);
(Bektaş, 2008). Once filled with inert gases mainly argon, krypton or xenon that have
lower heat conductivities respectively compared to air these cavities together with
panes pasted with low-emittance coatings could perform efficiently. The heat
conductivities of these gases used in double or triple windows are shown in table 4
above (Bektaş, 2006); (Bektaş et al, 2008). Such improvements to the window
glazings technology has allowed for the design of triple glazing windows with U-
Values that could be as low as 0.5 W / m2.K for use in low energy buildings (Manz
et al., 2006).
Much of the residential buildings in Turkey have low performance single-glazed
windows installed. As a proportion, 87% of the residential buildings in Turkey have
single-glazed windows installed, 9% have double-glazed windows, and an amount of
4% have low-e coatings (MVV Consultants and Engineers, 2004). In Turkey,
recently, little application of triple-paned window has been seen let alone quadruple-
paned windows which are still to be introduced to Turkey.

41
When the window is placed into the wall, it usually causes a thermal bridge or
temperature exchange through the construction. While installing the windows in the
center of the opening results in the lowest thermal bridge values. On the other hand,
locating the window close to the inner side or outer side of the opening both result in
high heat losses (Bülow-Hübe, 2011). Window systems consist of glass panes,
structural frames, spacers, and sealants as shown in figure 10 below.
Figure 10 Typical features of windows (http://www.wbdg.org, Last Accessed 18 / 11
/ 2013).
Overall, the best selection of window glazings is dependent on the building
orientation, the local climate as well as the building type. When selecting windows
the following characteristics should be considered:
1) U-value (Thermal Transmittance).
2) Solar Heat Gain Coefficient (SHGC).
3) Visible Transmittance (Tvis-glass).
4) Tints (Colors).
5) Low Emissivity (Low-e) Coating.
6) Air Gap of Double and Triple Glazing.
42
As mentioned earlier, U-value also known as thermal transmittance coefficient is the
property of windows reflecting the extent of heat flow from inside to outside and
vice versa due to conduction, convection, and radiation. Low U-values of the
building envelope mean a high value of insulation with lower thermal conductivity
(λ) making the building envelope advantageous in cold climates by producing
interior comfort. If there is a low U-value of the building envelope, lower heating
energy demand is required (Ian, 2012; Bülow-Hübe, 2011). During winter the higher
the U-value of a window, the more heat is lost from the interior to the exterior. In the
cold dominant climate of Ankara, this loss of heat in winter is not recommended;
therefore low U-values become necessary. While in summer the lower the U-value,
the lesser heat loss occurs to the exterior leading to the need of supporting heat
disposition by means of natural ventilation. The units of U-value is the British
thermal unit per hour per square foot per °F (Btu/hr · ft² · °F). U-values may range
from as high as a value of 1.3 for an aluminum frame single glazed window to as low
a value of 0.2 for a multi-paned with low-emissivity coatings and insulated frame. It
is important to know that the U-value is calculated by finding the average of glass,
slash and frame (Bülow-Hübe, 2011).
The lower the U-value, the lesser heat passes through the building envelope from
interior to exterior and vice versa. Thus, this is advantageous for both winter and
summer. In both winter and summer, the window option with the lower U-value
provides an envelope with lesser heat gain or heat loss.
Glazing has a good heat conductivity value. When comparing both thinner glazing
the thicker glazing, the thinner glazing transmits more heat energy and thus an
increased temperature value is collected in the interior. In addition, the thicker the
glazing the lower is the U-value and the better is this glazing option for both winter
and summer.
On the one hand, there is the “U-value” which is defined as thermal transmittance
and on the other hand, there is the “R-value” which is defined as thermal resistance.

43
“R-values” are commonly used in North America and they are merely the reciprocal
of the “U-value”.
Solar heat gain coefficient is a central concept for high performance envelope design.
SHGC provides a means for measuring blocked heat from the sun. Low SHGC
results in high heat blocking and the lesser is the heat gain or loss through the
window. The SHGC factor of windows has a value between 0 and 1. SHGC = 0
means that all the incident solar heat subjected to the window is blocked and does not
transmit any heat and thus there is no heat gain or loss of the window. On the other
hand, SHGC = 1 means that all of the incident solar energy subjected to the window
is allowed to be transmitted as heat and thus a maximum heat gain or loss through
the window. A window with an SHGC value of 0.6 will transmit double the amount
of solar heat as a window with an SHGC of 0.3. Windows with a low value of SHGC
are recommended for buildings that are built using passive solar heat principles
(Cocina, 2009).
The lower the solar heat gain coefficient of the window, the better it is for both
winter and summer. Here, the more the product is blocking solar heat, the lesser it is
transmitting heat through the window.
Tvis-glass is the measure of how much of the visible part of the solar spectrum is
transmitted through the window glazing. Sunlight is part of the solar spectrum in the
form of electromagnetic waves that reaches the earth. The solar spectrum consists
collectively of ultraviolet (UV), visible, and infrared (IR) wavelength. Ultraviolet
short wavelength cannot be seen by the naked eye, and they are the cause skin
damage. Visible light is seen by the eye, and amounts to 47% of the sunlight energy.
Infrared long wavelength also cannot be seen to the naked eye amounting to 46% of
the sunlight energy (http://www.nfrc.org, Last Accessed 27 / 11 / 2013).
Applying coloring or tinting, coatings or films to glass panes of windows enhances
their properties. Glass tints are created during their manufacture by the addition

44
colorants. Other glass tints are created by the addition of colored films. One reason
for the addition of tints is aesthetics, while another reason is to reduce solar gains.
Window tints can block a significant amount of heat energy while still allowing for
light as well as clear outside views as shown in figure 11 below.
Figure 11 Different Tints (http://www.wbdg.org, Last Accessed 18 / 11 / 2013).
Low-emissivity coated glazing (or low-e coated glazing) is a type of energy-efficient
glass that prevents heat being transmitted through windows to the cold exterior and
vice versa. When Low-emissivity or low-e coatings such as metal oxides are added
to the glass panes during manufacture radiant heat transmission between the pane
surfaces is reduced. In addition, low-e coatings lower the window’s U-value thus
reducing heat transfer from the interior to the exterior and vice versa.
In addition, there are two types of low-e coatings namely hard and soft. Windows
with the hard coatings are used in coupled windows and they are able to be cleaned.
As for soft coatings, they are sensitive to mechanical treatment and have to be
protected in a sealed insulating pane. Soft coatings have a very low energy emittance
of 1 to 3 %, while hard coatings have energy emittance around of 16% (Bülow-Hübe,
2011).

45
Old double glazed windows do not have low-e coatings and are thus not energy
efficient. With the addition of low-e coatings to the new glazed windows energy
efficiency is increased and energy bills are reduced. Windows with low-e keep heat
within interior spaces in winter, thus allowing for comfortable occupancy of these
spaces for more periods of the year. Usually heat tends to travel from hotter areas to
colder spaces. Thus, windows that do not have low-e coatings allow heat to be
transmitted through the glazing and towards the colder exterior. On the other hand,
windows with low-e coating radiate heat poorly preventing it from being transmitted
to the exterior. Instead, windows with low-e coating reflect retarding heat back into
the immediate space (Elder, 2000).
The presence of a low-e coating prevents heat in the form of long wavelength
infrared rays from being transmitted through windows towards the interior and vice
versa, thus being reflected either towards the interior or the exterior. While, on the
other hand low-e coatings transmit short waves in the form of visible light through to
the interior and vice versa.
The gap filled with air or argon gas in double and triple glazing windows transfer
heat by means of convection. Heat transferred by conduction through the outer pane
of a double or triple glazing reaches the gas filled gap facing the pane. By means of
convection between the solid (glass pane) and the fluid (air or argon) the hot
molecules of the pane vibrate and transmit heat to the molecules of the fluid. The
molecules start colliding with each other resulting in an increase of energy and
vibration. Thus the temperature of the fluid increases and heat is transferred to the
surface of the inner pane. The thicker the air gap, the more is the temperature
increase and thus more heat is transmitted resulting in a hotter interior.
The heat transmittance through double and triple glazing windows are described
below:

46
1) Double Clear Glazing: This type of window consists of two glazing panes
with a sandwiched air gap. The air gap reduces heat transfer due to its
insulating properties. When compared to single clear glazing windows,
double clear glazing windows reduces heat loss by half. Double clear glazing
windows not only reduces heat transmission but also allows high amounts of
visible light.
Figure 12 Energy Distribution for Double Glazing Clear Glass
(http://www.commercialwindows.org, Last Accessed 10 / 11 / 2013).
Figure 12 above describes the distribution of solar radiation incident at two clear
glass panes of a double glazing window. As the incident solar radiation reaches the
outer glazing, part of it is reflected to the exterior and a large part is transmitted
across into the gap before reaching the inner pane where a large part is transmitted to
the interior space and a lesser part is reflected back first passing through the gap and
then through the exterior pane to the exterior. During this process, solar heat is
absorbed within both the exterior and interior panes. This absorbed heat within both
the panes is released partly to the exterior and partly to the interior.
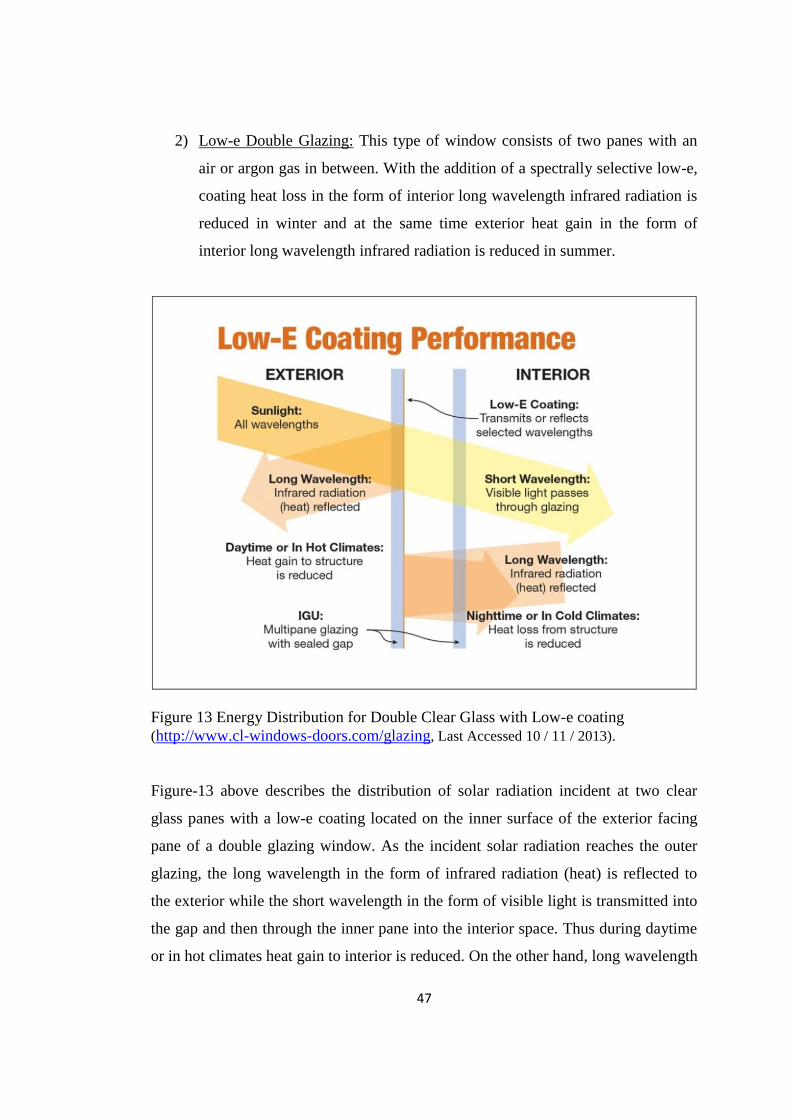
47
2) Low-e Double Glazing: This type of window consists of two panes with an
air or argon gas in between. With the addition of a spectrally selective low-e,
coating heat loss in the form of interior long wavelength infrared radiation is
reduced in winter and at the same time exterior heat gain in the form of
interior long wavelength infrared radiation is reduced in summer.
Figure 13 Energy Distribution for Double Clear Glass with Low-e coating
(http://www.cl-windows-doors.com/glazing, Last Accessed 10 / 11 / 2013).
Figure-13 above describes the distribution of solar radiation incident at two clear
glass panes with a low-e coating located on the inner surface of the exterior facing
pane of a double glazing window. As the incident solar radiation reaches the outer
glazing, the long wavelength in the form of infrared radiation (heat) is reflected to
the exterior while the short wavelength in the form of visible light is transmitted into
the gap and then through the inner pane into the interior space. Thus during daytime
or in hot climates heat gain to interior is reduced. On the other hand, long wavelength

48
in the form of infrared radiation (heat) radiating from the interior through to the
exterior is reflected back to the interior after reaching the pane with the low-e
coating. Thus during cold nighttime or in cold climates heat loss from the interior is
reduced.
The U-Values and SHGC of two double glazing units one without low-e coating and
the other with low-e coating are shown in table 5 below.
Table 5 U-value and SHGC of a double glazing with and without Low-e coating.
(http://www.adelaidecitycouncil.com, Last Accessed 11 / 11 / 2013)
Glass Type U Value (W/m2 x k) SHGC
Double Clear Glazing 2.70 0.70
Low E Double Glazing 1.90 0.66
1) Triple clear glazing: Triple glazing is manufactured using the same principle
as double glazing, but three glass sheets are used. Recently triple glazing
windows is the better option for maximum energy transfer between interiors
to exteriors.
Figure 14 below describes the distribution of solar radiation (heat) incident at three
clear glass panes of a triple glazing window. As the incident solar radiation reaches
the outer glazing, part of it is reflected back to the exterior while a larger part is
transmitted through to the first gap. Similarly, when this transmitted solar radiation
(heat) reaches the middle pane part of it reflected and a larger part is transmitted
through to the second gap. Here, the reflected heat passes back to the exterior first
through the first gap and then through the exterior facing pane. The transmitted heat
that reaches the second gap also passes towards the inner pane where a large part of
it is transmitted to the interior space and part is reflected back to the second gap
before being transmitted through the middle pane, first gap and exterior pane. On the
other hand, interior heat is transmitted to the exterior in the same way but in the
opposite direction as the heat transmission from the exterior to the interior.

49
Figure 14 Energy distribution for Triple Clear Glass (http://www.bettaglaze.co.uk,
Last Accessed 11 / 11 / 2013).
Figure 15 below describes the distribution of solar radiation (heat) incident at three
clear glass panes with a low-e coating located on the exterior surface of the inside
pane of a triple glazing window. As the incident solar radiation reaches the outer
glazing, part of it is reflected back to the exterior while a larger part is transmitted
through to the first gap. Similarly, when this transmitted solar radiation (heat)
reaches the middle pane part of it reflected back and a larger part is transmitted
through to the second gap. Here, the reflected heat passes back to the exterior first
through the first gap and then through the exterior facing pane. The heat transmitted
through to the second gap reaches the inside pane. Here, due to the presence of the
low-e coating, the short wavelength visible light is transmitted to the interior and the
long wavelength infrared heat radiation is reflected back through the second gap,
middle pane, first gap and outside pane to the exterior. On the other hand, the long
wavelength in the form of infrared heat radiation radiating from the inside through to
the exterior is reflected back to the inside after reaching the inside pane because of
the low-e coating. Thus, during daytime or in hot climates heat gain to interior is

50
reduced. And during nighttime or in cold climates heat loss from the interior is
reduced.
Figure 15 Energy distribution for Triple Clear Glass with Low-e Coating
(http://www.greenspec.co.uk, Last Accessed 13 / 11 / 2013).
2.2.4.2 Window Frames
The frame of a window may be made of different materials ranging from UPVC,
wood or aluminum. The frame and the window glazing together give the window its
characteristics. The selection of the window frame is based on its appearance,
thermal efficiency, ease of maintenance, ease of service, cost, availability, shape and
its recyclability. Various types of energy efficient window glazing frames are
available with energy efficient glass and gas inserted in between the panes (Spence,
2000).
Aluminum windows are made from extruded aluminum structural members. Since
aluminum is easy to work complex designs these members are readily produced
(Spence, 2000). Aluminum has an excellent strength-to-weight ratio, resists
corrosion and easily yields to complex shapes. In addition to its yielding property,

51
aluminum does not rot or deform thus lasting the building lifecycle but requiring
periodical maintenance.
In term of prices, aluminum frames have the lowest cost when compared to other
window frames. Since aluminum is a good conductor, heat is transmitted easily
through the frame. This is a setback which is combated by the addition of a thermal
break which comes in the form of a vinyl profile located in between two aluminum
sections. The result is a thermally resistant window frame.
Aluminum does not hold brush paint well, so it is recommended that the original
paint of aluminum is used in the coloring of the frame (Spence, 2000).
Wooden framed windows are available with fixed and operable sash. They may be
clad with plastic or aluminum or left natural and / or painted. Wooden windows are
good products both in appearance and qualities. They last long however they are
accompanied with a price. Wooden windows are bought with three or more times the
price of a similar vinyl window. Not only that but they also require constant
maintenance. Low price wooden windows mean long term losses because with time
they tend to crumble. These low quality windows need constant maintenance which
if not done, will lead to their crumbling.
Not every client could afford the luxury of wooden windows. Such wooden
windows, even though expensive, require constant maintenance and painting. Thus,
money expenditure never stops in such a case. Wooden frames provide better
insulation than metal and plastic windows. However, they do swell and shrink as the
moisture content changes (Spence, 2000).
Since its creation in the 1920’s, Vinyl has been the most widely used plastic in the
world including window frames. Being known as polyvinyl chloride (PVC), it
resists both chemicals and corrosion reactions. An extended product unplasticized

52
polyvinyl chloride (UPVC), has the same property of PVC with the addition of
offering safety to harmful ultraviolet energy arrival from the sun.
When comparing window frames, the most efficient ones are the UPVC frames.
Aluminum frames are thermally not as efficient as timber or UPVC as they will
transmit heat and cold air in and out of the building. UPVC could be easily shaped
into different forms, providing high thermal resistance and also a good strength to
weight ratio. Moreover, UPVC frames could be easily manufactured and given
different colors or paints thus favoring it over other frames such as aluminum and
wood. Thus UPVC frames are preferred.
Moreover, UPVC frames could be easily manufactured thus favoring it over other
frames such as aluminum and wood.
In its natural form, UPVC frames do not rust, swell, pit, peel or corrode and never
needs painting. Its members can be produced with the accuracy needed to provide
airtight fits (Spence, 2000).
In addition, UPVC frames are very strong thus making them unbreakable and lasting
the lifecycle of the building. It could also be added that UPVC frames require no
maintenance however some cleaning makes the window looking new. Another
quality of UPVC is its good insulation property against both hot and cold making it
the better option for both winter and summer. UPVC frames only drawback are their
bulky appearance. To solve that modern UPVC frames are toned down to give them
smoother appearance. In this thesis, UPVC frames are selected to frame the glazing
windows under investigation.
2.2.4.3 Masonry Walls
Masonry is a means of construction made of stone, concrete, brick, gypsum, hollow
clay tile, concrete brick, tile, or other similar building units of materials combined

53
and set into close positioning with mortar. A type of building envelope is the heavy
construction that is popular in Turkey. Common construction utilizes concrete or
clay masonry blocks for walls.
In order to provide low energy consumption with the lower heat losses through
masonry walls of masonry blocks, one option is to have insulation material in the
form of a sandwich solution with two block layers and thermal insulation in the
middle. In this kind of construction, mineral wool or polystyrene or polyurethane
would be the most suitable insulating material (Bülow-Hübe, 2011).
Concrete masonry units (CMU) not only are cost efficient, but also increase
productivity by reducing construction time. Their light weight reduces energy spent
in transportation and improves the builders’ workmanship. CMUs are manufactured
into three types according to their weight class namely heavyweight, medium weight
and light weight. They are distinguished by their pounds per cubic foot (pcf).
Heavyweight units weigh 125 pcf or more. Medium weight units weigh between 125
pcf and 105 pcf. Lightweight units weigh less than 105 pcf. A (0.20 x 0.20 x 0.40 m)
CMU heavyweight unit is 15.42 kg or more, a medium weight unit is between 12.70
and 15.42 kg, while a lightweight unit is less than 12.70 kg based on a 50% solid unit
(Lochonic, 2010).
A standardized shape and size of these concrete blocks is (0.203 x 0.203 x 0.406 m).
With further adjustments considering the extra mortar this block size has been
reduced to (0.194 x 0.194 x 0.388 m). To achieve wanted properties of the concrete
block, constant monitoring is necessary while they are manufactured (Portland
Cement Association, 2013); (Ramachandran, 2013).
The concrete used in the production of the concrete blocks is made from the
following constituents namely powdered Portland cement, gravel, sand, and water.
The result is a light grey, smoothly textured block with a high compressive strength.
When compared to other concrete blocks used for general purposes, these blocks

54
have higher sand percentages and lower gravel and water percentages resulting in a
very dry and stiff mixture that retain a strong and stable shape once it is removed
from its mold.
Figure 16 Hollow Concrete Blocks (Ramachandran, 2013).
Hollow CMU blocks are very efficient with a number of advantages, one being its
usage as part of the structure in the form of walls and slabs. As mentioned earlier,
hollow CMU are fire resistant, sound resistant and have a high thermal mass (Hoke,
1993).
Hollow CMU units exist with a central core that not only reduces the blocks weight
but also eases labor effort. Some of the different sizes of hollow concrete blocks are
shown in figure 16 above.
Lightweight concrete provide more energy savings because their heat flow resistance
is twice that of heavy weight concrete and therefore less energy is needed to
heat/cool the interior (Yiğit et. al, 2011).
In comparison to normal aggregates, light weight aggregates have higher water
absorption rate as well as lower relative density. Furthermore, not only is it light

55
weight but it also has good strength, high fire resistance and good heat insulation.
Using lightweight aggregate in concrete has a number of advantages namely the
reduction of dead load, reduction in handling and transportation costs as well as
improved fire resistance capability (Yiğit et. al, 2011).
In building construction, lightweight concrete (LC) has been utilized as masonry
blocks, wall panels, roof decks as well as precast concrete units. The light weight of
the aggregates used in the manufacture of lightweight concrete was beneficial
especially for constructions built in seismic zones (Şahin et. al., 2012).
In terms of advantages in cost efficiency, lightweight aggregates with low thermal
conductivity could be used to produce lightweight concrete blocks (Al-Jabri et al.
2005).
Natural or artificial lightweight aggregates are found and provided all around the
world and with their different characteristics of weight and strength could be used to
produce concrete used for different purposes such as internal and external walls,
internal layers of exterior cavity walls, fill panels as well as isolation elements of
roof decks and floors (Topçu, 2001); (Demirboğa et al. 2001). Lightweight
aggregates could be produced from natural materials, by-products or unprocessed
materials. With a large number of voids that could occur within in the aggregate,
lightweight aggregate concrete could have a higher thermal insulating characteristic
when compared to normal heavyweight concrete. Therefore, lightweight concrete is
advantageous with its lightness as well as good thermal insulation (Al-Jabri et al.
2005); (Şahin et al., 2012).
When applied to building constructions, these concrete blocks may heat or cool,
absorb or radiate heat to the surrounding components of the wall system. The thermal
performance of these concrete blocks depends on the one hand on the thermal
insulation applied or the on the other hand the different wall layers. Moreover,
lightweight concrete blocks provide more a thermal mass effect when compared to
56
other wall systems such as wooden or steel construction. Even with similar
thicknesses, lightweight concrete blocks stores less heat when compared
heavyweight concrete blocks. However, lightweight concrete releases heat slower,
something which adds to its total thermal performance (Ramachandran, 2013).
Energy efficiency could be achieved by masonry construction. Masonry wall systems
may use interior insulation, integral insulation, or exterior insulation for maximum
design flexibility. Interior insulation comes in the form of fibrous batt or rigid board
insulation can be granular or foamed in place insulation or rigid polystyrene inserts.
Exterior insulation mainly comes in the form of rigid board attached to a wall’s
masonry surface and covered with a weather resistant coating or plaster (Simpsons,
2001).
Lightweight blocks have the advantages of improved worker productivity and morale
leading to faster construction and projects finishing with minimum mason accidents
and injuries.
The data in APPENDIX-YY shows the image, dimensions, density, weight, block
per cube, fire ratings of a number of available hollow concrete masonry units.
2.2.4.4 Wall System (Autoclaved Aerated concrete (AAC) Block)
Due to its light-weight, low density, high fire resistance and unique thermal and
breathing properties, Autoclaved Aerated Concrete (AAC) has been one of the most
commonly used construction materials (Taşdemir and Ertokat, 2002); (Andolsun et
al, 2005); (Narayanan and Ramamurthy, 2000a). These properties make AAC a
suitable material for earthquake-resistance purposes (Taşdemir and Ertokat, 2002).
However, AAC has a disadvantage of deteriorating when exposed to water
(Andolsun, 2006).

57
AAC is produced and used in Turkey either as building blocks or steel reinforced
panels. AAC building blocks are divided into three types namely masonry blocks,
floor blocks and insulation blocks. AAC steel reinforced panels may be used as wall
elements, roof and floor deck elements as well as complementary elements such as
lintels (www.akg-gazbeton.com, Last Accessed 05 / 03 / 2014). The dimensions and
shapes of the different types of AAC are shown in table 6 below and figures 17 and
18 below.
Table 6 Product Dimensions of AAC Masonry Blocks (www.akg-gazbeton.com,
Last Accessed 05 / 03 / 2014).
Type of the Masonry Block Length (l)
(cm)
Width (b) (cm) Thickness (d)
Plain-end wall blocks 60 25 (5 - 35)
Tongue and groove wall blocks 60 25 (15 – 35)
U-blocks 60 25 (20, 25, 30)
Plain-end wall blocks Tongue and groove wall
blocks
U-blocks
Figure 17 Aerated Autoclaved Concrete (Aroni et. al., 1993)
(www.akg-gazbeton.com, Last Accessed 05 / 03 / 2014).
Figure 18 Aerated Autoclaved Concrete - close-up view (Aroni et. al, 1993).

58
AAC blocks is made from fine aggregates, cement and an expansion agent that gives
it the property of being blown just like the bread dough when exposed to heat. Thus,
it can be said that AAC consists of 80% air. AAC blocks, shown in figure 17 and 18,
created by the Swedish architect Johan Axel Eriksson first appeared in the 1920’s
(Aroni et al., 1993).
In Turkish Standards, Autoclaved Aerated Concrete may be defined as a lightweight
concrete that consists of a mixture of fine grain siliceous aggregate and an inorganic
binder agent such as lime or cement that acts with pore-forming agent which
decreases the mixture’s unit weight. This is followed by a steam curing process
which gives the mixture its mechanical strength (TSE, 1988); (Çiçek, 2002). Another
definition of Autoclaved Aerated Concrete may be described basically as a mortar
with pulverized sand and/or industrial waste like fly ash as filler, in which air is
entrapped artificially by chemical means (metallic powders like Al, Zn, H2O2) with
the result greatly reduced density (Narayanan & Ramamurthy, 2000b).
2.2.4.5 Plasters and Renders
Mineral-based plasters function as outdoor or indoor plasters and either hand or
machine pasted plasters. Plasters and renders for exteriors are weatherproof,
moisture, rain and temperature change resistant. Cement-based, lime-based plasters,
synthetic resin and silicate dispersion plasters are the best in usage for outdoor
plastering.
Plasters applied in interiors must be breathable, abrasion-resistant and appropriate for
decoration or coated layers, wall paper and tiles. Internal plasters may be made of
gypsum or gypsum-lime or lime-cement or gypsum cement skim, but recently, clay-
based plasters are becoming common in the market because of their better
environmental impact (Spence, 2000).

59
In this thesis, Gypsum Insulating Plaster is used for interior and exterior coating
because of its low conductivity of (0.18 W/m2 x k) when compared to other plasters.
The better the insulation, the less heat gain or loss occurs.
2.2.4.6 Insulation
Thermal insulation may be defined as a material or a collection of materials which
when together heat transfer either by conduction, convection, and radiation is slowed
down to and from a building because of its high thermal resistance property
(ASHRAE, 2001); (Al-Homoud, 2005).
In Turkey, due to little insulation in existing and new buildings, the result is a lot of
heat loss and energy waste. Thus enough thermal insulation leads to much energy
savings (Bolattürk, 2006).
In modern times as mentioned earlier, energy is a basic requirement for the social
and economic progression of societies. This requirement in energy conservation
became ever more important after the oil crisis of 1973. For the condition of Turkey
which imports much of its energy, this has influenced its national energy strategies.
In addition, much more energy would be required due to the population and
urbanization increase. It is expected that the population of Turkey would increase to
100 million by 2020, therefore, further energy conservation is required. As
mentioned earlier, even though Turkey has resources such as hard coal, lignite,
asphaltite, petroleum, natural gas, hydroelectric energy and geothermal energy, it has
imported fifty two percentage of the energy it spends from other countries (Oğulata,
2002); (Bolattürk, 2006).
In cold climates, energy in the form of heating is mainly consumed in buildings.
With time and technology, one way to minimize this costly energy consumption that
otherwise pollutes the environment, was the application of thermal insulation on
walls (Aksoy, 2012).

60
As an influential addition to the wall, thermal insulation within the wall is major in
reducing energy usage. Since energy is released by fossil originated fuels and 35-
40% of that energy is utilized to heat buildings, the need arises to save it by applying
these fuels efficiently (Aytaç and Aksoy, 2006); (Aksoy, 2012).
Wall thermal insulation is one method to decrease heat loss from buildings. An
amount of 77% of energy consumed within a building could be saved by adding
thermal insulation to roofs and walls (Mohsen and Akash, 2001); (Aksoy, 2012). In
the past almost no insulation was applied in buildings in Turkey, something which
led to high heating energy consumption. The mean heat usage in residents was above
200 kWh/m2 per year (Dilmaç and Kesen, 2003); (Aksoy, 2012). Thus energy saving
gained increased importance in Turkey. Since Turkey imports much energy, the
Ministry of Public Works and Housing released a new regulation namely (TS 825) in
1998, once applied, reduced considerable energy consumption in buildings (Turkish
Standard Institution, 1998); (Aksoy, 2012).
Figure 19 Thermal regions of 81 cities for Turkey (Ankara being numbered as city 6
in region 3) (TS 825 Standard).
The TS 825 Standard provided necessary information of insulation that must be
followed in buildings in Turkey (TSE, 2008). In Turkey, TS 825 ‘Heat Insulation

61
Code in Building’ described from figure 19 above and figure 20 below is the only
regulation addressing the insulation issue. In this document, Turkey is separated into
four climatic regions, and the maximum heat transmittance coefficient (U-value) of
walls, roofs, floors and windows in these regions were determined. According to this,
the U-value for Climate Regions I, II, III and IV should be 2.4 W/m2K for all
window glazings (TSE, 2008).
Figure 20 Thermal Transmittance requirements according to (TS 825 Standard).
Examples for the different regions are as follows:
1) 1st
Region = Antalya, Adana (hottest outdoor temperature)
2) 2nd
Region = İstanbul, Samsun (moderate outdoor temperature)
3) 3rd
Region = Ankara, Konya (cold outdoor temperature)
4) 4th
Region = Erzurum, Kars (coldest outdoor temperature)
The walls with all its components such as the masonry blocks, plaster and thermal
insulation is very important in the thermal calculations of the building (Aksoy and
Inalli, 2003); (Aksoy, 2012) Some Research regarding thermal insulation is as
follows:
Bolattürk in 2006 determined the most favorable insulation thickness, energy savings
and payback periods of various fuels for sixteen selected locations with four different
climates. He found that energy savings ranged between twenty two and seventy nine

62
percentage while the most favorable insulation ranged between two and seventeen
centimeters (Bolattürk, 2006).
In 2003, Çomaklı and Yüksel tested the most favorable insulation thickness suitable
in cold locations. The optimization was based on the life cycle cost analysis. They
concluded that energy savings could be obtained once optimum insulation
thicknesses were applied within walls (Çomaklı and Yüksel, 2003).
In 2004, Dombayıcı found that in the city of Denizli, Turkey, once the most
favorable expanded polystyrene thickness was applied to the walls, energy
consumption was decreased by 46.6% (Dombayıcı, 2004).
In 2008, Özel and Pıhtılı determined the most favorable insulation thickness applied
to external walls for Adana, Elazığ, Erzurum and İzmir provinces considering the
heating and cooling degree day values (Özel and Pıhtılı, 2008).
In 2010, Uçar and Balo determined the most favorable insulation thicknesses of
different wall structures for four different insulation materials and for four climatic
zones within Turkey and for different fuel types. They concluded that energy cost
savings ranged between 4.2 $/m2 and 9.5 $/m2, according to the city and type of
insulation (Uçar and Balo, 2010).
According to the study by Mohsen and Akash in 2001, different building insulations
such as polystyrene, rock wool, and air gaps were investigated in regards to the
energy they save. They concluded that 77% energy savings could be obtained once
polystyrene was used for both walls and roofs insulation. (Mohsen and Akash, 2001);
(Bolattürk, 2006).
In a study by Jaber in 2002 regarded space heating load, he concluded that 50% of
this load could be decreased by the application of economically suitable thermal
insulation material to walls and ceilings (Jaber, 2002); (Bolattürk, 2006).

63
According to the study by Al-Sallal in 2003, the payback period when both
polystyrene and fiberglass roof insulations were applied in warm and cold climates
was investigated. He concluded that the payback period in cold climates was less
than that in warm climates (Al-Sallal, 2003); (Bolattürk, 2006).
Another study by Hasan in 1999 investigated cost savings and payback periods
obtained when both rock wool and polystyrene insulation were applied. He used a
life-cycle cost analysis to obtain the most favorable insulation thicknesses. A saving
of 21$/m2 of the wall area resulted when rock wool and polystyrene insulation was
used. Moreover, a payback period of 1-1.7 years for rock wool insulation and 1.3-2.3
years for polystyrene insulation were obtained, for different wall constructions
(Hasan,1999); (Bolattürk, 2006).
According to a study by Al-Sanea and Zedan in 2002, an investigation of the effect
of the heat transfer properties on the wall orientation was done with the result that
both were closely related and were mutually influenced. However, they concluded
that heat transfer, in comparison, had lesser effect on the cost and the most favorable
thickness of the considered thermal insulation material. They also studied the
economic aspects of the total price and the most favorable thermal insulation
thickness (Al-Sanea and Zedan, 2002); (Bolatturk, 2006).
From all these studies, it could be concluded that the building envelope components
such as walls and roofs of buildings being the dividing elements that separate
interiors from exteriors affect the energy performance of buildings. The addition of
thermal insulation should be considered according to climate and the interior thermal
comfort needs of occupants. Thermal insulation is usually added as part of the
building envelope component to decrease interior heating and cooling, energy usage
as well as costs. Increasing thermal insulation thicknesses adds to the monetary costs
on the one hand, but on the other hand reduces the costs for interior heating and
cooling. Consequently at the most favorable thermal insulation thickness the cost of
fuel is minimal. In turn, no extra energy saving would occur if the thickness of the

64
thermal insulation is increased (Mahlia et al., 2007); (Uçar and Balo, 2010). When
comparing the thermal insulation materials to other natural or man-made materials
differences in behavior occur according to temperature exposure. Much research has
been done investigating the influence of operating temperature on the thermal
behavior of thermal insulation materials (Al-Homoud, 2005); (Uçar and Balo, 2010).
According to a study by Bolattürk in 2008, the optimum thermal insulation
thicknesses according to both the heating and cooling loads were obtained for a
number of cities located in the first climatic zone of Turkey as per the TS 825
standard (Bolattürk, 2008).
According to a study by Dombayıcı et al. in 2006, the optimum thermal insulation
thickness of the exterior building envelope for two different insulation materials
namely expanded polystyrene and rockwool were calculated in Denizli (Dombayıcı
et al., 2006)
In their study, Özel and Pıhtılı analyzed differently located insulations in twelve wall
systems in different seasons namely winter and summer in the city of Elazığ, Turkey.
Different insulation configurations across the different wall systems were
investigated with the thicknesses of both the insulation and masonry remained
constant. The best location of insulation from the different wall systems with the
consideration of their time lag and decrement factor characteristics was investigated
in both summer and winter. They concluded that the best option was to locate three
insulation layers one on the outside, the second in the middle and the third in the
inside. In addition, another conclusion obtained was that locating thermal insulation
at the interior and exterior sides of the wall produced the better option when
compared to locating insulation with different thicknesses from the maximum time
lag and minimum decrement factor perspective (Özel and Pıhtılı, 2007).
It is usual in the construction that the insulation is applied in the exterior, middle or
interior of the wall structure. However, according to recent developments in research

65
by (Asan, 2000); (Sodha et al, 1997) (Bojic and Loveday, 1997); (Özel and Pıhtılı,
2007) it was concluded that a higher thermal performance would occur when a
double layer of insulation is applied when compared to a single layer of insulation
with the same total thickness. From the study, the worst option was locating a single
insulation piece at different locations other than that of the exterior. In addition, high
time lag and low decrement values were obtained when half of the insulation was
located in the exterior surface and half was located in the center of the wall (Asan,
2000); (Özel and Pıhtılı, 2007).
Nowadays, in the insulation industry, it could be noticed that such products are
available in sheets with different thicknesses. In new construction, insulation could
be installed in the exterior surface, sandwiched in the wall or the interior surface. In
the case of already erected walls or built construction, the only locations to place
insulation are either the exterior or interior surfaces of the walls (Asan, 2000).
Insulation materials come in many forms as shown in figure 21 below. The first
being batts and blankets, the second being rigid materials such as foam boards and
fiber boards, the third being sprayed-on materials such as polyurethane and finally
loose fill insulation such as cellulose (Simpsons, 2001).
Plastic foam panels or rigid insulation panels are used variously. Polyurethane and
polystyrene panels could be used for interior and exterior applications for both
residential and commercial constructions.
Rigid fiberglass or mineral wool boards are used to insulate masonry, steel and wood
construction components. These insulation products are good in draining water
through themselves and away allowing them to be suitable for wet facing areas such
as foundations and marine applications. These products are also used for high
temperature facing devices such as solar collectors.

66
Figure 21 Classification of the most used insulating materials (Papadopoulos, 2005).
Plastic foam insulation panels are also applied in exterior building envelope. For
example polystyrene insulation may be attached to the exterior of masonry wall
together with a stucco coating that sticks as an outer layer (Krigger and Chris, 2009).
Moreover, it is not the thermal insulation fibers that resist the heat flow, however it is
the countless microscopic air pores within the insulation material fabric that resist the
convective heat transfer by prohibiting air from moving (Al-Homoud, 2005).
Thermal transmittance or U-Values of some insulation results are given in the figure
22 below. Thermal insulation has many benefits from which the following are but a
few:
1) Economic benefits: By the application of thermal insulation with a low initial
capital investigation, approximately 5% of the total building cost and much
energy savings could be achieved which means much energy cost savings and

67
thus much operating cost savings. Reduction in operating costs equals
decrease in HVAC system costs (Al-Homoud, 2005).
2) Environmental benefits: The application of thermal insulation saves energy
by reducing operation costs and improving environmental benefits. This
could be achieved since pollution producing mechanical systems would be
minimized (Al-Homoud, 2005).
3) Thermally comfortable buildings: The application of thermal insulation
reduce the energy load expended by the HVAC systems and thus increase the
period of indoor thermal comfort (Al-Homoud, 2005).
Figure 22 The thermal transmittance of several common insulation materials with
five centimeter thicknesses compared to the thermal transmittance of a concrete
block (Al-Homoud, 2004).

68
The percentage of different types of insulations in Turkey and Europe are given in
figure 23 below (Society of Polystyrene Manufacturers, 2003).
Figure 23 Percentage consumption of insulation materials in Europe and Turkey
(Society of Polystyrene Manufacturers, 2003).
“Glass wool is made from silica sand, an inorganic raw material, which is
obtained domestically. It is produced through heating silica sand at 1200˚C
- 1250˚C and transforming it into fibers. Glass wool is non-combustible,
non-toxic, and resistant to corrosion. It has low weight by volume, low
thermal conductivity, stable chemical property, and low moisture absorption
rate due to its excellent hydrophobicity. Thanks to its intertwined flexible
fibers, glass wool is the best insulating material against noise, cold and heat
and also offers excellent fire-resistant properties. It can be manufactured in
the forms of blanket, board, pipe or loose in different size and with different
technical properties, with different facing materials according to the intended
use and the place of use. It is used for thermal insulation, sound insulation,
acoustic comfort as well as fire safety.” (http://www.izocam.com.tr, Last
Accessed 15 / 03 / 2014).
İzocam Cephepan (exterior insulation) is a water resistant glass wool board produced
with silicone spread and surfaced with yellow or black glass tissue. It is used at
curtain wall systems, under the glass, granite, marble and aluminum wall cladding or
under plaster for thermal insulation, sound insulation and fire safety purposes as
shown in figure 24 below.

69
Figure 24 İzocam Cephepan or Façade insulation (http://www.izocam.com.tr, Last
Accessed 15 / 03 / 2014).
Table 7 The Properties of Glass Wool (http://www.izocam.com.tr, Last Accessed 15
/ 03 / 2014).
Properties Description Symbol Units
Material Glass wool -- -
Density 30 ρ ρ Kg / m3
Declared Thermal
Conductivity (10 °C)
0,032 λ λ W/m.K
Thickness 50 t t mm
Thermal Transmittance 0.7143 U-Value W / m2.K
Specific Heat 840 c J / kg.K
Some characteristics of glass wool are shown in table 7 above.
Wall board (mid-insulation) is a glass wool insulation material in the form of a board
which is a good water repellent due to the silicone constituent it contains. It functions

70
as an insulation layer sandwiched between two wall layers for fire, thermal and
sound isolation as shown in figure 25 below.
Figure 25 İzocam Wall Board or Mid-wall insulation (http://www.izocam.com.tr,
Last Accessed 15 / 03 / 2014).
Figure 26 İzocam Optimum Wall or Interior insulation (http://www.izocam.com.tr,
Last Accessed 15 / 03 / 2014).

71
Optimum wall (interior insulation) is a glass wool insulation included under the
category of blankets with a special kraft paper layer on one side. It may be applied as
a thermal and sound insulation layer located to perform its function over exterior
walls, interior surfaces of all kinds of reinforced concrete elements, internal and
adjacent walls, boundary walls of staircases and elevator pit walls and as interior
wall insulation to timber framed construction. Its parts could be installed with a
special system of fastening equipment and accessories as shown in figure 26 above.
2.3 Thermal Simulation
In the past before the creation of computer-aided building simulation, architects and
building services depended at large on manual calculations utilizing data of
previously designed buildings or the ‘rule-of-thumb’ estimation or extrapolation
methodology for new designs that have not been analyzed previously. As a result,
this method of calculation mostly led to oversized heating or cooling systems and
thus poor energy performance. Even though such calculations were inaccurate for
small buildings, it was unimaginable to design energy efficiency calculations for
complex buildings without the usage of computer-aided detailed building simulation
programs (BSPs). Nowadays, BSPs working in personal computers help architects
and engineers to simulate and design new and variant energy efficient buildings
before proceeding to the construction stage. In addition, through parametric analysis,
specialists could simulate buildings for new technologies and innovations that could
improve energy efficiency (Hong, 2000).
With the advent of computers, building simulation began in the 1960’s and further
continued through the 1970’s. During these years much of the research activities
were concentrated in investigations of fundamental theory and algorithms of load and
energy approximation. These investigations led to much refinements of the transfer
function technique which was put forward by Mitalas and Stephenson (Mitalas,
1967); (Stephenson, 1967), and the widely known methods like the degree-day
method, the bin method, and the equivalent full load hour method, all having the

72
function of predicting the energy expenditure in buildings (ASHRAE, 1997). During
this time these simulation techniques played an important role in achieving thermal
energy efficiency within even the most complex of building.
After the oil crisis was over, during the late seventies and early eighties, interest in
achieving energy efficiency in buildings decreased. However with the introduction of
desk-top personal computers attention to building energy simulation once again
increased. During this same time, the US Department of Energy invested an amount
of $1 billion on R&D projects on energy conservation and renewable energy. As a
result, a number of popular detailed building and energy systems simulation
programs like DOE-2 (US Department of Commerce, 1980), ESP (Clarke, 1988) and
TRNSYS (Solar Energy Laboratory, 1988) became available for easy usage by
architects and engineers. Even though building simulation programs (BSPs) still
existed, they were not used due to their difficult implementation and high cost.
Design Builder 2.2.5.004 v, is a dynamic building energy simulation software that is
used to simulate interior thermal environment including the cooling and heating
loads in the investigated apartment flats throughout the year. It is the first
comprehensive user interface to use the Energy Plus dynamic thermal simulation
engine. It can simulate the thermal behavior of any building with a number of zones
for various climates and different usage conditions. The input data involves the
occupancy schedules, heating and cooling operations periods, HVAC systems,
lighting systems, and house equipment. Moreover, as an output, the heat gains /
losses through the building elements, the HVAC system, the lighting system, and the
occupants and interior thermal conditions, for example, air temperature, radiant
temperature, operation temperature, and relative humidity (Maçka and Yalçın, 2011);
(http://www.designbuilder.co.uk, 2009, Last Accessed 05 / 02 / 2014).
Climate Consultant is user friendly program that provides an understanding of the
local climate to the architect, the builder, the contractor, the homeowner, the student
by means of graphic-based output data. An important requirement for the operation

73
of this program is the initial installation of different yearly 8760 hour EPW format
climatic data applicable to thousands of weather stations around the world. This
Climatic data is available at no cost by the Department of Energy. Climate
Consultant uses this climatic data to create a number of informative graphs whose
aim is to understand the local climate as well as the climates influence on the
building form. In this way advice to more energy efficient and sustainable buildings
is forwarded for many climates at many locations on earth (http://www.energy-
design-tools.aud.ucla.edu/, Last Accessed 05 / 02 / 2014).
2.4 Life Cycle Cost Analysis
The life Cycle Cost is the total cost of owning, operating, maintaining, repairing,
replacing and disposing of a building or a building system over a period of time. By
means of an analytical study this summation is done to find an approximation of the
net yearly cost for the building unit life under consideration, with attention to the
time value of money (Boussabaine and Kirkham, 2003); (Maçka and Yalçın, 2011).
In addition, to find the unit’s life cycle cost, all the future costs during the study
period must be discounted to the present value, except for the initial capital
investment of the project. The following formula is used to calculate the life cycle
cost (LCC) (Manioğlu, 2002); (Maçka and Yalçın, 2011):
LCC = I + M-R-O + R – RV, where
LCC : Life cycle cost
I : Initial capital investment
M-R-O : Maintain-repair-operation cost
R : Replacement cost
RV : Residual value
However, since the costs for owning, maintaining, repairing, replacing and disposing
of the glazing window alternatives and the wall sections investigated in this thesis

74
over the study period of thirty years were not known, only the initial investment and
operation costs were documented and their resultant data were used in calculating the
economic efficiency.

75
CHAPTER 3
MATERIAL AND METHODOLOGY
This part of the thesis includes a description regarding the material investigated and
informative details regarding Ankara climate obtained from climate consultant
program as well as the details clarifying the methodology and method followed.
3.1 Material
The apartment residential building investigated is a typical building in Turkey
located in Ankara. The construction completion dated back to 2009 and according to
the surrounding buildings it was the latest. This thesis attempted to test the building
envelope of all the flats, three in number, in the apartment first floor. Figure 27
below shows the photograph of the apartment building exterior investigated.
Figure 27 Apartment photograph (14 / 11 / 2013).

76
Figure 28 below shows the typical floor plan (first floor) with three apartments
namely the flat-1 facing South-West, flat-2 facing South-East and flat-3 facing
North.
Figure 28 Apartment first floor plan (Keçiören Municipality).

77
Figure 29 below shows the architectural system section details through the main
elevation of the apartment.
Figure 29 Project section details (Keçiören Municipality).

78
Figures 30, 31, 32, 33, 34 and 35 show the perspectives and zone details of the flat-1,
flat-2 and flat-3 obtained from the simulation software Design Builder.
Figure 30 Flat-1 South-Western perspective (Design Builder).
For flat 1 22.2% of the windows face South, 44.4% of the windows face West, while
33.3% are vents facing internal voids.
Figure 31 Flat-1 Interior zone details (Design Builder).

79
Figure 32 Flat-2 South-Eastern perspective (Design Builder).
For flat 2 22.2% of the windows face South, 44.4% of the windows face East, while
33.3% are vents facing internal voids.
Figure 33 Flat-2 Interior zone details (Design Builder).

80
Figure 34 Flat-3 Northern Eastern perspective (Design Builder).
For flat 3 37.5% of the windows face North, 25% of the windows face West, while
12.5% of the windows face East, while 25% are vents facing internal voids.
Figure 35 Flat-3 Interior zone details (Design Builder).

81
As shown in figures 30, 32 and 34 above, an adiabatic surface was used in the
ground floor and the second floor as well as the adjacent zones for each of the flats.
This application of adiabatic adjacency meant that the heat was not transferred across
to the nearby zones from the three flats. This fact was required in this study since the
heat released by the heating system was not to be lost to either the ground floor or
second floor or to the nearby zones thus a heat equilibrium was maintained. The only
thermal activity occurring was that along the entirety of each flat internally and most
importantly through the opaque (walls) and transparent (windows) components of
each of the three flats building envelopes.
3.1.1 Windows Under Investigation
In this thesis, the part that involved the window glazing investigation included three
types of commonly used window alternatives in Turkey. The types are:
1) ISICAM KLASIK (4 + 16 + 4) cm. This was the simplest of the three
windows and was used as the reference window. (U-Value = 2.715
W/m2.K).
2) ISICAM SINERJI (4 + 16 + *4) cm. This type of window glazing
satisfies the TS 825 standard requirement. Due to this reason it is used
widely in Turkey. (* Represents the location of low-e Coating) (U-
Value = 1.548 W / m2.K).
3) ISICAM SINERJI 3+ (4* + 16 + 4 + 16 + *4) cm. This type of
window glazing provided higher performance in cold climates. It also
satisfied the TS 825 Standard. (* Represents the location of low-e
Coating) (U-Value = 0.778 W / m2.K)
For the sake of investigation, the window alternative which was the most energy
efficient and was the most economically efficient was compared to the other window

82
alternatives. Their thermal behavior was tested for the cold dominant climate of
Ankara. To find out the heating loads, the window alternatives were simulated
keeping the base case alternative as the basic measure. In addition, this simulation
calculated the monthly and yearly heating loads produced by the three different
windows for the three different apartment flats and the outputs were obtained.
The initial investment cost of the window alternatives in terms of unit price per
square meter was found and by adding this cost for each window to the energy
operation cost of each window the required economic efficiency calculations were
obtained.
Table 8 Characteristics of used materials of the case study.
Thermal
Conductivity
(W / m.K)
Specific Heat
Capacity (J /
kg.K)
Density
(kg /
m3)
Gypsum Insulating Plaster 0.180 1000 600
MW Glass wool (High Performance
Panels)
0.032 840 30
XPS Extruded Polystyrene-CO2
Blowing
0.034 1400 35
EPS Expanded Polystyrene-Standard 0.040 1400 15
13.5 cm Brick Block 0.320 1000 600
8.5 cm Brick Block 0.320 1000 650
Aerated Autoclaved Concrete (AAC)
Block
0.110 896 2800
Heavy Weight Concrete Blocks 1.630 1000 2300
Light Weight Concrete Blocks 0.190 1000 600
Concrete Reinforced (with 2% steel) 2.500 1000 2400
Screed 0.410 840 1200
Wooden Floor 0.140 1200 650
The compositions of the interior partitions, floor and ceiling slabs and floor finishes
were maintained the same. Moreover, when the three window options were being
investigated all the other base case conditions were maintained as the existing built
situation. The properties of the building materials used in the flats are given in table
8.

83
3.1.2 Wall Sections Under Investigation
The second part of the investigation in this thesis was to test the thermal energy
efficiency of four wall system sections for each of three different types of block
materials namely Aerated Autoclaved Concrete (AAC) Blocks, Heavy Weight
Concrete Blocks, and Light Weight Concrete Blocks. The three different block wall
system configurations are shown in the figures 36, 37 and 38. As an investigation
the building envelope, represented by the different wall system sections, which was
the most energy efficient and most economically efficient was compared from the
results of the simulation and the consequent initial investment and operation costs
were estimated. To find out the heating loads produced by the heating system, the
wall system sections were simulated keeping the base case option as the constant
measure.
Here the areas of the different block wall components were calculated to find the
initial investment and operation costs and from the data obtained from the simulation
their heating loads for the cold dominant climate of Ankara were obtained. The
original construction was taken as the base case and the study was held for three
different flat apartments in one floor. To obtain the initial capital investment cost of
each of the different wall system sections, a calculation including the total unit area
in m2 multiplied by the unit cost per square meters was undertaken. To find the
operation cost of each of the different wall system sections, a calculation involving
the unit cost per kWh of the fuel used for heating was multiplied by the yearly total
heating output. By the addition of the initial capital investment costs of the wall
system sections to the operation costs which included the block costs per unit area,
the insulation as well as the workers’ production the investigated calculations were
obtained. Moreover, since during the study period of the building the maintenance,
repair and replacement costs were not known they were not added to the calculation.

84
Figure 36 Aerated Autoclaved Concrete Blocks for four different Wall System
Sections and The Base Case Section.

85
Figure 37 Hollow Heavyweight Concrete Blocks for four different Wall System
Sections and The Base Case Section.

86
Figure 38 Hollow Lightweight Concrete Blocks for four different Wall System
Sections and The Base Case Section.
The information regarding the apartment flat zones, their areas, the total area of each
flat and the dimensions and areas of the windows with their orientation were given in
table 9 below.

87
Table 9 The zonal and window size information (Keçiören Municipality).
Zone Flat-1
Area (m2)
Window Dimension and Orientation
L (m) H (m) Area (m2) Direction
Saloon (Win.) 27.1500 2.20 1.60 3.52 S
Saloon (Door) ---- 0.90 1.30 2.06 W
Kitchen 9.8150 1.40 1.30 1.82 W
M. Bedroom 15.2250 1.50 1.30 1.95 W
Bedroom-1 11.8125 1.70 1.30 3.10 S
Bedroom-2 8.4350 1.20 1.30 1.56 W
Laundry 1.9575 ---- ---- --- ----
Bathroom 3.0725 0.40 0.50 0.20 IV
Bath 1.9500 0.40 0.50 0.20 IV
WC 1.5950 0.50 0.50 0.25 IV
Corridor 9.4800 ---- ---- ---- ----
Total 103.5632 = 14.66
Flat-2
Area (m2)
Saloon (Win.) 27.1500 2.20 1.60 3.52 S
Saloon (Door) ---- 0.90 1.30 2.06 E
Kitchen 9.8150 1.40 1.30 1.82 E
M. Bedroom 15.2250 1.50 1.30 1.95 E
Bedroom-1 11.8125 1.70 1.30 3.10 S
Bedroom-2 8.4350 1.20 1.30 1.56 E
Laundry 1.9575 ---- ---- 1.78 ----
Bathroom 3.0725 0.40 0.50 0.20 IV
Bath 1.9500 0.40 0.50 0.20 IV
WC 1.5475 0.50 0.50 0.25 IV
Corridor 9.4800 ---- ---- ---- ----
Total 105.2381 = 14.66
Flat-3
Area (m2)
Saloon 24.5250 2.20 1.60 3.52 N
Kitchen 14.1400 1.40 1.30 3.09 E
M. Bedroom 12.0000 1.50 1.30 1.95 W
Bed-1 (Win.) 13.5300 1.50 1.30 1.95 N
Bed-1 (Door) ---- 0.90 1.30 1.17 W
Bedroom-2 12.2100 1.50 1.60 2.40 N
Laundry 1.4975 ---- ---- ---- ----
Bathroom 5.7700 0.40 0.50 0.20 IV
WC 1.4375 0.30 0.50 0.15 IV
Corridor 8.9400 ---- ---- ---- ----
Total 107.0125 = 14.43

88
3.2 Ankara Climate
Ankara with its elevation, inward location and its cold snowy winters and hot, dry
summers is classified to have a continental climate. Ankara’s spring and autumn are
rainy. Under Köppen's climate classification, Ankara is classified to have a temperate
climate. Due to its high altitude and dry summers Ankara’s summer nights are cool
(World Map of the Köppen-Geiger Climatic Classification, 2010).
Continental climate is known to have yearly changes in temperature because of the
non-existence of water bodies in its vicinity. During winter another feature common
to continental climate is its cold temperature that is enough to support a common
period of snow each year. The data shown in table 10 documents the record high,
average high, average low and record low temperatures (°C) of Ankara climate
obtained between 1960 and 2012 (Turkish State Meteorological Service).
Table 10 Ankara climatic details (Turkish State Meteorological Service).
Climate data for Ankara (1960–2012)
Month Jan Feb Mar Apr May Jun Jul Aug Sep Oct Nov Dec Year
Record
high °C
16.6
19.9
26.4
30.6
33.0
37.0
41.0
40.4
36.0
32.2
24.4
19.8
41.0
Average
high °C
4.3
6.4
11.7
17.2
22.2
26.6
30.2
30.2
26.0
19.9
12.8
6.6
17.8
Average
low °C
-3.0
-2.2
1.0
5.7
9.7
13.0
16.0
16.0
11.9
7.4
2.5
-0.6
6.5
Record
low °C
-21.2
-21.5
-19.2
-6.7
-1.6
4.7
6.8
6.3
2.5
-3.4
-10.5
-17.2
-21.5
3.2.1 Temperature Range According to Climate Consultant
As seen from the temperature range graph below and according to data obtained from
climate consultant, the comfort temperature range for the city of Ankara is between
20 ˚C to 25 ˚C. Starting from January, the recorded high temperature, the design high

89
temperature, the average high temperature, the mean temperature, the average low
temperature, the design low temperature, and the recorded low temperature in a
sequence increase steadily from January up to July. From August to December these
temperatures decrease steadily as shown in figure 39.
Figure 39 Monthly temperature range within Ankara according to Climate
Consultant.
3.3 Methodology
For this investigation, three flats located in the first floor have been selected. Table 9
shows the zones within the flat, the area of the flats, size and area of the windows.
In terms of windows, aluminum frames are thermally not as efficient as timber or
UPVC as they will transmit heat and cold air in and out of the building. Moreover
since UPVC has more advantages to other frames it was preferable. So the frame that
was applied to the three different window glazing alternatives and input into the
simulation was UPVC.

90
3.3.1 Method
The investigation in this thesis constituted the usage of a computer program. It was
known as “Design Builder”. Design builder was a multi-zone simulation software
which calculated the thermal indoors of the flats investigated during any period of
time and in this thesis the period was an entire year. Data collected from this
program would help in thermally analyzing the different building envelope
alternatives investigated in this thesis.
A wide range of building types could be analyzed using this software and in this
case, three flats. Energy simulations of real designs could be obtained. The input data
in the software included the following:
1) Activity template:
From all the activity templates that included different building types such as
airport terminals and bus stations to workshops and maintenance depots, the
selected template in this thesis was the dwelling template. This template
consisted of the following sub-topics:
i) Occupancy:
This included the number of people per unit floor area data included
within the building zones. It was supported and controlled by the
occupancy schedules for example the bed, the bath, the circulation, the
lounge, the dining, the kitchen and the toilet schedules.

91
ii) Metabolic rate:
This was the energy spent in a given period in a particular space or zone.
It included values ranging from 1.00 for men, 0.85 for women or 0.75
for children.
iii) Holidays:
This was useful in documenting the days of the year where the occupants
were at home or were away from home. It was in the form of a schedule
which, once input into the design builder software, was included in the
simulation calculation
iv) Domestic Hot Water:
This was the heat energy required for the supplied water in the wet areas.
v) Environmental Control:
This documents the set-point and range of the HVAC heating and cooling
as well as the ventilating temperatures, whether they are natural or
mechanical. In addition, the fresh air amount per person and the
mechanical ventilation per unit area was also included. However, in this
investigation, the effect of mechanical ventilation was ignored in order to
study the effect of passive design strategies natural ventilation was
selected.
vi) Computer:
This was the option of the energy spent using computers.

92
vii) Office equipment:
This was the option of the energy spent using office equipment.
viii) Miscellaneous equipment:
This was the option of the energy spent for electrical equipment e.g.
television, radio etc.
ix) Catering equipment:
This was the option of the energy spent for kitchen electrical equipment
e.g. electrical stove, dishwasher etc.
ix) Process equipment:
This was the option of the energy spent for other electrical equipment
e.g. washing machine etc.
2) Construction template:
This included the documentation of external walls, internal partitions, flat
roofs, pitched roofs, ceilings, and floors.
3) Openings template:
This was the openings or glazing system used within the building spaces or
zones. The windows may be single, double or triple with different
dimensions, frame types and dividers. Windows may also be external,
internal or roof glazing. Doors were also included in this template.

93
4) Lighting template:
This was the lighting system used within the building spaces or zones. The
lighting location, whether external or internal, is also included.
5) Heating, ventilation and air conditioning (HVAC) template:
This template allows for the choice for different HVAC systems. It included
the fuel whether electrical or natural gas used in its operation. The HVAC
system used is hot water radiator in winter and natural ventilation in summer.
The occupants used the flats during the entire day and night. The tables in
APPENDIX MM indicated the occupancy schedule during the day and night for the
weekdays and weekends for all the zones of the three flats including the holidays.
The lighting schedule matches the above occupancy schedules because whenever the
different zones are in use the lighting would be in use. On the other hand, the data of
other electricity operated devices such as televisions and computers located in the
living rooms and bedrooms, the stove, washing machine and refrigerator located in
the kitchen, are input in the activity template by switching on the computer, office
equipment, miscellaneous, Catering and process options. The zone occupancy
schedule also applies for these electricity operated devices with the exception of the
refrigerator which continues to be in use even when the kitchen is not in use.
The living room (saloon), kitchen and the entire bedrooms, bathrooms and corridors
being the flats constituents are heated by the heating radiators and cooled by natural
ventilation, while corridors, bath, WC, and laundry are not heated or cooled. Toilets
and bathrooms are ventilated by natural means with a ventilation rate considered as 7
air-changes per hour (achs).

94
The known factors of initial investment and operation costs in this thesis were
considered instead of the entire life cycle cost which involves knowing the total cost
of owning, operating, maintaining, repairing, replacing and disposing of a building or
a building system over a period of time. As mentioned earlier since all the other
factors such as owning, maintenance, repairing, replacing and disposing are not
known, they may be considered as typical constants in all calculations. Thus their
effect on the total initial investment and operation costs calculations of the glazing
alternatives and different wall sections would be relatively proportional. So only the
initial investment and operation costs calculations were considered in thesis. The
factors used in the initial investment and operation costs estimation are given in table
11 below.
Table 11 The factors used in the Initial Investment and Operation Costs Estimation.
Analysis type Initial Investment and Operation Costs
Beginning date 2007
Study period 30 years
Planning/Construction period 2 years
Service date 2009
Life of glazing 60 years
Fuel type Natural gas, electricity
The unit cost of natural gas 0.08686175 TL / kWh (for 01 / 04 / 2014)
The unit cost of electricity 0.28386 TL / kWh (for 01 / 10 / 2012)
The unit cost of Water 2.26 TL / m3 (for 04 / 04 / 2014)

95
CHAPTER 4
RESULTS AND DISCUSSION
Firstly the monthly and yearly heat gains through the three window glazing
alternatives in the investigated flat-1, flat-2 and flat-3 are given. This is followed by
monthly and yearly heat load production by the heating system for all the wall
system sections in the investigated flat-1, flat-2 and flat-3. The heat losses and gains
percentage through all the three window glazing alternatives for flat-1, flat-2 and
flat-3 are included next. The heat losses percentage through all the wall sections for
flat-1, flat-2 and flat-3 are included. Finally the initial capital investment and
operation costs calculations for the three glazing window alternatives and the
different wall system sections are also included.
4.1 Comparing Monthly Heat Gains Through the Different Glazing Windows in
Flat-1, Flat-2 and Flat-3
From figure 40 and according to the simulation, the monthly heat gains for the three
glazing window alternatives are obtained from January to December. The numerical
results of the simulation are shown in APPENDIX VV.
According to the simulation, a pattern is seen by the three glazing window types in
that the winter months receive lesser heat gains when compared to the summer
months. A steady rise in heat gain occurs from winter to summer before a steady
decline in heat gain from summer to winter is noticeable.
According to the simulation, it could be concluded that in the temperate cold climate
of Ankara the least energy gain occurs through ISICAM SINERJI 3+ followed by
that through ISICAM SINERJI and finally through ISICAM KLASIK. This may

96
explained due to the respective lower thermal transmittance value (U-Value) from
the first alternative to the second alternative to the third.
Figure 40 Monthly heat gains through the three window glazing alternatives in the
investigated flat-1, flat-2, flat-3 kWh.

97
According to the simulation, the monthly heat gains for the three glazing window
alternatives namely ISICAM KLASIK, ISICAM SINERJI and ISICAM SINERJI 3+
were similar for flat-3. This may be explained to the fact that this Northern facing
flat-3 receives the least solar energy and thus the glazing windows have minimized
reaction with the immediate exterior even though they were meant to react
differently.
Another conclusion was that when the glazing alternatives namely ISICAM
KLASIK, ISICAM SINERJI and ISICAM SINERJI 3+ were compared more heat
gains were recorded for flats-2 when compared to flat-1. This may be explained due
to the fact that the Southern-Eastern facing flat-2 is exposed to solar heat more than
the Southern-Western facing flat-1.
In all the months, the performance of ISISCAM SINERJI 3+ in terms of heat gains
for flat-1 and flat-2 was the least thus indicating its high performance. This is
advantageous in the summer months since less heat gains are transmitted to the
interiors. In the winter months this performance of ISICAM SINERJI 3+ indicates
that even though less heat was gained to the interior from the exterior, at the same
time less heat was lost from the interior to the exterior because of its high thermal
performance.
4.2 Comparing Monthly Heat Load Production by the Heating System Through
All the Different Wall Sections in Flat-1, Flat-2 and Flat-3
Figures 41, 42, and 43 shown below represent the monthly heat loads production by
the heating system for the base case, 1A, 1B, 2A, 2B, 3A, 3B wall system sections of
flat-1, flat-2 and flat-3. The numerical results obtained from the simulation could be
seen in APPENDIX WW. The simulation provides heating load production
throughout the entire months of the year, from January to December.
98
One conclusion that could be added is regarding the wall sections involving AAC
blocks namely 1B, 1C and 1D, heavyweight concrete blocks namely 2B, 2C and 2D
and lightweight concrete blocks namely 3B, 3C and 3D. According to the simulation
these wall sections in each of their category perform almost similar with little
numerical difference as could be seen in APPENDIX WW and figuratively as
shown in APPENDIX AAA.
The severity of the winter months could be concluded from the simulation results.
An increase of the heat load production by the heating system starts from October, to
November and then to December and January which together produce the highest
heat loads. From January to February and then to March the heating loads reduce
gradually.
From the simulation program, the schedule of the heating system was selected as the
winter (northern hemisphere). This schedule calculates the heating load production in
the winter months from the beginning of October, throughout November, December,
January, February and finally March. The other months from April, May, June, July,
August and September are counted as the summer months where the heating system
would be turned off and only natural ventilation would be used for cooling the
interior spaces.
Another conclusion obtained from the simulation results for all the flats and for all
the walls system sections which have no insulation, namely 1A, 2A and 3A, from the
different types of blocks from Aerated Autoclaved Concrete Block, to heavyweight
concrete blocks and to lightweight concrete blocks, the maximum heat loads are
produced by the heating system. This indicates the importance of the presence of
insulation in heat gain resistance in winter. The glass wool insulation implemented in
the other wall system sections increase the thermal performance of the wall. This is
due to the lower heat conductivity of glass wool with a value of 0.032 W/ m2.k. Thus
lesser heat is gained to the interior and lesser heat loads are produced by the heating
system by the other wall system sections other than 1A, 2A and 3A.

99
As could be seen from APPENDIX AAA, another conclusion obtained from the
simulation results for the wall sections involving heavyweight concrete blocks
namely 2A, 2B, 2C and 2D, the highest heat load production from the heating system
was achieved when compared to the other heat load production resulted by the other
wall sections involving AAC blocks namely 1A, 1B, 1C and 1D and lightweight
concrete blocks namely 3A, 3B, 3C and 3D. This may be explained due to the fact
that heavyweight concrete blocks have the highest heat conductivity value of 1.63 W
/ m2.k, when compared to that of AAC blocks and Lightweight concrete blocks
which have the thermal conductivity of 0.11 W/ m2.k and 0.19 W / m2.k
respectively. The difference in conductivity affects the heat transfer through the
walls even though insulation is included. Thus higher heat transfer through the wall
section occurs and higher heat load production is released by the heating system to
maintain interior comfort. Therefore in a sequence, in order to provide the same
interior comfort, according to the simulation results AAC blocks produce the best
and least amount of heat load production by the heating system, followed by
lightweight concrete blocks and then heavyweight concrete blocks.
When comparing the monthly total heat loads production by the heating system for
the three flats 1, 2 and 3 under investigation, a similar pattern of thermal behavior
was noticed from the winter to the summer months and vice versa. Heat load
production decreased steadily from the winter months to the summer months and
increased steadily from the summer months to the winter months but with a
difference. This difference indicates that when considering the heat load production
by the heating system the most energy was released by flat-3, followed by flat-1 and
then by flat-2. This may be explained due to the fact that flat-3 which is the North
facing flat received the least solar energy when compared to the other flats and thus
more heat load production is required to achieve the needed interior thermal comfort.
In addition, the least heat load production is achieved for flat-2 when compared to
the other flats. This may be explained due to the fact that it received the maximum
solar energy since it is the flat facing the South-East. This extra solar energy helps in

100
the interior heat gain and thus in order to achieve the required interior comfort lesser
heat load production in necessary by the heating system.
Figure 41 Monthly heat load production by the heating system for some Wall
Sections in the investigated flat-1 kWh.

101
Figure 42 Monthly heat load production by the heating system for some Wall
Sections in the investigated flat-2 kWh.

102
Figure 43 Monthly heat load production by the heating system for some Wall
Sections in the investigated flat-3 kWh.

103
4.3 Comparing Yearly Heat Gains Through the Different Glazing Windows in
Flat-1, Flat-2 and Flat-3
According to the simulation, the yearly heating loads transmitted to the interiors were
determined by the usage of a heating gain measure by the glazings during the heating
period. Figures 44 shows the yearly heating gains of the glazing window alternatives
used in the respective study flats. The figure below indicates that for the three
different glazing alternatives, those in flat-2 receive more solar heat when compared
to flat-1. However, according to the simulation, the three different glazing
alternatives in flat-3 perform similarly. This may be explained due to the fact that in
this Northern facing flat little solar energy was received and since the high
performance glazing performs well with the presence of solar energy the heat gain
was minimized.
Figure 44 Yearly heating gains through the three window glazing alternatives in the
investigated flat-1, flat-2 and flat-3- kWh/y.

104
4.4 Comparing Yearly Heat Load Production by the Heating System Through
All the Different Wall Sections in Flat-1, Flat-2 and Flat-3
According to the simulation the annual heating loads are determined by the measure
of the net load production of the heating system.
Figure 45 Yearly heating load production of the Wall Sections- Base, 1A, 1B, 1C,
1D, 2A, 2B, 2C, 2D, 3A, 3B, 3C, 3D units in flat-1, kWh / year.
According to figures 45, 46, and 47, the yearly heating loads results obtained from
the simulation show that in flat-1 the wall sections 1A, 1B, 1C and 1D involving
Aerated Autoclaved Concrete Blocks produced the best performance of the heating

105
system in terms of heating load production thus AAC blocks configuration provided
the most heat energy saving in order to achieve the required interior comfort. This
was followed by the wall sections 3A, 3B, 3C and 3D involving Lightweight
Concrete Blocks, and then followed by the wall sections 2A, 2B, 2C and 2D
involving Heavyweight Concrete Blocks.
Figure 46 Yearly heating load production of the Wall Sections- Base, 1A, 1B, 1C,
1D, 2A, 2B, 2C, 2D, 3A, 3B, 3C, 3D units in flat-2, kWh / year.
This may be explained due to the difference in the conductivities of different
construction block used, where Aerated Autoclaved Concrete Blocks have the least
conductivity of 0.11 W / m2 . K followed by Lightweight Concrete Blocks with a

106
conductivity of 0.19 W / m2 . K and then Heavyweight Concrete Blocks with a
conductivity of 1.63 W / m2 . K. The difference in conductivity affects the heat
transfer through the walls even though insulation is used. The higher the conductivity
of the material, the higher the heat is transferred through the wall section.
Figure 47 Yearly heating load production of the Wall Sections- Base, 1A, 1B, 1C,
1D, 2A, 2B, 2C, 2D, 3A, 3B, 3C, 3D units in flat-3, kWh / year.
The thermal behavior pattern in flat-1 is repeated in the other flat-2 and flat-3,
however to different extents. According to the simulation, flat-2 produced the least
results in heat load performance followed by flat-1, and then followed by flat-3. This
may be explained by the fact that the Southern Eastern facing flat-2 received the
most solar energy which when added to the interior heating system lesser heating

107
load is required to achieve interior thermal comfort in winter. The yearly energy
expenditure obtained from the simulation results are used to calculate the operation
costs which is further added to the initial investment cost. It is important to mention
that the initial investment and operation costs value for the window glazing options is
first calculated and then that for the different wall sections is also calculated.
4.5 Percentages (%) of Heat Gains and Losses Through the Window Glazings in
Flat-1, Flat-2, Flat-3
According to Maçka and Yalçın in 2011 the heat losses and gains are considered to
be as follows:
“Heat losses occur through glazings, walls, floors, roofs, doors and
ventilation, external infiltration, and external ventilation, while heat gains
occur through general lighting, miscellaneous systems, occupancy, domestic
hot water, heat generation, solar gains from exterior windows, room
electricity, and computer and equipment in building.” (Maçka and Yalçın, 2011).
Figure 48 Heat losses (%) through the three window glazing alternatives in flat-1,
flat-2 and flat-3 obtained from the simulation results.

108
From figure 48, 7% of the heat losses in flat-1 occur by ISICAM KLASIK glazing,
4% of the heat losses occur by ISICAM SINERJI and 3% of the heat losses occur by
ISICAM SINERJI 3+. Therefore heat energy savings of 3% and 4% were obtained
by ISICAM SINERJI and ISICAM SINERJI 3+ glazings respectively when
compared to the ISICAM KLASIK glazing.
From figure 48, 7% of the heat losses in flat-2 occur by ISICAM KLASIK glazing,
5% of the heat losses occur by ISICAM SINERJI and 3% of the heat losses occur by
ISICAM SINERJI 3+. Therefore heat energy savings of 2% and 4% were obtained
by ISICAM SINERJI and ISICAM SINERJI 3+ glazings respectively when
compared to the ISICAM KLASIK glazing.
From figure 48, 7% of the heat losses in flat-3 occur by ISICAM KLASIK, ISICAM
SINERJI and ISICAM SINERJI 3+ glazings. This indicates similar thermal behavior
of the glazing alternatives for flat-3. As mentioned earlier, this may be explained to
the fact that little solar energy is received by the North facing flat-3.
From figure 49, 30% of the heat gains in flat-1 occur by ISICAM KLASIK glazing,
24% of the heat gains occur by ISICAM SINERJI glazing and 16% of the heat gains
occur by ISICAM SINERJI 3+ glazing. Therefore heat energy savings of 6% and
14% were obtained by ISICAM SINERJI and ISICAM SINERJI 3+ glazings
respectively when compared to the ISICAM KLASIK glazing.
From figure 49, 31% of the heat gains in flat-2 occur by ISICAM KLASIK glazing,
27% of the heat gains occur by ISICAM SINERJI glazing and 17% of the heat gains
occur by ISICAM SINERJI 3+ glazing. Therefore heat energy savings of 4% and
14% were obtained by ISICAM SINERJI and ISICAM SINERJI 3+ glazings
respectively when compared to the ISICAM KLASIK glazing.
From figure 49, 20% of the heat gains in flat-3 occur by ISICAM KLASIK, ISICAM
SINERJI and ISICAM SINERJI 3+ glazings. This indicates similar thermal behavior

109
of the glazing alternatives for flat-3. As mentioned earlier, this may be explained to
the fact that little solar energy is received by the north facing flat-3.
Figure 49 Heat gains (%) through the three window glazing alternatives in flat-1,
flat-2 and flat-3 obtained from the simulation results.
4.6 Percentages (%) of Heat Losses through the Wall Sections in Flat-1, Flat-2,
Flat-3
Heat losses occur through glazings, walls, floors, roofs, doors and ventilation,
external infiltration, and external ventilation (Maçka and Yalçın, 2011).
From figure 50 below, the heat losses through all the wall system sections of flat-1
were shown. From the figure, 4% of the total heat losses in flat-1 occur by the base
case wall section. A heat energy loss of 2% was obtained by wall section 1A. Similar
heat energy losses were obtained by 1B, 1C, and 1D wall sections when compared to
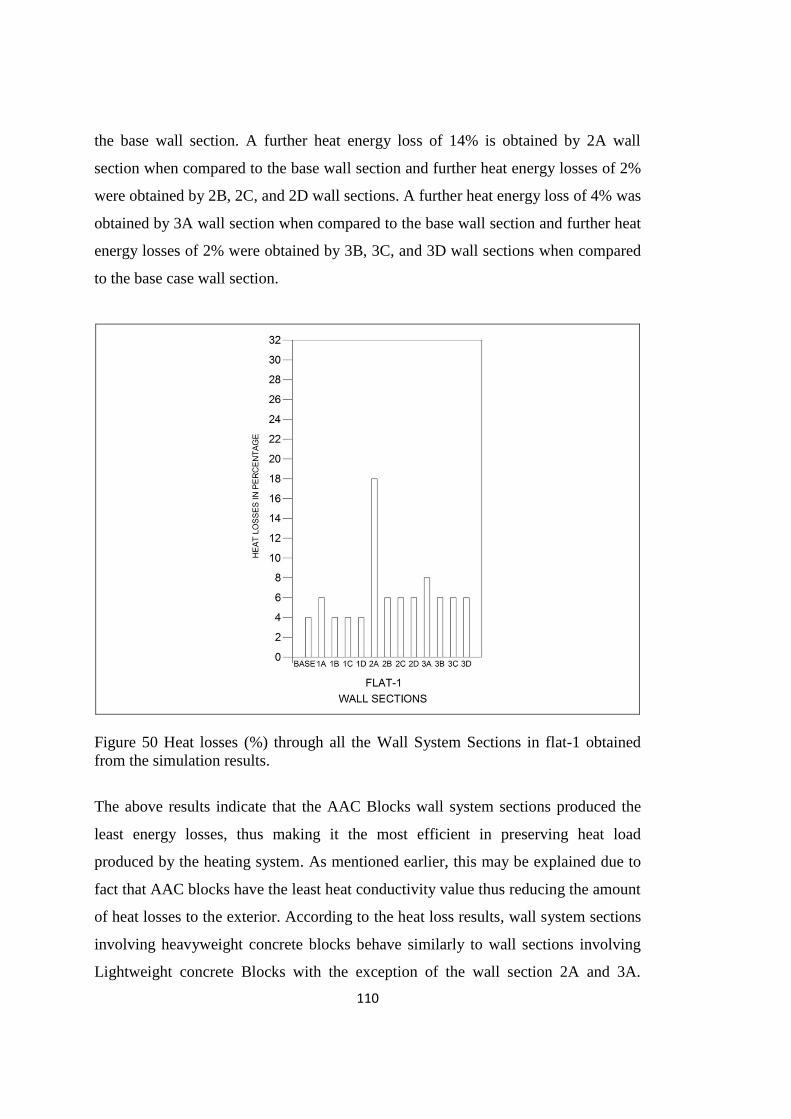
110
the base wall section. A further heat energy loss of 14% is obtained by 2A wall
section when compared to the base wall section and further heat energy losses of 2%
were obtained by 2B, 2C, and 2D wall sections. A further heat energy loss of 4% was
obtained by 3A wall section when compared to the base wall section and further heat
energy losses of 2% were obtained by 3B, 3C, and 3D wall sections when compared
to the base case wall section.
Figure 50 Heat losses (%) through all the Wall System Sections in flat-1 obtained
from the simulation results.
The above results indicate that the AAC Blocks wall system sections produced the
least energy losses, thus making it the most efficient in preserving heat load
produced by the heating system. As mentioned earlier, this may be explained due to
fact that AAC blocks have the least heat conductivity value thus reducing the amount
of heat losses to the exterior. According to the heat loss results, wall system sections
involving heavyweight concrete blocks behave similarly to wall sections involving
Lightweight concrete Blocks with the exception of the wall section 2A and 3A.

111
These wall sections have no insulation and so were prompt to lose more heat to the
exterior and thus increase the load on the heating system. The heat loss percentage
values of these wall systems could be seen from APPENDIX XX.
From figure 51 below, the heat losses through all the wall system sections of flat-2
were shown. From the figure 4% of the total heat losses in flat-2 occur by the base
case wall section. A heat energy loss of 2% was obtained by wall section 1A. Similar
heat energy losses were obtained by 1B, 1C, and 1D wall sections when compared to
the base wall section. A further heat energy loss of 15% was obtained by 2A wall
section when compared to the base wall section and further heat energy losses of 2%
were obtained by 2B, 2C, and 2D wall sections. A further heat energy loss of 4% is
obtained by 3A wall section when compared to the base wall section and further heat
energy loss of 2% were obtained by 3B, 3C, and 3D wall sections when compared to
the base case wall section.
Figure 51 Heat losses (%) through all the Wall System Sections in flat-2 obtained
from the simulation results.

112
The above results indicate that the AAC Blocks wall sections produce the least
energy losses, thus making it the most efficient in preserving heat load produced by
the heating system. As mentioned earlier, this may be explained due to fact that AAC
blocks have the least heat conductivity value thus reducing the amount of heat losses
to the exterior. According to the heat loss results wall sections involving
heavyweight concrete blocks behave similarly to wall sections involving Lightweight
concrete Blocks with the exception of the wall section 2A and 3A. These wall
sections have no insulation and so are prompt to lose more heat to the exterior and
thus increase the load on the heating system. The heat loss percentage values of these
wall systems could be seen from APPENDIX XX.
From figure 52 below, the heat losses through all the wall sections of flat-3 are
shown. From the figure 4% of the total heat losses in flat-3 occurs by the base case
wall section. A heat energy loss of 2% is obtained by wall section 1A. Further heat
energy gains of 1% were obtained by 1B, 1C, and 1D wall sections when compared
to the base wall section. A further heat energy loss of 15% is obtained by 2A wall
section when compared to the base wall section and further heat energy losses of 2%
were obtained by 2B, 2C, and 2D wall sections. A further heat energy loss of 4% was
obtained by 3A wall section when compared to the base wall section and similar heat
energy losses were obtained by 3B, 3C, and 3D wall sections when compared to the
base case wall section.
The above results indicate that the AAC Blocks wall sections produce the least
energy losses, thus making the heat load production demand by the heating system
the most in these sections. The reduction in heat energy by wall sections 1B, 1C and
1D was due the north facing flat-3 which receives the least solar energy and together
with the low conductivity of AAC blocks lesser heat losses were produced by these
wall sections. This is also applicable to wall sections 3B, 3C and 3D which also
produce lesser heat losses for flat-3 when compared to those results of flat-1 and flat-
2. As mentioned earlier, this may be explained due to the fact that lightweight
concrete blocks have low heat conductivity values thus reducing the amount of heat

113
loss to the exterior. According to the heat loss results, wall sections involving
heavyweight concrete blocks lose heat more than the wall sections involving
lightweight concrete blocks due to the difference in conductivity with the exception
of the wall section 2A and 3A. These sections have no insulation and so are prompt
to lose more heat to the exterior and thus increase the load on the heating system
Wall sections. The heat loss percentage values of these wall systems sections could
be seen from APPENDIX XX.
Figure 52 Heat losses (%) through all the Wall System Sections in flat-3 obtained
from the simulation results
4.7 Initial capital investment calculation
The square-meter unit prices of the three alternative glazing units in this study were
obtained from distributers that deal with (Trakya Cam Sanayii A.S.)
(http://www.trakyacam.com.tr/, Last Accessed 18 / 03 / 2014) which is a company in
Trakya (Turkey) that produces many quality architectural window glazing products

114
that are common in the market. Since there were three window glazing alternatives,
three initial capital investments and operation costs were calculated and tabulated.
While table 12 shows the square-meter unit prices of the glazing units, table 20
shows the total initial capital investment for the glazing units in the flats. A sample
calculation for the initial cost of a glazing unit could be seen in APPENDIX ZZ.
The unit cost includes the price of the glazing, frame and labor cost for fixing.
Again it is important to mention that in this thesis only the initial capital investment
and operation costs were investigated.
Table 12 The Three Window Alternatives Under Investigation Square-Meter Unit
Costs (http://www.trakyacam.com.tr/, Last Accessed 18 / 03 / 2014)
Window Type U-Value
W/m2.k
Glazing Costs
TL + KDV / m2
ISICAM
KLASIK
4 + 16 + 4
4 (cm) Pane Thickness +
16 (cm) Cavity Thickness +
4 (cm) Pane Thickness +
Air-
2.715
225
ISICAM
SINERJI
4 + 16 + *4
4 (cm) Pane Thickness +
16 (cm) Cavity Thickness +
4 (cm) Pane Thickness +
Argon-
1.548
235
ISICAM
SINERJI
3+
4* + 16 + 4 + 16 + *4
4 (cm) Pane Thickness +
16 (cm) Cavity Thickness +
4 (cm) Pane Thickness +
16 (cm) Cavity Thickness +
4 (cm) Pane Thickness +
Argon-
0.778
335
* The location of low-e Coating (Trakya Cam Sanayii A.Ş.)
The unit costs in this thesis in terms of the different wall system sections were based
on the manufacturer. For the Base case 0.20 x 0.20 x 0.135 bricks and 0.20 x 0.20 x
0.085 bricks the manufacturer was Çorum Blok Tuğla. For the Aerated Autoclaved
Concrete the manufacturer was Akggazbeton. While for heavyweight concrete
blocks and lightweight concrete blocks the manufacturer was Expanded Shale, Clay,
and Slate institute. For the exterior, sandwiched and interior insulation products the

115
manufacturer was İzocam Ticaret ve Sanayii A.Ş. Tables 13, 14, 15, 16, 17 and 18
document the total costs of the wall system sections of the three different block units
including the insulation.
Table 13 Flat-1 Total Block Costs (http://www.corumbloktugla.com/,(Last Accessed
20 / 03 / 2014) (www.akggazbeton.com, Last Accessed 05 / 03 / 2014),
(http://www.escsi.org/, Last Accessed 23 / 03 / 2014).
Section Type of Block Dimensions
(W x D x L) / m
Total
Area/m2
Unit Cost
TL / m2
Total
Cost /TL
BASE BRICKS 0.20 x 0.20 x
0.135
31.015 50.000 1550.75
BASE BRICKS 0.20 x 0.20 x
0.085
31.015 37.500 1163.06
1A AAC
Blocks
0.20 x 0.25 x 0.60 31.015 130.000 4032.00
1B AAC
Blocks
0.20 x 0.25 x 0.60 31.015 130.000 4032.00
1C AAC
Blocks
0.10 x 0.25 x 0.60 62.030 75.000 4652.00
1D AAC
Blocks
0.20 x 0.25 x 0.60 31.015 130.000 4032.00
2A Heavy Weight
Blocks
0.20 x 0.20 x 0.40 31.015 32.200 999.00
2B Heavy Weight
Blocks
0.20 x 0.20 x 0.40 31.015 32.200 999.00
2C Heavy Weight
Blocks
0.10 x 0.20 x 0.40 62.030 28.325 1757.00
2D Heavy Weight
Blocks
0.20 x 0.20 x 0.40 31.015 32.200 999.00
3A Light Weight
Blocks
0.20 x 0.20 x 0.40 31.015 49.750 1543.00
3B Light Weight
Blocks 0.20 x 0.20 x 0.40 31.015 49.750 1543.00
3C Light Weight
Blocks
0.10 x 0.20 x 0.40 62.030 43.750 2714.00
3D Light Weight
Blocks
0.20 x 0.20 x 0.40 31.015 49.750 1543.00

116
Table 14 Flat-2 Total Block Costs (http://www.corumbloktugla.com/,(Last Accessed
20 / 03 / 2014) (www.akggazbeton.com, Last Accessed 05 / 03 / 2014),
(http://www.escsi.org/, Last Accessed 23 / 03 / 2014).
Section Type of Block Dimensions
(W x D x L) / m
Total
Area m2
Unit Cost
TL / m2
Total
Cost/TL
BASE BRICKS 0.20 x 0.20 x
0.135
31.015 50.000 1550.75
BASE RRICKS 0.20 x 0.20 x
0.085
31.015 37.500 1163.06
1A AAC
Blocks
0.20 x 0.25 x 0.60 31.015 130.000 4032.00
1B AAC
Blocks
0.20 x 0.25 x 0.60 31.015 130.000 4032.00
1C AAC
Blocks
0.10 x 0.25 x 0.60 62.030 75.000 4652.00
1D AAC
Blocks
0.20 x 0.25 x 0.60 31.015 130.000 4032.00
2A Heavy Weight
Blocks
0.20 x 0.20 x 0.40 31.015 32.200 999.00
2B Heavy Weight
Blocks
0.20 x 0.20 x 0.40 31.015 32.200 999.00
2C Heavy Weight
Blocks
0.10 x 0.20 x 0.40 62.030 28.325 1757.00
2D Heavy Weight
Blocks
0.20 x 0.20 x 0.40 31.015 32.200 999.00
3A Light Weight
Blocks
0.20 x 0.20 x 0.40 31.015 49.750 1543.00
3B Light Weight
Blocks
0.20 x 0.20 x 0.40 31.015 49.750 1543.00
3C Light Weight
Blocks
0.10 x 0.20 x 0.40 62.030 43.750 2714.00
3D Light Weight
Blocks
0.20 x 0.20 x 0.40 31.015 49.750 1543.00

117
Table 15 Flat-3 Total Block Costs (http://www.corumbloktugla.com/,(Last Accessed
20 / 03 / 2014) (www.akggazbeton.com, Last Accessed 05 / 03 / 2014),
(http://www.escsi.org/, Last Accessed 23 / 03 / 2014)
Section Type of Block Dimensions
(W x D x L) / m
Total
Area m2
Unit Cost
TL / m2
Total
Cost/TL
BASE BRICKS 0.20 x 0.20 x
0.135
44.685 50.000 2234.25
BASE RRICKS 0.20 x 0.20 x
0.085
44.685 37.500 1675.69
1A AAC
Blocks
0.20 x 0.25 x 0.60 44.685 130.000 5809.00
1B AAC
Blocks
0.20 x 0.25 x 0.60 44.685 130.000 5809.00
1C AAC
Blocks
0.10 x 0.25 x 0.60 89.370 75.000 6703.00
1D AAC
Blocks
0.20 x 0.25 x 0.60 44.685 130.000 5809.00
2A Heavy Weight
Blocks
0.20 x 0.20 x 0.40 44.685 32.200 1439.00
2B Heavy Weight
Blocks
0.20 x 0.20 x 0.40 44.685 32.200 1439.00
2C Heavy Weight
Blocks
0.10 x 0.20 x 0.40 89.370 28.325 2531.00
2D Heavy Weight
Blocks
0.20 x 0.20 x 0.40 44.685 32.200 1439.00
3A Light Weight
Blocks
0.20 x 0.20 x 0.40 44.685 49.750 2223.00
3B Light Weight
Blocks
0.20 x 0.20 x 0.40 44.685 49.750 2223.00
3C Light Weight
Blocks
0.10 x 0.20 x 0.40 89.370 43.750 3910.00
3D Light Weight
Blocks
0.20 x 0.20 x 0.40 44.685 49.750 2223.00

118
Table 16 Flat-1 Total Insulation Costs (http://www.izocam.com.tr, Last Accessed 15
/ 03 / 2014)
Section Type of Insulation Thickness
/ m
Total
Area
m2
Unit
Cost
TL / m2
Total
Cost/TL
BASE Extruded
Polystyrene (XPS)
0.05 31.015 13.50 418.70
BASE Expanded
Polystyrene (EPS)
0.05 31.015 7.85 243.47
1A No
Insulation
0.00 0.00 0.00 0.00
1B Exterior Insulation
(Cephepan)
0.05 31.015 6.000 186.00
1C Mid-Insulation
(Wall Board)
0.05 31.015 2.880 90.00
1D Interior Insulation
(Optimum Wall)
0.05 31.015 2.880 90.00
2A No
Insulation
0.00 0.00 0.00 0.00
2B Exterior Insulation
(Cephepan)
0.05 31.015 6.000 186.00
2C Mid-Insulation
(Wall Board)
0.05 31.015 2.880 90.00
2D Interior Insulation
(Optimum Wall)
0.05 31.015 2.880 90.00
3A No
Insulation
0.00 0.00 0.00 0.00
3B Exterior Insulation
(Cephepan)
0.05 31.015 6.000 186.00
3C Mid-Insulation
(Wall Board)
0.05 31.015 2.880 90.00
3D Interior Insulation
(Optimum Wall)
0.05 31.015 2.880 90.00

119
Table 17 Flat-2 Total Insulation Costs (http://www.izocam.com.tr, Last Accessed 15
/ 03 / 2014)
Section Type of Insulation Thickness
/ m
Total
Area
m2
Unit
Cost
TL / m2
Total
Cost
TL
BASE Extruded
Polystyrene (XPS)
0.05 31.015 13.50 418.70
BASE Expanded
Polystyrene (EPS)
0.05 31.015 7.85 243.47
1A No
Insulation
0.00 0.00 0.00 0.00
1B Exterior Insulation
(Cephepan)
0.05 31.015 6.000 186.00
1C Mid-Insulation
(Wall Board)
0.05 31.015 2.880 90.00
1D Interior Insulation
(Optimum Wall)
0.05 31.015 2.880 90.00
2A No
Insulation
0.00 0.00 0.00 0.00
2B Exterior Insulation
(Cephepan)
0.05 31.015 6.000 186.00
2C Mid-Insulation
(Wall Board)
0.05 31.015 2.880 90.00
2D Interior Insulation
(Optimum Wall)
0.05 31.015 2.880 90.00
3A No
Insulation
0.00 0.00 0.00 0.00
3B Exterior Insulation
(Cephepan)
0.05 31.015 6.000 186.00
3C Mid-Insulation
(Wall Board)
0.05 31.015 2.880 90.00
3D Interior Insulation
(Optimum Wall)
0.05 31.015 2.880 90.00

120
Table 18 Flat-3 Total Insulation Costs (http://www.izocam.com.tr, Last Accessed 15
/ 03 / 2014)
Section Type of Insulation Thickness
/ m
Total
Area
m2
Unit
Cost
TL / m2
Total
Cost
TL
BASE Extruded
Polystyrene (XPS)
0.05 44.685 13.50 603.25
BASE Expanded
Polystyrene (EPS)
0.05 44.685 7.85 350.78
1A No
Insulation
0.00 0.00 0.00 0.00
1B Exterior Insulation
(Cephepan)
0.05 44.685 6.000 268.00
1C Mid-Insulation
(Wall Board)
0.05 44.685 2.880 129.00
1D Interior Insulation
(Optimum Wall)
0.05 44.685 2.880 129.00
2A No
Insulation
0.00 0.00 0.00 0.00
2B Exterior Insulation
(Cephepan)
0.05 44.685 6.000 268.00
2C Mid-Insulation
(Wall Board)
0.05 44.685 2.880 129.00
2D Interior Insulation
(Optimum Wall)
0.05 44.685 2.880 129.00
3A No
Insulation
0.00 0.00 0.00 0.00
3B Exterior Insulation
(Cephepan)
0.05 44.685 6.000 268.00
3C Mid-Insulation
(Wall Board)
0.05 44.685 2.880 129.00
3D Interior Insulation
(Optimum Wall)
0.05 44.685 2.880 129.00

121
Table 19 The Glazing Areas of The Three Alternatives Under Investigation (m2)
Type of Glazing Total Glazing Area-m2
Flat-1 Flat-2 Flat-3
Isicam Klasik 14.66 14.66 14.43
Isicam Sinerji 14.66 14.66 14.43
Isicam Sinerji 3+ 14.66 14.66 14.43
Table 20 The total initial capital investment for the glazing units in the flats (TL)
Type of Glazing Initial Capital Investment (TL)
Flat-1 Flat-2 Flat-3
Isicam Klasik 3299 3299 3247
Isicam Sinerji 3445 3445 3391
Isicam Sinerji 3+ 4911 4911 4834
Table 21 The total initial capital investment for the Wall Sections in the flats (TL)
Type of Wall
Section
Initial Capital Investment (TL)
Flat-1 Flat-2 Flat-3
Base Case 15,022 15,022 16,510
1A 11,124 11,124 12,901
1B 11,310 11,310 13,169
1C 17,350 17,350 19,440
1D 11,214 11,214 13,030
2A 9,107 9,107 9,547
2B 9,293 9,293 9,815
2C 15,857 15,857 16,670
2D 9,197 9,197 9,676
3A 8,569 8,569 9,249
3B 8,755 8,755 9,517
3C 17,772 17,772 17,007
3D 8,659 8,659 9,378
Table 19 shows the glazing areas in the three flats. While tables 20 and 21 show the
initial capital investment of the glazing units and wall system sections investigated in
the three flats. A sample calculation of the initial investment costs could be seen in
APPENDIX ZZ.

122
4.8 Operation cost calculation
To calculate the operation costs of the building, the yearly heating energy costs are
multiplied by unit cost of the fuel, natural gas, used to run the heating system
multiplied by the study period. The yearly energy costs of the glazing units and wall
sections used in the study flats are given in table 22 and table 23. A sample
calculation of the operation cost for both the glazing window alternative and the
different wall sections could be seen in APPENDIX ZZ.
Table 22 Annual energy prices of the glazings of the case study flats (TL).
Isicam Klasik / TL Isicam Sinerji / TL Isicam Sinerji 3+ / TL
Flat-1 359.12 264.23 152.66
Flat-2 410.99 302.49 174.94
Flat-3 308.56 308.56 308.56
Table 23 Annual energy prices of the wall sections of the case study flats (TL)
Base 1A 1B 1C 1D 2A 2B 2C 2D 3A 3B 3C 3D
Flat-1 408 430 391 392 393 675 436 436 437 478 408 407 408
Flat-2 332 356 315 315 316 624 362 362 364 408 332 331 332
Flat-3 497 526 477 478 479 837 534 533 535 587 498 497 498
4.9 Comparing the Initial Investment and Operation Costs of Glazing Units in
Flat-1, Flat-2, Flat-3
The fact that the lowest value would be the most economically efficient alternative
was accepted in the evaluation of initial investment and operation cost for the study
period (thirty years). Tables 24, 25 and 26 and figure 53 below show the sum of the
total initial investment and operation costs of the glazing alternatives. A sample
calculation for the total sum of the initial investigation and the operation costs could
be seen in APPENDIX ZZ.

123
Table 24 Initial Investment and Operation Costs of Flat-1 Glazing Alternatives (TL)
Isicam Klasik Isicam Sinerji Isicam Sinerji 3+
Flat-1 Initial Investment
Cost / TL
3299 3445 4911
Operations Cost / TL 359.12 x 30
= 10,774
264.23 x 30
= 7,927
152.66 x 30
= 4,580
Total Initial Investment and
Operation Costs
14,073 11,372 9,491
Table 25 Initial Investment and Operation Costs of Flat-2 Glazing Alternatives (TL)
Isicam Klasik Isicam Sinerji Isicam Sinerji 3+
Flat-2 Initial Investment
Cost / TL
3299 3445 4911
Operations Cost / TL 410.99 x 30
= 12,330
302.49 x 30
= 9,075
174.94 x 30
= 5,248
Total Initial Investment and
Operation Costs
15,629 12,520 10,159
Figure 53 The summation of initial investment and operation costs of the
investigated three window glazing units in Flat-1, Flat-2, Flat-3 (TL)

124
Table 26 Initial Investment and Operation Costs of Flat-3 Glazing Alternatives (TL)
Isicam Klasik Isicam Sinerji Isicam Sinerji 3+
Flat-3 Initial Investment
Cost / TL
3247 3391 4834
Operations Cost / TL 308.56 x 30
= 9256.8
308.56 x 30
= 9256.8
308.56 x 30
= 9256.8
Total Initial Investment and
Operation Costs
12,504 12,648 14,091
4.10 Comparing the Initial Investment and Operation Costs of the Wall Sections
in Flat-1, Flat-2, Flat-3
The fact that the lowest value would be the most economically efficient wall system
sections was accepted in the evaluation of initial investment and operation cost for
the study period. Tables 27, 28, 29, 30, 31, 32, 33, 34, 35 and figures 54, 55, 56
show the total initial investment and operation costs of the wall system sections.
Table 27 Initial Investment and Operation Costs of Flat-1 Wall Sections Base, 1A,
1B, 1C, and 1D (TL)
Flat-1 BASE 1A 1B 1C 1D
Initial Investment Cost /
TL
15,022 11,124 11,310 17,350 11,214
Operations Cost / TL 408 x 30
=
12,240
430 x 30
=
12,900
391 x 30
=
11,730
392 x 30
=
11,760
393 x 30
=
11,790
Total Initial Investment
and Operation Costs
27,262 24,024 23,040 29,110 23,004
Table 28 Initial Investment and Operation Costs of Flat-1 Wall Sections 2A, 2B, 2C,
and 2D (TL)
Flat-1 2A 2B 2C 2D
Initial Investment Cost / TL 9,107 9,293 15,857 9,197
Operations Cost / TL 675 x 30
=
20,250
436 x 30
=
13,080
436 x 30
=
13,080
437 x 30
=
13,110
Total Initial Investment and
Operation Costs
29,357 22,373 28,937 22,307

125
Table 29 Initial Investment and Operation Costs of Flat-1 Wall Sections 3A, 3B, 3C,
and 3D (TL)
Flat-1 3A 3B 3C 3D
Initial Investment Cost / TL 8,569 8,755 15,772 8,659
Operations Cost / TL 478 x 30
=
14,340
408 x 30
=
12,240
407 x 30
=
12,210
408 x 30
=
12,240
Total Initial Investment and
Operation Costs
22,909 20,995 27,982 20,899
Table 30 Initial Investment and Operation Costs of Flat-2 Wall Sections Base, 1A,
1B, 1C, and 1D (TL)
Flat-2 BASE 1A 1B 1C 1D
Initial Investment Cost /
TL
15,022 11,124 11,310 17,350 11,214
Operations Cost / TL 332 x 30
=
9,960
356 x 30
=
10,680
315 x 30
=
9,450
315 x 30
=
9,450
316 x 30
=
9,480
Total Initial Investment
and Operation Costs
24,982 21,804 20,760 26,800 20,694
Table 31 Initial Investment and Operation Costs of Flat-2 Wall Sections 2A, 2B, 2C,
and 2D (TL)
Flat-2 2A 2B 2C 2D
Initial Investment Cost / TL 9,107 9,293 15,857 9,197
Operations Cost / TL 624 x 30
=
18,720
362 x 30
=
10,860
362 x 30
=
10,860
364 x 30
=
10,920
Total Initial Investment and
Operation Costs
27,827 20,153 26,717 20,117
Table 32 Initial Investment and Operation Costs of Flat-2 Wall Sections 3A, 3B, 3C,
and 3D (TL)
Flat-2 3A 3B 3C 3D
Initial Investment Cost / TL 8,569 8,755 15,772 8,659
Operations Cost / TL 408 x 30
=
12,240
332 x 30
=
9,960
331 x 30
=
9,930
332 x 30
=
9,960
Total Initial Investment and
Operation Costs
20,809 18,715 25,702 18,619

126
Table 33 Initial Investment and Operation Costs of Flat-3 Wall Sections Base, 1A,
1B, 1C, and 1D (TL)
Flat-3 BASE 1A 1B 1C 1D
Initial Investment Cost /
TL
16,510 12,901 13,169 19,440 13,030
Operations Cost / TL 497 x 30
=
14,910
526 x 30
=
15,780
477 x 30
=
14,310
478 x 30
=
14,340
479 x 30
=
14,370
Total Initial Investment
and Operation Costs
31,420 28,681 27,479 33,780 27,400
Table 34 Initial Investment and Operation Costs of Flat-3 Wall Sections 2A, 2B, 2C,
and 2D (TL)
Flat-3 2A 2B 2C 2D
Initial Investment Cost / TL 9,547 9,815 16,670 9,676
Operations Cost / TL 837 x 30
=
25,110
534 x 30
=
16,020
533 x 30
=
15,990
535 x 30
=
16,050
Total Initial Investment and
Operation Costs
34,657 25,835 32,660 25,726
Table 35 Initial Investment and Operation Costs of Flat-3 Wall Sections 3A, 3B, 3C,
and 3D (TL)
Flat-3 3A 3B 3C 3D
Initial Investment Cost / TL 9,249 9,517 17,007 9,378
Operations Cost / TL 587 x 30
=
17,610
498 x 30
=
14,940
497 x 30
=
14,910
498 x 30
=
14,940
Total Initial Investment and
Operation Costs
26,859 24,457 31,917 24,318
In figures 54, 55 and 56 below, the initial investment costs for 1C, 2C and 3C
influences the economy efficiency primarily when compared to the initial investment
of the other wall sections namely 1B, 2B and 3B as well as 1D, 2D and 3D. This is
due to the fact that wall sections 1C, 2C and 3C consist of a double layer of building
blocks with a sandwiched insulation. The presence of this double layer increases both
the walls prices since more blocks are used in their construction as well as the

127
production cost represented by the monetary expense by the masons, used in their
construction.
Figure 54 Total initial investment and operation costs of the investigated wall
sections Base, 1A, 1B, 1C, 1D, 2A, 2B, 2C, 2D, 3A, 3B, 3C, 3D in Flat-1 (TL)

128
Figure 55 Total initial investment and operation costs of the investigated wall
sections Base, 1A, 1B, 1C, 1D, 2A, 2B, 2C, 2D, 3A, 3B, 3C, 3D in Flat-2 (TL)

129
Figure 56 Total initial investment and operation costs of the investigated wall
sections Base, 1A, 1B, 1C, 1D, 2A, 2B, 2C, 2D, 3A, 3B, 3C, 3D in Flat-3 (TL)

130
In addition figure 54, 55 and 56 shown above also show the total initial investment
and operation costs order of wall sections from the best represented by 1 to the worst
represented by 13.
Table 36 A comparison of percentages (%) of total initial investment and operation
costs of the glazing units according to Isicam Klasik in Flat-1, Flat-2 and Flat-3
Isicam Klasik Isicam Sinerji Isicam Sinerji 3+
Flat-1 --- 0.81 0.670
Flat-2 --- 0.80 0.650
Flat-3 --- 1.15 12.69
Table 37 A comparison of percentages (%) of total initial investment and operation
costs of the wall sections according to the base section in Flat-1, Flat-2 and Flat-3
Bas
-e
Sec.
1A
Sec.
1B
Sec.
1C
Sec.
1D
Sec.
2A
Sec.
2B
Sec.
2C
Sec.
2D
Sec.
3A
Sec.
3B
Sec.
3C
Sec.
3D
Flat-1 --- 0.88 0.85 6.78 0.84 7.68 0.82 6.14 0.82 0.84 0.77 2.64 0.77
Flat-2 --- 0.87 0.83 7.28 0.83 11.4 0.81 6.95 0.81 0.83 0.75 2.88 0.75
Flat-3 --- 0.91 0.87 7.51 0.87 10.3 0.82 3.95 0.82 0.85 0.78 1.58 0.77
Tables 36 and 37 show a comparison of percentages (%) of total initial investment
and operation costs of the glazing units according to Isicam Klasik and those of the
wall sections according to the base section in Flat-1, Flat-2 and Flat-3

131
CHAPTER 5
CONCLUSIONS
In this thesis, the energy and economy efficiency of three double-glazing units and
thirteen different wall systems were used in three flats of the first floor of an
apartment building. They were calculated from the simulation results for the cold
climate of Ankara. From the simulation results, table 38 shows the energy and
economy efficiencies of the case study wall sections. In sequence, the wall sections
with minimum energy and economy efficiency performance produce the best
alternative. The best wall section is ranked as one or 1 and is given the maximum
points of 65. This ranking system from 1 to 13 and the point system from 65 to 5 is
applied for all the thirteen wall systems to verify their energy and economic
efficiency in a sequence from best to worst.
Table 38 A comparison of the energy efficiency and economy efficiency of the
investigated wall sections
Wall
Sec.
Flat-1 Flat-2 Flat-3
Total Energy
Efficient
Perfor-mance
Points
Total Economy
Efficient
Perfor-mance
Points
TOTAL
Points
Energy
Efficient Perfor-
mance
Economy
Efficient Perfor-
mance
Energy
Efficient Perfor-
mance
Economy
Efficient Perfor-
mance
Energy
Efficient Perfor-
mance
Economy
Efficient Perfor-
mance Ra-
nk
Poi
-nt
Ra-
nk
Poi
-nt
Ra-
nk
Poi
-nt
Ra-
nk
Poi
-nt
Ra-
nk
Poi
-nt
Ra-
nk
Poi
-nt
Base 7 35 9 25 5 45 9 25 4 50 9 25 130 75 205
1A 8 30 8 30 8 30 8 30 8 30 8 30 90 90 180
1B 1 65 6 40 1 65 6 40 1 65 7 35 195 115 310
1C 2 60 12 10 2 60 12 10 2 60 12 10 180 30 210
1D 3 55 5 45 3 55 5 45 3 55 6 40 165 130 295
2A 13 5 13 5 13 5 13 5 13 5 13 5 15 15 30
2B 10 20 7 35 11 15 4 50 10 20 4 50 55 135 190
2C 9 25 11 15 10 20 11 15 9 25 11 15 70 45 115
2D 11 15 3 55 9 25 3 55 11 15 3 55 55 165 220
3A 12 10 4 50 12 10 7 35 12 10 5 45 30 130 160
3B 5 45 2 60 6 40 2 60 6 40 2 60 125 180 305
3C 4 50 10 20 4 50 10 20 5 45 10 20 145 60 205
3D 6 40 1 65 7 35 1 65 7 35 1 65 110 195 305

132
In terms of the total energy efficiency performance by rank from the above table 38,
the best ranking from best to worst is as follows:
Table 39 Ranking by the total energy efficiency of the investigated wall sections for
all the three flats
Rank 1 2 3 4 5 6 7 8 9 10 11 12 13
Wall
Sec.
1B
1C
1D
3C
Base
3B
3D
1A
2C
2D
2B
3A
2A
From table 39, it could be concluded that the wall section alternative 1B which
includes Aerated Autoclaved Concrete with insulation facing the outside produces
the best performance in terms of energy efficiency. When considering the best
energy efficiency performance, the wall section 1B for all the three flats, it could be
concluded that minimum heating loads in kWh is required from the heating system to
achieve the required thermal comfort when compared to other wall sections. All the
other wall sections require the heating system to produce more heating to achieve the
same thermal comfort.
In addition, wall sections 1B, 1C and 1D which are the sections involving Aerated
Autoclaved Concrete blocks produce the best performances when compared to
sections including lightweight concrete blocks and heavyweight concrete blocks.
Also as could be concluded, wall sections 3C, 3B and 3D which involve lightweight
concrete blocks follow 1B, 1C and 1D wall sections in energy performances. These
were then followed by wall sections 2C, 2D and 2B which involve heavyweight
concrete blocks.
A final conclusion that was noticed was that regarding the sections without insulation
namely 3A and 2A. According to the energy efficiency ranking, they attain the last
two places in the list respectively. This means that the highest energy was required to

133
be produced by the heating system in order to achieve the required interior thermal
comfort.
In terms of the total economy efficiency performance by rank from the above table
38, the best ranking from best to worst is as follows:
Table 40 Ranking by the total economy efficiency of the investigated wall sections
for all the three flats
Rank 1 2 3 4 5 6 7 8 9 10 11 12 13
Wall
Sec.
3D
3B
2D
2B
1D
3A
1B
1A
Base
3C
2C
1C
2A
From table 40, it could be concluded that the wall sections 3D and 3B respectively
are the most economically efficient in the long term of 30 years. This may be
explained by the fact that the operation cost summed as a total of the three flats, is
lesser than the operation costs for other wall sections. This economic efficiency is
supported by the low initial investment of both the wall sections. So when both the
operation and initial investment costs were added the results indicated that wall
sections 3D and 3B respectively are the most economically efficient compared to the
other wall sections. Similarly, when the initial investment and operation costs are
calculated to wall sections 2D and 2B as well as 1D and 1B, the results showed that
the wall sections 3D and 3B which involves lightweight concrete blocks produced
the most economic efficiency in the 30 year study period. This was followed by wall
sections 2D and 2B in then 1D and 1B.
From the economy point of view, the 3C, 2C and 1C wall sections which included
sandwiched insulation and two wall block layers the initial investment increased due
to the fact that double distance block construction costs and efforts were undertaken
when compared to the single layer block construction efforts applied in the
constructing the other wall sections (See APPENDIX QQ for explanation). Thus,
more blocks and energy are used in these double wall configurations. In turn, this

134
influences the initial investment cost by a considerable margin which makes the wall
sections 3C, 2C and 1C wall sections economically less efficient.
A final conclusion could be noted about wall section 2A which is the least
economically efficient. While the initial investment is reasonably similar to other
wall sections’ initial investments, the affecting factor here is the operation cost which
is relatively higher than those for other wall sections. As mentioned earlier, the
operation cost calculated for this wall section 1A, summed as a total of all the three
flats is more than the operation costs calculated for all the other wall sections. Since
this operation cost is high as could be seen in the initial investment and operation
cost tables, this high operation cost factor influences the economy efficiency, thus
making wall section 2A the worst economically efficient wall section.
In terms of the total energy and economy efficiency performance by rank from the
above table, the best ranking from best to worst is as follows:
Table 41 Ranking by both the total energy efficiency and economy efficiency of the
investigated wall sections for all the three flats
Rank 1 2 3 4 5 6 7 8 9 10 11 12 13
Wall
Sec.
1B
3B
3D
1D
2D
1C
Base
3C
2B
1A
3A
2C
2A
Considering the coupled energy and economic efficiencies of the wall sections as
shown in table 41, those wall sections with insulation on the exterior namely 1B and
3B which involve AAC blocks and lightweight concrete blocks respectively,
represent the best options. These are followed by the wall sections facing the inside
represented namely by 3D, 1D and 2D. From the table 41 it is reminded that 3D is
the wall section involving lightweight concrete blocks, and 1D is the wall section
involving AAC blocks while 2D is the wall section involving heavyweight concrete
blocks.

135
From table 41, it could also be concluded that for the three types of blocks the
options without insulation namely 1A, 3A and 2A perform the worst in terms on both
energy and economic efficiency, with the absence of insulation being the major
factor in deciding their worst ranking.
From the simulation results, table 42 shows the energy and economic efficiencies of
the case study window glazing alternatives. In sequence the window alternatives with
minimum energy and economy efficiency performance produce the best alternative.
The best wall section is ranked as one or 1 and is given the maximum points of 30.
This ranking system from 1 to 3 and the point system from 30 to 10 is applied for all
the three window alternatives to verify their energy and economic efficiency in a
sequence from best to worst.
Table 42 A comparison of the energy efficiency and economy efficiency of the
investigated glazing units
Glazing Unit
Flat-1 Flat-2 Flat-3 Total
Energy
Efficient Perfor-
mance Points
Total
Economy
Efficient Perfor-
mance Points
TOTAL
Points
Energy Efficient
Perfor-
mance
Economy Efficient
Perfor-
mance
Energy Efficient
Perfor-
mance
Economy Efficient
Perfor-
mance
Energy Efficient
Perfor-
mance
Economy Efficient
Perfor-
mance Ra-
nk
Poi
-nt
Ra-
nk
Poi
-nt
Ra-
nk
Poi
-nt
Ra-
nk
Poi
-nt
Ra-
nk
Poi
-nt
Ra-
nk
Poi
-nt
Isicam
Klasik 3 10 3 10 3 10 3 10 1 30 1 30 50 50 100
Isicam
Sinerji 2 20 2 20 2 20 2 20 1 30 2 20 70 60 130
Isicam
Sinerji 3+
1 30 1 30 1 30 1 30 1 30 3 10 90 70 160
In terms of the total energy efficiency performance by rank from the above table 42
the best ranking from best to worst is as follows:
Table 43 Ranking by the total energy efficiency of the investigated glazing
alternatives for all the three flats
Rank 1 2 3
Glazing Unit Isicam Sinerji 3+ Isicam Sinerji Isicam Klasik
In terms of the total economic efficiency performance by rank from the above table
the best ranking from best to worst is as follows:

136
Table 44 Ranking by the total economic efficiency of the investigated glazing
alternatives for all the three flats
Rank 1 2 3
Glazing Unit Isicam Sinerji 3+ Isicam Sinerji Isicam Klasik
In terms of the total energy and economic efficiency performance by rank from the
above table the best ranking from best to worst are as follows:
Table 45 Ranking by both the total energy and economic efficiency of the
investigated glazing alternatives for all the three flats
Rank 1 2 3
Glazing Unit Isicam Sinerji 3+ Isicam Sinerji Isicam Klasik
From table 43 for all the flats, the high performance glazing ISICAM SINERJI 3+
produces the best results first in terms of energy efficiency, then in terms of economy
efficiency and then in terms of total energy and economy efficiency when compared
to ISICAM KLASIK and ISICAM SINERJI.
However, when flat-3 was considered individually according to the simulation, all
the glazing units tended to perform similarly. This may be explained due to the fact
that little solar energy is received by the North facing flat-3 to the extent that the
glazing units were not used to their maximum potential causing them to behave
similarly.
As a result, another conclusion may be obtained regarding the economy efficiency.
Since the glazing alternatives perform similarly for flat-3, the initial investment
proves to be a burden leading to monetary wastage of the high performing expensive
glazing alternative namely ISICAM SINERJI 3+. This is followed by ISICAM
SINERJI. Since both ISICAM SINERJI 3+ and ISICAM SINERJI were prevented
from performing their high performance intended function, ISICAM KLASIK
becomes economically efficient for flat-3.

137
One of the conclusions and benefits that could be added from this investigation
would be the possibility of reducing energy bills and rents. In terms of energy and
economic efficiency flat-2 resulted in the least heating bills produced by the heating
system during winter, followed by flat-1 and then flat-3. This was due to the flats
different orientations. Flat-2 facing South East received the most solar energy during
the winter followed by flat-1 facing South West and then flat-3 facing North.
Therefore, the flats rents differ accordingly where flat-2 is allocated the highest rent
followed by flat-1 and then flat-3.
In addition, the best wall section and glazing alternatives concluded from this study
would help release the least amount of CO2 which would have otherwise added to
environmental pollution.

138

139
REFERENCES
ADELAIDE City Council. http://www.adelaidecitycouncil.com. (Last Accessed
11/ 11 / 2013).
AKG – Gazbeton. www.akg-gabeton.com (Last Accessed 05 / 03 / 2014).
Aksoy, U. Teoman. “A numerical analysis for energy savings of different oriented
and insulated walls in the cold climate of Turkey – Simulation-based study.”
Energy and Buildings , Volume 50, p. 243–250, 2012.
Aksoy, U.T., M. Inalli, “Numerical analysis of effect on heating energy of
insolating practices in building envelope.” Installation Engineer, Volume 76, p. 34–
39, 2003.
Aksoy, U. Teoman, Mustafa Inalli. “Impacts of some building passive design
parameters on heating demand for a cold region.” Building and Environment,
Volume 41, p. 1742–1754, 2006.
Al-Homoud Mohammad S. “Performance characteristics and practical applications
of common building thermal insulation materials.” Building and Environment,
Volume 40, p. 353–366, 2005.
Al-Jabri KS, Hago AW, Al-Nuaimi AS, Al-Saidy AH “Concrete blocks for thermal
insulation in hot climate.” Cement and Concrete Research, Volume 35, p. 1472–
1479, 2005.
Al-Sallal K.A., “Comparison between polystyrene and fiberglass roof insulation in
warm and cold climates.” Renewable Energy, Volume 28, p. 603–611, 2003.
Al-Sanea S.A., M.F. Zedan, “Optimum insulation thickness for building walls in a
hot-dry climate.” International Journal of Ambient Energy, Volume 23, Issue No.3,
p. 115-126, 2002.

140
Andolsun Simge. “A Study on Materials Properties of Autoclaved Aerated Concrete
(AAC) and its Complementary Wall Elements: Their Compatibility in
Contemporary and Historical Wall Section.” The Degree of Master of Science in
Building Science in Architecture, September, 2006.
Andolsun, S., A. Tavukçuoğlu, E. N. Caner-Saltik, “Evaluation of autoclaved
aerated concrete (AAC) as a repair material for timber framed historical
structures.” Proceedings of Postgraduate Researchers of the Built and Natural
Environment (PROBE) 2005 Conference (p. 505-519), Glasgow, Scotland. (ISBN 1-
903661-82-X), 16-17 November, 2005.
Apte, J., Arasteh, D., Huang, Y.J., “Future advanced windows for zero-energy
homes.” ASHRAE Transactions, Volume 109, Issue No.2, p. 871–882, 2003.
Arasteh D, Selkowitz S, Apte J, LaFrance M. “Zero energy windows.” Lawrence
Berkeley National Laboratory, Paper LBNL-60049, 2006.
Arıcı, Müslüm., Hasan Karabay. “Determination of optimum thickness of double-
glazed windows for the climatic regions of Turkey.” Energy and Buildings, Volume
42, p. 1773–1778, 2010.
Aroni, S.;G.I. De Groot, M.J. Robinson; G. Svanholm; F.H. Wittman. “Autoclaved
Aerated Concrete, Properties, Testing and Design.” Rilem Technical Committees
78-MCA and 51-ALC. Taylor & Francis Group. London and New York, 1993.
Asan. H. “Investigation of wall’s optimum insulation position from maximum time
lag and minimum decrement factor point of view.” Energy and Buildings, Volume
32, p. 197–203, 2000.
Asan H, Sancaktar YS. “Effects of wall’s thermophysical properties on time lag and
decrement factor.” Energy and Buildings, Volume 28, p. 159–66, 1998.
Asan H, Sancaktar YS. “Effects of wall’s thickness and position on time lag and
decrement factor.” Energy and Buildings, Volume 28, p. 299–305, 1998.
ASHRAE. “ASHRAE handbook of fundamentals.” Refrigerating and Air-
Conditioning Engineers Inc., GA, USA: American Society of Heating, 1997.

141
ASHRAE Standart 55–81, “Thermal comfort conditions for human occupancy.”
ASHRAE Atlanta, 1981.
ASHRAE. “American Society of Heating, Refrigerating, and Air Conditioning
Engineers.” Handbook of Fundamentals, Atlanta, GA, USA, [Chapter 23], 2001.
ASHRAE, Standard 55–81,“Thermal Comfort Conditions for Human Occupancy,
American Society of Heating Refrigerating and Air-conditioning Engineers.”
Atlanta, 2001.
ASHRAE 90.1.American Society of Heating, Refrigerating and Air-Conditioning
Engineers, Inc., 2004 & 2007.
Askar H, Probert SD, Batty WJ. “Windows for buildings in hot arid countries.”
Appl Energy, Volume 70, p. 77–101, 2001.
Atikol U., Hossein Assefi, M. Reza Azizian, Maryam Gharebaghi. “Effect of
demand-side management on the feasibility of high performance Windows.” 3rd
IASME/WSEAS Int. Conf. on Energy & Environment, University of Cambridge,
UK, February 23-25, 2008.
Aydın, Orhan. “Determination of optimum air-layer thickness in double-pane
windows.” Energy and Buildings, Volume 32, p. 303–308, 2000.
Aytaç¸ A., U.T. Aksoy, “The relation between optimum insulation thickness and
heating cost on external walls for energy saving.” Journal of Faculty Engineering
and Architecture of Gazi University, Volume 21, Issue No. 4, p. 753–758, 2006.
Baer. S. “Raising the open U-value by passive means.” Proc. 8th Nat. Passive Solar
Conf, Glorieta. NM, p. 839-842, 1983.
Baggs, D and Mortensen, N. “Thermal mass in building design.” Environment
design guide, DES 4. Australian Institute of Architects, Melbourne. 2006.
www.environmentdesignguide.com.au (Last Accessed 16 / 04 / 2014).

142
Bahaj AS, James PAB, Jentsch MF. “Potential of emerging glazing technologies for
highly glazed buildings in hot arid climates.” Energy and Buildings, Volume 40, p.
720–31, 2008.
Balaras, C.A., “The role of thermal mass on the cooling load of buildings. An
overview of computational methods.” Energy and Buildings, Volume 24, p. l-10,
1996.
Balcomb J.D., “Designing Passive Solar Buildings to Reduce Temperature Swings.”
Report Submitted to Arizona State University, Department of Architecture, Tempe, AZ,
1978.
Bektaş, B., “Investigation of Transparent Surface Usage on Outer Walls in Terms
of Heating.” Master Thesis, Fırat University Natural Sciences Institute, Elaziğ, 2006.
Bektaş, B. and Aksoy, U.T., “Energy Performance of Window Systems of Buildings
in Cold Climate Regions.” Fırat University Journal of Science and Engineering,
Volume 17, p. 499-508, 2005.
Bektaş, B., EKİCİ U., Teoman AKSOY. “Investigation of the Effects of Orientation
and Window Usage on External Walls in Terms of Heating and Cooling Energy.”
TUBITAK, Turkish J. Eng. Env. Sci., Volume 32, p. 23 – 33, 2008,
Berköz, E., M.S. Küçükdoğu, Z.Y. Aygun, D. Enarun, R. Ünver, G. Kocaaslan,
K.A. Yener, E. Yıldız, F. Ak and D. Yıldız, Enerji Etkin Konut ve Yerlesme
Tasarimi “Energy efficient house and urban design.” TUBITAK-INTAG 201,
Research Report, Ankara, 1995.
BETTAGLAZE. http://www.bettaglaze.co.uk. (Last Accessed 11 / 11 / 2013).
Bojic M Lj, Loveday DL. “Energy and Buildings.” Volume 26, p. 153–7, 1997.
Bolattürk, Ali. “Determination of Optimum Insulation Thickness for Building
Walls with Respect to Various Fuels and Climate Zones in Turkey.” Applied
Thermal Engineering, Volume 26, p. 1301–1309, 2006.

143
Bolattürk A. “Optimum insulation thicknesses for building walls with respect to
cooling and heating degree-hours in the warmest zone of Turkey.” Building and
Environment, Volume 43, p. 1055–64, 2008.
Boussabaine, A., Kirkham, R., "Whole Life-Cycle Costing: Risk and Risk
Responses." Wiley- Blackwell, Oxford, p. 3-10, 2003.
Bostancıoğlu Esra, Benihan Telatar. “Effect of Window Size on Residential
Buildings’ Energy Costs.” World Applied Sciences Journal, Volume 21, Issue No. 4,
p. 631-640, 2013.
Braeuer G. “Large area glass coating.” Surface and Coatings Technology, Volume
112, p. 358-65, 1999.
Bülow-Hübe, H. and Åke, Blomsterberg., “Important design aspects of a very low
energy building.” NorthPass– Promotion of the Very low-energy house Concept to
the North European Building Market, Published 16 / 12 / 2011, Referred 18.11.2012
(Mia Ala-Juusela VT).
Büyükalaca O, Bulut H. “Detailed weather data for the provinces covered by the
Southeastern Anatolia Project (GAP) of Turkey.” Appl Energy, Volume 77, p. 187–
204, 2004.
Calis, A.C., A. Tereci and U. Eicker, “Example of an Ecological Settlement:
Scharnhauser Park. Yapi.”, Volume 333, p. 48-52, 2009.
CannyLiving – Double Glazed Window Panels.
http://www.cl-windows-doors.com/glazing (Last Accessed 10 / 11 / 2013).
Clarke J.A., Irving A.D., “Special issue on building energy simulation.” Energy and
Buildings, Volume 10, Issue No. 3, 1988.
Clarke JA, McLean D. “ESP-A building and plant energy simulation system.”
Strathclyde: Energy Simulation Research Unit, University of Strathclyde, 1988.
144
Cocina, W., “Fenestration Studies on Building Energy Using The Façade
Evaluation Facility.” Bachelor of Science Degree in Mechanical Engineering,
University of Nevada, Las Vegas, 2009. Copyright by Wendell Cocina, 2011.
http://digitalscholarship.unlv.edu/cgi/viewcontent.cgi?article=2298&context=thesesd
issertations, (Last Accessed 19 / 09 / 2013)
Collins RE, Simko TM. “Current status of the science and technology of vacuum
glazing.” Solar Energy, Volume 62, p. 189-213, 1998.
Çengel, Y.A. “Heat Transfer: A Practical Approach.” McGrawHill, p. 766, 1998.
Çengel, Y.A. “Heat Transfer: A Practical Approach.” 2nd ed., McGrawHill, New
York, p. 492, 2003.
Çetiner, I., Özkan, E., "An approach for the evaluation of energy and cost
efficiency of glass façades." Energy and Buildings, Volume 37, p. 673-684, 2004.
Çiçek, Y. E., “Pismis toprak tugla, bimsbeton, gazbeton ve perlitli yapı
malzemelerinin fiziksel, kimyasal ve mekanik özelliklerinin karsılastırmalı
olarakincelenmesi.” Unpublished Master’s Thesis. 2002.
Çomaklı K., Yüksel B. “Optimum Insulation Thickness of External Walls for
Energy Saving.” Applied Thermal Engineering, Volume 23, p. 473-479, 2003.
Çomaklı, K., Bedri Yüksel. “Environmental impact of thermal insulation thickness
in buildings.” Applied Thermal Engineering, Volume 24, p. 933–940, 2004.
Çorum Blok Tuğla, (http://www.corumbloktugla.com/) (Last Accessed 20 / 03 /
2014).
Demirboğa R, Örüng I, Gül R “Effect of expanded perlite aggregate and mineral
admixtures on the compressive strength of low-density concretes.” Cement and
Concrete Research, Volume 31, p. 1627-1632, 2001.
Design Builder. http://www.designbuilder.co.uk (2009) (Last Accessed 05 / 02
/2014).

145
Dilmaç, Ş., and Kesen, N., “A Comparision of New Turkish Thermal Insulation
Standard (TS 825), ISO9164, EN 832 and Germ an Regulation.” Energy and
Building, Volume 35, 161-174, 2003.
Dincer .I., “Environmental impacts of energy.” Energy Policy, Volume 27, 845–
854, 1999.
Dincer .I., M.A. Rosen, “Energy environment and sustainable development.”
Applied Energy, Volume 64, 427–440, 1999.
DOĞAL GAZ CİHAZLARI SANAYİCİLERİ VE İŞ ADAMLARI DERNEĞİ.
http://www.dosider.org (Last Accessed 20 / 04 /2014).
Dombayıcı ÖA. “The Environmental Impact of Thermal Insulation Thickness for
External Walls of Buildings.” Applied Thermal Engineering, Volume 24, Issue Nos.
5-6, p. 933-940, 2004.
Dombayıcı ÖA, Gölcü.M, Pancar Y. “Optimization of insulation thickness for
external walls using different energy-sources.” Applied Energy, Volume 83, p.
921–928, 2006.
Duffin RJ. “A passive wall design to minimize building temperature swings.” Solar
Energy Volume 33, Issue Nos. 3–4, p. 337–342, 1984,
Eames. Philip C. “Vacuum glazing: Current performance and future prospects.”
Vacuum, Volume 82, p. 717–722, 2008.
Eco Who – Your Guide To Being Eco Friendly And Sustainable.
http://www.ecowho.com (Last Accessed 04 / 01 / 2014).
Elder, K., “Building Envelope.” Energy User News, Volume 25, Issue 11, p. 32-34,
November 2000.
Energy Design Tools. http://www.energy-design-tools.aud.ucla.edu/ (Last Accessed
05 / 02 /2014).
146
Energy in architecture, “The European Passive Solar Handbook.” Commission of
the European Communities, 1994.
ESCSI – Expanded Shale, Clay and Slate Institute. (http://www.escsi.org/) (Last
Accessed 25 / 03 / 2014).
Fang, Y., T.J. Hyde, N. Hewitt, “Predicted thermal performance of triple vacuum
glazing.” Solar Energy, Volume 84, p. 2132–2139, 2010.
Florides GA, Tassou SA, Kalogirou SA, Wrobel LC. “Measures used to lower
building energy consumption and their cost effectiveness.” Appl Energy, Volume
73, p. 299–328, 2002.
Freire, Roberto Zanetti Walter Mazuroski, Marc Olivier Abadie, Nathan Mendes.
“Capacitive effect on the heat transfer through building glazing systems.” Applied
Energy, Volume 88, p. 4310–4319, 2011.
Ismail, K.A.R., J.R. Henrıquez. “Modeling and simulation of a simple glass
window.” Solar Energy Materials & Solar Cells, Volume 80, p. 355–374, 2003.
Gasparella, Andrea., Giovanni Pernigotto, Francesca Cappelletti, Piercarlo
Romagnoni, Paolo Baggio, “Analysis and modelling of window and glazing systems
energy performance for a well insulated residential building.” Energy and
Buildings, Volume 43, p. 1030–1037, 2011.
Goulding, J., O. Lewis, T. Steemers (Eds.), “Energy in Architecture: The European
Passive Solar Handbook.” Batsford for the Commission of the European
Communities, 1992.
Gowri, K. “Knowledge-based system approach to building envelope design.” Ph.D.
dissertation, Centre for Building Studies, Concordia University, Montreal, Canada
1990.
GREEN SPEC. http://www.greenspec.co.uk(Last Accessed 13 / 11 / 2013).

147
Hall Mathew R., “Material For Energy Efficiency And Thermal Comfort In
Building.” Woodhead Publishing Series In Energy, 2010.
Hasan A., “Optimizing insulation thickness for buildings using lifecycle cost.”
Appl. Energy, Volume 63, p. 115–124, 1999.
Hassouneh, K. A. Alshboul, A. Al-Salaymeh, “Influence of windows on the energy
balance of apartment buildings in Amman.” Energy Conversion and Management
Volume 51, p. 1583–1591, 2010.
Hays SM, Gobbell RV, Ganick NR. “Indoor air quality. Solutions and strategies.”
New York: McGraw-Hill, 1995.
Hirst, Eric; Jeanne Clinton; Howard Geller; Walter Kroner. “Energy Efficiency in
Buildings Progress and Promise.” F.M. O’Hara Jr. Editor.American Council for an
Energy Efficient Economy Washington, D.C. Copyright, 1986
Hoke, John Ray Jr. “Architectural Graphic Standards.” Math Edition. The
American Institute of Architects. John Wiley & Sons, Inc, 1994. Aroni, G. J. de
Groot, M. J. Robinson, G. Svanholm and F.H. Wittman ed. Taylor & Francis Group,
London and New York, 1993.
Hong, Tianzhen S.K. Chou, T.Y. Bong. “Building simulation: an overview of
developments and information sources.” Building and Environment, Volume 35, p.
347-361, 2000.
Hopkins, V., G. Gross and D. Ellifritt, “ASHRAE Trans.” Volume 85, p. 885-902,
1979.
Hutcheon, N. B. “Requirements for exterior walls.” Canadian Building Digest 48,
National Research Council : Division of Building Research, Canada, 1963.
Hutcheon, N. B. and G. 0. P. Handegord, “Building science for a cold climate.”
Construction Technology Centre Atlantic Inc., Fredericton, New Brunswick, Canada
1989.

148
Hunn B., (Ed.), “Fundamentals of Building Energy Dynamics.” MIT Press, 1996.
Ian, S., “Simulation of energy consumption for passive house.” Bachelor’s Thesis
Building Service Engineering, December 12. Mikkeli University of Applied Science.
http://publications.theseus.fi/bitstream/handle/10024/53867/Sushitckii_Ian.pdf?seque
nce=1, ( Last Accessed 29 / 09 / 2013)
International Energy Agency. (https://www.iea.org) (Last Accessed 19 / 03 /2014).
IZOCAM – İZOCAM TİCARET VE SANAYİ A.Ş. http://www.izocam.com.tr (Last Accessed 15 / 03 / 2014).
Jaber J.O., “Prospects of energy savings in residential space heating.” Energy and
Buildings, Volume 34, p. 311–319, 2002.
Jaber, Samar., Salman Ajib. “Thermal and economic windows design for different
climate zones.” Energy and Buildings, Volume 43, p. 3208–3215, 2011.
Jelle, Bjørn Petter “Traditional, state-of-the-art and future thermal building
insulation materials and solutions – Properties, requirements and possibilities.”
Energy and Buildings, Volume 43, p. 2549–2563, 2011.
Jensen, K.I., J.M. Schultz, F.H. Kristiansen, “Development of windows based on
highly insulating aerogel glazings.” Journal of Non-Crystalline Solids, Volume 350,
p. 351–357, 2004.
Jindal Nikhil, Ranjana Jha, Sarita Baghel. “Enhancement of Indoor Temperature
For Human Thermal Comfort Using Variable Glazing Area For Cold Stations Of
India.” International Journal of Scientific & Technology Research Volume 2, Issue
10, October 2013.
Kachadorian, J., “The Passive Solar House, Using solar design to heat & cool your
home.” Chelsea Green Publishing, White River Junction, Vermont, 1997.
Karabay, Hasan., Müslüm Arıcı. “Multiple pane window applications in various
climatic regions of Turkey.” Energy and Buildings, Volume 45, p. 67–71, 2012.

149
Karlsson, J., Karlsson, B., Roos, A., "A simple model for assessing the energy
performance of Windows." Energy and Buildings, Volume 33, p. 641-651, 2001.
Kavak, K., “Energy efficiency in world and Turkey and the investigation of the
productivity of energy in Turkish industry.” Expertise Thesis. T.R. Prime Ministry
State Planning Organization, 2005.
Kaynaklı. Ö. “A study on residential heating energy requirement and optimum
insulation thickness.” Renewable Energy, Volume 33, p. 1164–1172, 2008.
Khaled, A. A., “Sizing Windows to Achieve Passive Cooling, Passive Heating and
Day lighting in Hot Arid Regions.” Renewable Energy, Volume 14, Issue Nos. 1-4,
p. 365-371, 1998.
Korpela, S.A., Y. Lee, J.E. Drummond, “Heat transfer through double pane
window.” Journal of Heat Transfer, Volume 104, p. 539–544, 1982.
Krigger, John; Chris Dorsi. Residential Energy. “Cost Savings and Comfort for
Existing Buildings.” Fifth edition. Saturn Resource Management Inc. All Rights
reserved 805 N. Thompson- Shore, Inc, 2009.
La Roche, P., M. Milne, “Effects of window size and thermal mass on comfort
using an intelligent ventilation controller.” Solar Energy, Volume 77, p. 421–434,
2004.
Larrson, U., B. Moshfegh, M. Sandberg, “Thermal analysis of super insulated
windows (numerical and experimental investigations).” Energy and Buildings,
Volume 29, p. 121–128, 1999.
Lechner. N. “Heating, Cooling, Lighting—Design Methods for Architects.” Wiley,
New York, 1991.
Lin H. “Building plane, form and orientation for energy saving.” Journal of
Architecture, Volume 4, p. 37–41, 1981.

150
Lochonic Kyle. “Lightweight Concrete Masonry Unit: A weight off our shoulders.”
http://www.escsi.org/uploadedFiles/Technical_Docs/SmartWall_Masonry/3600.0%2
0LW%20CMU%20A%20Weight%20Off%20Our%20Shoulders.pdf 2010. (Last
Accessed 24/3/2014)
Loutzenhiser PG, Manz H, Carl S, Simmler H, Maxwell GM. “Empirical validations
of solar gain models for a glazing unit with exterior and interior blind assemblies.”
Energy and Building, Volume 40, p. 330–40, 2008.
Lowell, S.; Joan, E. Shields. “Powder Technology series. Powder Surface area and
Porosity.” Third Edition Chapman & Hall, 1991.
Maçka, S., "Determination of energy efficient window types according to Turkish
Climate Regions." Master of Thesis, Natural & Aplied Science, Karedeniz Technical
University, Trabzon, Turkey, 2008.
Maçka, Sibel., Yalçın YAŞAR. “The Effects of Window Alternatives on Energy
Efficiency And Building Economy In High – Rise Residential Buildings In Cold
Climates.” Gazi University Journal of Science GU J Sci, Volume 24, Issue No. 4, p.
927-944, 2011.
Mahlia, T.M.I., Taufiq, B.N., Ismail Masjuki, H.H., “Correlation between thermal
conductivity and the thickness of selected insulation materials for building wall.”
Energy and Buildings, Volume 39, p. 182-187, 2007.
Manioğlu, G., "An approach fot the determination of building envelope and
operation period of heating system according to energy conservation and life cycle
cost." PhD Thesis. İstanbul Technical University Natural and Applied Sciences
Institute, İstanbul, p. 14-25, 2002.
Manioğlu Gülten, Zerrin Yılmaz. “Economic evaluation of the building envelope
and operation period of heating system in terms of thermal comfort.” Energy and
Buildings, Volume 38, p. 266–272, 2006.
Manz H. “Numerical simulation of heat transfer by natural convection in cavities
of façade elements.” Energy and Buildings, Volume 35, p. 305-311, 2003.

151
Manz, H. “On minimizing heat transport in architectural glazing.” Renewable
Energy, Volume 33, p. 119–128, 2008.
Manz, H., S. Brunner, L. Wullschleger. “Triple vacuum glazing: Heat transfer and
basic mechanical design constraints.” Solar Energy, Volume 80, p. 1632–1642,
2006.
Mazria Edward . “The Passive Solar Energy Book: A Complete Guide to Passive
Solar Home.” Greenhouse and Building Design.” 1979.
Menzies, G.F., J.R. Wherrett, “Windows in the workplace: examining issues of
environmental sustainability and occupant comfort in the selection of multi-glazed
windows.” ISSN 0378-7788, Energy and Buildings, Volume 37, Issue No. 6, p. 623–
630, 2005.
Mingfang T. “Solar control for buildings.” Building and Environment, Volume 37,
p. 659–664, 2002.
Mitalas GP, Stephenson DG. “Room thermal response factors.” ASHRAE
Transactions, Volume 73, Issue No. 1, 1967.
Mohsen M.S., B.A. Akash, “Some prospect of energy savings in buildings.” Energy
Conversion and Management, Volume 42, p. 1307–1315, 2001.
MPA British Precast - The Federation for Precast Concrete in the UK.
http://www.britishprecast.org (Last Accessed 26 / 04 / 2014).
MVV Consultants and Engineers, "In the Frame of the Project: Improvement
Energy Efficiency in Turkey." Report of MVV, Berlin, p. 1-20, 2004.
Narayanan N., K. Ramamurthy, “Structure and properties of aerated autoclaved
concrete: a review.” Cement and Concrete Composites, Volume 22, p. 321-329,
2000a.
Narayanan N., K. Ramamurthy, “Micro structural investigations on aerated
concrete.” in: Cement and Concrete Research, Volume 30, p. 457-464, 2000b.

152
National Fenestration Rating Council. http://www.nfrc.org (Last Accessed 27 / 11/
2013).
Ng N, Collins RE, So L. “Thermal and optical evolution of gas in vacuum glazing.”
Mater Sci Eng B, Volume 119, p. 258-264, 2005.
Nielsen T.R., K. Duer and S. Svendsen, “Energy Performance of Glazing and Windows.”
Solar Energy, Volume 69 (Suppl.), Issue Nos. 1-6, p. 137-143, 2000.
Ogle, R. and John, O., “Failure of the building envelope: Two case studies,
Envelopes VI / Moisture and Air Leakage Control I-Practices.” (John O’Conner,)
September, 2013
http://web.ornl.gov/sci/buildings/2012/1995%20B6%20papers/008_Ogle.pdf, (Last
Accessed 20 / 02 / 2014).
Oğulata T.R. “Sectoral Energy Consumption in Turkey.” Renewable and
Sustainable Energy Reviews, Volume 6, p. 471-480, 2002.
Oil and Gas Security Emergency Response of IAE Countries. https://www.iea.org/publications/freepublications/publication/2013_Turkey_Country
_Chapterfinal_with_last_page.pdf (Last Accessed 15 / 03 /2014).
Omar EA, Al-Ragom F. “On the effect of glazing and code compliance.” Appl
Energy, Volume 71, p. 75–86, 2002.
Omer A.M., “Energy Environment and Sustainable Development.” Renewable and
Sustainable Energy reviews, Volume 12, p. 2265- 2300, 2008.
Oral, Gül Koçlar., “Appropriate window type concerning energy consumption for
heating.” Energy and Buildings, Volume 32, p. 95–100, 2000.
Oral, Gül Koçlar, Alpin Köknel Yener, Nurgün Tamer Bayazıt. “Building envelope
design with the objective to ensure thermal, visual and acoustic comfort
conditions.” Building and Environment, Volume 39, p. 281 – 287, 2004.

153
Oral, G.K. and Yılmaz, Z., “Building Form for Cold Zones Related to Building
Envelope from Heating Energy Conservation Point of View.” Energy and
Buildings, Volume 35, p. 383-388, 2003.
Oral, Gül Koçlar. Zerrin Yılmaz. “The limit U values for building envelope related
to building form in temperate and cold climatic zones.” Building and Environment
Volume 37, p. 1173 – 1180, 2002.
Özel M., Pıhtılı K. “Determination of Optimum Insulation Thickness by Using
Heating and Cooling Degree Day Values.” Sigma Engineering and Sciences
Journal, Volume 26, p. 191-197, 2008.
Özel, M., K. Pıhtılı. “Optimum location and distribution of insulation layers on
building walls with various orientations.” Building and Environment, Volume 42, p.
3051–3059, 2007.
Papadopoulos. A.M. “State of the art in thermal insulation materials and aims for
future developments.” Energy and Buildings, Volume 37, p. 77–86, 2005.
Papaefthimiou S, Syrrakou E, Yianoulis P. “An alternative approach for the energy
and environmental rating of advanced glazing) an electrochromic window case
study.” Energy and Buildings, Volume 41, p. 17–26, 2009.
Perez YV, Capeluto IG. “Climatic considerations in school building design in the
hot–humid climate for reducing energy consumption.” Appl Energy, Volume 86, p.
340–348, 2009.
Persson Mari-Louise. “Windows of Opportunities: The Glazed Area and its Impact
on the Energy Balance of Buildings.” Acta Universitatis Upsaliensis Uppsala, 2006.
Persson Mari-Louise, Arne Ross and Maria Wall, “Influence of Window Size on the
Energy Balance of low Energy House.” Energy and Buildings, Volume 38, p. 181-
188, 2006.
Poirazis H, Blomsterberg A, Wall M. “Energy simulations for glazed office
buildings in Sweden.” Energy and Building, Volume 40, p. 1161–1170, 2008.

154
Portland Cement Association. “Concrete Masonry Units.” (2013) Retrieved from
http://www.cement.org/masonry/block.asp (Last Accessed 05 / 03 / 2014).
Portland Cement Association. “Concrete thinking for Sustainable World.” (2013).
Retrieved from http://www.concretethinker.com/solutions/Energy-Performance.aspx
(Last Accessed 05 / 03 / 2014).
Portland Cement Association. “Insulated Concrete Forms.” (2013). Retrieved from
http://www.cement.org/homes/ch_bs_icf.asp (Last Accessed 05 / 03 / 2014).
Portland Cement Association. “Tilt up Concrete.” (2013). Retrieved from Portland
Cement Association: http://www.cement.org/homes/ch_bs_tiltup.asp#energy (Last
Accessed 05 / 03 / 2014).
Pyeongchan Ihm, LyoolPark, MoncefKrarti, DonghyunSeo. “Impact of window
selection on the energy performance of residential buildings in South Korea.”
Energy Policy, Volume 44, p. 1–9, 2012.
Ramachandran Sriranjani. “Life Cycle Assessment of Wall Systems.” A Thesis
Presented in Partial Fulfillment of the Requirements for the Degree Master of
Science, July 2013
Reilly, S., D. Arasteh, M. Rubin, “The effects of infrared absorbing gasses on
window heat transfer: a comparison of theory and experiment.” Solar Energy
Materials, Volume 20, p. 277–288, 1990.
Reim, H. A. Beck, W. Korner, R. Petricevic, M. Glora, M. Weth, T. Schliermann, F.
Fricke, C. Schmidt, F.J. Potter, “Highly insulating aerogel glazing for solar energy
usage.” Solar Energy, p. 21–29, 2002.
Rivard Hugues, Claude, Bedard Paul Fazio, Kinh H. HA., “Functional Analysis of
the Preliminary Building Envelope Design Process.” Building and Environment,
Volume 30, Issue No. 3, p. 391-401, 1995.
Robinson, P., J. Littler, “Thermal performance assessment of an advanced glazing
system.” Solar Energy, Volume 50, p. 129–134, 1993.

155
Roos, A., B. Karlsson, “Optical and thermal characterization of multiple glazed
windows with low U-values.” Solar Energy, p. 315–325, 1994.
Rousseau, M.Z., “Building Science Insight.” Technical Report, Building Science
Insight, 1988.
Rousseau, P.G., E.H. Mathews. “A new integrated design tool for naturally
ventilated buildings.” Energy and Buildings, Volume 23, p. 231-236, 1996.
Saydam Refik., “ The global environmental problems.” Hygiene Center & German
Technical Cooperation (technical report), p. 21, 2000.
Schultz, J.M., K.I. Jensen, F.H. Kristiansen, “Super insulation aerogel glazing.”
Solar Energy Materials and Solar Cells, Volume 89, p. 275–285, 2005.
Selamet, S. “A model proposal for determination the heat flow trough the building
envelope according to the building form.” M.S. Thesis, Istanbul Technical
University, Istanbul, 1995, p. 6.
Simpsons, H. Leslie. “Construction Principles, Materials and Methods.” Seventh
Edition. John Wiley & Sons, Inc. Canada, 2001.
Society of Polystyrene Manufacture, 2003. Istanbul, Turkey.
http://zenonpanel.com.mk/al/wpcontent/uploads/2009/06/Thermal-Insulation-
properties.PDF, (Last Accessed 02 / 11 / 2013).
Sodha MS, Kaushik SC, Tiwari GN, Goyal IC, Malık MAS, Khatry AK. “Building
and Environment.”, Volume 14, p. 47–52, 1997.
Solar Energy Laboratory. “TRNSYS: a transient system simulation program.”,
University of Wisconsin, 1988.
Spence, William P., “Encyclopedia of Construction Methods and Materials.”
Sterling Publishing Co. New York, 2000.
Stephenson DG, Mitalas GP. “Cooling load calculation by thermal response factor
method.” ASHRAE Transactions, Volume 73, Issue No. 1, 1967.

156
Sujoy Pal, Biswanath Roy and Subhasis Neogi, “Heat Transfer Modeling on Windows and
Glazing under the Exposure of Solar Radiation.” Energy and Buildings, Volume 41, p.
654-661, 2009.
Sullivan, R., S. Selkowitz, “Window Performance Analysis in a Single-family
Residence.” Lawrence Berkeley National Laboratory, University of California, USA,
p. 1–22, 1985.
Superior Block Corporation. (http://www.superiorblockcorp.com) (Last Accessed
12 / 12 / 2013).
Şahin Sırrı, Sedat Karaman, Selçuk Memiş. “The effects of hydrophobe clay on
some physical and mechanical properties of the low-strength concrete blocks
produced with pumice aggregate.” Akdeniz Universitesi Ziraat Fakultesi Dergisi
Volume 25, Issue No. 2, p. 111-115, 2012.
Şişman Nuri, Emin Kahya, Nil Aras and Haydar Aras, “Determination of Optimum
Insulation Thickness of the External Walls and Roof for Turkey’s Different
Degree-days regions.” Energy Policy, Volume 35, p. 5151-5155, 2007.
Tanaka H, Okumiya M, Tanaka H, Yoon GY, Watanabe K. “Thermal
characteristics of a double-glazed external wall system with roll screen in cooling
season.” Build Environment, Volume 44, p.1509–1516, 2009.
Taşdemir, C. & N. Ertokat, “Gazbetonun Fiziksel ve Mekanik Özellikleri Üzerine
Bir Degerlendirme.” Proceedings of 1. Ulusal Yapı Malzemesi Kongresi ve Sergisi
Istanbul: TMMOB Mimarlar Odası Istanbul Büyükkent Subesi. Volume 2, p. 425-
437, 2002.
TOJSAT : The Online Journal of Science and Technology - April 2011, Volume
1, Issue 2 http://www.tojsat.net/index.php/tojsat/article/viewFile/6/8 (Last Accessed
06 / 03 / 2014).
Topçu IB.,“Semi-light weight concretes produced by volcanic slags.” Cement and
Concrete Research, Volume 27, p. 15–21, 2001.

157
Trakya Cam Sanayii A.Ş. (http://www.trakyacam.com.tr/) (Last Accessed 18 / 03 /
2014).
TSE, TS 453. “Gas and Foam Concrete Material and Elements for Building.”
1988.
TS 825 Thermal Insulation in Buildings, “Turkish Standard Institution.” Turkey,
1998.
Turkish Standardization Institute (TSE), "Heat Insulation Rules in Building. TS
825", Ankara, p. 1-80, 2008.
Turkish State Meteorological Service. (http://en.wikipedia.org/wiki/Ankara). (Last
accessed 08 / 08 / 2013).
TÜBİTAK. (2003). “Enerji ve doğal kaynaklar paneli, rapor ekleri.” Ankara:
TÜBİTAK.
TÜRKİYE CUMHURİYETİ EKONOMİ BAKANLIĞI. Turkish Republic Ministry
of Foreign-Trade Counselor ship
http: // www. dtm.gov.tr/dtadmin/upload/EAD/KonjokturIzlemeDb/teut.doc (2009)
(Last Accessed 15 / 03 /2014).
Uçar A., Balo F. “Determination of the Energy Savings and the Optimum
Insulation Thickness in the Four Different Insulated Exterior Walls,” Renewable
Energy, Volume 35, p. 88-94, 2010.
Urbikain M.K., J.M. Sala. “Analysis of different models to estimate energy savings
related to windows in residential buildings.” Energy and Buildings, Volume 41, p.
687–695, 2009.
US Department of Commerce. “DOE-2 manuals (Version 2.1).” Springfield,
Illinois, USA: National Technical Information Service, 1980.
Waterfield, P., “The Energy Efficient Home. A complete guide.”, The Crowood
Press Ltd., Ramsbury, Marlborough, Wilshire SN8 2HR, 2007.

158
WBDG – Whole Building Design Guide. A Program of the National Institute of
Building Sciences. http://www.wbdg.org (Last Accessed 18 / 11/ 2013).
WEC-TNC, World Energy Council, Turkish National Committee. “Turkey Energy
Report,” Ankara, Turkey, 1995.
Weinlaeder H, Ebert HP, Fricke J.“VIG - Vacuum insulation glass,” 7th Int.
Vacuum Insulation Symposium, Duebendorf, Switzerland, p. 197-204, 2005.
Weir, G., T. Muneer, “Energy and environmental impact analysis of double-glazed
windows,” Energy Conversion and Management, Volume 39, p. 243–256, 1998.
Wiggington, M., Harris, J., "Intelligent Skins", Architectural Press, Oxford, p. 7-17,
2002.
WINDOWS – For High Performance Commercial Buildings.
http://www.commercialwindows.org. (Last Accessed 10 / 11 / 2013).
World Map of the Köppen-Geiger Climate Classification. University of Melbourne.
(http://koeppen-geiger.vu-wien.ac.at/) (Last Accessed 08 / 08 / 2013).
Wright, J., “A correlation to quantify convective heat transfer between vertical
window glazings,” ASHRAE Transactions Volume 106, p. 940–946, 1996.
Yam, J., Y. Li, Z. Zheng, “Nonlinear coupling between thermal mass and natural
ventilation in buildings,” International Journal of Heat and Mass Transfer, Volume
46, p. 1251–1264, 2003.
Yıldız Yusuf. “Retrofitting Existing Mass Housing For Energy Efficiency: A Case
Study in Gaziemir Emlak Bank Housing Area, Izmir, Turkey.”A Thesis Submitted
to the Graduate School of Engineering and Science of İzmir Institute of Technology,
Master of Science in Architecture, July 2008.
Yılmaz, Z., “Evaluation of built environment from the thermal comfort viewpoint,”
ASHRAE Trans. Volume 93, (1), p. 7–8, 1987.

159
Yılmaz, Z., “Evaluation of Climatic Comfort Conditions in New Residential
Buildings in Turkey,” Istanbul Technical University, p.32, 1990.
Yiğit Ali, İsmail DEMİR, M.Serhat BAŞPINAR “Effect of Municipal Heating
System Coal Ash on the Insulation Properties of Light Weight Concrete.” TOJSAT: The Online Journal of Science and Technology, Volume 1, Issue 2, April
2011.
Zhou, Junli, Guoqiang Zhang, Yaolin Lin, Yuguo Li. “Coupling of thermal mass
and natural ventilation in buildings.” Energy and Buildings 40 (2008) 979–986.

160

161
BIBLIOGRAPHY
ACI Committee 213 “Guide for structural lightweight aggregate concrete.”
American Concrete Institute, Committee 213 Report, Paris, 1970.
Adalberth K.. “Energy use in four multi-family houses during their life cycle.”
Journal of Low Energy and Sustainable Buildings, Volume 1, 2000.
Ahmad, M., Bontemps, A., Salle´ e, H., Quenard, D.,“Thermal testing and
numerical simulation of a prototype cell using light wallboards coupling vacuum
isolation panels and phase change material.” Energy and Buildings, Volume 38, p.
673-681, 2006.
Al-Sanea S.A., M.F. Zedan, S.A. Al-Ajlan, “Effect of electricity tariff on the
optimum insulation-thickness in building walls as determined by a dynamic heat-
transfer model.” Appl. Energ. Volume 82, p. 313–330, 2005.
Andrea Gasparella, Giovanni Pernigotto, Francesca Cappelletti, Piercarlo
Romagnoni, Paolo Baggio. “Analysis and modelling of window and glazing systems
energy performance for a well insulated residential building.” Energy and
Buildings, Volume 43, p. 1030–1037, 2011.
Apsen Research Corporation, "Integrated Energy Efficient Window – Wall Systems,
Phase 1: Concept Development." Report of Apsen, USA, p. 1-19, 2001.
Asan. H, “Optimising insulation thickness for buildings using life cycle cost.”
Applied Energy, Volume 63, p. 115–124, 1999.
ASTM Standard C 168-97. “Terminology relating to thermal insulating materials.”
1997.
Briesemann, D. “Einfluss der feuchtigkeit auf die druckfestigkeit dampfgeharteten
gasbetons.” Cement and Concrete Research, Volume 6, p. 561-570, 1976.

162
Buchanan Lisa E. “Glazing Type vs. Orientation: A comparison of Solar Gain
Reduction in Las Vegas Product Houses.” Master of Architecture, School of
Architecture, University of Nevada. Las Vegas, May 1997.
Carmody, John, Stephen Selkowitz, and Lisa Heschong. “Residential Windows: A
Guide to New Technologies and Energy Performance.” New York: W.W. Norton &
Company, 1996.
Cavette, C. (2007). “How are Products made?” Retrieved from Volume 3:
http://www.madehow.com/Volume-3/Concrete-Block.html (Last Accessed 20 / 03 /
2014).
Ceb. “Autoclaved Aerated Concrete.” CEB Manual of Design and Technology,
(ISBN 0904406768.). The Construction Press, Lancaster, London, New York. 1978.
Chiba, K., T. Takahashi, T. Kageyama, H. Oda, “Low-emissivity coating of
amorphous diamond-like carbon/Ag-alloy multilayer on glass.” Applied Surface
Science, Volume 246, p. 48–51, 2005.
Claude, Hugues Rivard, Bedard Paul Fazio, Kinh H. HA., “Functional Analysis of
the Preliminary Building Envelope Design Process.” Building and Environment,
Volume 30, Issue No. 3, p. 391-401, 1995.
Çengel, Y.A. “Heat Transfer: A Practical Approach.” 2nd ed., McGrawHill, New
York, p. 492, 2003.
Demirbas, A., “Energy balance, energy sources, energy policy, future developments
and energy investments in Turkey.” Energy Convers. Manage. Volume 42, p. 1239–
1258, 2001.
Dilmaç, Ş., Tırıs, M., "The Energy Saving in Housing Sector in Turkey." Tesisat,
Volume 22, p. 10-13, 1995.
Drury B. Crawley, Jon W. Hand, Michael Kummert, Brent T. Griffith. “Contrasting
the capabilities of building energy performance simulation programs.” Building
and Environment, Volume 43, p. 661–673, 2008.

163
Frey, E. “Recent results on thermal conductivity and hygroscopic moisture content
of AAC.” Proceedings of the Third RILEM International Symposium on Autoclaved
Aerated Concrete Advances in Autoclaved Aerated Concrete, F.H. Wittmann, ed.
A.A. Balkema, Rotterdam, Brookfield. (ISBN 90-5410-086-9). p. 89-92, 14-16
October, 1992.
Giritli, H., "Project and Construction Management Methods of Economic
Evaluation in Construction", Lecture Document , İstanbul Technical University, p.
1-35, 2003.
Hall Mathew R., “Material For Energy Efficiency And Thermal Comfort In
Building.” Woodhead Publishing Series In Energy, 2010.
Hepbasli, A., N. Ozalp, “Development of energy efficiency and management
implementation in the Turkish industrial sector.” Energ. Convers. Manage. Volume
44, p. 231–249, 2003.
Huang Tai Uey. “Energy Saving Integrated Façade: Design and Analysis Using
Computer Simulation.” A Thesis Presented to the Faculty of USC the School of
Architecture, University of Southern California, Master of Building Science, August
2010.
Jacobs, F. & G. Mayer. “Porosity and permeability of autoclaved aerated concrete.”
Proceedings of the Third RILEM International Symposium on Autoclaved Aerated
Concrete. Advances in Autoclaved Aerated Concrete, F.H. Wittmann, ed. A.A.
Balkema, Rotterdam, Brookfield (ISBN 90-5410-086-9). p. 71-75, 14-16 October,
1992.
Johnson, T.E. “Low-e Glazing Design guide.” Butterworth-Heinemann, US, 1991.
Karlsson, J.. A. Roos. “Annual energy window performance vs. glazing thermal
emittance – the relevance of very low emittance values.” Thin Solid Film, Volume
392, p. 345-348, 2001.
Kaygusuz K, Kaygusuz A. “Energy and sustainable development. Part II:
environmental impacts of energy use.” Energy Sources, Volume 26, p. 1071–1082,
2004.

164
Kaygusuz K. “Environmental impacts of energy utilization and renewable energy
policies in Turkey.” Energy Policy, Volume 30, p. 689–98, 2002.
Koçlar, G. “Effect of the position of the heat insulation layer in the opaque
component on the heating period.” Architectural Science Review, Volume 41, p.
125, 1998.
Koçlar, G.O. Z. Yılmaz, “Building form for cold climatic zones related to building
envelope from heating energy conservation point of view.” Energy and Buildings,
Volume 35, p. 383–388, 2003.
Kontoleon, K.J. and D.K. Bikas, “Modelling the influence of glazed openings
percentage and type of glazing on the thermal zone behavior.” Energy and
Buildings, Volume 34, p. 389-399, 2002.
Lippe, K. F. “The effect of moisture on the thermal conductivity of AAC.”
Proceedings of the Third RILEM International Symposium on Autoclaved Aerated
Concrete. Advances in Autoclaved Aerated Concrete, F.H. Wittmann, ed. A.A.
Balkema, Rotterdam, Brookfield. (ISBN 90-5410-086-9.) p. 99-102, 14-16 October,
1992.
Mahlia T.M.I., A. Iqbal, “Cost benefits analysis and emission reductions of
optimum thickness and air gaps for selected insulation materials for building walls
Maldives.” Energy, Volume 35, p. 2242-2250, 2010.
Mahtani, P., K.R. Leong, I. Xiao, A. Chutinan, N.P. Kherani, S. Zukotynski,
“Diamond-like carbon based low-emissive coatings.” Solar Energy Materials and
Solar Cells, Volume 95, p. 1630–1637, 2011.
Manioğlu, G. “Determination of building envelope and operation period of heating
system according to life cycle cost.” Proceedings of second International Building
Physics Conference, Leuven, Belgium. p. 633–636, 2003.
Manz Heinrich, Urs-Peter Menti. “Energy performance of glazings in European
climates.” Renewable Energy, Volume 37, p. 226-232, 2012.

165
Manz, H., “On minimizing heat transport in architectural glazing.” Renewable
Energy, Volume 33, p. 119–128, 2008.
Muneer, N., Abodahab, N., Weir, G., Kubie, J., "Windows in Buildings, Thermal,
Acoustic, Visual and Solar Performance." Architectural Press, Oxford, p. 6-10
2000.
Oğulata T.R. “Energy sector and wind energy potential in Turkey.” Renewable and
Sustainable Energy Reviews, Volume 7, p. 469–84, 2003.
Özel Meral. “Thermal performance and optimum insulation thickness of building
walls with different structure materials.” Applied Thermal Engineering, Volume 31,
p. 3854-3863, 2011.
Pal Sujoy, Biswanath Roy and Subhasis Neogi, “Heat Transfer Modeling on
Windows and Glazing under the Exposure of Solar Radiation.” Energy and
Buildings,Volume 41, p. 654-661, 2009.
Porteous, C. and Kerr, M. “Solar Architecture in Cool Climates.” Earthscan,
London, Sterling, VA. 2005.
Rilem, Recommended practice- RILEM Technical Commities: 78-MCA and 51-
ALC. “Autoclaved Aerated Concrete- Properties, Testing and Design.” S. Aroni, G.
J. de Groot, M. J. Robinson, G. Svanholm and F.H. Wittman ed. Taylor & Francis
Group, London and New York, 1993.
Sari D, Paşamehmetoğlu AG. “The effects of gradation, admixture on the pumice
light weight aggregate concrete.” Cement and Concrete Research, Volume 35, p.
936–942, 2005.
Shaw M. “Computer modelling as a design tool for predicting building
performance.” Blue Pages, Building Serv Eng Res Technol, Volume 16, Issue No. 4,
1995; Volume 17, Issue No. 2, 1996.
Stegou-Sagia. A, K. Antonopoulos, C. Angelopoulou, G. Kotsiovelos. “The impact
of glazing on energy consumption and comfort.” Energy Conversion and
Management, Volume 48, p. 2844–2852, 2007.

166
Svanholm, G. “Influence of water content on properties.” F.H. Wittmann ed. p.
119-130, 1983.
Swiss Standard SIA 380/1. “Thermal energy in buildings (in German).” Zurich:
Swiss Association of Engineers and Architects; 2001.
Tada S. “Material design of aerated concrete,” An Optimum Performance
Design.Materials and Construction, Volume 19, p. 21- 26, 1986.
Tada, S., S. Nakano. “Microstructural approach to properties of moist cellular
concrete,” Autoclaved Aerated Concrete, Moisture and Properties, F.H. Wittmann,
ed. Elsevier. (ISBN 0444421173). p.71-88, 1983.
Tavıl, A., H. Yaman, İ. Çetiner and K. Coşkun, “Energy and Cost Efficient Window
Selection Model for Residential Buildings in Different Climatic Regions of
Turkey.” Journal of itu/a architecture, planning, design, Volume 9, Issue No. 1, p.
143-154, 2010.
Tianzhen Hong, S.K. Chou, T.Y. Bong. “Building simulation: an overview of
developments and information sources.” Building and Environment, Volume 35, p.
347-361, 2000.
Tosun, M., K. Dincer. “Modelling of a thermal insulation system based on the
coldest temperature conditions by using artificial neural networks to determine
performance of building for wall types in Turkey.” International Journal of
Refrigeration Volume 34, p. 362-373, 2011.
Tritt, Terry M., “Thermal Conductivity.Theory, Properties and Applications.”
Clemson University.” Clemson, South Carolina. Kluwer Academic / Plenum
Publishers. New York, 2004.
Turan, N.D., Egitim Yapilarinin Tasarim Ölçütlerinin Yillik Isitma Enerjisi
Harcamalarinin Azaltilmasina Yönelik Olarak Belirlenmesi. “Determine design
criteria of educational buildings for minimizing annual heating energy
consumptions.” Master Thesis, Yildiz Technical University Institute of Science,
Istanbul, 2004.
167
US Department of Energy. “Insulation fact sheet with addendum on moisture
control.” DOE/CE-0180, USA, 2002.
Vergohl, M., N. Malkomes, T. Matthee, G. Brauer, U. Richter, F.-W. Nickol, J.
Bruch, “In situ monitoring of optical coatings on architectural glass and
comparison of the accuracy of the layer thickness attainable with ellipsometry and
photometry.” Thin Solid Films, Volume 392, p. 258–264, 2001.
Wiggington, M., Harris, J., "Intelligent Skins." Architectural Press, Oxford, p. 7-17
2002.
Wray W.O., “Design and Analysis of Direct Gain Solar Heated Buildings,” Report
No. LA-8885-MS, UC-59C, Los Alamos Scientific Laboratory, University of
California, 1981.
Wright, Gordon. “Rewriting the Solar Heat Gain/Daylight Equation.” Building
Design & Construction, Volume 33, Issue No. 3, p. 58-60, March 1992.
Yıldız, M., “Determination of Solar Heat Gain Factors Through Glasses in
Turkey,” Ph.D. Thesis, Middle East Technical University Natural Sciences Institute,
Ankara, 1990.
Yıldız, Y., Arsan, Z. D. “Identification of the Building Parameters that Influence
Heating and Cooling Energy Loads for Apartment Buildings in Hot-Humid
Climates,” Energy, Volume 36, Issue No.7, p. 4287-4296, 2011.
Yıldız, Y., T.G. Özbalta and Z.D. Arsan,. Farkl Cam Türleri ve Yönlere Göre
Pencere / Duvar Alan Oran n n Bina Enerji Performans na Etkisi: E itim Binas ,
izmir, “Impact of Window-to-Wall Surface Area for Different Window Glass Types
and Wall Orientations on Building Energy Performance: A Case Study for a
School Building Located in izmir, Turkey.” Megaron, Volume 6, Issue No. 1, p. 30-
38, 2011.
Yüksek Ö., “Reevaluation of Turkey’s hydropower potential and electric energy
demand.” Energy Policy Volume 36, p. 3374–3382, 2008.

168

169
APPENDIX A
QUESTIONNAIRES FLAT-1, FLAT-2 AND FLAT-3
QUESTIONNAIRE-FLAT-1
1) How many are your family members? Write applicable (Yes or No).
1) Father: __NA____________________________________________
2) Mother: __NA___________________________________________
3) Child-1: __NA___________________________________________
4) Child-2: __NA___________________________________________
5) Child-3: __NA___________________________________________
6) Child-4: __NA___________________________________________
7) Other: __Single Occupant__________________________________
2) How many boys and how many girls are your children? State the number.
1) Girls: __0_______________________________________________
2) Boys: __0______________________________________________
3) Write down the number series of children by age and gender. Write applicable.
For example:- Child-1: Girl (10 years old)
1) Child-1: __0____________________________________________
2) Child-2: __0____________________________________________
3) Child-3: __0____________________________________________
4) Child-4: __0____________________________________________
5) Other: __0______________________________________________
5) Which room belongs to child-1? Write (Yes or No or Not applicable).
1) Bedroom-1: __NA________________________________________
2) Bedroom-2: __NA________________________________________
6) Which room belongs to child-2? Write (Yes or No or Not applicable).
1) Bedroom-1: __NA________________________________________
2) Bedroom-2: __NA________________________________________

170
7) Which room belongs to child-3? Write (Yes or No or Not applicable).
1) Bedroom-1: __NA________________________________________
2) Bedroom-2: __NA________________________________________
8) Which room belongs to child-4? Write (Yes or No or Not applicable).
1) Bedroom-1: __NA________________________________________
2) Bedroom-2: __NA________________________________________
9) During the weekdays how is the M. Bedroom used? For example:
Between (23:00 pm – 07:00 am) the M. Bedroom is occupied, and.
Between (07:00 am – 18:00 pm) the M. Bedroom is not occupied.
1) Between which hours is it occupied:
1:__24:00 pm – 08:00 am_______________
2:__NA_____________________________
3:__NA_____________________________
2) Between which hours is it not occupied:
1:__08:00 am – 24:00 pm_______________
2:__NA_____________________________
3:__NA_____________________________
10) During the weekdays how is the Bedroom-1 used? For example:
Between (23:00 pm – 07:00 am) the Bedroom-1 is occupied, and
Between (07:00 am – 18:00 pm) the Bedroom-1 is not occupied.
1) Between which hours is it occupied:
1:__NA_____________________________
2:__NA_____________________________
3:__NA_____________________________
2) Between which hours is it not occupied:
1:__NA_____________________________
2:__NA_____________________________
3:__NA_____________________________

171
11) During the weekdays how is the Bedroom-2 used? For example:
Between (23:00 pm – 07:00 am) the Bedroom-2 is occupied, and
Between (07:00 am – 18:00 pm) the Bedroom-2 is not occupied
1) Between which hours is it occupied:
1:__NA_____________________________
2:__NA_____________________________
3:__NA_____________________________
2) Between which hours is it not occupied:
1:__NA_____________________________
2:__NA_____________________________
3:__NA_____________________________
12) During the weekdays how is the Saloon used? For example:
Between (18:00 pm – 23:00 pm) the Saloon is occupied, and
Between (23:00 pm – 18:00 pm) the Saloon is not occupied.
1) Between which hours is it occupied:
1:__20:00 pm – 24:00 pm ______________
2:__NA_____________________________
3:__NA_____________________________
2) Between which hours is it not occupied:
1:__24:00 pm – 20:00 pm ______________
2:__NA_____________________________
3:__NA_____________________________
13) During the weekdays how is the kitchen used? For example:
Between (19:00 pm – 20:00 pm) the kitchen is occupied.
Between (20:00 pm – 19:00 pm) the kitchen is not occupied, and
1) Between which hours is it occupied:

172
1:__19:00 pm – 20:00 pm ______________
2:__NA_____________________________
3:__NA_____________________________
2) Between which hours is it not occupied:
1:__20:00 pm – 19:00 pm ______________
2:__NA_____________________________
3:__NA_____________________________
14) During the weekdays how is the laundry used? For example:
On Wednesday Between (20:00 pm – 21:00 pm) the laundry is used, or
During the weekdays it is not used,
1) Between which hours is it occupied:
1:__NA_____________________________
2:__NA_____________________________
3:__NA_____________________________
2) Between which hours is it not occupied:
1:__NA_____________________________
2:__NA_____________________________
3:__NA_____________________________
15) During the weekends how is the M. Bedroom used? For example:
Between (24:00 pm – 09:00 am) the M. Bedroom is occupied, and
Between (09:00 am – 24:00 pm) the M. Bedroom is not occupied.
1) Between which hours is it occupied:
1:__24:00 pm – 10:00 am ______________
2:__NA_____________________________
3:__NA____________________________
2) Between which hours is it not occupied:
1:__10:00 am – 24:00 pm ______________
2:__NA_____________________________
3:__NA_____________________________

173
16) During the weekends how is the Bedroom-1 used? For example:
Between (24:00 pm – 09:00 am) the Bedroom-1 is occupied, and
Between (09:00 am – 24:00 pm) the Bedroom-1 is not occupied.
1) Between which hours is it occupied:
1:__NA_____________________________
2:__NA_____________________________
3:__NA_____________________________
2) Between which hours is it not occupied:
1:__NA_____________________________
2:__NA_____________________________
3:__NA_____________________________
17) During the weekends how is the Bedroom-2 used? For example:
Between (24:00 pm – 09:00 am) the Bedroom-2 is occupied.
Between (09:00 am – 24:00 pm) the Bedroom-2 is not occupied, and
1) Between which hours is it occupied:
1:__NA_____________________________
2:__NA_____________________________
3:__NA_____________________________
2) Between which hours is it not occupied:
1:__NA_____________________________
2:__NA_____________________________
3:__NA_____________________________
18) During the weekends how is the Saloon used? For example:
Between (09:00 am – 24:00 pm) the Saloon is occupied.
Between (24:00 pm – 09:00 am) the Saloon is not occupied, and
1) Between which hours is it occupied:
1:__11:00 am – 19:00 pm_______________
2:__20:00 pm – 24:00 pm_______________
3:__NA_____________________________

174
2) Between which hours is it not occupied:
1:__24:00 pm – 11:00 am_______________
2:__19:00 pm – 20:00 pm_______________
3:__NA_____________________________
19) During the weekends how is the kitchen used? For example:
Between (19:00 pm – 20:00 pm) the kitchen is occupied, and
Between (11:00 am – 19:00 pm) the kitchen is not occupied, and
Between (10:00 am – 11:00 am) the kitchen is occupied, and
Between (20:00 pm – 10:00 am) the kitchen is not occupied,
1) Between which hours is it occupied:
1:__10:00 am – 11:00 am_______________
2:__19:00 pm – 20:00 pm_______________
3:__NA_____________________________
2) Between which hours is it not occupied:
1:__20:00 pm – 10:00 am_______________
2:__11:00 am – 19:00 pm_______________
3:__NA_____________________________
20) During the weekends how is the laundry used? For example:
On Wednesday Between (20:00 pm – 21:00 pm) the laundry is used, or
During the weekdays it is not used,
1) Between which hours is it occupied:
1:__10:00 am – 11:00 am_______________
2:__NA_____________________________
3:__NA_____________________________
2) Between which hours is it not occupied:
1:__11:00 am – 10:00 am_______________
2:__NA_____________________________
3:__NA_____________________________

175
21) What are the holidays of the year that you celebrate? State Yes and for how
many days?
1) Ramadan days: __Yes, three days _____________________________
2) Pilgrimage days: __Yes, four days_____________________________
3) New Year: __Yes, one day___________________________________
4) Independence day: __Yes, one day____________________________
5) Children day: __Yes, one day________________________________
6) Workers day: __Yes, one day________________________________
7) Summer holidays: __Yes, three month_________________________
8) Other: __NA______________________________________________
9) Other: __NA______________________________________________
10) Other: __NA______________________________________________
22) Which holidays do you leave home and for how many days? For example:
Summer Holidays: 90 days
1) __Summer Holidays, for 90 days ______________________________
2) __Ramadan Holiday, for 3 days_______________________________
3) __Haj Holidays, for 4 days___________________________________
4) __NA____________________________________________________
5) Other: __NA______________________________________________
6) Other: __NA______________________________________________
7) Other: __NA______________________________________________
23) Do you have a water radiator heating system (Combi System) for heating in
winter? State Yes or No? If no which other system do you use?
__Yes____________________________________________________________
24) For how many months (during the winter) of the year do you use this heating
system fully?
___Six Months (October, November, December, January, February, March) ____
25) For how many months (during the summer) of the year do you not use this
heating system fully?
___Six Months (April, May, June, July, August, September) ________________
26) Approximately how much money do you use to buy natural gas or electricity for
this heating system?
___3600 TL / One Year for heating purposes and water heating______________

176
27) Do you use any device (for example cooler or fan) to cool during the summer?
State Yes or No. If yes describe the device and between which times it is used in
summer.
__No_____________________________________________________________
_________________________________________________________________
28) Do you ventilate your house mechanically? State Yes or No. If yes describe the
device and at what times it is used. For Example:
Split Unit (Used between 12:00 pm– 20:00 pm)
__No_____________________________________________________________
29) Do you ventilate your house naturally in summer? State Yes or No. If yes
describe the times this is done. For example
(Windows are open between 12:00 pm – 20:00 pm).
__Yes, Open Windows (Opened Between 12:00 am – 20:00 pm)_____________
_________________________________________________________________
30) Do you have computers in your house? State Yes or No. If yes, describe how
many and where they are located in the house?
__Yes, One Laptop Computer. Located in the Saloon.______________________
_________________________________________________________________
_________________________________________________________________
31) Do you have office equipment (printer, fax, and etc)? State Yes or No. If yes,
describe what they are, how many, and where they are located in the house?
__NA____________________________________________________________
_________________________________________________________________
________________________________________________________________

177
QUESTIONNAIRE – FLAT-2
1) How many are your family members? Write applicable (Yes or No).
1) Father: __Yes____________________________________________
2) Mother: __Yes___________________________________________
3) Child-1: __Yes___________________________________________
4) Child-2: __NA___________________________________________
5) Child-3: __NA___________________________________________
6) Child-4: __NA___________________________________________
7) Other: __NA_____________________________________________
2) How many boys and how many girls are your children? State the number.
1) Girls: __One Girl_________________________________________
2) Boys: __NA_____________________________________________
3) Write down the number series of children by age and gender. Write applicable.
For example:- Child-1: Girl (10 years old)
1) Child-1: __Girl (3 years Old)_______________________________
2) Child-2: __NA___________________________________________
3) Child-3: __NA___________________________________________
4) Child-4: __NA___________________________________________
5) Other: __NA____________________________________________
5) Which room belongs to child-1? Write (Yes or No or Not applicable).
1) Bedroom-1: __NA________________________________________
2) Bedroom-2: __Yes_______________________________________
6) Which room belongs to child-2? Write (Yes or No or Not applicable).
1) Bedroom-1: __NA________________________________________
2) Bedroom-2: __NA________________________________________
7) Which room belongs to child-3? Write (Yes or No or Not applicable).
1) Bedroom-1: __NA________________________________________
2) Bedroom-2: __NA________________________________________
8) Which room belongs to child-4? Write (Yes or No or Not applicable).

178
1) Bedroom-1: __NA________________________________________
2) Bedroom-2: __NA________________________________________
9) During the weekdays how is the M. Bedroom used? For example:
Between (23:00 pm – 07:00 am) the M. Bedroom is occupied, and.
Between (07:00 am – 18:00 pm) the M. Bedroom is not occupied.
1) Between which hours is it occupied:
1:__24:00 pm – 07:00 am______________
2:__12:00 am – 14:00 pm______________
3:__19:00 pm – 20:00 pm______________
2) Between which hours is it not occupied:
1:__20:00 pm – 24:00 pm______________
2:__07:00 am – 12:00 am______________
3:__14:00 pm – 19:00 pm______________
10) During the weekdays how is the Bedroom-1 used? For example:
Between (23:00 pm – 07:00 am) the Bedroom-1 is occupied, and
Between (07:00 am – 18:00 pm) the Bedroom-1 is not occupied.
1) Between which hours is it occupied:
1:__09:00 am – 12:00 am______________
2:__NA_____________________________
3:__NA_____________________________
2) Between which hours is it not occupied:
1:__12:00 am – 09:00 am______________
2:__NA____________________________
3:__NA____________________________
11) During the weekdays how is the Bedroom-2 used? For example:
Between (23:00 pm – 07:00 am) the Bedroom-2 is occupied, and
Between (07:00 am – 18:00 pm) the Bedroom-2 is not occupied.
1) Between which hours is it occupied:
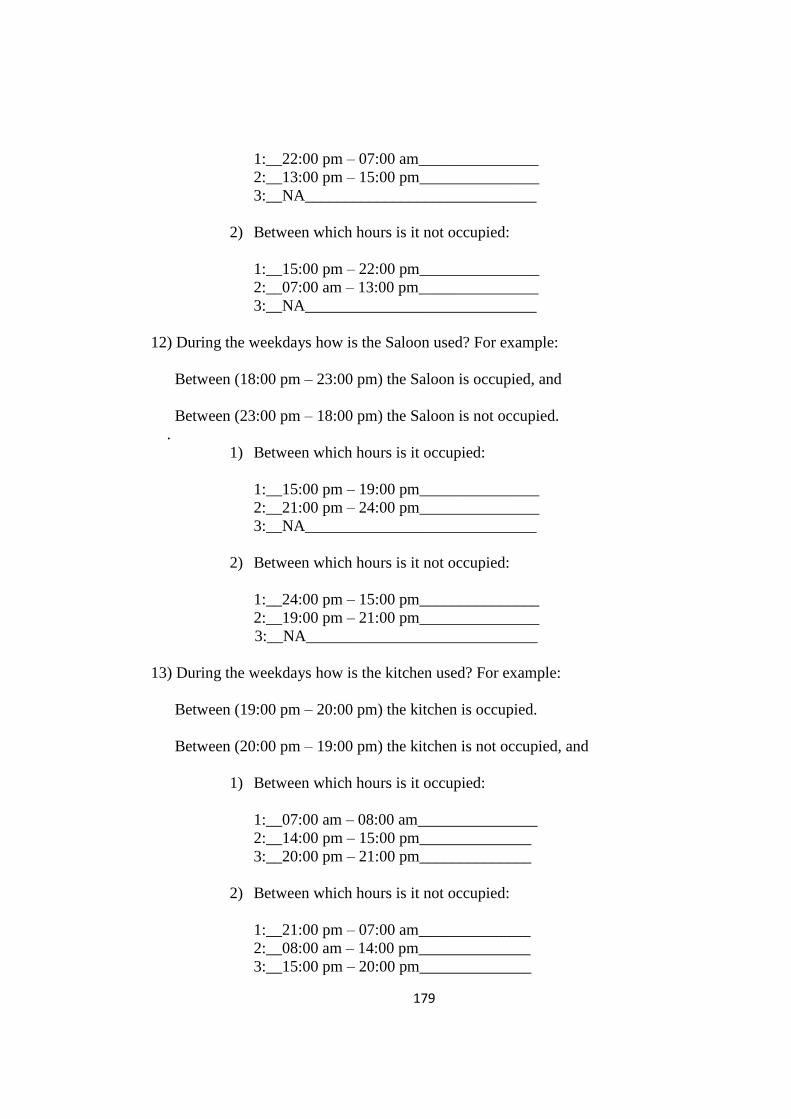
179
1:__22:00 pm – 07:00 am_______________
2:__13:00 pm – 15:00 pm_______________
3:__NA_____________________________
2) Between which hours is it not occupied:
1:__15:00 pm – 22:00 pm_______________
2:__07:00 am – 13:00 pm_______________
3:__NA_____________________________
12) During the weekdays how is the Saloon used? For example:
Between (18:00 pm – 23:00 pm) the Saloon is occupied, and
Between (23:00 pm – 18:00 pm) the Saloon is not occupied.
.
1) Between which hours is it occupied:
1:__15:00 pm – 19:00 pm_______________
2:__21:00 pm – 24:00 pm_______________
3:__NA_____________________________
2) Between which hours is it not occupied:
1:__24:00 pm – 15:00 pm_______________
2:__19:00 pm – 21:00 pm_______________
3:__NA_____________________________
13) During the weekdays how is the kitchen used? For example:
Between (19:00 pm – 20:00 pm) the kitchen is occupied.
Between (20:00 pm – 19:00 pm) the kitchen is not occupied, and
1) Between which hours is it occupied:
1:__07:00 am – 08:00 am_______________
2:__14:00 pm – 15:00 pm______________
3:__20:00 pm – 21:00 pm______________
2) Between which hours is it not occupied:
1:__21:00 pm – 07:00 am______________
2:__08:00 am – 14:00 pm______________
3:__15:00 pm – 20:00 pm______________

180
14) During the weekdays how is the laundry used? For example:
On Wednesday Between (20:00 pm – 21:00 pm) the laundry is used, or
During the weekdays it is not used,
1) Between which hours is it occupied:
1:__10:00 am – 11:00 am_______________
2:__NA_____________________________
3:__NA_____________________________
2) Between which hours is it not occupied:
1:__11:00 am – 10:00 am_______________
2:__NA_____________________________
3:__NA_____________________________
15) During the weekends how is the M. Bedroom used? For example:
Between (24:00 pm – 09:00 am) the M. Bedroom is occupied, and
Between (09:00 am – 24:00 pm) the M. Bedroom is not occupied.
1) Between which hours is it occupied:
1:__24:00 pm – 10:00 am______________
2:__17:00 pm – 18:00 pm______________
3:__NA_____________________________
2) Between which hours is it not occupied:
1:__18:00 pm – 24:00 pm______________
2:__10:00 am – 17:00 pm______________
3:__NA____________________________
16) During the weekends how is the Bedroom-1 used? For example:
Between (24:00 pm – 09:00 am) the Bedroom-1 is occupied, and
Between (09:00 am – 24:00 pm) the Bedroom-1 is not occupied.
1) Between which hours is it occupied:
1:__11:00 am – 12:00 am_______________
2:__NA_____________________________
3:__NA_____________________________

181
2) Between which hours is it not occupied:
1:__12:00 am – 11:00 am_______________
2:__NA_____________________________
3:__NA_____________________________
17) During the weekends how is the Bedroom-2 used? For example:
Between (24:00 pm – 09:00 am) the Bedroom-2 is occupied.
Between (09:00 am – 24:00 pm) the Bedroom-2 is not occupied, and
1) Between which hours is it occupied:
1:__22:00 pm – 07:00 am_______________
2:__15:00 pm – 17:00 pm_______________
3:__NA_____________________________
2) Between which hours is it not occupied:
1:__17:00 pm – 22:00 pm_______________
2:__07:00 am – 15:00 pm_______________
3:__NA_____________________________
18) During the weekends how is the Saloon used? For example:
Between (09:00 am – 24:00 pm) the Saloon is occupied.
Between (24:00 pm – 09:00 am) the Saloon is not occupied, and
1) Between which hours is it occupied:
1:__12:00 am – 15:00 pm______________
2:__18:00 pm – 20:00 pm______________
3:__21:00 pm – 24:00 pm______________
2) Between which hours is it not occupied:
1:__24:00 pm – 12:00 am___________
2:__15:00 pm – 18:00 pm___________
3:__20:00 pm – 21:00 pm___________
19) During the weekends how is the kitchen used? For example:
Between (19:00 pm – 20:00 pm) the kitchen is occupied, and

182
Between (11:00 am – 19:00 pm) the kitchen is not occupied, and
Between (10:00 am – 11:00 am) the kitchen is occupied, and
Between (20:00 pm – 10:00 am) the kitchen is not occupied,
1) Between which hours is it occupied:
1:__10:00 am – 11:00 am_______________
2:__15:00 pm – 16:00 pm_______________
3:__20:00 pm – 21:00 pm_______________
2) Between which hours is it not occupied:
1:__21:00 pm – 10:00 am_______________
2:__11:00 am – 15:00 pm_______________
3:__16:00 pm – 20:00 pm_______________
20) During the weekends how is the laundry used? For example:
On Wednesday Between (20:00 pm – 21:00 pm) the laundry is used, or
During the weekdays it is not used,
1) Between which hours is it occupied:
1:__10:00 am – 11:00 am_______________
2:__NA_____________________________
3:__NA_____________________________
2) Between which hours is it not occupied:
1:__11:00 am – 10:00 am_______________
2:__NA_____________________________
3:__NA_____________________________
21) What are the holidays of the year that you celebrate? State Yes and for how
many days?
1) Ramadan days: __Yes, three days _____________________________
2) Pilgrimage days: __Yes, four days_____________________________
3) New Year: __Yes, one day___________________________________
4) Independence day: __Yes, one day____________________________
5) Children day: __Yes, one day________________________________
6) Workers day: __Yes, one day________________________________

183
7) Summer holidays: __Yes, three month_________________________
8) Other: __NA_____________________________________________
9) Other: __NA______________________________________________
10) Other: __NA______________________________________________
22) Which holidays do you leave home and for how many days? For example:
Summer Holidays: 90 days
1) __Summer Holidays, for 90 days ______________________________
2) __Ramadan Holiday, for 3 days_______________________________
3) __Haj Holidays, for 4 days___________________________________
4) __Children’s Day, for 1 day__________________________________
5) Other: __NA______________________________________________
6) Other: __NA______________________________________________
7) Other: __NA______________________________________________
23) Do you have a water radiator heating system (Combi System) for heating in
winter? State Yes or No? If no which other system do you use?
__Yes____________________________________________________________
24) For how many months (during the winter) of the year do you use this heating
system fully?
___Six Months (October. November, December, January, February, March) ____
25) For how many months (during the summer) of the year do you not use this
heating system fully?
___Six Months (April, May, June, July, August, September) ________________
26) Approximately how much money do you use to buy natural gas or electricity for
this heating system?
___3600 TL / One Year for heating purposes and water heating______________
27) Do you use any device (for example cooler or fan) to cool during the summer?
State Yes or No. If yes describe the device and between which times it is used in
summer.
__No_____________________________________________________________
_________________________________________________________________

184
28) Do you ventilate your house mechanically? State Yes or No. If yes describe the
device and at what times it is used. For Example:
Split Unit (Used between 12:00 pm – 20:00 pm)
__No_____________________________________________________________
_________________________________________________________________
29) Do you ventilate your house naturally in summer? State Yes or No. If yes
describe the times this is done. For example
(Windows are open between 12:00 pm – 20:00 pm)
__Yes, Open Windows (Opened Between 12:00 am – 20:00 pm)_____________
_________________________________________________________________
30) Do you have computers in your house? State Yes or No. If yes, describe how
many and where they are located in the house?
__ Yes, One Laptop Computer. Located in the Bedroom-1__________________
_________________________________________________________________
_________________________________________________________________
31) Do you have office equipment (printer, fax, and etc)? State Yes or No. If yes,
describe what they are, how many, and where they are located in the house?
__NA____________________________________________________________
_________________________________________________________________
_________________________________________________________________

185
QUESTIONNAIRE – FLAT- 3
1) How many are your family members? Write applicable (Yes or No).
1) Father: __Yes___________________________________________
2) Mother:__Yes___________________________________________
3) Child-1: __Yes__________________________________________
4) Child-2: __Yes__________________________________________
5) Child-3: __NA___________________________________________
6) Child-4: __NA___________________________________________
7) Other: __NA____________________________________________
2) How many boys and how many girls are your children? State the number.
1) Girls: __Yes, two girls____________________________________
2) Boys: __NA_____________________________________________
3) Write down the number series of children by age and gender. Write applicable.
For example:- Child-1: Girl (10 years old)
1) Child-1: __Girl (12 years Old)______________________________
2) Child-2: __Girl ( 8 years Old)_______________________________
3) Child-3: __NA___________________________________________
4) Child-4: __NA___________________________________________
5) Other: __NA____________________________________________
5) Which room belongs to child-1? Write (Yes or No or Not applicable).
1) Bedroom-1: __NA________________________________________
2) Bedroom-2: __Yes, Room for Child-1________________________
6) Which room belongs to child-2? Write (Yes or No or Not applicable).
1) Bedroom-1: __ Yes, Room for Child-2________________________
2) Bedroom-2: __NA________________________________________
7) Which room belongs to child-3? Write (Yes or No or Not applicable).
1) Bedroom-1: __NA________________________________________
2) Bedroom-2: __NA________________________________________
8) Which room belongs to child-4? Write (Yes or No or Not applicable).

186
1) Bedroom-1: __NA________________________________________
2) Bedroom-2: __NA________________________________________
9) During the weekdays how is the M. Bedroom used? For example:
Between (23:00 pm – 07:00 am) the M. Bedroom is occupied, and.
Between (07:00 am – 18:00 pm) the M. Bedroom is not occupied.
1) Between which hours is it occupied:
1:__24:00 pm – 07:00 am______________
2:__12:00 am – 14:00 pm______________
3:__19:00 pm – 20:00 pm______________
2) Between which hours is it not occupied:
1:__20:00 pm – 24:00 pm______________
2:__07:00 am – 12:00 am______________
3:__14:00 pm – 19:00 pm______________
10) During the weekdays how is the Bedroom-1 used? For example:
Between (23:00 pm – 07:00 am) the Bedroom-1 is occupied, and
Between (07:00 am – 18:00 pm) the Bedroom-1 is not occupied.
1) Between which hours is it occupied:
1:__24:00 pm – 07:00 am______________
2:__19:00 pm – 20:00 pm______________
3:__NA____________________________
2) Between which hours is it not occupied:
1:__20:00 pm – 24:00 pm______________
2:__07:00 am – 19:00 pm______________
3:__NA____________________________
11) During the weekdays how is the Bedroom-2 used? For example:
Between (23:00 pm – 07:00 am) the Bedroom-1 is occupied, and
Between (07:00 am – 18:00 pm) the Bedroom-1 is not occupied.
1) Between which hours is it occupied:

187
1:__24:00 pm – 07:00 am______________
2:__19:00 pm – 20:00 pm______________
3:__NA____________________________
2) Between which hours is it not occupied:
1:__20:00 pm – 24:00 pm______________
2:__07:00 am – 19:00 pm______________
3:__NA____________________________
12) During the weekdays how is the Saloon used? For example:
Between (18:00 pm – 23:00 pm) the Saloon is occupied, and
Between (23:00 pm – 18:00 pm) the Saloon is not occupied.
1) Between which hours is it occupied:
1:__10:00 am – 14:00 pm______________
2:__15:00 pm – 19:00 pm______________
3:__21:00 pm – 24:00 pm______________
2) Between which hours is it not occupied:
1:__24:00 pm – 10:00 am___________
2:__14:00 pm – 16:00 pm___________
3:__20:00 pm – 21:00 pm___________
13) During the weekdays how is the kitchen used? For example:
Between (19:00 pm – 20:00 pm) the kitchen is occupied.
Between (20:00 pm – 19:00 pm) the kitchen is not occupied, and
1) Between which hours is it occupied:
1:__07:00 am – 08:00 am______________
2:__14:00 pm – 15:00 pm______________
3:__20:00 pm – 21:00 pm______________
2) Between which hours is it not occupied:
1:__21:00 pm – 07:00 am______________
2:__08:00 am – 14:00 pm______________
3:__15:00 pm – 20:00 pm______________

188
14) During the weekdays how is the laundry used? For example:
On Wednesday Between (20:00 pm – 21:00 pm) the laundry is used, or
During the weekdays it is not used,
1) Between which hours is it occupied:
1:__10:00 am – 11:00 am_______________
2:__NA_____________________________
3:__NA_____________________________
2) Between which hours is it not occupied:
1:__11:00 am – 10:00 am_______________
2:__NA_____________________________
3:__NA_____________________________
15) During the weekends how is the M. Bedroom used? For example:
Between (24:00 pm – 09:00 am) the M. Bedroom is occupied, and
Between (09:00 am – 24:00 pm) the M. Bedroom is not occupied.
1) Between which hours is it occupied:
1:__24:00 pm – 10:00 am_______________
2:__17:00 pm – 18:00 pm_______________
3:__NA_____________________________
2) Between which hours is it not occupied:
1:__18:00 pm – 24:00 pm_______________
2:__10:00 am – 17:00 pm_______________
3:__NA_____________________________
16) During the weekends how is the Bedroom-1 used? For example:
Between (24:00 pm – 09:00 am) the Bedroom-1 is occupied, and
Between (09:00 am – 24:00 pm) the Bedroom-1 is not occupied.
1) Between which hours is it occupied:
1:__24:00 pm – 10:00 am_______________
2:__17:00 am – 18:00 pm_______________
3:__NA_____________________________

189
2) Between which hours is it not occupied:
1:__18:00 pm – 24:00 pm_______________
2:__10:00 am – 17:00 pm_______________
3:__NA_____________________________
17) During the weekends how is the Bedroom-2 used? For example:
Between (24:00 pm – 09:00 am) the Bedroom-2 is occupied.
Between (09:00 am – 24:00 pm) the Bedroom-2 is not occupied, and
1) Between which hours is it occupied:
1:__24:00 pm – 10:00 am_______________
2:__17:00 pm – 18:00 pm_______________
3:__NA_____________________________
2) Between which hours is it not occupied:
1:__18:00 pm – 24:00 pm_______________
2:__10:00 am – 17:00 pm_______________
3:__NA_____________________________
18) During the weekends how is the Saloon used? For example:
Between (09:00 am – 24:00 pm) the Saloon is occupied.
Between (24:00 pm – 09:00 am) the Saloon is not occupied, and
1) Between which hours is it occupied:
1:__11:00 am – 16:00 pm______________
2:__18:00 pm – 20:00 pm______________
3:__21:00 pm – 24:00 pm______________
2) Between which hours is it not occupied:
1:__24:00 pm – 11:00 am______________
2:__16:00 pm – 18:00 pm______________
3:__20:00 pm – 21:00 pm______________
19) During the weekends how is the kitchen used? For example:
Between (19:00 pm – 20:00 pm) the kitchen is occupied, and

190
Between (11:00 am – 19:00 pm) the kitchen is not occupied, and
Between (10:00 am – 11:00 am) the kitchen is occupied, and
Between (20:00 pm – 10:00 am) the kitchen is not occupied,
1) Between which hours is it occupied:
1:__10:00 am – 11:00 am_______________
2:__16:00 pm – 17:00 pm_______________
3:__20:00 pm – 21:00 pm_______________
2) Between which hours is it not occupied:
1:__21:00 pm – 10:00 am_______________
2:__11:00 am – 16:00 pm_______________
3:__17:00 pm – 20:00 pm_______________
20) During the weekends how is the laundry used? For example:
On Wednesday Between (20:00 pm – 21:00 pm) the laundry is used, or
During the weekdays it is not used,
1) Between which hours is it occupied:
1:__10:00 am – 11:00 am_______________
2:__NA_____________________________
3:__NA_____________________________
2) Between which hours is it not occupied:
1:__11:00 am – 10:00 am_______________
2:__NA_____________________________
3:__NA_____________________________
21) What are the holidays of the year that you celebrate? State Yes and for how
many days?
1) Ramadan days: __Yes, three days _____________________________
2) Pilgrimage days: __Yes, four days_____________________________
3) New Year: __Yes, one day___________________________________
4) Independence day: __Yes, one day____________________________
5) Children day: __Yes, one day________________________________
6) Workers day: __Yes, one day________________________________
7) Summer holidays: __Yes, three month_________________________
8) Other: __NA______________________________________________

191
9) Other: __NA______________________________________________
10) Other: __NA______________________________________________
22) Which holidays do you leave home and for how many days? For example:
Summer Holidays: 90 days
1) __Summer Holidays, for 90 days ______________________________
2) __Ramadan Holiday, for 3 days_______________________________
3) __Haj Holidays, for 4 days___________________________________
4) __Children’s Day, for 1 day__________________________________
5) Other: __NA______________________________________________
6) Other: __NA______________________________________________
7) Other: __NA______________________________________________
23) Do you have a water radiator heating system (Combi System) for heating in
winter? State Yes or No? If no which other system do you use?
__Yes____________________________________________________________
24) For how many months (during the winter) of the year do you use this heating
system fully?
___Six Months (October, November, December, January, February, March) ____
25) For how many months (during the summer) of the year do you not use this
heating system fully?
___Six Months (April, May, June, July, August, September) ________________
26) Approximately how much money do you use to buy natural gas or electricity for
this heating system?
___3600 TL / One Year for heating purposes and water heating______________
27) Do you use any device (for example cooler or fan) to cool during the summer?
State Yes or No. If yes describe the device and between which times it is used in
summer.
__No_____________________________________________________________
_________________________________________________________________
28) Do you ventilate your house mechanically? State Yes or No. If yes describe the
device and at what times it is used. For Example:

192
Split Unit (Used between 12:00 pm – 20:00 pm)
__No_____________________________________________________________
_________________________________________________________________
29) Do you ventilate your house naturally in summer? State Yes or No. If yes
describe the times this is done. For example
(Windows are open between 12:00 pm – 20:00 pm)
__Yes, Open Windows (Opened Between 12:00 am – 20:00 pm)_____________
_________________________________________________________________
30) Do you have computers in your house? State Yes or No. If yes, describe how
many and where they are located in the house?
__ Yes, One Laptop Computer. Located in the Saloon______________________
_________________________________________________________________
31) Do you have office equipment (printer, fax, and etc)? State Yes or No. If yes,
describe what they are, how many, and where they are located in the house?
__NA_______________________________________________________________
____________________________________________________________________

193
APPENDIX B
DIFFERENT CONSTRUCTION SYSTEM UNDER INVESTIGATION
(BS EN ISO 6946)
Table 46 Different Construction System Under Investigation (BS EN ISO 6946)
Type of Wall Construction System Conductivity
W/m2 x k
Specific
Heat
J/Kg x K
Density
Kg/m3
Existing Wall Construction System
Red Brick Block 13.5 cm (Outer Leaf) 0.32 1000 600
Red Brick Block 8.5 cm (Inner Leaf) 0.32 1000 650
Wall Construction System Under Study
Autoclaved Aerated Concrete (AAC) 0.11 896 2800
Concrete Block (Heavyweight) 1.63 1000 2300
Concrete Block (lightweight) 0.19 1000 600

194

195
APPENDIX C
DIFFERENT INSULATION MATERIALS UNDER INVESTIGATION
(URALITA)
Table 47 Different Insulation Materials Under Investigation (Uralita)
Type of Wall Insulation System Conductivity
W/m2 x k
Specific
Heat
J/Kg x K
Density
Kg/m3
Exiting Wall Insulation System
Extruded Polystyrene Foam (CO2 Blown)
XPS
0.034 1400 35
Expanded Polystyrene (Standard) EPS 0.040 1400 15
Proposed Wall Insulation System
MW Glass Wool (High Performance
Panels)
0.032 840 30

196

197
APPENDIX D
DIFFERENT WINDOW FRAMES UNDER INVESTIGATION
(BS EN ISO 6946)
Table 48 Different Window Frames Under Investigation
Type of Window Frame U-Value (W/m2
x k)
Existing Window Frames
Painted Wooden Window Frame 3.633
Proposed Window Frame
Unplasticized Polyvinyl Chloride (UPVC) Window Frame 3.476

198

199
APPENDIX E
ORIGINAL EXTERNAL WALL SYSTEM (SECTION BASE CASE)
Table 49 Original External Wall System (Section Base Case)
Construction
External Walls
Number of Layers 6
Outermost Layer 0.030 M Gypsum Insulating Plaster
Second Layer 0.040 M XPS Extruded Polystyrene – Co2 Blowing
Third Layer 0.135 M Brick
Fourth Layer 0.030 M EPS Expanded Polystyrene (Standard)
Fifth Layer 0.085 M Brick
Innermost Layer 0.020 M Gypsum Insulating Plaster

200

201
APPENDIX F
HVAC TEMPLATE (DESIGN BUILDER)
Table 50 HVAC Template (Design Builder)
Template Hot Water Radiator Heating,Natural Ventilation
Mechanical Ventilation
ON or OFF Off
Auxiliary Energy
Auxiliary Energy (kWh/m2) 3.26
Heating
ON or OFF On
Fuel 2-Natural Gas
Heating System CoP 0.65
Type
Heating Type 1-Convective
Supply Air Condition
Supply Air Temperature (°C) 15
Supply Air Humidity Ratio (g/g) 0.010
Operation
Schedule Winter (Northern Hemisphere)
Cooling
ON or OFF Off
DHW
ON or OFF On
DHW Template Project DHW
Type 4- Instantaneous DHW only
DHW CoP 0.850
Fuel 2- Natural Gas
Water Temperatures
Delivery Temperature (°C) 50
Mains Supply Temperature (°C) 10
Operation
Schedule On
Natural Ventilation
ON or OFF On
Outside Air Definition Method 1- By Zone
Outside Air (ac/h) 3.00
Schedule Summer (Northern Hemisphere)
Air Temperature Distribution
Distribution Mode 1- Mixed

202

203
APPENDIX G
LIGHTING TEMPLATE (DESIGN BUILDER)
Table 51 Lighting Template (Design Builder)
Lighting Template
Template Fluorescent
General Lighting
ON or OFF On
Light Energy (W / m2-100 lux) 4.60
Schedule (According to zone usage)
Luminaire Type 1- Suspended
Radiant Fraction 0.420
Visible Fraction 0.180
Convective Fraction 0.400
Task and Display Lighting
ON or OFF Off
Exterior Lighting
ON or OFF Off
Lighting Control
ON or OFF Off

204

205
APPENDIX H
GLAZING TEMPLATE (DESIGN BUILDER) – PART-1
Table 52 Glazing Template (Design Builder) – Part-1
Glazing Template
Template Project Glazing Template
External Windows
Glazing Type Alternative 1, 2 or 3
Layout No glazing
Dimension
Type 0-None
Reveal
Inside Reveal Depth (m) 0.00
Inside Sill Depth (m) 0.00
Frame Dividers
ON or OFF (Has a Frame / Dividers) On
Construction UPVC Window Frame
Dividers
Type 1- Divided Lite
Width (m) 0.020
Horizontal Dividers 1
Vertical Dividers 1
Outside Projection (m) 0.00
Inside Projection (m) 0.00
Glass Edge-Center Construction Ratio 1.00
Frame
Frame Width (m) 0.040
Frame Inside Projection (m) 0.00
Frame Outside Projection (m) 0.00
Glass Edge-Center Construction Ratio 1.00
Shading
ON or OFF (Window Shading) Off
ON of OFF (Local Shading) Off
Internal Windows
Glazing Type Project Internal Glazing
Layout No Glazing

206
Table 52 (Continued) Glazing Template (Design Builder) – Part-2
Dimensions
Type 0- None
Frame and Dividers
ON or OFF (Has a frame / dividers) Off
Operation
% Glazing area opens % 0
Operation Schedule Off
Roof Windows / Skylight
Glazing Type Project Roof Glazing
Layout No roof glazing
Dimensions
Type 0-None
Frame and Dividers
ON or OFF (Has a frame / dividers) Off
Shading
ON or OFF (Window Shading) Off
Door
External
ON or OFF (Auto generate) Off
Internal
ON or OFF (Auto generate) Off
Operation
% Area Door Opens 0
% Time Door is Open 0
Operation Schedule Off
Vents
Internal
ON or OFF (Auto generate) Off
Operation
Operation Schedule Off

207
APPENDIX I
PROPOSED EXTERNAL WALL SYSTEM (SECTIONS 1A, 1B, 1C AND 1D)
Table 53 Proposed External Wall System (Section 1A, 1B, 1C and 1D)
Construction
Proposed External Walls-1A
Number of Layers 3
Outermost Layer 0.030 M Gypsum Exterior Plaster
Second Layer 0.20 M Aerated Autoclaved Concrete Block
Innermost Layer 0.020 M Gypsum Interior Plaster
Proposed External Walls-1B
Number of Layers 4
Outermost Layer 0.030 M Gypsum Exterior Plaster
Second Layer 0.050 M MW Glass Wool (High Performance
Panel)
Third Layer 0.20 M Aerated Autoclaved Concrete Block
Innermost Layer 0.020 M Gypsum Interior Plaster
Proposed External Walls-1C
Number of Layers 5
Outermost Layer 0.030 M Gypsum Exterior Plaster
Second Layer 0.10 M Aerated Autoclaved Concrete Block
Third Layer 0.050 M MW Glass Wool (High Performance
Panel)
Fourth Layer 0.10 M Aerated Autoclaved Concrete Block
Innermost Layer 0.020 M Gypsum Interior Plaster
Proposed External Walls-1D
Number of Layers 4
Outermost Layer 0.030 M Gypsum Exterior Plaster
Second Layer 0.20 M Aerated Autoclaved Concrete Block
Third Layer 0.050 M MW Glass Wool (High Performance
Panel)
Innermost Layer 0.020 M Gypsum Interior Plaster

208

209
APPENDIX J
PROPOSED EXTERNAL WALL SYSTEM (SECTIONS 2A, 2B, 2C AND 2D)
Table 54 Proposed External Wall System (Sections 2A, 2B, 2C and 2D)
Construction
Proposed External Walls-2A
Number of Layers 3
Outermost Layer 0.030 M Gypsum Exterior Plaster
Second Layer 0.20 M Hollow Heavyweight Concrete Block
Innermost Layer 0.020 M Gypsum Interior Plaster
Proposed External Walls-2B
Number of Layers 4
Outermost Layer 0.030 M Gypsum Exterior Plaster
Second Layer 0.050 M MW Glass Wool (High Performance
Panel)
Third Layer 0.20 M Hollow Heavyweight Concrete Block
Innermost Layer 0.020 M Gypsum Interior Plaster
Proposed External Walls-2C
Number of Layers 5
Outermost Layer 0.030 M Gypsum Exterior Plaster
Second Layer 0.10 M Hollow Heavyweight Concrete Block
Third Layer 0.050 M MW Glass Wool (High Performance
Panel)
Fourth Layer 0.10 M Hollow Heavyweight Concrete Block
Innermost Layer 0.020 M Gypsum Interior Plaster
Proposed External Walls-2D
Number of Layers 4
Outermost Layer 0.030 M Gypsum Exterior Plaster
Second Layer 0.20 M Hollow Heavyweight Concrete Block
Third Layer 0.050 M MW Glass Wool (High Performance
Panel)
Innermost Layer 0.020 M Gypsum Interior Plaster

210

211
APPENDIX K
PROPOSED EXTERNAL WALL SYSTEM (SECTIONS 3A, 3B, 3C AND 3D)
Table 55 Proposed External Wall System (Sections 3A, 3B, 3C and 3D)
Construction
Proposed External Walls-3A
Number of Layers 3
Outermost Layer 0.030 M Gypsum Exterior Plaster
Second Layer 0.20 M Hollow Lightweight Concrete Block
Innermost Layer 0.020 M Gypsum Interior Plaster
Proposed External Walls-3B
Number of Layers 4
Outermost Layer 0.030 M Gypsum Exterior Plaster
Second Layer 0.050 M MW Glass Wool (High Performance
Panel)
Third Layer 0.20 M Hollow Lightweight Concrete Block
Innermost Layer 0.020 M Gypsum Interior Plaster
Proposed External Walls-3C
Number of Layers 5
Outermost Layer 0.030 M Gypsum Exterior Plaster
Second Layer 0.10 M Hollow Lightweight Concrete Block
Third Layer 0.050 M MW Glass Wool (High Performance
Panel)
Fourth Layer 0.10 M Hollow Lightweight Concrete Block
Innermost Layer 0.020 M Gypsum Interior Plaster
Proposed External Walls-3D
Number of Layers 4
Outermost Layer 0.030 M Gypsum Exterior Plaster
Second Layer 0.20 M Hollow Lightweight Concrete Block
Third Layer 0.050 M MW Glass Wool (High Performance
Panel)
Innermost Layer 0.020 M Gypsum Interior Plaster

212

213
APPENDIX L
ORIGINAL FLAT ROOF SYSTEM
Table 56 Original Flat Roof System
Construction
Flat Roof
Number of Layers 6
Outermost Layer 0.020 M Concrete Roofing Tiles
Second Layer 0.030 M Screed
Third Layer 0.002 M Pure Bitumen
Fourth Layer 0.080 M XPS Extruded Polystyrene – CO2 Blowing
Fifth Layer 0.120 M Reinforced Concrete with % 2 Steel
Innermost Layer 0.020 M Gypsum Insulating Plaster

214

215
APPENDIX M
ORIGINAL AND PROPOSED PITCHED ROOF SYSTEM
Table 57 Original and Proposed Pitched Roof System
Construction
Pitched Roof (Occupied) Turkey Pitched Roof (Heavyweight)
Number of Layers 3
Outermost Layer 0.025 M Clay Tile (Roofing)
Second Layer 0.1523 MW Stone Wool (Rolls)
Innermost Layer 0.005 M Roofing Felt
Pitched Roof (Unoccupied) Turkey Pitched Roof (Heavyweight)
Number of Layers 3
Outermost Layer 0.025 M Clay Tile (Roofing)
Second Layer 0.1523 MW Stone Wool (Rolls)
Innermost Layer 0.005 M Roofing Felt

216

217
APPENDIX N
ORIGINAL AND PROPOSED INTERNAL PARTITION SYSTEM
Table 58 Original and Proposed Internal Partition System
Construction
Internal Partition
Number of Layers 3
Outermost Layer 0.020 M Gypsum Insulating Plaster
Second Layer 0.100 M Brick
Innermost Layer 0.020 M Gypsum Insulating Plaster

218

219
APPENDIX O
ORIGINAL SEMI-EXPOSED WALL SYSTEM (BASE CASE)
Table 59 Original Semi-Exposed Wall System (Base Case)
Construction
Semi-exposed Wall-Base Case
Number of Layers 6
Outermost Layer 0.030 M Gypsum Insulating Plaster
Second Layer 0.040 M XPS Extruded Polystyrene – Co2 Blowing
Third Layer 0.135 M Brick
Fourth Layer 0.030 M EPS Expanded Polystyrene (Standard)
Fifth Layer 0.085 M Brick
Innermost Layer 0.020 M Gypsum Insulating Plaster

220

221
APPENDIX P
PROPOSED SEMI-EXPOSED WALL SYSTEM (SECTIONS 1A, 1B, 1C AND
1D)
Table 60 Proposed Semi-Exposed Wall System (Sections 1A, 1B, 1C and 1D)
Construction
Proposed Semi-exposed Walls-1A
Number of Layers 3
Outermost Layer 0.030 M Gypsum Exterior Plaster
Second Layer 0.20 M Aerated Autoclaved Concrete Block
Innermost Layer 0.020 M Gypsum Interior Plaster
Proposed Semi-exposed Walls-1B
Number of Layers 4
Outermost Layer 0.030 M Gypsum Exterior Plaster
Second Layer 0.050 M MW Glass Wool (High Performance
Panel)
Third Layer 0.20 M Aerated Autoclaved Concrete Block
Innermost Layer 0.020 M Gypsum Interior Plaster
Proposed Semi-exposed Walls-1C
Number of Layers 5
Outermost Layer 0.030 M Gypsum Exterior Plaster
Second Layer 0.10 M Aerated Autoclaved Concrete Block
Third Layer 0.050 M MW Glass Wool (High Performance
Panel)
Fourth Layer 0.10 M Aerated Autoclaved Concrete Block
Innermost Layer 0.020 M Gypsum Interior Plaster
Proposed Semi-exposed Walls-1D
Number of Layers 4
Outermost Layer 0.030 M Gypsum Exterior Plaster
Second Layer 0.20 M Aerated Autoclaved Concrete Block
Third Layer 0.050 M MW Glass Wool (High Performance
Panel)
Innermost Layer 0.020 M Gypsum Interior Plaster

222

223
APPENDIX Q
PROPOSED SEMI-EXPOSED WALL SYSTEM (SECTIONS 2A, 2B, 2C AND
2D)
Table 61 Proposed Semi-Exposed Wall System (Sections 2A, 2B, 2C and 2D)
Construction
Proposed Semi-exposed Walls-2A
Number of Layers 3
Outermost Layer 0.030 M Gypsum Exterior Plaster
Second Layer 0.20 M Hollow Heavyweight Concrete Block
Innermost Layer 0.020 M Gypsum Interior Plaster
Proposed Semi-exposed Walls-2B
Number of Layers 4
Outermost Layer 0.030 M Gypsum Exterior Plaster
Second Layer 0.050 M MW Glass Wool (High Performance
Panel)
Third Layer 0.20 M Hollow Heavyweight Concrete Block
Innermost Layer 0.020 M Gypsum Interior Plaster
Proposed Semi-exposed Walls-2C
Number of Layers 5
Outermost Layer 0.030 M Gypsum Exterior Plaster
Second Layer 0.10 M Hollow Heavyweight Concrete Block
Third Layer 0.050 M MW Glass Wool (High Performance
Panel)
Fourth Layer 0.10 M Hollow Heavyweight Concrete Block
Innermost Layer 0.020 M Gypsum Interior Plaster
Proposed Semi-exposed Walls-2D
Number of Layers 4
Outermost Layer 0.030 M Gypsum Exterior Plaster
Second Layer 0.20 M Hollow Heavyweight Concrete Block
Third Layer 0.050 M MW Glass Wool (High Performance
Panel)
Innermost Layer 0.020 M Gypsum Interior Plaster

224

225
APPENDIX R
PROPOSED SEMI-EXPOSED WALL SYSTEM (SECTIONS 3A, 3B, 3C AND
3D)
Table 62 Proposed Semi-Exposed Wall System (Sections 3A, 3B, 3C and 3D)
Construction
Proposed Semi-exposed Walls-3A
Number of Layers 3
Outermost Layer 0.030 M Gypsum Exterior Plaster
Second Layer 0.20 M Hollow Lightweight Concrete Block
Innermost Layer 0.020 M Gypsum Interior Plaster
Proposed Semi-exposed Walls-3B
Number of Layers 4
Outermost Layer 0.030 M Gypsum Exterior Plaster
Second Layer 0.050 M MW Glass Wool (High Performance
Panel)
Third Layer 0.20 M Hollow Lightweight Concrete Block
Innermost Layer 0.020 M Gypsum Interior Plaster
Proposed Semi-exposed Walls-3C
Number of Layers 5
Outermost Layer 0.030 M Gypsum Exterior Plaster
Second Layer 0.10 M Hollow Lightweight Concrete Block
Third Layer 0.050 M MW Glass Wool (High Performance
Panel)
Fourth Layer 0.10 M Hollow Lightweight Concrete Block
Innermost Layer 0.020 M Gypsum Interior Plaster
Proposed Semi-exposed Walls-3D
Number of Layers 4
Outermost Layer 0.030 M Gypsum Exterior Plaster
Second Layer 0.20 M Hollow Lightweight Concrete Block
Third Layer 0.050 M MW Glass Wool (High Performance
Panel)
Innermost Layer 0.020 M Gypsum Interior Plaster

226

227
APPENDIX S
ORIGINAL AND PROPOSED SEMI-EXPOSED CEILING SYSTEM
Table 63 Original and Proposed Semi-Exposed Ceiling System
Construction
Semi-exposed Ceiling-Base
Case
Turkey Semi-Exposed Ceiling (Heavyweight)
Number of Layers 4
Outermost Layer 0.01 M Plywood (Heavyweight)
Second Layer 0.1392 M MW Glass Wool (rolls)
Third Layer 0.10 M Cast Concrete
Innermost Layer 0.013 M Plaster Board

228

229
APPENDIX T
ORIGINAL AND PROPOSED SEMI-EXPOSED FLOOR SYSTEM
Table 64 Original and Proposed Semi-Exposed Floor System
Construction
Semi-exposed Floor
Number of Layers 5
Outermost Layer 0.030 Gypsum Insulating Plaster
Second Layer 0.040 M XPS Extruded Polystyrene – Co2 Blowing
Third Layer 0.120M Concrete, Reinforced ( With 2% Steel)
Fourth Layer 0.030 M Screed
Innermost Layer 0.020 M Ceramic / Porcelain

230

231
APPENDIX U
ORIGINAL AND PROPOSED GROUND FLOOR SYSTEM
Table 65 Original and Proposed Ground Floor System
Construction
Ground Floor
Outermost Layer 5
Second Layer 0.030 M Gypsum Insulating Plaster
Third Layer 0.080 M XPS Extruded Polystyrene – CO2 Blowing
Fourth Layer 0.120 M Reinforced Concrete with % 2 Steel
Innermost Layer 0.030 M Screed
Outermost Layer 0.020 M Wooden Flooring

232

233
APPENDIX V
ORIGINAL AND PROPOSED EXTERNAL FLOOR SYSTEM
Table 66 Original and Proposed External Floor System
Construction
External Floor
Number of Layers 1
Single Layer 0.100 M Dense Cast Concrete

234
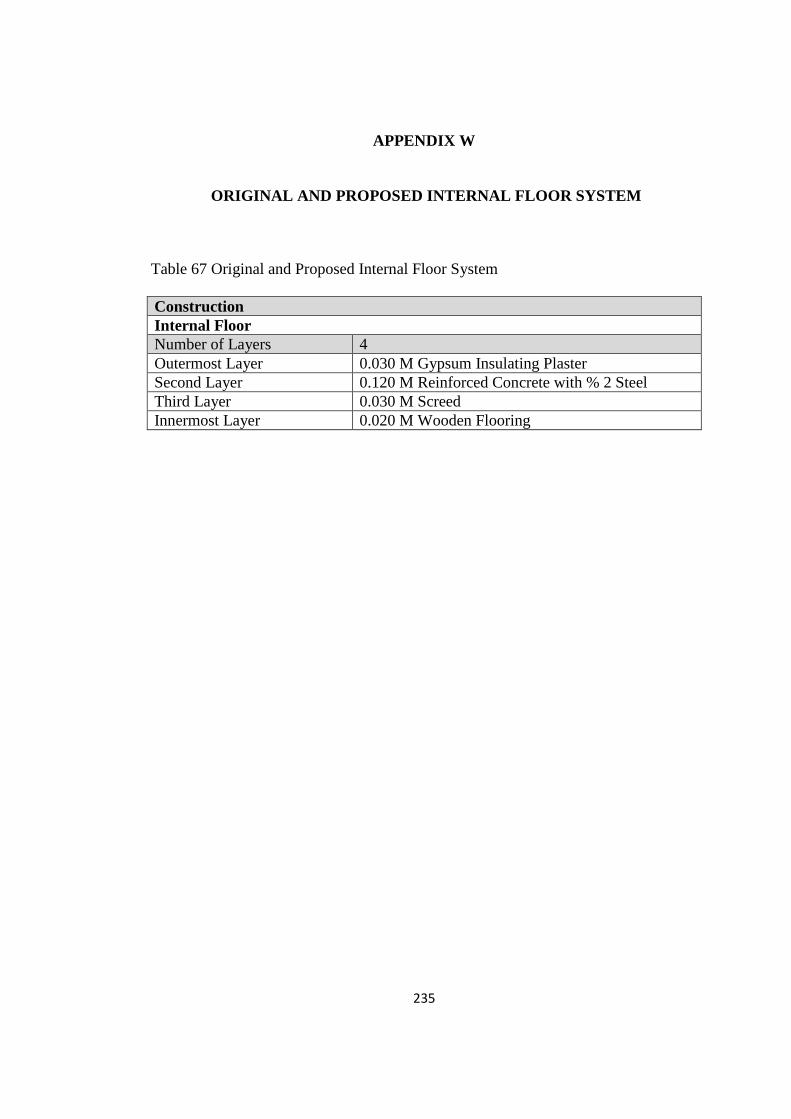
235
APPENDIX W
ORIGINAL AND PROPOSED INTERNAL FLOOR SYSTEM
Table 67 Original and Proposed Internal Floor System
Construction
Internal Floor
Number of Layers 4
Outermost Layer 0.030 M Gypsum Insulating Plaster
Second Layer 0.120 M Reinforced Concrete with % 2 Steel
Third Layer 0.030 M Screed
Innermost Layer 0.020 M Wooden Flooring

236

237
APPENDIX X
ORIGINAL SUB-SURFACES WALL SYSTEM (BASE CASE)
Table 68 Original Sub-Surfaces Wall System (Base Case)
Construction
Sub surface Wall-Base
Case
Number of Layers 6
Outermost Layer 0.030 M Gypsum Insulating Plaster
Second Layer 0.040 M XPS Extruded Polystyrene – Co2 Blowing
Third Layer 0.135 M Brick
Fourth Layer 0.030 M EPS Expanded Polystyrene (Standard)
Fifth Layer 0.085 M Brick
Innermost Layer 0.020 M Gypsum Insulating Plaster

238

239
APPENDIX Y
ORIGINAL AND PROPOSED SUB-SURFACES INTERNAL WALL
SYSTEM
Table 69 Original and Proposed Sub-Surfaces Internal Wall System
Construction
Sub surfaces Internal Wall System
Number of Layers 3
Outermost Layer 0.020 M Gypsum Insulating Plaster
Second Layer 0.100 M Brick
Innermost Layer 0.020 M Gypsum Insulating Plaster

240

241
APPENDIX Z
ORIGINAL AND PROPOSED SUB-SURFACES ROOF SYSTEM
Table 70 Original and Proposed Sub-Surfaces Roof System
Construction
Sub surface Roof System
Number of Layers 3
Outermost Layer 0.020 M Gypsum Insulating Plaster
Second Layer 0.120 M Reinforced Concrete with % 2 Steel
Innermost Layer 0.020 M Gypsum Insulating Plaster

242

243
APPENDIX AA
PROPOSED SUB-SURFACES WALL SYSTEM (SECTIONS 1A, 1B, 1C AND
1D)
Table 71 Proposed Sub-Surfaces Wall System (Sections 1A, 1B, 1C and 1D)
Construction
Proposed Sub surface Walls-1A
Number of Layers 3
Outermost Layer 0.030 M Gypsum Insulating Exterior Plaster
Second Layer 0.20 M Aerated Autoclaved Concrete Block
Innermost Layer 0.020 M Gypsum Insulating Interior Plaster
Proposed Sub surface Walls-1B
Number of Layers 4
Outermost Layer 0.030 M Gypsum Insulating Exterior Plaster
Second Layer 0.050 M MW Glass Wool (High Performance
Panel)
Third Layer 0.20 M Aerated Autoclaved Concrete Block
Innermost Layer 0.020 M Gypsum Insulating Interior Plaster
Proposed Sub surface Walls-1C
Number of Layers 5
Outermost Layer 0.030 M Gypsum Insulating Exterior Plaster
Second Layer 0.10 M Aerated Autoclaved Concrete Block
Third Layer 0.050 M MW Glass Wool (High Performance
Panel)
Fourth Layer 0.10 M Aerated Autoclaved Concrete Block
Innermost Layer 0.020 M Gypsum Insulating Interior Plaster
Proposed Sub surface Walls-1D
Number of Layers 4
Outermost Layer 0.030 M Gypsum Insulating Exterior Plaster
Second Layer 0.20 M Aerated Autoclaved Concrete Block
Third Layer 0.050 M MW Glass Wool (High Performance
Panel)
Innermost Layer 0.020 M Gypsum Insulating Interior Plaster

244

245
APPENDIX BB
PROPOSED SUB-SURFACES WALL SYSTEM (SECTIONS 2A, 2B, 2C AND
2D)
Table 72 Proposed Sub-Surfaces Wall System (Sections 2A, 2B, 2C and 2D)
Construction
Proposed Sub surface Walls-1A
Number of Layers 3
Outermost Layer 0.030 M Gypsum Insulating Exterior Plaster
Second Layer 0.20 M Hollow Heavyweight Concrete Block
Innermost Layer 0.020 M Gypsum Insulating Interior Plaster
Proposed Sub surface Walls-1B
Number of Layers 4
Outermost Layer 0.030 M Gypsum Insulating Exterior Plaster
Second Layer 0.050 M MW Glass Wool (High Performance
Panel)
Third Layer 0.20 M Hollow Heavyweight Concrete Block
Innermost Layer 0.020 M Gypsum Insulating Interior Plaster
Proposed Sub surface Walls-1C
Number of Layers 5
Outermost Layer 0.030 M Gypsum Insulating Exterior Plaster
Second Layer 0.10 M Hollow Heavyweight Concrete Block
Third Layer 0.050 M MW Glass Wool (High Performance
Panel)
Fourth Layer 0.10 M Hollow Heavyweight Concrete Block
Innermost Layer 0.020 M Gypsum Insulating Interior Plaster
Proposed Sub surface Walls-1D
Number of Layers 4
Outermost Layer 0.030 M Gypsum Insulating Exterior Plaster
Second Layer 0.20 M Hollow Heavyweight Concrete Block
Third Layer 0.050 M MW Glass Wool (High Performance
Panel)
Innermost Layer 0.020 M Gypsum Insulating Interior Plaster

246

247
APPENDIX CC
PROPOSED SUB-SURFACES WALL SYSTEM (SECTIONS 3A, 3B, 3C AND
3D)
Table 73 Proposed Sub-Surfaces Wall System (Sections 3A, 3B, 3C and 3D)
Construction
Proposed Sub surface Walls-3A
Number of Layers 3
Outermost Layer 0.030 M Gypsum Insulating Exterior Plaster
Second Layer 0.20 M Hollow Lightweight Concrete Block
Innermost Layer 0.020 M Gypsum Insulating Interior Plaster
Proposed Sub surface Walls-3B
Number of Layers 4
Outermost Layer 0.030 M Gypsum Insulating Exterior Plaster
Second Layer 0.050 M MW Glass Wool (High Performance
Panel)
Third Layer 0.20 M Hollow Lightweight Concrete Block
Innermost Layer 0.020 M Gypsum Insulating Interior Plaster
Proposed Sub surface Walls-3C
Number of Layers 5
Outermost Layer 0.030 M Gypsum Insulating Exterior Plaster
Second Layer 0.10 M Hollow Lightweight Concrete Block
Third Layer 0.050 M MW Glass Wool (High Performance
Panel)
Fourth Layer 0.10 M Hollow Lightweight Concrete Block
Innermost Layer 0.020 M Gypsum Insulating Interior Plaster
Proposed Sub surface Walls-3D
Number of Layers 4
Outermost Layer 0.030 M Gypsum Insulating Exterior Plaster
Second Layer 0.20 M Hollow Lightweight Concrete Block
Third Layer 0.050 M MW Glass Wool (High Performance
Panel)
Innermost Layer 0.020 M Gypsum Insulating Interior Plaster

248
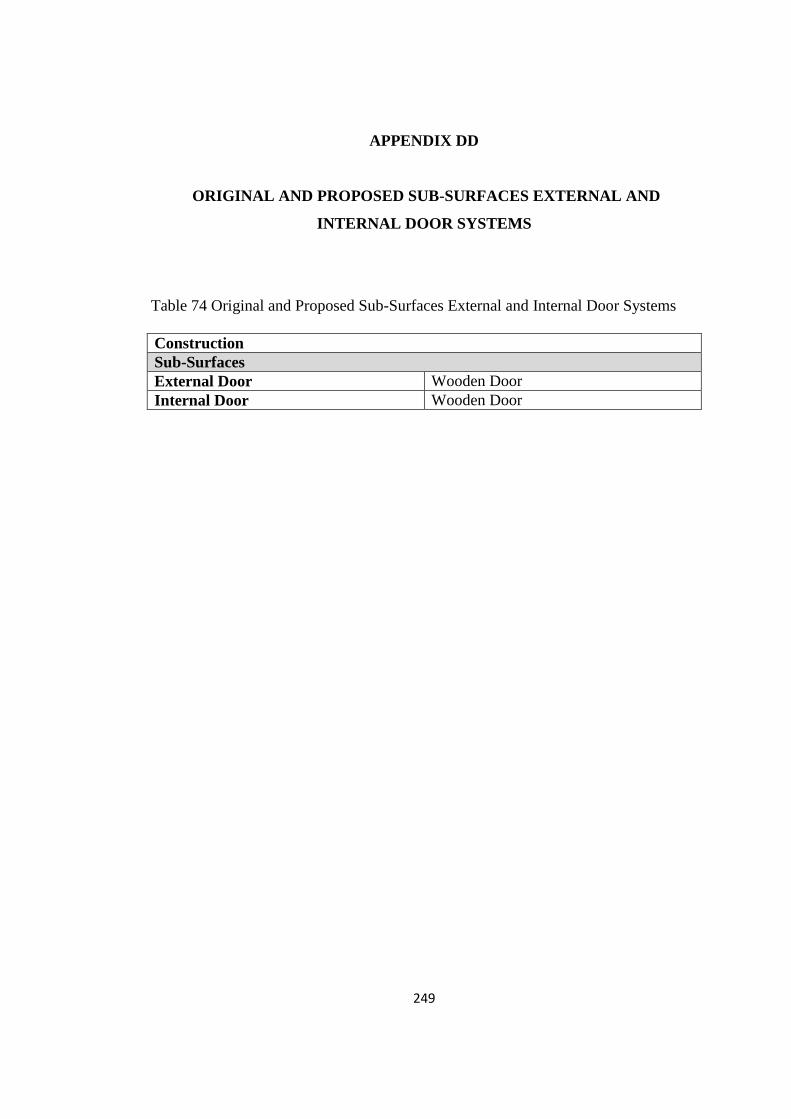
249
APPENDIX DD
ORIGINAL AND PROPOSED SUB-SURFACES EXTERNAL AND
INTERNAL DOOR SYSTEMS
Table 74 Original and Proposed Sub-Surfaces External and Internal Door Systems
Construction
Sub-Surfaces
External Door Wooden Door
Internal Door Wooden Door

250

251
APPENDIX EE
ORIGINAL AND PROPOSED INTERNAL THERMAL MASS SYSTEMS
Table 75 Original and Proposed Internal Thermal Mass Systems
Construction
Project Thermal Mass 0.10 M Cast Concrete Dense

252

253
APPENDIX FF
COMPONENT BLOCKS SHADING AND REFLECTION SYSTEMS
Table 76 Component Blocks Shading and Reflection Systems
Component Block
Component block shades and reflects
ON or OFF off
Material Material
Project component block material
Maximum Transmittance 0.000
Transmittance Schedule
ON or OFF Off ( All the time)

254

255
APPENDIX GG
AIR TIGHTNESS
Table 77 Air Tightness
Air Tightness
Model Infiltration
ON or OFF On
Constant Rate (ac/h) 0.700

256

257
APPENDIX HH
WINDOW OPENING SYSTEM
Table 78 Window Opening System
External Windows Drawn
Glazing Type Any Glazing Type Under Investigation
Frame Type UPVC Frame

258

259
APPENDIX II
DOOR OPENING SYSTEM
Table 79 Door Opening System
Doors
External
Auto generate
ON or OFF Off
Internal
Auto generate
ON or OFF Off
Operation
% Area door opens
% Time door is open
Operation Schedule
ON or OFF Off

260
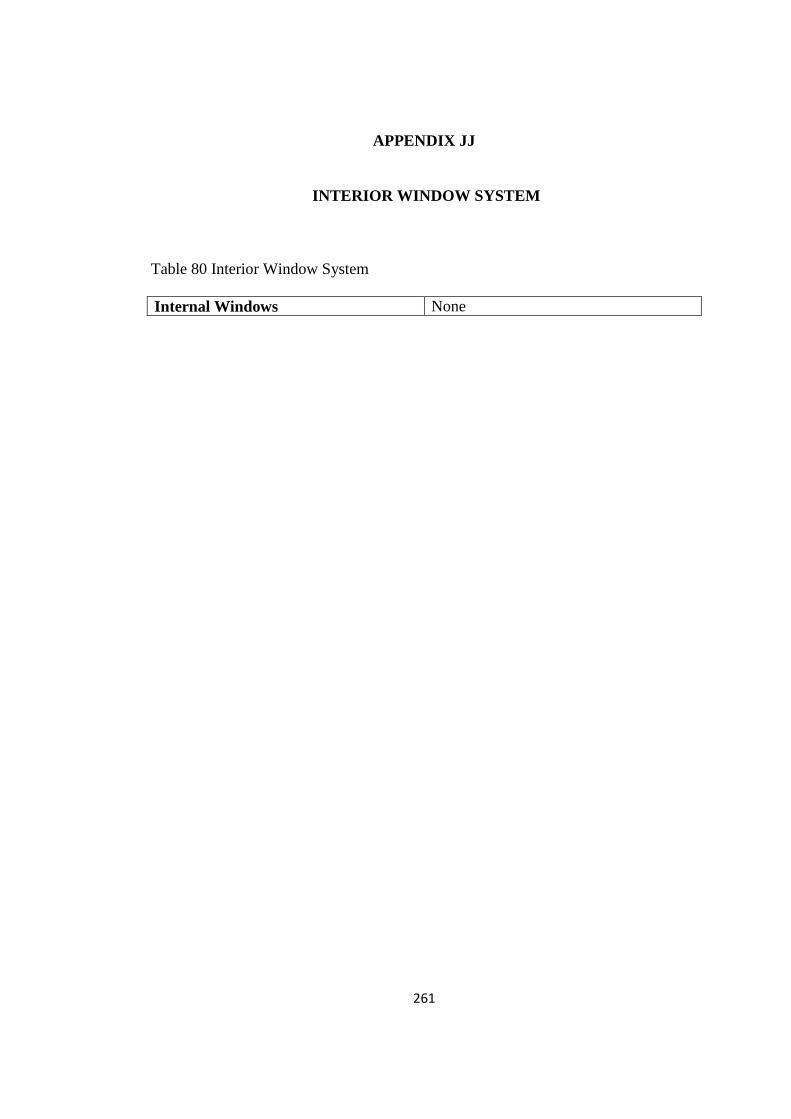
261
APPENDIX JJ
INTERIOR WINDOW SYSTEM
Table 80 Interior Window System
Internal Windows None

262

263
APPENDIX KK
ROOF WINDOW / SKYLIGHT SYSTEM
Table 81 Roof Window / Skylight System
Roof Windows / Skylights None

264

265
APPENDIX LL
VENT OPENING SYSTEM
Table 82 Vent Opening System
Vents
Internal
Vent Type Grille, small, light slats
Auto Generate
ON or OFF off
Operation
ON or OFF off

266

267
APPENDIX MM
OCCUPANCY SCHEDULES FOR FLATS-1, FLAT-2 AND FLAT-3
Table 83 Flat-1 Occupancy Schedule
Time (h) Zones
Saloon M.
Bed
room
Bed
room
-1
Bed
room
-2
Kitche
n
Bath
room
WC Bath Laun-
dry
W
D
W
E
W
D
W
E
W
D
W
E
W
D
W
E
W
D
W
E
W
D
W
E
W
D
W
E
W
D
W
E
W
D
W
E 00:00-08:00 0 0 1 1 0 0 0 0 0 0 0 0 0 0 0 0 0 0 08:00-09:00 0 0 0 1 0 0 0 0 0 0 1 0 0 0 0 0 0 0 09:00-10:00 0 0 0 1 0 0 0 0 0 0 0 0 0 0 0 0 0 0 10:00-11:00 0 0 0 0 0 0 0 0 0 0.5 0 1 0 0 0 0 0 1 11:00-12:00 0 1 0 0 0 0 0 0 0 0 0 0 0 0 0 0 0 0 12:00-13:00 0 1 0 0 0 0 0 0 0 0 0 0 0 0 0 0 0 0 13:00-14:00 0 1 0 0 0 0 0 0 0 0 0 0 0 0 0 0 0 0 14:00-15:00 0 1 0 0 0 0 0 0 0 0 0 0 0 0 0 0 0 0 15:00-16:00 0 1 0 0 0 0 0 0 0 0 0 0 0 0 0 0 0 0 16:00-17:00 0 1 0 0 0 0 0 0 0 0 0 1 0 0 0 0 0 0 17:00-18:00 0 1 0 0 0 0 0 0 0 0 0 0 0 0 0 0 0 0 18:00-19:00 0 1 0 0 0 0 0 0 0 0 0 0 0 0 0 0 0 0 19:00-20:00 0 0 0 0 0 0 0 0 0.5 0.5 0 0 0 0 0 0 0 0 20:00-21.00 1 1 0 0 0 0 0 0 0 0 0 0 0 0 0 0 0 0 21:00-22:00 1 1 0 0 0 0 0 0 0 0 0 0 0 0 0 0 0 0 22:00-23:00 1 1 0 0 0 0 0 0 0 0 0 0 0 0 0 0 0 0 23:00-00:00 1 1 0 0 0 0 0 0 0 0 1 1 0 0 0 0 0 0

268
Table 84 Flat-2 Occupancy Schedule
Time (h) Zones
Saloon M.
Bed
room
Bed
room
-1
Bed
room
-2
Kitche
n
Bath
room
WC Bath Laun-
dry
W
D
W
E
W
D
W
E
W
D
W
E
W
D
W
E
W
D
W
E
W
D
W
E
W
D
W
E
W
D
W
E
W
D
W
E 00:00-07:00 0 0 1 1 0 0 1 1 0 0 0 0 0 0 0 0 0 0 07:00-08:00 0 0 0 1 0 0 0 0 0.5 0 0 0 1 1 1 1 0 0 08:00-09:00 0 0 0 1 0 0 0 0 0 0 1 1 0 0 0 0 0 0 09:00-10:00 0 0 0 1 1 0 0 0 0 0 0 0 0 0 0 0 0 0 10:00-11:00 0 0 0 0 1 0 0 0 0 0.5 0 0 0 0 0 0 1 1 11:00-12:00 0 0 0 0 1 1 0 0 0 0 0 0 0 0 0 0 0 0 12:00-13:00 0 1 1 0 0 0 0 0 0 0 0 0 0 0 0 0 0 0 13:00-14:00 0 1 1 0 0 0 1 0 0 0 0 0 1 1 0 0 0 0 14:00-15:00 0 1 0 0 0 0 1 0 0.5 0 1 1 0 0 0 0 0 0 15:00-16:00 1 0 0 0 0 0 0 1 0 0.5 0 0 0 0 1 1 0 0 16:00-17:00 1 0 0 0 0 0 0 1 0 0 0 0 0 0 0 0 0 0 17:00-18:00 1 0 0 1 0 0 0 0 0 0 0 0 0 0 0 0 0 0 18:00-19:00 1 1 0 0 0 0 0 0 0 0 0 0 0 0 0 0 0 0 19:00-20:00 0 1 1 0 0 0 0 0 0 0 0 0 0 0 0 0 0 0 20:00-21.00 0 0 0 0 0 0 0 0 0.5 0.5 0 0 0 0 0 0 0 0 21:00-22:00 1 1 0 0 0 0 0 0 0 0 1 1 1 1 0 0 0 0 22:00-23:00 1 1 0 0 0 0 1 1 0 0 0 0 0 0 0 0 0 0 23:00-00:00 1 1 0 0 0 0 1 1 0 0 0 0 0 0 1 1 0 0
Table 85 Flat-3 Occupancy Schedule
Time (h) Zones
Saloon M.
Bed
room
Bed
room
-1
Bed
room
-2
Kitche
n
Bath
room
WC Bath Laun-
dry
W
D
W
E
W
D
W
E
W
D
W
E
W
D
W
E
W
D
W
E
W
D
W
E
W
D
W
E
W
D
W
E
W
D
W
E 00:00-07:00 0 0 1 1 1 1 1 1 0 0 0 0 0 0 0 0 0 0 07:00-08:00 0 0 0 1 0 1 0 1 0.5 0 1 1 1 1 0 0 0 0 08:00-09:00 0 0 0 1 0 1 0 1 0 0 0 0 0 0 0 0 0 0 09:00-10:00 0 0 0 1 0 1 0 1 0 0 0 0 0 0 0 0 0 0 10:00-11:00 1 0 0 0 0 0 0 0 0 0.5 0 0 0 0 0 0 1 1 11:00-12:00 1 1 0 0 0 0 0 0 0 0 0 0 0 0 0 0 0 0 12:00-13:00 1 1 1 0 0 0 0 0 0 0 0 0 0 0 0 0 0 0 13:00-14:00 1 1 1 0 0 0 0 0 0 0 0 0 0 0 0 0 0 0 14:00-15:00 0 1 0 0 0 0 0 0 0.5 0 0 0 1 1 0 0 0 0 15:00-16:00 1 1 0 0 0 0 0 0 0 0 1 1 0 0 0 0 0 0 16:00-17:00 1 0 0 0 0 0 0 0 0 0.5 0 0 0 0 0 0 0 0 17:00-18:00 1 0 0 1 0 1 0 1 0 0 0 0 0 0 0 0 0 0 18:00-19:00 1 1 0 0 0 0 0 0 0 0 0 0 0 0 0 0 0 0 19:00-20:00 0 1 1 0 1 0 1 0 0 0 0 0 0 0 0 0 0 0 20:00-21.00 0 0 0 0 0 0 0 0 0.5 0.5 0 0 0 0 0 0 0 0 21:00-22:00 1 1 0 0 0 0 0 0 0 0 0 0 0 0 0 0 0 0 22:00-23:00 1 1 0 0 0 0 0 0 0 0 0 0 1 1 0 0 0 0 23:00-00:00 1 1 0 0 0 0 0 0 0 0 1 1 0 0 0 0 0 0

269
APPENDIX NN
PRODUCTION UNITS PER MASON ACCORDING TO BLOCK WEIGHT
Table 86 Production Units Per Mason According to Block Weight
Estimated production rates based on CMU weight. Reprinted with NCMA
permission from Kolkoski, R.V., Masonry Estimating. Craftsman Book Company,
1988. Information is supported in NCMA TEK Note 4-1A: Productivity and
Modular Coordination in Concrete Masonry Construction (2002), which states
“concrete masonry unit weight greatly impacts masonry productivity, with lighter
weight units resulting in higher productivity rates (other factors being equal).

270

271
APPENDIX OO
TYPE OF CONCRETE BLOCKS, DIMENSIONS, PRICES AND
PRODUCTION DAYS IN TURKISH LIRAS
Table 87 Type of Concrete Blocks, Dimensions, Prices and Production Days in
Turkish Liras
Type of Block of
Concrete Blocks
Dimensions
(W x D x L) / cm
Weight /
kg
Cost /
TL
Production /
Days
13.50 cm Brick 13.50 x20 x 20 3.24 0.20 190.0
8.5 cm Brick 8.50 x 20 x 20 2.21 0.15 200.0
Aerated Autoclaved 20 x 25 x 60 12.000 16.250 160.0
Aerated Autoclaved 10 x 25 x 60 6.000 8.125 180.0
Heavy Weight 20 x 20 x 40 15.558 2.576 140.0
Heavy Weight 10 x 20 x 40 11.022 1.133 162.0
Light Weight 20 x 20 x 40 11.476 3.980 161.5
Light Weight 10 x 20 x 40 7.711 1.750 175.0

272

273
APPENDIX PP
SKILLED TECHNICAL STAFF (MASONS) AVERAGE MONTHLY PAY
Table 88 Skilled Technical Staff (Masons) Average Monthly Pay
Position Average Monthly Pay (mean)
SKILLED TECHNICAL STAFF 1,576 TL

274

275
APPENDIX QQ
THE MASONS SALARY FOR THE CONSTRUCTION OF THE BUILDING
ENVELOPE FOR ONE FLOOR INCLUDING FLATS-1, FLAT-2 AND
FLAT-3
Table 89 The Masons Salary For the Construction of the Building Envelope for One
Floor Including Flats 1, 2 and 3
Type of
Block of
Concrete
Blocks
Dimensions
(W x D x L)
/ m
Produc
-tion Ratio
days
/ days
No.
of
Mas
-ons
Constrc
-tion
Period
/ month
Block
Layers
In wall
Masons
Salary
/ TL
Total
Salary
/ TL
13.5 cm
Brick
0.135 x 0.20
x 0.20
180 / 190
=
0.947
2 2 1 1,576x2x2
x1x0.947
5,972
8.5 cm
Brick
0.085 x 0.20
x 0.20
180 / 200
=
0.900
2 2 1 1,576x2x2
x1x0.900
5,674
Aerated
Autoclaved
0.20 x 0.25
x 0.60
180 / 160
=
1.125
2 2 1 1,576x2x2
x1x1.125
7,092
Aerated
Autoclaved
0.10 x 0.25
x 0.60
180 / 180
=
1.000
2 2 2 1.576x2x2
x2x1.000
12,608
Heavy
Weight
0.20 x 0.20
x 0.40
180 / 162
=
1.111
2 2 1 1,576x2x2
x1x1.286
8,108
Heavy
Weight
0.10 x 0.20
x 0.40 180 / 140
=
1.286
2 2 2 1.576x2x2
x2x1.111
14,010
Light Weight
0.20 x 0.20
x 0.40 180 / 175
=
1.029
2 2 1 1,576x2x2
x1x1.115
7,026
Light Weight
0.10 x 0.20
x 0.40 180 / 161.5
=
1.115
2 2 2 1.576x2x2
x2x1.029
12,968
Since the building which has a ground and three floors is constructed in two years,
each floor is built and finished in six month or 180 days. This period is taken as the
standard production period. From APPENDIX NN and APPENDIX OO the
production units per mason according to block weight, dimension and cost are
documented. Since there are three flats in one floor and since the exterior envelope of

276
one floor is constructed in six month by two masons, the exterior envelope of each of
the three flats is therefore constructed in two month by two masons. From these two
month by two masons and the block layers the masons total salary could be
calculated as shown in APPENDIX QQ.

277
APPENDIX RR
COMPARING ENERGY CONSUMPTIONS THROUGH GLAZING UNITS
IN THE INVESTIGATED FLATS
The glazing units in the studied flats have different orientations and so it cannot be
concluded that each glazing unit has the same linear proportionality in terms of total
energy consumption.
Table 90 The energy consumption through the glazing units in the flat-1.
Flat-1 (103.5632 m2)
Double Glazing
Units
Total
Glazing Area
-m2
Yearly Total Energy
Consumption-
kWh
Net Energy Consumption
For Glazing Area of 1 m2-
kWh
Isicam Klasik
14.66
4134.40 282.02
Isicam Sinerji 3041.99 207.50
Isicam Sinerji 3+ 1757.53 119.89
Table 91 The energy consumption through the glazing units in the flat-2.
Flat-2 (105.2381 m2)
Double Glazing
Units
Total
Glazing Area
-m2
Yearly Total Energy
Consumption-
kWh
Net Energy Consumption
For Glazing Area of 1 m2-
kWh
Isicam Klasik
14.66
4731.55 322.75
Isicam Sinerji 3482.47 237.55
Isicam Sinerji 3+ 2014.05 137.38
Table 92 The energy consumption through the glazing units in the flat-3.
Flat-1 (107.0125m2)
Double Glazing
Units
Total
Glazing Area
-m2
Yearly Total Energy
Consumption-
kWh
Net Energy Consumption
For Glazing Area of 1 m2-
kWh
Isicam Klasik
14.43
3552.30 246.17
Isicam Sinerji 3552.30 246.17
Isicam Sinerji 3+ 3552.30 246.17

278

279
APPENDIX SS
COMPARING ENERGY CONSUMPTIONS THROUGH THE WALL
SECTIONS IN THE INVESTIGATED FLATS
Table 93 The energy consumption through the Wall Sections in the Flat-1.
Flat-1 (103.5632 m2)
Wall Sections of
Flat-1
Total Exterior
Wall Area
-m2
Yearly Total Energy
Consumption-
kWh
Net Energy Consumption
For Glazing Area of 1 m2-
kWh
Base Case
31.015
4698.61 151.49
1A 4950.15 159.61
1B 4503.75 145.21
1C 4509.15 145.39
1D 4517.81 145.67
2A 7770.12 250.53
2B 5018.61 161.81
2C 5013.98 161.66
2D 5031.04 162.21
3A 5501.98 177.40
3B 4693.17 151.32
3C 4688.88 151.18
3D 4694.81 151.37

280
Table 94 The energy consumption through the Wall Sections in the Flat-2.
Flat-2 (105.2381 m2)
Wall Sections of
Flat-2
Total Exterior
Wall Area
-m2
Yearly Total Energy
Consumption-
kWh
Net Energy Consumption
For Glazing Area of 1 m2-
kWh
Base Case
31.015
3817.97 123.10
1A 4098.68 132.15
1B 3620.56 116.74
1C 3625.15 116.88
1D 3636.33 117.24
2A 7178.76 231.46
2B 4168.56 134.40
2C 4167.16 134.36
2D 4186.24 134.97
1A 4693.57 151.33
1B 3819.41 123.15
1C 3816.02 123.04
1D 3822.80 123.26
Table 95 The energy consumption through the Wall Sections in the Flat-3.
Flat-1 (107.0125m2)
Wall Sections of
Flat-3
Total Exterior
Wall Area
-m2
Yearly Total Energy
Consumption-
kWh
Net Energy Consumption
For Glazing Area of 1 m2-
kWh
Base Case
44.685
5723.88 128.09
1A 6056.20 135.53
1B 5493.01 122.93
1C 5500.59 123.10
1D 5511.49 123.34
2A 9638.08 215.69
2B 6141.85 137.45
2C 6139.07 137.39
2D 6157.28 137.79
3A 6751.76 151.10
3B 5730.18 128.23
3C 5726.39 128.15
3D 5733.31 128.31

281
APPENDIX TT
PERCENTAGES (%) OF HEAT GAINS AND LOSSES THROUGH THE
GLAZING ALTERNATIVES IN FLAT-1, FLAT-2 AND FLAT-3
Heat losses occur through glazings, walls, floors, roofs, doors and ventilation,
external infiltration, and external ventilation, while heat gains occur through general
lighting, miscellaneous systems, occupancy, domestic hot water, heat generation,
solar gains from exterior windows, lighting, and chillers in building.
Table 96 The heat losses (kWh) through the three window options in Flat-1 obtained
from the simulation results according to windows types.
Heat Losses – kWh (Flat-1)
Glazing Walls Floors Door and
Ventilation
External
Infiltration
External
Ventilation
Isicam Klasik 612 396 360 216 1404 6026.4
Isicam Sinerji 381.6 396 360 216 1404 6026.4
Isicam Sinerji 3+ 223.2 396 360 216 1404 6026.4
Table 97 The heat losses (kWh) through the three window options in Flat-2 obtained
from the simulation results according to windows types.
Heat Losses – kWh (Flat-2)
Glazing Walls Floors Door and
Ventilation
External
Infiltration
External
Ventilation
Isicam Klasik 676.8 396 367.2 129.6 1461.6 6271.2
Isicam Sinerji 417.6 396 367.2 129.6 1461.6 6271.2
Isicam Sinerji 3+ 244.8 396 374.4 129.6 1461.6 6271.2

282
Table 98 The heat losses (kWh) through the three window options in Flat-3 obtained
from the simulation results according to windows types.
Heat Losses – kWh (Flat-3)
Glazing Walls Floors Door and
Ventilation
External
Infiltration
External
Ventilation
Isicam Klasik 698.4 446.4 1281.6 93.6 1490.4 6393.6
Isicam Sinerji 698.4 446.4 1281.6 93.6 1490.4 6393.6
Isicam Sinerji 3+ 698.4 446.4 1281.6 93.6 1490.4 6393.6
Table 99 The heat gains (kWh) through the three window options in Flat-1 obtained
from the simulation results according to windows types.
Heat Gains – kWh (Flat-1)
General
Lighting Occup-
ancy Solar
Gain
Exterior
Windows
DHW
(Natural
Gas)
Room
Electri-
city
System
Misc. Heat
Genera-
tion
Computer
And
Equipment
Isicam
Klasik 1159.91 551.93 4134.40 10.42 419.53 291.24 7188.11 317.74
Isicam
Sinerji 1159.91 554.15 3041.99 10.42 419.53 291.24 6683.29 317.74
Isicam
Sinerji
3+
1159.91 556.83 1757.53 10.42 419.53 291.24 6458.25 317.74
Table 100 The heat gains (kWh) through the three window options in Flat-2 obtained
from the simulation results according to windows types.
Heat Gains – kWh (Flat-2)
General
Lighting Occup-
ancy Solar
Gain
Exterior
Windows
DHW
(Natural
Gas)
Room
Electri-
city
System
Misc. Heat
Genera-
tion
Computer
And
Equipment
Isicam
Klasik 1567.90 1971.32 4731.55 50.23 417.84 302.99 5873.80 312.48
Isicam
Sinerji 1567.90 1943.32 3482.47 50.23 417.84 302.99 4912.40 312.48
Isicam
Sinerji
3+
1567.90 1978.72 2014.05 50.23 417.84 302.99 5026.69 312.48

283
Table 101 The heat gains (kWh) through the three window options in Flat-3 obtained
from the simulation results according to windows types.
Heat Gains – kWh (Flat-3)
General
Lighting Occup-
ancy Solar
Gain
Exterior
Windows
DHW
(Natural
Gas)
Room
Electri-
city
System
Misc. Heat
Genera-
tion
Computer
And
Equipment
Isicam
Klasik 1859.10 3052.23 3552.30 59.44 616.45 309.13 8805.98 474.76
Isicam
Sinerji 1859.10 3052.23 3552.30 59.44 616.45 309.13 8805.98 474.76
Isicam
Sinerji
3+
1859.10 3052.23 3552.30 59.44 616.45 309.13 8805.98 474.76

284

285
APPENDIX UU
PERCENTAGES (%) OF HEAT GAINS AND LOSSES THROUGH THE
WALL SECTIONS IN FLAT-1, FLAT-2 AND FLAT-3
Heat losses occur through glazings, walls, floors, roofs, doors and ventilation,
external infiltration, and external ventilation, while heat gains occur through general
lighting, miscellaneous systems, occupancy, domestic hot water, heat generation,
solar gains from exterior windows, lighting, and chillers in building.
Table 102 The heat losses (kWh) through the wall sections of Flat-1
Heat Losses – kWh (Flat-1)
Glazing Walls Floors Door and
Ventilation External
Infiltration External
Ventilation
Sect. Base 612 396 360 216 1404 6026.4
Section1A 612 518.4 352.8 216 1404 6026.4
Section1B 612 316.8 360 216 1404 6026.4
Section1C 612 324 360 216 1404 6026.4
Section1D 612 316.8 360 216 1404 6026.4
Section2A 597.6 1886.4 331.2 208.8 1404 6026.4
Section2B 612 547.2 352.8 216 1404 6026.4
Section2C 612 547.2 352.8 216 1404 6026.4
Section2D 612 547.2 352.8 216 1404 6026.4
Section3A 604.8 756 352.8 216 1404 6026.4
Section3B 612 396 360 216 1404 6026.4
Section3C 612 396 360 216 1404 6026.4
Section3D 612 396 360 216 1404 6026.4

286
Table 103 The heat losses (kWh) through the wall sections of Flat-2
Heat Losses – kWh (Flat-2)
Glazing Walls Floors Door and
Ventilation External
Infiltration External
Ventilation
Sect. Base 676.8 396 367.2 129.6 1461.6 6271.2
Section1A 669.6 532.8 367.2 129.6 1461.6 6271.2
Section1B 676.8 316.8 367.2 129.6 1461.6 6271.2
Section1C 676.8 316.8 367.2 129.6 1461.6 6271.2
Section1D 676.8 316.8 367.2 129.6 1461.6 6271.2
Section2A 655.2 2044.8 338.4 122.4 1461.6 6271.2
Section2B 669.6 561.6 367.2 129.6 1461.6 6271.2
Section2C 669.6 561.6 367.2 129.6 1461.6 6271.2
Section2D 669.6 561.6 367.2 129.6 1461.6 6271.2
Section3A 669.6 7992 360 129.6 1461.6 6271.2
Section3B 676.8 396 367.2 129.6 1461.6 6271.2
Section3C 676.8 396 367.2 129.6 1461.6 6271.2
Section3D 676.8 396 367.2 129.6 1461.6 6271.2
Table 104 The heat losses (kWh) through the wall sections of Flat-3
Heat Losses – kWh (Flat-3)
Glazing Walls Floors Door and
Ventilation External
Infiltration External
Ventilation
Sect. Base 698.4 446.4 1281.6 93.6 1490.4 6393.6
Section1A 691.2 597.6 1274.4 93.6 1490.4 6393.6
Section1B 698.4 352.8 1288.8 93.6 1490.4 6393.6
Section1C 698.4 352.8 1288.8 93.6 1490.4 6393.6
Section1D 698.4 352.8 1288.8 93.6 1490.4 6393.6
Section2A 676.8 2318.4 1209.6 86.4 1490.4 6393.6
Section2B 691.2 633.6 1274.4 93.6 1490.4 6393.6
Section2C 691.2 640.8 1274.4 93.6 1490.4 6393.6
Section2D 691.2 640.8 1274.4 93.6 1490.4 6393.6
Section3A 691.2 900 1260 93.6 1490.4 6393.6
Section3B 698.4 446.4 1281.6 93.6 1490.4 6393.6
Section3C 698.4 446.4 1281.6 93.6 1490.4 6393.6
Section3D 698.4 446.4 1281.6 93.6 1490.4 6393.6

287
Table 105 The heat gains (kWh) through the wall sections in Flat-1
Heat Gains – kWh (Flat-1)
General
Lighting
Occup-
ancy
Solar
Gain
Exterior
Windows
DHW
(Natural
Gas)
Room
Electri-
city
System
Misc.
Heat
Genera-
tion
Computer
And
Equipment
Sect. Base 1159.91 552.26 4134.40 10.42 360.23 291.24 7228.63 317.74
Section1A 1159.91 554.95 4134.40 10.42 360.23 291.24 7615.62 317.74
Section1B 1159.91 551.64 4134.40 10.42 360.23 291.24 6928.84 317.74
Section1C 1159.91 551.46 4134.40 10.42 360.23 291.24 6937.15 317.74
Section1D 1159.91 550.58 4134.40 10.42 360.23 291.24 6950.47 317.74
Section2A 1159.91 569.69 4134.40 10.42 360.23 291.24 11954.03 317.74
Section2B 1159.91 556.27 4134.40 10.42 360.23 291.24 7720.94 317.74
Section2C 1159.91 555.56 4134.40 10.42 360.23 291.24 7713.81 317.74
Section2D 1159.91 554.21 4134.40 10.42 360.23 291.24 7740.06 317.74
Section3A 1159.91 557.87 4134.40 10.42 360.23 291.24 8464.59 317.74
Section3B 1159.91 552.52 4134.40 10.42 360.23 291.24 7220.26 317.74
Section3C 1159.91 552.26 4134.40 10.42 360.23 291.24 7213.66 317.74
Section3D 1159.91 551.78 4134.40 10.42 360.23 291.24 7222.79 317.74
Table 106 The heat gains (kWh) through the wall sections in Flat-2
Heat Gains – kWh (Flat-2)
General
Lighting
Occup-
ancy
Solar
Gain
Exterior
Windows
DHW
(Natural
Gas)
Room
Electri-
city
System
Misc.
Heat
Genera-
tion
Computer
And
Equipment
Sect. Base 1567.90 1967.32 4731.55 50.23 417.84 302.99 5873.80 312.48
Section1A 1567.90 1976.22 4731.55 50.23 417.84 302.99 6305.66 312.48
Section1B 1567.90 1963.12 4731.55 50.23 417.84 302.99 5570.10 312.48
Section1C 1567.90 1962.65 4731.55 50.23 417.84 302.99 5577.16 312.48
Section1D 1567.90 1960.08 4731.55 50.23 417.84 302.99 5594.36 312.48
Section2A 1567.90 2039.85 4731.55 50.23 417.84 302.99 11044.3 312.48
Section2B 1567.90 1980.44 4731.55 50.23 417.84 302.99 6413.17 312.48
Section2C 1567.90 1978.85 4731.55 50.23 417.84 302.99 6411.01 312.48
Section2D 1567.90 1974.91 4731.55 50.23 417.84 302.99 6440.37 312.48
Section3A 1567.90 1989.70 4731.55 50.23 417.84 302.99 7220.88 312.48
Section3B 1567.90 1967.18 4731.55 50.23 417.84 302.99 5876.02 312.48
Section3C 1567.90 1966.57 4731.55 50.23 417.84 302.99 5870.80 312.48
Section3D 1567.90 1964.54 4731.55 50.23 417.84 302.99 5881.23 312.48

288
Table 107 The heat gains (kWh) through the wall sections in Flat-3
Heat Gains – kWh (Flat-3)
General
Lighting
Occup-
ancy
Solar
Gain
Exterior
Windows
DHW
(Natural
Gas)
Room
Electri-
city
System
Misc.
Heat
Genera-
tion
Computer
And
Equipment
Sect. Base 1859.10 3052.23 3552.30 59.44 616.45 309.13 8805.98 474.76
Section1A 1859.10 3064.62 3552.30 59.44 616.45 309.13 9317.23 474.76
Section1B 1859.10 3046.86 3552.30 59.44 616.45 309.13 8450.78 474.76
Section1C 1859.10 3046.08 3552.30 59.44 616.45 309.13 8462.44 474.76
Section1D 1859.10 3042.30 3552.30 59.44 616.45 309.13 8479.22 474.76
Section2A 1859.10 3147.46 3552.30 59.44 616.45 309.13 14827.8 474.76
Section2B 1859.10 3069.67 3552.30 59.44 616.45 309.13 9448.99 474.76
Section2C 1859.10 3067.77 3552.30 59.44 616.45 309.13 9444.73 474.76
Section2D 1859.10 3062.72 3552.30 59.44 616.45 309.13 9472.74 474.76
Section3A 1859.10 3083.52 3552.30 59.44 616.45 309.13 10387.3 474.76
Section3B 1859.10 3052.48 3552.30 59.44 616.45 309.13 8815.66 474.76
Section3C 1859.10 3051.76 3552.30 59.44 616.45 309.13 8809.53 474.76
Section3D 1859.10 3049.26 3552.30 59.44 616.45 309.13 8820.48 474.76

289
APPENDIX VV
MONTHLY HEAT GAINS TRANSMITTED THROUGH THE THREE
GLAZING ALTERNATIVES IN FLAT-1, FLAT-2 AND FLAT-3
Table 108 The Monthly Heat Gains Transmitted Through the Three Glazing
Alternatives in Flat-1
Flat1 J F M A M J J A S O N D Tot
ALT1
240.7
321.0
309.0
348.6
381.4
402.0
448.4
462.7
458.9
349.9
251.7
160.0
4134.4
ALT2
177.8
236.6
227.1
256.3
280.7
296.0
329.9
339.7
336.5
257.3
185.8
118.3
3042.0
ALT3 104.2
137.9
130.8
147.7
161.9
171.4
190.2
194.5
192.4
148.8
108.7
69.2
1757.5
Table 109 The Monthly Heat Gains Transmitted Through the Three Glazing
Alternatives in Flat-2
Flat2 J F M A M J J A S O N D Tot
ALT1 245.5
339.9
343.3
393.8
460.5
499.1
556.5
543.4
526.9
379.0
276.4
167.2
4731.6
ALT2 181.4
250.5
252.4
289.7
339.1
367.7
409.7
399.2
386.7
278.7
203.9
123.5
3482.5
ALT3 106.3
145.9
145.5
167.2
196.1
213.2
236.8
228.9
221.6
161.2
119.1
72.4
2014.1
Table 110 The Monthly Heat Gains Transmitted Through the Three Glazing
Alternatives in Flat-3
Flat3 J F M A M J J A S O N D Tot
ALT1 137.1
187.7
272.5
338.3
415.3
453.9
479.3
423.9
342.8
243.5
150.4
107.7
3552.3
ALT2
137.1
187.7
272.5
338.3
415.3
453.9
479.3
423.9
342.8
243.5
150.4
107.7
3552.3
ALT3
137.1
187.7
272.5
338.3
415.3
453.9
479.3
423.9
342.8
243.5
150.4
107.7
3552.3

290

291
APPENDIX WW
MONTHLY HEAT LOAD PRODUCTION OF THE HEATING SYSTEM IN
FLAT-1, FLAT-2 AND FLAT-3 IN KWH
Table 111 The Monthly Heat Load Production of The Heating System in Flat-1
Flat1 J F M A M J J A S O N D Tot
Base
1219
806
764
0
0
0
0
0
0
151
697
1061
4699
1A
1275
866
811
0
0
0
0
0
0
149
729
1121
4950
1B
1171
788
737
0
0
0
0
0
0
120
660
1029
4504
1C 1173
785
735
0
0
0
0
0
0
124
663
1029
4509
1D 1175
786
736
0
0
0
0
0
0
130
663
1028
4518
2A 1920
1363
1290
0
0
0
0
0
0
338
1170
1689
7770
2B 1293
877
823
0
0
0
0
0
0
149
743
1134
5019
2C 1291
872
820
0
0
0
0
0
0
155
743
1132
5014
2D
1294
871
821
0
0
0
0
0
0
167
745
1133
5031
3A
1405
950
900
0
0
0
0
0
0
200
820
1226
5502
3B
1217
809
764
0
0
0
0
0
0
147
695
1062
4693
3C
1216
806
763
0
0
0
0
0
0
148
694
1061
4689
3D
1217
807
764
0
0
0
0
0
0
151
695
1061
4695

292
Table 112 The Monthly Heat Load Production of The Heating System in Flat-2
Flat2 J F M A M J J A S O N D Tot
Base
1062
662
593
0
0
0
0
0
0
74
525
902
3818
1A
1128
724
641
0
0
0
0
0
0
77
563
966
4099
1B 1013
639
564
0
0
0
0
0
0
55
486
865
3621
1C 1015
636
562
0
0
0
0
0
0
58
490
865
3625
1D 1016
637
565
0
0
0
0
0
0
62
492
865
3636
2A 1850
1272
1163
0
0
0
0
0
0
248
1046
1601
7179
2B 1146
736
654
0
0
0
0
0
0
76
576
981
4169
2C
1145
731
652
0
0
0
0
0
0
82
577
979
4167
2D
1147
730
654
0
0
0
0
0
0
93
581
980
4186
3A
1271
816
739
0
0
0
0
0
0
121
662
1084
4694
3B
1062
661
593
0
0
0
0
0
0
75
526
902
3819
3C
1062
659
592
0
0
0
0
0
0
76
526
901
3816
3D
1061
661
594
0
0
0
0
0
0
79
527
902
3823
Table 113 The Monthly Heat Load Production of The Heating System in Flat-3
Flat3 J F M A M J J A S O N D Tot
Base 1501
1056
894
0
0
0
0
0
0
196
851
1227
5724
1A 1578
1130
953
0
0
0
0
0
0
200
894
1302
6057
1B 1445
1029
863
0
0
0
0
0
0
163
807
1187
5493
1C 1448
1026
861
0
0
0
0
0
0
168
810
1187
5501
1D
1449
1026
862
0
0
0
0
0
0
176
811
1187
5511
2A
2398
1772
1550
0
0
0
0
0
0
447
1457
2014
9638
2B
1600
1143
969
0
0
0
0
0
0
200
911
1319
6142
2C
1599
1139
965
0
0
0
0
0
0
209
912
1316
6139
2D
1600
1137
965
0
0
0
0
0
0
223
916
1316
6157
3A
1740
1238
1063
0
0
0
0
0
0
265
1012
1433
6752
3B
1502
1056
895
0
0
0
0
0
0
197
852
1228
5730
3C
1502
1054
894
0
0
0
0
0
0
199
852
1226
5726
3D
1502
1055
895
0
0
0
0
0
0
202
853
1227
5733

293
APPENDIX XX
PERCENTAGE HEAT LOSSES AND HEAT GAINS FOR THE GLAZING
WINDOWS AND HEAT LOSSES THROUGH ALL WALL SECTIONS FOR
FLAT-1, FLAT-2 AND FLAT-3
Figure 57 Heat losses (%) through the three window glazing options in flat-1
obtained from the simulation results
7% 4%
4% 2%
16%
67%
FLAT-1-ISICAM KLASIK GLAZING
WALLS
FLOORS EXTERNAL
DOORS AND VENTS
EXTERNAL INFILTRATION
EXTERNAL VENTILATION
4% 5% 4%
2%
16%
69%
FLAT-1-ISICAM SINERJI GLAZING
WALLS
FLOORS EXTERNAL
DOORS AND VENTS
EXTERNAL INFILTRATION
EXTERNAL VENTILATION
3% 5% 4%
2%
16%
70%
FLAT-1-ISICAM SINERJI 3+ GLAZING
WALLS
FLOORS EXTERNAL
DOORS AND VENTS
EXTERNAL INFILTRATION
EXTERNAL VENTILATION

294
Figure 58 Heat losses (%) through the three window glazing options in flat-2
obtained from the simulation results
7% 4% 4%
1%
16%
68%
FLAT-2-ISICAM KLASIK GLAZING
WALLS
FLOORS EXTERNAL
DOORS AND VENTS
EXTERNAL INFILTRATION
EXTERNAL VENTILATION
5% 4%
4% 2%
16%
69%
FLAT-2-ISICAM SINERJI
GLAZING
WALLS
FLOORS EXTERNAL
DOORS AND VENTS
EXTERNAL INFILTRATION
EXTERNAL VENTILATION
3% 4% 4% 1%
17%
71%
FLAT-2-ISICAM SINERJI 3+
GLAZING
WALLS
FLOORS EXTERNAL
DOORS AND VENTS
EXTERNAL INFILTRATION
EXTERNAL VENTILATION

295
Figure 59 Heat losses (%) through the three window glazing options in flat-3
obtained from the simulation results
7% 4%
12% 1%
14% 62%
FLAT-3-ISICAM KLASIK
GLAZING
WALLS
FLOORS EXTERNAL
DOORS AND VENTS
EXTERNAL INFILTRATION
EXTERNAL VENTILATION
7% 4%
12%
1%
14% 62%
FLAT-3-ISICAM SINERJI
GLAZING
WALLS
FLOORS EXTERNAL
DOORS AND VENTS
EXTERNAL INFILTRATION
EXTERNAL VENTILATION
7% 4%
12%
1%
14% 62%
FLAT-3-ISICAM SINERJI 3+
GLAZING
WALLS
FLOORS EXTERNAL
DOORS AND VENTS
EXTERNAL INFILTRATION
EXTERNAL VENTILATION
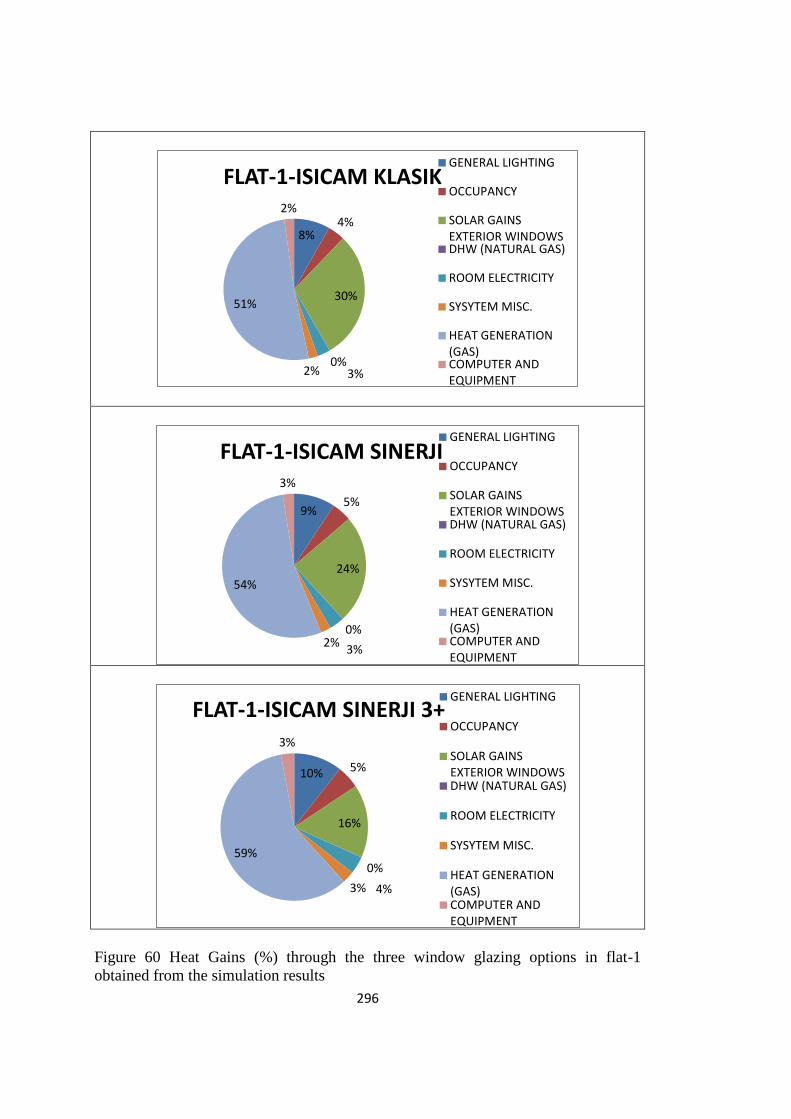
296
Figure 60 Heat Gains (%) through the three window glazing options in flat-1
obtained from the simulation results
8% 4%
30%
0% 3% 2%
51%
2%
FLAT-1-ISICAM KLASIK GENERAL LIGHTING
OCCUPANCY
SOLAR GAINSEXTERIOR WINDOWSDHW (NATURAL GAS)
ROOM ELECTRICITY
SYSYTEM MISC.
HEAT GENERATION(GAS)COMPUTER ANDEQUIPMENT
9% 5%
24%
0%
3% 2%
54%
3%
FLAT-1-ISICAM SINERJI GENERAL LIGHTING
OCCUPANCY
SOLAR GAINSEXTERIOR WINDOWSDHW (NATURAL GAS)
ROOM ELECTRICITY
SYSYTEM MISC.
HEAT GENERATION(GAS)COMPUTER ANDEQUIPMENT
10% 5%
16%
0%
4% 3%
59%
3%
FLAT-1-ISICAM SINERJI 3+ GENERAL LIGHTING
OCCUPANCY
SOLAR GAINSEXTERIOR WINDOWSDHW (NATURAL GAS)
ROOM ELECTRICITY
SYSYTEM MISC.
HEAT GENERATION(GAS)COMPUTER ANDEQUIPMENT

297
Figure 61 Heat Gains (%) through the three window glazing options in flat-2
obtained from the simulation results
10%
13%
31%
0% 3% 2%
39%
2%
FLAT-2-ISICAM KLASIK GENERAL LIGHTING
OCCUPANCY
SOLAR GAINS EXTERIORWINDOWSDHW (NATURAL GAS)
ROOM ELECTRICITY
SYSYTEM MISC.
HEAT GENERATION (GAS)
COMPUTER ANDEQUIPMENT
12%
15%
27%
0% 3% 2%
38%
3%
FLAT-2-ISICAM SINERJI GENERAL LIGHTING
OCCUPANCY
SOLAR GAINS EXTERIORWINDOWSDHW (NATURAL GAS)
ROOM ELECTRICITY
SYSYTEM MISC.
HEAT GENERATION (GAS)
COMPUTER ANDEQUIPMENT
13%
17%
17%
0% 4% 3%
43%
3%
FLAT-2-ISICAM SINERJI 3+ GENERAL LIGHTING
OCCUPANCY
SOLAR GAINS EXTERIORWINDOWSDHW (NATURAL GAS)
ROOM ELECTRICITY
SYSYTEM MISC.
HEAT GENERATION (GAS)
COMPUTER ANDEQUIPMENT

298
Figure 62 Heat Gains (%) through the three window glazing options in flat-3
obtained from the simulation results
11%
17%
20%
0% 3% 2%
44%
3%
FLAT-3-ISICAM KLASIK GENERAL LIGHTING
OCCUPANCY
SOLAR GAINS EXTERIORWINDOWSDHW (NATURAL GAS)
ROOM ELECTRICITY
SYSYTEM MISC.
HEAT GENERATION (GAS)
COMPUTER ANDEQUIPMENT
11%
17%
20%
0% 3% 2%
44%
3%
FLAT-3-ISICAM SINERJI GENERAL LIGHTING
OCCUPANCY
SOLAR GAINS EXTERIORWINDOWSDHW (NATURAL GAS)
ROOM ELECTRICITY
SYSYTEM MISC.
HEAT GENERATION (GAS)
11%
17%
20%
0% 3% 2%
44%
3%
FLAT-3-ISICAM SINERJI 3+ GENERAL LIGHTING
OCCUPANCY
SOLAR GAINS EXTERIORWINDOWSDHW (NATURAL GAS)
ROOM ELECTRICITY
SYSYTEM MISC.
HEAT GENERATION (GAS)
COMPUTER ANDEQUIPMENT

299
Figure 63 Heat losses (%) through the Wall Sections Base and 1A in flat-1 obtained
from the simulation results
7% 4%
4%
2%
16%
67%
FLAT-1-BASE CASE
GLAZING
WALLS
FLOORS EXTERNAL
DOORS AND VENTS
EXTERNAL INFILTRATION
EXTERNAL VENTILATION
7% 6%
4%
2%
15%
66%
FLAT-1-1A
GLAZING
WALLS
FLOORS EXTERNAL
DOORS AND VENTS
EXTERNAL INFILTRATION
EXTERNAL VENTILATION

300
Figure 64 Heat losses (%) through the Wall Sections 1B, 1C, 1D, 2A, 2B, 2C, 2D in
flat-1 obtained from the simulation results
7% 4% 4%
2%
16%
67%
FLAT-1-1B, 1C, and 1D GLAZING
WALLS
FLOORS EXTERNAL
DOORS AND VENTS
EXTERNAL INFILTRATION
EXTERNAL VENTILATION
6%
18%
3%
2% 13%
58%
FLAT-1-2A GLAZING
WALLS
FLOORS EXTERNAL
DOORS AND VENTS
EXTERNAL INFILTRATION
EXTERNAL VENTILATION
7% 6%
4%
2%
15%
66%
FLAT-1-2B, 2C, AND 2D GLAZING
WALLS
FLOORS EXTERNAL
DOORS AND VENTS
EXTERNAL INFILTRATION
EXTERNAL VENTILATION

301
Figure 65 Heat losses (%) through the Wall Sections 3A, 3B, 3C and 3D in flat-1
obtained from the simulation results
7% 8% 4%
2%
15%
64%
FLAT-1-3A
GLAZING
WALLS
FLOORS EXTERNAL
DOORS AND VENTS
EXTERNAL INFILTRATION
EXTERNAL VENTILATION
7% 4%
4%
2%
16%
67%
FLAT-1-3B, 3C, AND 3D
GLAZING
WALLS
FLOORS EXTERNAL
DOORS AND VENTS
EXTERNAL INFILTRATION
EXTERNAL VENTILATION

302
Figure 66 Heat losses (%) through the Wall Sections Base and 1A in flat-2 obtained
from the simulation results
7% 4%
4%
1%
16%
68%
FLAT-2-BASE CASE
GLAZING
WALLS
FLOORS EXTERNAL
DOORS AND VENTS
EXTERNAL INFILTRATION
EXTERNAL VENTILATION
7% 6% 4%
1%
16%
66%
FLAT-2-1A
GLAZING
WALLS
FLOORS EXTERNAL
DOORS AND VENTS
EXTERNAL INFILTRATION
EXTERNAL VENTILATION

303
Figure 67 Heat losses (%) through the Wall Sections 1B, 1C, 1D, 2A, 2B, 2C, 2D in
flat-2 obtained from the simulation results
7% 4% 4%
1%
16%
68%
FLAT-2-1B, 1C, AND 1D
GLAZING
WALLS
FLOORS EXTERNAL
DOORS AND VENTS
EXTERNAL INFILTRATION
EXTERNAL VENTILATION
6%
19%
3%
1% 13%
58%
FLAT-2-2A
GLAZING
WALLS
FLOORS EXTERNAL
DOORS AND VENTS
EXTERNAL INFILTRATION
EXTERNAL VENTILATION
7% 6%
4%
1%
16%
66%
FLAT-2-2B, 2C, AND 2D
GLAZING
WALLS
FLOORS EXTERNAL
DOORS AND VENTS
EXTERNAL INFILTRATION
EXTERNAL VENTILATION

304
Figure 68 Heat losses (%) through the Wall Sections 3A, 3B, 3C and 3D in flat-2
obtained from the simulation results
7% 8% 4%
1%
15%
65%
FLAT-2-3A
GLAZING
WALLS
FLOORS EXTERNAL
DOORS AND VENTS
EXTERNAL INFILTRATION
EXTERNAL VENTILATION
7% 4%
4%
1%
16%
68%
FLAT-2-3B, 3C, AND 3D
GLAZING
WALLS
FLOORS EXTERNAL
DOORS AND VENTS
EXTERNAL INFILTRATION
EXTERNAL VENTILATION

305
Figure 69 Heat losses (%) through the Wall Sections Base and 1A in flat-3 obtained
from the simulation results
7% 4%
12%
1%
14% 62%
FLAT-3-BASE CASE
GLAZING
WALLS
FLOORS EXTERNAL
DOORS AND VENTS
EXTERNAL INFILTRATION
EXTERNAL VENTILATION
6% 6%
12%
1%
14% 61%
FLAT-3-1A
GLAZING
WALLS
FLOORS EXTERNAL
DOORS AND VENTS
EXTERNAL INFILTRATION
EXTERNAL VENTILATION

306
Figure 70 Heat losses (%) through the Wall Sections 1B, 1C, 1D, 2A, 2B, 2C, 2D in
flat-3 obtained from the simulation results
7% 3%
13%
1%
14% 62%
FLAT-3-1B, 1C, AND 1D
GLAZING
WALLS
FLOORS EXTERNAL
DOORS AND VENTS
EXTERNAL INFILTRATION
EXTERNAL VENTILATION
6%
19%
10%
1% 12%
52%
FLAT-3-2A
GLAZING
WALLS
FLOORS EXTERNAL
DOORS AND VENTS
EXTERNAL INFILTRATION
EXTERNAL VENTILATION
7% 6%
12%
1%
14% 60%
FLAT-3-2B, 2C, AND 2D
GLAZING
WALLS
FLOORS EXTERNAL
DOORS AND VENTS
EXTERNAL INFILTRATION
EXTERNAL VENTILATION

307
Figure 71 Heat losses (%) through the Wall Sections 3A, 3B, 3C and 3D in flat-3
obtained from the simulation results
6% 8%
12%
1%
14% 59%
FLAT-3-3A
GLAZING
WALLS
FLOORS EXTERNAL
DOORS AND VENTS
EXTERNAL INFILTRATION
EXTERNAL VENTILATION
7% 4%
12%
1%
14% 62%
FLAT-3-3B, 3C, AND 3D
GLAZING
WALLS
FLOORS EXTERNAL
DOORS AND VENTS
EXTERNAL INFILTRATION
EXTERNAL VENTILATION

308

309
APPENDIX YY
HOLLOW CMU CHARACTERISTICS
Table 114 The image, dimensions, density, weight, block per cube, fire ratings of a
number of available hollow concrete masonry units (http://www.superiorblockcorp.com),
Last Accessed 12 / 12 /2013)
Image Nominal
Size
(cm)
Actual
Size
(cm)
Density Weight
(lbs)
Block
Per
Cube
Fire
Rating
(hrs)
10x20x40
cm
Hollow
9.675 x
19.675 x
39.675
cm
125 23.64 144 1 hr
105
18.17
144
1 hr
90
16.41
144
1 hr
15x20x40
cm
Hollow
14.675 x
19.675
x
39.675
cm
125 30.57 96 1 hr
105
23.49
96
1 hr
90
21.22
96
1 hr
20x20x40
cm
Hollow
19.675 x
19.675 x
39.675
cm
125 41.45 72 2 hrs
105
31.85
72
2 hrs
90
28.77
72
2 hrs
30mins
25x20x40
cm
Hollow
24.675 x
19.675 x
39.675
cm
125 52.32 60 2 hrs
30mins
105
40.20
60
3 hrs
90
36.31
60
3 hrs
30x20x40
cm
Hollow
29.675 x
19.675 x
39.675
cm
125 63.19 42 3 hrs
105
48.55
42
3 hrs
30mins
90
43.86
42
4 hrs

310

311
APPENDIX ZZ
SAMPLE CALCULATIONS
Sample Calculation -1
From table 12 the glazing cost and fixing cost of ISICAM SINERJI 3+ found in the
market = 335 TL + KDV / m2
Therefore the Initial Investment is equal to:
From table 19 The Total Window Glazing Area in m2 = 14.66 m2
X From table 12 The ISICAM SINERJI 3+ Glazing Cost = 335 TL
= Initial investment = 4911 TL
Sample Calculation -2
From table 21 the cost of the Base Case Wall Section with its construction calculated
from the market for flat-1 equals:
From table 13 the total unit cost of brick (0.20x0.20x0.135) m per m2
= Total Area x Unit Cost/m2 TL
= 31.015 x 50.00 TL
= 1550.75 TL
+
From table 13 the total unit cost of brick (0.20x0.20x0.085) m per m2
= Total Area x Unit Cost/m2 TL
= 31.015 x 37.50 TL
= 1163.00 TL

312
+
From table 16 the total unit cost of Extruded polystyrene (XPS) per m2
= Total Area x Unit Cost/m2 TL
= 31.015 x 13.50 TL
= 418.70 TL
+
From table 16 the total unit cost of Extruded polystyrene (XPS) per m2
= Total Area x Unit Cost/m2 TL
= 31.015 x 7.85 TL
= 243.47 TL
+
From Appendix QQ the total Mason Salary for Brick (0.20x0.20x0.135) m
including insulation in TL
= 5,972 TL
+
From Appendix QQ the total Mason Salary for Brick (0.20x0.20x0.085) m
including insulation in TL
= 5,674 TL
____________________________________________________________________
= Initial investment = 15,022 TL
Sample Calculation -3
The operation cost is calculated using a multiplication of the total yearly energy
expenditure calculated from the simulation by the cost of natural gas per kWh which
is the main energy heating supply. For the city of Ankara and according to table 11
this natural gas price equals:
= 0.08686175 TL / kWh
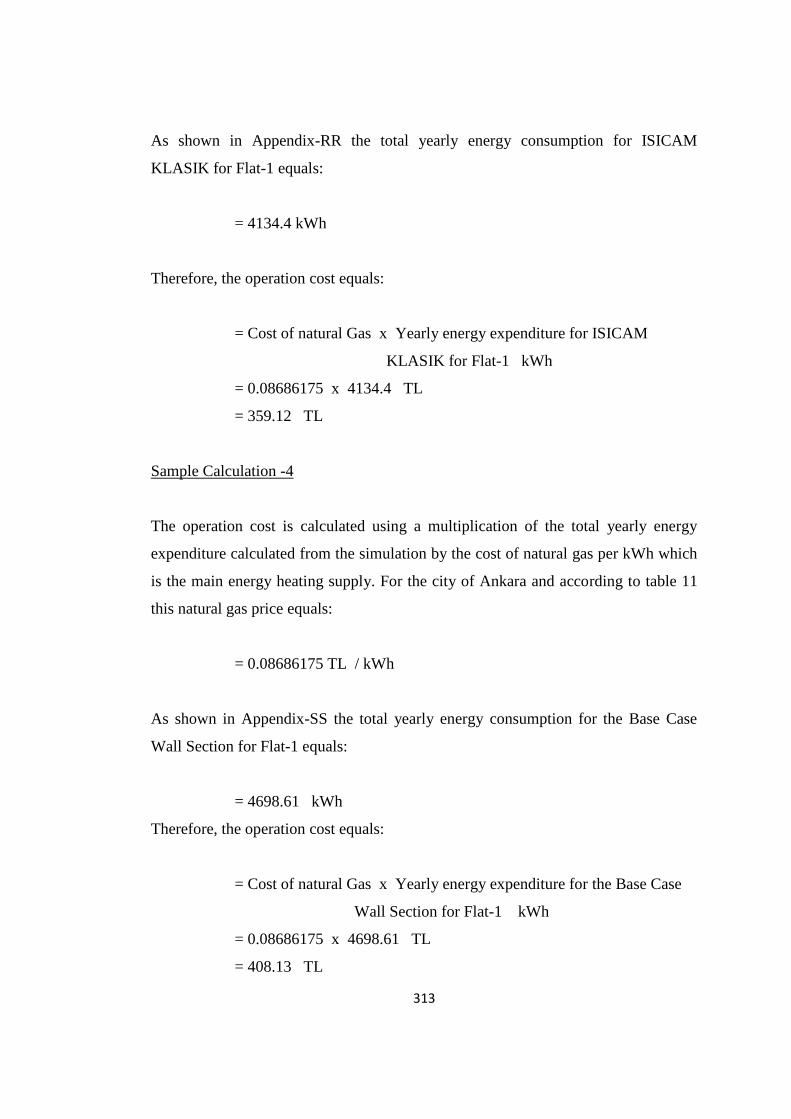
313
As shown in Appendix-RR the total yearly energy consumption for ISICAM
KLASIK for Flat-1 equals:
= 4134.4 kWh
Therefore, the operation cost equals:
= Cost of natural Gas x Yearly energy expenditure for ISICAM
KLASIK for Flat-1 kWh
= 0.08686175 x 4134.4 TL
= 359.12 TL
Sample Calculation -4
The operation cost is calculated using a multiplication of the total yearly energy
expenditure calculated from the simulation by the cost of natural gas per kWh which
is the main energy heating supply. For the city of Ankara and according to table 11
this natural gas price equals:
= 0.08686175 TL / kWh
As shown in Appendix-SS the total yearly energy consumption for the Base Case
Wall Section for Flat-1 equals:
= 4698.61 kWh
Therefore, the operation cost equals:
= Cost of natural Gas x Yearly energy expenditure for the Base Case
Wall Section for Flat-1 kWh
= 0.08686175 x 4698.61 TL
= 408.13 TL

314
Sample Calculation -5
Since there no owning, operating, maintaining, repairing, replacing and disposing of
a building or a building system over a period of time considered, only the sum of the
Initial Investment Cost and Operation Cost is included.
As seen from table 24 the initial investment and operation total cost of ISICAM
KLASIK glazing for Flat-1 equals:
Initial Investment Cost = 3299 TL
+ Operation Cost x 30 = 359.12 x 30 = 10,774 TL
_________________________________________________________________
Initial Investment + Operation Costs = 14,073 TL
Sample Calculation -6
Since there no owning, operating, maintaining, repairing, replacing and disposing of
a building or a building system over a period of time considered, only the sum of the
Initial Investment Cost and Operation Cost is included.
As seen from table 27 the initial investment and operation total cost of the Base Case
Wall Section for Flat-1 equals:
Initial Investment Cost = 15,022 TL
+ Operation Cost x 30 = 408.13 x 30 = 12,240 TL
_________________________________________________________________
Initial Investment + Operation Cost = 27,262 TL

315
APPENDIX AAA
ANKARA CLIMATE: 1) DRY BULB TEMPERATURE AND RELATIVE
HUMIDITY; 2) SUN SHADING CHART (DECEMBER 21st TO JUNE 21
st);
SUN SHADING CHART (JUNE 21st TO DECEMBER 21
st); WIND WHEEL
The dry bulb temperature and relative humidity for all the month of the year are
documented. It could be inferred from the graph that relative humidity during the
nights is higher than those values during the day. This is because the temperature is
high during the day and hot air absorbs water more than cold air as shown in figure
72. As could be inferred from the graph the dry bulb temperatures are below the
comfort level during the winter month and within the comfort limits during the
summer.
Figure 72 Dry Bulb Temperature and Relative Humidity Within Ankara According
to Climate Consultant

316
The sun shading chart recording from December 21st to June 21
st indicate the winter
months mostly. The blue color indicates temperatures less than 21˚C , the yellow
color indicates temperatures greater than 21˚C, while the red color indicates
temperatures greater than 24˚C. From figure 73 above the blue color occurs for the
months of December, January, February, March and April, while the yellow and red
color is common to the month of May and June. As could be inferred from the chart
the late morning, afternoon and evening hours display higher temperatures.
Figure 73 Sun Shading Chart (December 21st to June 21
st) Within Ankara According
to Climate Consultant
The sun shading chart recording June 21st to December 21
st indicate the summer
months mostly. The blue color indicates temperatures less than 21˚C, the yellow
color indicates temperatures greater than 21˚C, while the red color indicates
temperatures greater than 24˚C. From figure 42 below the yellow and red colors
occurs for the months of June, July, August and September while the blue color is
common to the month of October, November and December. As could be inferred

317
from the chart the late morning afternoon and evening hours display higher
temperatures as shown in figure 74.
Figure 74 Sun Shading Chart (June 21st to December 21
st) Within Ankara According
to Climate Consultant
As seen from the wind wheel chart much of the wind blows from north and north-
east direction as shown in figure 75.
Figure 75 Wind Wheel Within Ankara According to Climate Consultant

318

319
APPENDIX BBB
MONTHLY HEAT LOAD PRODUCTION BY THE HEATING SYSTEM
FOR ALL THE WALL SECTIONS IN THE INVESTIGATED FLAT-1,
FLAT-2 AND FLAT-3 (KWH)
Figure 76 Monthly heat load production by the heating system for all the Wall
Sections in the investigated flat-1 kWh.

320
Figure 77 Monthly total heat loads produced by all the Wall Sections in the
investigated flat-2 kWh.

321
Figure 78 Monthly total heat loads produced by all the Wall Sections in the
investigated flat-3 kWh.