Embed Size (px)
Citation preview
An Energy Transfer Protein in Coelenterate Bioluminescence CHARACTERIZATION OF THE RENILLA GREEN-FLUORESCENT PROTEIN*
(Received for publication, July 3, 1978)
William W. Ward+ and Milton J. Cormierg
From the Bioluminescence Laboratory, Department of Biochemistry, University of Georgia, Athens, Georgia 30602
Bioluminescence in the sea pansy, Renilla reniformis, a marine anthozoan coelenterate, is a complex process involving the participation of three proteins. These are: 1) the luciferin-binding protein, 2) the enzyme lucifer- ase, and 3) the green-fluorescent protein (GFP). Luci- ferin-binding protein is a specific substrate-binding protein which binds one molecule of coelenterate-type luciferin per molecule of protein and which then “re- leases” luciferin in the presence of Ca’+. Luciferase is the enzyme which catalyzes oxidation (by 02) of coelen- terate-type luciferin, leading to the production of COZ and enzyme-bound excited-state oxyluciferin. Oxyluci- ferin may then emit blue light by a direct de-excitation pathway or may transfer excitation energy to GFP. GFP is a noncatalytic accessory protein which accepts excitation energy from oxyluciferin, by radiationless energy transfer, and then emits green bioluminescence. In this paper the purification methods and physico- chemical characteristics of GFP from R. reniformis are presented, and in the companion article luciferin-bind- ing protein is described.
GFP was purified 12,000-fold to homogeneity from crude extracts of R. reniformis and characterized as a dimer of identical subunits held together by noncova- lent forces. A monomer molecular weight of 27,000 was determined.
GFP has an intense absorption band with a maximum at 498 nm and a molar extinction coefficient for the dimer of 270,000. The emission spectrum, which peaks at 509 nm, is a mirror image of the absorption (excita- tion) spectrum. Its fluorescence quantum yield of 80% results from the presence of a covalently bound chro- mophore of unknown chemical structure.
The addition of GFP (at 5 x 10e7 M) to an in vitro system containing luciferin and luciferase produces a shift in the spectral distribution of light emission from blue to green and increases the radiative quantum yield by a factor of 3.1. This in vitro energy transfer process is mediated by specific protein-protein interaction be- tween luciferase and GFP. The Renilla bioluminescence system is thus the first radiationless energy transfer system the individual components of which have been purified to homogeneity, characterized, and then reas-
* This work was supported in part through National Science Foun- dation Grant BMS 74-06914 and Energy Research and Development Administration Grant AT-38-l-635 to M. J. C. and National Institutes of Health Grant 1 F 32 EY 05104-01 and Rutgers Research Council Grant 07-2312 to W. W. W. This is contribution 377 from the Univer- sity of Georgia Marine Institute, Sapelo Island, Ga. The costs of publication of this article were defrayed in part by the payment of page charges. This article must therefore be hereby marked “adver- tisement” in accordance with 18 USC. Section 1734 solely to indicate this fact.
+. Present address, Department of Biochemistry and Microbiology, Rutgers University, Cook College, New Brunswick, N. J. 08903.
8 To whom correspondence should be sent.
sembled in vitro with restoration of the energy transfer function.
Bioluminescent coelenterates from the classes Anthozoa and Hydrozoa are known to produce green light via the intracellular oxidation of coelenterate-type luciferin (1, 2). In both classes of coelenterate, the light flash appears to be neurologically regulated through the release of calcium ions (1, 2). In the anthozoans, calcium initiates the “release” of luciferin from a specific protein known as the calcium-trig- gered luciferin-binding protein (3-5). Luciferin is then oxidized to oxyluciferin and CO, by molecular oxygen in the presence of the enzyme luciferase (6). In the hydrozoans, however, there is no luciferase (1, 7), nor is there a requirement for molecular oxygen (1, 8, 9). Instead, there is a single protein, known as a photoprotein (lo), which contains bound oxygen and bound luciferin and which appears to combine the func- tions of both the luciferin-binding protein and the enzyme luciferase (3, 11).
It has long been recognized that, while the in vivo light emission from these animals is green, the in vitro reactions generate blue light (8, 9, 12, 13). Shimomura et al. (8) were the first to discover a green-fluorescent protein in extracts of the luminescent hydrozoan jellyfish Aequorea. They also suggested (12) that this protein might be responsible for the green in uivo emission by a mechanism of absorption and re- emission (trivial transfer). Nearly 10 years later, analogous proteins were discovered by Morin and Hastings in the colo- nial hydroid Obelia (9) and by Wampler et al. in the antho- zoan sea pansy Renilla (13). In these latter cases, radiationless energy transfer was proposed as a mechanism by which green light is generated in vivo. It was subsequently shown, with a relatively crude Renilla preparation (13, 14) and with an Aequorea system immobilized on DEAE-celluose (15), that some form of energy transfer can also occur in vitro. Unequiv- ocal in vitro radiationless energy transfer has now been estab- lished in the soluble Renilla system. Using pure luciferase, luciferin, and green-fluorescent protein from Renilla renifor- mis, Ward and Cormier have shown that excitation energy is efficiently transferred at submicromolar protein concentra- tions from the enzyme-bound reaction product, oxyluciferin, to the noncatalytic green fluorescent protein (16). A scheme illustrating the competing pathways to the blue and green bioluminescence emissions in Renilla is shown in Fig. 1. The radiationless energy transfer responsible for green emission is accompanied by a 3-fold increase in radiative quantum yield. These authors have also demonstrated interspecies and in- traspecies in vitro energy transfer with dilute solutions of partially purified proteins from other anthozoan coelenterates including Renilla kollikeri, Renilla miilleri, Acanthoptilum gracile, and Stylatula elongata (17). They have substantiated a mechanism (illustrated here in Fig. 1) for energy transfer in
781
by guest on March 16, 2020
http://ww
w.jbc.org/
Dow
nloaded from
782 An Energy Transfer Protein in Bioluminescence
BLUE LH2+ L’ase + 02 - - L’ase-L=O’
PATH WAY
I +GFP GREEN
PATH WAY
I
L’ase-L=O’ I
I L’ase- L=o
+
hr (480 nm)
GFP
I
ENERGY
TRANSFER
L’ase- L=o L’ase-L=O
G:P’ - GkP + hl’ (509 nm)
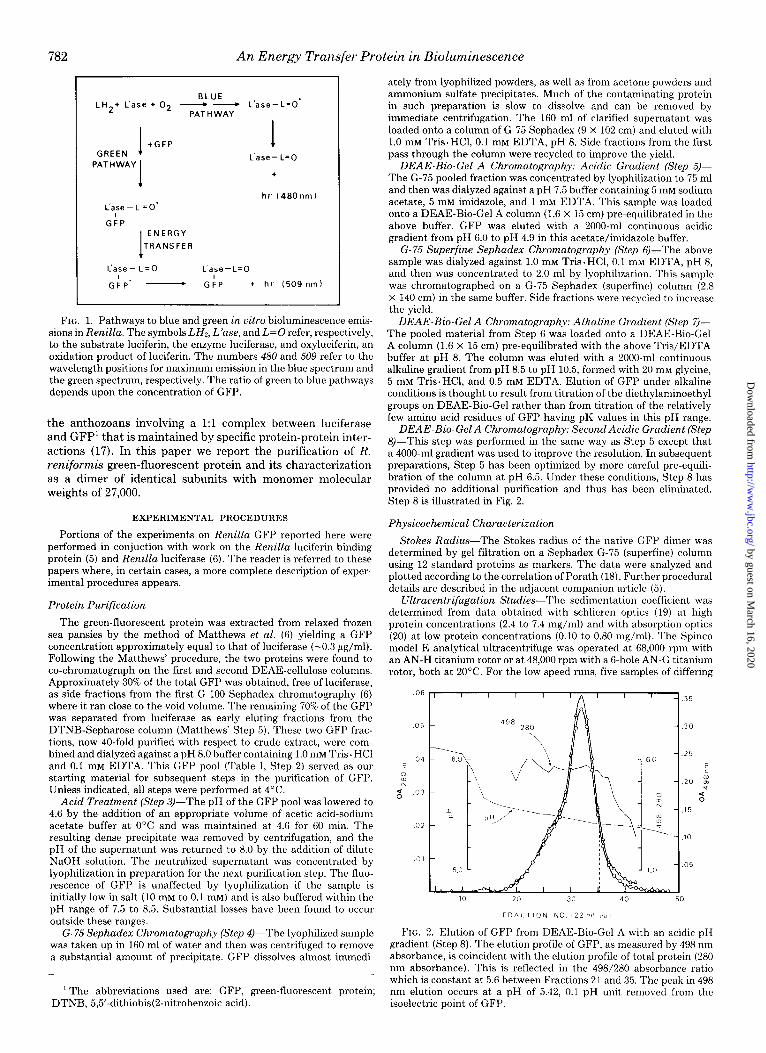
FIG. 1. Pathways to blue and green in vitro bioluminescence emis- sions in Renilla. The symbols LH,, L’ase, and L=O refer, respectively, to the substrate luciferin, the enzyme luciferase, and oxyluciferin, an oxidation product of luciferin. The numbers 480 and 509 refer to the wavelength positions for maximum emission in the blue spectrum and the green spectrum, respectively. The ratio of green to blue pathways depends upon the concentration of GFP.
the anthozoans involving a 1:l complex between luciferase and GFP’ that is maintained by specific protein-protein inter- actions (17). In this paper we report the purification of R.
reniformis green-fluorescent protein and its characterization as a dimer of identical subunits with monomer molecular weights of 27,000.
EXPERIMENTAL PROCEDURES
Portions of the experiments on Renilla GFP reported here were performed in conjuction with work on the Renilla luciferin-binding protein (5) and Renilla luciferase (6). The reader is referred to these papers where, in certain cases, a more complete description of exper- imental procedures appears.
Protein Purification
The green-fluorescent protein was extracted from relaxed frozen sea pansies by the method of Matthews et al. (6) yielding a GFP concentration approximately equal to that of luciferase (-0.3 pg/ml). Following the Matthews’ procedure, the two proteins were found to co-chromatograph on the fist and second DEAE-cellulose columns. Approximately 30% of the total GFP was obtained, free of luciferase, as side fractions from the first G-100 Sephadex chromatography (6) where it ran close to the void volume. The remaining 70% of the GFP was separated from luciferase as early eluting fractions from the DTNB-Sepharose column (Matthews’ Step 5). These two GFP frac- tions, now 40-fold purified with respect to crude extract, were com- bined and dialyzed against a pH 8.0 buffer containing 1.0 mM Tris. HCl and 0.1 mM EDTA. This GFP pool (Table I, Step 2) served as our starting material for subsequent steps in the purification of GFP. Unless indicated, all steps were performed at 4°C.
Acid Treatment (Step 3)-The pH of the GFP pool was lowered to 4.6 by the addition of an appropriate volume of acetic acid-sodium acetate buffer at 0°C and was maintained at 4.6 for 60 min. The resulting dense precipitate was removed by centrifugation, and the pH of the supernatant was returned to 8.0 by the addition of dilute NaOH solution. The neutralized supernatant was concentrated by lyophilization in preparation for the next purification step. The fluo- rescence of GFP is unaffected by lyophilization if the sample is initially low in salt (10 mM to 0.1 mrvr) and is also buffered within the pH range of 7.5 to 8.5. Substantial losses have been found to occur outside these ranges.
G- 75 Sephadex Chromatography (Step 4)-The lyophilized sample was taken up in 160 ml of water and then was centrifuged to remove a substantial amount of precipitate. GFP dissolves almost immedi-
’ The abbreviations used are: GFP, green-fluorescent protein; DTNB, 5,5’-dithiobis(2-nitrobenzoic acid).
ately from lyophilized powders, as well as from acetone powders and ammonium sulfate precipitates. Much of the contaminating protein in such preparation is slow to dissolve and can be removed by immediate centrifugation. The 160 ml of clarified supernatant was loaded onto a column of G-75 Sephadex (9 x 102 cm) and eluted with 1.0 mM Tris. HCl, 0.1 mM EDTA, pH 8. Side fractions from the first pass through the column were recycled to improve the yield.
DEAE-Bio-Gel A Chromatography: Acidic Gradient (Step 5)- The G-75 pooled fraction was concentrated by lyophilization to 75 ml and then was dialyzed against a pH 7.5 buffer containing 5 IIIM sodium acetate, 5 InM imidazole, and 1 mM EDTA. This sample was loaded onto a DEAE-Bio-Gel A column (1.6 x 15 cm) pre-equilibrated in the above buffer. GFP was eluted with a 2000-ml continuous acidic gradient from pH 6.0 to pH 4.9 in this acetate/imidazole buffer.
G-75 Superfine Sephadex Chromatography (Step 6)-The above sample was dialyzed against 1.0 mM Tris. HCl, 0.1 IIIM EDTA, pH 8, and then was concentrated to 2.0 ml by lyophilization. This sample was chromatographed on a G-75 Sephadex (superfine) column (2.8 x 140 cm) in the same buffer. Side fractions were recycled to increase the yield.
DEAE-Bio-Gel A Chromatography: Alkaline Gradient (Step 7)- The pooled material from Step 6 was loaded onto a DEAE-Bio-Gel A column (1.6 x 15 cm) pre-equilibrated with the above Tris/EDTA buffer at pH 8. The column was eluted with a 2000.ml continuous alkaline gradient from pH 8.5 to pH 10.5, formed with 20 mM glycine, 5 mM Tris.HCl, and 0.5 mM EDTA. Elution of GFP under alkaline conditions is thought to result from titration of the diethylaminoethyl groups on DEAE-Bio-Gel rather than from titration of the relatively few amino acid residues of GFP having pK values in this pH range.
DEAE-Bio-Gel A Chromatography: Second Acidic Gradient (Step @-This step was performed in the same way as Step 5 except that a 4000-ml gradient was used to improve the resolution. In subsequent preparations, Step 5 has been optimized by more careful pre-equih- bration of the column at pH 6.5. Under these conditions, Step 8 has provided no additional purification and thus has been eliminated. Step 8 is illustrated in Fig. 2.
Physicochemical Characterization
Stokes Radius-The Stokes radius of the native GFP dimer was determined by gel filtration on a Sephadex G-75 (superfine) column using 12 standard proteins as markers. The data were analyzed and plotted according to the correlation of Porath (18). Further procedural details are described in the adjacent companion article (5).
Ultracentrifugation Studies-The sedimentation coefficient was determined from data obtained with schlieren optics (19) at high protein concentrations (2.4 to 7.4 mg/ml) and with absorption optics (20) at low protein concentrations (0.10 to 0.80 mg/ml). The Spinco model E analytical ultracentrifuge was operated at 68,000 rpm with an AN-H titanium rotor or at 48,000 rpm with a 6-hole AN-G titanium rotor, both at 2O’C. For the low speed runs, five samples of differing
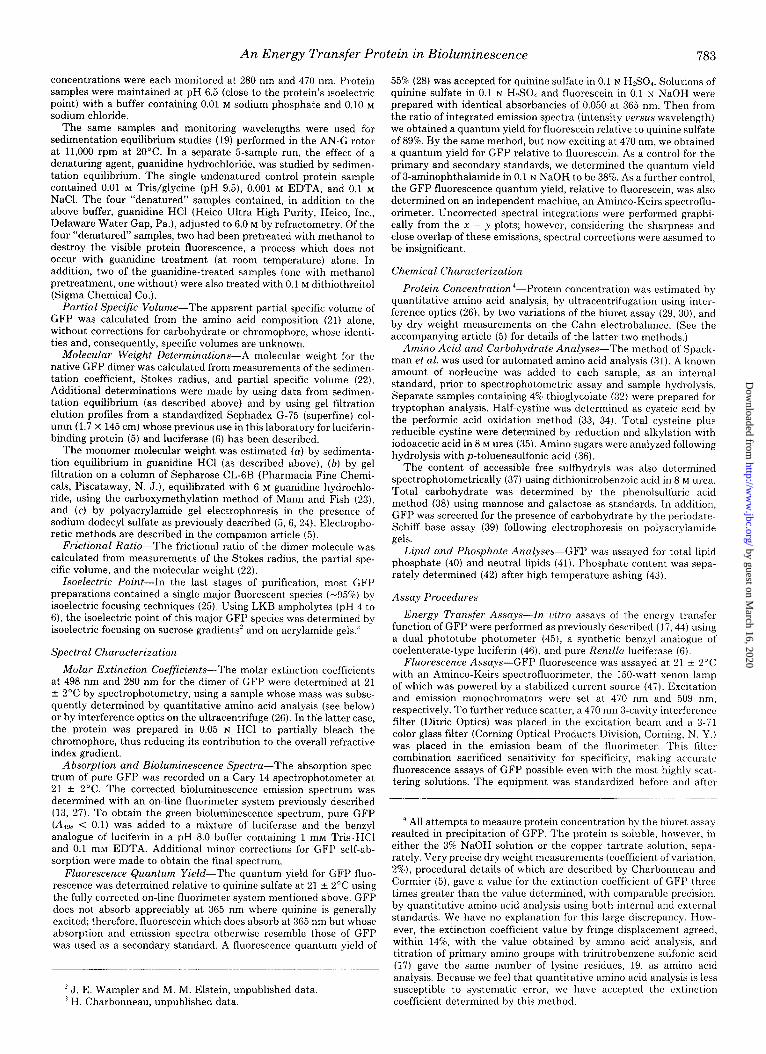
FIG. 2. Elution of GFP from DEAE-Bio-Gel A with an acidic pH gradient (Step 8). The elution profile of GFP, as measured by 498 nm absorbance, is coincident with the elution profile of total protein (280 nm absorbance). This is reflected in the 498/280 absorbance ratio which is constant at 5.6 between Fractions 21 and 35. The peak in 498 nm elution occurs at a pH of 5.42, 0.1 pH unit removed from the isoelectric point of GFP.
by guest on March 16, 2020
http://ww
w.jbc.org/
Dow
nloaded from
concentrations were each monitored at 280 nm and 470 nm. Protein samples were maintained at pH 6.5 (close to the protein’s isoelectric point) with a buffer containing 0.01 M sodium phosphate and 0.10 M
sodium chloride. The same samples and monitoring wavelengths were used for
sedimentation equilibrium studies (19) performed in the AN-G rotor at 11,006 rpm at 20°C. In a separate &sample run, the effect of a denaturing agent, guanidine hydrochloride, was studied by sedimen- tation equilibrium. The single undenatured control protein sample contained 0.01 M Tris/glycine (pH 9.5), 0.001 M EDTA, and 0.1 M
NaCl. The four “denatured” samples contained, in addition to the above buffer, guanidine HCl (Heico Ultra High Purity, Heico, Inc., Delaware Water Gap, Pa.), adjusted to 6.0 M by refractometry. Of the four “denatured” samples, two had been pretreated with methanol to destroy the visible protein fluorescence, a process which does not occur with guanidine treatment (at room temperature) alone. In addition, two of the guanidine-treated samples (one with methanol pretreatment, one without) were also treated with 0.1 M dithiothreitol (Sigma Chemical Co.).
55% (28) was accepted for quinine sulfate in 0.1 N H&O1. Solutions of quinine sulfate in 0.1 N HSO., and fluorescein in 0.1 in NaOH were prepared with identical absorbancies of 0.050 at 365 nm. Then from the ratio of integrated emission spectra (intensity versus wavelength) we obtained a quantum yield for fluorescein relative to quinine sulfate of 89%. By the same method, but now exciting at 470 nm, we obtained a quantum yield for GFP relative to fluorescein. As a control for the primary and secondary standards, we determined the quantum yield of 3-aminophthalamide in 0.1 N NaOH to be 38%. As a further control, the GFP fluorescence quantum yield, relative to fluorescein, was also determined on an independent machine, an Aminco-Keirs spectroflu- orimeter. Uncorrected spectral integrations were performed graphi- cally from the x - y plots; however, considering the sharpness and close overlap of these emissions, spectral corrections were assumed to be insignificant.
Chemical Characterization
Partial Specific Volume-The apparent partial specific volume of GFP was calculated from the amino acid composition (21) alone, without corrections for carbohydrate or chromophore, whose identi- ties and, consequently, specific volumes are unknown.
Protein ConcentrationJ-Protein concentration was estimated by quantitative amino acid analysis, by ultracentrifugation using inter- ference optics (26), by two variations of the biuret assay (29, 30), and by dry weight measurements on the Cahn electrobalance. (See the accompanying article (5) for details of the latter two methods.)
Molecular Weight Determinations-A molecular weight for the native GFP dimer was calculated from measurements of the sedimen- tation coefficient, Stokes radius, and partial specific volume (22). Additional determinations were made by using data from sedimen- tation equilibrium (as described above) and by using gel filtration elution profiles from a standardized Sephadex G-75 (superfine) col- umn (1.7 x 145 cm) whose previous use in this laboratory for luciferin- binding protein (5) and luciferase (6) has been described.
The monomer molecular weight was estimated (a) by sedimenta- tion equilibrium in guanidine HCl (as described above), (b) by gel filtration on a column of Sepharose CL-6B (Pharmacia Fine Chemi- cals, Piscataway, N. J.), equilibrated with 6 M guanidine hydrochlo- ride, using the carboxymethylation method of Mann and Fish (23), and (c) by polyacrylamide gel electrophoresis in the presence of sodium dodecyl sulfate as previously described (5, 6, 24). Electropho- retie methods are described in the companion article (5).
Amino Acid and Carbohydrate Annlyses-The method of Spack- man et al. was used for automated amino acid analysis (31). A known amount of norleucine was added to each sample, as an internal standard, prior to spectrophotometric assay and sample hydrolysis. Separate samples containing 4% thioglycolate (32) were prepared for tryptophan analysis. Half-cystine was determined as cysteic acid by the performic acid oxidation method (33, 34). Total cysteine plus reducible cystine were determined by reduction and alkylation with iodoacetic acid in 8 M urea (35). Amino sugars were analyzed following hydrolysis with p-toluenesulfonic acid (36).
Frictional Ratio-The frictional ratio of the dimer molecule was calculated from measurements of the Stokes radius, the partial spe- cific volume, and the molecular weight (22).
The content of accessible free sulkydryls was also determined spectrophotometrically (37) using dithionitrobenzoic acid in 8 M urea. Total carbohydrate was determined by the phenolsulfuric acid method (38) using mannose and galactose as standards. In addition, GFP was screened for the presence of carbohydrate by the periodate- Schiff base assay (39) following electrophoresis on polyacrylamide gels.
Isoelectric Point-In the last stages of purification, most GFP preparations contained a single major fluorescent species (-95%) by isoelectric focusing techniques (25). Using LKB ampholytes (pH 4 to 6), the isoelectric point of this major GFP species was determined by isoelectric focusing on sucrose gradients’ and on acrylamide gels:
Lipid and Phosphate Analyses-GFP was assayed for total lipid phosphate (40) and neutral lipids (41). Phosphate content was sepa- rately determined (42) after high temperature ashing (43).
Assay Procedures
Spectral Characterization
Energy Transfer Assays-In vitro assays of the energy transfer function of GFP were performed as previously described (17,44) using a dual phototube photometer (45), a synthetic benzyl analogue of coelenterate-type luciferin (46), and pure Renilla luciferase (6).
Molar Extinction Coefficients-The molar extinction coefficients at 498 nm and 280 nm for the dimer of GFP were determined at 21 + 2°C by spectrophotometry, using a sample whose mass was subse- quently determined by quantitative amino acid analysis (see below) or by interference optics on the ultracentrifuge (26). In the latter case, the protein was prepared in 0.05 N HCl to partially bleach the chromophore, thus reducing its contribution to the overall refractive index gradient.
Absorption and Bioluminescence Spectra-The absorption spec- trum of pure GFP was recorded on a Cary 14 spectrophotometer at 21 f 2°C. The corrected bioluminescence emission spectrum was determined with an on-line fluorimeter system previously described (13, 27). To obtain the green bioluminescence spectrum, pure GFP (A,w < 0.1) was added to a mixture of luciferase and the benzyl analogue of luciferin in a pH 8.0 buffer containing 1 mM Tris.HCl and 0.1 mM EDTA. Additional minor corrections for GFP self-ab- sorption were made to obtain the final spectrum.
Fluorescence Assays-GFP fluorescence was assayed at 21 * 2°C with an Aminco-Keirs spectrofluorimeter, the I50-watt xenon lamp of which was powered by a stabilized current source (47). Excitation and emission monochromators were set at 470 nm and 509 nm, respectively. To further reduce scatter, a 470 nm 3-cavity interference filter (Ditric Optics) was placed in the excitation beam and a 3-71 color glass filter (Corning Optical Products Division, Corning, N. Y.) was placed in the emission beam of the fluorimeter. This filter combination sacrificed sensitivity for specificity, making accurate fluorescence assays of GFP possible even with the most highly scat- tering solutions. The equipment was standardized before and after
__. . - -
Fluorescence Quantum Yield-The quantum yield for GFP fluo- rescence was determined relative to quinine sulfate at 21 & 2°C using the fully corrected on-line fluorimeter system mentioned above. GFP does not absorb appreciably at 365 nm where quinine is generally excited; therefore, fluorescein which does absorb at 365 nm but whose absorption and emission spectra otherwise resemble those of GFP was used as a secondary standard. A fluorescence quantum yield of
‘J. E. Wampler and M. M. Elstein, unpublished data. ,’ H. Charbonneau, unpublished data.
4 All attempts to measure protein concentration by the biuret assay resulted in precipitation of GFP. The protein is soluble, however, in either the 3% NaOH solution or the copper tartrate solution, sepa- rately. Very precise dry weight measurements (coefficient of variation, 2W), procedural details of which are described by Charbonneau and Cormier (5), gave a value for the extinction coefficient of GFP three times greater than the value determined, with comparable precision, by quantitative amino acid analysis using both internal and external standards. We have no explanation for this large discrepancy. How ever, the extinction coefficient value by fringe displacement agreed, within 14%, with the value obtained by amino acid analysis, and titration of primary amino groups with trinitrobenzene sulfonic acid (17) gave the same number of lysine residues, 19, as amino acid analysis, Because we feel that quantitative amino acid analysis is less susceptible to systematic error, we have accepted the extinction coefficient determined by this method.
An Energy Transfer Protein in Bioluminescence 783
by guest on March 16, 2020
http://ww
w.jbc.org/
Dow
nloaded from
784 An Energy Transfer Protein in Bioluminescence
each assay with samples of a fluorescein stock solution in 0.10 N NaOH. The stock solution, prepared so as to match the fluorescence intensity of a 10 pg/ml solution of Renilla GFP, was found to be stable for more than 12 months when stored in a brown bottle at 4°C.
Spectrophotometric Assays-Assays for protein concentration were performed routinely with a Zeiss spectrophotometer and simply expressed as A2”(, units. For the pure GFP, 1.0 mg/ml of protein corresponds to 0.89 absorbance units at 280 nm.
RESULTS AND DISCUSSION
Protein Purification
The Renilla green-fluorescent protein co-extracts and co- purifies through several steps with the enzyme luciferase. This accounts, in part, for the fact that earlier preparations of these proteins (13,48) were cross-contaminated. For work reported in all of the more recent papers, however, luciferase (6, 49) and GFP (16, 17, 44) have been fully resolved and purified to homogeneity. Our studies on energy transfer (16) and protein- protein interaction (17,44), for example, have utilized samples of homogeneous GFP whose purification procedure we are now reporting.
In contrast to luciferase (6), the green-fluorescent protein is relatively stable during early stages in purification. Ammo- nium sulfate precipitates and acetone powders (48), which may lose luciferase activity upon preparation or upon pro- longed storage at -2O”C, are suitable starting materials for the purification of GFP. However, as a matter of convenience, we have chosen to use side fractions of luciferase preparations (6) as our routine starting material.
From 15 kg of relaxed (3) and frozen Renilla we obtained approximately 40 mg of green-fluorescent protein (Table I) and 35 mg of luciferase (6). This GFP, which separated from luciferase on Matthews’ (6) Steps 4 and 5, served as our pool of starting material (Table I, Step 2). The GFP pool was purified to homogeneity with six additional steps. The initial acid treatment (Table I, Step 3) removed virtually all contam- inants with significant absorption at 498 nm. This step was followed with several gel filtration and ion exchange steps (Table I, Steps 4 to 8). The degree of resolution achieved with acidic and alkaline pH gradient elutions from DEAE-Bio-Gel A represents a significant improvement over earlier ion ex- change purification methods for GFP (14, 50). It also elim- inates the need for an elaborate preparative isoelectric focus- ing step, previously required as a terminal purification step.”
Criteria of Purity
Step 3 of the purification scheme (Table I) removed vir- tually all contaminants with significant 498 nm absorbancies but retained a large amount of 280 nm absorbing contami- nants; therefore, in Steps 3 through 8, the optical density at 498 nm has been considered proportional to the concentration of GFP. The optical density at 280 nm, however, is not proportional to GFP concentration at each of these purifica- tion steps, as reflected by a progressive increase in the 498 nm/280 nm ratios. Therefore, after Step 3 we found it possible to accurately monitor the protein’s purity by measuring ab- sorbancies at 498 nm and 280 nm. A maximum and constant value of 5.6 for the 498/280 ratio was obtained by Step 8 of the purification. Fig. 2 illustrates this constant 498/280 ab- sorption ratio with the elution of 80% of the GFP from the terminal purification column. Rechromatography of the ter- minal pooled fractions on an additional G-75 superfine Seph- adex column failed to raise the absorption ratio above 5.6, even at the peak fraction. This same maximum ratio of 5.6 has also been achieved by independent purification methods
‘J. E. Wampler and M. M. Elstein, unpublished data.
involving terminal preparative isoelectric focusing on sucrose gradient-stabilized ampholyte solutions.”
It has been impossible to detect protein contaminants by disc gel electrophoresis (51), sodium dodecyl sulfate-gel elec- trophoresis, or isoelectric focusing on polyacrylamide gels using overloads of GFP whose absorption ratios are 4.0 or greater. Thus we conclude that such preparations are pure with respect to these electrophoretic criteria. Likewise, the schlieren patterns from sedimentation velocity runs on the analytical ultracentrifuge are sharp symmetric peaks with no indication of sample heterogeneity, and the sedimentation equilibrium plots are straight lines. The physical, chemical, and spectral characterizations, described below, were obtained with samples of GFP which met these criteria of purity.
Protein Characterization
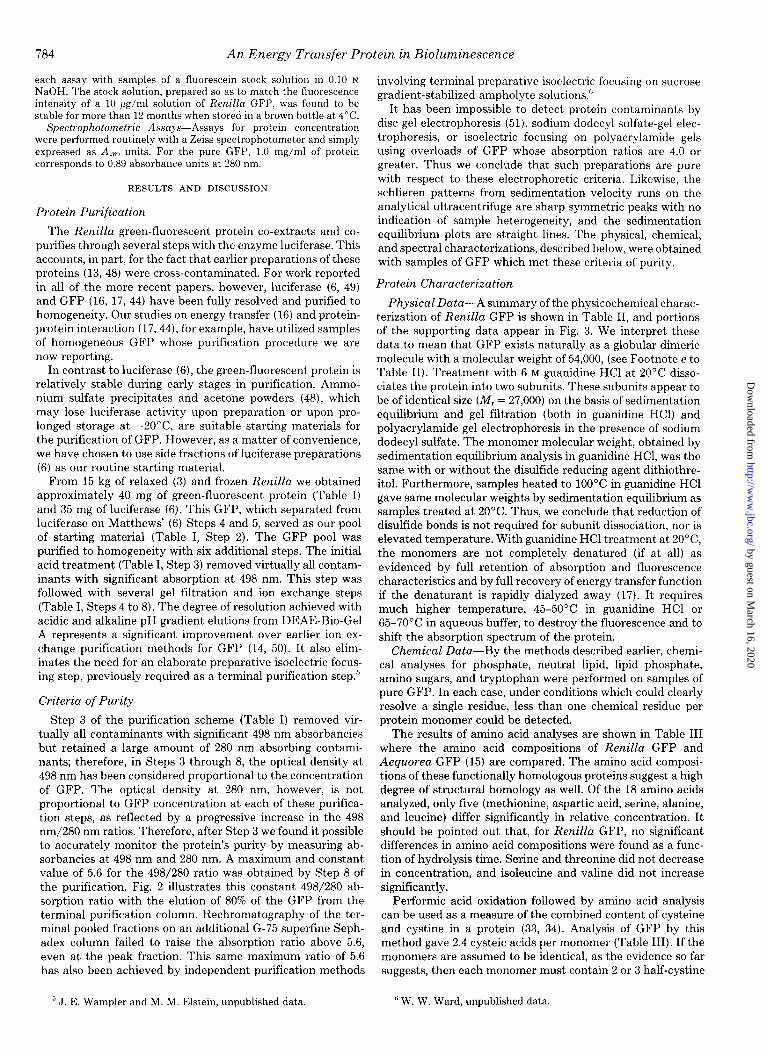
Physical Data-A summary of the physicochemical charac- terization of Renilla GFP is shown in Table II, and portions of the supporting data appear in Fig. 3. We interpret these data to mean that GFP exists naturally as a globular dimeric molecule with a molecular weight of 54,000, (see Footnote e to Table II). Treatment with 6 M guanidine HCl at 20°C disso- ciates the protein into two subunits. These subunits appear to be of identical size (M, = 27,000) on the basis of sedimentation equilibrium and gel filtration (both in guanidine HCl) and polyacrylamide gel electrophoresis in the presence of sodium dodecyl sulfate. The monomer molecular weight, obtained by sedimentation equilibrium analysis in guanidine HCl, was the same with or without the disulfide reducing agent dithiothre- itol. Furthermore, samples heated to 100°C in guanidine HCl gave same molecular weights by sedimentation equilibrium as samples treated at 20°C. Thus, we conclude that reduction of disulfide bonds is not required for subunit dissociation, nor is elevated temperature. With guanidine HCl treatment at 2O”C, the monomers are not completely denatured (if at all) as evidenced by full retention of absorption and fluorescence characteristics and by full recovery of energy transfer function if the denaturant is rapidly dialyzed away (17). It requires much higher temperature, 45-50°C in guanidine HCl or 65-70°C in aqueous buffer, to destroy the fluorescence and to shift the absorption spectrum of the protein.
Chemical Data-By the methods described earlier, chemi- cal analyses for phosphate, neutral lipid, lipid phosphate, amino sugars, and tryptophan were performed on samples of pure GFP. In each case, under conditions which could clearly resolve a single residue, less than one chemical residue per protein monomer could be detected.
The results of amino acid analyses are shown in Table III where the amino acid compositions of Renilla GFP and Aequorea GFP (15) are compared. The amino acid composi- tions of these functionally homologous proteins suggest a high degree of structural homology as well. Of the 18 amino acids analyzed, only five (methionine, aspartic acid, serine, alanine, and leucine) differ significantly in relative concentration. It should be pointed out that, for Renilla GFP, no significant differences in amino acid compositions were found as a func- tion of hydrolysis time. Serine and threonine did not decrease in concentration, and isoleucine and valine did not increase significantly.
Performic acid oxidation followed by amino acid analysis can be used as a measure of the combined content of cysteine and cystine in a protein (33, 34). Analysis of GFP by this method gave 2.4 cysteic acids per monomer (Table III). I f the monomers are assumed to be identical, as the evidence so far suggests, then each monomer must contain 2 or 3 half-cystine
’ W. W. Ward, unpublished data.
by guest on March 16, 2020
http://ww
w.jbc.org/
Dow
nloaded from
785 An Energy Transfer Protein in Bioluminescence
TABLE I Renilla green-fluorescent protein purification scheme
step Description Volume AX0 A198 498/280 GFP” GFPb Purification Yield ml w 5% B
1 Extraction’ 120,000 -425,000 -40 -0.0084 100 2 GFP pool‘+ 4,000 9,360 360 0.038 34.7 0.33 40 87 3 Acid treatment (pH 4.6) 4,140 7,620 199 0.026 34.7 0.41 49 87 4 Sephadex G-75 (2 cycles) 683 1,084 147 0.136 31.8 2.6 310 80 5 DEAE-Bio-Gel A (acidic 440 64.0 96.0 1.50 19.2 27 3,200 48
gradient) 6 G-75 superfine (2 cycles) 36 29.6 84.0 2.84 16.8 51 6,100 42 7 DEAE-Bio-Gel A (alkaline 600 15.9 64.4 4.05 12.9 72 8,600 32
gradient) 8 DEAE-Bio-Gel A (acidic 315 9.17 51.3 5.60 10.3 100 12,000 26
gradient)
” Based on fluorescence assay relative to an external fluorescein standard in 0.10 N NaOH.
b The bulk protein is assumed to have 0.89 A280 unit/mg/ml. ’ This represents 2?/2 times the standard preparation size or 15 kg
of frozen Renilla (6). High turbidity and the presence of fluorescent
TABLE II Physicochemical characterization of Renilla green-fluorescent
protein
Stokes radius, a (A) Frictional ratio, f/f0 Sedimentation coefficient, s&,~, x lOI (S) Partial specific volume, apparent., Vapp (cm3 g-‘) Isoelectric point (PI) Molar extinction coefficient, Q’ M (1 mol-’
cm-‘) h = 498 nm X = 280 nm
Absorption ratio, 498 nm/280 nm Fluorescence quantum yield, h (%) Molecular weight as dimer, from:
Sedimentation velocity Sedimentation equilibrium Gel filtration
30.4 * 1.1” 1.21 f 0.08 3.93 -c 0.07
0.735 5.34" -I 0.07
2.7 x 10” 4.8 x lo4 5.6 80'f 2
52,400 k 2,100 50,900 + 2,800 52,900 f 3,800"
Average 52,100 + 3,000” Molecular weight as monomer, from:
Sedimentation equilibrium in 6 M guanidine 28,900 of: 1,800 HCl
Gel filtration in 6 M guanidine HCl 25,800 + 1,000’ SDS’ gel electrophoresis 29,700 -r- 3,000"
Average 28,100 f 2,000”
a The error is the average deviation of data points from a linear least squares fit of the data. Unless indicated, the other errors reported here are standard deviations.
* From J. E. Wampler and M. Elstein, unpublished data. ‘From H. Carbonneau, R. Hart, and W. W. Ward, unpublished
data. ’ Combining dimer and monomer data we arrived at average mo-
lecular weights of 27,000 for the monomer and 54,000 for the dimer. The errors shown here are arithmetic means of the standard devia- tions.
e The data can be fitted to an empirical nonlinear function better than to a linear function. The deviation here is assumed to be no greater than 1000 because of the excellent fit to the curve.
‘SDS, sodium dodecyl sulfate.
residues. Two additional experiments were performed to de- termine the oxidation state and chemical accessibility of these residues. First, GFP was treated with iodoacetic acid (35) following 24-h incubation of the protein in 0.01 M 2-mercap- toethanol in 8 M urea at pH 8.6 and at 30°C. The GFP sample remained fluorescent and retained most of its energy transfer ability following the alkylation reaction. However, subsequent amino acid analysis, after 24-h acid hydrolysis, yielded no detectable carboxymethylcysteine. These results suggest that all cysteine residues in GFP are relatively inaccessible, even
contaminants in the crude extract precluded accurate absorbance and fluorescence determinations.
” The GFP pool is composed of the GFP fractions from Matthews’ (6) Steps 4 and 5.
FIG. 3. Molecular weight determinations for the monomer and dimer forms by gel filtration in the presence (+GuHCl) and the absence (-GuHCl) of 6 M guanidine hydrochloride. Data for the monomer (+GuHCl) were obtained on a silanized column of Sepha- rose CL-6B (1.4 x 140 cm) equilibrated with 6 M guanidine HCl. GFP and the protein standards were alkylated with iodoacetic acid after a 2-h incubation in 6 M guanidine HCl containing 0.1 M 2.mercaptoeth- anol. A column of Sephadex G-75 (1.7 x 145 cm; superfine) was used for gel filtration of the native (-GuHCI) forlm of GFP. Standard proteins used for these two calibrations include: a, liver alcohol dehydrogenase; b, bovine serum albumin; c, hemoglobin; d, ovalbu- min; e, horseradish peroxidase; f, P-lactoglobulin; g, carbonic anhy- drase; h, trypsin inhibitor; i, myoglobin;;, ribonuclease; h, cytochrome c; 1, yeast enolase; m, yeast alcohol dehydrogenase; n, a-chymotryp- sinogen; and o, lysozyme. BP, luciferin-binding protein.
under “denaturing” conditions. A second experiment supports this conclusion. GFP was treated with lo-* M DTNB in 8 M urea at pH 8.0 (37). No DTNB reactivity was detected so long as the protein remained fluorescent. When the chromophore fluorescence was totally destroyed, by incubation at 70°C in an 8 M urea solution containing DTNB, a slight color enhance- ment at 412 nm corresponding to 0.3 residue of cysteine per monomer was detected. Incubation for a longer duration at this temperature failed to increase the 412 nm extinction. Thus, we conclude that the color enhancement at 412 nm is a nonspecific reaction, possibly involving chromophore ab- sorbance changes known to accompany denaturation of the protein.
We had earlier concluded that the quaternary structure of GFP does not involve stabilization by interchain disulfide bonds since the monomers can be separated in guanidine HCl
by guest on March 16, 2020
http://ww
w.jbc.org/
Dow
nloaded from
786 An Energy Transfer Protein in Bioluminescence
TABLE III
l’he amino ncid compositions of Renilln cud Aeqrtorea” GFP
Renrlla, Aeyuoren, residues/ residues/ “7,000 g” 27,000 g nearest
integer
1,ysine 18.7 19.0 19 19 Histidine 7.8 8.4 8 8 Arginine 7.3 5.9 7 6 Half-cystine 2.4’ 2.9 2 3 Methionine 9.2 4.7 9 5 Aspartic acid 19.5 30.0 20 30 Glutamic acid 27.1 25.4 27 25 Threonine 16.6 14.6 17 15 Serine 15.4 8.8 15 9 Proline 10.8 11.8 11 12 Glycine 22.2 22.4 22 22 Alanine 14.4 11.1 14 11 Valine 17.8 16.4 18 16 Isoleucine 13.8 12.6 14 13 Leucine 15.4 17.9 15 18 Tyrosine 11.4 9.6 11 10 FIG. 4. The absorption and fluorescence emission spectra for pure
Phenylalanine 12.9 11.7 13 12 GFP. The spectra were obtained at room temperature on instruments
Tryptophan 0” 0 0 0 described under “Experimental Procedures.” The GFP fluorescence
Amino sugars 0’ 0 0 0 emission intensity, with 470 nm excitation, is relatively insensitive to
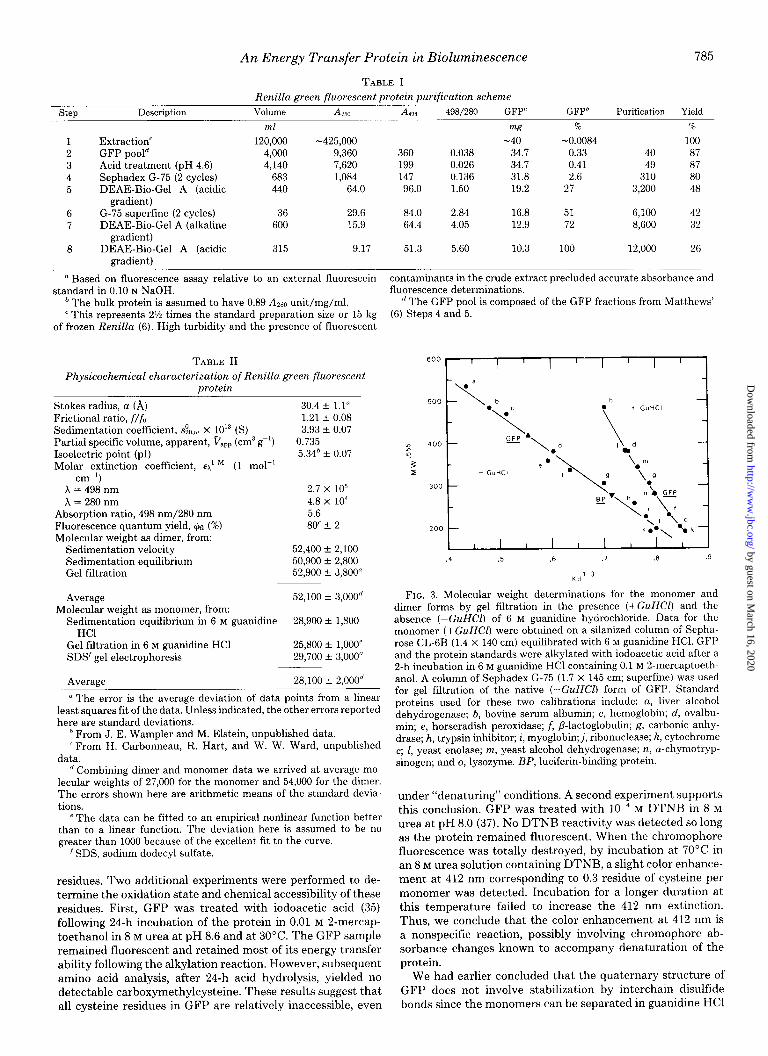
” Aequoreu GFP data from Morise et al. (15). temperature, varying less than 20% between 5’ and 50°C.
’ Each value represents the average from hydrolyses of 24, 48, and 72 h unless otherwise indicated.
’ Determined as cysteic acid following performic acid oxidation. I I I I I I I IllI
” Determined by hydrolysis in the presence of thioglycolate. ’ Hydrolysis with p-toluenesulfonic acid.
I 0
without a reducing agent. The above experiments indicate 2 0 08
that the cystine or cysteines, or both, are totally inaccessible t.- 0
to common sulfhydryl reagents in both the native and the I 0.1 a.
partially denatured protein. The inability of GFP sulfhydryls to react with DTNB under extreme denaturing conditions, however, suggests that they may exist in the oxidized form as 0 05
a single cystine group whose disulfide bond forms a single 2
intrachain bridge. u 0.4 z
Amino acid analysis failed to detect a measurable amount of amino sugar (36). The phenolsulfuric acid assay for total
; 03
sugars (38), however, indicated that GFP does contain a significant level of bound sugar. The amount of sugar actually detected was equivalent to 2.5 mannose residues or 3.4 galac- tose residues per protein monomer. These results were quali- tatively supported by a positive test for carbohydrate using the periodate-Schiff base assay (39) following polyacrylamide gel electrophoresis. WAVELENGTH (NM)
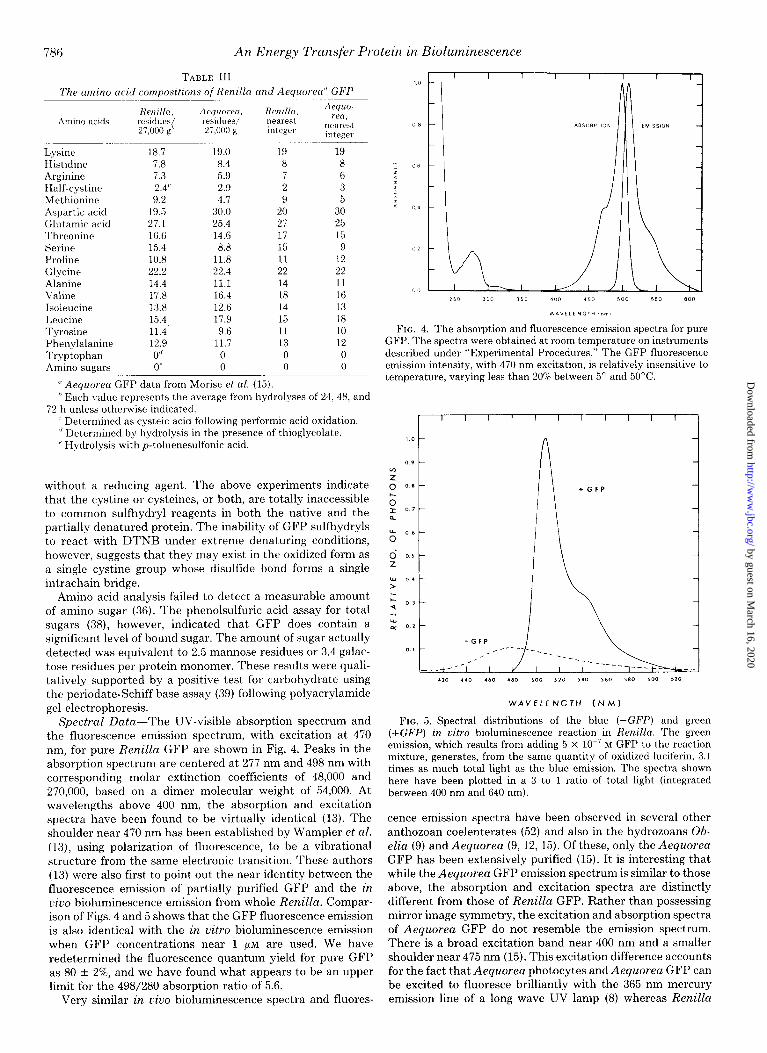
Spectral Data-The UV-visible absorption spectrum and FIG. 5. Spectral distributions of the blue (-GFP) and green
the fluorescence emission spectrum, with excitation at 470 (+GFP) in vitro bioluminescence reaction in Renilla. The green
nm, for pure Renilla GFP are shown in Fig. 4. Peaks in the emission, which results from adding 5 x lo-’ M GFP to the reaction
absorption spectrum are centered at 277 nm and 498 nm with mixture, generates, from the same quantity of oxidized luciferin, 3.1
corresponding molar extinction coefficients of 48,000 and times as much total light as the blue emission. The spectra shown
270,000, based on a dimer molecular weight of 54,000. At here have been plotted in a 3 to 1 ratio of total light (integrated between 400 nm and 640 nml.
wavelengths above 400 nm, the absorption and excitation spectra have been found to be virtually identical (13). The cence emission spectra have been observed in several other shoulder near 470 nm has been established by Wampler et al. anthozoan coelenterates (52) and also in the hydrozoans Ob- (13), using polarization of fluorescence, to be a vibrational elia (9) and Aequorea (9, 12, 15). Of these, only the Aequorea structure from the same electronic transition. These authors GFP has been extensively purified (15). It is interesting that (13) were also first to point out the near identity between the while the Aequorea GFP emission spectrum is similar to those fluorescence emission of partially purified GFP and the in above, the absorption and excitation spectra are distinctly ciuo bioluminescence emission from whole Renilla. Compar- different from those of Renilla GFP. Rather than possessing ison of Figs. 4 and 5 shows that the GFP fluorescence emission mirror image symmetry, the excitation and absorption spectra is also identical with the in vitro bioluminescence emission of Aequorea GFP do not resemble the emission spectrum. when GFP concentrations near 1 pM are used. We have There is a broad excitation band near 400 nm and a smaller redetermined the fluorescence quantum yield for pure GFP shoulder near 475 nm (15). This excitation difference accounts as 80 + 2%, and we have found what appears to be an upper for the fact that Aequorea photocytes and Aequorea GFP can limit for the 498/280 absorption ratio of 5.6. be excited to fluoresce brilliantly with the 365 nm mercury
Very similar in uivo bioluminescence spectra and fluores- emission line of a long wave UV lamp (8) whereas Renilla
by guest on March 16, 2020
http://ww
w.jbc.org/
Dow
nloaded from
An Energy Transfer Protein in Bioluminescence 787
photocytes and Renilla GFP are almost nonfluorescent with
365 nm excitation. Considering the degree of chemical homol-
ogy evident in these proteins from amino acid analysis (Table
III), it would be interesting to determine whether the two
chromophores are identical and, if so, how protein attachment
influences their unique spectral characteristics.
Energy Transfer Function
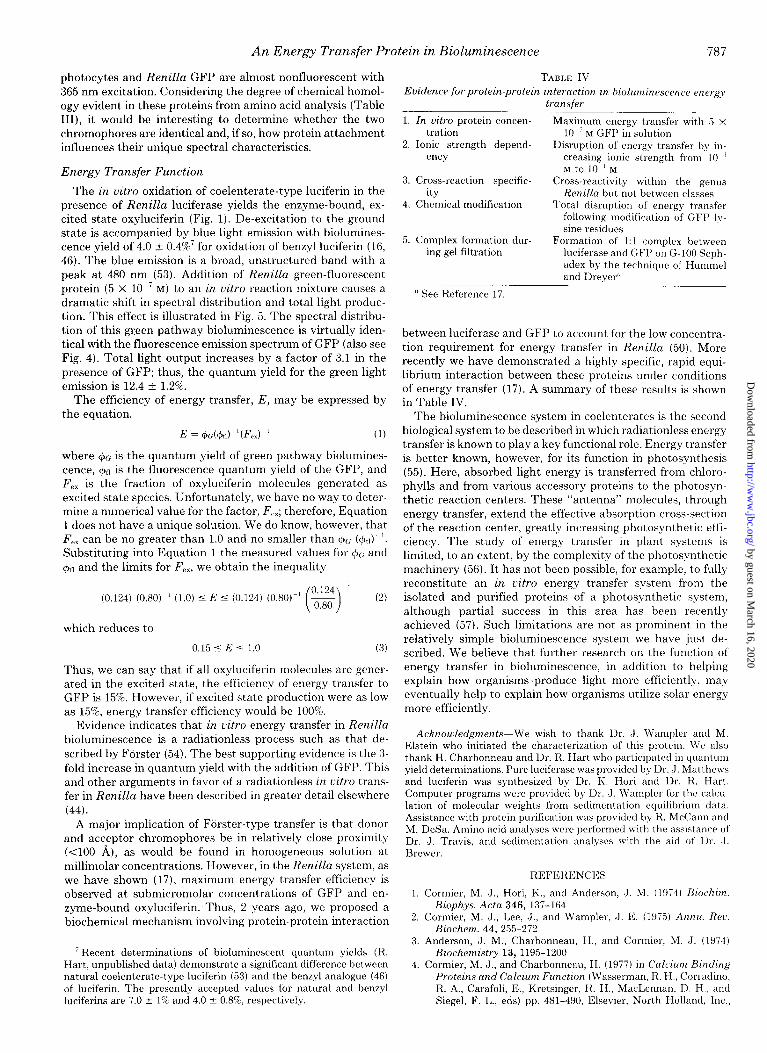
The in vitro oxidation of coelenterate-type luciferin in the
presence of ReniZZa luciferase yields the enzyme-bound, ex-
cited state oxyluciferin (Fig. 1). De-excitation to the ground
state is accompanied by blue light emission with biolumines-
cence yield of 4.0 -t 0.4%’ for oxidation of benzyl luciferin (16,
46). The blue emission is a broad, unstructured band with a
peak at 480 nm (53). Addition of Renilla green-fluorescent
protein (5 X 10-j M) to an in vitro reaction mixture causes a
dramatic shift in spectral distribution and total light produc- tion. This effect is illustrated in Fig. 5. The spectral distribu-
tion of this green pathway bioluminescence is virtually iden-
tical with the fluorescence emission spectrum of GFP (also see
Fig. 4). Total light output increases by a factor of 3.1 in the
presence of GFP; thus, the quantum yield for the green light
emission is 12.4 f 1.2%.
The efficiency of energy transfer, E, may be expressed by
the equation.
E = l$c(~)-‘(F,,)-’ (1)
where +C is the quantum yield of green pathway biolumines- cence, 40 is the fluorescence quantum yield of the GFP, and
F,. is the fraction of oxyluciferin molecules generated as excited state species. Unfortunately, we have no way to deter-
mine a numerical value for the factor, F,,; therefore, Equation
1 does not have a unique solution. We do know, however, that
F,, can be no greater than 1.0 and no smaller than 0~; (I$&‘.
Substituting into Equation 1 the measured values for 4~; and
+,I and the limits for F,,, we obtain the inequality
(0.124) (0.80)-’ (1.0) 5 E 5 (0.124) (0.80)-’ (2)
which reduces to
0.15 5 E 5 1.0 (3)
Thus, we can say that if all oxyluciferin molecules are gener-
ated in the excited state, the efficiency of energy transfer to
GFP is 15%. However, if excited state production were as low
as 15%, energy transfer efficiency would be 100%.
Evidence indicates that in vitro energy transfer in Renilla
bioluminescence is a radiationless process such as that de-
scribed by Fiirster (54). The best supporting evidence is the 3-
fold increase in quantum yield with the addition of GFP. This and other arguments in favor of a radiationless in vitro trans-
fer in Renilla have been described in greater detail elsewhere
(44).
A major implication of Fiirster-type transfer is that donor and acceptor chromophores be in relatively close proximity
(<lOO A), as would be found in homogeneous solution at millimolar concentrations. However, in the Renilla s,ystem, as
we have shown (17), maximum energy transfer efficiency is
observed at submicromolar concentrations of GFP and en-
zyme-bound oxyluciferin. Thus, 2 years ago, we proposed a
biochemical mechanism involving protein-protein interaction
’ Recent determinations of bioluminescent quantum yields (Ii. Hart, unpublished data) demonstrate a significant difference between natural coelenterate-type luciferin (53) and the benzyl analogue (46) of luciferin. The presently accepted values for natural and benzyl luciferins are 7.0 * 1% and 4.0 2 0.8%j, respectively.
TABLE IV
E’uidence for protein-protein interaction in bioluminescence energy transfer
1.
2.
3.
4.
5.
In vitro protein concen- tration
Ionic strength depend- ency
Cross-reaction specific- ity
Chemical modification
Complex formation dur- ing gel filtration
Maximum energy transfer with 5 x
10~’ M GFP in solution Disruption of energy transfer by in-
creasing ionic strength from lo-” M to lo-’ M
Cross-reactivity within the genus Renilla but not between classes
Total disruption of energy transfcl following modification of GFI’ ly- sine residues
Formation of 1:l complex between luciferase and GFP on G-100 Seph- adex by the technique of Hummel and Dreyer”
’ See Reference 17.
between luciferase and GFP to account for the low concentra-
tion requirement for energy transfer in Renilla (50). More
recently we have demonstrated a highly specific, rapid equi-
librium interaction between these proteins under conditions
of energy transfer (17). A summary of these results is shown in Table IV.
The bioluminescence system in coelenterates is the second
biological system to be described in which radiationless energy
transfer is known to play a key functional role. Energy transfer
is better known, however, for its function in photosynthesis
(55). Here, absorbed light energy is transferred from chloro- phylls and from various accessory proteins to the photosyn-
thetic reaction centers. These “antenna” molecules, through
energy transfer, extend the effective absorption cross-section
of the reaction center, greatly increasing photosynthetic effi-
ciency. The study of energy transfer in plant systems is
limited, to an extent, by the complexity of the photosynthetic
machinery (56). It has not been possible, for example, to fully reconstitute an in vitro energy transfer system from the
isolated and purified proteins of a photosynthetic system,
although partial success in this area has been recently
achieved (57). Such limitations are not as prominent in the
relatively simple bioluminescence system we have just de-
scribed. We believe that further research on the function of
energy transfer in bioluminescence, in addition to helping
explain how organisms ,produce light more efficiently, may eventually help to explain how organisms utilize solar energy
more efficiently.
Acknowledgments-We wish to thank Dr. d. Wampler and M. Elstein who initiated the characterization of this protein. We also thank H. Charbonneau and Dr. R. Hart who participated in quantum yield determinations. Pure luciferase was provided by Dr. <J. Matthews and luciferin was synthesized by Dr. K. Hori and Dr. K. Hart. Computer programs were provided by Dr. J. Wampler for the calcu- lation of molecular weights from sedimentation equilibrium data. Assistance with protein purification was provided by K. McCann and M. DeSa. Amind acid analyses were performed with the assistance of Dr. J. Travis. and sedimentation analvses with the aid of 1)r. .J. Brewer
REFKRENCES
1. Cormier, M. J., Hori, K., and Anderson, J. M. (1974) Biochim. Biophys. Actn 346, 137-164
2. Cormier, M. J., Lee, J., and Wampler, J. E. (1975) Annu. Rec. Biochem. 44,255-272
3. Anderson, J. M., Charbonneau, H., and Cormier, M. J. (1974) Biochemistry 13, 1195-1200
4. Cormier, M. J., and Charbonneau, H. (1977) in Calcium Bindzng Proteins and Cnlcium Function (Wasserman, Ii. H., Corradino, R. A., Carafoli, E., Kretsinger, K. H., MacLennan, D. H., and Siegel, F. L., eds) pp. 481-490, Elsevier, North Holland, Inc.,
by guest on March 16, 2020
http://ww
w.jbc.org/
Dow
nloaded from
788 An Energy Transfer Protein in Bioluminescence
Amsterdam 30. Goa, J. (1958) &and. J. Clin. Lab. Invest. 5, 218 5. Charbonneau, H., and Cormier, M. J. (1979) J. Biol. Chem. 254, 31. Spackman, D. H., Stein, W. H., and Moore, S. (1958) Anal. Chem.
769-780 30, 1190-1206 6. Matthews, J. C., Hori, K., and Cormier, M. J. (1977) Biochemistry 32. Matsubara, H., and Sasaki, R. M. (1969) Biochem. Biophys. Res.
16, 85-91 Commun. 35, 175-181 7. Cormier, M. J., Hori, K., Karkhanis, Y. D., Anderson, J. M., 33. Moore, S. (1963) J. Biol. Chem. 238, 235-237
Wampler, J. E., Morin, J. G., and Hastings, J. W. (1973) J. Cell. 34. Hirs, C. H. W. (1967) Methods Enzymol. l&59-62 Physiol. 81,291-297 35. Crestfield, A. M., Moore, S., and Stein, W. H. (1963) J. Biol.
8. Shimomura, O., Johnson, F. H., and Saiga, Y. (1962) J. Cell. Chem. 238, 622-627
9.
10.
11.
12.
13.
14.
15.
16.
17.
18. 19. 20.
21.
22
23
Comp. Physiol. 59,223-239 Morin, J. G., and Hastings, J. W. (1971) J. Cell. Physiol. 77,
313-318 Shimomura, O., and Johnson, F. H. (1966) in Bioluminescence in
Progress (Johnson, F. H., and Haneda, Y., eds) pp. 495-521, Princeton University Press, Princeton, N. J.
Ward, W. W., and Cormier, M. J. (1975) Proc. Natl. Acad. Sci. U. S. A. 72,2530-2534
Johnson, F. H., Shimomura, O., Saiga, Y., Gershman, L. C., Reynolds, G. T., and Waters, J. R. (1962) J. Cell. Comp. Physiol. 60,85-103
Morise, H., Shimomura, O., Johnson, F. H., and Winant, J. (1974) Biochemistry 14,2656-2662
Ward, W. W., and Cormier, M. J. (1976) J. Phys. Chem. 80, 2289-2291
Wampler, J. E., Hori, K., Lee, J., and Cormier, M. J. (1971) Biochemistry 10, 2903-2909
Wampler, J. E., Karkhanis, Y. D., Hori, K., and Cormier, M. J. (1972) Fed. Proc. 31,419
Ward, W. W., and Cormier, M. J. (1978) Photochem. Photobiol. 27,389-396
Porath, J. (1963) Pure Appl. Chem. 6,233-244 Schachman. H. K. (1957) Methods Enzvmol. 4.32-103 Beckman Instruction Manual E-TB-065, pp. ‘1.1-5.1, Beckman
Instrument Co., Palo Alto, Calif. Cohn, E. J., and Edsall, J. T. (1943) in Proteins, Amino Acids,
and Peptides, p. 375, Van Nostrand Reinhold Co., New York Brewer, J. M., Pesce, A. J., and Ashworth, R. B. (1974) in
Experimental Techniques in Biochemistry, pp. 161-215, Pren- tice-Hall, Inc., Englewood Cliffs, N. J.
Mann, K. G., and Fish, W. W. (1972) Methods Enzymol. 26C, 28-42
24. Neville, D. M., Jr. (1971) J. Biol. Chem. 246,6328-6334 25. Wrigley, C. W. (1971) Methods Enzymol. 22,559-564 26. Babul, J., and Stellwagen, E. (1969) Anal. Biochem. 28,216-221 27. Wampler, J. E., and DeSa, R. J. (1971) Appl. Spectrosc. 25,
623-627 28. Melhuish, W. H. (1961) J. Phys. Chem. 65, 229-235 29. Gornall, A. G., Bardawill, C. J., and David, M. M. (1949) J. Biol.
Chem. 177, 751-766
36. Allen, K., and Neuberger, A. (1975) FEBS Lett. 60, 76-80 37. Ellman, G. L. (1959) Arch. Biochem. Biophys. 82, 70-77 38. Dubois, M., Gilles, K. A., Hamilton, J. K., Rebers, P. A., and
Smith, F. (1956) Anal. Chem. 28, 350-356 39. Zacharius, R. M., ZeIl, T. E., Morrison, J. H., and Woodlock, J. J.
(1969) Anal. Biochem. 30, 148-152 40. Makula, R. A., and Finnerty, W. R. (1974) J. Bacterial. 120,
1279-1283 41. Scott, C. C. L., Makula, R. A., and Finnerty, W. R. (1976) J.
Bacterial. 127, 469-480 42. Chen, P., Tribara, T., and Warner, H. (1976) Anal. Chem. 28,
1756-1758 43. Ames, B. N., and Dubin, D. T. (1960) J. Biol. Chem. 235,769-775 44. Ward, W. W., and Cormier, M. J. (1978) Methods Enzymol. 57.
257-268 45. Wampler, J. E. (1975) in Analytical Applications of Biolumines-
cence and Chemiluminescence (ChappeIIe. E. W.. and Picciolo.
46. Hori, K., Wampler, J. E., Matthews, J. C., and Cormier, M. J.
G. L., eds) N.A.S.A. publication SPI388, i. 105-i14, N.A.S.A.;
(1973) Biochemistry 12,4463-4468 47. DaSa, R. J. (1970) Anal. Biochem. 35,293-296 48. Karkhanis, Y. D., and Cormier. M. J. (1971) Biochemistry 10.
Washington, D. C.
317-326. ” I
49. Matthews, J. C., Hori, K., and Cormier, M. J. (1977) Biochemistry 16.5217-5220
50. Ward, W. W., and Cormier, M. J. (1976) Abstracts of the Fourth Annual Meeting of the American Society of Photobiology, Denver, Colorado, p. 121
51. Gabriel, 0. (1971) Methods Enzymol. 22, 565-578 52. Wampler, J. E., Karkhanis, Y. D., Morin, J. G., and Cormier, M.
J. (1973) Biochim. Biophys. Acta 314, 104-109 53. Hori, K., Charbonneau, H., Hart, R. C., and Cormier, M. J. (1977)
Proc. Natl. Acad. Sci. U. S. A. 74,4285-4287 54. Fb;rster, T. (1959) Faraday Sot. Trans. 27, 7-17 55. Clayton, R. K. (1971) Light and Living Mutter, Vol. 2: The
Biological Part, McGraw-Hi& Inc., New York 56. Gantt, E. (1977) Photochem. Photobiol. 26,685-687 57. Koka, P., and Song, P.-S. (1977) Biochim. Biophys. Acta 495,
220-231
by guest on March 16, 2020
http://ww
w.jbc.org/
Dow
nloaded from
W W Ward and M J Cormierthe Renilla green-fluorescent protein.
An energy transfer protein in coelenterate bioluminescence. Characterization of
1979, 254:781-788.J. Biol. Chem.
http://www.jbc.org/content/254/3/781.citation
Access the most updated version of this article at
Alerts:
When a correction for this article is posted•
When this article is cited•
to choose from all of JBC's e-mail alertsClick here
http://www.jbc.org/content/254/3/781.citation.full.html#ref-list-1
This article cites 0 references, 0 of which can be accessed free at
by guest on March 16, 2020
http://ww
w.jbc.org/
Dow
nloaded from