Embed Size (px)
Citation preview
International Research Journal of Engineering and Technology (IRJET) e-ISSN: 2395 -0056
Volume: 04 Issue: 01 | Jan -2017 www.irjet.net p-ISSN: 2395-0072
© 2017, IRJET | Impact Factor value: 5.181 | ISO 9001:2008 Certified Journal | Page 1344
AN ENHANCED TECHNIQUE FOR NETWORK TRAFFIC CLASSIFICATION
WITH UNKNOWN FLOW DETECTION
Jaskirat Singh1, Ms. Maninder Kaur2
M.tech Student, Doaba institute of engineering & technology, Ghataur,Punjab , India HOD ( M.tech), Doaba institute of engineering & technology, Ghataur,Punjab , India
---------------------------------------------------------------------***---------------------------------------------------------------------
Abstract - — In a wireless network it is very important to provide the network security and quality of service. To achieve these parameters there must be proper traffic classification in the wireless network. There are many algorithms used such as port number, deep packet inspection as the earlier method, KISS, nearest cluster based classifier (NCC), SVM method are used to classify the traffic and improve the network security and quality of service of a network. In this work, we aim to tackle the problem of unknown flows in a WSN. This work considers very few labeled training samples and investigates flow correlation in real world network environment, which makes it better to the previous work.
Key Words: Traffic classification, unknown flow detection, network security, SVM, Deep packet inspection. , KISS, NCC, Training purity.
1. INTRODUCTION 1.1 A wireless sensor network
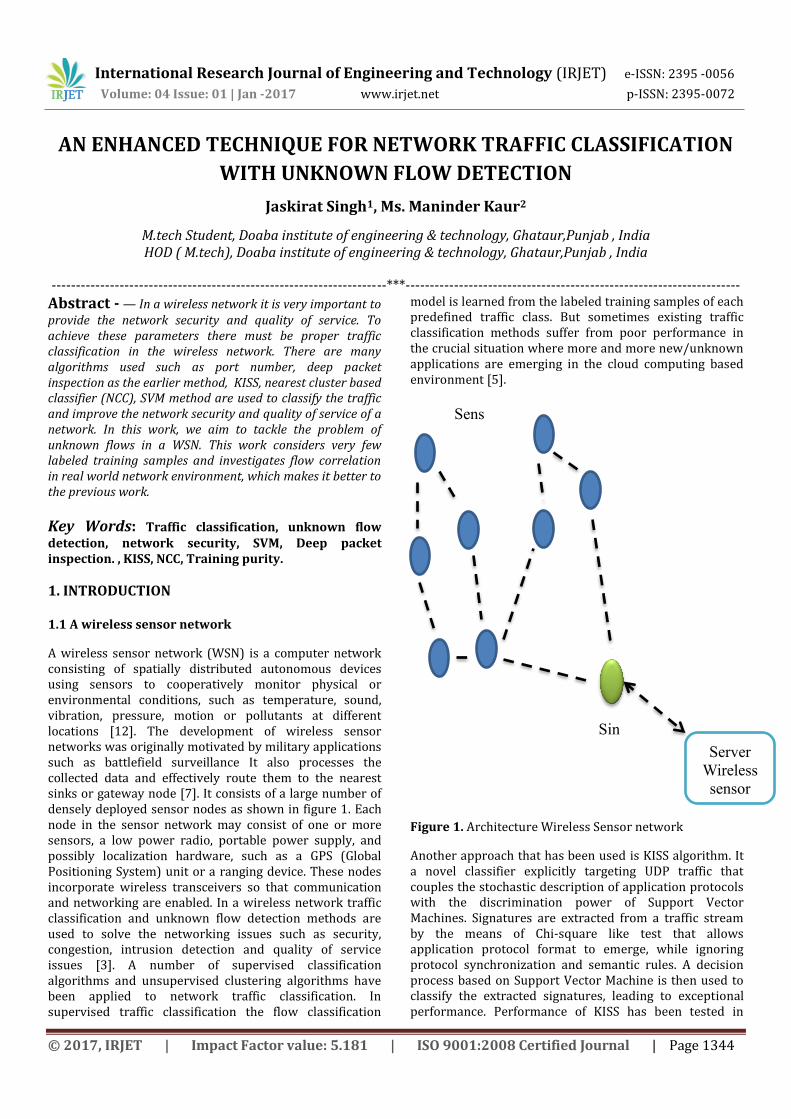
A wireless sensor network (WSN) is a computer network consisting of spatially distributed autonomous devices using sensors to cooperatively monitor physical or environmental conditions, such as temperature, sound, vibration, pressure, motion or pollutants at different locations [12]. The development of wireless sensor networks was originally motivated by military applications such as battlefield surveillance It also processes the collected data and effectively route them to the nearest sinks or gateway node [7]. It consists of a large number of densely deployed sensor nodes as shown in figure 1. Each node in the sensor network may consist of one or more sensors, a low power radio, portable power supply, and possibly localization hardware, such as a GPS (Global Positioning System) unit or a ranging device. These nodes incorporate wireless transceivers so that communication and networking are enabled. In a wireless network traffic classification and unknown flow detection methods are used to solve the networking issues such as security, congestion, intrusion detection and quality of service issues [3]. A number of supervised classification algorithms and unsupervised clustering algorithms have been applied to network traffic classification. In supervised traffic classification the flow classification
model is learned from the labeled training samples of each predefined traffic class. But sometimes existing traffic classification methods suffer from poor performance in the crucial situation where more and more new/unknown applications are emerging in the cloud computing based environment [5].
Figure 1. Architecture Wireless Sensor network
Another approach that has been used is KISS algorithm. It a novel classifier explicitly targeting UDP traffic that couples the stochastic description of application protocols with the discrimination power of Support Vector Machines. Signatures are extracted from a traffic stream by the means of Chi-square like test that allows application protocol format to emerge, while ignoring protocol synchronization and semantic rules. A decision process based on Support Vector Machine is then used to classify the extracted signatures, leading to exceptional performance. Performance of KISS has been tested in
Sens
or
Sin
k Server
Wireless
sensor
network
International Research Journal of Engineering and Technology (IRJET) e-ISSN: 2395 -0056
Volume: 04 Issue: 01 | Jan -2017 www.irjet.net p-ISSN: 2395-0072
© 2017, IRJET | Impact Factor value: 5.181 | ISO 9001:2008 Certified Journal | Page 1345
different scenarios, considering both data, VoIP, traditional P2P applications and novel P2PTV systems [3]. This work considers very few labeled training samples and investigates flow correlation in real world network environment, which makes it better to the previous works.
1.2 Ad hoc network An ad hoc network is a network that is composed of individual devices communicating with each other directly. The term implies spontaneous construction because these networks often bypass the gate keeping hardware or central access point such as a router. Many ad hoc networks are local area networks where computers or other devices are used to send data directly to one another rather than going through a centralized access point.
Figure 2. An Ad hoc network The idea of an ad hoc network is often unfamiliar to end users who have only seen small residential or business networks that use a typical router to send wireless signals to individual computers. The ad hoc network is being used quite a bit in new types of wireless engineering, although until recently it was a rather esoteric idea. However, a mobile ad hoc network involves mobile devices communicating directly with one another. Another type of ad hoc network, the vehicular ad hoc network, involves placing communication devices in cars.
2. LITERATURE SURVEY The goal of network traffic classification is to classify traffic flows according to their generation applications. The current research of traffic classification concentrates on the application of machine learning techniques into flow statistical feature based classification methods [2]. The flow statistical feature based traffic classification can avoid the problems suffered by previous approaches such as dynamic ports, encrypted applications and user privacy protection. Many supervised classification algorithms have been applied to traffic classification by taking into account various network applications and situations. The state-of-heart traffic classification methods aim to take the advantages of flow statistical features and machine
learning techniques, however the classification performance is severely affected by limited supervised information and unknown applications. The flow statistical feature based traffic classification can avoid the problems suffered by previous approaches such as dynamic ports, encrypted applications and user privacy protection. In general, the Nearest-Neighbor (NN) based approaches provide better classifier performance, but this is not possible when the size of training data is small. used for automatic recognition of unknown applications. The port-based prediction methods and payload-based deep inspection methods comes under Traditional methods. The standard strategies in current network environment suffer from variety of privacy issues, dynamic ports and encrypted applications. Recent research efforts are focused on traffic classification and Machine Learning Techniques are used for classification.
3. PROPOSED SYSTEM
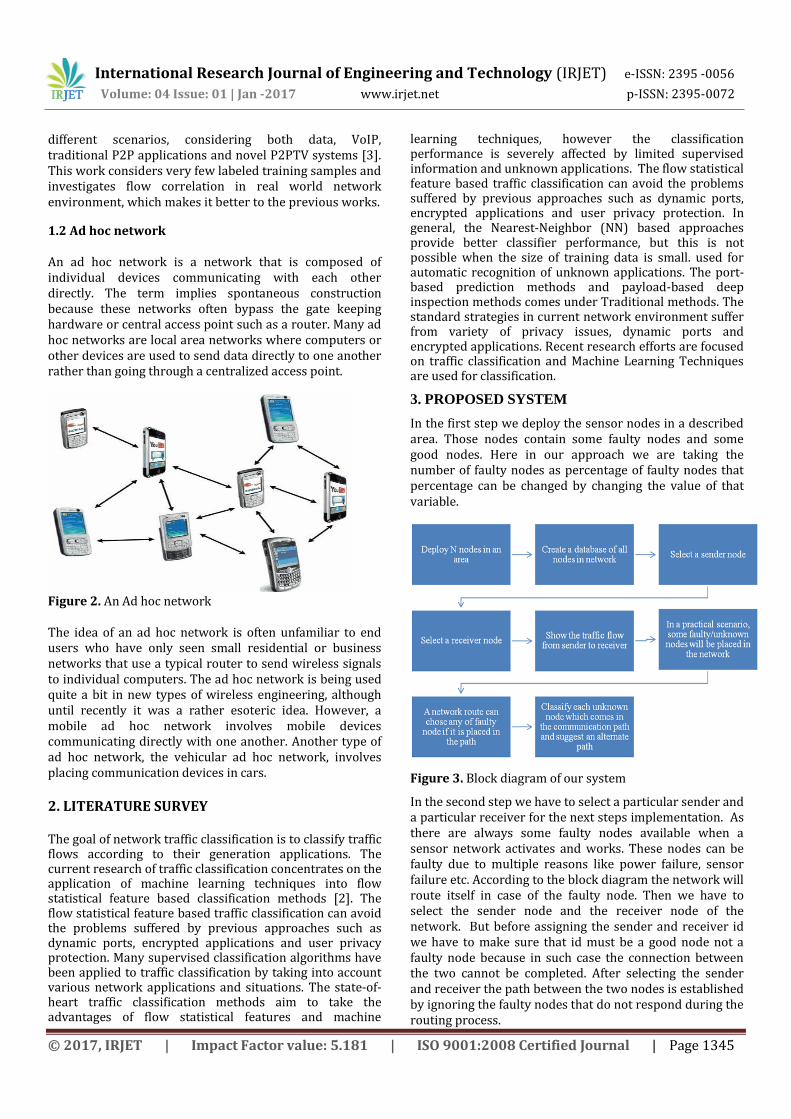
In the first step we deploy the sensor nodes in a described area. Those nodes contain some faulty nodes and some good nodes. Here in our approach we are taking the number of faulty nodes as percentage of faulty nodes that percentage can be changed by changing the value of that variable.
Figure 3. Block diagram of our system
In the second step we have to select a particular sender and a particular receiver for the next steps implementation. As there are always some faulty nodes available when a sensor network activates and works. These nodes can be faulty due to multiple reasons like power failure, sensor failure etc. According to the block diagram the network will route itself in case of the faulty node. Then we have to select the sender node and the receiver node of the network. But before assigning the sender and receiver id we have to make sure that id must be a good node not a faulty node because in such case the connection between the two cannot be completed. After selecting the sender and receiver the path between the two nodes is established by ignoring the faulty nodes that do not respond during the routing process.
International Research Journal of Engineering and Technology (IRJET) e-ISSN: 2395 -0056
Volume: 04 Issue: 01 | Jan -2017 www.irjet.net p-ISSN: 2395-0072
© 2017, IRJET | Impact Factor value: 5.181 | ISO 9001:2008 Certified Journal | Page 1346
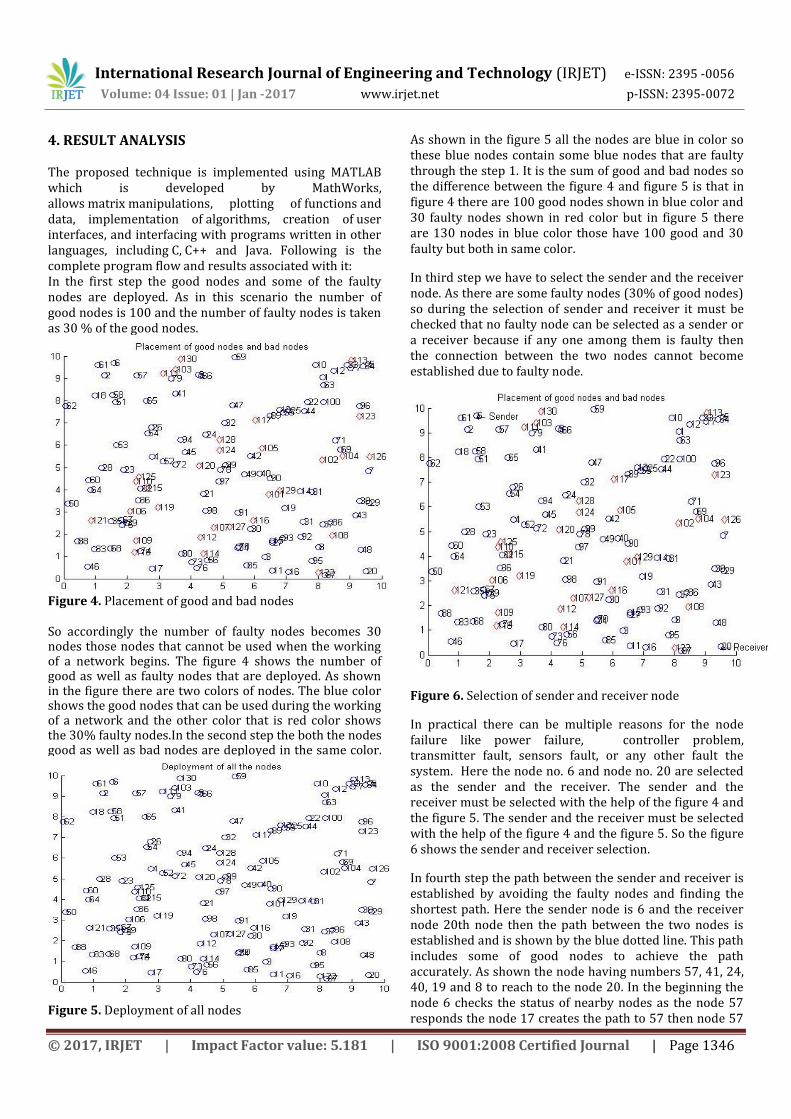
4. RESULT ANALYSIS The proposed technique is implemented using MATLAB which is developed by MathWorks, allows matrix manipulations, plotting of functions and data, implementation of algorithms, creation of user interfaces, and interfacing with programs written in other languages, including C, C++ and Java. Following is the complete program flow and results associated with it: In the first step the good nodes and some of the faulty nodes are deployed. As in this scenario the number of good nodes is 100 and the number of faulty nodes is taken as 30 % of the good nodes.
Figure 4. Placement of good and bad nodes So accordingly the number of faulty nodes becomes 30 nodes those nodes that cannot be used when the working of a network begins. The figure 4 shows the number of good as well as faulty nodes that are deployed. As shown in the figure there are two colors of nodes. The blue color shows the good nodes that can be used during the working of a network and the other color that is red color shows the 30% faulty nodes.In the second step the both the nodes good as well as bad nodes are deployed in the same color.
Figure 5. Deployment of all nodes
As shown in the figure 5 all the nodes are blue in color so these blue nodes contain some blue nodes that are faulty through the step 1. It is the sum of good and bad nodes so the difference between the figure 4 and figure 5 is that in figure 4 there are 100 good nodes shown in blue color and 30 faulty nodes shown in red color but in figure 5 there are 130 nodes in blue color those have 100 good and 30 faulty but both in same color.
In third step we have to select the sender and the receiver node. As there are some faulty nodes (30% of good nodes) so during the selection of sender and receiver it must be checked that no faulty node can be selected as a sender or a receiver because if any one among them is faulty then the connection between the two nodes cannot become established due to faulty node.
Figure 6. Selection of sender and receiver node
In practical there can be multiple reasons for the node failure like power failure, controller problem, transmitter fault, sensors fault, or any other fault the system. Here the node no. 6 and node no. 20 are selected as the sender and the receiver. The sender and the receiver must be selected with the help of the figure 4 and the figure 5. The sender and the receiver must be selected with the help of the figure 4 and the figure 5. So the figure 6 shows the sender and receiver selection.
In fourth step the path between the sender and receiver is established by avoiding the faulty nodes and finding the shortest path. Here the sender node is 6 and the receiver node 20th node then the path between the two nodes is established and is shown by the blue dotted line. This path includes some of good nodes to achieve the path accurately. As shown the node having numbers 57, 41, 24, 40, 19 and 8 to reach to the node 20. In the beginning the node 6 checks the status of nearby nodes as the node 57 responds the node 17 creates the path to 57 then node 57
International Research Journal of Engineering and Technology (IRJET) e-ISSN: 2395 -0056
Volume: 04 Issue: 01 | Jan -2017 www.irjet.net p-ISSN: 2395-0072
© 2017, IRJET | Impact Factor value: 5.181 | ISO 9001:2008 Certified Journal | Page 1347
check the status of its nearby nodes than the node 41 responds and during this process the faulty node is found that is node number 128 shown by the path of red color. So the node 41 receives two responses among them one is faulty so the node 41 ignores the faulty node and connects to the node 24, in this way each next node checks its nearby nodes status and successfully path between sender and receiver establishes as shown in figure 7. When the path between the sender and the receiver completes then the results for the system is obtained by the different parameters of the system design. There are three parameters that we are considering here to evaluate the system performance. The three parameters are the propagation rate, training purity and accuracy of the system.
Figure 7. Path establishment from sender to receiver
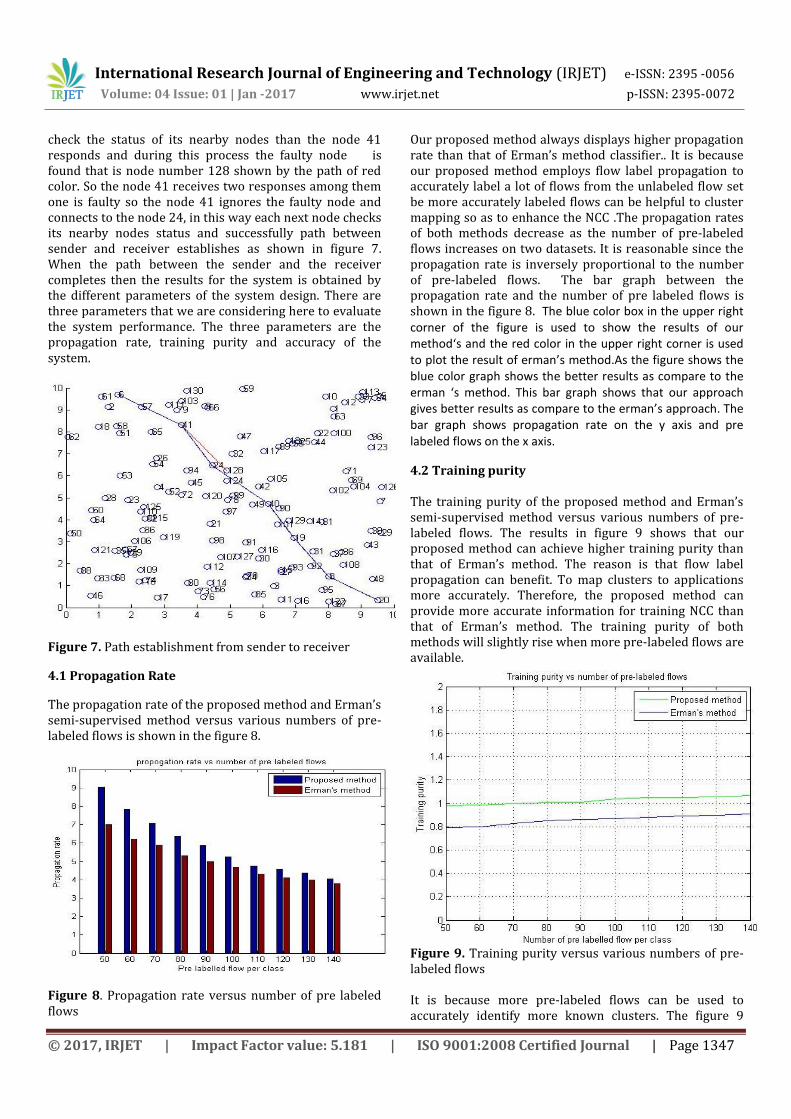
4.1 Propagation Rate
The propagation rate of the proposed method and Erman’s semi-supervised method versus various numbers of pre-labeled flows is shown in the figure 8.
Figure 8. Propagation rate versus number of pre labeled flows
Our proposed method always displays higher propagation rate than that of Erman’s method classifier.. It is because our proposed method employs flow label propagation to accurately label a lot of flows from the unlabeled flow set be more accurately labeled flows can be helpful to cluster mapping so as to enhance the NCC .The propagation rates of both methods decrease as the number of pre-labeled flows increases on two datasets. It is reasonable since the propagation rate is inversely proportional to the number of pre-labeled flows. The bar graph between the propagation rate and the number of pre labeled flows is shown in the figure 8. The blue color box in the upper right corner of the figure is used to show the results of our method‘s and the red color in the upper right corner is used to plot the result of erman’s method.As the figure shows the blue color graph shows the better results as compare to the erman ‘s method. This bar graph shows that our approach gives better results as compare to the erman’s approach. The bar graph shows propagation rate on the y axis and pre labeled flows on the x axis.
4.2 Training purity The training purity of the proposed method and Erman’s semi-supervised method versus various numbers of pre-labeled flows. The results in figure 9 shows that our proposed method can achieve higher training purity than that of Erman’s method. The reason is that flow label propagation can benefit. To map clusters to applications more accurately. Therefore, the proposed method can provide more accurate information for training NCC than that of Erman’s method. The training purity of both methods will slightly rise when more pre-labeled flows are available.
Figure 9. Training purity versus various numbers of pre-labeled flows It is because more pre-labeled flows can be used to accurately identify more known clusters. The figure 9
International Research Journal of Engineering and Technology (IRJET) e-ISSN: 2395 -0056
Volume: 04 Issue: 01 | Jan -2017 www.irjet.net p-ISSN: 2395-0072
© 2017, IRJET | Impact Factor value: 5.181 | ISO 9001:2008 Certified Journal | Page 1348
shows the training purity on the y axis and the pre labeled flows on the x axis of the figure. Number of pre labled flows is taken from 50 to 140 with the gap of 10. The green color line in the upper right corner shows the results for the proposed method and the blue color line in the upper right corner is used to plot the results of the erman‘s method results. As shown the training purity increases as the pre labeled flows increases. The proposed method shows more training purity as compare to earlier used method.
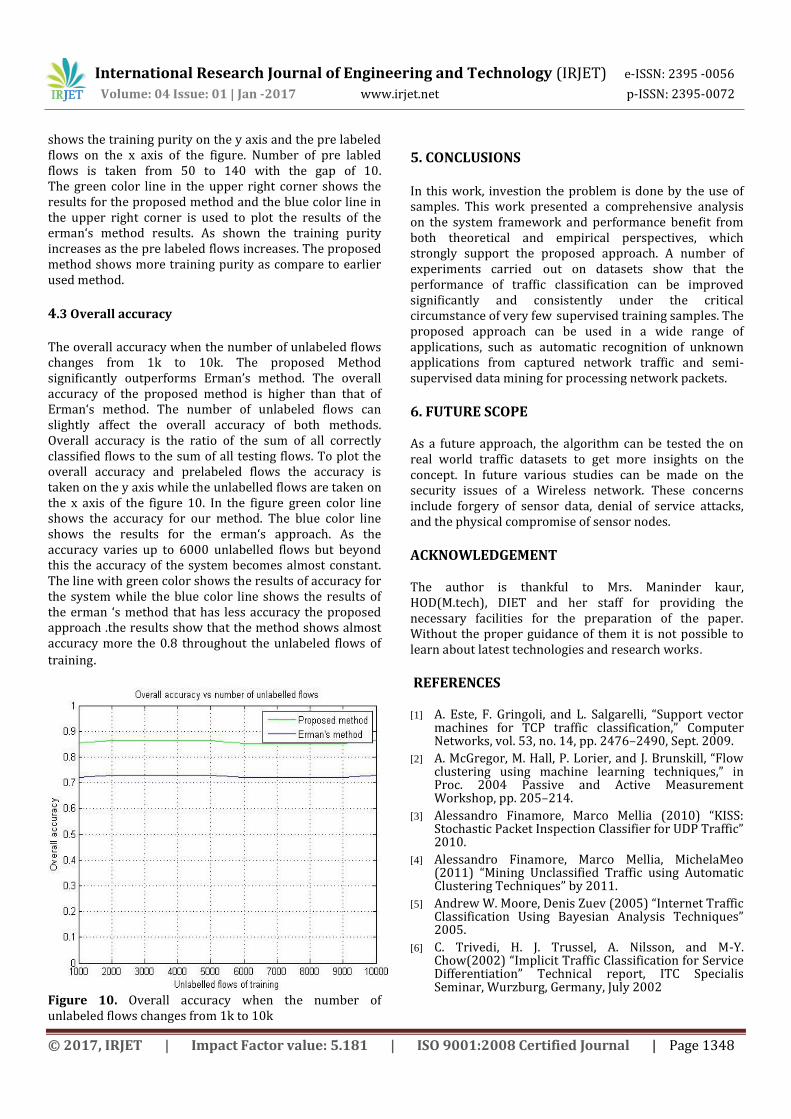
4.3 Overall accuracy
The overall accuracy when the number of unlabeled flows changes from 1k to 10k. The proposed Method significantly outperforms Erman’s method. The overall accuracy of the proposed method is higher than that of Erman‘s method. The number of unlabeled flows can slightly affect the overall accuracy of both methods. Overall accuracy is the ratio of the sum of all correctly classified flows to the sum of all testing flows. To plot the overall accuracy and prelabeled flows the accuracy is taken on the y axis while the unlabelled flows are taken on the x axis of the figure 10. In the figure green color line shows the accuracy for our method. The blue color line shows the results for the erman‘s approach. As the accuracy varies up to 6000 unlabelled flows but beyond this the accuracy of the system becomes almost constant. The line with green color shows the results of accuracy for the system while the blue color line shows the results of the erman ‘s method that has less accuracy the proposed approach .the results show that the method shows almost accuracy more the 0.8 throughout the unlabeled flows of
training.
Figure 10. Overall accuracy when the number of unlabeled flows changes from 1k to 10k
5. CONCLUSIONS In this work, investion the problem is done by the use of samples. This work presented a comprehensive analysis on the system framework and performance benefit from both theoretical and empirical perspectives, which strongly support the proposed approach. A number of experiments carried out on datasets show that the performance of traffic classification can be improved significantly and consistently under the critical circumstance of very few supervised training samples. The proposed approach can be used in a wide range of applications, such as automatic recognition of unknown applications from captured network traffic and semi-supervised data mining for processing network packets.
6. FUTURE SCOPE As a future approach, the algorithm can be tested the on real world traffic datasets to get more insights on the concept. In future various studies can be made on the security issues of a Wireless network. These concerns include forgery of sensor data, denial of service attacks, and the physical compromise of sensor nodes.
ACKNOWLEDGEMENT The author is thankful to Mrs. Maninder kaur, HOD(M.tech), DIET and her staff for providing the necessary facilities for the preparation of the paper. Without the proper guidance of them it is not possible to learn about latest technologies and research works.
REFERENCES [1] A. Este, F. Gringoli, and L. Salgarelli, “Support vector
machines for TCP traffic classification,” Computer Networks, vol. 53, no. 14, pp. 2476–2490, Sept. 2009.
[2] A. McGregor, M. Hall, P. Lorier, and J. Brunskill, “Flow clustering using machine learning techniques,” in Proc. 2004 Passive and Active Measurement Workshop, pp. 205–214.
[3] Alessandro Finamore, Marco Mellia (2010) “KISS: Stochastic Packet Inspection Classifier for UDP Traffic” 2010.
[4] Alessandro Finamore, Marco Mellia, MichelaMeo (2011) “Mining Unclassified Traffic using Automatic Clustering Techniques” by 2011.
[5] Andrew W. Moore, Denis Zuev (2005) “Internet Traffic Classification Using Bayesian Analysis Techniques” 2005.
[6] C. Trivedi, H. J. Trussel, A. Nilsson, and M-Y. Chow(2002) “Implicit Traffic Classification for Service Differentiation” Technical report, ITC Specialis Seminar, Wurzburg, Germany, July 2002
International Research Journal of Engineering and Technology (IRJET) e-ISSN: 2395 -0056
Volume: 04 Issue: 01 | Jan -2017 www.irjet.net p-ISSN: 2395-0072
© 2017, IRJET | Impact Factor value: 5.181 | ISO 9001:2008 Certified Journal | Page 1349
[7] CHEE-YEE CHONG, MEMBER, IEEE AND SRIKANTA P. KUMAR(2003) “Sensor Networks: Evolution, Opportunities, and Challenges”, IEEE 2003
[8] Crotti, Maurizio Dusi (2007) “Traffic Classification through Simple Statistical Fingerprinting” 2007.
[9] Dinesh Kumar Gupta (2013) “A Review on Wireless Sensor Networks” 2013.
[10] H. Kim, KC. Claffy, M. Fomenkov, D. Barman, M. Faloutsos, K. Lee, “Internet traffic classification demystified: myths, caveats, and the best practices” Conference on Future Networking Technologies (CoNEXT’08), Madrid, Spain, December 2008
[11] I.F. Akyildiz, W. Su*, Y. Sankarasubramaniam “Wireless sensor networks: a survey” December 2001.
[12] J. Erman, M. Arlitt, and A. Mahanti, “Traffic classification using clustering algorithms,” in Proc. 2006 SIGCOMM Workshop on Mining Network Data, pp. 281–286
[13] J. Erman, A. Mahanti, and M. Arlitt, “Internet traffic identification using machine learning,” in Proc. 2006 IEEE Global Telecommunications Conference, pp. 1–6.
[14] Jamuna, Vinodh Ewards S.E (2013) “Efficient Flow based Network Traffic Classification using Machine Learning” IJERA 2013.
[15] Jun Zhang, Member, IEEE, Chao Chen, Student Member, IEEE, Yang Xiang, Senior Member, IEEE, Wanlei Zhou, Senior Member, IEEE, and Athanasios V. Vasilakos Senior Member, IEEE (2015) “An Effective Network Traffic Classification Method with Unknown Flow Detection” 2015.
[16] Jun Zhang(2013) “Network Traffic Classification Using Correlation Information” Issue No.01 - Jan. (2013 vol.24)
[17] K. Xu, Z. Zhang, S. Bhattacharyya, “Profiling internet backbone traffic: behavior models and applications,” ACM SIGCOMM 2005, Philadelphia, PA, pp. 169-180, August 2005.
[18] L. Bernaille and R. Teixeira, “Early recognition of encrypted applications,” in Proc. 2007 International Conference on Passive and Active Network Measurement, pp. 165–175.
[19] L. Bernaille, R. Teixeira, I. Akodkenou, A. Soule, and K. Salamatian, “Traffic classification on the fly,” SIGCOMM Comput. Commun. Rev., vol. 36, pp. 23–26, Apr. 2006.
[20] M. Roughan, S. Sen, O. Spatscheck, N. Duffield, “Class-of-service mapping for QoS: a statistical signature-based approach to IP traffic classification,” 4th ACM SIGCOMM Internet Measurement Conference (IMC’04), Taormina, IT, pp. 135-148, October 2004.
[21] Muhammad R Ahmed (2012) “Wireless sensor network characteristics and architecture”, 2012.
[22] Mukta Chandna, Bhawna Singla(2015) “Flooding v/s Gossiping” 2015.
[23] N. Williams, S. Zander, and G. Armitage, “A preliminary performance comparison of five machine learning algorithms for practical IP traffic flow classification,” SIGCOMM Comput. Commun. Rev., vol. 36, pp. 5–16, Oct. 2006
[24] Nguyen T. T. and Armitage G “A survey of techniques for internet traffic classification using machine learning,”., IEEE Commun. Surveys vol. 10, no. 4, pp. 56–76, Fourth Quarter.
[25] Prof. Dr. D.G. Harkut (2005) “A view of Network Traffic Classification Methods” 2005.
[26] Prof. Dr. D.G. Harkut (2015) “An Overview of Network Traffic Classification Methods” 2015.
BIOGRAPHIES
Jaskirat singh has received B.Tech degree in Electronics and Communication Engineering from Doaba Institute of Engineering and Technology, Ghataur, Punjab Technical University, Jalandhar, Punjab. He is currently pursuing M.Tech degree in Electronics and Communication Engineering from Doaba Institute of Engineering and Technology, I.K.Gujral Punjab Technical University, Jalandhar, Punjab.


![Virtual techdays INDIA │ 18-20 august 2010 IIS 7/7.5 Tips & Tricks Jaskirat Singh │ Technical Lead [IIS|Asp.Net team], Microsoft](https://img.pdfslide.net/doc/110x75/56649dd15503460f94ac76bf/virtual-techdays-india-18-20-august-2010-iis-775-tips-tricks-jaskirat.jpg)