Embed Size (px)
Citation preview

CANINE FAECES: THE MICROBIOLOGY OF
AN ENVIRONMENTAL HEALTH PROBLEM
Salah Attia Jaber
BSc., Omar Al-Mukhtar, El-Beida, Libya
MSc., Omar Al-Mukhtar, El-Beida, Libya
MPhil., University of Sheffield, England
Thesis submitted in partial fulfilment for the requirements of the
Degree of Doctor of Philosophy in the Department of Molecular
Biology and Biotechnology, University of Sheffield, UK.
September 2012

II
Salah Jaber Molecular Biology and Biotechnology
CANINE FAECES: THE MICROBIOLOGY OF AN ENVIRONMENTAL HEALTH PROBLEM
Molecular Biology and Biotechnology Milton Wainwright
Salah Jaber Molecular Biology and Biotechnology
Salah Jaber Molecular Biology and Biotechnology
090230389
29.08.2012
29.08.2012
29.08.2012
Dedication
I dedicate this thesis to my family, especially to my mother and to my father‟s soul. To
my wonderful wife Maryam Al-Magasbi, who supported me during every step of the
way. To my children Azizza, Attia and Mohammed, thank you for patience and
understanding. Finally, to all my teachers, my brothers, my sisters and my friends and
my neighbours; I respect you all and, I dedicate my modest work to you.

II
Acknowledgments
First and foremost, I would like to thank Almighty Allah for giving me the patience and
determination to carry out and conclude this Thesis. This research project would not
have 1 been possible without the support of many people. I wish to express my gratitude
to my wonderful supervisor, Prof. Milton Wainwright who was extremely helpful and
offered invaluable assistance, support, comments, encouragement and guidance.
Deepest gratitude is also due to my advisor, Dr Jim Gilmour and Dr. Lynda Partridge
for their valuable advice and suggestion during annual meetings. Not forgetting the
members of the supervisory committee, whose suggestion and criticism was highly
significant in accomplishing this thesis. I express my appreciation to cultural attaché of
Libyan embassy, namely Dr. Abdel- Basit Gadour for tremendous support and
encouragement. Dr Sulaiman Al-Naimat, Dr Khalid Al-Abri, Dr Adham Elshawaihde,
Krys Bangret and Dr Rada all deserve special credit for their good company and
assistance.
The author would also like to convey thanks to my tutor, Dr. James Foley from ELTC
for encouragement and help, Words of credits should also go to Mr. Chris Hill for his
assistance in electron microscopy also to Mr. Simon J Thorpe for his assistance in
GC/MS experiments.
Finally, an honourable mention goes to my family and friends for their understandings and supports
on me in completing this project. Special thanks also to all my friends in Prof Wainwright‟s
laboratory, particularly for my best friends Sultan Al-sharari, Khalid Al-Quthami, Sami
Alyahya, Waleed Al- Waneen and Mamdouh Bukari.

III
Abstract
The overall aim of the research work reported in this Thesis was to study a variety of
aspects of dog faeces in relation to public health, their fertilizer potential and possibility
that such faeces might be remediated using larvae, ultimately to provide a source of
biodiesel. The results can be summarized as follows:
1) Dog faeces were shown to be source of pathogenic bacteria, notably Escherichia.
coli and Salmonella. These bacteria were shown to be transferred to the soil of a local
playing field by direct, in situ, transfer from dog faeces undergoing weathering. E. coli
and Salmonella enterica were isolated from all four sites while no such isolates were
obtained from the fifth location which was uncontaminated with dog faeces
2) It was shown here that “common or garden” slugs can transfer potentially pathogenic
bacteria from dog faeces to lettuce.
3) The feeding of Black Soldier Fly Larvae on faeces led to a statistically significant
increase in the number of bacteria inside the BSFL gut and the same trend was seen in
relation to dog faeces fed Fruit Beetle Larvae. This trend of increasing bacterial
numbers in larvae fed on dog faeces is particularly worrying in relation to the potential
feeding of these larvae to animals- post exposure to faeces.
4) Dog faeces were shown to have potential inherent fertilizer content; the nutrients
present being released over a time period mimicking the natural weathering of dog
faeces in the environment.
5) As a generalization, the addition of both types of larvae to dog faeces significantly
reduced the concentration of indigenous plant nutrients over the entire four week
incubation period; exceptions to this were nitrate and phosphate concentrations in BSFL
treated faeces, where significant increases were seen at week 4 and 3 respectively and in
faeces treated with FBL, where ammonium concentrations were significantly increased
at weeks 2-4, and phosphate at week 4. While the addition of both larvae therefore

IV
initially decreased levels of indigenous plant nutrients there was a trend in some of the
nutrients to increase the longer the incubation went on. This suggests that perhaps a
longer term exposure of dog faeces to the two larvae might have lead to increase in
ammonium, nitrate, sulphate and phosphate concentrations. The addition of ammonium,
elemental sulphur an insoluble phosphate to dog faeces which had been modified by the
two larvae led to significant increases in nitrate, sulphate and plant-available phosphate,
results which shows that that dog faeces contains the indigenous microflora required for
the transformation of these amendments (which simulate fertilizer addition). The results
suggest the possibility that larval modified dog faeces could be used as compost
additive fertilizer, or perhaps even be used as an agricultural soil fertilizer.
6) The potential for using fly larvae for the bioremediation of dog faeces was
investigated. Black Soldier Fly (BSFL) and Fruit Beetle (FBL) Fly larvae were shown
to dramatically improve the physical nature of canine faeces, even after only a short
exposure period, giving a bioremediated product which is markedly improved in terms
of texture, reduced odour and overall reduced offensiveness. The bioremediated dog
faeces product was also found to be suitable as potting compost when “diluted” with
proprietary potting compost.
7) The haemolymph and total body extracts of BSFL and FBL were shown to be
antibacterial.
8) The potential for using dog faeces and dog faeces which had been treated with BSFL
and FB as a source of biodiesel was determined. It was shown that potential biodiesel
precursors) (mainly fatty acids) were present both in the raw dog faeces and in faeces
which were treated with the two different larvae.
9) The number of bacteria present in dog faeces disposed of in plastic bags dramatically
increased over exposure to the UK summer, when temperatures were recorded between
10-270C.

V
Table of Contents
Dedication ........................................................................................................................... I
Acknowledgments .............................................................................................................. II
Abstract ............................................................................................................................ III
Table of Contents ............................................................................................................... V
List of Figures .................................................................................................................... X
List of Tables .................................................................................................................. XVI
Chapter One: Introduction ................................................................................................ 1
1.1. The environmental problem of canine faeces ......................................................... 2
1.2. Microbiology of dog faeces .................................................................................... 2
1.3. Parasites and diseases associated with canine faeces ............................................. 4
1.3.1. Toxoicariasis ................................................................................................... 4
1.3.2. Toxoplasma contamination of dog faeces ....................................................... 5
1.3.3. Other protozoan livestock parasite disease related to dog faeces ................... 6
1.3.3.1. Neosporosis .................................................................................................. 6
1.4. Chemical composition of dog faeces ...................................................................... 8
1.5. Transmission of pathogenic bacteria from dog faeces to human food ................. 10
1.6. Slugs and snails as intermediate host-vectors of pathogenic bacteria .................. 11
1.7. Waste composting ................................................................................................ 12
1.8. Composting and recycling of dogs waste ............................................................. 13
1.9. Bio-conversion of putrescent waste using BSFL ................................................. 14
1.9.1. The Black Soldier Fly life cycle ................................................................... 15
1.9.2. Bioconversion of dog faeces using Black Soldier Fly larvae (BSFL) .......... 15
1.9.3. The Texas Experimental BSF Composting Research Programme ............... 16
Over a period of one year, approximately 20% by weight of the fresh food waste is
converted into fresh larvae. This food waste had an average dry matter content of
37%, and the pre-pupae has an average dry matter content of 44%, i.e., on a dry
matter basis, the bioconversion of food waste situates at almost 24%. An input of
100 kg of food waste per day can be handled by three 6-foot bioconversion units.
................................................................................................................................. 16
1.14. Nitrification ........................................................................................................ 19

VI
1.14.1. The Nitrogen Cycle ..................................................................................... 19
1.14.4. Nitrate reduction.......................................................................................... 22
1.14.6. Assimilatory nitrate reduction ..................................................................... 23
1.15.1. Forms of S in soil ........................................................................................ 26
1.15.5. S-Mineralization .......................................................................................... 29
1.15.7. Sulphur oxidation ........................................................................................ 29
1.15.10. The phototrophic sulphur bacteria ............................................................ 33
1.17. Aims of the Work Reported in this Thesis ......................................................... 35
Chapter Two: Transfer of Bacteria by Invertebrate Slugs from Canine Faeces to Lettuce
......................................................................................................................................... 36
2.1. Introduction .......................................................................................................... 37
2.2. Materials and Methods ......................................................................................... 39
2.2.1. Slug culturing ................................................................................................ 39
2.2.2. Isolation of bacteria from dog faeces ............................................................ 39
2.2.3. Isolation of bacteria from slugs ..................................................................... 40
2.2.4 Isolation of bacteria from lettuce ................................................................... 42
2.2.5 Bacterial identification ................................................................................... 42
2.2.5.1 Identification of bacteria using Chromagar medium .................................. 42
2.2.5.2. Extraction of Genomic DNA ..................................................................... 43
2.2.5.3. Agarose preparation ................................................................................... 44
2.2.5.4. PCR amplification ...................................................................................... 44
2.2.5.5. Phylogenetic identification of unknown bacteria ....................................... 45
2.2. 6. Mycoplasma identification ........................................................................... 45
2.2.6.1. Samples description ................................................................................... 45
before BLASTn NCIMB database .......................................................................... 46
2.2.6.2. Detection of Mycoplasma .......................................................................... 47
2.2.6.3 Test samples preparation for PCR............................................................... 47
2.2.6.4 PCR amplification ....................................................................................... 47
2.2.6.5. Agarose gel electrophoresis ....................................................................... 49
2.2.7. Detection and identification of fungi ............................................................ 49
2.2.7.3. PCR amplification of fungal gene .............................................................. 50
2.2.8. Identification of unknown fungi.................................................................... 51
2.3. Results and Discussion ......................................................................................... 53
2.3.1. Transfer of bacteria by slugs to lettuce ......................................................... 53

VII
2.3.2. Bacteria isolated from dog faeces ................................................................. 53
2.3.3. Bacteria isolated from slugs .......................................................................... 54
2.3.3.1. Bacteria isolated from control slugs ........................................................... 54
2.3.3.2. Bacteria isolated from slugs fed on faeces ................................................. 55
2.3.3.4. Fungi isolated from dog faeces .................................................................. 55
2.3.4. Transmission of bacteria from dog faeces to lettuce ..................................... 55
2.3.5. Mycoplasma detection ................................................................................... 59
2.3.5.1. Attempts to isolate Mycoplasma from various samples ............................. 59
2.3.5.2. Comments on the detection of Mycoplasma using PCR procedure ........... 63
Chapter Three: Reduction in Bacterial Numbers in Dog Faeces Using Black Soldier Fly
and Fruit Beetle Larvae ................................................................................................... 64
3.1 Introduction ........................................................................................................... 65
3.2. Materials and Methods ......................................................................................... 67
3.2.1 Methods for bacterial isolation and identification ......................................... 67
3.2.2. Dog faeces and insects larvae collection ....................................................... 68
3.2.3. Bacterial isolation from dog faeces ............................................................... 69
3.2.4. Bacterial isolation from the larval gut ........................................................... 69
3.2.5. Determination of pH ..................................................................................... 69
3. 2. 6. Statistical analyses ...................................................................................... 70
3.3. Results and Discussion ......................................................................................... 72
3.3.1. Identification of bacteria associated with dog faeces and larvae .................. 72
Chapter Four: Modification of Canine Faeces by Black Soldier Fly and Fruit Beetle
Larvae in relation to Plant Nutrient Release and Potential Use of Modified Faeces as a
Compost Additive ............................................................................................................ 81
4.1 Introduction ......................................................................................................... 82
4.2. Materials and Methods ......................................................................................... 85
4.2.1. Sample collection .......................................................................................... 85
4.2.1.1. Samples collection from canine waste ....................................................... 85
4.2.1.2. Samples collected from treated dog faeces ................................................ 85
4.2.1.3. Effect of larvae on the nutrient content of dog faeces. .............................. 85
4.2.3. Nutrient transformations in modified dog faeces amended with ammonium
nitrate, sulphur and insoluble phosphate ................................................................. 86
4.2.3.1. Determination of ammonium–N (NH4+-N) in dog faeces .......................... 86

VIII
4.2.3.2. Determination of Nitrate – N (NO3--N) ..................................................... 87
4.2.3.3. Determination of Sulphate-SO42-
- S ........................................................... 87
4.2.3.4. Determination of phosphate solubilisation PO43-
-P ................................... 87
4.2.4.Measurement of the pH of dog faeces samples .............................................. 88
4.2.5. Determination of the effects of modified dog faeces as a compost additive on
plant seed germination and growth ......................................................................... 88
4.3. Results and Discussion ......................................................................................... 89
4.3.1. Effect of larvae on the texture of dog faeces................................................. 89
4.3.5. Determination of the effects of modified dog faeces as a compost additive on
plant seed germination and growth ......................................................................... 96
Chapter Five: The Antibacterial Activity of the Haemolymph and Whole Body Extracts
from BSFL and FBL against Four Species of Bacteria ..................................................... 99
5. 1 Introduction ........................................................................................................ 100
5.2. Materials and Methods ....................................................................................... 101
5.2.1. Culture of larvae .......................................................................................... 101
5.2.2. Antibacterial properties of BSF and FB larvae ........................................... 102
5.2.2.1. Collection of excretion/secretion (ES) from larval whole-body and
haemolymph .......................................................................................................... 102
5.2.2.2. Antibacterial assay ................................................................................... 102
5.2.3. Time killing curves for testing the bacterial activity .................................. 103
5.2.4. Bacterial culture .......................................................................................... 104
5.2.5. Transmission Electron Microscopy of Bacteria treated with haemolymph or
whole body secretions of the two larvae ............................................................... 104
5.2.6. Statistical analysis ....................................................................................... 105
5.3. Results and Discussion ....................................................................................... 105
Chapter Six: The Number of Bacteria in Grassed Soil of Public Parks Contaminated with
Dog Faeces and Effect of Faeces-Volatiles on Plant Growth. .......................................... 114
6. 1. Introduction ....................................................................................................... 115
6.2. Materials and methods ........................................................................................ 116
6.2.1. Samples collection from public parks ......................................................... 116
6.2.2. Effect of incubation of dog faeces in plastic bags left under ambient outside
conditions .............................................................................................................. 116
6.2.3 The effect of gasses (odour) from dog faeces on plant growth .................... 117
6.3 Results and Discussion ........................................................................................ 119

IX
6.3.1. Occurrence of E. coli and S. enterica in dog faeces contaminated grassed-
soil ......................................................................................................................... 119
6.3.2 Effect of leaving dog faeces in plastic bags on bacterial numbers .............. 120
6.3.3 The effect of the gasses (odour) released from dog faeces on the plant growth
............................................................................................................................... 122
Chapter Seven: Production of Biodiesel from Dog Waste by BSF and FB Larvae- A
Potential Solution To The Dog Faeces Problem .............................................................. 127
7.1. Introduction ........................................................................................................ 128
7.1.1. Fuels from wastes ........................................................................................ 128
7.1.2. Anaerobic digestion to methane .................................................................. 128
7.2. Materials and Methods ....................................................................................... 133
7.2.1. Samples collection ...................................................................................... 133
7. 2.2. Extraction of lipids ..................................................................................... 133
7.3. Results and Discussion ....................................................................................... 135
Chapter Eight: Final Discussion .................................................................................... 146
8.1 Final Discussion .................................................................................................. 147
8.2 Future work ......................................................................................................... 152
References ...................................................................................................................... 154
Wright, E. P. (1982). The occurrence of Campylobacter jejuni in dog faeces from
a public park. Journal of Hygiene 89: 191-194..................................................... 175
Appendices ..................................................................................................................... 176
Appendix One: Preparation of chemical solutions and reagents ............................... 177
Appendix Two: Identification of bacteria ................................................................. 181
Appendix Three: ANOVA tables .............................................................................. 197
Appendix Four: Turbo mass spectrometer GC/MS ................................................... 221

X
List of Figures
Fig 1. 1: Anticipated transfer pathways of E. coli O157 by slugs from an environmental
source to vegetable crops. ............................................................................................... 12
Fig 1. 2: The Nitrogen Cycle .......................................................................................... 25
Fig 1. 3: The Sulphur Cycle ............................................................................................ 27
Fig. 2. 1: Bacterial colonies isolated from dog faeces using Chromagar medium ......... 40
Fig. 2. 2: Section of digestive track of slug from where the samples were taken .......... 41
Fig. 2. 3: Isolation of Bacteria from slugs: (a) colonies inside slugs, and (b) colonies
from the outside of slugs. ................................................................................................ 41
Fig. 2. 4: Standard hyperladder I with 14 lanes indicates higher intensity bands, 1000
and 10,000 and each lane (5μl) provides 720ng of DNA (BIOLINE supplier). ............. 46
Fig. 2. 5: FinchTV software that manually adjusts errors of consensus sequences........ 46
Fig. 2. 6: Fungi isolated from dog faeces grown on a) PDA medium b) Czapek Dox ... 52
Fig. 2. 7: Purification of fungi speces; a) green mould; b) black mould on PDA medium
......................................................................................................................................... 52
Fig. 2. 8:.Extraction of genomic DNA of isolated bacterial species; (lane JS1)
Enterobacter amnigenus; (lane JS 2) Acinetobacter sp; (lane JS3) Comamonas sp; (lane
JS 4) Acinetobacter sp( lane L); hyper ladder and( lane JS5) Delftia sp ........................ 57
Fig. 2. 9: PCR- 16Sr RNA, amplification products of four isolated bacterial species
analyzed by electrophoresis in agarose gel lanes represent; ( lane L); hyper ladder;(lane
JS1) outside control slugs (Metallic blue); (lane JS 2) inside slugs fed on faeces (B);
(lane JS3) outside slugs fed on faeces( B); (lane JS 4) outside slugs fed on faeces (C);
(lane 5) contaminated lettuce(Pink-red). ......................................................................... 57

XI
Fig. 2. 10: Extraction of genomic DNA of isolated bacterial species; (lane L); hyper
ladder and (lane MR1) Delftia sp ; (lane MR 2) Staphylococcus lentus; (lane MR3)
E. coli .............................................................................................................................. 58
Fig. 2. 11: PCR-16Sr RNA, amplification products of isolated bacterial species
analyzed by electrophoresis in agarose gel lanes represent; ( lane L); hyper ladder;(lane
MR1), contaminated lettuce (Blue); (lane MR 2) Inside slugs fed on faeces (Metallic
blue ); (lane MR3), Inside slugs fed on faeces ( Pink-.red) ............................................ 58
Fig. 2. 12: Extraction of genomic DNA fungi species ; ( lane L); hyper ladder and (lane
6 and 7) fungi isolated from dog faeces .......................................................................... 60
Fig. 2. 13: PCR-18SrRNA, amplification products of fungal species analyzed by
electrophoresis in agarose gel lanes represent; ( lane L); hyper ladder; (lane5)
Trichoderma asperellum (lane 6) no result. .................................................................... 60
Fig. 2. 14: Polymerase chain reaction (PCR) detection of Mycoplasma species in Earth
worm samples, EZ-PCR-Mycoplasma test analyzed by electrophoresis in 2% agarose
gel; the lanes represent ( lane M); 1kb hyper ladder, ( lane 1); negative control(distilled
water). ; (lane 2); earth worm sample; (lane 3); negative result; (lane 4) positive control
......................................................................................................................................... 61
Fig. 2. 15: Polymerase chain reaction (PCR) detection of Mycoplasma species in Dog
faeces and lettuce samples, EZ-PCR- Mycoplasma test analyzed by electrophoresis in
2% agarose gel; the lanes represent ( lane L); 1kb hyper ladder, ( lane 1); negative
control (distilled water).; (lane 2); negative result; (lane 3); dog faeces samples ; (lane 4)
control lettuce; (lane 5); contaminated lettuce ................................................................ 61
Fig. 2. 16: Polymerase chain reaction (PCR) detection of Mycoplasma species in Dog
faeces and lettuce samples, EZ-PCR- Mycoplasma test analyzed by electrophoresis in
2% agarose gel; the lanes represent ( lane L); 1kb hyper ladder, ( lane 1); Outside
control slug (negative result) (lane 2); Outside contaminated slug; (lane 3); Outside
XII
control snails (lane 4) Outside contaminated snails (lane 5); Inside control slugs; (lane
6); Inside contaminated slugs; (lane 7); inside control snails (lane 8); Inside
contaminated snails (lane 9) negative control (distilled water) ...................................... 62
2); earth worm sample; (lane 3); negative result; (lane 4) positive control .................... 61
Fig. 3. 1: Black Soldier Fly larvae, 1
st instar .................................................................. 70
Fig. 3. 2: A Black Soldier Fly adult ................................................................................ 70
Fig. 3. 3: Fruit Beetle larvae 3rd
instar ............................................................................ 71
Fig. 3. 4:.Fruit Beetle pupae ........................................................................................... 71
Fig. 3. 5: Fruit Beetle adults ........................................................................................... 71
Fig. 3. 6: Escherichia coli grown on selective chromogenic agar E. coli media isolated
from dog faeces and larvae fed on dog faeces; a) HiCrome E. coli agar showing
purple/pink coloured colonies, b) Brilliance E. coli /Coliform agar showing blue
colonies. .......................................................................................................................... 73
Fig. 3. 7: Salmonella Spp grown on XLT-4 selective Salmonella agar medium............ 73
Fig. 3. 8: Colonies of bacteria grown on plate count agar medium ................................ 74
Fig. 3. 9: Two bacterial isolates showing different external morphology; a) cocci, b)
bacillus, observed by SEM. ............................................................................................. 74
Fig. 3. 10: Bacterial numbers in dog faeces grown on; a) plate count medium, b)HiCore
E. coli in and c) Salmonella medium after treatment with Black Soldier Fly larvae ...... 75
Fig. 3. 11:. Bacterial numbers from dog faeces, bacteria grown on; a) plate count
medium, b) HiCore E. coli medium and c) Salmonella medium by Fruit Beetle Larvae.
......................................................................................................................................... 76
Fig. 3. 12: Numbers of bacteria; a) E. coli, b) Salmonella enterica and bacterial species
grown on plate count medium isolated from gut of BSF larvae ..................................... 78
Fig. 3. 13: Numbers of total “heterotrophic bacteria” in gut of FB larvae; a) E. coli b)
Salmonella enterica and c) bacterial species grown on plate count medium ................ 79

XIII
Fig. 4. 1: Untreated dog faeces after 28 days incubation ................................................ 89
Fig. 4. 2: Modified faeces: a) treated with FBL; ........................................................... 89
Fig.4. 3: The effect of BSFL activity on indigenous; a) ammonium, b) nitrate, c)
sulphate and d) phosphate concentration in dog faeces(* Significantly different from
control, p=0.05). .............................................................................................................. 90
Fig. 4. 4: The effect of FBL activity on a indigenous a) ammonium, b) nitrate, c)
sulphate and d) phosphate concentration in dog faeces (* Significantly different from
control, p=0.05) ............................................................................................................... 91
Fig. 4. 5: The effect of length of incubation on a) ammonium concentration following
addition of (10µg/ (NH4)2SO4-N g) , b) nitrate concentration following the addition of
(10µg/ (NH4)2SO4-N g), c) S0 oxidation following the addition of (1% w/w) S
O and
d)
phosphate solubilisation following the addition of (1% w/w)calcium phosphate to dog
faeces modified with BSFL(* Significantly different from control, p=0.05) ................. 92
Fig. 4. 6: The effect of length of incubation on a) ammonium concentration following
the addition of (10µg/ (NH4)2SO4-N g), b) nitrate concentration following the addition
of (10µg/ (NH4)2SO4-N g) , c) S0 oxidation following the addition of (1% w/w) S
O , d)
......................................................................................................................................... 93
Fig. 4. 7: Shows a) the seeds planted in untreated dog faeces; from 1 to 3 - turnip
seeds, from 4 to 6 is lettuce seeds; b) the seeds planted in compost ; 7 to 9 - turnip
seeds, from 10 to 12 is lettuce seeds. .............................................................................. 97
Fig. 4. 8: Shows; a) the lettuce seeds planted in different concentration of treated dog
faeces with BSFL No; 1, control dog faeces 2, 3 and 4 are 75, 50 and 25% of dog faeces
concentration and 5 is a control compost. From 6 to 10 are the turnip seeds planted at
the same concentration b) the lettuce seeds planted in different concentration of treated
dog faeces with FBL No; 1, control dog faeces 2, 3 and 4 were 75, 50 and 25% of dog
XIV
faeces and 5 is a control compost. From 6 to 10 showing turnip seeds planted at the
same concentration .......................................................................................................... 97
Fig. 5. 1: The effect of BSFL haemolymph and whole body extract on E. coli, growth
curve over 8 h. ............................................................................................................... 105
Fig. 5. 2: The effect of FBL larvae haemolymph and whole body extract E.coli , growth
curve over 8 h. ............................................................................................................... 106
Fig. 5. 3: The effect of BSFL haemolymph and whole body extract on S.enterica
growth curve over 8 h. .................................................................................................. 106
Fig. 5. 4: The effect of FBL haemolymph and whole body extract on S.enterica growth
curve over 8 h. ............................................................................................................... 107
Fig. 5. 5: The effect of BSFL haemolymph and whole body extract on S.aureus MRSA,
growth curve over 8 h. .................................................................................................. 108
Fig. 5. 6: The effect of FBL haemolymph and whole body on Staphylococcus aureus
MRSA, growth curve over 8 h. ..................................................................................... 109
Fig. 5. 7: The effect of BSFL haemolymph and whole body on Serratia marcescens,
growth curve over 8 h. .................................................................................................. 109
Fig. 5. 8: The effect of FBL haemolymph and whole body extract on Serratia
marcescens, growth curve over 8 h. .............................................................................. 110
Fig. 5. 9: The effect of larval components on the morphology of E. coli observed by
TEM, a) control for BSFL, b) whole body extract of BSFL, c), haemolymph of BSFL;
d) control for FBL, e) whole body extracts for FBL and g) haemolymph of FBL. ...... 112
Fig. 5. 10: The effect of larval components on the morphology of S.aureus observed by
TEM, a) control for BSFL, b) whole body extract of BSFL, c), haemolymph of BSFL;
d) control for FBL, e) whole body extracts for FBL and g) haemolymph of FBL. ...... 112
Fig. 6. 1: Plastic bags containing dog faeces bags obtained from Sheffield parks ....... 117

XV
Fig. 6. 2: Airtight container contains 200 g of fresh dog faeces, the dog faeces gases
were pumped via the tube into the plastic box containing compost planted with lettuce
or turnip seeds. .............................................................................................................. 118
Fig. 6. 3: The presence and population density of E. coli and Salmonella sp in five
locations in public areas of Sheffield (location 5 is the uncontaminated grass sample).
....................................................................................................................................... 119
Fig. 6. 4: Bacterial species isolated from dog faeces left in polythene bags; a) red
colonies of E. Coli, and blue Enterococcus Spp, b) E. coli, c) Salmonella enterica, d)
Staphylococcus aureus. ................................................................................................. 121
Fig. 6. 5: Numbers of E. coli, Salmonella enterica and total heterotrophic bacteria
(grown on plate count media) isolated from dog faeces left in plastic bags. ................ 122
Fig. 6. 6: The effect of gas (odour) emission from dog faeces on vegetable growth; a)
control lettuce seeds, b) control turnip seeds c) lettuce treated with dog faeces gasses
and d) turnip treated with dog faeces gasses. ................................................................ 124
Fig. 6. 7: A typical dog waste bin used in public parks in the UK (author‟s photograph).
....................................................................................................................................... 125
Fig. 7. 1: Fatty acids extracted from; a, BSFL, b) FBL, ............................................... 135
Fig. 7. 2: GC–MS chromatogram of a reference mixture of fatty acid representative the
total of samples ion taken from dog faeces and BSF and FB larvae. The chromatogram
for this figure and all subsequent figures were obtained with Gas Chromatograph using
Zebron ZB-S capillary column ..................................................................................... 141

XVI
List of Tables
Table 1. 1: Bacteria that can dissimilate nitrate to ammonium Based on Tiedje (1988) 24
Table 1. 2: Colourless sulphur oxidising bacteria. (Modified after Kuenen and
Beudeker, 1982) .............................................................................................................. 32
Table 2. 1: PCR reaction mixtures for the amplification of Mycoplasma-DNA fragment.
......................................................................................................................................... 48
Table 2. 2: PCR amplification protocol of Mycoplasma DNA fragment ...................... 48
Table 2. 3: Analysis of coloured bacterial strains which require further 16S rRNA tests
for their identification confirmation to the species level. ............................................... 54
Table 2. 4: Bacterial identification using 16SrRNA ...................................................... 56
Table 2. 5: Presence of Mycoplasma in various samples ............................................... 59
Table 3. 1: Media used to detect and identify E. coli and S. enterica from dog faeces,
BSF and FB larvae gut .................................................................................................... 72
Table 4. 1: The percentage seed germination and growth planted in different ratios of in
modified dog faeces (treated with BSF and FB larvae) and potting compost ................ 96
Table 5. 1:The effect of the two species of larval haemolymph and whole body
secretions on the four species of bacteria. ..................................................................... 111
Table 7. 1: The percentage of lipids in dry weight of 1g samples of faeces and larvae
....................................................................................................................................... 136
Table 7. 2: The GC/MS analysis chain composition of a number of fatty acids from dog
faeces and larval fats ..................................................................................................... 139
Table 7. 3: Comparison of fatty acid methyl ester composition of BSFL fat-based
biodiesel and rapeseed oil-based biodiesel. .................................................................. 143

XVII
Table 7. 4: Comparison of fuel properties of BSFL fat-based biodiesel, rapeseed oil-
based biodiesel, and the standard EN14214. ................................................................. 144

1
Chapter One: Introduction

2
1.1. The environmental problem of canine faeces
The Dog (Canis lupus familiaris) is a member of the Canidae family of the
mammalian order "Carnivora. Dogs have been adapted for economic usefulness and are
loyal and generally protective of humans, being used as guide dogs for the blind and
disabled; their keen sense of smell is also used to detect bombs or drugs (Kim, 2008;
Murray, 2007). In contrast, dogs are a source of danger to humans through their bites,
and because they transmit zoonotic diseases such as rabies, toxoplasmosis,
echinococcosis, trypanosomiasis, filariasis, spirocerosis, hydatidosis, larva migrans etc.
(WHO, 1959; Oduyemi and Olayemi, 1977; Hill et al., 1985) resulting in death. Canine
waste which is not removed from the local environment due to the irresponsible
behaviour of dog owners may represent a source of potential pathogens. Pathogenic
bacteria can survive in canine faeces for a long period and can be spread by wind and
vehicular traffic. Faeces can also be carried inside dwellings via contaminated shoes
(Tarsitano et al., 2010). The interactions between plants and other animals including
invertebrates in the field may also be an important means of transmission of pathogenic
bacteria to crops.
Contamination of the urban environment by dog faeces continues to be a growing
problem around the world. While in the UK societal changes in thinking about the dog
dirt problem has led more people to pick up the waste products of their pets, our streets
continue to be polluted with dog faeces.
1.2. Microbiology of dog faeces
Dog faeces present two major problems. Firstly they smell and are generally
offensive, secondly, and more importantly, they spread microbial and parasitic diseases.
Since dog faeces often contaminate parks and playing fields, children are likely to be

3
frequently exposed to the likelihood of catching such damaging and potentially fatal
infections. The disease spread to humans by dog faeces include:
Campylobacteriosis and Yersiniosis, dogs which eat raw pork are infected with
Yersinia enterocolitica which can cause enteritis in dogs and cats; the organism is also
shed in the faeces for several weeks after infection, even in the absence of clear
symptoms (Fredriksson-Ahomaa, et al., 2001), Dogs may therefore be an obvious
source of human infection and this has shown to be high amongst children under six
years of age, so dog faeces may provide a transmission link for pathogenic bacteria
between pigs and young children. Campylobacteriosis is a bacterial infection causing
diarrhoea in humans. Wright et al. (1982) found that for dog faeces collected in urban
parks Campylobacter were isolated from 260 collected samples, while Salmonella
species were found in only three. Most of the Campylobacter were isolated during the
warm months of June and July, i.e. they were present when children are most likely to
be at play outside.
Salmonellosis, represent a very large group of rod-shaped, gram negative bacteria
including more than 2000 known serotypes which belong to the family of
Enterobacteriaceae. All these serotypes are human pathogens and can cause various
symptoms from mild gastroenteritis to severe illness or death. In 1890 more than 30
people out of every 100,000 in the United State died of typhoid caused by S. typhi.
Salmonella can cause food poisoning from eggs, pork, chicken and beef (Jacquelyn,
1999; Blancou et al., 2005) and is the most common bacterial infection transmitted to
humans, symptoms include, fever, muscle aches and vomiting and diarrhoea.
Escherichia coli is a gram-negative rod of the family Enterobacteriaceae and is found
in the gastrointestinal of all warm-blooded animals. All strains of E. coli are spread by
the faecal-oral transmission route. Many strains can cause gastroenteritis; among these

4
are the enterotoxgenic (ETEC), enteropathogenic (EPEC), enteroinvasive (EIEL), or
enterohemorragic (EHEC) E. coli. (Maier et al., 2009).
Shigella flexneri is an intestinal bacterium responsible for severe diarrhoea in people
and non-human primates (monkeys); it is also found in dogs (Wang et al. 1996). About
25,000 cases are reported in people in the United States every year. Many monkeys
carry this bacterium without symptoms, while people are also commonly carriers. Small
children at child care facilities and people who handle monkeys are most at risk. The
diarrhoea produced in people exposed to human or monkey waste is never life
threatening but during the two to three weeks the diarrhoea lasts, the victim is quite ill.
The chief danger from this disease is dehydration.
Streptococcus and Staphylococci these bacteria are found on all animals that typically
associate with humans. In the great majority of cases they cause no disease in the
animal. However, in pets, eye infections are occasionally associated with Streptococci
and skin infections with Staphylococci. Both bacteria can spread from pets to humans
on contaminated hands and objects. Infections are generally limited to the skin and eyes.
Faecal coliforms cause dysentery herpes, typhoid fever and ear infections in humans.
Not surprisingly these bacteria are well represented in dog and other animal faeces
(Whitlock et al., 2002).
1.3. Parasites and diseases associated with canine faeces
1.3.1. Toxoicariasis
Toxoicariasis is the main medical problem relating to dog faeces. It is an infection of
the round worm Toxocara canis (Gillespie, 1988) and is a zoonotic disease spread via
unwashed vegetables and dog faeces (Karadam et al., 2008); young people are
particularly at risk due to their weaker immune systems and because of their likely
increased exposure by ingesting the eggs (Thompson et al., 1986). Puppies, which are a

5
major source of environmental contamination, can pass up to 15,000 eggs per gram of
faeces. Each T. canis female can lay up to 700 eggs a day and these are excreted when
the dog defecates; they can survive in soil for as long as three years. After two to three
weeks of warm weather the eggs develop into an embryo state, containing larvae which
are infective to dogs and people. The larvae attempt to migrate throughout the human
body like they would do in a dog's, but the human body regards them as foreign and
reacts leading to tissue damage (Overgaauw and Nederland, 1997). Two types of
toxocariasis exist, namely: visceral larva migrans (VLM) and ocular larva migrans
(OLM). In VLM, the larvae reach the liver, causing inflammation and symptoms
including abdominal pain and pyrexia; most people however, recover spontaneously.
OLM occurs when a migrating larva reaches the eye where it causes the formation of a
granuloma on the retina which leads to significant visual impairment and in severe
cases, blindness; around 12 new cases of OLM are diagnosed annually in the UK
(Despommier, 2003).
1.3.2. Toxoplasma contamination of dog faeces
Toxoplasma gondii is an obligate intracellular protozoan with worldwide distribution
(Frenkel 1990, Wallace, 1973), where it can cause blindness in humans. It is found in
the Americas, including southern Mexico, Central America, South America, and the
West Indies. Infections with Toxoplasma are very common in Panama, although most
infections are asymptomatic. Antibodies titres to Toxoplasma are high in children,
notably where cats and dogs are numerous, sanitation is bad and there is high shade and
high humidity. Cats are the main hosts of Toxoplasma, but the parasite is also found in
dogs (Barutzki and Schaper, 2003). Pets become infected by consuming rodents and
birds, which are intermediate hosts that contain cysts (bradyzoites) that help to continue
the chronic infection. When pets eat infected animals, the bradyzoites develop into the
6
enteroepithelial stages and the shedding of oocysts in the cat or dog faeces. The oocysts
then sporulate in the soil and then lie dormant from up to weeks or months, especially
when in moist, shaded areas. Sporozoites within the oocysts are then infectious to
humans and other mammals after being passed by hand to mouth, after which
tachyzoites and bradyzoites (multiplying asexual stage) continue to induce active
infection. Dogs have only recently been considered a factor in the spread of
toxoplasmosis (Frenkel, 1996). Interestingly, by eating or rolling in cat faeces, dogs
probably play an important role in the mechanical transmission of Toxoplasma oocysts
(Lindsay et al., 1997) and it is likely that dogs excrete oocysts near human habitats,
promoting Toxoplasma transmission to humans.
1.3.3. Other protozoan livestock parasite disease related to dog faeces
There is a growing link between two specific protozoan diseases in livestock and the
fact that faeces, from infected dogs, is increasingly found on grazing land (Dubey and
Lindsay, 2006). The two main diseases in question are:
1.3.3.1. Neosporosis
This disease caused by the parasite Neospora caninum is responsible for the highest
rate of all cattle abortions reported in the UK. Once this disease occurs in cattle it can
remain in the herd as a result of vertical transmission of the parasite between cows and
their calves. Neospora eggs are produced by infected dogs and then excreted into their
faeces. Cattle then become infected when they eat food or drink water contaminated
with the eggs. Infection in cattle is common and generally ill effects are not clear, either
for the cow or the calf (Williams et al., 2000) The disease becomes obvious when
Neospora multiplies in the cells of the developing calf and its placenta and causes
damage sufficient to bring about abortion or stillbirth. Control of Neospora abortion is
difficult and there are no drugs available at present to control this disease in cattle or to

7
cure the infected animals. Similarly, no vaccine is currently licensed in the UK to
prevent cattle-neosporosis. Fortunately, current evidence shows that Neospora is not a
major problem for humans . (Anderson et al., 1995)
The vertical transmission of neosporosis is a main cause of long standing infection
within a herd, although spread of the disease between females which are not related
only occurs where a dog acts as host to the parasite. The parasite can be picked up by
dogs through the consumption of contaminated livestock material, including placentas
from newly calved cows, or by being fed contaminated raw meat, faeces from infected
dogs then contaminate pasture and also cattle feed, water or bedding (Anderson et al.,
1997); (Davison et al., 1999).
Only a small number of infected dogs develop the disease, which produces
progressive lameness and paralysis in pups younger than 6 months of age. Infected
bitches can pass the parasite to their young during pregnancy by transplacental
infection. If dogs do develop symptoms, then the results are usually fatal or lead to
euthanasia (Reichel et al., 2007). This disease is very important since it impacts farm
economics due to infected cows being more likely to abort and the occurrence of
premature culling and reduced milk yields. Since there is no way to prevent (through
vaccination), or an effective treatment of neosporosis, a farmer‟s main defence against
the disease is to take action against any likely Neospora contamination (Dubey, 2003).
1.3.3.2. Sarcocystosis
This is a disease which is also caused by a parasite, in this case Sarcocystis spp,
which employs a number of intermediate hosts, including dogs. Sarcocystis eggs are
produced by infected carnivores and are excreted in their faeces, and sheep become
infected when they eat food, or drink water contaminated with Sarcocystis eggs. In
many cases, infected livestock show no disease symptoms (Traub et al., 2002). The

8
disease can be transmitted from ewe to lamb during pregnancy, but vertical transmission
is not believed to be important. Dogs can pick up the parasite through the ingestion of
contaminated material from carcasses, or by consuming contaminated raw sheep meat.
Faeces from infected dogs can also contaminate pasture as well as animal feed, water or
bedding. In contrast to neosporosis, no transmission of the Sarcocystis parasite occurs
between bitch and puppy. The link between infected dogs and sarcocystosis in sheep is
compelling, but the disease is generally regarded as less of a problem than neosporosis.
No vaccine is available against sarcocystosis in sheep and although there are some
treatments available, the high cost and practicality of administration of these prevents
their spread use. As with neosporosis, the most feasible option for the farmer is to
reduce infection risks. In addition to, round worms, giardiosis, tuberculosis,
gastroenteritis and cryptosporidiosis and Cystercercosis, is a human disease involving
larval tapeworms. Although parasitic infections are important in relation to dog faeces,
no attempt was made here in this thesis to study these infectious agents . (Dubey and
Williams, 1980)
1.4. Chemical composition of dog faeces
Dog faeces (and those of cats) contains about 0.7% nitrogen, 0.25% phosphate and
0.02% potasium. As a result, dog faeces are not a particularly good plant fertilizer; they
are offensive and often oderous and contain pathogens, as well as Toxoplasma. In it its
unweathered state therefore dog faeces are not a useful, let alone, ideal organic
fertilizer.
Currently most dog waste is allowed to breakdown naturally in the environment
where it is deposited, and where collected it is usually incinerated. Dog faeces are not
ideal additives to composting plants and as a result, their addition to municipal
composters is generally avoided. Similarly, because of their low nutrient and high

9
pathogen content they are not regarded as ideal or safe fertilizers for agricultural, garden
or allotment use.
The problems relating to dog faeces and the environmental pollution they cause has
been largely overlooked and surprisingly little research work has been published in this
area.
Here are some facts about dog ownership and the resultant waste problem relating to
the UK: There are around 24 million UK households and, in 2002, the number of
households owning dogs was 4.8 million. Some 21% of households with dogs have
more than one. There are around 6.8 million dogs in the UK, the highest levels of dog
ownership being among the 45 to 54 year-old age group - around 30%. It has been
calculated that the UK dog population produces some 900 tonnes of faeces every day
and over a ten-year lifetime, a dog can produce up to half a ton of faeces.
There are an estimated 41 million and 60.7 million dogs in Europe and the USA
respectively. Australia has one of the highest rates of pet ownership in the world, with
almost 36% of Australian households having a dog (Australian Companion Animal
Council 2010).
In the UK, the legal position relating to dog fouling is covered by the following
statutes:
The Dog (Fouling of Land) Act 1996 in England and Wales. The Dog Fouling
(Scotland) Act 2003. The Litter (Animal Droppings) Order 1991 - Made under section
84 (14) of the Environmental Protection Act 1990 and Statutory Instruments Numbers
2762 and 2763.DoE Circular No 18/96 (Welsh Office No 54/96).
These Acts require that the owner should immediately clean up after his or her dog,
should it foul what is termed 'designated land'. Designated areas are usually defined as
places where dog faeces have the potential to cause a health hazard to people, including
children's play parks, public greens and parks, residential areas, cycle paths and

10
walkways etc. Individual local authorities can use these Acts as a basis to create bylaws
(which allow for instant fixed-penalty fines) and nominate the designated areas in the
appropriate borough. The fines begin at around £40, rising to a maximum of £1,000.
Dog wardens may be employed to patrol these areas and catch those irresponsible dog
owners who fail to remove their dog‟s faeces.
The Government recommends that the dog faeces-related disease problem can be
reduced by the following actions:
a) Poop scooping on each occasion your dog makes a mess.
b) Dogs should be wormed regularly-every three to six months, using a wormer
recommended by a veterinary surgeon.
c) Dogs should be exercised in dedicated areas of parks where available.
d) Dogs should be discouraged from parks having children's playgrounds.
e) Pregnant women and individuals who suffer from impaired immunity should use
additional extra precautions when cleaning up the faeces, for example by wearing
disposable gloves.
1.5. Transmission of pathogenic bacteria from dog faeces to human food
Because of immunization and the use of litter boxes and flea treatments, the transfer
of pet diseases to humans has greatly been reduced over the years, but still some dog
related diseases infect people; most troubling of all when people are infected by their
pet, they usually are unaware of it. Besides the risk of bites, scratches and allergies,
several infections can be transmitted to the human as zoonosis. These pathogenics have
an oral-faecal transmission cycle and humans can be infected either by faecal
contamination of food, water or the environment (gardens, sandpits and playgrounds) or
by direct contact (Overgaauw et al., 2009). Outbreaks of diseases caused by infective
bacteria as well as parasites have been documented to occur as a result of consumption

11
of contaminated salad and vegetables. The studies described in this Thesis relating to
this problem focus in the potential consumption of contaminated lettuce. Sources of pre-
harvest contamination of produce include manure, from livestock operations, and
domestic animals (Beuchat, 2006).
Diseases caused by pathogenic bacteria, such as Salmonellosis and
Campylobacteriosis are the most frequently reported zoonotic diseases transmitted from
animals to humans via food (Norrung and Buncic, 2007). Infections with verotoxin-
producing E. coli O157 are comparably less frequent but of considerable public health
concern as they are associated with life-threatening human diseases such as
haemorrhagic colitis (HC) and haemolytic uraemic syndrome (HUS) (Roldgaard et al.,
2004). Although a variety of foods may serve as vectors of food borne illness, the farm
is the original source of all of these pathogens and there is strong association between
prevalence in food production and other animals and post-harvest prevalence on
carcasses (Elder et al., 2000).
1.6. Slugs and snails as intermediate host-vectors of pathogenic bacteria
Slugs (Mollusca: Gastropoda) are a major pest of fruits and vegetables (Godan,
1983; South, 1992), with the Grey Garden Slug Deroceras reticulatum
(Stylommatophora Agrioimacidae) being the most widespread and most serious pest
(Wilson et al., 1993). Slugs, by serving as intermediate hosts for many bacterial
diseases mainly found in animals faeces (South, 1992), present a risk to plants, animals
and humans. Slugs ingest soil bacteria during feeding and as a result, they become hosts
of many bacteria including pathogens like such as E. coli O157. These can be picked up
from dog faeces or from animal faeces which have been spread in open fields (Figure
1.1) (Walker et al., 1999).
Emma et al. (2006) conducted research on the Yellow Slug (Limax flavus) and the
Great Gray Slug (Limax maximus), and confirmed that both species can carry E. coli

12
O157, both on the surface and internally. The persistent slug species Deroceras
reticulatum can carry E. coli on its external surface for 14 days (Emma et al., 2006).
Slugs which ingest E. coli also pass viable bacteria to their faeces and E. coli was found
to persist for more than 3 weeks in excreted slug faeces (Hogan, 1985). In a similar
study Emma et al. (2006) showed that E. coli, through contact and/or ingestion can
survive for many days both internally and externally.
Fig 1. 1: Anticipated transfer pathways of E. coli O157 by slugs from an environmental
source to vegetable crops.
1.7. Waste composting
Increases in the human population and the expansion of large cities have lead to
marked increase in the volume of all kinds of waste. The search for modern approaches
to waste management, notably composting has recently gained momentum (Pascual et
al. 1997; Bhattacharyya et al. 2001a and b; Smith and Hughes 2004). Composting is
now often a preferred approach to waste management (Lee et al. 2004; Sharholy et al.
2008) and is defined as the biological oxidative decomposition of organic matter
Source of E. coli O157
Cattle / Sheep faeces / manure / Slurry
Contaminated pasture / soil Carriage of E. coli O157 by the
Slug
(A) Contact (B) Ingest
E. coli O157 contaminated Vegetable
(C) E. coli O157
Transferred by
contact
(D) Excretion of E.
coli O157 In faeces
contact

13
(Stoffella and Kahn 2001) based on the catalytic activity of environmental organisms
which are responsible for organic matter decomposition. Under optimum conditions,
three stages of traditional composting have been identified: 1) mesophilic, or moderate
temperature phase; 2) thermophilic, or high temperature phase and 3) cooling or
maturing phase (Kostov et al. 1996; Trautmann and Olynciw 2000). The duration of
these phases relates to the type of organic matter under compost and its efficiency,
which is largely determined by aeration and humidity (McKinley and Vestal, 1985;
Strom 1985 , Strom et al. 1983; Butler et al. 2001).
1.8. Composting and recycling of dogs waste
The risk of canine waste accumulation in the urban environment and agro-ecosystem
is an increasing problem. Recycling is a sustainable approach for disposing of waste,
and composting can be an important component of recycling approaches. The microbes
involved oxidize carbon as an energy source for growth and take in nitrogen for protein
synthesis (Taylor, 2004). The correct carbon to nitrogen ratio in composting systems is
required for the efficient decomposition of wet dog waste contains 0.7% nitrogen (N),
0.25% phosphate, compared to wet cattle manure, dog waste which contains 40% more
nitrogen, the same amount of phosphate, and a twentieth of the amount of potash (Hall
and Schulte 1979). Dog waste composting reduces the amount of waste being sent to
landfills (Sequi, 1996) and also reduces the amount of methane being released into the
atmosphere (Peigne and Girardin 2004, Albaladejo et al. 2000). Because of the high
nitrogen content of dog manure, a rich source of carbon is required for composting,
such as wood chips, shavings or sawdust (C:N ratio of 560-641:1) (Rynk 1992, Miller
1996).

14
1.9. Bio-conversion of putrescent waste using BSFL
After seven years of research, a patented bioconversion process that effects a 95%
reduction in the weight and volume of food waste within a matter of just a few hours
has been developed using the Black Soldier Fly. This unique approach to bioconversion
requires no energy, no electricity, no chemicals, not even the addition of water. It is
totally self-contained and does not produce effluent and, while it produces a small
amount of carbon dioxide, it does not produce any other greenhouse gases, such as
methane (Craig Sheppard et al., 2002).
The Black Soldier Fly BSF ( Hermetia illucens) is a tropical fly (Craig Sheppard et
al., 2002) indigenous to the whole of the Americas, from the south of Argentina to
Boston and Seattle, and in World War II, the fly also spread into Europe, India, Asia as
well as Australia.
As a result, the currently discussed bioconversion process does not require the
introduction of a foreign or exotic species, involving as it does an organism which is
indigenous to the Americas, and now Europe. It is also not associated with the
transmission of disease. The BSF has the ability to thrive in the presence of salts,
alcohols, ammonia and a various food-based toxins and can process food waste as well
as swine, human and poultry waste. Upon reaching maturity, the larvae of the BSF
migrate out of the bioprocessing unit into a collection bucket without any human or
mechanical intervention and thereby provide a self-harvested grub which is rich in
nutrients and is food source which rivals in commercial value the finest fish meal.
Unlike many other flies, BSF adults do not enter dwellings and since they do not have
functional mouth parts, they do not eat waste and cannot (like the House Fly)
regurgitate on human food, and therefore are not involved with disease transmission.
Black Soldier Fly adults do not, in any way, bite, bother or annoy humans.

15
1.9.1. The Black Soldier Fly life cycle
Soldier fly adults come together in small numbers near an isolated bush or tree in
order to find and choose a mate. After mating, the female finds an ideal place to lay her
eggs, and lays about 900 eggs in 5 to 8 days lifespan. Housefly adults, by contrast, often
live for 30 days, and during this long period, they eat, and as result actively spread
disease.
Male BSF do not go near wastes since they do not lay eggs. The females in fact,
prefer to lay their eggs not upon the waste, but either above or to the side of it, thereby
allowing the eggs a far better chance of survival. The eggs are relatively slow in
hatching (102 to 105 hours). The newly hatched larvae then crawl or fall onto the waste
and begin to eat it with unbelievable rapidity. It takes about two weeks for the larvae to
become mature a period which may extend to 6 months if the temperature is not right,
or if there is not enough food. This ability of BSF larvae to extend its life cycle under
conditions of stress is very useful when using it waste bioprocessing.
Black Soldier Fly larvae pass through 5 stages or instars. When mature, pre-pupal
larvae are about 25mm long, 6mm in diameter, and weigh around 0.2 grams. These
larvae are extremely tough and robust and can survive under conditions of extreme
oxygen starvation. They can be also subjected to several 1000 gs of centrifugation
without being harmed (Lord et al., 1994).
1.9.2. Bioconversion of dog faeces using Black Soldier Fly larvae (BSFL)
Black Soldier Fly larvae have been used to dramatically reduce food waste and
manure, and convert the nutrients from food waste and manure into insect larval
biomass containing over 40% protein and over 30% crude fat (Newton et al. 2005).
As a result, BSF larvae are potentially excellent source of protein and therefore as a
high energy meal for chicken, fish and other domestic animals. As an added benefit,

16
BSF larvae also aerate and dry manure, thereby increasing rates of breakdown and
reducing odours. BSF larvae add value to soil composition as a result of digesting
organic material and the release of larval faeces into the soil, which promotes plant
growth (Jeon et al., 2011).
1.9.3. The Texas Experimental BSF Composting Research Programme
In an experiment conducted in Texas over a period of one year, it was found that
BSF larvae are able to digest over 15 kilograms per day of restaurant food waste per
square meter of feeding surface area, or roughly 3 lbs per square foot per day, leading to
a 95% reduction in the weight and volume of such waste. As a result, for every 100 lbs
of restaurant food waste placed into a bio-processing unit, only 5 lbs of a black, friable
residue remain. Over 100,000 active larvae can be found in a typical waste disposal
unit, and they can eat and digest just about any type of putrescent waste, including meat
and dairy products. The instant waste is deposited into the unit, the larvae begin to
secrete enzymes into the waste long before it begins to rot and smell. Since thermophilic
and anaerobic bacteria play no role in this process, the larvae can conserve and recycle
the majority of the nutrients and energy within the waste (Alvarez, 2012).
1.9.4. Rates of bioconversion
Over a period of one year, approximately 20% by weight of the fresh food waste
is converted into fresh larvae. This food waste had an average dry matter content
of 37%, and the pre-pupae has an average dry matter content of 44%, i.e., on a dry
matter basis, the bioconversion of food waste situates at almost 24%. An input of
100 kg of food waste per day can be handled by three 6-foot bioconversion units.
The BSF pre-pupa is composed of:
42.1% crude protein, 34.8% ether extract (lipids), 7.0% crude fibre, 7.9% moisture,
1.4% nitrogen free extract (NFE),14.6% ash, 5.0% calcium and 1.5% phosphorus.

17
Live BSF pre-pupae have been successfully fed to bull frogs, tropical fish, reptiles,
snakes and many other creatures that have a strong preference for living food, and the
value of fresh BSF larvae ranges from $4 to $20 /lb. Chickens are especially fond of the
live larvae (Amatya, 2009).
1.10. Does winter pose a problem to composting?
In winter, bioprocessing using BSF can be maintained by simply placing a styrofoam
sheet on top of the larval residue to retain the heat generated by larval movement. If this
heat is not allowed to escape, the temperature on the surface of the residue easily
exceeds 35 degrees C. During summer, the conversion rate of fresh food waste into
fresh larvae runs as high as 20%, but during winter, this conversion drops to less than
5%, in spite of the fact that the larvae digest roughly the same daily quantity of food
waste per unit surface area. Under the right ideal summer conditions, it takes about two
weeks for newly hatched larvae to reach the mature pre-pupal form, but during the cold
of autumn and winter, this two-week period may last as long as six months. Well-
insulated, BSF technology units can be introduced into some of the coldest regions of
Earth. During the hot summer months, overcrowding can often occur, a process which
leads to relatively high temperatures within the unit; so as to cool the unit down, some
actively feeding larvae are forced to exit the unit (Craig Sheppard et al., 2002).
1.11. Slugs as agents of disease transmission
Slugs (Mollusca: Gastropoda) are the major pests of large varieties of vegetables and
fruits in fields, home gardens, landscapes, greenhouses, (Godan, 1983; South, 1992).
Slugs can also present a risk to plants, animals and humans because they serve as
intermediate hosts for many bacterial diseases which predominate in animal faeces
(South, 1992). Slugs usually ingest bacteria in soils as an important source of food.
Consequently, they become hosts of many bacterial strains, such as E. coli O157, either

18
via direct contact or being contaminated with animal faeces spread in open fields
(Walker et al., 1999). Emma et al. (2006) showed that both the Yellow Slug (Limax
flavus) and the Great Gray Slug (Limax maximus) carry E. coli O157 both on the
surface and internally, and that slugs are contaminated with E. coli through contact
and/or ingestion. Elliot (1969) also suggested that slugs possibly carry E. coli O157, and
Dawkins et al. (1986) showed that four slug species transmit the agent of bacterial soft
rot of potatoes (Erwinia carotovora) although this was considered to be accidentally
rather than obligatory.
1.12. Transfer of bacterial species via slugs and snails to lettuce.
The enteric tract of dogs, like mammals, possesses a complex microbial ecosystem,
including several bacteria such as Streptococci, Bifidbacteria, Lactobacilli, Bacteroides
and Clostridium (Drasar and Hill, 1974; Drasar and Barrow, 1985). Acinetobater
baumannii isolated from a number of dogs and cats, is spread (Thierry et al., 2008)
nosocomially, a fact which explains the occurrence of several strains of A. baumannii in
the veterinary hospital environment among dogs.
Some invertebrates may be responsible in transmission of the E. coli and other
bacteria to field crops either by direct contact or contamination with animal faeces. The
greatest concerns to human pathogens on fresh vegetables and fruits is represented by
the enteric pathogens (e.g. E. coli O157:H7 and Salmonellae), which can grow before
being eaten.
1.13. Detection and confirmation of Mycoplasma in dog faeces
The first documented occurrence of Mycoplasma in dogs was in 1934. During the
last 70 years, 15 known species of Mycoplasma have been recognised and several have
been isolated from or detected in dogs (Chalker, 2005). The isolation of a Mycoplasma
from a human was first reported in 1937 (Taylor-Robinson, 1996; Kudva et al., 1998).

19
Four species, M. hominis, M. orale, M. pneumoniae, M. salivarium have been isolated
in humans as well as dogs (Colaizy et al., 2003).
Culture techniques remain the most commonly used approaches to the detection of the
presence of Mycoplasma in environmental samples such as canine samples. However,
there are now a wide variety of indirect test methods available for Mycoplasma
detection, including PCR- based kit, DNA fluorochrome staining, autoradiography,
ELISA (McGarrity et al., 1985; Lincoln and Gabridge, 1998; Rottem and Barile, 1993)
The most widely used recommended indirect test is DNA fluorochrome staining
(McGarrity et al., 1983), an easy and relatively fast procedure which stains DNA using
a fluorescent dye. When stained and fixed cells are examined under a UV microscope
equipped with the proper filter package, DNA fluoresces brightly and negative control
slides should always be used to help interpret staining results. These positive and
negative Mycoplasma control slides are commercially available. The best overall testing
approach is a combination of both methods: direct culture can be provided very high
sensitivity while DNA fluorochrome staining can detect any fastidious Mycoplasma.
1.14. Nitrification
1.14.1. The Nitrogen Cycle
Nitrogen is essential for life, it is the main component of amino acids which are the
building blocks of peptides and protein, and is found in important biological
components such as chitin and mucopeptides; it is also an integral part of the genetic
material of cells, the nucleic acids. Plant growth in soils throughout the world is often
restricted by the supply of available N and, as a result, it is nitrogen supply, more than
any other soil nutrient which limits UK and world crop production. Because of this
large amounts of nitrogen are applied globally as fertiliser in order to increase crop
productivity (Lam et al., 1996)

20
. In agricultural systems, the need to understand the nitrogen cycle is of extreme
importance if maximum crop yields are to be achieved. In natural ecosystems, no
additional, fertiliser nitrogen is applied, but the need to understand the soil N-cycle is
just as critical.
1.14.2. Ammonification
The great bulk (95-99%) of the soil nitrogen is in organic compounds which are
largely unavailable to higher plants (Pate, 1973). When soil microorganisms degrade
these compounds, simple amino compounds (R-NH2-) are formed. Many soil
microorganisms are able to deaminate amino acids (e.g. bacteria, actinomycetes and
fungi) with the resultant release of ammonia. Any NH4-N that accumulates in soil
represents the quantity of substrate nitrogen in excess of microbial requirements
(Richards, 1987). Ammonium production is referred to as ammonification and the fate
of the ion varies, depending upon conditions in the soil. Ammonia as a gas is volatile
and leaves the soil; however, if dissolved in soil water the ion-NH4 is formed.
Ammonium can be accumulated and utilized by plants and microorganisms and under
favourable conditions can be oxidized to nitrate.
The flow of nitrogen in the soil is intimately tied to flow of carbon and the processes
involved in the nitrogen cycle bring about changes to the soil environment that also
have an influence on other soil processes and cycles
Recently, the definition of nitrification has extended to refer to the biological
oxidation of any reduced of nitrogen to a more oxidised form (Killham, 1994).
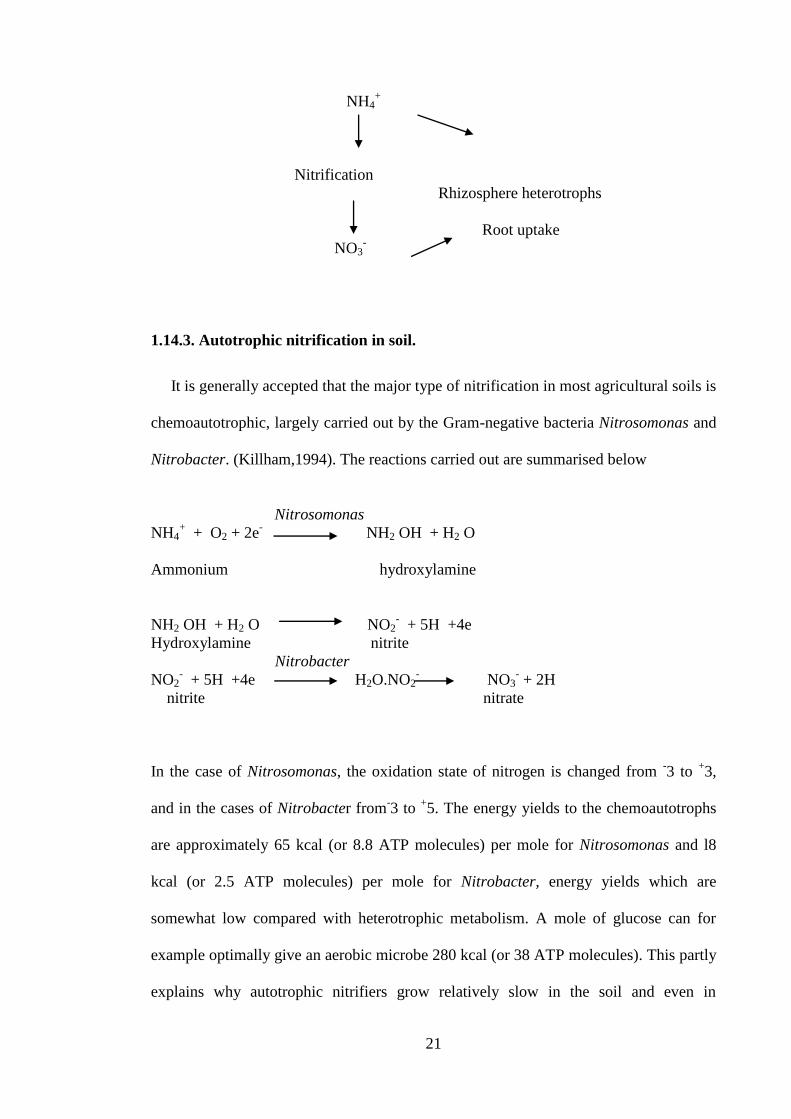
21
NH4+
Nitrification
Rhizosphere heterotrophs
Root uptake
NO3-
1.14.3. Autotrophic nitrification in soil.
It is generally accepted that the major type of nitrification in most agricultural soils is
chemoautotrophic, largely carried out by the Gram-negative bacteria Nitrosomonas and
Nitrobacter. (Killham,1994). The reactions carried out are summarised below
Nitrosomonas
NH4+ + O2 + 2e
- NH2 OH + H2 O
Ammonium hydroxylamine
NH2 OH + H2 O NO2- + 5H +4e
Hydroxylamine nitrite
Nitrobacter
NO2- + 5H +4e H2O.NO2
- NO3
- + 2H
nitrite nitrate
In the case of Nitrosomonas, the oxidation state of nitrogen is changed from -3 to
+3,
and in the cases of Nitrobacter from-3 to
+5. The energy yields to the chemoautotrophs
are approximately 65 kcal (or 8.8 ATP molecules) per mole for Nitrosomonas and l8
kcal (or 2.5 ATP molecules) per mole for Nitrobacter, energy yields which are
somewhat low compared with heterotrophic metabolism. A mole of glucose can for
example optimally give an aerobic microbe 280 kcal (or 38 ATP molecules). This partly
explains why autotrophic nitrifiers grow relatively slow in the soil and even in

22
laboratory culture where conditions for growth are optimised. Natural generation times
for nitrifying bacteria of the order of 20-40 h, together with their low numbers in most
soils however, gives a highly misleading impression of their vital contribution to
nitrogen cycling and to soil ecology in general (Killham,1994).
1.14.4. Nitrate reduction
Once nitrate is formed in soil, it is subjected to the following fates;
1- It can undergo microbial denitrification to gaseous oxides of nitrogen
to dinitrogen-N2.
2- It can be utilized as a source of N for plants and microorganisms. Assimilation of
NO3 is followed by its reduction to NH4+, which is then utilized (i.e. assimilatory
reduction) (Alexander, 1977, Paul and Clark, 1989).
3- In the absence of O2, nitrate can be used by microorganisms as an electron acceptor
and as a result be reduced to NH4+ (dissimilatory reduction) (Paul and Clark, 1989).
4- Being a negatively charged ion, NO3- is easily leached through soil and into ground
water and soil nitrate leaching has several consequences. When nitrate is leached, it
reduces the base saturation of a soil and increases exchangeable acidity. High
concentrations of nitrate in surface waters can also lead to eutrophication and fatal
diseases such as gastric cancers and methaemoglobinaemia (Alexander 1977).
1.14.5. Nitrogen losses from soil
Of all the nutrients required for plant growth, N is by far the most mobile and subject
to greatest loss by physical, chemical, and/or biological processes from the soil-plant
system (Knowles 1981, 1982). Even under the best circumstances, no more than two
thirds of the fertilizer-N is accounted for by crop removal or recovered in the soil at the
end of the growing season and nearly one-half of the applied amount can be lost. Five
main processes for N loss occur, including microbial denitrification, chemo-

23
denitrification, NH3 volatilization, leaching, and erosion. There are two biological
processes for reduction of oxidised N forms (e.g., NO3- and NO2
-). One of these,
assimilatory NO3- reduction, the other process is dissimilatory NO3
- reduction , more
commonly known as denitrification (Alexander 1977, Cooper, and Smith, 1963, Lynch
1983, Payne 1981).
1.14.6. Assimilatory nitrate reduction
In assimilatory nitrate reduction N is incorporated into cell biomass of plants,
bacteria, cyanobacteria, and fungi all of which reduce NO3- to NH4. in the biosynthesis
of amino acids and proteins (Atlas and Bartha 1993). The process needs energy and
several enzyme systems, including nitrate and nitrite reductases to form ammonia,
which is subsequently converted into amino acids. As a result, this process is regulated
by the availability of nitrogen, and nitrate utilization occurs when energy exceeds the
concentration of ammonium or organic-nitrogen compounds (Atlas and Bartha l998).
1.14.7. Dissimilatory nitrate reduction
Dissimilatory nitrate reduction is a process, in which the N is not utilized and in the
absence of O2. Nitrate ions acts as a terminal electron acceptor. The process is also
known as nitrate respiration, or dissimilatory nitrate reduction (Atlas and Bartha 1998).
Respiratory denitrification is usually the major dissimilatory process occurring in soils
which reduces nitrate and under anaerobic conditions nitrate-respiring bacteria reduce
nitrate to nitrite. Facultative anaerobes are often involved and many of these can also
further reduce nitrite to ammonium:
NO3- + 4H2+ 2H4 NH4
- + 3H2O.
The following genera are involved:

24
Table 1.1: Bacteria that can dissimilate nitrate to ammonium Based on Tiedje (1988)
Genus Typical habitat
Clostridium Soil, sediment
Desulfovibrio Sediment
Selenomonas Rumen
Veillonella Intestinal tract
Wolinella Rumen
Facultative anaerobes
Citrobacter Soil, wastewater
Enterobacter Soil, wastewater
Erwinia Soil
Escherichia Soil, wastewater
Klebsiella Soil, wastewater
Photo bacterium Seawater
Salmonella Sewage
Serratia Sediment
Vibrio sediment
Microaerophiles
Campylobacter Oral cavity
Aerobes
Bacillus Soil, food
Pseudomonas Soil, water
Neisseria Mucous membranes

25
Fig 1. 2: The Nitrogen Cycle
Abbreviations; d, denitrification; dan, dissimilatoryand assimilatory nitrate reduction to
ammonium; I, immobilisation; m, mineralisation; n, nitrification and subsequent
leaching 1; p, plant; r, root exudation and turnover (Killham , 1994)
1.15. The Sulphur cycle
Sulphur is an essential element which in plants, it is an important component of
amino acids methionine and cysteine. Plants contain as much sulphur as phosphorus,
and sulphur is as important in the formation of protein. Despite this, sulphur has
traditionally been regarded as a plant nutrient of secondary importance to nitrogen,
phosphorus and potassium.

26
1.15.1. Forms of S in soil
It is generally accepted that well over 90% of the sulphur in most non- calcareous,
non-tropical, surface soil is in organic forms, about half in the form of sulphate esters
and esters with C-O-S linkage (Tisdale, Nelson and Beaton 1985); about 20% of the
sulphur directly bonded to carbon such as S-containing amino acids (Biederbeck 1978),
and the remainder in a variety of largely inert organic compounds.
1.15.2. Biological and biochemical S-mineralisation
The mineralisation of organic sulphur in soil occurs by two main processes,
biological and biochemical. Carbon-bonded sulphur is mineralised biologically during
the oxidation of carbon by soil organisms to provide energy, whereas non-carbon
bonded organic sulphur is mineralised through enzymatic catalysis outside the cell
(Killham, l994). An example of this latter biochemical release of sulphur, the form of
sulphates-catalysed by cleavage of sulphate esters, Sulphur is released into the inorganic
pool in various oxidation states from sulphide (oxidation state-2) to sulphate (oxidation
state in +6).

27
Fig 1. 3: The Sulphur Cycle
Abbreviations: I, immobilisation; m, mineralization; p, plant uptake; r, root exudation
and turnover; so, oxidation and subsequent, leaching 1; sr , reduction (Killham, 1994).
1.15.3. Soil ecology and S-mineralization
The rate of S-mineralisation in soil is influenced by similar environmental factors
which control N-mineralisation, including water potential, temperature, and pH, the
presence of plants, drying/heating cycles and the form and quantity of organic sulphur
have the most important influence on rates of soil S-mineralisation.
In most soils, the inorganic S-pool is very small and biological uptake, both as
microbial immobilization and plant uptake depends upon an adequate rate of
mineralisation. Some soils cannot meet the sulphur demands of all crops in this way,

28
and this S-deficiency is sometimes not offset by fertilizer, pesticide and atmospheric S-
inputs (Hoque and Killham 1987).
The great similarities between the cycling of sulphur and nitrogen (notably with
regard to mineralisation from organic matter) suggest a fundamental involvement of soil
animals in S-mineralisation. Until further information becomes available, it can be
assumed that the quantitative involvement of soil animals in the cycling of sulphur is
approximately similar to that for the cycling of N. The atmosphere contains
considerable amounts of sulphur released by the burning of fossil fuels and by
microbiological sulphate reduction. Plants meet most of their sulphur needs from
sulphate, but they may obtain some sulphur directly from the atmosphere. When plants
and animals are incorporated into the soil their proteins are hydrolysed to form amino
acids, which together with other sulphur containing compounds are further oxidized by
microorganisms to form sulphate, while in anaerobic soils H2S is formed partly from
sulphate reduction and partly from the mineralization of organic sulphur. A number of
intermediates are produced during S-oxidation, including thiosulphate, polythionates
and sulphate. These ions do not generally persist however, and their concentration in
nature is as a result, usually low.
1.15.4. Microorganisms involved in the S-Cycle
Microorganisms are responsible for:
(1) The mineralization of organic sulphur to sulphate.
(2) The oxidation of reduced forms of inorganic sulphur to sulphate.
(3) The aerobic reduction of sulphate to sulphides.
(a) The immobilization of sulphate as organic sulphur.

29
1.15.5. S-Mineralization
Sulphur mineralization is the conversion of organic sulphur into inorganic forms,
notably sulphate; it provides a substantial source of soil sulphate, notably in forest
ecosystems Johnson (1932). Sulphur mineralization is therefore an important way in
which sulphate is mobilised in soils (it also provides a source of H+ ions) (Tabatabai
1985). Sulphur mineralization increases in the presence of oxygen, temperature (in the
mesophilic range, Tabatabai and Al-Khafaji (1980), moisture level and the addition of
lime to acid soils (Williams 1967).
1.15. 6. Sulphate reduction
Bacteria of the genus Desulfuvibrio are the main microorganisms concerned with the
reduction of sulphate. They use sulphate as an electron acceptor for growth. While few
microorganisms are able to reduce sulphate to sulphide many bacteria, actinomycetes
and fungi can reduce partially reduced inorganic sulphur compounds such as
thiosulphate, tetrathionate and sulphite to sulphide (Alexander, 1977).
1.15.7. Sulphur oxidation
The oxidation of reduced sulphur in soil is generally regarded as a microbial process
(Wainwright, 1978 Burns 1967), although some non-biological oxidation of the element
has been shown to occur in autoclaved soils (Wainwright and Killham 1980, Nor and
Tabatabai 1977).
During the microbial decomposition of organic sulphur compounds, sulphides and
other incompletely oxidised substances are formed, such as elemental S, thiosulphate,
and polythionates; these reduced substances are the available for oxidation. The
oxidation of some sulphur compounds, such as sulphites (SO32-
) and sulphides (S2-
) can

30
occur by strict chemical reactions (Brady and Weil 1974) and such abiotic oxidation can
occur to a limited extent in soils, but microbial reactions are clearly dominant:
So
S2O32-
S4 O62-
SO42-
Elemental Thiosulphate Tetrathionate Sulphate sulphur
The microorganisms involved in S-oxidation can be divided into: chemoautotrophs
(lithotrophs), including species of the genus Thiobacillus
1- Photoautotrophs, including species of purple and green sulphur bacteria, and
2- Chemoheterotrophs (organotrophs), including a wide range of bacteria and fungi
1.15.8. Heterotrophic sulphur-bacteria
The ability of heterotrophic bacteria to oxidise sulphur was initially studied by
Guittoneau (1927) and confirmed by Starkey (1934) who showed that soil heterotrophic
bacteria can oxidise thiosulphate to sulphate via tetrathionate. A wide range of
heterotrophic bacteria, fungi and actinomycetes (Yagi, 197l) can oxidise a variety of
reduced forms of sulphur in vitro. Bacterial species of the genera Arthrobacter,
Achromobacter, Bacillus, Beggiatoa, Flavobacterium, Micrococcus, Mycobacterium,
Pseudomonas and Sphaerotilus can oxidize sulphur; unlike the S-oxidising autotrophs,
heterotrophic bacteria do not seem to obtain energy from the process (Trudinger , 1967,
Schook and Berk, 1978).
1.15.9. Chemotrophic sulphur bacteria
The chemotrophic sulphur bacteria vary in both morphology and physiology, ranging
from specialist obligate chemolithotrophs through facultative chemolithotrophs which
can grow mixotrophically, to specialist heterotrophs, some of which may not benefit
directly from the oxidation of reduced sulphur compounds (Kuenen and Beudeket,1982;
Table, 1.2); the most widely studied in this group belong to the genus Thiobacillus. The

31
thiobacilli are rod shaped organisms which can obtain energy from oxidizing inorganic
sulphur compounds, using oxygen as an electron acceptor, while CO2 or bicarbonate
supplies the carbon for chemoautotrophic growth (London and Rittenberg 1967).
Additionally, they can be subdivided into those growing on neutral pH and those, which
live at acidic pH. They can also grow both at acidic and alkaline pH values. Vitolins and
Swaby (1969) pointed out that that Thiobacilli are important sulphur oxidisers only at
pH values below 7, while heterotrophs are the primary sulphur oxidisers in neutral to
alkaline soils (pH 6.0-7.5). The reduction in pH resulting from sulphuric acid formation
by thiobacilli may also control some diseases of plants including potato scab (Brown,
1982).

32
Table1. 2: Colourless sulphur oxidising bacteria. (Modified after Kuenen and
Beudeker, 1982)
Obligate chemolithotrophic
S-bacteria
Facultative chemolithotrophic
S-bacteria
(a) Aerobic bacteria
Thiobacillus thiooxidans T. novellus
T. neapolianus T. intermedius
T. ferrooxidans T. acidophilus
T. kabobis T. organoparus
T. tepidarius* Sulfolobus acidocaldarius
Thiomicrospira pelophila Sulfolobus brierleyi
(b) Facultative anaerobic bacteria
T. denitrificans Thiobacillus A2
T. thioparus Thermothrix thiopara
Thiomicrospira denitrificans Paracoccus denitrificans
Thiosphaera pantotropha **
Chemolithoheterotrophs Heterotrophs Unclassified
T. permetabolis Beggiatoa Thiovulum
Pseudomonas sp Pseudomonas sp Thiophysa
Thiothrix
Thiospira
Thioploca

33
1.15.10. The phototrophic sulphur bacteria
The phototrophic sulphur bacteria are found in anaerobic environments, (e.g. in H2S
rich mud, and stagnant waters), which remain exposed to light; since they are not found
in most agricultural soils they need not be discussed further here.
1.16. Phosphorus cycling
Phosphorus is second only to nitrogen as an inorganic nutrient required by plants and
microbes and is important for the accumulation and release of energy during cell
metabolism. Phosphorus is added to the soil as a fertilizer, or is produced during the
breakdown of plant residues or animal remains. Microorganisms are involved in a
number of transformations of the element including:
(l) Solubilization of inorganic insoluble phosphorus compounds.
(2) Mineralization of organic compounds to form inorganic phosphate.
(3) Immobilization of inorganic phosphate into cell components.
(4) Oxidation and reduction of inorganic phosphorus compounds.
Some 15-85% of phosphorus in soil is organic, notably as minerals existing as insoluble
phosphates. These insoluble inorganic compounds are largely unavailable to plants.
Microorganisms including fungi and bacteria can solubilize this insoluble phosphate.
These phosphate-solubilizing fungi include species of Penicillium, Sclerotium,
Fusarium and Aspergillus (Alexander 1977). This process involves the production of
organic acids and/or chelating agents (Wainwright 1981). The mineralization of organic
phosphorus is an important soil process due to the existence of a large reservoir of non-
plant available organic phosphorus which is converted to inorganic forms by enzymes
collectively known as phosphatases. The microbial immobilization and assimilation of
phosphorus may depress crop yields and the resultant phosphorus shortages can be
overcome by adding phosphorus fertilizers to the soil. Fungi are also able to oxidize

34
reduced phosphorus compounds eg. phosphite to phosphate and can use these
compounds as sole phosphorus source. There is the possibility of a reductive phosphate
pathway occurring in soils with phosphate being reduced to phosphate and
hypophosphate; fungi however, have not been implicated in this pathway (Alexander,
1977).
1.16.1. P-Mineralization and immobilization
The maintenance of soluble phosphate in the soil solution depends to some extent on the
magnitude of the two opposing processes
Mineralization
Organic P Pi (e.g., H2 PO4-. HPO4
-)
Immobilization
Phosphorus mineralization is an enzymatic process. As a group, the enzymes involved,
called phosphatases, catalyze a variety of reactions which release phosphate from
organic phosphorus compounds.
1.16.2. P-solubilization
Phosphate solubilising microorganisms (fungi and bacteria) include species of
Pseudomonas, Mycobacterium, Microococctts, Bacillus, Flavobacterium, Penicillium,
Sclerotium, Fusarium,and Aspergillus (Alexander,1977). Many common
microorganisms, including species of Pseudomonas, Achromobacter, Flavobacterium,
Streptomyces, and especially Aspergillus and Arthrobacter, are able to solubilize
insoluble inorganic phosphates in soil. The rhizosphere often has a particularly high
proportion of such organisms, for example, having found that 20 - 40% of the bacteria,
actinomycetes and fungi isolated from the rhizospheres of many plants are able to
dissolve hydroxyapatite, compared with l0 - 14% from non-rhizosphere soil.

35
1.17. Aims of the Work Reported in this Thesis
The overall aim of the work reported in this Thesis is to attempt to correct this
deficiency by providing research data relevant to:
a) The composition of bacterial populations found in dog faeces
b) The distribution of bacteria in playing field soils exposed to dog faeces
c) The fertilizer potential of dog faeces and its potential to be used as additive to potting
composts.
d) The question of whether slugs can act as vectors of bacterial disease, transmitting
pathogenic bacteria from dog faeces to lettuce.
d) The potential use of Black Soldier Fly and Fruit Beetle larvae to increase the rate of
composting of dog faeces.
e) The ability of slugs, snails and earth worms to carry and transfer Mycoplasmas to
lettuce from dog faeces.
f) The potential use of dog faeces as a source of biofuels.

36
Chapter Two: Transfer of Bacteria by Invertebrate
Slugs from Canine Faeces to Lettuce

37
2.1. Introduction
Several bacterial species, by being associated with a variety of invertebrates, can
infect humans, plants and animals; either via vectors (such as mosquitoes, the malaria
disease carrier) or through infecting the food chain with bacteria, notably vegetables
crops and fresh fruits.
Food poisoning outbreaks are frequently associated with cross contamination from
insects, such as houseflies, to meat products; however, direct contamination of foods,
notably of vegetables and lettuce in the field is also highly. Many field crops are prone
to be contaminated with remains of faeces from farm and domestic animals which are in
contact with manure contaminated soil or dust, and this is the major source of pre-
harvest contamination. Indirect sources of contamination also result from the interaction
between vegetables and fruits and phytophagous birds, mammals, and insects.
Pets and farm animals have been shown to be effective vectors of pathogenic
bacteria, either in the visceral or on their remains and animal faeces have been shown to
contain bacteria such as Salmonella, E. coli O157, and Listeria monocytogenes
(Beuchat, 1996).
Dog faeces are likely to be a major a source of bacterial contamination of vegetable
and lettuce crops especially where these are produced in allotments, small-holdings, or
agriculture land located close to housing estates where dogs are common. The canine
enteric tract, like most mammals, has a complex microbial ecosystem, which includes
several bacteria such as species of Streptococci, Bifidobacteria, Lactobacilli,
Bacteroides and Clostridium (Drasar and Hill, 1974; Drasar and Barrow, 1985).
Acinetobater baumannii has also been isolated from a number of dogs and cats, and
according to Thierry et al. (2008) the molecular typing of samples with limited
polymorphisms of ribosomal DNA provided confirmation of nosocomial spread of this

38
pathogen as well as for the occurrence of several strains of A. baumannii in dogs in
veterinary hospitals.
Slugs (Mollusca: Gastropoda) are major pests of large varieties of vegetables and
fruits in fields, domestic gardens, allotments, landscaped areas and greenhouses,
(Godan, 1983; South, 1992). Slugs present a risk to plants, animals and humans because
they often serve as intermediate hosts for many bacterial diseases found in animals‟
faeces (South, 1992). Slugs usually ingest bacteria in soils as an important component
of their food. Consequently, they become hosts to many bacteria, such as E. coli O157,
either via direct contact or by being contaminated with animal faeces spread in open
fields (Fig. 1.1), (Walker et al., 1999). Emma et al. (2006) carried out a study on both
yellow slug (Limax flavus) and great gray slug (Limax maximus), and confirmed that
both species can carry E. coli O157 both on the surface and internally.
Emma et al. (2006) also showed that once a slug has become contaminated with E.
coli through contact and/or ingestion, the bacterium can survive for many days
internally and externally, thereby providing adequate time for successful transmission.
Elliot (1969) also suggested that slugs possibly carry E. coli O157. However, the
laboratory study of Dawkins et al. (1986) demonstrated that in four slug species i.e.
Arion hortensis, Deroceras reticulatum, Milax budapestensis and Limax maculatus
tested to see if they transmit bacterial soft rot of potatoes Erwinia carotovora, the
association between the pathogen and its slug vectors was considered to be accidental,
rather than obligatory. Invertebrates then may be responsible for the transmission of the
E. coli O157 and other bacterial strains to fruits and vegetables either by direct contact,
or following contamination with animal faeces. Human pathogens present on fresh
fruits and vegetables, notably enteric pathogens (e.g. E. coli O157:H7 and Salmonella),
have the ability to grow before being eaten and bacterial pathogens have been isolated
from a large number of vegetables and fruits. Many strains of food poisoning bacteria
39
have also been isolated from soils including Vibrio cholera, E. coli, Campylobacter
jejuni and Shigella. In addition, Enterococci have been found in soils, and their
distribution is generally associated with animal faeces.
The aim of the work reported in this Chapter was to determine if bacteria can be
transferred from canine faeces to vegetable crops (in this case lettuce) by slugs
indigenous to the UK.
2.2. Materials and Methods
2.2.1. Slug culturing
One hundred slugs were used in this research. They were divided into small groups;
sets of twenty slugs were placed in five sterilised plastic boxes (of size 20cm × 30cm ×
10 cm). The grey garden slug Limax maximus was obtained from Blades Biological Ltd.
In order to maintain the slugs alive, wet tissues were placed in the bottom of the boxes
and changed every 3 days. Fresh lettuce was introduced to the slugs twice a week as
their only food source. All slug-containing boxes were left at room temperature.
2.2.2. Isolation of bacteria from dog faeces
Samples were collected from fresh dog faeces. Portions (1g) were added to 99 ml of
distilled water and were shaken at 70 g for 15 min. Aliquots of the shaken samples were
spread onto the surface plates containing Chromagar medium, and left overnight in
an incubator at 37oC (Samra et al., 1998).

40
Fig. 2. 1: Bacterial colonies isolated from dog faeces using Chromagar medium
2.2.3. Isolation of bacteria from slugs
The slugs were starved for 2 days and then exposed to fresh dog faeces (which was
collected locally) as their sole food source. Bacteria were then isolated from both the
outside and inside of the animal.
Samples were collected from inside slugs in sterile deionised water as follows: Slugs
were killed using formalin (90% v/v in a Petri-dish), and then dissected. Portions of 2
ml of (dH2O) were directly injected into the digestive track of the slugs, and the samples
were collected using sterile syringes (Fig.2.2). Samples (1 ml) were then added to 9 ml
of distilled water and were shaken at 100 g for 15 min, Surface samples were obtained
directly from the surface secretion of the slugs. Both collected samples were spread onto
the surface of Chromagar media (e.g. Orientation media); and the inoculated plates were
incubated at 37oC for overnight.

41
Fig. 2. 2: Section of digestive track of slug from where the samples were taken
Fig. 2. 3: Isolation of Bacteria from slugs: (a) colonies inside slugs, and (b) colonies
from the outside of slugs.
(b) (a)

42
2.2.4 Isolation of bacteria from lettuce
Bacteria were initially isolated from fresh lettuce leaves as controls. Slugs previously
fed on dog faeces were then fed lettuce. After two days, the suspension was prepared
from both control and contaminated lettuce leaves, by immersing small pieces of lettuce
leaves in 50 ml of liquid Nutrient Agar. The samples were incubated overnight at 25oC
under continuous shaking (250 g). In order to obtain different isolation batches, four
dilution series (e.g. 10-1
, 10-2
, 10-3
and 10-4
were used in this experiment, followed by
spreading the samples (100µl) onto Chromagar plates which were then incubated for
18-24 hours.
2.2.5 Bacterial identification
2.2.5.1 Identification of bacteria using Chromagar medium
Chromagar Orientation medium was prepared as recommended by the
Manufacturer‟s instructions (Chromagar Company, Paris, France). The medium was
made up as follows: (per litre) 15 g of agar, 16 g of peptone, (1.3 g of chromogen mix)
meat extract, and yeast extract, pH 7. The species of bacteria were presumptively
identified on the basis of the colour of the colonies produced when growing on
Chromagar. The colour is produced by the reaction of enzymes, produced by a
specified genus or species, with certain chromogenic substrates. Chromagar Orientation
media contains two chromogenic substrates used for the detection of B-D glucosidase
and B-D-glucosidase enzyme activity, together with 1- pyrolidonyl-B-naphtylamide
hydrololysis (PYR) which is described for the identification and differentiation of
Enterococci from other bacteria (Merlino, 1997). See appendix two (Fig, 2. 2)

43
2.2.5.2. Extraction of Genomic DNA
Genomic DNA (gDNA) was extracted from the bacterial strains (JS1, JS2, JS3 and
JS4) which were grown on LB nutrient solid medium for overnight at 37o
C, DNA was
isolated using Key Prep-Bacterial DNA Extraction kit by following procedure. 4 ml of
culture grown overnight in LB medium was centrifuged at 6,000×g for two minutes at
room temperature. The supernatant was decanted completely. The cell pellet was then
washed with TE buffer and completely suspended in 100μl of buffer R1 by pipetting it
up and down. Then 10μl of lysozyme (50mg/ml) was added to the cell suspension and
mixed thoroughly. After 20 minutes incubation at 37°C, the digested cells were
collected by centrifugation at 1000×g for 3 minutes and the supernatant was decanted
immediately. The collected pellet was then re-suspended in 180μl of Buffer R2 and 20μl
of Proteinase K, mixed thoroughly and incubated at 65°C for 20 minutes in a shaking
water bath. In order to obtain a RNA-free DNA, 20μl of RNase A (DNase-Free,
20mg/ml) was added and followed by incubation at 37°C for 5 minutes. Homogeneous
solution was obtained by adding 2volumes of Buffer BG to the previous mixture and
mixed thoroughly by inverting tube several times then incubated at 65°C for a further
10 minutes, immediately 200μl of absolute ethanol was added and mixed carefully. The
samples were transferred into a column assembled in a clean tube and centrifuged for 1
minute at 10,000×g, supernatants were discarded. The column was then washed with
750μl of the wash buffer and centrifuged twice for 1 minute at 10,000×g in order to
remove the residual ethanol, supernatants were also discarded. Finally, the column was
placed into a clean microcentrifuge tube and 100μl of preheated Elution Buffer, TE
buffer or sterile water was added directly onto column membrane and left for 2 minutes
which then centrifuged at 10,000×g for 1 minute to elute DNA. To verify DNA
presence and purity, 10μl of each resultant DNA was mixed with 2μl of Blue/Orange 6x

44
loading dye and electrophoresed using 1% agarose gel. The checked DNA was stored at
-20°C
2.2.5.3. Agarose preparation
To separate DNA, RNA or protein. Nucleic acid molecules are separated by size.
This is achieved by moving negatively charged nucleic acid molecules through an
agarose matrix with an electric field (electrophoresis) where shorter molecules move
faster and migrate farther than longer ones due to the sieving effect of the gel. The
presence, size and quantity of the DNA were checked and determined by
electrophoresis in 1% agarose gel which was prepared as follow: 0.5g of molecular
biology grade agarose was dissolved in 1ml of 50x TAE buffer and 40ml distilled water.
The agarose was completely dissolved by heating in a microwave oven. The solution
was mixed gently and allowed to cool to 55°C, and then 2.5μl ethidium bromide was
added. After mixing, the solution was poured into a sealed gel rack and a comb was
inserted at one side of the gel and allowed to stand in room temperature for 20 minutes.
Then the comb and seal were removed and gel was placed into an electrophoresis tank
and submerged in 1x TAE buffer. 10μl of the DNA sample was mixed with 2μl of
Blue/Orange 6x loading dye and loaded into the wells. 6μl of Hyper Ladder was loaded
as well into one of the wells as a reference. The samples were electrophoresed for 40
minutes at 80V to allow DNA to migrate toward the anode. The DNA fragments were
visualised under a UV transilluminator and the images were captured using a connected
digital camera
2.2.5.4. PCR amplification
The 16S rRNA gene was amplified with the universal bacterial forward primer (5`
CCG AAT TCG TCG ACA ACA GAG TTT GAT CCT GGC TCA G 3`) and universal
reverse primer (5` CCC GGG ATC CAA GCT TAC GGC TAC CTT GTT ACG ACT T

45
3`) according to Weisburg et al., (1991). A typical PCR mixture (50 μl in volume)
contained the following components: 39μl sterile distilled water, 5μl 10× Buffer , 2.5μl
50 mM MgCl2, 0.5μl forward Primer, 0.5μl Reverse primer, 1.0μl dNTPs, 1ul
genomic DNA and 0.5μl Bioline Taq. The PCR reaction mixture, after incubation at
94°C for 3 minutes as an initial denaturation, were cycled 30 times through the
following temperature profile: denaturation for 1 minute at 94°C; annealing for 1
minute at 60°C; and elongation for 5 minutes at 72°C with final incubation for 5
minutes at 75°C, after which 10 μl of each PCR amplification mixture was mixed with
2μl of Blue/Orange 6x loading dye and analysed by 1% agarose gel electrophoresis. In
addition, 6μl of 1 Kb Hyper ladder I loading was used to confirm the correct sized
product (Fig. 2.4). All PCR products were analyzed on agarose gels to check for the
successful amplification 16S rRNA gene in the samples
2.2.5.5. Phylogenetic identification of unknown bacteria
All samples sent to Sheffield University Medical School Core Genetics Unit for
sequencing. BLAST was used to compare the sequence. Finch TV software was used to
correct the sequence then compared it with BLAST to look for the closest matches
(Fig. 2.5)
2.2. 6. Mycoplasma identification
2.2.6.1. Samples description
A variety of samples were tested here for the presence of Mycoplasma spp, namely:
a) Earthworms, b) both the internal organs and outer slime of slugs and snails) dog
faeces, d) control and contaminated lettuce.
The earthworms were placed in polystyrene boxes together with a sterilized soil. A
number of earthworms (10) were then placed in 40 ml of distilled water and then

46
centrifuged at 5000 g for 10 minutes. A 1 ml of the suspension was then taken to test for
Mycoplasma. Slugs and snails were collected from the local area.
Fig. 2. 4: Standard hyperladder I with 14 lanes indicates higher intensity bands, 1000
and 10,000 and each lane (5μl) provides 720ng of DNA (BIOLINE supplier).
Fig. 2. 5: FinchTV software that manually adjusts errors of consensus sequences
before BLASTn NCIMB database

47
2.2.6.2. Detection of Mycoplasma
The followed procedure to detect the presence of Mycoplasma or not was using EZ-
PCR Mycoplasma Test Kit (Gene flow Ltd, Cat No.20-700-20).
2.2.6.3 Test samples preparation for PCR
A quantity of 1.0 ml of sample was transferred to 1.5 ml sterile Eppendoff tube and
centrifuged at 10000 g for one 1 minute to sediment the Mycoplasma. The supernatant
was transferred to a fresh 1.5 ml tube and centrifuged at 15000 g once again for 10
minutes to sediment the Mycoplasma. The supernatant was carefully discarded and
removed then re-suspended the pellet (not always visible) in 50µl of buffer solution and
mixed thoroughly using a micro- pipette samples were heated at 95oC for 3 minutes
then stored at -20 oC.
2.2.6.4 PCR amplification
PCR amplification of Mycoplasma DNA was performed as described by the
manufacturer. For the test sample, positive and negative control a reaction mixture of
the following was prepared ( no ice in PCR tube) by addition of the PCR mixture
containing sdH2 O, reaction mix and the test sample (Table 2.1). The tube was placed in
a thermal cycle and the Mycoplasma programme was run. After PCR amplification, the
PCR tube moved from the thermal cycler and 4 µl of 5x loading dye was added to each
tube. For the positive control, the DNA template control (270bp) was provided by
manufacturer whereas for negative control, the DNA template was replaced with
double-distilled water.

48
Table.2. 1: PCR reaction mixtures for the amplification of Mycoplasma-DNA fragment.
Reaction/Component Volume
Sterile deionized water (sdH2O) 35 µl
Reaction Mix 10 µl
Test sample
Positive control
Negative
5 µl
The reaction procedure (Table 2.2.) consisted of the initial denaturation step at 94oC
for 30 sec followed by 35 cycles of denaturation at 94oC for 30 sec., primer annealing at
60oC for 120 sec, and extension at 72
oC for 60 sec, and was ended by 1 cycle of
denaturation at 94oC for 30 sec., primer annealing at 60sec for 120 sec., and extension at
72oC for 5 min.
Table.2. 2: PCR amplification protocol of Mycoplasma DNA fragment
Step Time Temperature Number of cycle
Initial denaturation 30 sec 94 oC 1
Denauration 30 sec 94 oC
35
Annealing 2 min 60 oC
Extensions/ Elongation 1 min 72 oC
Final denaturation 30 sec 94 oC
1 Final annealing 2 min 60 oC
Final extension 5 min 72 oC
Hold 4 oC

49
2.2.6.5. Agarose gel electrophoresis
The amplified producers (10µl), including positive and negative control, (2µl) 5x
loading dye were separated in a 2% agarose gel in TAE for 45 minutes at a constant
voltage of 80 V. Amplified produce by UV transillumination with ethidium bromide
staining. A 200 bp Ladder (Bioline, UK) was used as a molecular size standard.
2.2.7. Detection and identification of fungi
2.2.7.1. Samples isolation on PDA and Czapek-Dox media
To determine fungal species in dog faeces samples (0.1 g) of fresh dogs faeces were
inoculated onto PDA (Potato Dextrose Agar), while 0.l g inoculated into CDA (Czapek
Dox Agar) then incubated at 25 o
C for 3 to 5 days. (Figs, 2.6 a, 2.6 b). Identification of
fungi was achieved by extraction of genomic DNA and using 18S rRNA primers
samples were 0.5- 1 ml of an overnight Potato Dextrose Broth culture.
2.2.7.2. Extraction of gDNA from pure cultures of fungi for PCR using 18S rRNA
Fungi /Yeast Genomic DNA Isolation Kit, Model 27300 from Sigma was used to
extract genomic DNA from fungal isolates using the following procedure:
1. Lysate preparation; 5 ml of pure culture grown 3 days on PDA broth medium was
centrifuged at 14,000 (g) for 1 minute to pellet the cell. The supernatant was decanted
then 500µl of Lysis Solution added to the cell pellet. The suspended pellet was mixed
with gentle vortexing , RNase 20µl was added to the cell suspension then the mixture
transferred to a provided Bead Tube and vortexing again for 5 minutes at maximum
speed. The bead Tube was incubated with lyaste at 65Co for 10 minutes, the lysate
mixed 2 times during incubation by inverting the tube. The lyaste including cell debris
was transferred to DNase-free microcentrifuge tube by pipetting, and the tube
centrifuged for 2 minutes at 14,000 ×g. The supernatant transferred carefully to a new

50
DNase-free microcentrifuge tube without disturbing the pellet. An equal volume of 96%
-100% ethanol was added to the lysate collected above (1µl of ethanol: 1µl of lysate)
then vortexe to mix, 300µl of binding solution was added briefly to the suspension
which was mixed by vortexing.
2. Binding of nucleic acid. Lysate (650 µl) was applied with ethanol to the column
and centrifuged for 1 minute at 8,000 ×g, the spin column was reassembled with the
collection tube, while the flow was discarded. This step was repeated with remaining
lysate.
3. Column wash. 500µl of wash solution was next added to the column and centrifuged
for 1 minute at 8,000 ×g.
4. Nucleic Acid elution. The column was transferred into a fresh 1.7 ml Elution tube
which is provided with the kit and 100µl of elution buffer was added to the column and
centrifuged for 2 minutes at 8,000 ×g; again the column was spin at 14,000 ×g for 1
minute.
5. Storage of DNA; the purified nucleic acid was stored -200C
for a few days, while it
is recommended that samples be placed at -70oC for long term storage.
2.2.7.3. PCR amplification of fungal gene
The 18Sr RNA gene was amplified with the ITS1 fungi forward primer (5` TCCGT
AGGTGAACCTGCGG 3`) and ITS4 reverse primer (5` TCCTCCGCTTATTGAT
ATGC3`) (see appendix). A representative PCR mixture 50 μl included the following
reagents: 35 µl sterile distilled water, 5 µl of PCR buffer (10 mM Tris-HCl, pH 8.3, 50
mM KCl, 1.5 Mm), 2.5µl of MgCl2, , 1μl forward Primer (ITS1), 1 μl Reverse primer
(ITS4), 1.0 μl dNTPs, 4µl genomic DNA and 0.5 μl of Taq polymerase . The
following thermal cycling conditions were performed in a thermal cycler BIO Rad
57BR0200; an initial denaturation step at 95oC was conducted for 2 minutes and a

51
thermocycle for 30 cycle, where each cycle consisted of 30 second at 95oC
followed by
30 second at 58oC for annealing , and 30 second at 72
oC elongation; and a final
extension cycle of 7 minutes at 72oC. The amplified product (10µl) was added to 2 µl
6× loading dye visualized on a 2% (w/v) agarose gel made up in Tris-Borate- EDTA
buffer (0.09 M Tris base, 0.09 M boric acid, 2 mM EDTA pH 8.0) containing 0.5 mg
ethidium bromide ml-1
to confirm the presence of amplified target DNA in the PCR
mixture. In addition, 6μl of Hyper Ladder was loaded into one of the wells as a
reference. Samples were run at a constant voltage of 80 V for 45 minutes. Twenty
microlitres of the remaining PCR product was used for the electrochemical assay (Muir
et al., 2011)
2.2.8. Identification of unknown fungi
All samples were sent to the Medical School Core Genetics Unit for sequencing.
BLAST was used to compare the sequences and Finch TV software was used to correct
the sequence with BLAST and look for the closest matches.

52
Fig. 2. 7: Purification of fungi species; a) green mould; b) black mould on
PDA medium
a b
a b
Fig. 2. 6: Fungi isolated from dog faeces grown on a) PDA medium b)
Czapek Dox
medium

53
2.3. Results and Discussion
2.3.1. Transfer of bacteria by slugs to lettuce
All isolated bacteria were grown on Chromagar (Orientation) media and incubated at
37oC for overnight. Cultures shown in (Fig. 2.1) showed different colonies grown on
Chromagar media. Chromagar information sheets (reference) were used to identify
genera and species of the grown bacterial colonies. There was a consistent colour
reaction observed for some species or genus, according to colony colour. For instance,
Enterococcus sp, from all isolations, appeared as blue (turquoise) colonies, while, other
colonies from different isolates showed a variety of colours as shown in Table 2.3.
Previous studies on slugs have shown no relationship between E. coli transfer and
animals faeces (Elliot. 1969) or have failed to detect the presence of pathogens
(Shrewsbury and Barson, 1947). On the other hand, field studies by Sproston et al.
(2006) provided evidence that E. coli can be transferred to vegetables from sheep faeces
via contaminated slugs.
2.3.2. Bacteria isolated from dog faeces
A number of colonies developing colours on Chromagar media were isolated from
dog faeces based on colony-colour blue turquoise, beige, metallic blue, pink-red, cream
is shown in Table (2.3) Based on the colour identification coding catalogues for
Chromagar (Orientation) media, the genera and species identification of the isolates are:
Entercoccus sp, Salmonella sp, Staphylococcus lentus, E. coli, Proteus sp and
Acinetobacter sp.

54
2.3.3. Bacteria isolated from slugs
2.3.3.1. Bacteria isolated from control slugs
Blue bacterial colonies grew from cultures of both the internal and external parts of
slugs; these were identified as an Enterococcus sp. Bacterial colonies of a metallic blue
colour were found to grow from the outside secretion of slugs and these were identified
as Enterobacter amnigenes, a finding which was confirmed using 16S rRNA sequence
gene anlaysis (i.e.. 99% confirmed).
Table.2. 3: Analysis of coloured bacterial strains which require further 16S rRNA
tests for their identification confirmation to the species level.
Colonies colour on
Chromagar medium
Presence of bacteria species in different Samples
Dogs
faeces
Slugs Vegetable (Lettuce)
Control
Fed on
faeces Control Contaminated
In Ex In Ex
Enterococcus spp Blue Turquoise + + + + + + +
Enterobacter
amnigenus
Metallic blue - - + - - - -
Staphylococcus
lentus
Metallic blue + - - + - - +
Acinetobacter sp Beige + - - + + - -
Comamonas sp Blue - - - - + - -
Delftia sp Beige + - - + - +
Proteus sp Beige with brown Halo + - - + - - -
E. coli Pink-red + - - + - - +
Salmonella sp Creamy + + - -
In = Internal samples Ex= External samples
Grey shading indicates bacteria that were transferred to lettuce
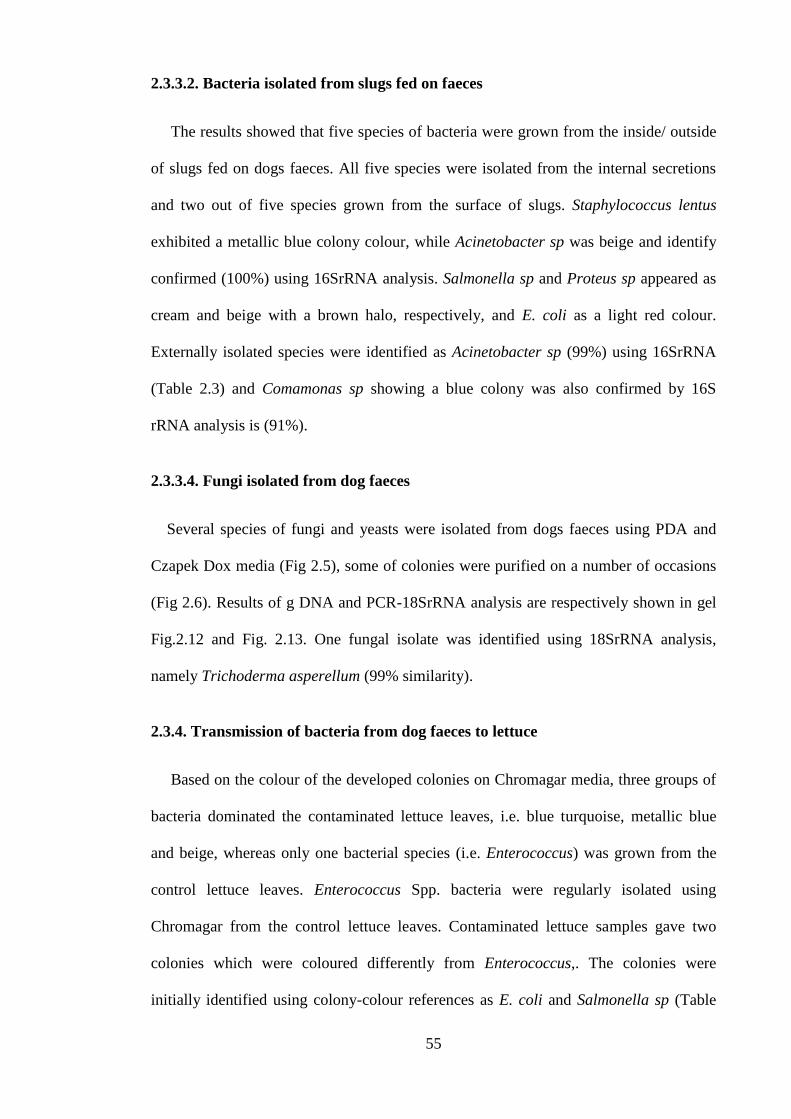
55
2.3.3.2. Bacteria isolated from slugs fed on faeces
The results showed that five species of bacteria were grown from the inside/ outside
of slugs fed on dogs faeces. All five species were isolated from the internal secretions
and two out of five species grown from the surface of slugs. Staphylococcus lentus
exhibited a metallic blue colony colour, while Acinetobacter sp was beige and identify
confirmed (100%) using 16SrRNA analysis. Salmonella sp and Proteus sp appeared as
cream and beige with a brown halo, respectively, and E. coli as a light red colour.
Externally isolated species were identified as Acinetobacter sp (99%) using 16SrRNA
(Table 2.3) and Comamonas sp showing a blue colony was also confirmed by 16S
rRNA analysis is (91%).
2.3.3.4. Fungi isolated from dog faeces
Several species of fungi and yeasts were isolated from dogs faeces using PDA and
Czapek Dox media (Fig 2.5), some of colonies were purified on a number of occasions
(Fig 2.6). Results of g DNA and PCR-18SrRNA analysis are respectively shown in gel
Fig.2.12 and Fig. 2.13. One fungal isolate was identified using 18SrRNA analysis,
namely Trichoderma asperellum (99% similarity).
2.3.4. Transmission of bacteria from dog faeces to lettuce
Based on the colour of the developed colonies on Chromagar media, three groups of
bacteria dominated the contaminated lettuce leaves, i.e. blue turquoise, metallic blue
and beige, whereas only one bacterial species (i.e. Enterococcus) was grown from the
control lettuce leaves. Enterococcus Spp. bacteria were regularly isolated using
Chromagar from the control lettuce leaves. Contaminated lettuce samples gave two
colonies which were coloured differently from Enterococcus,. The colonies were
initially identified using colony-colour references as E. coli and Salmonella sp (Table

56
2.3); these were not however, confirmed by 16SrRNA analysis. The results of genomic
DNA and PCR amplification (Figs 2.8 and 2.9) showed that Enterobacter amnigenus.
Acinetobacter sp, Comamonas sp and Acinetobacter sp were isolated from
contaminated lettuce (samples, JS1, JS2, JS3 and JS4 respectively (Table 2.4) in
addition to Delftia sp, Staphylococcus lentus and E. coli (samples MS1, MS2 and MS3)
were also genomic DNA and PCR amplification achieved (Figs 2.10 and 2.11).
Table.2. 4: Bacterial identification using 16SrRNA
S/No S/ source Species S %
JS1 From outside control slugs (C) Enterobacter amnigenus 99%
JS2 From inside slugs fed on faeces (C) Acinetobacter sp 99%
JS3 From outside slugs fed on faeces (B) Comamonas sp 91%
JS4 From outside slugs fed on faeces (C.) Acinetobacter sp 100%
MS1 From contaminated lettuce (B) Delftia sp 99%
MS2 From inside slugs fed on faeces (MB) Staphylococcus lentus 100%
MS3 From inside slugs fed on faeces (P) E. coli 100%
C = Cream or Beige colony, B= Blue colony, MB= Metallic blue colony, P= Pink-red colony

57
JS
1
JS
2
JS
3
JS
4
L
JS
5
Fig.2.8:.Extraction of genomic DNA of isolated bacterial species; (lane JS1)
Enterobacter amnigenus; (lane JS 2) Acinetobacter sp; (lane JS3) Comamonas sp; (lane
JS 4) Acinetobacter sp( lane L); hyper ladder and( lane JS5) Delftia sp
JS
1
JS
2
JS
3
JS
4
JS
5
L
Fig. 2. 9: PCR- 16Sr RNA, amplification products of four isolated bacterial species
analyzed by electrophoresis in agarose gel lanes represent; ( lane L); hyper ladder;(lane
JS1) outside control slugs (Metallic blue); (lane JS 2) inside slugs fed on faeces (B);
(lane JS3) outside slugs fed on faeces( B); (lane JS 4) outside slugs fed on faeces (C);
(lane 5) contaminated lettuce(Pink-red).
1.5 kp
1.5 kp

58
L
MR
1
MR
2
MR
3
Fig. 2. 10: Extraction of genomic DNA of isolated bacterial species; (lane L); hyper
ladder and (lane MR1) Delftia sp ; (lane MR 2) Staphylococcus lentus; (lane MR3)
E. coli L
MR
1
MR
2
MR
3
Fig. 2. 11: PCR-16Sr RNA, amplification products of isolated bacterial species
analyzed by electrophoresis in agarose gel lanes represent; ( lane L); hyper ladder;(lane
MR1), contaminated lettuce (Blue); (lane MR 2) Inside slugs fed on faeces (Metallic
blue ); (lane MR3), Inside slugs fed on faeces ( Pink-.red)
1.5 kp

59
2.3.5. Mycoplasma detection
2.3.5.1. Attempts to isolate Mycoplasma from various samples
Samples were examined for the presence of Mycoplasma contamination using the
EZ- Polymerase Chain Reaction (PCR) assay. The samples were obtained from the
inside and outside of slugs and snails, whole body of earthworm, dog faeces samples
and lettuce control and following exposure to slugs fed on dog faeces (Table 2.5).
Table.2. 5: Presence of Mycoplasma in various samples
Samples Symbol Reaction
Outside slug SR1 Positive
Inside slugs SR2 Negative
Earthworm SR3 Positive
Control lettuce AZ1 Negative
Contaminated lettuce AZ2 Positive
Control snail AZ3 Negative
Outside contaminated slug AZ4 Negative
Inside contaminated slug AZ5 Positive
Inside contaminated snail AZ6 Positive
Outside contaminated snail AZ7 Negative
Dog faeces AZ8 Positive
The PCR technique (Figs 2. 14, 2.15 and 2.16) was successful at detecting
Mycoplasma species from dog faeces and from slugs and earthworm collected from
local areas of Sheffield. The main finding of the work reported here is that Mycoplasma
was transmitted from dog faeces to slugs or snails which they, ingested or carried, and
then in turn transferred to lettuce. Earthworms were also shown to carry Mycoplasma
from soil on or in their bodies, a fact which presumably reflects contamination from
animal faeces, mainly dogs.
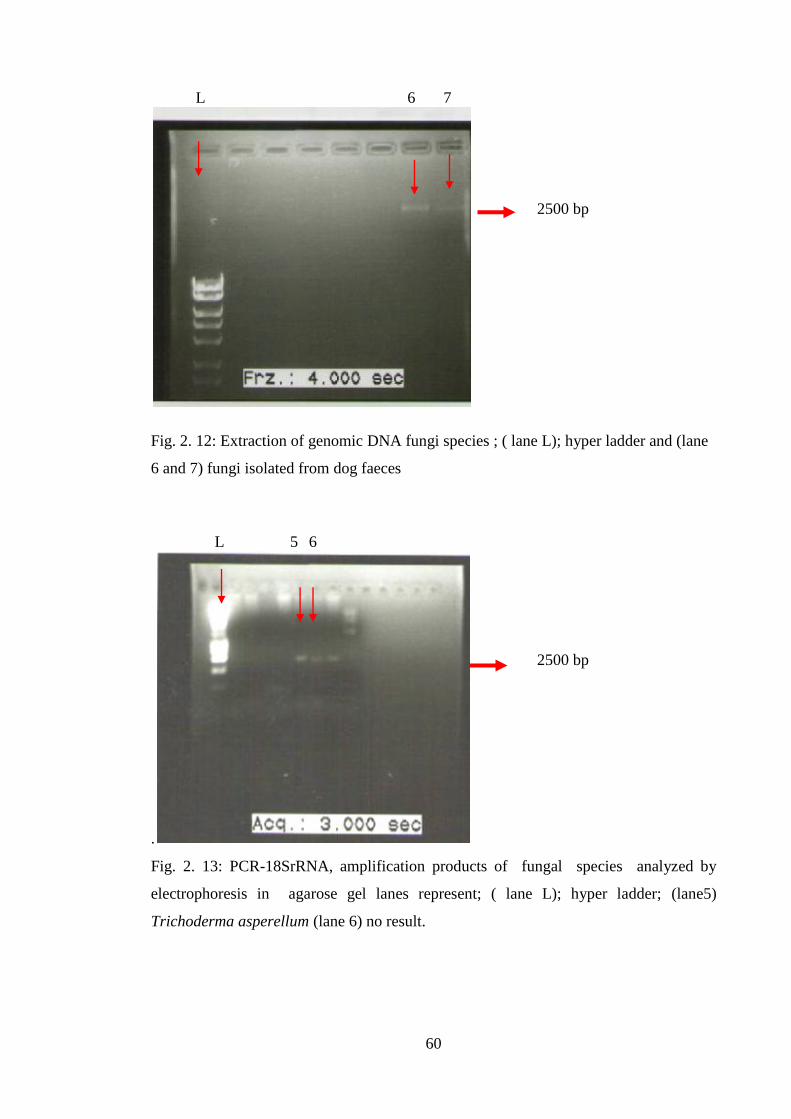
60
L 6 7
Fig. 2. 12: Extraction of genomic DNA fungi species ; ( lane L); hyper ladder and (lane
6 and 7) fungi isolated from dog faeces
L
5 6
.
Fig. 2. 13: PCR-18SrRNA, amplification products of fungal species analyzed by
electrophoresis in agarose gel lanes represent; ( lane L); hyper ladder; (lane5)
Trichoderma asperellum (lane 6) no result.
2500 bp
2500 bp
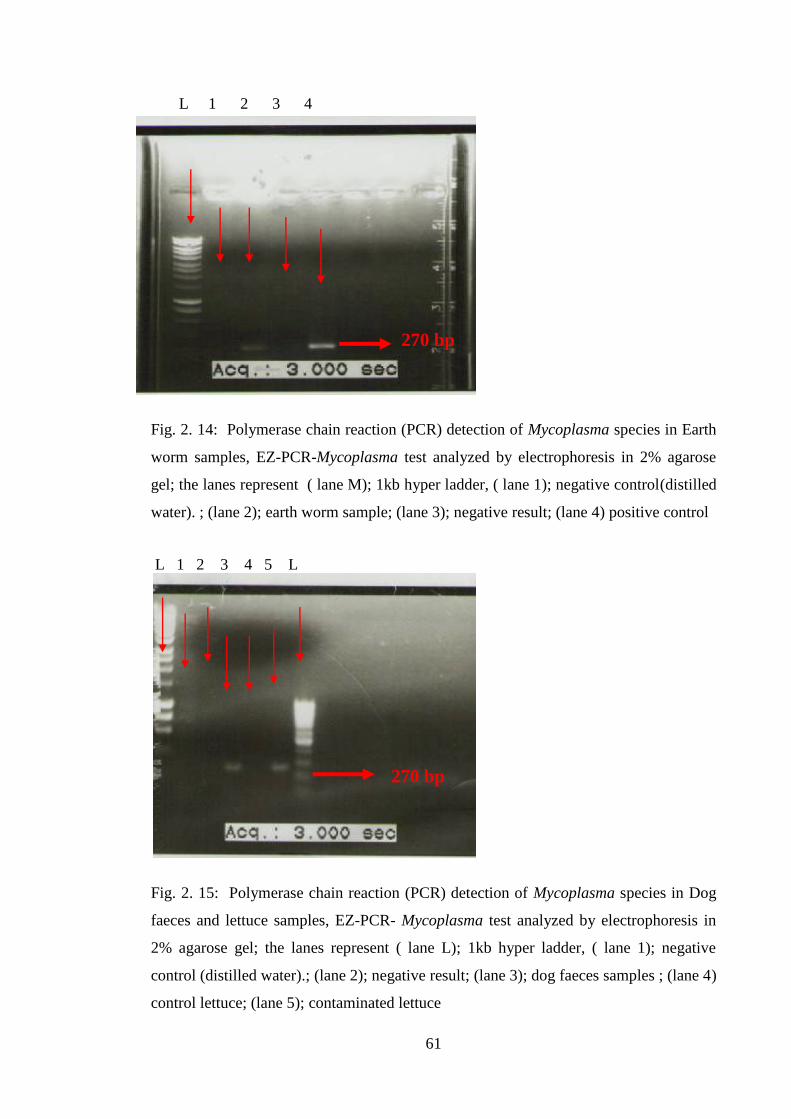
61
L 1 2 3 4
Fig. 2. 14: Polymerase chain reaction (PCR) detection of Mycoplasma species in Earth
worm samples, EZ-PCR-Mycoplasma test analyzed by electrophoresis in 2% agarose
gel; the lanes represent ( lane M); 1kb hyper ladder, ( lane 1); negative control(distilled
water). ; (lane 2); earth worm sample; (lane 3); negative result; (lane 4) positive control
L 1 2 3 4 5 L
Fig. 2. 15: Polymerase chain reaction (PCR) detection of Mycoplasma species in Dog
faeces and lettuce samples, EZ-PCR- Mycoplasma test analyzed by electrophoresis in
2% agarose gel; the lanes represent ( lane L); 1kb hyper ladder, ( lane 1); negative
control (distilled water).; (lane 2); negative result; (lane 3); dog faeces samples ; (lane 4)
control lettuce; (lane 5); contaminated lettuce
270 bp
270 bp

62
L 1 2 3 4 5 6 7 8 9
Fig. 2. 16: Polymerase chain reaction (PCR) detection of Mycoplasma species in Dog
faeces and lettuce samples, EZ-PCR- Mycoplasma test analyzed by electrophoresis in
2% agarose gel; the lanes represent ( lane L); 1kb hyper ladder, ( lane 1); Outside
control slug (negative result) (lane 2); Outside contaminated slug; (lane 3); Outside
control snails (lane 4) Outside contaminated snails (lane 5); Inside control slugs; (lane
6); Inside contaminated slugs; (lane 7); inside control snails (lane 8); Inside
contaminated snails (lane 9) negative control (distilled water)
270 bp

63
2.3.5.2. Comments on the detection of Mycoplasma using PCR procedure
In this study the EZ-PCR technique was used to detect culturable-independent
Mycoplasma DNA. This kit can detect a range of Mycoplasma species such as (M.
fermentans, M. hyorhinism, M. arginini, M. orale, M. salivarium, M, hominis, M,
pulmonis, M, arthitidis, M. bovis, M, pneamoniae, M. pirum and M. carpricolum) in
addition to Acholeplasma and Spiroplasma, all with a high degree of sensitivity and
specificity. The main aspect of this method is that rRNA gene sequences of
prokaryotic, including Mycoplasma, are well conserved, whereas, the sequences and
length of the spacer region in the rRNA operon (e.g. the region between 16S and 23S
gene) differ from species to other. Two primers were used to amplify the conserved 16S
ribosomal DNA (rDNA) coding region. The primer sequences allow for the detection of
Mycoplasma DNA but not any other bacterial DNA that may contaminate sample
preparations or solutions used for the PCR. Therefore, amplification of the gene
sequence with PCR using this primer set enhances not only the sensitivity, but also the
specificity of detection. Amplified products are then detected by agarose gel
electrophoresis. Although our study was focused on domestic dogs, several species of
Mycoplasma found in dogs have also been found in humans and other animals which
means the potential of transition several species of pathogenic Mycoplasma from canine
and amongst animal species (e.g. M. arginini) has been isolated from a range of hosts
which are associated with canines, including goats, sheep, cattle, healthy cats (Tan et
al., 1974 and 1977), and camels suffering from pneumonia.

64
Chapter Three: Reduction in Bacterial Numbers in
Dog Faeces Using Black Soldier Fly and Fruit Beetle
Larvae

65
3.1 Introduction
Animal faeces is known to contain pathogens such as Escherichia coli and
Salmonella spp, recent research has shown that waste production from animals is
increasing annually as a result of population growth and human activities (Mawdsley et
al.,1995; Pell,1997). Around a million tons of hen waste is produced annually
worldwide (Turnell et al., 2007), while approaching up to one billion tons of cow
wastes is produced annually in the United State alone (Islam et al., 2005). This type of
waste leads to the pollution of water sources, soils, crops and the air by animal wastes.
Factors such as temperature, moisture, aeration and pH value, in addition to manure
composition and animal health together influence the population of pathogens present
prior to, and during manure storage (Erickson et al., 2004). Escherichia coli normally
grow over the range of pH 5 to 9 but under laboratory condition can survive several
hours at pH 2 to 3 (Small et al., 1994). In order to manage animal wastes a variety of
experimental treatments have been attempted, e.g. the mixing of animals manure with
carbon sources in order to accelerate the biological oxidation of wastes (Kashmanian
and Rynk, 1996). Such a treatment makes the resultant manure more effective for use in
agricultural and also kills pathogenic bacteria by the production of high temperature
(40-550C) during the primary stages of composting (Jiang et al., 2003). However,
failure to maintain this heat for long periods may allow bacteria to survive (Prysor
Williams et al., 2006; Nemiroff and Patterson, 2007). Consequently, the possibility
exists that insufficiently treated manure will lead to bacterial contamination of soil and
agricultural crops (Cekmecelioglu et al., 2005). As well as biological treatments,
chemical approaches can successfully reduce pathogens in manure, examples include:
gassing with ammonia and the application of sodium carbonate (Himathongkham, 1999;
Park and Diez-Gonzalez, 2003).

66
Invertebrate larvae have also been evaluated in the treatment of animal wastes and
manures; saprophagous or polyphagous larvae can take up as important elements during
benefaction of animal waste and increase their protein and carbohydrate contents as a
result; in this way, not only is the manure improved for fertilizer use, but the nutrient
content of the larvae is increased, making them ideal as food sources for, for example
poultry chicken and egg production (Erickson et al., 2004). Black Soldier Fly (BSF)
larvae, Hermetia illucens L. (Diptera:Startiomyidae) have been widely evaluated for this
purpose. The life cycle of BSF has four stages; egg, larva, pupa and adult. The larvae
range in size from (3– 9 mm) and usually have five larval instars. Black Soldier Fly
larvae have been used to bioremediate livestock manure in studies by Sheppard et al,
(1994) and Sheppard and Newton, (2001) and a number of studies have shown that
BSF larvae can reduce the pathogenic bacteria in waste, e.g. E coli and Salmonella
Spp in chicken manure (Erickson et al., 2004; Jeon et al., 2011). Black Soldier Fly
larvae can also dry and aerate manure in addition to reducing odours by eating and
ingesting of bacterial and fungicidal compound, as a results BSF larvae can modify the
microflora of manure and reducing the number of harmful species (Jeon et al., 2011).
The studies reported here were aimed at using BSF larvae and Fruit Beetle grubs
(Sun Beetle larvae, FB) Pachnoda marginata peregrina (Coleoptera: Scarabaeidae) to
reduce the bacterial population of dog waste and also to improve texture and fertilizer
nutrient content in the hope that treated dog faeces might be converted from an
offensive waste into a useful compost material.

67
3.2. Materials and Methods
3.2.1 Methods for bacterial isolation and identification
Several broth and agar-based media and selective media based on colony coloration
were used:
HiCrome E. coli (TM) Agar is a selective medium obtained from Fluka-Sigma-
Aldrich Company (see media in Appendix). The medium was used to isolate and
enumerate E. coli as recommended by Hansen and Yourassowsky, (1984). Most of the
Escherichia coli strains can be differentiated from other coliforms by presence of the
enzyme glucuronidase which is highly specific for E. coli (see medium composition in
Appendix). The chromogenic agent X-glucuronide used in this medium detects
glucuronide activity. Escherichia coli cells absorb X-glucuronide and the intracellular
glucuronidase splits the bond between the chromophore and the glucuronide. The
released chromophore then gives a blue colouration to the colonies (Fig. 3.6 a) of E.
coli. Brilliance E. coli/Coliform agar from Oxoid, on the other hand, gave a purple
colour with E. coli (Fig.; 3. 6 b).
A highly selective XLT-4 Agar CM 1061 (Xylose Lactose Tergitol™ 4) agar
medium obtained from Oxoid was used to isolate and identify Salmonella sp., as
recommended by Mallinson et al., (2000). Differentiation on this medium is facilitated
by the fermentation of xylose, lactose and sucrose as well as the decarboxylation of
lysine. Salmonella appear as black or red colonies with a black centre (Fig. 3. 7), due to
their ability to reduce thiosulphate to hydrogen sulphide, which then causes the colony
to blacken (as there are ferric ions present in the medium). The makers instruction for
the preparation of this medium are as follows: Suspend 59g of XLT-4 Agar Base in 1
litre of distilled water, then 4.6ml of XLT-4 SR0237 selective supplement was added
to the medium and brought to the boil. The medium was not autoclaved. After cooling

68
to approximately 50°C, the medium was poured into sterile Petri-dishes (Tate et al.,
1990).
A range of media including Luria-Bertani (L.B) , Plate Count Agar (Fig. 3.8) and
Mueller Hinton (M.H) and Nutrient Broth or Agar were also prepared for routine
isolation and growth studies. Bacteria were also identified using 16s rRNA analysis;
DNA was extracted according to the instructions of the Anachem Key prep-Bacterial
DNA Extraction kit, and then bacterial 16S rRNA gene was amplified and sequenced
using PCR. After checking, the purified PCR products were sent to the Medical School,
(University of Sheffield) to be sequenced. 16SrRNA gene sequences were adapted
using the Finch TV software and then exported into The Basic Local Alignment Search
Tool (BLAST), available from the website of National Centre for Biotechnology
Information (NCBI)http://www.ncbi.nlm.nih.gov, to identify matches with existing
characterized reference sequences
3.2.2. Dog faeces and insects larvae collection
Dog faeces (from an Alsatian) were collected with the cooperation of a dog owner in
Sheffield. The fresh dog faeces samples were distributing onto two small boxes
(30×20×15 cm) and placed at laboratory condition whereas the first box treated with
Black Soldier Fly larvae (Fig.3.1). One hundred larvae per 100g dog faeces
approximately were used, as suggested by Li et al., (2011). The second box included
100g of dog faeces (without larvae) as the control. Fruit Beetle larvae were treated in
the same manner, except that 10 FB larvae (Fig.3.3) were added to 100 g of dog faeces;
controls were also set up. The larvae were purchased online from Ricks LiveFood.
Black Soldier flies were reared to the adult stage (Fig.3.2) and Fruit Beetle stages from
larvae (Fig. 3.3) pupa (Fig. 3.4) and adults (Fig. 3.5) to the next generation.

69
3.2.3. Bacterial isolation from dog faeces
Bacteria were isolated at weekly intervals over a 28 day incubation period. Samples 1g
were diluted in 9 ml of sterilized water then a serial dilution from 0.1 to 106 was
performed; the 0.1 ml of each diluted samples were then spread on E. coli agar ,
XLT4, L.B and count plate media, and incubated between 18 and 24 h at 370C. In this
case, both the control and treatment dog faeces were sampled from control and
treatment (with larvae) boxes in triplicate at each sampling day (0, 7, 14, 21or 28)
3.2.4. Bacterial isolation from the larval gut
Bacteria were isolated from BSF and FB larvae gut and surface after being fed on
faeces. For internal isolation, the outer surface was rinsed three times in sterilized water.
The larvae were then anaesthetized using a piece of cotton wool wetted with
chloroform (100%), placed with the larvae in Petri-dishes for few minutes. The
anterior end, near the cephalopharyngeal skeleton, was opened and the abdominal
contents were squeezed gently to collect 1g of the gut contents. A serial dilution was
then prepared for BSF and FB larvae to determine the number and type of bacteria,
and 0.1 ml of each diluted samples was taken for both control and treatment larval gut
and spread onto the E. coli agar , XLT4, and count plate media and incubated
between 18 and 24 h at 37oC; triplicates were used throughout.
3.2.5. Determination of pH
The pH of the dog faeces was determined as follows; 5 g of dog faeces were dissolved
in 50 ml deionised water (Erickson et al., 2004); suspension were shaken for 15 min on
a reciprocal shaker at 100 g until the suspension became homogenous, The pH of the
final solution was measured weekly using a calibrated Jenway 3310 pH meter
(Bogdanov et al., 2002).

70
3. 2. 6. Statistical analyses
All observations are presented as Mean ±SD (Standard deviation). Bacterial populations
were converted to log CFU/g before statistical analysis. Statistical analyses were
performed on experimental datasets using the t-Test and three way ANOVA at >0.05
probability level compared significance of means of three replication. Results were
analysed using Sigma Plot 11.0©
software.
Fig. 3. 1: Black Soldier Fly larvae, 1st instar
Fig. 3. 2: A Black Soldier Fly adult

71
Fig. 3. 3: Fruit Beetle larvae 3rd
instar
Fig. 3. 4:.Fruit Beetle pupae
Fig. 3. 5: Fruit Beetle adults

72
3.3. Results and Discussion
3.3.1. Identification of bacteria associated with dog faeces and larvae
Several species of bacteria were isolated from dog faeces and intestinal tract (gut) of
both the Black Soldier Fly and the Fruit Beetle FB larvae using the chromogenic media,
Hicrome E. coli and Brilliance E. coli/ Coliform agars. XLT-4 agar was used to isolate
and identify Salmonella Spp. The results (Table 3.1) show that E. coli produced a blue
or pink/purple colony (Fig. 3.6), while Salmonella enterica produced a black colony on
these media (Fig. 3.7). Bacteria growing on Plate Count Agar were not identified (Fig.
3.8). Scanning Electron Microscope (SEM) confirmed that the morphology of bacteria
isolated from dog faeces and gut of larvae agreed with E, coli and Salmonella enterica
(Fig. 3.9 a) while some of bacteria species were cocci, e.g. MRSA(Fig. 3.9 b).
Molecular identification of gDNA using 16S rRNA results confirmed the species
isolated as Escherichia coli and Salmonella enterica. The samples were sent to Medical
School Core Genetics Unit for sequencing, and then we used (BLAST) to compare the
sequence. Finch TV software was used and compared with BLAST to look for the
closest matches. The results show the species isolated from dog faeces were: E. coli
and Salmonella enteric 100% and 99% respectively see appendix 2 bacteria sequences
Table. 3. 1: Media used to detect and identify E. coli and S. enterica from dog faeces,
BSF and FB larvae gut
Sample Bacterial
species
Appearance of
the colony
SEM / Cell
morphology
Media
name
Gram
nature
DNA
Similar
Dog faeces E. coli Blue or purple Bacillus HiCrome or
Brilliance
Gram
negative 100%
BSFL gut E. coli Blue or purple Bacillus HiCrome or
Brilliance
Gram
negative 100%
FBL gut E. coli Blue or purple Bacillus HiCrome or
Brilliance
Gram
negative 100%
Dog faeces S. enterica Black Bacillus XLT-4 Gram
negative 99%
BBSFL gut S. enterica Black Bacillus XLT-4 Gram
negative 99%
FBL gut S. enterica Black Bacillus XLT-4 Gram
negative 99%
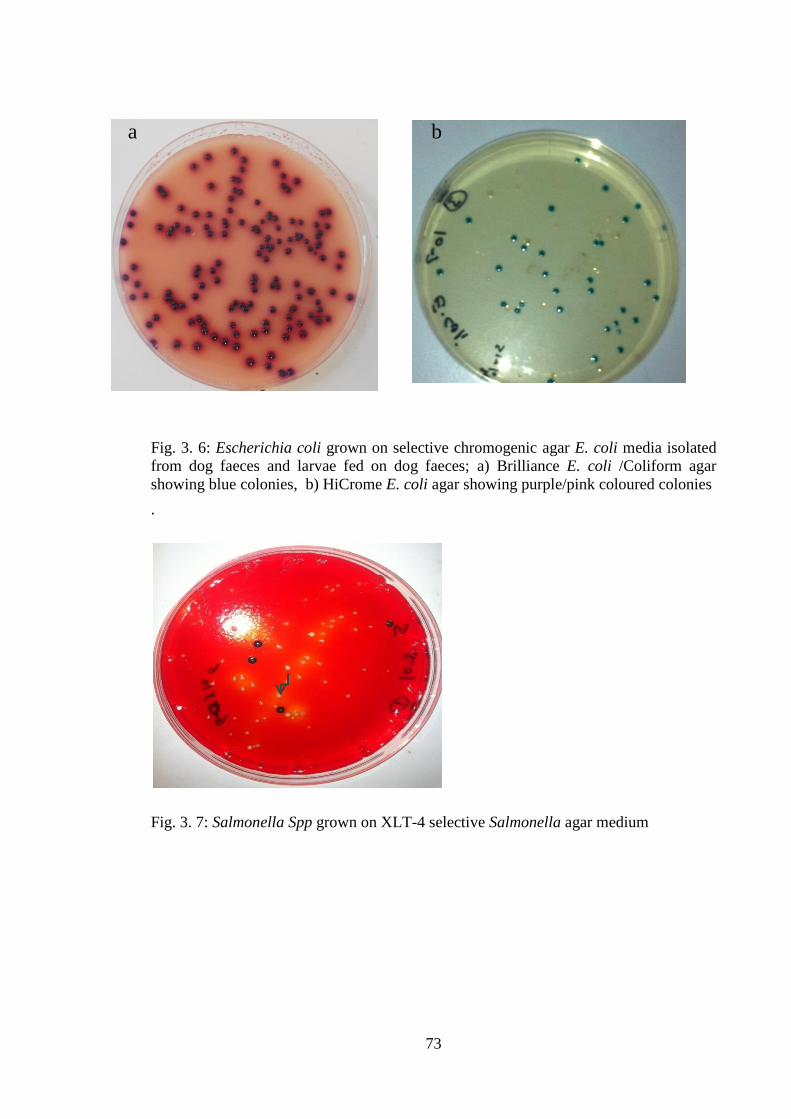
73
Fig. 3. 6: Escherichia coli grown on selective chromogenic agar E. coli media isolated
from dog faeces and larvae fed on dog faeces; a) Brilliance E. coli /Coliform agar
showing blue colonies, b) HiCrome E. coli agar showing purple/pink coloured colonies
.
Fig. 3. 7: Salmonella Spp grown on XLT-4 selective Salmonella agar medium
a b

74
Fig. 3. 8: Colonies of bacteria grown on plate count agar medium
Fig. 3. 9: Two bacterial isolates showing different external morphology; a) cocci, b)
bacillus, observed by SEM.
a b

75
Time(days)
day 0 day 7 day14 day 21 day 28
Ba
cte
ria
(lo
g1
0 C
FU
/ g
)
1e+3
1e+4
1e+5
1e+6
1e+7
1e+8
1e+9
1e+10
Treatment dog faeces with BSFL on Plate count medium
Control dog faeces without BSFL on Plate count medium
Time (days)
0 time 7 days 14 days 21 days 28 days
Ba
cte
ria
(lo
g1
0 C
FU
/g)
1e+2
1e+3
1e+4
1e+5
1e+6
1e+7
1e+8
1e+9Treatment dog faeces with BSFL on E. coli medium
Control dog faeces without BSFL on E. coli mdium
Time(days)
0 day 7 day 14 day 21 day 28 day
Ba
cte
ria
(lo
g1
0 C
FU
/g)
1e+2
1e+3
1e+4
1e+5
1e+6
1e+7
1e+8 Treatment dog faece with BSFL on Salmonella medium
Control dog faeces without BSFL on Salmonella medium
Fig. 3. 10: Bacterial numbers in dog faeces grown on; a) plate count medium, b)HiCore
E. coli in and c) Salmonella medium after treatment with Black Soldier Fly larvae
(Means of triplicate (±) SD log CFU/g (*significantly different from control)
*
*
*
*
*
*
*
*
*
*
*
b
c
a

76
Time(week)
0 day 7 day 14 day 21 day 28 day
Ba
cte
ria
(lo
g1
0 C
FU
/g
1e+3
1e+4
1e+5
1e+6
1e+7
1e+8
1e+9
1e+10 Control dog faeces without FBL on Plate count medium
Treatment dog faeces with FBL on Plate count medium
Time(day)
o day 7 day 14 day 21 day 28 day
Ba
cte
ria
(lo
g1
0C
FU
/g)
1e+4
1e+5
1e+6
1e+7
1e+8
1e+9
Control dog faeces without FBL on E. coli medium
Treatment dog faeces with FBL on E. coli medium
Time(week)
0 day 7 day 14 day 21 day 28 day
Bacte
ria (
l0g
10 C
FU
/g)
1e+3
1e+4
1e+5
1e+6
1e+7
1e+8
1e+9
1e+10 Control dog faeces without FBL on Salmonella medium
Treatment dog faeces with FBL on Salmonella mediun
Fig. 3. 11: Bacterial numbers from dog faeces, bacteria grown on; a) plate count
medium, b) HiCore E. coli medium and c) Salmonella medium by Fruit Beetle Larvae.
(*Significantly different from control)
*
*
*
*
*
*
*
a b
c
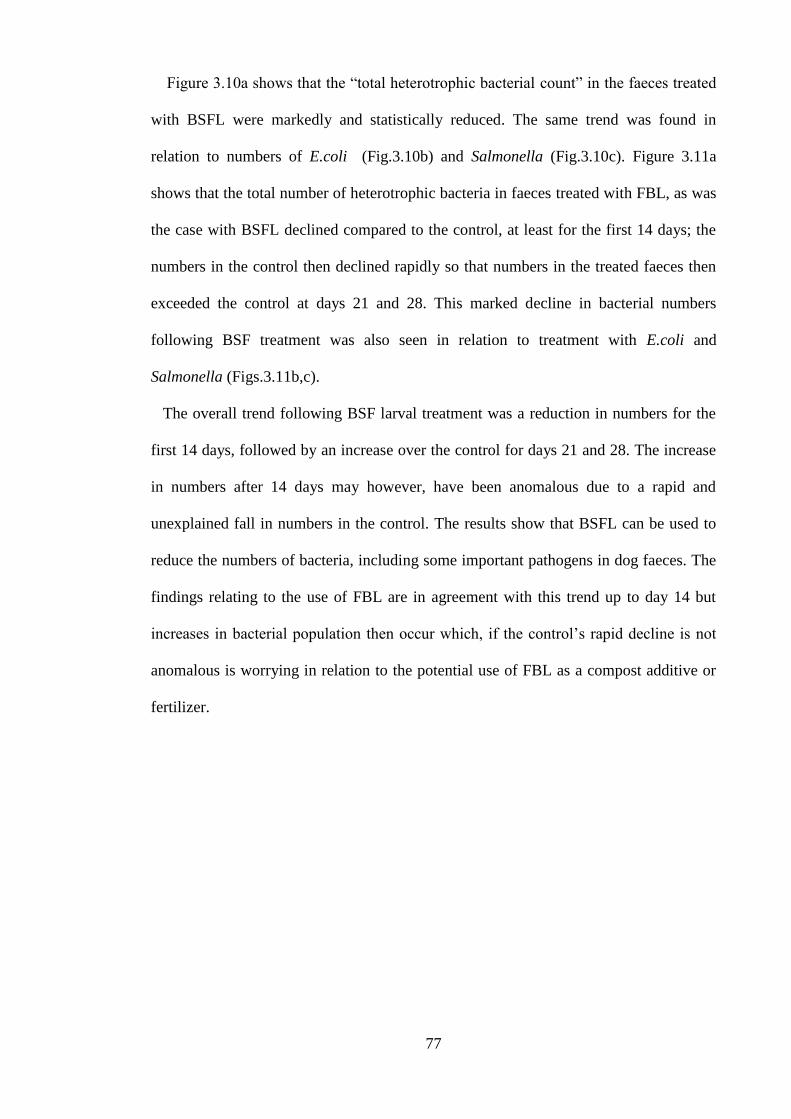
77
Figure 3.10a shows that the “total heterotrophic bacterial count” in the faeces treated
with BSFL were markedly and statistically reduced. The same trend was found in
relation to numbers of E.coli (Fig.3.10b) and Salmonella (Fig.3.10c). Figure 3.11a
shows that the total number of heterotrophic bacteria in faeces treated with FBL, as was
the case with BSFL declined compared to the control, at least for the first 14 days; the
numbers in the control then declined rapidly so that numbers in the treated faeces then
exceeded the control at days 21 and 28. This marked decline in bacterial numbers
following BSF treatment was also seen in relation to treatment with E.coli and
Salmonella (Figs.3.11b,c).
The overall trend following BSF larval treatment was a reduction in numbers for the
first 14 days, followed by an increase over the control for days 21 and 28. The increase
in numbers after 14 days may however, have been anomalous due to a rapid and
unexplained fall in numbers in the control. The results show that BSFL can be used to
reduce the numbers of bacteria, including some important pathogens in dog faeces. The
findings relating to the use of FBL are in agreement with this trend up to day 14 but
increases in bacterial population then occur which, if the control‟s rapid decline is not
anomalous is worrying in relation to the potential use of FBL as a compost additive or
fertilizer.

78
Time(week)
0 day 7 day 14 day 21 day 28 day
Ba
cte
ria
(lo
g1
0 C
FU
/g)
1e+0
1e+1
1e+2
1e+3
1e+4
1e+5
1e+6
Control BSFL gut without dog faeces on E. coli medium
Treatment BSFL gut with dog faeces on E. coli medium
Time(week)
0 day 7 day 14 day 21 day 28 day
Ba
cte
ria
(lo
g1
0 C
FU
/g)
1e-1
1e+0
1e+1
1e+2
1e+3
1e+4
1e+5
1e+6
Controlt BSFL gut without dog faeces on Salmonella medium
Treatment BSFL gut with dog faeces on Salmonella medium
Time(days)
0 day 7 day 14 day 21 day 28 day
Ba
cte
ria
(lo
g1
0 C
FU
/g)
1e+1
1e+2
1e+3
1e+4
1e+5
1e+6
1e+7Control BSFL gut withou dog faeces on plate count medium
Treatment BSFL gutwith dog faeces on Plate count medium
Fig. 3. 12: Numbers of bacteria; a) E. coli, b) Salmonella enterica and bacterial species
grown on plate count medium isolated from gut of BSF larvae
Means of triplicate (±) SD log CFU/g (*Significantly different from control).
*
*
*
*
*
* *
*
* *
*
*
a
c
b

79
Time(days)
0 day 7 day 14 day 21 day 28 day
Ba
cte
ria
(lo
g1
0 C
FU
/ g
)
1e+0
1e+1
1e+2
1e+3
1e+4
1e+5
1e+6
1e+7
Control FBL gut without dog faeces on E. coli medium
Treatment BFL gut with dog faeces on E. coli medium
Time(days)
0 day 7 day 14 day 21 day 28 day
Ba
cte
ria
(lo
g1
0 C
FU
/g)
1e+0
1e+1
1e+2
1e+3
1e+4
1e+5
1e+6
Control FBL gut without dog faeces on Salmonella mediun
Treatment FBL gut with dog faeces on Salmonella medium
Time(days)
0 day 7 day 14 day 21 day 28 day
Ba
cte
ria
(lo
g1
0 C
FU
/g)
1e+1
1e+2
1e+3
1e+4
1e+5
1e+6
1e+7
Control FBL gut without dog faeces on Plate count medium
Treatment FBL gut with dog faeces on Plate count medium
Fig. 3. 13: Numbers of total “heterotrophic bacteria” in gut of FB larvae; a) E. coli b)
Salmonella enterica and c) bacterial species grown on plate count medium
Means of triplicate (±) SD log CFU/g (*Significantly different from control).
* *
*
*
*
* *
* *
*
*
a b
c

80
Figure 3.12 shows the number of bacteria, including pathogens inside the gut of BSFL
following feeding on dog faeces. The overall trend is obvious, namely feeding leads to a
statistically significant increase in the number of bacteria inside the BSFL gut. The
same trend is seen in relation to dog faeces fed FBL (Fig 3.13). This trend of increasing
bacterial numbers in larvae fed on dog faeces is particularly worrying in relation to the
potential feeding of these larvae to animals-post exposure to faeces. Black soldier Fly
larvae in particular are currently being produced for use as animal feed (mainly to
chickens) following feeding on restaurant food waste. It is unlikely then, considering
the high pathogen content of larvae fed on dog faeces that these could be safely used as
animal feed following feeding on dog faeces. The only reference seemingly available on
the effect of feeding BSFL on animal faeces was reported by Erickson et al. (2004),who
found that they reduced the pathogenic bacteria population, including E. coli and
Salmonella in chicken and hogs manure.

81
Chapter Four: Modification of Canine Faeces by Black
Soldier Fly and Fruit Beetle Larvae in relation to Plant
Nutrient Release and Potential Use of Modified Faeces
as a Compost Additive

82
4.1 Introduction
The digestive tract of animals contains a wide range of microorganisms and as a
result, their faeces may also contain these organisms which include a variety of
pathogenic and saprophytic faecal bacteria (Mawdsley et al., 1995; Pell, 1997).
The accumulation of dog faeces in the urban environment poses a major threat to
animals, plants, human health and water sources (Rippy et al.1997). In the United States
alone, dog faeces contamination is estimated to be around ten million tons annually
(Brinton and Storms 2004) and the disposal of dog faeces is a major problem in regions
of high-density dog populations. Dog populations vary worldwide; in the city of
Quebec for example, approximately 25% of residents own at least one dog (Marketing,
2002). The estimated dog population of Quebec is 742,728, with 432,000 being found in
Montreal alone (Institute de la statistique Quebec 2005a). A European survey showed
that 44,000,000 domestic animals, including 6,900,000 dogs, were living in Italy in
2002. In 2007 a random study in the UK revealed that dogs were owned by 26% of
households, while the 2006 dog population was around 10.5 million. The average daily
faecal production of a dog is approximately 100 grams and open spaces, public gardens,
pathways, arcades, pedestrian precincts and roadways are the sites with the highest
pollution (Tarsitano et al., 2010). Canine faeces, are often not removed from the urban
environment, due to the bad habits of the owners and they clearly represent a source of
potential pathogens in addition to being an unsightly inconvenience (Nemiroff and
Patterson, 2007).
In the past, series of treatments have been used to reduce the pathogenic bacteria
content of animals manures; the mixing of animals manure with various carbon sources
being the most common method used to activate the biological oxidation process.
(Kashmanian and Rynk, 1996). In this treatment method, pathogenic bacteria are killed
by the high temperature (40-550C) produced in the primary stages of the composting
83
process (Jiang et al., 2003). However, the failure to maintain such high temperatures
for long periods may allow pathogens to survive (Prysor-Williams et al., 2006,
Nemiroff and Patterson, 2007) Consequently, the possibility for bacterial contamination
of soil and agricultural crops resulting from the of inefficiently composted manure is a
concern (Cekmecelioglu et al., 2005). In addition, chemical treatments that have been
used with success to reduce pathogens in manure (including gassing with ammonia and
the application of sodium carbonate (Himathongkham, 1999) may introduce further
environmental risks.
Many insect species depend completely on animals manure as organic materials as
their main food source, so that a number of insects (Saprophagous) can be used to help
recycle and improve the fertilizer quality of animal manures (Erickson et al., 2004).
Recently, a range of studies on animal waste benefaction have been conducted in
China, United States, Mexico, Eastern Europe, Australia and Central and South
America, aimed at treating animals faeces with insects to produce manure and animal
feed in the form of larvae; insect larvae were found to reduce the nutrient concentration
and mass of the manure residue, thereby reducing the pollution potential of the waste by
50-60% or more. (Newton et al., 2005)
A novel approach involves the use of black Soldier Fly (BSF) larvae Hermetia
illucens L. (Diptera: Startiomyidae). The life cycle of BSF has four stages; egg, larva,
pupa and adult. The larvae range in size from (3– 9 mm) and usually have five larval
instars. Female adults do not need to feed and lay around 900 eggs in their short life of 5
to 8 days; adults surviving on the large fat body stored from the larval stage. The black
Soldier Fly is not recognized as a pest since the adult Fly is not attracted to human
habitation or foods, nor does it bite or sting (Newton et al., 2005)
The larva of the black Soldier Fly is an common sight is some countries in decaying
organic matter including kitchen waste, spoiled feed and the larval stage of BSF and its

84
use has been suggested as a means of reducing livestock manures (Craig Sheppard et
al., 1994; Sheppard and Newton, 2001) a number of studies have demonstrated the
ability of BSF larvae to recycle animals manure and reduce the number of pathogenic
bacteria which they contain; E coli and Salmonella spp populations have, for example,
been reduced in chicken manure (Erickson et al., 2004). Previously, several studies have
also reported on the possibility of recycling the dog faeces using physical and chemical
approaches whereas some have utilized BSF larvae to reduce the bacterial population
from animals manure such as hogs, cows and poultry. The work discussed in this
Thesis focuses on using the BSF larvae to treat dog faeces. In addition, Fruit Beetle
larvae FBL Cotinis mutabilis (Scaraaeidae: Coleoptera) were investigated and compared
with BSFL in relation to their ability to reduce populations of E. coli and Salmonella
Spp.
The aim of this study therefore was also to investigate changes in the concentration of
ammonium and nitrate, and sulphur oxidation and phosphate solubilisation during larval
treatment of dog faeces with of BSF and FB larvae in the hope of converting the
biomass of these wastes dog faeces from a toxic, unsightly waste-product, into a safe
and useable fertilizer and compost additive.

85
4.2. Materials and Methods
4.2.1. Sample collection
4.2.1.1. Samples collection from canine waste
Samples of fresh dog faeces were collected from a single dog (Alsatian) owned by a
local family. The collected samples were distributed into eight plastic boxes (15x 20×
10 cm), each box containing 100 g of dog faeces with or without larvae. Three
replicates were used and the results compared using T-Test at 0.05 probability level and
ANOVA to determine levels of significance using Sigma Plot 11.0.
4.2.1.2. Samples collected from treated dog faeces
After 28 days, the treated dog faeces (now compost) were collected, weighed and
then divided into control and treatment without added larvae. Samples (100g) of the
treated and control faeces for each element were then placed in polythene bags. Treated
samples were amended by addition ammonium, nitrate, sulphur and insoluble phosphate
regents while the control no elements regents were added to the samples . Sample were
taken a weekly to measure the elements.
4.2.1.3. Effect of larvae on the nutrient content of dog faeces.
A number of first instar Black Soldier Fly (BSF) and Fruit Beetle (FB) larvae were
bought from a commercial company (Ricks Live-Food) in UK. Dog faeces (100)were
were placed in the plastic boxes and 100 larvae of BSF and 10 larvae of FBL were
added; a control with no larvae was also set up. The treatments were left for 28days
under laboratory conditions and sampled at 7 day intervals for the following plant-
fertilizer ions: ammonium, nitrate, sulphate and phosphate.

86
4.2.3. Nutrient transformations in modified dog faeces amended with ammonium
nitrate, sulphur and insoluble phosphate
Samples of dog faeces which had been modified by treatment with either BSFL or
FBL and the larvae were removed. The two types of modified samples (100g) were then
amended, in triplicate (in polythene bags) with ammonium (5ml of a 100ug per ml
solution of NH4SO4) and ammonium and nitrate was measured; elemental sulphur (1g)
and sulphate was measured; insoluble calcium phosphate (Ca3O8 P2,1g) and soluble
phosphate was measured. Controls lacking amendment were also set up. Then 20 ml of
water was added to each bag, which were closed to allow a small hole to allow for gas
exchange; the samples were then incubated at 25o C for 7, 14. 21 and 28 days elements
determined as follows.
4.2.3.1. Determination of ammonium–N (NH4+-N) in dog faeces
Ammonium was extracted from both control(without larvae) and treatment (with
larvae) dog faeces as well as to the modified control and treatment dog faeces ( dog's
compost) by adding solution of (15% w/v) of KCL in the ratio;(1g) of samples : (10 ml)
KCL. The dog faeces were shaken for 30 min at 70 g then, in order to determine the
concentration of ammonium N(NH4+-N) 2 ml of filtrate was mixed with (1ml) of EDTA
(6% w/v), then (7ml) of distilled water, (5ml)of phenolate reagent (see appendix), and
(3ml) of sodium hypochlorite solution (10%v/v). The mixture was then incubated at
25C0
for 20 min in the dark. The volume was made up to 50 ml and mixed then the
concentration of the indophenol-blue ammonium complex was measured at 630 nm
(Wainwright and Pugh, 1973), the concentration of ammonium intensity was
determined by reference to a standard curve(10-100µg NH4+-N) prepared from a
standard solution of ammonium sulphate (see Appendix). Urea (0.5g) was added to the
treatment samples (amended) dog faeces then while control was set-up lacking urea.

87
4.2.3.2. Determination of Nitrate – N (NO3--N)
Samples were extracted (1g) of each and shaken for 15 min with 20ml of water then
the samples were filtrated through Whatman No 1 filter paper. Nitrate was determined
using the method of (Sims and Jackson, 1971). Chromotropic acid: 7ml was mixed with
3ml of the filtrate then incubated at 40C0 in water bath for 45 min; the producer yellow
colour was measured at 410 nm and the concentration of nitrate was determinate by
reference to a standard curve of nitrate concentration.
4.2.3.3. Determination of Sulphate-SO42-
- S
Samples (1g) were shaken with 10 ml of water then shaken at 70 g using an orbital
shaker for 15 min the samples were filtrated through Whatman No.1 filter paper.
Sulphate-S was determined using turbidimetric method to analysis the sulphur element
(Hesse, 1971) as follows: Filtrate (10 ml) was transferred into a 250 ml volumetric
flask, 1g of barium chloride BaCl2, and 2 ml of gum acacia (0.25% w/v) were added and
mixed well then the volume increased up to 25 ml of water. The white suspension
resulting from precipitation of BaCl2 was measured at 470 nm using a
spectrophotometer and the concentration if of SO42-
-S was determined by reference to a
standard curve (0- 100µg sulphate ml) prepared from a standard solution of Na2SO4.
(see Appendix).
4.2.3.4. Determination of phosphate solubilisation PO43-
-P
Samples (10g) were placed into screw capped glass bottle containing 100 ml of 0.5
N NaHCO3 and all the bottles were shaken for 30 min at 70 g, using an orbital shaker,
the contents were then filtered through Whatman No. 1 filter paper. Phosphate ions
were determined as described by Falih, (1995) as follows: Filter (3 ml) was mixed with
7 ml of work solution (see Appendix) then the mixture incubated at 37C0 for 1 hour. A

88
serial dilution were taken up to log 10-3
for the blue colour reaction then was measured
at 820 nm using a spectrophotometer and the amount of PO4-P were determined by
reference to a calibration curve(0- 8 µg PO4-P ml-1
.
4.2.4.Measurement of the pH of dog faeces samples
The pH of the dog faeces was determined each from zero time until 28 days, using a
1:1 distilled water suspension , shaken for 15 min on a reciprocal shaker (100 revolution
min-1
), and a pH meter fitted with a glass electrode.
4.2.5. Determination of the effects of modified dog faeces as a compost additive on
plant seed germination and growth
The two types of modified dog faeces (BSFL and FBL) mixed with a local grassland
soil, which had not recently been fertilized, in the ratio 25%, 50% and 75%. Controls
consisted of modified and unmodified dog faeces. Samples (100g) of each mixed
proportions were planted with turnip or lettuce. The treatments were set up in triplicate
and watered twice a week and left under laboratory condition and plant growth was
observed.

89
4.3. Results and Discussion
4.3.1. Effect of larvae on the texture of dog faeces
Untreated dog faeces were greasy and tightly packed (Fig.4.1) and possessed an
offensive odour. Treatment of fresh dog faeces with Black Soldier Fly and Fruits Beetle
larvae reduced two 100g sample to 38g and 43g of modified dog‟s faeces within 4
weeks (62% and 57% reduction using BSF and FB larvae respectively. The modified
dog faeces were more friable and loosely textured and had lost their faecal structure and
their offensive odour (Fig.4.2).
Fig. 4. 1: Untreated dog faeces after 28 days incubation
Fig. 4. 2: Modified faeces: a) treated with FBL;
b) treated with BSFL after 28 days
A B

90
Time (week)
week 0 week 1 week 2 week 3 week 4
Conc.
of
NH
4-N
( g
ml-1
)
100
150
200
250
300Control
Treatment
Time (week)
week 0 week 1 week 2 week 3 week 4
Conc.
of
NO
3-N
( µ
gm
l-1)
50
60
70
80
90
100 Control
Treatment
Time( week)
wek 0 week 1 week 2 week 3 week 4
g S
O4-S
g-1
0
50
100
150
200
250
300Control
Treatment
Time (week)
week 0 week 1 week 2 week 3 week 4
gP
O4-P
g-1
400
500
600
700
800
900
1000
Control
Treatment
Fig. 4. 3: The effect of BSFL activity on indigenous; a) ammonium, b) nitrate, c)
sulphate and d) phosphate concentration in dog faeces(* Significantly different from
control, p=0.05).
*
*
*
*
*
*
*
*
*
a b
*
*
*
*
*
*
*
*
*
*
*
c d
µ µ

91
Time (week)
week 0 week 1 week 2 week 3 week 4
Conc.
of
NH
4-N
( gm
l-1)
0
50
100
150
200
Control
Treatment
Time (week)
week 0 week 1 week 2 week 3 week 4
Conc.
of
NO
3-N
µ(g
ml-1
)
40
60
80
100
120
140
160 Control
Treatment
Time(week)
week 0 week 1 week 2 week 3 week 4
g S
O4-S
g-1
0
50
100
150
200
250
300 Control
Treatment
Time (week)
week 0 week 1 week 2 week3 week 4
g P
O4-P
g-1
200
400
600
800
1000
1200 Control
Treatment
Fig. 4. 4: The effect of FBL activity on a indigenous a) ammonium, b) nitrate, c)
sulphate and d) phosphate concentration in dog faeces (* Significantly different from
control, p=0.05)
*
*
*
*
*
*
*
*
*
*
*
*
*
*
*
*
*
*
*
*
*
*
*
*
*
*
a b
c d
µ
µ

92
Time (week)
week 0 week 1 week 2 week 3 week 4
Co
nc. o
f N
H4
-N
(g
ml-
1)
80
100
120
140
160
180
200 Control
Treatment
Time(week)
Zero time week 1 week 2 week 3 week 4C
onc.
of
NO
3 -N
gm
l-120
30
40
50
60
70
80
90
100 Control
Treatment
Time (week)
week 0 week 1 week 2 week 3 week 4
g S
O4- s
g-1
160
180
200
220
240
260
280
300 Control
Treatment
Time (week)
week 0 week 1 week 2 week 3 week 4
gP
O4-p
g-1
400
500
600
700
800
900
1000Control
Treatment
Fig. 4. 5: The effect of length of incubation on a) ammonium concentration following
addition of (10µg/ (NH4)2SO4-N g) , b) nitrate concentration following the addition of
(10µg/ (NH4)2SO4-N g), c) S0 oxidation following the addition of (1% w/w) S
O and
d)
phosphate solubilisation following the addition of (1% w/w)calcium phosphate to dog
faeces modified with BSFL(* Significantly different from control, p=0.05)
*
*
*
*
*
* *
*
*
*
*
*
*
*
*
*
*
*
*
*
*
*
*
*
*
*
*
*
*
*
*
*
a b
c d
µ
µ

93
Time (week)
week 0 week 1 week 2 week 3 week 4
Conc.
of
NH
4-N
( g
ml-
1)
120
130
140
150
160
170
180
190
200
Control
Treatment
X Data
week 0 week 1 week 2 week 3 week 4
Conc.
of
NO
2 -N
( g
ml-1
)
60
70
80
90
100
110 Control
Treatment
Time(week)
week 0 week 1 week 2 week 3 week 4
gS
O4 S
g-1
0
20
40
60
80
100
120
140
160 Treatment
Control
Time (week)
Zero time week 1 week 2 week 3 week 4
gP
O4-P
g-1
200
300
400
500
600
700
800
900 Control
Treatment
Fig. 4. 6: The effect of length of incubation on a) ammonium concentration following
the addition of (10µg/ (NH4)2SO4-N g), b) nitrate concentration following the addition
of (10µg/ (NH4)2SO4-N g) , c) S0 oxidation following the addition of (1% w/w) S
O , d)
phosphate solubilisation following the addition of (1% w/w) of calcium phosphate to
dog faeces modified with FBL (* Significantly different from control, p=0.05)
*
*
*
*
*
*
*
*
*
*
*
*
*
*
*
*
*
*
*
*
*
*
*
*
*
*
*
a b
c d
µ
µ

94
Fig.4.3 shows the effect of BSFL activity on the concentration of the indigenous dog
faeces-related plant nutrients: ammonium, nitrate, sulphate and phosphate. Fig (4.3a)
shows that there was a significant reduction in ammonium concentration ever the entire
incubation period, while (Fig.4.3b) shows a similar decrease in nitrate concentration up
to week three, followed by a significant increase at week 4. Sulphate concentration in
the dog faeces also decreased following BSFL treatment over the entire incubation
period (Fig.4.3c), while phosphate concentrations were significantly reduced up to week
three and then significantly increased at week 4 (Fig.4.3d)
Fig.4.4 shows the effect of FBL on the indigenous plant nutrients in the dog faeces.
Ammonium concentrations were reduced to week 2, but significantly increased at weeks
3 and 4 (Fig.4.4a). Nitrate concentrations, in contrast were significantly reduced over
the entire incubation period (Fig.4.4b), as were sulphate concentrations; phosphate
concentrations were significantly reduced up to week 3, but significantly increased at
week 4 (Fig4.4d).
The effect of amendment with BSFL modified dog faeces with a source of plant
nutrients (ammonium, sulphate and insoluble phosphate) is shown in Fig.4.5. The
concentration of all of the released nutrients (ammonium, nitrate, sulphate and
phosphate) was generally significantly increased over the control, over the entire
incubation period. The same trend was seen in nutrient-amended faeces modified by the
addition of FBL (Fig.4.6).
As a generalization, the addition of both types of larvae to dog faeces significantly
reduced the concentration of indigenous plant nutrients over the entire four week
incubation period; exceptions to this were nitrate and phosphate concentrations in BSFL
treated faeces, where significant increases were seen at week 4 and 3 respectively and in
faeces treated with FBL, where ammonium concentrations were significantly increased
at weeks 2-4, and phosphate at week 4. While the addition of both larvae therefore
95
initially decreased levels of indigenous plant nutrients there was a trend in some of the
nutrients to increase the longer the incubation went on. This suggests that perhaps a
longer term exposure of dog faeces to the two larvae might have lead to increase in
ammonium, nitrate, sulphate and phosphate concentrations. While this would generally
be advantageous to the fertility of soils surrounding dog faeces, the potential long term
increase in nitrate could at first sight be considered detrimental as nitrate can be readily
leached to ground waters (where, when present in drinking water, it can cause blue baby
disease and gastric cancer in humans). However, the relatively small amounts of dog
faeces which are present, spread over large areas of soil, would likely make such
increased nitrate contributions to drinking water relatively insignificant.
The addition of ammonium, elemental sulphur and insoluble phosphate to dog faeces
which had been modified by the two larvae led to significant increases in nitrate,
sulphate and plant-available phosphate, results which shows that that dog faeces
contains the indigenous microflora required for the transformation of these amendments
(which simulate fertilizer addition). The increased friability and therefore increased
aeration of the dog faeces following larval modification is also like to result in
enhanced rates of nitrification, S-oxidation and phosphate solubilisation. Clearly the
microflora of dog faeces can act to modify added fertilizers and convert them to the
plant available form.

96
4.3.5. Determination of the effects of modified dog faeces as a compost additive on
plant seed germination and growth
Table 4. 1 shows that none of the seeds used germinated or grew in raw, untreated
dog faeces (Control DF), but all grew in untreated compost (control compost). Of the
seeds used only turnip germinated/grew in potting compost: modified dog faeces (FBL)
at a ratio of 25:75. At a ratio of 50:50 lettuce seed failed to grow in BSFL modified
faeces, but 80% of turnip seeds grew in this mix; 20 % of lettuce seeds grew in 50:50
FBL: compost and 40% of turnip seeds. At a ratio of 25:75 BSFL modified dog faeces:
compost 20% of lettuce seeds grew and 100 % of turnip seeds grew. The growth figures
for FBL modified faeces were relatively, lettuce 40%, and turnip, 80%. The results
given in Table 4.1 are shown visually in Figs. 4.7 and 4.8
Table. 4. 1: The percentage seed germination and growth planted in different ratios of in
modified dog faeces (treated with BSF and FB larvae) and potting compost
Planted seeds Control
Modifies
DF
75%
DF
50%
DF
25%
DF
Control
compost
Lettuce seeds planted in dog faeces
treated with BSFL
0% 0% 0% 20% 80%
Turnip seeds planted in dog faeces
treated with BSFL
0% 0% 80% 100% 60%
Lettuce seeds planted in dog faeces
treated with FBL
0% 0% 20% 40% 60%
Turnip seeds planted in dog faeces
treated with FBL
0% 40% 40% 80% 80%
DF= Dog faeces
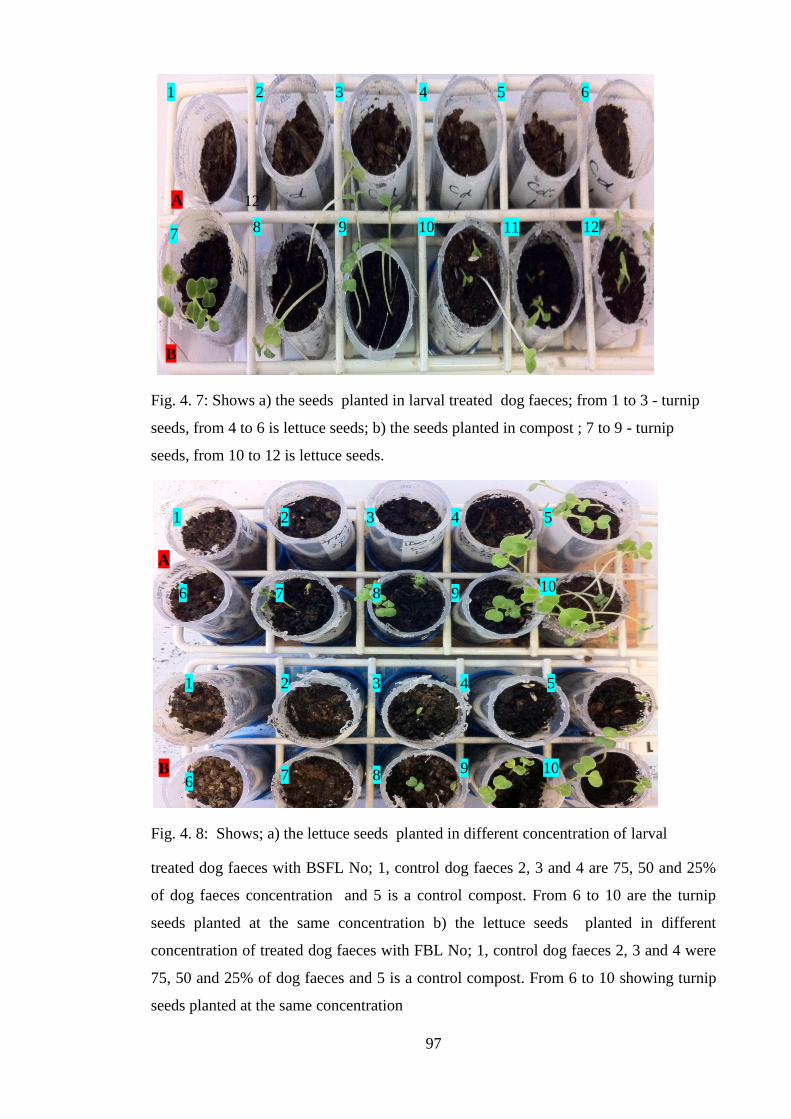
97
Fig. 4. 7: Shows a) the seeds planted in larval treated dog faeces; from 1 to 3 - turnip
seeds, from 4 to 6 is lettuce seeds; b) the seeds planted in compost ; 7 to 9 - turnip
seeds, from 10 to 12 is lettuce seeds.
Fig. 4. 8: Shows; a) the lettuce seeds planted in different concentration of larval
treated dog faeces with BSFL No; 1, control dog faeces 2, 3 and 4 are 75, 50 and 25%
of dog faeces concentration and 5 is a control compost. From 6 to 10 are the turnip
seeds planted at the same concentration b) the lettuce seeds planted in different
concentration of treated dog faeces with FBL No; 1, control dog faeces 2, 3 and 4 were
75, 50 and 25% of dog faeces and 5 is a control compost. From 6 to 10 showing turnip
seeds planted at the same concentration
A
B
1 2 3 5 4
6
1
7 8 9 10
2 3 4 5
6 7 8 9 10
3
A
12
5 6 4 2 1
11 10 9 8 7 12
A
B

98
Clearly, by increasing the ratio of compost to modified faeces the inhibitory effect of
raw dog faeces on plant growth was “diluted out”, thereby suggesting the possibility
that larval modified dog faeces could be used as a compost additive fertilizer, or perhaps
even be used as an agricultural soil fertilizer. These possibilities are however, limited by
the fact that dog faeces are widely separated in the environment, so that it would be
difficult to economically collect large amounts, making unviable it industrial use.
Domestic dog pounds and dog racing kennels might on the other hand provide a
sufficiently large source of faeces to make such use economic.
99
Chapter Five: The Antibacterial Activity of the
Haemolymph and Whole Body Extracts from BSFL
and FBL against Four Species of Bacteria

100
5. 1 Introduction
Like many other organisms, insects exhibit an efficient immunity response allowing
them to survive in environment and it is known that insects have various levels of
internal defence against microbial invasion (Cociancich et al., 1994), including the
ability, in some species, to externally secrete antibacterial compounds. Internal
components of Green Blow Fly maggots for example, have been used with success,
since 1930 (Simmons, 1935) to treat wounds infected with bacteria (Thomas et al.,
1999). In medicine, larvae of the Green Blow Fly (Lucilia sericata Meigen) are well-
known for having the ability to reduce and eradicate bacteria in human wounds
(Thomas et al., 1996); they can both ingest and digest such bacteria or may produce
active antimicrobial substances. A study by Murry and Hinckley (1992) showed that
earthworms (Eisenia foetida) can also reduce the population of Salmonella enterica in
horse manure.
The published work above shows a variety of results relating to the antibacterial
activity of larval extracts against several species of bacteria. Bexfield et al., (2004)
established that Lucilia sericata excretions/secretion inhibit growth of E. coli. Similarly,
they showed that Lucilia sericata extracts inhibit the growth of P. aeruginosa over a 24-
hour period ,whereas Jaklič et al., ( 2008) reported a prolonged lag phase of more than
5-hours, and Thomas et al., (1999) found only limited inhibition.
More recently, Mumcuoglu et al., (2001) found green fluorescent protein (GFP)–
producing E. coli in the alimentary canal of Fly larvae and found a decreasing intensity
of this marker during passage through the digestive tract. A battery of defence proteins
synthesized by insects in response to bacterial challenge may be responsible for this
decrease. Cecropins, and lytic proteins for example, have been isolated from larvae of
blow flies (Calliphora vicina) (Crowley and Houck, 2002). Another antibacterial
substance, p-hydroxycinnamaldehyde, isolated from the larvae of the Saw Fly,

101
Acantholyda parki S., has also been found to have a broad antibacterial spectrum
against both gram-negative and gram-positive bacteria (Leem et al., 1999).
The Black Soldier Fly, Hermetia illucens, is a beneficial insect because its larvae
feed on organic material, including the remains of plants, animals and humans. Such
larvae can degrade large amounts of waste quickly and efficiently than any other known
species of fly due to their potent mouthparts and digestive enzymes (Tomberlin et al.,
2002), The effect of larval excretion/ secretion (ES) against some common species of
bacteria found in dog faeces was studied in relation to determining how larvae can resist
bacterial invasion. Based on these findings, similar antibacterial substances might be
present in BSF and FB larvae.
The investigations reported in this Thesis were aimed at determining the ability of
Black Soldier Fly and Fruit Beetle larvae to reduce the number of pathogenic bacteria,
such as E. coli, Salmonella enterica and Staphylococcus aureus MRSA, in dog faeces.
Few studies have reported the ability of Black Soldier Fly or Fruit Beetles to
demonstrate immunity or the ability of their internal and external secretion, as
antibacterial agents.
The aims of the work reported in this Chapter was to investigate the presence of
antibacterial activity in the body extracts of BSF and FB larvae and their inhibitory
effects against four species of bacteria.
5.2. Materials and Methods
5.2.1. Culture of larvae
The two species of insects (larvae of Soldier Fly and Fruit Beetle) used in this study
were obtained from a commercial company (Ricks, Livefood.Co.UK), the third instar of
BSF larvae was purchased, while large sized FB larvae were used.
102
5.2.2. Antibacterial properties of BSF and FB larvae
5.2.2.1. Collection of excretion/secretion (ES) from larval whole-body and
haemolymph
Samples were placed separately in small boxes (10×15x30 cm) under laboratory
conditions. In order to collect the whole body and haemolymph extraction, samples 20g
of each larval species (approximately 200 larvae of BSF and 10 larvae of FB) were left
unfed for 4 days until they were free from gut residues. For whole body extracts and
larval secretions, larvae were washed with sterile deionised water (dH2O) and placed in
Petri-dish at -4oC for a few days. The larvae were then ground manually, using a mortar
and pestle, until they became homogenous. Haemolymph was collected from larvae by
clipping the anterior end near the cephalopharyngeal skeleton. The abdomen was then
squeezed gently to force the haemolymph to flow from the wound. The resultant
suspensions were then filtered (0.2µm) to remove any large particles and bacteria. The
excretion/secretion ES from each group of insect larvae were dissolved in 0.1 μ g/ml
protein in 0.1% trifluoroacetic acid (TFA) 1: 10 v/v. The suspension was placed on ice
for 6 hours and centrifuged four times at 14000 g for 30 min. The supernatant was then
harvested and separated into 15 ml centrifuge tubes; samples were used fresh or kept
frozen at -80°C for a few days until required (Sahalan et al., 2006; Huberman et al.,
2007).
5.2.2.2. Antibacterial assay
Antibacterial activity was determined as follows: Viable counts: the effect of BSF
and FB extract on the viability of E. coli, Salmonella enteric, Serratia marcescens and
S. aureus MRSA cells were monitored by inoculating 1ml of an overnight 5.0 x10⁶ cfu/
ml , into 9 ml nutrient agar with and without both extracts and incubating with shaking
at37°C (250g). Samples (100 μl) were removed at intervals, diluted serially and 100μl

103
of the diluted samples were placed on nutrient agar plates and incubated at 37°C for 24
hours. The colonies were then counted after overnight incubation and the results
expressed as colony forming units (CFU/ml). Turbidimetric analysis: bacterial cells
were incubated the extracted haemolymph and whole body; the final optical density of
the treated and untreated cultures were then measured at 600 nm.
5.2.3. Time killing curves for testing the bacterial activity
The time kill assays were prepared by inoculating one or two colonies of overnight
test bacteria into 9 ml of Mueller–Hinton broth and incubating for 18-24 hours at 37°C
with shaking, adjusting to a 0.5 McFarland 5 x 10⁶ CFU ml
-1. Haemolymph and whole
body were prepared separately by adding 4ml of haemolymph to 16 of ml of Mueller–
Hinton broth in 100 ml flasks, solutions lacking haemolymph acted as controls.
Treatments and control were incubated with shaking at 37°C and samples were
transferred to nutrient agar at 0, 2, 4, 6 and 8 hours. Viable counts were performed by
serially diluting each sample 10-fold in PBS and spreading 100 μml volumes from the
appropriate dilutions onto nutrient agar. After incubation at 37°C, for 20–24 h, viable
counts (CFU ml-1
) were determined to provide a quantitative determination of bacterial
growth colony forming units. To confirm the sterility of samples of ES prior to bacterial
inoculation, a loop (10 µl) of haemolymph and whole body secretions from each larvae,
TSB, and sterile dH2O were spread separately onto nutrient agar and incubated at 37°C
for 24 h .This procedure was repeated at four, eight and 24 h to ensure the media used to
prepare dilutions for viable counts was contamination-free.

104
5.2.4. Bacterial culture
Four species of bacteria were used in this study. Three species were Gram negatives
(Escherichia coli, Salmonella enterica and Serratia marcescens) were obtained from
previous works, whereas the forth, Staphylococcus aureus was a Gram positive. The
organisms were obtained from the Departmental Culture Collection.
Bacteria were maintained on nutrient agar at 4oC. New subcultures were prepared as
required (Alexander and Strete, 2001). In order to test that the colonies were viable, the
plates were incubated overnight at 37oC to allow growth.
5.2.5. Transmission Electron Microscopy of Bacteria treated with haemolymph or
whole body secretions of the two larvae
For transmission E/M, harvested cells were fixed in 3% glutaraldehyde and 0.1M
phosphate buffer overnight at 4°C, and then washed twice times with 30 min intervals at
4°C in 0.1M phosphate buffer. Cells were subjected to a secondary fixation with 2%
osmium tetroxide aqueous for 2 hour at room temperature and the previous wash step
was repeated. After this, cells at room temperature were serially dehydrated with 75%,
95%, and three times using 100% ethanol, the last one was dried over anhydrous copper
sulphate for 15 min. The cells were then placed in an intermediate solvent, propylene
oxide, for two changes of 15 min duration. Infiltration was accomplished by placing the
cells in a 50/50 mixture of propylene oxide/Araldite resin. The cells were then left in
this 50/50 mixture overnight at room temperature. Once this incubation was finished the
cells were transferred into full strength Araldite resin and left for 6-8 hours at room
temperature after which time they were embedded in fresh Araldite resin for 48-72
hours at 60°C. Semi-thin sections approximately 0.5 μm thick were cut on a Reichert
Ultracut E ultramicrotome and stained with 1% toluidine blue in 1% borax. Ultrathin
sections, approximately 70-90nm thick, were then cut using a Reichert Ultracut E

105
ultramicrotome and stained for 25 mins with 3% uranyl acetate in 50% ethanol followed
by staining with Reynold‟s lead citrate for 25 min. The sections were examined using a
FEI Tecnai Transmission Electron Microscope at an accelerating voltage of 80Kv.
5.2.6. Statistical analysis
All data were presented as means ± SD. (Standard deviation). The data was analyzed by
SigmaPlot©
11.0. P<0.05 was considered as significant.
5.3. Results and Discussion
Figures 5.1 and 5.2 show the effects of the haemolymph and whole body extract of
the BSFL and FBL respectively on the growth of E. coli. Both the BSFL extracts had
only a minor effect on the growth of E. coli from 2-8h (Fig 5.1). After 8h however,
BSFL haemolymp had a marked effect on E. coli. In contrast the addition of the
haemolymph and whole body extracts of the FBL produced an increase in numbers of
E. coli compared to the control, from hour 2-8 (Fig.5.2).
. Time(h)
0 time 2 h 4 h 6 h 8 h
Bac
teria
(log
10 C
FU/ m
l)
1e+7
1e+8
1e+9
1e+10
1e+11
1e+12
1e+13
1e+14
1e+15
1e+16
Control E. coli
Haemol'ymph secretion of BSFL+ E.coli
Whole body secretion of BSFL + E. coli
Fig. 5. 1: The effect of BSFL haemolymph and whole body extract on E. coli, growth
curve over 8 h.
*

106
Time (h)
0 time 2 h 4 h 6 h 8 h
Bct
eria
( lo
g10 C
FU
/ m
l)
1e+6
1e+7
1e+8
1e+9
1e+10
1e+11
1e+12
1e+13
1e+14
1e+15
Control E. coil
Haemolymph secretion of FBL +with E. coli
Whole secretion OF FBL + E.coli
Fig. 5. 2: The effect of FBL larvae haemolymph and whole body extract E.coli , growth
curve over 8 h.
Time(h)
0 time 2 h 4 h 6 h 8 h
Bac
teria
( lo
g10 C
FU/ m
l)
1e+7
1e+8
1e+9
1e+10
1e+11
1e+12
1e+13
1e+14
1e+15
Control Salmonella enterica
Haemolymph secretion of BSFL +Salmonella enterica
Whole secretion of BSFL + Salmonella enterica
Fig. 5. 3: The effect of BSFL haemolymph and whole body extract on S.enterica growth
curve over 8 h.

107
Both the haemolymph and whole body extract of the BSFL inhibited the growth of
S. enterica at hour 2 of the incubation period, although by hour 4, there was little impact
of both extracts on bacterial numbers; the inhibition trend for both bacteria then
resumed from hours 6-8 (Fig5.3).
Haemolymph of the FBL had a general slight stimulatory impact on numbers of
Salmonella enterica over the entire incubation period, with the effect being at its lowest
in the middle of the 8 hours. The whole body secretion in contrast, reduced bacterial
numbers over the entire incubation period (Fig.5.4).
Time (hour)
0 time 2 h 4 h 6 h 8 h
Bac
teria
(lo
g10 C
FU
/ ml)
1e+6
1e+7
1e+8
1e+9
1e+10
1e+11
1e+12
1e+13
1e+14
1e+15
1e+16
Control Salmonella enterica
Haemolymph secrection of FBL + Salmonella enterica
Whole secretion of FBL + Salmonella enterica
Fig. 5. 4: The effect of FBL haemolymph and whole body extract on S.enterica growth
curve over 8 h.

108
Time(h)
0 time 2 h 4 h 6 h 8 h
Bact
eria (
log
10 C
UF
/ lm
)
1e+6
1e+7
1e+8
1e+9
1e+10
1e+11
1e+12
1e+13
1e+14
1e+15 Control MRSA
Haemolyph secretion of BSFK + MRSA
Whole secretion of BSFL + MRSA
Fig. 5. 5: The effect of BSFL haemolymph and whole body extract on S.aureus MRSA,
growth curve over 8 h.
Both of the extracts from the BSFL had a general inhibitory effect on the growth of
S. aureus, the effect being most marked with the haemolymph, which inhibited growth
over the entire incubation period (Fig.5.5). The haemolymph extract from the FBL
inhibited the growth of MRSA between 4 and 8 hours (Fig.5.6), while the whole body
extract increased numbers at 6hours.
*

109
time(h)
0 time 2.0 h 4.0 h 6.0 h 8.0 h
Bac
teria
( lo
g10 C
FU/ m
l)
1e+7
1e+8
1e+9
1e+10
1e+11
1e+12
1e+13
1e+14
1e+15
Control MRSA
Haemolymph secretion of FBL+ MRSA
Whole secretion of FBL + MRSA
Fig. 5. 6: The effect of FBL haemolymph and whole body on Staphylococcus aureus
MRSA, growth curve over 8 h.
Time (hour)
0 h 2 h 4 h 6 h 8 h
Bac
teria
(lo
g10 C
FU
/ml)
1e+7
1e+8
1e+9
1e+10
1e+11
1e+12
1e+13
1e+14
1e+15
1e+16
1e+17 Control of Serratia macescens
Haemolymph secretion of BSFL + Serratia macescens
Whole secretion of BSFL + Serratia macescens
Fig. 5. 7: The effect of BSFL haemolymph and whole body on Serratia marcescens,
growth curve over 8 h.
*

110
Both the haemolymph and whole body extract of BSFL inhibited the growth of
S .marcescens over the entire incubation period, the effect of the haemolymph extract
being most marked at the end of the growth period ((Fig.5.7). The whole body extract
of the FBL had less effect on the growth of S. marcescens over the entire incubation
period, while the haemolymph had a slight, and very transient stimulatory effect, at the
6h point only; the haemolymph increased numbers at the end of the incubation period
(Fig.5.8).
Time (hour)
0 h 2 h 4 h 6 h 8 h
Bact
eria (
log
10 C
FU
/ m
l)
1e+6
1e+7
1e+8
1e+9
1e+10
1e+11
1e+12
1e+13
1e+14
1e+15Control of Serratia nacescens
Haemolymph secretion of FBL + Serratia macescens
Whole secretion of FBL + Serratia macescens
Fig. 5. 8: The effect of FBL haemolymph and whole body extract on Serratia
marcescens, growth curve over 8 h.

111
Table. 5. 1:The effect of the two species of larval haemolymph and whole body
secretions on the four species of bacteria.
Bacterial strains Gram strain
BSF larvae FBL larvae
Haemolymph Whole
body Haemolymph
Whole
body
E. coli Gram -ve + + - -
Salmonella enterica Gram-ve - - - +
S. aureus MRSA Gram +ve + - + -
Serratia marcescens Gram -ve + + - -
Table. 5.1 shows that the effect of the extracts on bacteria varied with different species
of larva and with different types of extracts used. Clearly, no overall generalization can
be made about the effects of BSFL and FBL extracts on bacteria can be observed.

112
Fig. 5. 9: The effect of larval components on the morphology of E. coli observed by
TEM, a) control for BSFL, b) whole body extract of BSFL, c), haemolymph of BSFL;
d) control for FBL, e) whole body extracts for FBL and g) haemolymph of FBL.
Fig. 5. 10: The effect of larval components on the morphology of S.aureus observed by
TEM, a) control for BSFL, b) whole body extract of BSFL, c), haemolymph of BSFL;
d) control for FBL, e) whole body extracts for FBL and g) haemolymph of FBL.
g
a c b
e d
a c b
d e g

113
The effects of the two larval extracts on E.coli and S. aureus as observed under the
transmission electron microscope are respectively shown in Figs. 5.9 and 5.10. The
haemolymph extract of BSF is the only one which has a readily observed, and marked,
effect on the morphology of E.coli (Fig.5.9c); note that the cells are seen to lose some of
their electron dense structure, but that cell lysis is not evident. In the same way, the
haemolymph of BSFL is the only fly body extract which has an effect on the cell
structure of S. aureus; again there is no obvious evidence of cell lysis (Fig.5.10c).
Interest in the possible antibacterial activity of the body extracts of the two flies used
here was based on two possibilities. Firstly that an antibacterial agent, possibly a protein
might be obtained from either or both of the extracts and secondly that BSFL or FBL
might be used in infected wounds in the same way that larvae of the Green Blow Fly (
Lucillia sericata) are used in maggot therapy (Boxfield et al.,2004). The latter
possibility is perhaps unlikely based on the large size of the two fly larvae compared
with maggots, a fact which would restrict their application to open wounds. Maggot
therapy is extremely effective, so it is unlikely that the two larvae studied here would
replace this approach to wound treatment. Similarly while extracts from the two larvae
have been shown to inhibit the growth of bacteria, their effectiveness is unlikely to be
comparable to antibiotics like penicillin.
Conclusion: In conclusion, whole body extracts and the haemolymph of the two fly
species used here do have antibacterial effects, but such inhibitory effects are not
consistent, both in relation to the individual fly species, or in relation to the type of
bacterium investigated. The addition of the fly larvae to faeces is likely however, to lead
to reduction in overall bacterial numbers. It seems unlikely that BSFL or FB larvae
could be usefully applied to the control of bacterial infections in human or animal
wounds.

114
Chapter Six: The Number of Bacteria in Grassed Soil
of Public Parks Contaminated with Dog Faeces and
Effect of Faeces-Volatiles on Plant Growth.

115
6. 1. Introduction
The number of dogs in the UK has increased dramatically in recent times especially
in cities, and their waste represents a considerable source of pollution in relation to
humans and the environment (Carvalho et al., 2009). Dog faeces are known to carry a
large and various microbial and parasite population which can cause diseases and
public-health problems (Baxter and Leck, 1984). Dog waste is linked with more than 60
zoonotic diseases and provides a serious public-health problem (Rinaldi et al., 2006).
Irresponsibility on the part of dog owners in relation to the disposal the dog waste
represents a source of potential pathogens in public areas such as playgrounds, parks,
gardens, public squares and sandpits (Schantz, 1994; Rubel and Wisnivesky, 2005); the
risks to young children being particularly obvious. Children may, by accident consume
contaminated soil or grass, or touch their mouths or eyes with hands contaminated with
dog faeces or otherwise handle bags left hanging outdoors on trees branches and in
parks (Fig.6.1) ; people using hand activated wheelchairs and active sports players may
also be at risk (Jackson, 1995). Viable pathogens present in dried canine faeces can also
be spread by the wind and are carried into dwellings and workplaces on soiled shoes.
The aim of the work reported in this Chapter was to study faecal contamination
accumulation in a local public park, a problem which is likely to be a risk to the health
of young children and parks visitors. In addition, the work focuses on the extremely
undesirable habit of some dog owners to remove dog faeces from the environment and
leave them in a plastic bag on the parks, a habit which contributes to a potentially bigger
problem than does exposed faeces. The effect of dog faeces volatiles on plant growth
will also be touched upon.
116
6.2. Materials and methods
6.2.1. Samples collection from public parks
The following protocol was used to determine the presence of E. coli and Salmonella
enterica in addition to other heterotrophic bacteria (as determined using Plate Count
Agar) in soil samples collected from a public park in Sheffield UK (a grassed area of
playing field behind the former Lodge Moor Hospital). Four samples of soil were taken
(0 - 3 cm) from under surface grassed soil contaminated with dog faeces (samples were
taken directly from soil which had long exposure to faeces and not from under fresh
material); the last sample was taken from an area not contaminated with faeces, i.e. an
uncontaminated control. Samples (1 g) were suspended in (9 ml) autoclave-sterilised
water in sterile 15 ml tubes and shaken at 70 g for 30 min. A serial dilution was
performed, then dilutions from 103
to 106 were taken and (100 ml) of this suspension
was then spread onto the surface of selective media for E. coli and Salmonella Spp.
XLT4 and Plate Count Agar; the plates were then incubated in triplicate at 37oC
overnight. Presumptive isolation was based on the use of selective media such as E. coli
and XLT4 Salmonella Spp. agar media, followed by use of the Gram stain. In addition,
the 16s rRNA gene dependant technique was used; DNA being extracted according to
the Anachem Key prep-Bacterial DNA extraction kit; bacterial 16SrRNA gene was then
amplified and sequenced.
6.2.2. Effect of incubation of dog faeces in plastic bags left under ambient outside
conditions
A variety of fresh dog faeces were collected from dog bins from Weston Park.
Samples were placed in black plastic bags and left exposed to ambient weather
conditions on the roof of the Firth Court building from the middle of May until the
middle of June, 2012. Samples (1 g) of the faeces were diluted in (9 ml) in sterilised

117
water. Then a serial dilution from 103 to 10
7 was performed and (100 µl) of the final
suspension was then spread onto plates contained the selective media: HiCrome E. coli
agar and Salmonella Spp XLT4, as well as Plate Count Agar. Plates were incubated in
triplicate at 37oC for 18-24 h.
Fig. 6. 1: Plastic bags containing dog faeces bags obtained from Sheffield parks
6.2.3 The effect of gasses (odour) from dog faeces on plant growth
Two plastic containers were prepared, one contained compost soil divided to two
parts each one include 200 g of compost into which was planted lettuce seeds, and the
other turnip; controls not receiving faeces-gasses were also set up. The gasses were
transferred, using a pump, from a large Erlenmeyer flask containing 200g dog faeces.
The gasses then passed through holes in the bottom of the plant growth container and
passed over the growing seedlings (Fig. 6.2). Seeds (50 each of lettuce and turnip) were
planted and watered twice a week and left at room temperature in the light. The
experiment was continued for two weeks when the growth was visually assessed, i.e. for
four weeks. The samples were aerated and suspended with unoccupied space under
natural conditions.

118
Fig. 6. 2: Airtight container contains 200 g of fresh dog faeces, the dog faeces gases
were pumped via the tube into the plastic box containing compost planted with lettuce
or turnip seeds.
Plastic
container
Dog
faeces
Air pump

119
6.3 Results and Discussion
Total bacteria count
Sample/ location
1 2 3 4 5
Bacte
ria (
log
10 C
FU
/ g)
0
2e+4
4e+4
6e+4
8e+4
1e+5
1e+5
1e+5
2e+5
2e+5
2e+5
E. coli
Salmonella enterica
Fig. 6. 3: The presence and population density of E. coli and Salmonella sp in five
locations in public areas of Sheffield (location 5 is the uncontaminated grass sample).
6.3.1. Occurrence of E. coli and S. enterica in dog faeces contaminated grassed-soil
Escherichia coli and Salmonella enterica were isolated from all four sites (Fig. 6.3),
while no isolates were obtained from the fifth location which was uncontaminated with
dog faeces. The number of E. coli varied from site to site (from 104 to 10
5 CFU/g); E.
coli was isolated in highest numbers. The isolation of these pathogenic bacteria from
playing fields frequented by children is obviously a major public health concern since
120
pathogenic bacteria could be picked up from these soils, either on shoes, or by transfer
from contaminated skin to the ears, eyes or mouths of infected children (and of course,
people in general) from where they could cause disease.
Several studies have concluded that there is a high potential risk to human health of
contaminated soil and animal faeces, and direct or indirect contact with dog faeces has
been implicated in several human infections with E. coli and Salmonella enterica
(Kudva et al., 1998). The risk of the transfer pathogenic bacteria to young children from
dog faeces in public areas-notably gardens, parks and playing-field probably is critical
because people do not always know that they have been exposed to contamination and
can touch their eyes or mouth with faeces without realising it. Contaminated garden
and park soils could possibly influence the health of large number of adults and children
and it is therefore important that research and development is carried out on risk
assessment and also to develop measures to mitigate such contamination (Alloway,
2004).
6.3.2 Effect of leaving dog faeces in plastic bags on bacterial numbers
An undesirable and unhygienic habit has recently developed amongst some dog
owners in Sheffield (and presumably other parts of the country) of picking up their dog
waste, transferring it to polythene bags and then leaving the filled bags in the
environment as litter, rather than depositing them in dedicated dog-waste containers.
A wide range of potentially pathogenic bacteria were isolated from dog faeces left at
ambient conditions in plastic bags (Fig.6.4). The results presented in Fig.6.5 show that
numbers of E.coli and S. enterica increased in the dog faeces, left in sealed plastic bags,
over the 28 day incubation period; as did the number of total heterotrophic bacteria.

121
Fig. 6. 4: Bacterial species isolated from dog faeces left in polythene bags; a) red
colonies of E. coli, and blue Enterococcus Spp, b) E. coli, c) Salmonella enterica, d)
Staphylococcus aureus.
a b
c d
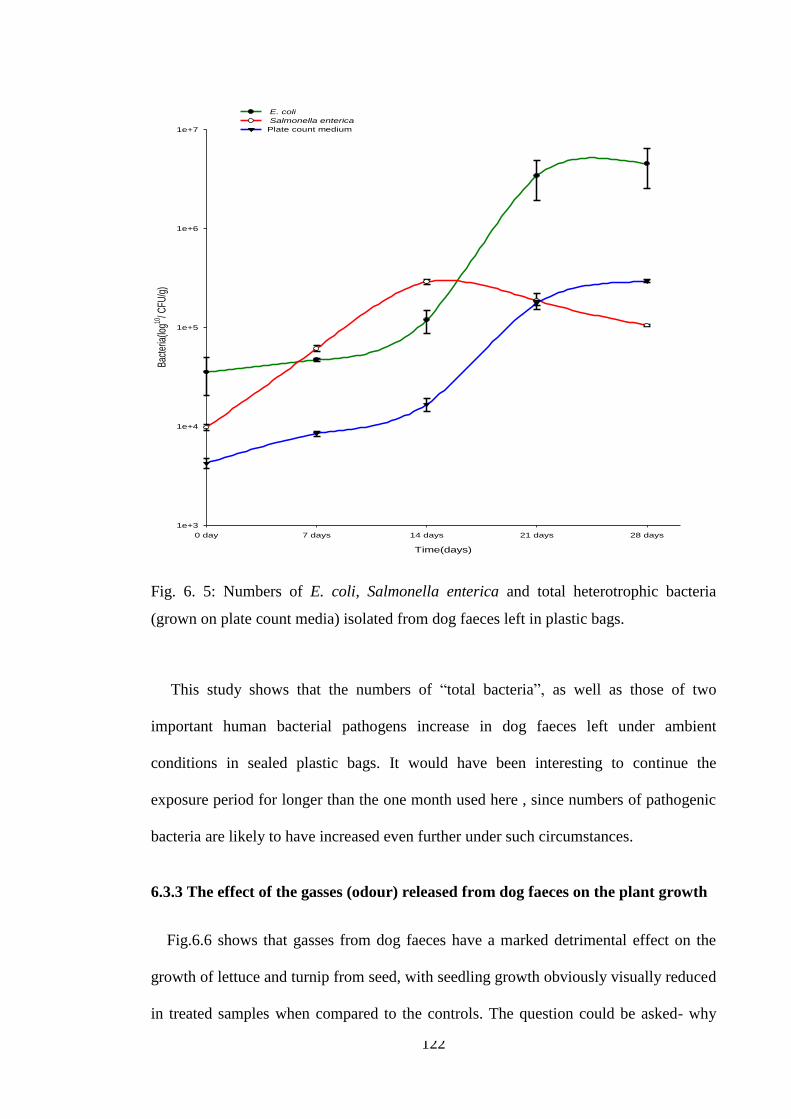
122
Time(days)
0 day 7 days 14 days 21 days 28 days
Bac
teria
(log10
/ CFU
/g)
1e+3
1e+4
1e+5
1e+6
1e+7
E. coli
Salmonella enterica
Plate count medium
Fig. 6. 5: Numbers of E. coli, Salmonella enterica and total heterotrophic bacteria
(grown on plate count media) isolated from dog faeces left in plastic bags.
This study shows that the numbers of “total bacteria”, as well as those of two
important human bacterial pathogens increase in dog faeces left under ambient
conditions in sealed plastic bags. It would have been interesting to continue the
exposure period for longer than the one month used here , since numbers of pathogenic
bacteria are likely to have increased even further under such circumstances.
6.3.3 The effect of the gasses (odour) released from dog faeces on the plant growth
Fig.6.6 shows that gasses from dog faeces have a marked detrimental effect on the
growth of lettuce and turnip from seed, with seedling growth obviously visually reduced
in treated samples when compared to the controls. The question could be asked- why

123
was the effect of dog faeces volatiles on plant growth determined, and not the direct
effect of the faeces themselves? The answer is that it would have been difficult the
separate the likely toxic effects of dog faeces, on plant growth, from the positive
fertilizer effect resulting from the fact that the faeces are rich in plant nutrients like
ammonium and nitrate. Although the nature of the dog faeces gases and volatiles was
not determined, the observed inhibitory effects presumably result from the inhibition of
seed germination or shoot growth, following the production of a cocktail of toxic gases,
including ammonia in high concentration (Van der Eerden, 1982). Several studies have
discussed emissions from animals and researchers have obtained varying results; clearly
research is needed to discover the impact of gases, emitted from animal manures (such
as ammonium) on plants (Kebreab et al., 2006). The effect of ammonia on vegetation
has been noticed since 1896, when König observed injuries to the surrounding
vegetation near a soda factory where ammonia was accidentally released. Garber (1935)
appears to have been the first to expose plants to NH3 and to prove its phytotoxic effects
(Fangmeier et al., 1994). Ammonia can cause various types of injury, including
necrosis, growth reduction, growth stimulation and increased frost sensitivity. Several
plant species have been assessed for sensitivity to ammonia. Some conifer species were
relatively sensitive to low concentrations in the long term; some cultivars of cauliflower
and tomato were relatively sensitive to somewhat higher concentrations for a short term.
Special attention has been paid to plant injury around intensively managed livestock.
The emission from these sources consists of a large number of compounds, ammonia
proving to be the main toxic component (Van der Eerden, 1982).

124
Fig. 6. 6: The effect of gas (odour) emission from dog faeces on vegetable growth; a)
turnip treated with dog faeces gasses and, b) lettuce treated with dog faeces gasses c)
control turnip seeds d) control lettuce seeds.
Dog faeces represent a potential source for spreading pathogenic bacteria such as E.
coli and Salmonella enterica, bacteria which represent an obvious risk human health.
Bacterial pathogens from dog faeces could infect young children and others playing, or
using, parks etc (including of course dog owners). Dog faeces have also been shown
a D b
c
d

125
here to produce gasses which are injurious to plant germination and/ or growth, and are
also likely to be directly inhibitory to plant growth.
There has been a welcomed trend of late for dog owners to act responsibly by picking
up waste from their dogs, placing this in plastic bags and than putting these bags into
special local council run dog-waste containers, from where they are transported and
incinerated (Fig.6.7).
Fig. 6. 7: A typical dog waste bin used in public parks in the UK (author‟s photograph).
Unfortunately there is another increasing trend, namely the discarding of such bags
filled with dog faeces into the local environment. The results presented here show that
this practise potentially increases the problem of dog faeces because the sealed
polythene bags provide an environment where pathogenic bacteria (and presumably
other pathogens, like viruses) can rapidly increase. Such an increase in pathogen
numbers was seen during a relatively cool UK summer and could be much greater
where summer temperatures are higher. In addition, the possibility exists that the
environment inside the bags could become anaerobic and select for, or otherwise
encourage the growth of anaerobic, pathogenic bacteria, such as species of Clostridium.
Clearly this habit should be discouraged. In fact it would be better to encourage dog

126
owners to leave dog faeces in the open air, where they can break down naturally (with
pathogens being outcompeted by saprophytic microbes) than to allow them to discard
the faeces in sealed bags which, when broken (by for example a child sliding on them)
could release an increased, and potentially more dangerous, pathogen load.
The survival of bacteria in animals waste under environmental condition has been
studied by, amongst others, LaGoy, (1987), who showed that E. coli in cattle manure
survived for 42 to 49 days at 37°C, for 49 to 56 days at 22°C, and for 63 to 70 days at
5°C (LaGoy, 1987) Another study of E. coli in manure commutation revealed that the
pathogen may survive for up to 47 days, 4 months, and 21 months in bovine, aerated
ovine, and non-aerated ovine manure, respectively (Kudva et al., 1998).
Himathongkham et al, (1999) based on their research findings, recommended that cow
manure should be survive for 105 days at 4°C or 45 days at 37°C to achieve a 5-log10
reduction of both E. coli and Salmonella enterica serovar (Himathongkham et al.,
1999). These results indicate that E. coli can continue in bovine faeces for an extended
period of time and that bovine faeces are a potential vehicle for transmitting the
pathogen to cattle, food, and the environment (Jiang et al., 2003). However, pathogenic
bacteria such as E. coli and Salmonella Spp. can survive in animals manure or soil up to
70 days under 140F (McLaughlin, 2002). A study by Kudva et al, (1998) reported that
E. coli survived in the manure for 21 months, and the numbers of bacteria recovered
ranged from <102 to 10
6 CFU/g at different times over the course of the experiment.
Conclusion: In conclusion dog faeces represent an important means of transfer of
bacterial pathogens from dogs to humans via the soil. The reprehensible recent habit
amongst some dog owners of leaving faeces in sealed plastic bags is likely to greatly
exacerbate this problem.

127
Chapter Seven: Production of Biodiesel from Dog
Waste by BSF and FB Larvae- A Potential Solution To
The Dog Faeces Problem
128
7.1. Introduction
Biodiesel is receiving increased attention as a renewable source of fuel. Biofuels can
be made from a variety of feedstocks including starch, vegetable oil, or animal fats as an
fuel alternative to help reduce consumption of petroleum. Alternatively cheap waste,
such as dairy manure can be used to produce bioethanol (Liao et al., 2008; Predojevic
2008) and is hoped that, as well as producing biofuels, a reduction can be made in the
amount of waste which has to be disposed of to the environment (Ann et al., 2002). In
addition to biodiesel, other fuels can be obtained from wastes as is discussed below.
7.1.1. Fuels from wastes
Many fuels can be derived from waste refuse can be combusted directly in an
incinerator to provide power and chicken litter can (Ferrer et al., 2005) , like dog faeces,
be dried and directly combusted (Li et at., 2011).
7.1.2. Anaerobic digestion to methane
The anaerobic fermentation of animal fats, vegetable oil, starch and sugar can be
achieved using conventional technology and results in the production of methane, i.e.
biogas (Demirbas, 2008). Digestate, a solid by-product which can be used as a fertilizer
is also produced. Dog faeces can fuel an anaerobic digester and produced methane. This
might be done in a large centralized facility, but it is more likely that it will be done on
a more local scale. Methane is of course a more potent green house gas than carbon
dioxide and when burnt its releases CO2; any treatment will however solve the direct
problem of dog waste removal. In the US, and increasingly world-wide, dog waste is
being turned into a local energy source (Demirel et al,. 2010). Dog owners throw the
waste into a feeding tube, turn on a hand crank, so that the anaerobic biogas digester can
decompose the faeces and make it into a burnable methane gas. The gas is then used to

129
power the local street. i.e. the so-called “Park Spark Project”. A criticism of this
approach is that during methane production, pathogens are not removed content
completely a potentially harmful product will remain after digestion; such residues can
however, be treated in the conventional sewage treatment system (Demirel et al,. 2010).
Biofuel or agrofuel is obtained from biomass and may be produced in a solid, liquid
or gaseous form. The utilization of waste biomass as a source of energy can decrease
problems relating to waste management , pollution, greenhouse gaseous emissions and,
as a result, the burning of fossil fuels. Some 19 million tons of oil equivalents could be
derived from biomass, with some 46% being obtained from bio-wastes like farm waste,
agricultural waste, municipal solid waste and other biodegradable waste streams
(Demirbas., 2008)
7.1.3. Landfill methane
Landfill waste undergoes anaerobic digestion to landfill gases (LFG). Such gases can
be burned and looked up to as a source of renewable energy (Themelis and Ulloa.,
2007). The LFG is made of around 50% methane and since it is equivalent to natural
gas can be used to generate electricity for public consumption or alternatively it can be
burned for heat. If LFG is not used properly, it would be released to the atmosphere. and
since methane is a greenhouse gas, it has a global warming potential of 23 times carbon
dioxide, i.e. one ton of methane results in the greenhouse gas equivalent of 23 tons of
carbon dioxide. Harvesting and burning LFG reduces the global warming potential by a
factor of 23 and energy is provided for heat and power. A typical landfill power plant
can supply power to 1900 homes and avoid 6000 tons of methane per year from
entering the atmosphere. As well as eliminating 18,000 tons per year of carbon dioxide
by fossil fuel replacement (De Montfon, 2012)

130
7.1.4. Biodiesel from waste cooking oils
Each week the UK population uses in excess of 1,500 tonnes of cooking oil. Large
scale producers of waste oil like restraints, chip shops and industrial food producers
have their waste oil removed by licensed collectors, and around 100,000 tonnes of
recoverable waste oil produced each year within the UK (Phan and Phan., 2008).
Currently most of this recovered oil is treated and added to animal feed. The EU
however, its use for pig feed due to several food scares related to vegetable oil and a
similar ban may soon apply to cattle also. Such oilcan however, be converted into
biodiesel (Silvis, 2006). The waste vegetable oil currently used to produce UK
biodiesel is mostly rapeseed oil, whose trans-esterification produces RME (Rape Methyl
Ester), or more properly, FAME (Fatty Acid Methyl Ester) which is the correct
chemical term for biodiesel produced from any oil or fat using methanol as the alcohol
for the production process (Zhang et al., 2003).
7.1.5. Methane from anaerobic digestion
Anaerobic digestion (or gasification) is the use of bacteria to decompose organic
matter in the absence of oxygen to produce a gas containing 60% methane, 40% carbon
dioxide together with a mix of solid and liquid fertiliser, and since anaerobic digestion
does not produce anymore carbon dioxide than would be produced by the natural
decomposition of the waste, it regarded as being „carbon neutral‟ In this process, waste
is pumped once a day into the digester, and remains there for about 10 to 40 days, when
the internal of the digester must reach between 30 and 70 degrees C. Any mix of
organic waste mater can be used, including animal and human sewage, crop residues,
newspaper, abattoir waste and agricultural and food processing waste. Since the
resultant product is a gas this fuel is more applicable to electricity generation, rather

131
than a transport fuel; although methane could be liquefied for vehicular use (Chynoweth
et al., 2001).
7.1.6. Oil from tyre pyrolysis
Around 40 million tyres (440,000 tonnes) per year are produced world-wide. Currently
the UK recovers some value from 70% of the total used tyres produced, with the rest
going to landfill. In 2006 a ban on tyre-landfill was introduced, so tyres are increasingly
being treated by pyrolysis, a process of thermal degradation in the absence of oxygen at
elevated temperatures (430°C) and pressures(Shulman, 2004). The products of pyrolysis
(from organic waste) are gases, small quantities of liquid, and a solid residue containing
carbon and ash. The gases produced in the process can then be re-used to provide the
heat required to continue the process (Makarov and Drozdovskiĭ., 1991 ).
7.1.7. Biodiesel production
Currently, biodiesel is generally used as a diesel fuel additive to minimize particulate
release and the production of carbon monoxide, and hydrocarbons. The relatively high
production cost is the main reason why biodiesel is not used as a primary fuel. Three
quarters of the cost of biodiesel is derived from the feedstock, such as soybean oil,
rapeseed oil and sunflower oil. In addition, the use of limited food supplies for the
production of biodiesel is not feasible for developing countries like China. As a result,
non-food feedstocks such as Jatropha curcas, Chinese tallow and microalgae are being
developed as sources of biofuels; the use of these sources however, is certainly not
without problems. On the other hand, organic wastes such as animal wastes, residential
wastes (e.g., household), commercial and institutional wastes are generated in large
quantities in developing countries and present a cheap from of organic wastes which
would otherwise present a environmental pollution problem and so can act as a useful
resource for biodiesel production (Ma and Hanna., 1999)

132
7.1.8. Biodiesel production by BSFL
Animal faeces waste can be used for biodiesel production, with the resultant
biodiesel being comparable to rapeseed based biodiesel, and met the European biodiesel
standard, EN14214. Among the organic wastes evaluated, chicken manure appears to be
the best one for achieving high rates of BSFL biomass production. About 30% of the
waste-grown BSFL biomass can be extracted as crude fat, which can be used for the
production of biodiesel; the resultant fuel properties of the BSFL fat-based biodiesel,
including density (885 kg/m3), viscosity (5.8 mm2/s), and cetane number (53) were
found to be similar to those of rapeseed oil based biodiesel (Li et al., 2011a). To date
there appear to be no reports of the use of dogs faeces to produce biodiesel either alone
or in conjunction with BSFL or FBL. Among the organic wastes evaluated chicken
manure was found to be the best for maximal BSFL growth (327.6 g), which gave 8.5 g
crude fat production after petroleum ether extraction. An optimized two step conversion
process was performed, yielding 91.4 g of biodiesel with a biodiesel yield of 93% from
the crude fat contents (Li et al., 2011c). Cattle, pig and chicken manure can also act as
a food source for the production of high fat, nutrient–rich larvae. Fat-rich BSFL can be
used to degrade organic waste and produce biodiesel as well as providing foods from
animals notably chickens(Li et al., 2011b).
The results of recent studies have shown that BSFL-produced fatty acids could be
a valuable feedstock for biodiesel production having two advantages over crop oil-based
biodiesel, namely:
1) It does not compete with food resources or land use
2) It uses „„waste nutrients‟‟ for insect growth.
The aim of the work reported in this Chapter was to determine if the larvae used here
can convert dog faeces into a potentially viable source of biodiesel
133
7.2. Materials and Methods
7.2.1. Samples collection
Black soldier fly and fruit beetle larvae were obtained from LiveFood Co., while dog
faeces samples were collected from local dog waste bins. The faeces were distributed in
two boxes, each containing 100g of dog faeces. Ten BSFL were then added to the
waste (1000 larvae per kg dog waste) according to Li et al., ( 2011) and ten FB larvae
were similarly added to the dog faeces. The treated faeces were incubated under
laboratory conditions for 28 days; samples were obtained in triplicate at weekly
intervals.
7. 2.2. Extraction of lipids
In order to extract lipids from dog faeces and larvae, the larval whole body were
ground and then weekly samples (1 g) of all samples were added to Eppendorf tubes 1.5
ml and frozen at -80oC overnight, then freeze dried (lypophilized) for 24-48 hours. To
estimate the weight of biomass the Eppendorf tubes were re-weighed. Samples were
transferred to centrifuge tubes (50 ml), 20 ml of methanol/ chloroform (2:1 v/v) were
added; the contents were then sonicated for 1 min on ice. Samples were centrifuged at
5000 g for 5 mins and transferred to a centrifuge tubes in order to determine the volume
of supernatant. Then 2:1 methanol: chloroform, and chloroform and 1% NaCl (1 g NaCl
in 100 ml) was added to give 2:2:1 methanol: chloroform:1%NaCl. (13.33ml
methanol:13.33 chloroform:6.7 1%NaCl) (Fig 7.1). Samples were then centrifuged for 2
mins at 5000 g. The centrifuge tubes were labelled and weighed then transferred to a
chloroform phase into pre-weighed sample were left in fume cupboard with tops open to
evaporate until dry. The centrifuge tubes were then re-weighed and the weight of lipids
calculated. (Lu et al. 2008; Chiu et al. 2009)

134
7.2.3.Detection and measurement the fatty acid using a combined mass
spectrometer and gas chromatographic GC/MS
The harvested lipids (10mg/ml) of dog faeces and BSF and FB larvae before and
after being fed on dog faeces were dissolved in chloroform. The samples were then
subjected to gas chromatography-mass spectrometry GC/MS. The GC/MS analyses
were performed using a Perkin Elmer Turbo mass spectrometer detector (software
version 5.4. Perkin Elmer). Injector and oven temperatures were set as above with a
transfer line temperature, 260°C. The injection volume was 1.0µl of dog faeces and
larvae and was injected in a capillary column (Zebran ZB-S, 30 m length x 0.25 mm
diameter x 0.25μm phase thickness) (see appendix 4). The oven temperature was
programmed from 60°C and increased at the rate of 10°C/min to a final temperature of
260°C, which was held at 260°C for 10 min. High purity helium was used as carrier gas
at 1ml/min, split ratio and 1:25; Electron ionization (EI) spectra were obtained at 70 eV;
the scan range was 50-450 m/z at 30 min. The identity of each compound was
determined by comparison of its retention index (RI) as well as of its total ion
chromatogram with the NIST mass spectral library version 5.4.2 (Albano et al., 2011;
Sivasamy et al., 2011).

135
7.3. Results and Discussion
7.3.1. Extraction of biodiesel from larvae
A visual representation of the fact that lipids could be extracted from the faeces on
which larvae were grown and from the larvae themselves is shown in Fig.7.1. Table 7.1
shows the percentage of lipids produced in the faeces fed on the larvae and in the larvae
themselves
Fig. 7. 1: Fatty acids extracted from; a, BSFL, b) FBL,
c) dog faeces with BSFL, d) Dog faeces with FBL
a b c d

136
Table. 7. 1: The percentage of lipids in dry weight of 1g samples of faeces and larvae
Time/ week Dry weight/ g
SD±
Total lipids/ g
SD±
% of lipids in
dry weight
Zero time
Untreated dog faeces (without larvae) 0.21 ± 0.01 0.15 ± 0.02 71%
BSFL before fed on dog faeces 0.26 ± 0.01 0.22 ± 0.02 85%
FBL before fed on dog faeces 0.20 ± 0.01 0.10 ± 0.02 50%
Week 1
Dog faeces with BSFL 0.70 ± 0.05 0.10 ± 0.00 14%
Dog faeces with FBL 0.44 ± 0.04 0.12 ± 0.01 27%
BSFL fed on dog faeces 0.28 ± 0.01 0.23 ± 0.01 82%
FBL fed on dog faeces 0.25 ± 0.02 0.14 ± 0.03 56%
Week 2
Dog faeces with BSFL 0.90 ± 0.02 0.10 ± 0.02 11%
Dog faeces with FBL 0.80 ± 0.02 0.14 ± 0.01 18%
BSFL fed on dog faeces 0.50 ± 0.02 0.15 ± 0.02 30%
FBL fed on dog faeces 0.60± 0.01 0.14 ± 0.04 23%
Week 3
Dog faeces with BSFL 0.90± 0.03 0.23± 0.03 26%
Dog faeces with FBL 0.80± 0.02 0.22± 0.02 28%
BSFL fed on dog faeces 0.50± 0.02 0.16± 0.04 32%
FBL fed on dog faeces 0.70± 0.02 0.13± 0.01 19%
Week 4
Dog faeces with BSFL 0.80 ± 0.01 0.23± 0.01 29%
Dog faeces with FBL 0.84± 0.02 0.20 ± 0.02 24%
BSFL fed on dog faeces 0.62± 0.04 0.16 ± 0.02 26%
FBL fed on dog faeces 0.82± 0.02 0.14 ± 0.01 17%

137
Untreated dog faeces (without larvae) possessed a lipid content of 71% Table 7.1).
The unfed larvae, BSFL and FBL, contained 85and 50% dry weight of lipids. This
suggests that both types of dog faeces and the two larvae could be used independently
as a source of lipids for the production of biofuels. The next step was to determine if
feeding the larvae on dog faeces would increase, over time, their lipid content and the
lipid content of the faeces on which they were feeding.
The results of the week 1 analysis shows that the lipid content of the dog faeces
treated with BSFL and FBL fell from 71 to 14 and 27% respectively, while the lipid
content of the two larvae remained broadly the same as before feeding on faeces. By
week 2, the lipid content of the dog faeces treated with BSFL and FBL declined, as did
the concentration of lipids in both types of larvae (Table 7.1);this trend was also seen at
weeks 3 and 4 (Table 7.1).
These results show that the decline in dog faeces lipid content was not mirrored by an
increase in the lipid content of the two larvae. Presumably, the faeces-lipids were, over
time, metabolized by the larvae, ultimately to carbon dioxide, i.e. the larvae were using
the faecal lipids as a food source. The results show that no advantage can be gained in
relation to total lipid production by treating dog faeces with BSFL and FBL. However,
Fig.7.2 shows that the type and concentration of fatty acids (as seen by referring to peak
retention times and peak height respectively of the exhibited chromatograms)varied
markedly depended on time of exposure of the larvae to dog faeces and the type of
larvae used. This is shown more clearly in Table 7.3. Dog faeces without larvae and
unfed FBL contained only palmitic and stearic acids, while unfed BSFL contained these
fatty acid together with lauric acid.
The type of fatty acid produced in the larvae and in the dog faeces on which the
larvae fed was then seen to vary over time. Oleic acid, for example was only produced
in the BSFL fed on dog faeces and then only at week 2 (Table 7.2). Clearly, the type of

138
fatty acid varied with the larvae used and in the faeces treated with the different larvae,
all of which varied over time. This finding suggests that BSFL and FBL might be used
to produce individual fatty acids, either within their bodies, when fed on dog faeces, or
in the dog faeces itself. In this way a single, or desired mixture of fatty acids, might be
produced. Thus, if oleic acid alone was needed as a biofuel feedstock, or for some other
biotechnological purpose then feeding BSF on dog faeces for 2 weeks and the
harvesting the larvae and extracting the fatty acid may provide a source of this
individual fatty acid.

139
Table. 7. 2: The GC/MS analysis chain composition of a number of fatty acids from dog faeces and larval fats
Fatty acid
Lip
ids N
um
ber
Time
Week 0 Week 1 Week 2 Week 3 Week 4
Do
g fa
eces n
o la
rva
e
Co
ntr
ol B
SF
L
Co
ntr
ol F
BL
Do
g fa
eces+
BS
FL
Do
g fa
eces+
FB
L
BS
FL
fed o
n fa
eces
FB
L fed
on
faec
es
Do
g fa
eces +
BS
FL
Do
g fa
eces+
FB
L
BS
FL
fed o
n fa
eces
FB
L fed
on
faec
es
Do
g fa
eces +
BS
FL
Do
g fa
eces+
FB
L
BS
FL
fed o
n fa
eces
FB
L fed
on
faec
es
Do
g fa
eces +
BS
FL
Do
g fa
eces+
FB
L
BS
FL
fed o
n fa
eces
FB
L fed
on
faec
es
Capric acid C10:0
+ + +
Undecylic acid C11:0 + +
Lauric acid C12:0 + + + +
Myristic acid C14:0 + + + + + +
Palmitic acid C16:0 + + + + + + + + + + + + + + +
Stearic acid C18:0 + + + +
Palmitoleic acid C16:1
Oleic acid C18:1 +
139

140
, 16-Mar-2012 + 22:25:01Sample A1 (chloroform)
3.54 5.54 7.54 9.54 11.54 13.54 15.54 17.54 19.54 21.54 23.54 25.54 27.54Time0
100
%
11wainwright01 Scan EI+ TIC
1.72e718.10
20.04
19.84
19.8021.42
23.83 25.79 26.33
, 16-Mar-2012 + 23:06:55Sample A2 (chloroform)
4.25 6.25 8.25 10.25 12.25 14.25 16.25 18.25 20.25 22.25 24.25 26.25 28.25Time0
100
%
11wainwright02 Scan EI+ TIC
2.26e813.85
13.05
19.8918.14
16.02
17.9320.05
, 16-Mar-2012 + 23:48:49Sample A3 (chloroform)
4.21 6.21 8.21 10.21 12.21 14.21 16.21 18.21 20.21 22.21 24.21 26.21 28.21Time0
100
%
11wainwright03 Scan EI+ TIC
9.14e719.87
18.11
13.6613.05 15.97 17.91
19.82
19.4720.05
21.42
, 17-May-2012 + 12:35:34Sample A4 (chloroform)
4.01 6.01 8.01 10.01 12.01 14.01 16.01 18.01 20.01 22.01 24.01 26.01 28.01Time0
100
%
11wainwright04 Scan EI+ TIC
7.81e619.83
2.0318.08
2.16
23.79
20.03
23.3229.05
, 17-May-2012 + 13:17:04Sample A5 (chloroform)
12.78 13.28 13.78 14.28 14.78 15.28 15.78 16.28 16.78Time0
100
%
11wainwright05 Scan EI+ TIC
2.26e713.71
15.97
, 16-Mar-2012 + 11:54:53Sample A6 (chloroform)
2.00 4.00 6.00 8.00 10.00 12.00 14.00 16.00 18.00 20.00 22.00 24.00 26.00 28.00 30.00Time0
100
%
11wainwright06 Scan EI+ TIC
2.79e813.89
2.02
18.14
16.03
17.94
19.88
19.83
20.05
, 16-Mar-2012 + 12:36:47Sample A7 (chloroform)
2.00 4.00 6.00 8.00 10.00 12.00 14.00 16.00 18.00 20.00 22.00 24.00 26.00 28.00 30.00Time0
100
%
11wainwright07 Scan EI+ TIC
1.50e819.88
18.12
2.02
17.922.2113.6713.05 15.97
19.82
20.05
, 16-Mar-2012 + 13:18:55Sample A8 (chloroform)
2.00 4.00 6.00 8.00 10.00 12.00 14.00 16.00 18.00 20.00 22.00 24.00 26.00 28.00 30.00Time0
100
%
11wainwright08 Scan EI+ TIC
1.52e819.87
18.122.02
2.2117.91
13.05
20.05
23.82 25.78
, 16-Mar-2012 + 14:00:59Sample A9 (chloroform)
5.86 7.86 9.86 11.86 13.86 15.86 17.86 19.86 21.86 23.86 25.86Time0
100
%
11wainwright09 Scan EI+ TIC
5.55e718.11
13.06
19.86
19.80
20.05
23.8321.42 25.79
, 16-Mar-2012 + 14:42:59Sample A10 (chloroform)
2.00 4.00 6.00 8.00 10.00 12.00 14.00 16.00 18.00 20.00 22.00 24.00 26.00 28.00 30.00Time0
100
%
11wainwright10 Scan EI+ TIC
5.20e813.97
2.0211.13
16.06 18.14
17.9419.87
20.04
, 16-Mar-2012 + 15:25:03Sample A11 (chloroform)
3.90 5.90 7.90 9.90 11.90 13.90 15.90 17.90 19.90 21.90 23.90 25.90 27.90Time0
100
%
11wainwright11 Scan EI+ TIC
1.16e818.12
2.20
13.6615.96
19.86
19.93
23.8320.26 21.42 25.78
Sample 3 FBL before
fed on dog faeces
Sample 4 dog
faeces with BSFL
Sample 5 dog
faeces with FBL
Sample 6 BSFL
fed on dog faeces
Sample 7 FBL
fed on dog faeces
Week 0
Week 1 Week 1
Week 1 Week 1
Week 2 Week 2
Week 2 Week 2
Sample 8 dog
faeces with BSFL Sample 9 dog
faeces with FBL
Sample 10 BSFL
fed on dog faeces
Sample 11 FBL
fed on dog faeces
Sample 1 dog faeces
without larvae
Sample 2 BSFL before
fed on dog faeces
Week 0
Week 0
Pa
lmitic
acid
C1
6:0
Ste
aric
acid
C18
:0
Lau
ric a
cid
C12:0
Myristic a
cid
C14:0
Palm
itic acid
C16:0
Myristic a
cid
C14:0
Palm
itic acid
C16:0
Cap
ric a
cid
C10:0
Un
decylic
acid
C1
1:0
La
uric a
cid
C1
2:0
My
ristic a
cid
C1
4:0
Pa
mitic a
cid
C1
6:0
Un
decy
lic a
cid
C1
1:0
My
ristic a
cid
C1
4:0
Pa
mitic a
cid
C1
6:0
Pa
mitic a
cid
C1
6:0
C
ap
ric a
cid
C10:0
Pa
mitic a
cid
C16:0
Ole
ic acid
C18:1
Cap
ric a
cid
C10:0
Pa
lmito
leic a
cid
C1
6:1
Minutes Minutes
Minutes
Minutes Minutes
Minutes Minutes
Minutes Minutes
Minutes Minutes
Myristic a
cid
C14
:0

141
Fig. 7. 2: GC–MS chromatogram of a reference mixture of fatty acid representative the
total of samples ion taken from dog faeces and BSF and FB larvae. The chromatogram
for this figure and all subsequent figures were obtained with Gas Chromatograph using
Zebron ZB-S capillary column
, 16-Mar-2012 + 16:06:53Sample A12 (chloroform)
4.02 6.02 8.02 10.02 12.02 14.02 16.02 18.02 20.02 22.02 24.02 26.02 28.02Time0
100
%
11wainwright12 Scan EI+ TIC
1.54e718.08
13.659.58 13.05
19.83
20.03
23.83 26.54
, 16-Mar-2012 + 17:30:48Sample A14 (chloroform)
17.83 18.33 18.83 19.33 19.83 20.33 20.83Time0
100
%
11wainwright14 Scan EI+ TIC
1.69e718.09
20.0319.83
, 16-Mar-2012 + 18:12:52Sample A15 (chloroform)
10.74 11.74 12.74 13.74 14.74 15.74 16.74 17.74 18.74 19.74 20.74Time0
100
%
11wainwright15 Scan EI+ TIC
7.49e814.10
13.99
11.15
16.1218.18
17.96 19.89
20.06
, 16-Mar-2012 + 18:55:00Sample A16 (chloroform)
11.07 12.07 13.07 14.07 15.07 16.07 17.07 18.07 19.07 20.07 21.07Time0
100
%
11wainwright16 Scan EI+ TIC
5.84e718.11
13.67
17.9115.96
19.86
19.92
20.26
, 16-Mar-2012 + 19:37:00Sample A17 (chloroform)
4.00 6.00 8.00 10.00 12.00 14.00 16.00 18.00 20.00 22.00 24.00 26.00 28.00Time0
100
%
11wainwright17 Scan EI+ TIC
1.08e718.08
13.043.66 9.59
19.84
19.79
20.03
29.1023.82 26.5825.23
, 16-Mar-2012 + 20:19:00Sample A18 (chloroform)
15.59 16.09 16.59 17.09 17.59 18.09 18.59 19.09 19.59 20.09 20.59 21.09 21.59 22.09 22.59Time0
100
%
11wainwright18 Scan EI+ TIC
1.57e718.09
20.0419.84
, 16-Mar-2012 + 21:01:00Sample A19 (chloroform)
11.94 12.94 13.94 14.94 15.94 16.94 17.94 18.94 19.94 20.94 21.94Time0
100
%
11wainwright19 Scan EI+ TIC
2.56e813.88
18.1416.04
17.9419.88
20.05
, 16-Mar-2012 + 21:43:04Sample A20 (chloroform)
17.96 18.46 18.96 19.46 19.96 20.46 20.96 21.46 21.96Time0
100
%
11wainwright20 Scan EI+ TIC
3.34e719.85
18.09
19.80
20.03
Sample 12 dog
faeces with BSFL
Sample 13 dog
faeces with FBL
Week 3 Week 3
Sample 14 BSFL
fed on dog faeces
Sample 15 FBL
fed on dog faeces
Week 3 Week 3
Sample 16 dog
faeces with BSFL Sample 17 dog
faeces with FBL
Week 3
Week 4
Week 3
Week 4
Sample 18 BSFL
fed on dog faeces Sample 19 FBL
fed on dog faeces
Pam
itic acid
C16:0
Pam
itic acid
C16:0
Ste
aric a
cid
C18
:0
Lau
ric a
cid
C12:0
Myristic a
cid
C14:0
Pam
itic acid
C16:0
Pam
itic acid
C16:0
Pam
itic acid
C1
6:0
Pam
itic acid
C1
6:0
Str
earic a
cid
Pa
mitic a
cid
C1
6:0
Pa
mitic a
cid
C1
6:0
La
uric a
cid
C1
2:0
My
ristic a
cid
C1
4:0
Minutes Minutes
Minutes
Minutes Minutes
Minutes Minutes
Minutes
142
The use of BSF to treat domestic waste has been pioneered by the New York-
based Ecosystem Corporation which is asking the US Department of Energy for $1.75
million to prove the concept. This Company is also seeking a matching grant from the
Dog's Biomass Research and Development Initiative to build a $3.5 million
demonstration project that would use 24,000 tons of food waste from an Ohio waste
transfer station to feed a "bioreactor" full of flies (Otis et al., 1980).The pilot plant could
produce between 150,000 to 195,000 gallons of oil per year; some 26 million tons of
food scraps are dumped by Americans into landfills each year, and only about 3 percent
of that is being recovered today. Ecosystem claim that with only one-quarter of all those
food scraps it could make 100 million gallons of oil every year; add in livestock
manure and other agriculture wastes and that amount could increase – particularly if the
company can be paid to take it off waste handlers' hands, a possibility which forms an
important part of many waste-to-biofuel business plans (Vaughn, 2009)
Restaurant wastes are also an ideal foodstock for BSFL biodiesel production. The
major methyl ester components of the biodiesel derived from BSFL were oleinic acid
methyl ester (27.1%), lauric acid methyl ester (23.4%), and palmitic acid methyl ester
(18.2%) (Table 7.3, 7.4). Table 7.3 also shows that BSFL biodiesel contains a far richer
mix of fatty acid methyl ester compounds than does biodiesel obtained from rapeseed.
Certainly the BSFL product provides a better source of fatty acids for other possible
industrial/food-based products than does rapeseed oil biodiesel.

143
Table. 7. 3: Comparison of fatty acid methyl ester composition of BSFL fat-based
biodiesel and rapeseed oil-based biodiesel.
Composition
BSFL fat-based
biodiesela (%)
Rapeseed oil-based
biodieselb (%)
Capric acid methyl ester 3.1 n/a
Lauric acid methyl ester 35.6 n/a
Myristic acid methyl ester 7.6 n/a
Palmitoleic acid methyl ester 3.8 n/a
Palmitic acid methyl ester 14.8 3.5
Oleinic acid methyl ester 23.6 64.4
Linoleic acid methyl ester 5.8 22.3
Linolenic acid methyl ester Nd 8.2
Stearic acid methyl ester 3.6 0.8
Noadecanic acid methyl ester 1.4 n/a
(See EN 14214 in Refs. Nd stands for not detected).
Most of the properties of this biodiesel met the specifications of the standard EN 14214,
including density (860 kg/m3), viscosity (4.9 mm
2/s), flash point (128 °C), cetane
number (58) and ester contents (96.9%) (Table 7.4).

144
Table. 7. 4: Comparison of fuel properties of BSFL fat-based biodiesel, rapeseed oil-based
biodiesel, and the standard EN14214.
Properties
EN14214
BSFL
biodiesela
Rapeseed
biodieselb
Density (kg/m3) 860–900 885 880
Viscosity at 40 °C (mm2/s) 1.9–6.0 5.8 6.35
Sulfur content (wt.%) 0.05 Nd <0.01
Ester content (%) 96.5 97.2 n/a
Water content (mg/kg) <0.03 0.03 0.03
Flash point (°C) 120 123 n/a
Cetane index 48–60 53 45
Acid number (mg KOH/g) <0.8 1.1 0.3
Methanol or ethanol (m/m) 0.2% 0.3% n/a
Distillation (°C) n/a 360 352
nd stands for not determined
.
(See EN 14214 in Refs. Nd stands for not detected).
Results such as these show that BSFL obtained from larvae grown on fat wastes
could potentially be used as a non-food feedstock for biodiesel production, as well as
significantly reducing the large quantity of a solid waste.
It has also been shown in the literature (REF) that larval biomass of BSFL fed on
animal manure can efficiently produced biodiesel. Approximately15.8 g biodiesel was
produced from about 1200 black soldier fly larvae when fed on dairy manure over a 21
days period.

145
Conclusion
The results reported in this Thesis show that dog faeces and BSFL and FBL fed on
such faeces can provide a source of fatty acids which could form the basis of biodiesel
production. Again however, the main limitation of using dog faeces for any process, be
it agricultural or industrial soon becomes apparent and relates to the economics of
collecting sufficient quantities of dog waste. When one compares the vast world-wide
production of rapeseed oil with the large, but widely dispersed sources of dog faeces it
soon becomes obvious that the former has such a huge competitive advantaged which
makes it impossible that bulk dog faeces-biodiesel could ever compete with other
sources of this product.

146
Chapter Eight: Final Discussion

147
8.1 Final Discussion
It is perhaps surprising, considering the vast amounts of dog faeces which reach the
environment that relatively few scientific studies have been made on the bioremediation
of this potentially toxic waste which is major source of disease-causing microorganisms
in the urban environment. The obvious distasteful nature of dog faeces doubtless
contributes to the lack of interest amongst researchers in this waste product. This lack of
interest means that there exists relatively few publications available which are directly
relevant to the scientific study of dog faeces.
The broad aim of this work reported in this Thesis was to study a variety of aspects of
dog faeces in relation to public health, their fertilizer potential and the possibility of
them being remediated using larvae, ultimately to provide a source of biodiesel.
Dog faeces were shown to be a source of pathogenic bacteria, notably E.coli and
Salmonella. These bacteria were shown to be transferred to the soil of a local playing
field by direct, in situ, transfer from dog faeces undergoing weathering. The potential
danger to public health is obvious, especially since children play in parks like these, and
are therefore at risk of picking up pathogens from contaminated soil, or more directly
from the faeces themselves. Dog faeces are known to transmit bacterial pathogens and,
perhaps more worryingly, potentially deadly parasites.
It was shown here that “common or garden” slugs can transfer potentially pathogenic
bacteria from dog faeces to lettuce. Again this is potentially damaging to public health,
especially since slugs frequent agricultural areas. The following genera and species of
bacteria were isolated from slugs: Enterococcus sp, Salmonella sp, Staphylococcus
lentus, E. coli, Proteus sp and Acinetobacter sp. Enterobacter amnigenes was isolated
from the outside secretion of slugs and their identification was confirmed using 16S
rRNA sequence gene analysis (i.e.. 99% confirmed). Externally isolated species were
identified to Acinetobacter sp (99%) using 16SrRNA and Comamonas sp was also

148
confirmed by 16S rRNA analysis is (91%), Enterobacter amnigenus, Acinetobacter sp,
Comamonas sp and Acinetobacter sp were isolated from lettuce contaminated with
slugs fed on dog faeces. Mycoplasma was transmitted from dog faeces to slugs or snails
which they, ingested or carried, and then in turn transferred to lettuce. Earthworms were
also shown to carry Mycoplasma from soil on/or within their bodies, a fact which
presumably reflects contamination from animal faeces, mainly dogs. Perhaps the
greatest potential risk relates to gardens and allotments where slugs may be common,
and not successfully controlled. The consumption of pathogen contaminated lettuces, or
other salad vegetables, is an obvious potential problem, which would presumably only
be solved by vigorous washing of locally grown produce. There is no doubt more
research effort has been devoted to the potential risk to human and animal of parasites
in dog faeces, rather than bacterial and virus pathogens. Viruses have been isolated from
dog faeces (Carmichael and Binn, 1981)
Dog faeces were shown to have potential inherent fertilizer content, the nutrients
present being released over a time period mimicking the natural weathering of dog
faeces in the environment. The fertilizer potential of dog faeces is not however, great
and their offensive nature and potentially rich pathogen content means that un-
weathered, or non-composted canine faeces are rarely used as an agricultural fertilizer.
Dog faeces were also shown to contain an indigenous microflora capable of
mineralizing organic nitrogen to ammonium and oxidizing added ammonium to nitrate;
elemental sulphur to sulphate and were able to solubilise insoluble phosphate to plant
available, soluble phosphate. As a generalization, the addition of both types of larvae to
dog faeces significantly reduced the concentration of indigenous plant nutrients over the
entire four week incubation period; exceptions to this were nitrate and phosphate
concentrations in BSFL treated faeces, where significant increases were seen at week 4
and 3 respectively and in faeces treated with FBL, where ammonium concentrations
149
were significantly increased at weeks 2-4, and phosphate at week 4. While the addition
of both larvae therefore initially decreased levels of indigenous plant nutrients there was
a trend in some of the nutrients to increase the longer the incubation went on. This
suggests that perhaps a longer term exposure of dog faeces to the two larvae might have
lead to increase in ammonium, nitrate, sulphate and phosphate concentrations. While
this would generally be advantageous to the fertility of soils surrounding dog faeces, the
potential long term increase in nitrate could at first sight be considered detrimental as
nitrate can be readily leached to ground waters (where, when present in drinking water,
it can cause blue baby disease and gastric cancer in humans). However, the relatively
small amounts of dog faeces which are present, spread over large areas of soil, would
likely make such increased nitrate contributions to drinking water relatively
insignificant.
The addition of ammonium, elemental sulphur and insoluble phosphate to dog faeces
which had been modified by the two larvae led to significant increases in nitrate,
sulphate and plant-available phosphate, results which shows that that dog faeces
contains the indigenous microflora required for the transformation of these amendments
(which simulate fertilizer addition). The increased friability and therefore increased
aeration of the dog faeces following larval modification is also like to result in
enhanced rates of nitrification, S-oxidation and phosphate solubilisation. Clearly, the
microflora of dog faeces could act to modify added fertilizers and convert them to the
plant available form. Dog faeces represent a potential source for spreading pathogenic
bacteria such as E. coli and Salmonella enterica, bacteria which represent an obvious
risk human health. Bacterial pathogens from dog faeces could infect young children and
others playing, or using, parks etc (including of course dog owners). Dog faeces have
also been shown here to produce gasses which are injurious to plant germination and/ or
growth, and are also likely to be directly inhibitory to plant growth.
150
The potential for using fly larvae for the bioremediation of dog faeces was
investigated. Black Soldier Fly (BSFL) and Fruit Beetle (FBL) Fly larvae were shown
to dramatically improve the physical nature of canine faeces, even after only a short
exposure period, giving a bioremediated product which is markedly improved in terms
of texture, reduced odour and overall reduced offensiveness.
The feeding of BSFL on faeces led to a statistically significant increase in the number
of bacteria inside the BSFL gut and the same trend was seen in relation to dog faeces
fed FBL. This trend of increasing bacterial numbers in larvae fed on dog faeces is
particularly worrying in relation to the potential feeding of these larvae to animals- post
exposure to faeces. Black soldier Fly larvae in particular are currently being produced
for use as animal feed (mainly to chickens) following feeding on restaurant food waste.
It is unlikely then, considering the high pathogen content of larvae fed on dog faeces
that these could be safely used as animal feed following feeding on dog faeces. The
bioremediated dog faeces produced was also found to be suitable as potting compost
when “diluted” with proprietary potting compost.
The haemolymph and total body extracts of BSFL and FBL were shown to be
antibacterial.
The potential for using dog faeces and dog faeces which had been treated with BSFL
and FB was determined. It was shown that potential biodiesel precursors (mainly fatty
acids) were present both in the raw dog faeces and in faeces which were treated with the
two different larvae. Whether or not dog faeces, treated or otherwise, could be used
economically as a source of biodiesel remains to be seen. Although vast amounts of dog
faeces are produced annually all over the world problems relating to such collection are
obvious. The increasing social trend towards dog owners collecting dog faeces and
placing them in council collection containers means that an increasing amount of this
potential bioresource is being collected together, at least in the urban environment. The
151
quantities collected will never however, approach that of other animal faeces, such as
cattle feedlot waste. As a result, it might be better to use the relatively small amounts of
dog faeces which are collected in any one location for localised methane generation,
rather than biodiesel production.
The number of bacteria, including pathogens declined inside the gut of BSFL
following feeding on dog faeces. The feeding of BSFL on faeces led to a statistically
significant increase in the number of bacteria inside the BSFL gut and the same trend
was seen in relation to dog faeces fed FBL. This trend of increasing bacterial numbers
in larvae fed on dog faeces is particularly worrying in relation to the potential feeding of
these larvae to animals- post exposure to faeces. Black soldier Fly larvae in particular
are currently being produced for use as animal feed (mainly to chickens) following
feeding on restaurant food waste. It is unlikely then, considering the high pathogen
content of larvae fed on dog faeces that these could be safely used as animal feed
following feeding on dog faeces. The bioremediated dog faeces produced was also
found to be suitable as potting compost when “diluted” with proprietary potting
compost. Increasing the ratio of compost to modified faeces “diluted out” the inhibitory
effect of raw dog faeces on plant growth suggesting the possibility that larval modified
dog faeces could be used as compost additive fertilizer, or perhaps even be used as an
agricultural soil fertilizer.
Escherichia coli and Salmonella enterica were isolated from all four sites (Fig.
6.3nb) while no such isolates were obtained from the fifth location which was
uncontaminated with dog faeces. The number of E. coli varied from site to site (from
104 to 10
5 CFU/g); E. coli was isolated in highest numbers. The isolation of these
pathogenic bacteria from playing fields frequented by children is obviously a major
public health concern since pathogenic bacteria could be picked up from these soils,
either on shoes, or by transfer from contaminated skin to the ears, eyes or mouths of

152
infected children (and of course, people in general) from where they could cause
disease. The number of bacteria present in dog faeces disposed of in plastic bags
dramatically increased over exposure to the UK summer, when temperatures were
recorded between 10-27oC. The following bacteria were isolated from the enclosed
faeces (Fig. 6.4) a), Enterococcus spp and E. coli in Chromoagar media b), E. coli in
HiCrome agar media c), Salmonella enterica in XLT-4 media while d) was
Staphylococcus aureus with MRSA selective media respectively. However, the faecal
sample counts were:( range 3.5×10⁵ to 4.6 × 10
6, 9.7×10
3 to 1.0× 10
5 and 4.2×10
3 to
2.9× 10⁵) for E. coli, Salmonella enterica and plate count respectively. This study has
demonstrated that the numbers and the diversity of bacteria can increase when dog
faeces are enclosed over a month in plastic bags.
There has been a welcome trend of late for dog owners to act responsibly by picking
up waste from their dogs, placing this in plastic bags and than putting these bags into
special local council run dog-waste containers, from where they are transported and
disposed off.
8.2 Future work
The lack of published work on all aspects of the environmental and agricultural
impact of dog faeces means that there is considerable potential to continue and extend
the work reported in this Thesis. This Thesis reports preliminary work on all of the
individual research questions investigated and all of the separate chapters could be
extended to form the basis of separate theses.
1) The work described here on biofuels could be extended, particularly in relation to the
type of lipids produced by fly larvae growing on faeces. However, since there exist
more readily available and technically more readily useable biofuel substrates available
153
it would seem economically pointless to devote to much attention to this area of green
technology.
2) No work was done here on viruses, both in relation to their presence in faeces and
transmission to salads and vegetable. This is clearly an opportunity for workers with the
experience and methodology in relation to working with viruses.
3) Considerable interest is currently being devoted to the use of BSFL, produced from
waste vegetables and other waste organic matter, as a source of poultry feed. It would
be of interest to develop this line of research. Problems related to pathogen transfer
mean that it is unlikely however, that such animal feeds could be safely produced from
dog faeces.

154
References

155
Albano, S. M., Lima, A. S., Miguel, M. G., Pedro, L. G., Barroso, J. G. And
Figueiredo, A. C. (2011). Antioxidant, Anti-5-lipoxygenase and anti-
acetylcholinesteras activities of essential oils and decoction waters of some
aromatic plants. Record of Natural Products 6, 35-48.
Alexander,M. (1977). Introduction to Soli Microbiology. (2nd ed). Wiley, New York.
Alexander, S. K. and Strete, D. (2001). Microbiology: a photographic atlas for the
laboratory. San Francisco: Benjamin Cummings, Addison Wesley Longman, Inc
Alloway, B. (2004). Contamination of soils in domestic gardens and allotments: a brief
overview. Land Contamination and Reclamation 12, 179-187.
Alvarez, L. (2012). The Role of Black Soldier Fly, Hermetia illucens (L.)(Diptera:
Stratiomyidae) in Sustainable Waste Management in Northern Climates.
Amann, R., F. Gloëckner and Neef, A. (1997). Modern methods in subsurface
microbiology: in situ identification of microorganisms with nucleic acid probes.
FEMS Microbiology Reviews 20, 191-200.
Amatya, P. (2009). Economics of Black Soldier Fly (Hermetia Illucens) in Dairy Waste
Management. ProQuest
American Public Health Association. (1992). Standard Methods for the Examination
of Dairy Products. 16th Edn. APHA Inc. Washington DC.
Anderson, M., Reynolds, J., Rowe, J., Sverlow, K., Packham, A., Barr, B. and
Conrad, P. (1997). Evidence of vertical transmission of Neospora sp infection
in dairy cattle. Journal of the American Veterinary Medical Association 210,
1169-1172.
Anderson, M., Palmer, C. W., Thurmond, M., Picanso, J., Blanchard, P.,
Breitmeyer, R., Layton, A., McAllister, M., Daft, B. and Kinde, H. (1995).
Evaluation of abortions in cattle attributable to neosporosis in selected dairy

156
herds in California. Journal of the American Veterinary Medical Association
207, 1206-1210
Anderson, J. M. and Baird‐Parker, A. (1975). A rapid and direct plate method for
enumerating Escherichia coli biotype I in food. Journal of Applied Microbiology
39, 111-117.
Ann, C., Walter, W., Mulbry, W. (2002). Recovery of dairy manure nutrients by
benthic freshwater algae. Bioresource Technology 84, 81–91.
Atlas, R.M. and Bartha, R. (1998). Microbial Ecology-Fundamentals and
Applications, Benjamin Cummings, Menlo Park.
Barutzki, D. and Schaper, R. (2003). Endoparasites in dogs and cats in Germany
1999–2002. Parasitology Research. 90, 148-150.
Baxter, D. and Leck, I. (1984). The deleterious effects of dogs on human health: 2.
Canine zoonoses. Journal of Public Health 6, 185-197.
Beuchat, L. R. (1996). Pathogenic microorganisms associated with fresh produce.
Journal of Food Protection 59, 204-216.
Beuchat, L. R. (2006). Vectors and conditions for preharvest contamination of fruits
and vegetables with pathogens capable of causing enteric diseases. British Food
Journal 108, 38-53.
Bexfield, A., Nigam, Y., Thomas, S. and Ratcliffe, N. A. (2004). Detection and
partial characterisation of two antibacterial factors from the excretions/secretions
of the medicinal maggot Lucillia sericata and their activity against methicillin-
resistant Staphylococcus aureus (MRSA). Microbes and Infection 6, 1297-1304.
Bhattacharyya, P., Chakraborty, A., Bhattacharya, B., Chakrabarti, K. (2003b).
Evaluation of MSW compost as a component of integrated nutrient management
in wetland rice. Compost Science and Uilization.11, 343–350.
Biederbeck, V.O. (1979). In Soil Organic Matter. Elsevier, New York.

157
Blancou, J., Chomel, B. B., Belotto, A. and Meslin, F. X. (2005). Emerging or re-
emerging bacterial zoonoses: factors of emergence, surveillance and control.
Veterinary Research 36, 507-522.
Bogdanov, S., Martin, P. and Lullmann, C. (2002). Harmonised methods of the
international honey commission. Swiss Bee Research Centre, FAM, Liebefeld.
Brady.C nad Weil. R. (1974). The Nature and Properies of Soil. Prentice Hall,
London.
Brinton, W.F and Storms, P.H. (2004). Microbiological test qualities of composted
manures and yard wastes. World Congress Organic Food, Michigan State
University, March 29-31.
Brown , K.A. (1982). Sulphur in the environment a review. Environmental Pollution 3,
47-80.
Burns, G.R. (1967). Oxidation of Sulphur in Soils. Sulphur Institute, Washington D.C.
Tech. Bull 13, 1-41
Butler, T.A., Sikora, L.J., Steinhilber, P.M. and Douglass, L.W. (2001). Compost
age and sample storage effects on maturity indicators of biosolids compost.
Journal of Environmental Quality 30, 2141–2148.
Carmicheal, L.E. and Binn, L.N. (1981). New enteric virus in the dog. Advances in
Veterinary Science and Comparative Medicine 25, 1-27
Carvalho, R., Araújo, J., Braga, F., Araujo, J., Silva, A. and Tavela, A. (2009).
Predatory activity of nematophagous fungi on infective larvae of Ancylostoma
sp.: evaluation in vitro and after passing through the gastrointestinal tract of
dogs. Journal of Helminthology 83, 231-236.
Cekmecelioglu, D., Demirci, A., Graves, R. and Davitt, N. (2005). Optimization of
windrow food waste composting to inactivate pathogenic microorganisms.
Transactions of the ASAE 48, 2023.

158
Chiu, S. Y., Kao, C. Y., Tsai, M. T., Ong, S. C., Chen, C. H. and Lin, C. S. (2009).
Lipid accumulation and CO2 utilization of Nannochloropsis oculata in response
to CO2 aeration. Bioresource Technology 100, 833-838.
Chynoweth, D. P., Owens, J. M. and Legrand, R. (2001). Renewable methane from
anaerobic digestion of biomass. Renewable Energy 22, 1-8.
Clinical and Laboratory Standards Institute. (2008). Performance standards for
antimicrobial susceptibility testing; Eighteenth Informational Supplement,
M100-S18. CLSI, Wayne, PA.
Cociancich, S., Bulet, P., Hetru, C. and Hoffmann, J. (1994). The inducible
antibacterial peptides of insects. Parasitology Today 10, 132-139.
Colaizy, T. T., Kuforiji, T., Sklar, R. S. and Pillers, D. A. M. (2003). PCR methods
in clinical investigations of human ureaplasmas: a minireview. Molecular
Genetics and Metabolism 80, 389-397.
Cooper,P.J.M.(1972). Sequence of products formed during denitrification in some
diverse western soils. Soil science Society of America Proceedings 27, 659-662
Craig Sheppard, D., Larry Newton, G., Thompson, S. A. and Savage, S. (1994). A
value added manure management system using the black Soldier Fly.
Bioresource Technology 50, 275-279.
Craig Sheppard, D., Tomberlin, J. K., Joyce, J. A., Kiser, B. C. and Sumner, S. M.
(2002). Rearing methods for the black soldier fly (Diptera: Stratiomyidae).
Journal of Medical Entomology 39, 695-698.
Crowley, L. D. and Houck, M. A. (2002). The immune response of larvae and pupae
of Calliphora vicina (Diptera: Calliphoridae), upon administered insult with
Escherichia coli. Journal of Medical Entomology 39, 931-934.
Dawkins, G. J., M. L. Hislop and C. Bishop. (1986). Transmission of bacteria soft rot
of potatoes by slug. Molluscan Studies. 52, 25-29.

159
Davison, H., Otter, A. and Trees, A. (1999). Estimation of vertical and horizontal
transmission parameters of< i> Neospora caninum</i> infections in dairy cattle.
International Journal for Parasitology 29, 1683-1689.
Demirbas, A. (2008). Biodiesel: a realistic fuel alternative for diesel engines. Springer.
Demirbas, A. (2008). Biofuels sources, biofuel policy, biofuel economy and global
biofuel projections. Energy Conversion and Management 49, 2106-2116.
Demirel, B., Scherer, P., Yenigun, O. and Onay, T. T. (2010). Production of methane
and hydrogen from biomass through conventional and high-rate anaerobic
digestion processes. Critical Reviews in Environmental Science and Technology
40, 116-146.
De Montfort, G. (2012). Waste Derived Biofuels: Are such fuels a suitable alternative
to fossil fuels?.
Despommier, D. (2003). Toxocariasis: clinical aspects, epidemiology, medical
ecology, and molecular aspects. Clinical Microbiology Reviews 16, 265-272.
Dox AW (1910). The intracellular enzymes of Penicillium and Aspergillus with special
reference to those of P.camemberti. United States Department of Agriculture,
Bureau of Animal Industry Bulletin. No. l; 120-170.
Drasar, B.S. and P. A. Barrow. (1985). Intestinal microbiology. In: Aspects of
Microbiology (Schlessinger, D., Ed.), Washington, D. American Society of
Microbiology 10, 28– 38.
Drasar, D.S. and M. J. Hill (1974). Human Intestinal Flora. Academic Press, London,
UK.
Dubey, J and Williams, C. (1980). Hammondia heydorni infection in sheep, goats,
moose, dogs and coyotes. Parasitology 81, 123-127.
Dubey, J. P. and Lindsay, D.S. (2006). Neosporosis, toxoplasmosis, and sarcocystosis
in ruminants. Veterinary Clinics Food and Animal Practise 22, 645-671.

160
Dubey, J. P. (2003). Review of Neospora caninum and neosporosis in animals. The
Korean journal of parasitology 41, 1-16.
Dusch, H. and Altwegg, M. (1995). Evaluation of five new plating media for isolation
of Salmonella species. Journal of Clinical Microbiology 33, 802-804.
Elder, R. O., Keen, J. E., Siragusa, G.R., Barkocy-Gallagher, G. A., Koohmaraie,
M., and Laegreid, W. W. (2000). Correlation of enter hemorrhagic Escherichia
coli O157 prevalence in feces, hides, and carcasses of beef cattle during
processing. Proceedings of the National Academy of Sciences of the United
States of America 97, 2999–3003.
Elliot, L. P. (1969). Certain bacteria, some of medical interest, associated with the slug
Limax maximus. Journal of Invertebrate Pathology 15, 306–312.
Emma, L. S., M. Macrae., I. D. Ogden., M. J. Wilson and N. J. C. Strachan.
(2006). Slugs: Potential Novel Vectors of Escherichia coli O157. Applied and
Environmental Microbiology 72, 144–149.
EN 14214 Automotive fuels – Fatty acid methyl esters (FAME) for diesel engines –
Requirements and test methods. European Committee for Standardization
(CEN). Brussels, 2003.
Erickson, M. C., Islam, M., Sheppard, C., Liao, J. and Doyle, M. P. (2004).
Reduction of Escherichia coli O157: H7 and Salmonella enterica serovar
Enteritidis in chicken manure by larvae of the Black Soldier Fly. Journal of
Food Protection 67, 685-690.
Falih, A. M. (1995). The Microbiology of Soil Receiving High Concentration of
Sucrose from a Natural Source. PhD Thesis, University of Sheffield
Fangmeier, A., Hadwiger-Fangmeier, A., Van der Eerden, L. andJager, H. J.
(1994). Effects of atmospheric ammonia on vegetation--A review. Environ-
ental pollution 86, 43-82.

161
Ferrer, E., Aho, M., Silvennoinen, J. and Nurminen, R.-V. (2005). Fluidized bed
combustion of refuse-derived fuel in presence of protective coal ash. Fuel
processing technology 87, 33-44.
Fredriksson-Ahomaa,M., Korte, T. and Korkeala, H. (2001). Transmission
of Yersinia enterocolitica 4/O:3 to pets via contaminated pork. Letters in
Applied Microbiology 32, 375–378.
Frenkel, J.K. (1990). Transmission of toxoplasmosis and the role of immunity in
limiting transmission and illness. Journal of the American Veterinary Medical
Association. 196, 233-240.
Frenkel, J.K., Parker, B.B. (1996). An apparent role of dogs in the transmission of
Toxoplasma gondii: the probable importance of xenosmophilia. Annals of the
New York Academy of Sciences. 791, 402–407.
Garber, K. (1935). Über die Physiologie der Einwirkung von Ammoniakgasen auf die
Pflanze. Landw. Vers.-Stat 123, 277-344.
Garner, J.S. (1996). Hospital Infection Control Practices Advisory Committee, U.S.
Department of Health and Human Services, Centres for Disease Control and
Prevention. Guideline for isolation precautions in hospitals. Infection Control
and Hospital Epidemiology 17: 53-80
Gillespie, S. (1988). The epidemiology of Toxocara canis. Parasitology Today 4, 180-
182.
Godan, D. (1983). Pest Slugs and Snails: biology and control. Springer-Verlag, Berlin,
Germany. [translated by S. Gruber].

162
Guittoneau, G. (1927). Sur I' oxidation microbienne du soufre au course de I'
ammonisation. Comptes Rendus Hebdomadaires des Scieances de l’Academie
des Sciences 184, 45-46.
Hall, RE and Schulte, E.F. (1979). Using Dog and Cat Manure on Home Gardens.
University of Wisconsin, Madison, College of Agriculture and Life Sciences.
Hansen, W. and Yourassowsky, E. (1984). Detection of beta-glucuronidase in lactose-
fermenting members of the family Enterobacteriaceae and its presence in
bacterial urine cultures. Journal of Clinical Microbiology 20, 1177-1179
Hesse, P.R. (1971). A Texbook of Soil Chemical Ananylsis, J. Murray, London.
Hill. I.R. Denham, D.A. and Scheltz, C.L. (1985). Toxocara canis larvae in the brain
of a child. Royal Society. Tropical Medicine and Hygiene. 79, 351-354.
Himathongkham, S., and H. Riemann. (1999). Destruction of Salmonella
typhimurium, Escherichia coli O157:H7 and Listeria monocytogenes in chicken
manure by drying and/or gassing with ammonia. FEMS Microbiology Letters
171, 179-182.
Hogan, J. M. (1985). The Behaviour of the Grey Field Slug (Deroceras reticulatum)-
with particular reference to control in winter wheat. Ph.D. Thesis. Newcastle
University, Newcastle upon-Tyne, UK.
Hoque S, Heath SB and Killham K. (1987). Evaluation of methods to assess adequacy
of potential soil sulphur supply to crops. Plant and Soil 101, 3-8
Huberman, L., Gollop, N., Mumcuoglu, K., Block, C. and Galun, R. (2007).
Antibacterial properties of whole body extracts and haemolymph of Lucillia
sericata maggots. Journal of Wound Care 16, 123-127.
Institut de la statistique Quebec (2005a) : Estimation trimestrielle de la population au
ler avril 2005 et part par province. http://www.stat.gouv.qc.ca/donstat/ econm_
finncl conjn_ econm/TSCI [cited Aug. 30, 2005].

163
Islam, M., Doyle, M. P., Phatak, S. C., Millner, P. and Jiang, X. (2005). Survival of
Escherichia coli O157: H7 in soil and on carrots and onions grown in fields
treated with contaminated manure composts or irrigation water. Food
Microbiology 22, 63-70.
Jacobs-Reitsma, W. F., A. W. van de Giessen., N. M. Bolder, and R. W. A. W.b
Mulder (1995). Epidemiology of Campylobacter Spp. at two Dutch broiler
farms. Epidemiology and Infection. 114, 413-421.
Jacquelyn, G. (1999). Microbiology-Principles and Explorations. London,Wiley.
Jaklič, D., Lapanje, A., Zupančič, K., Smrke, D. andGunde-Cimerman, N. (2008).
Selective antimicrobial activity of maggots against pathogenic bacteria. Journal
of Medical Microbiology. 57, 617-625.
Jeon, H., Park, S., Choi, J., Jeong, G., Lee, S. B., Choi, Y. and Lee, S. J. (2011). The
Intestinal Bacterial Community in the Food Waste-Reducing Larvae of
Hermetia illucens. Current Microbiology. 62, 1390-1399.
Jiang, X., Morgan, J. and Doyle, M. P. (2003). Fate of Escherichia coli O157: H7
during composting of bovine manure in a laboratory-scale bioreactor. Journal of
Food Protection 174, 25-30.
Karadam, S. Y., Ertug, S., Ertabaklar, H. and Okyay, P. (2008). The comparision of
IgG antibodies specific to Toxocara Spp. among eosinophilic and non-
eosinophilic groups. Microbiologica-Quarterly Journal of Microbiological
Sciences 31, 113-116.
Kashmanian, R. M. and Rynk, R. F. (1996). Agricultural composting in the United
States: Trends and driving forces. Journal of Soil and Water Conservation 51,
194.- 201

164
Kebreab, E., Clark, K., Wagner-Riddle, C. andFrance, J. (2006). Methane and
nitrous oxide emissions from Canadian animal agriculture: A review. Canadian
Journal of Animal Science 86, 135-157.
Killham, K. (1994). Soil Ecology, Cambridge,Cambridge University Press.
Kim R.E. (2008). Dog Meat in Korea. A Socio- Legal Challenge” Animal Law 14, 201-
236.
Kostov, O., Tzvetkov, Y., Kaloianova, N., Van Cleemut, O. (1996). Production of
tomato seedlings on composts of vine branches and grape prunings, hunks and
seeds. Compost Science and Utilization 4, 55–61.
Kudva, I. T., Blanch, K. and Hovde, C. J. (1998). Analysis of Escherichia coli O157:
H7 survival in ovine or bovine manure and manure slurry. Applied and
Environmental Microbiology 64, 3166-3174.
Kuenen, J.G. and Beudeker, R.F. (1982). Soil fungistasis, relation to fungal spore
nutrition. Phytopathology 298, 473-497.
LaGoy, P. K. (1987). Estimated soil ingestion rates for use in risk assessment. Risk
Analysis 7, 355-359.
Lam, H.-M., Coschigano, K., Oliveira, I., Melo-Oliveira, R. &Coruzzi, G. (1996).
The molecular-genetics of nitrogen assimilation into amino acids in higher
plants. Annual review of plant biology 47, 569-593.
Lapage, S. P., Shelton J. E. and Mitchell T. G. (1970) in Methods in Microbiology’
Eds. Norris J. R. and Ribbons D. W. Vol.3A. Academic Press. London. p. 116.
Lee, B., Ellenbecker, M., Moure-Eraso, R. (2004). Alternatives for treatment and
disposal cost reduction of regulated medical wastes. Waste Manage 24, 143-151.
Leem, J. Y., Jeong, I. J., Park, K. T. and Park, H. Y. (1999). Isolation of p-
hydroxycinnamaldehyde as an antibacterial substance from the saw fly,
Acantholyda parki . FEBS letters 442, 53-56.

165
Liao, W., Liu, Y., Wen, Z.Y., Frear, C. and Chen, S.L. (2008). Kinetic modelling of
enzymatic hydrolysis of cellulose in differently pre-treated fibers from dairy
manure. Biotechnology and Bioengineering 101, 441–451.
Lincoln, C. K. and Gabridge, M. G. (1998). Cell culture contamination: sources,
consequences, prevention, and elimination. Methods in Cell Biology 57, 49-65.
Li, Q., Zheng, L., Cai, H., Garza, E., Yu, Z. and Zhou, S. (2011a). From organic
waste to biodiesel: Black soldier fly, Hermetia illucens, makes it feasible. Fuel.
90, 1545-1548.
Li, Q., Zheng, L., Hou, Y., Yang, S. and Yu, Z. (2011b). Insect fat, a promising
resource for biodiesel. Journal of Petroleum and Environmental Biotechnology
S 2, 2-6.
Li, Q., Zheng, L., Qiu, N., Cai, H., Tomberlin, J. K. and Yu, Z. (2011c).
Bioconversion of dairy manure by black soldier fly (Diptera: Stratiomyidae) for
biodiesel and sugar production. Waste Management 31, 1316-1320.
Lindsay D.S., Dubai, J.P., Butler J.M., Blagburn, B.L. (1997). Mechanical
transmission of Toxoplasma gondii oocysts by dogs. Veterinary Parasitology
73, 27–33.
London, J. and Rittenberg, S.C. (1967). Thiobacillus permetabolis nov. sp, a
Lord, W. D., Lee Goff, M., Adkins, T. R. and Haskell, N. (1994). The black soldier
fly Hermetia illucens (Diptera: Stratiomyidae) as a potential measure of human
postmortem interval: observations and case histories. Journal of Forensic
Sciences 39, 215-215.
Lu, Y., Ludsin, S. A., Fanslow, D. L. and Pothoven, S. A. (2008). Comparison of
three microquantity techniques for measuring total lipids in fish. Canadian
Journal of Fisheries and Aquatic Sciences 65, 2233-2241.
Lynch, J.M. (1983). Soil Biotechnology, Microbiological Factors in Crop Productivity.
Blackwell. Boston.

166
Ma, F. and Hanna, M. A. (1999). Biodiesel production: a review. Bioresource
technology 70, 1-15.
Maier, R. M., Pepper, I. L. and Gerba, C. P. (2009). Environmental Microbiology.
London, Academic Press.
Makarov, V. M. and Drozdovskiĭ, V. (1991). Reprocessing of tyres and rubber
wastes: recycling from the rubber products industry. Ellis Horwood.
Mallinson, E., Miller, R., de Rezende, C., Ferris, K., deGraft-Hanson, J. and
Joseph, S. (2000). Improved plating media for the detection of Salmonella
species with typical and atypical hydrogen sulfide production. Journal of
Veterinary Diagnostic Investigation 12, 83.-87.
Marketing, L. (2002). Canadians and Their Pets. Montreal, Quebec, Canada: Leger
Marketing Trends Report. Canadian Press/Leger Marketing, pgs 2-3.
Mawdsley, J. L., Bardgett, R. D., Merry, R. J., Pain, B. F. and Theodorou, M. K.
(1995). Pathogens in livestock waste, their potential for movement through soil
and environmental pollution. Applied Soil Ecology 2, 1-15.
McGarrity, G., Sarama, J and Vanaman, V. (1985). Cell culture techniques. ASM
News 51, 170-183.
McGarrity, G. J., Steiner, T and Vanaman, V. (1983). Detection of mycoplasmal
infection of cell cultures by DNA fluorochrome staining. Methods in
Mycoplasmology 2, 155-208.
McKinley, V., Vestal, J. and Eralp, A. (1985). Microbial activity in composting.
Biocycle 26, 39-43.
McLaughlin, J. (2002). Gardens As a Source of Infectious Disease: Reducing the Risk.
Miami Dade County Extension Service.

167
Merlino, J. (1997). Application of Chromagar Orientation in the identification and
differentiation of Proteeae from other Enterobacteriaceae. Australian Journal of
Medical Science 18, 20-23.
Merlino, J., Siarakas, S., Robertson, G. J., Funnell, G. R., Gottlieb, T. and
Bradbury, R. (1996). Evaluation of CHROMagar Orientation for differentiation
and presumptive identification of gram-negative bacilli and Enterococcus
species. Journal of Clinical Microbiology. 34, 1788-1793.
Miller, R. G. and Tate, C. R. (1990). XLT4: A highly selective plating medium for the
isolation of Salmonella. Maryland Poultryman, April p. 2-7.
Miller, F.C. (1996). Heat Evolution during Composting of Sewage Sludge. In: The
Science of Composting, edited by de Bertoldi, M.D., Sequi, P., Lemmes, B.,
Papi, T. Glasgow, United-Kingdom: Blackie Academic and Professional, pgs
106-115.
Muir, A., G. Forrest,. noskralC ,J and slaehW, A (2011). Detection of Candida
albicans DNA from blood samples using a novel electrochemical assay. Journal
of Medical Microbiology 60, 467-471
Mumcuoglu, K. Y., Miller, J., Mumcuoglu, M., Friger, M. and Tarshis, M. (2001).
Destruction of bacteria in the digestive tract of the maggot of Lucilia sericata
(Diptera: Calliphoridae). Journal of Medical Entomology 38, 161-166.
Murry, A. C. and Hinckley, L. S. (1992). Effect of the earthworm (Eisenia foetida) on
Salmonella enteritidis in horse manure. Bioresource Technology 41, 97-100.
Nemiroff, L. and Patterson, J. (2007). Design, Testing and Implementation of a
Large-Scale Urban Dog Waste Composting Program. Compost Science and
Utilization 15, 237-242.
Newton, L., Sheppard, C., Watson, D., Burtle, G. and Dove, R. (2005). Using the
black Soldier Fly, Hermetia illucens, as a value-added tool for the management
168
of swine manure. Animal and Poultry Waste Management Center, North
Carolina State University, Raleigh, NC: 17.
Nor, Y. and Tabatabai, M. A. (1977). Extraction and colorimetric determination of
thiosulphate and tetrathionate soils. Soil Science 122, 175-177.
Otis, R. J., Boyle, W. C., Clements, E. V. and Schmidt, C. J. (1980). Design Manual;
Onsite Wastewater Treatment and Disposal Systems. Environmental Protection
Agency Report EPA-625/1-80-012, October 1980. 412 p, 86 Fig, 82 Tab, 204
Ref. 1 Append.
Overgaauw, P. A. M., Van Zutphen, L., Hoek, D., Yaya, F. O., Roelfsema, J.,
Pinelli, E., Van Knapen, F. and Kortbeek, L. M. (2009). Zoonotic parasites in
fecal samples and fur from dogs and cats in The Netherlands. Veterinary
Parasitology 163, 115-122.
Paul, E.A and Clark, F.E. (1989). Soil Microbiology and Biochemistry. Academic
Press, London.
Payne, W.J. (1981). Dentitrification . JohnWiley & Sons, Inc., New York, N.Y.
Peigne, J., Girardin, P. (2004). Environmental impacts of farm-scale composting
practices. Water, Air, and Soil Pollution 153, 45-68.
Pell, A. N. (1997). Manure and microbes: public and animal health problem? Journal of
Dairy Science 80, 2673-2681.
Phan, A. N. and Phan, T. M. (2008). Biodiesel production from waste cooking oils.
Fuel 87, 3490-3496.
PHLS Standard methods for the Microbial Examination of Food and Dairy Samples
(1999) Aerobic plate count at 30°C - F10 and F11.

169
Prysor Williams, A., Roberts, P., Avery, L. M., Killham, K. and Jones, D. L.
(2006). Earthworms as vectors of Escherichia coli O157: H7 in soil and
vermicomposts. FEMS Microbiology Ecology 58, 54-64.
Richards B.N, (1987). The Microbiology of Terrestrial Ecosystem. London, Longman.
Rinaldi, L., Biggeri, A., Carbone, S., Musella, V., Catelan, D., Veneziano, V and
Cringoli, G. (2006). Canine faecal contamination and parasitic risk in the city of
Naples (southern Italy). BMC Veterinary Research 2, 29.
Rippy, A, Gleason, M., Ash, A, Willingham, S. (1997). Composting Dog Waste in
Interior Alaska, Fairbanks Soil and Water District, Study Details, CWA Section
319 Progress Report, Project : 8-FY92-AK, 14 pgs
Rottem, S. and Barile, M. F. (1993). Beware of mycoplasmas. Trends in
Biotechnology 11, 143-151.
Rubel, D. and Wisnivesky, C. (2005). Magnitude and distribution of canine fecal
contamination and helminth eggs in two areas of different urban structure,
Greater Buenos Aires, Argentina. Veterinary Parasitology. 133, 339-347.
Rynk, R (ed.) (1992). On-Farm Composting Handbook. Ithaca, New York: Natural
Resource, Agriculture, and Engineering Service (NRAES), pps 12-20.
Sahalan, A. Z., Omar, B., Mohamed, A. Y. and Jeffery, J. (2006). Antibacterial
activity of extracted Hemolymph from larvae and pupae of local fly species
Musca Domestica and Chrysomya Megacephala. Jurnal Sains Kesihatan
Malaysia 4, 1-11.
Samra, Z., Heifetz, M., Talmor, J., Bain, E. and Bahar, J. (1998). Evaluation of use
of a new chromogenic agar in detection of urinary tract pathogens. Journal of
Clinical Microbiology 36, 990-994.
Santamaría, J. and Toranzos, G. A. (2003). Enteric pathogens and soil: a short
review. International microbiology 6, 5-9.

170
Schantz, P. (1994). Of worms, dogs, and human hosts: Continuing challenges for
veterinarians in prevention of human disease. Journal of the American
Veterinary Medical Association. 204, 1023-1028.
Schook, L.B. and Berk, R.S. (1978). Acid precipiation, Effects on fish. Ambio 5, 228-
230
Sheppard, D. C. and Newton, G. L. (2001). Insect digestion of manure. In: Manure
Management Strategies/technologies. White paper prepared under the auspices
of the National Center for Manure and Animal Waste Management, NCSU.
Shulman, V. L. (2004). Tyre recycling. iSmithers Rapra Publishing.
Silvis, H. (2006). Driving forces of European agriculture. Wageningen, The
Netherlands. LEI Agricultural Economics Research Institute.
Sims, J.R. and Jackson, G.D. (1971) Raid analysis of soil nitrate with chromotropic
acid. Soil Science Society American of Proceedings 35, 603-606.
Sivasamy, R., Angayarkanni, J. and Palaniswamy, M. (2011). A novel filarial
topoisomerase II inhibitor produced by native isolate Micrococcus luteus B1252.
African Journal of Biotechnology. 10, 16069-16077.
Small, P., Blankenhorn, D., Welty, D., Zinser, E. and Slonczewski, J. L. (1994).
Acid and base resistance in Escherichia coli and Shigella flexneri: role of rpoS
and growth pH. Journal of Bacteriology 176, 1729-1737.
Simmons, S. (1935). A bactericidal principle in excretions of surgical maggots which
destroys important etiological agents of pyogenic infections. Journal of
Bacteriology 30: 253-267.
Sims, J.R. and Jackson,G.D. (1971). Rapid analysis of soil nitrite with chromic acid.
Soil Science Society of America Proceedings 35, 603-606.

171
Smith, D.C., Hughes, J.C. (2004). Changes in maturity indicators during the
degradation of organic wastes subjected to simple composting procedures.
Biology and Fertility of Soils 39, 280–286.
South, A. (1992). Terrestrial Slugs: biology, ecology and control. London, Chapman
Hall.
Sproston, E. L., Macrae, M., Ogden, I. D., Wilson, M. J. and Strachan, N. J. C.
(2006). Slugs: Potential novel vectors of Escherichia coli O157. Applied and
Environmental Microbiology 72, 144-149.
Starkey, R.L. (1934). The production of polythionates from thiosulpate by
microorganisms. Journal of Bacteriology 48, 387-400.
Stoffella, P. J. and Kahn, B. A. (eds.) (2001). Compost Utilization in Horticultural
Cropping Systems, Boca Raton, CRC Press.
Strom, P. F. (1985). Identification of thermophilic bacteria in solid-waste composting.
Applied and . Environmential Microbiology. 50, 906-913.
Tarsitano, E., Greco, G., Decaro, N., Nicassio, F., Lucente, M. S., Buonavoglia, C.
and Tempesta, M. (2010). Environmental monitoring and analysis of faecal
contamination in an urban setting in the city of Bari (Apulia region, Italy):
health and hygiene implications. International Journal of Environmental
Research and Public Health 7, 3972-3986.
Tan, R.J.S., Lim, E.W. and Ishak, B. (1977). Ecology of mycoplasmas in clinically
healthy cats. Australian Veterinary Journal 53, 515–519.
Tan, R.J.S., and Miles, J.A.R. (1974). Incidence and significance of mycoplasmas in
sick cats. Research in Veterinary Science 16, 27–34.
Tate, C., Miller, R., Mallinson, E., Douglass, L. and Johnston, R. (1990). The
isolation of salmonellae from poultry environmental samples by several

172
enrichment procedures using plating media with and without novobiocin.
Poultry Science. 69, 721-726.
Taylor, L. (2004). Poop, Scoop and Compost: Proposal to Explore the Feasibility of
Composting Dog Waste in Public Parks. Vancouver, Canada: National Coalition
for People and Dogs, Handout, pgs. 1-7.
Taylor-Robinson, D. (1996). Infections due to species of Mycoplasma and
Ureaplasma: an update. Clinical Infectious Diseases 23, 671-682.
Themelis, N. J. and Ulloa, P. A. (2007). Methane generation in landfills. Renewable
Energy 32, 1243-1257.
Thierry, F., G. Frédéric., N. Jacques and A. P. Burnens (2008). The Role of
Acinetobacter baumannii as a nosocomial pathogen for dogs and cats in an
intensive care unit. Journal of Veterinary Internal Medicine 2, 177 – 183.
Tiedje, J.M. (1988). Ecology of denitrification and dissimilation nitrate reduction to
ammonium. Pp. 179-244. In: A.J.B.Zehnder (ed.) Biology of Anaerobic
Microorganisms. John Wiley, New York
Tisdale, S.L., Nelson, W. L., Beaton, J.D. (1985). Soil Fertility and Fertiliser, New
York, Macmillan.
Thomas, S., Andrews, A., Hay, N. and Bourgoise, S. (1999). The anti-microbial
activity of maggot secretions: results of a preliminary study. Journal of Tissue
Viability 9, 127.
Thomas, S., Jones, M., Shutler, S. and Jones, S. (1996). Using larvae in modern
wound management. Journal of Wound Care. 5, 60.
Thompson, D. E., Bundy, D. A. P., Cooper, E. S. and Schantz, P. M. (1986).
Epidemiological characteristics of Toxocara canis zoonotic infection of children
in a Caribbean community. Bulletin of the World Health Organization 64, 283.

173
Tomberlin, J. K., Sheppard, D. C. and Joyce, J. A. (2002). Selected life-history traits
of black soldier flies (Diptera: Stratiomyidae) reared on three artificial diets.
Annals of the Entomological Society of America 95, 379-386.
Trudinger, P.A. (1967). Metabolism of thiosulphate and tetrathionate by heterotrophic
bacteria from soil, Journal of Bacteriology 93, 550-559.
Traub, R. J., Robertson, I. D., Irwin, P., Mencke, N. and Thompson, R. C. A.
(2002). The role of dogs in transmission of gastrointestinal parasites in a remote
tea-growing community in northeastern India. American Journal of Tropical
Medicine and Hygiene 67, 539-545.
Trautmann, N., Olynciw, E. (2000). Compost Microorganisms. Cornell University
Composting Page. <http://www.cfe.cornell.edu/compost/microorg.html>.
Turnell, J., Faulkner, R. and Hinch, G. (2007). Recent advances in Australian broiler
litter utilisation. World's Poultry Science Journal 63, 223-232.
Van der Eerden, L. (1982). Toxicity of ammonia to plants. Agriculture and
Environment 7. 223-235.
Vaughn, J. (2009). Waste Management: A Reference Handbook. Abc-clio. pp 311
Vitolins, M.I. and Swaby, R.J. (1969). Activity of sulphur-oxidizing microorganisms
in some Australian soils. Australian Journal of Soil Research 7, 171-183
Wainwright, M. (1978a). Distribution of sulphur oxidation products in soil and on Acer
pseudoplatanus L. growing close to source of atmospheric pollution.
Environmental Pollution 17, 153-160.
Wainwright, M. (1981). Enzyme activity in interidal sands and salt-marsh soils. Plant
and Soil 59, 357-363.
Wainwright, M and Killham. K. (1980). Sulphur oxidation by Fusarium solani. Soil
Biology and Biochemistry 12, 555-558.
174
Wainwright, M. and Pugh, G.J.F. (1973). The effect of three fungicides on
nitrification and ammonification in soil. Soil Biology and Biochemstry 5, 577-
584.
Walker, A. J., D. M. Glen and P. R. Shewry (1999). Bacteria associated with the
digestive system of the slug Deroceras reticulatum are not required for protein
digestion. Soil Biology and Biochemistry 31, 1387–1394.
Wallace, G.D. (1973). The role of the cat in the natural history of Toxoplasma gondii.
American Journal of Tropical Medicine and Hygiene 22, 313–22.
WHO, (1959). Joint expert committee on Zoonoses second report. Tech. Rep. Ser. No
169.
Wang, R. F., Cao, W. W. and Cerniglia, C. E. (1996). PCR detection and quantitation
of predominant anaerobic bacteria in human and animal fecal samples. Applied
and Environmental Microbiology 62, 1242-1247.
Weisburg, W. G., Barns, S. M., Pelletier, D. A. &Lane, D. J. (1991). 16S ribosomal
DNA amplification for phylogenetic study. Journal of bacteriology 173, 697-
703.
Whitlock, J. E., Jones, D. T. and Harwood, V. J. (2002).Identification of the sources
of fecal coliforms in an urban watershed using antibiotic resistance analysis.
Water Research 36, 4273-428.
Williams, D., Guy, C., McGarry, J., Guy, F., Tasker, L., Smith, R., MacEachern,
K., Cripps, P., Kelly, D. and Trees, A. (2000). Neospora caninum-associated
abortion in cattle: the time of experimentally-induced parasitaemia during
gestation determines foetal survival. Parasitology 121, 347-358.
Wilkinson, P. G. (2011). Characterisation of the Bacterial Flora Associated with the
Grey Field Slug Deroceras reticulatum and Assessment of its Suitability as a
Target for Biological Control. PhD Thesis ,University of Edinburgh

175
Wilson, M. J., D. M. Glen and S. K. George (1993). The rhabditid nematode
Phasmarhabditis hermaphrodita as a potential biological control agent for slugs.
Biocontrol Science and Technology 3, 503–511.
Wilson M J, Glen D M, George S K, Pearce J D and Wiltshire C W. (1994)
Biological control of slugs in winter wheat using the rhabditid nematode
Phasmarhabditis hermaphrodita. Annals of Applied Biology 125, 377-390.
Wright, E. P. (1982). The occurrence of Campylobacter jejuni in dog faeces from a
public park. Journal of Hygiene 89: 191-194.
Yagi, S., Kitai, S. and Kimura, T. (1971). Oxidation of element sulphur to thiosulphur
by Streptomyces. Archives of Microbiology 22, 157-159.
Zhang, Y. a., Dube, M., McLean, D. and Kates, M. (2003). Biodiesel production
from waste cooking oil: 1. Process design and technological assessment.
Bioresource technology 89, 1-16.

176
Appendices

177
Appendix One: Preparation of chemical solutions and reagents
1.1 Solutions used in analysis of inorganic N-ions:
1.1.1 Indophenol blue method for the determination of ammonium-N (NH4+-N).
(a ) Standard ammonium solution..
Standard ammonium solution was prepared by dissolving 0.4717 g ammonium sulphate
in 1 litre distilled water for (100 pg N ml-1). (Wainwright and Pugh, 1973)
(A) Ethylenediamineteraaactic acid (EDTA)
EDTA (60g) was dissolved in (900ml) distilled water then diluted to 1 litre
(b) Phenol solution:
Phenol solution was prepared by dissolving phenol (62.5 g) in ethanol (25 ml) and
adding acetone (1S.5 ml) to give a total of 100 ml. The phenol solution was stored in the
dark at 4o C.
(c) Phenolate reagent:
Phenolate reagent was prepared by mixing 20 ml of phenol solution with 20 ml caustic
solution (27%NaOH w/v) and diluting to 100 ml. The reagent was prepared fresh daily.
1.1.2 Chromotropic acid method for nitrate-N determination.
(a) Standard nitrate solution:
Potassium nitrate (KNO3), 0J229 was dissolved in distilled water and made up to 1
litre volumetrically, for 100 NO3-N ml-1.
(b) Chromotropic acid reagent (C1o H6O8S2 Na2):
A0.l% (v/v) stock solution of chromotropic acid in concentrated sulphuric acid (H2SO4)
was prepa.red by dissolving 1.84 g chromotropic acid in litre H2SO+ (1:l). This solution
was stored in an amber bottle in refrigerator at 4oC for several months.
(c) Working chromotropic acid solution (CTA):

178
A working CTA-solution (0.01% v/v) was prepared by diluting 100 ml of stock solution
to 990 ml with concentrated sulphuric acid (H2SO4) then adding 10 ml concentrated
HCl. This solution was stored at 4oC for several weeks only
1.1.3 Analysis of inorganic S-ions.
(a) Standard sulphate-S solution:
Sodium sulphate (Na2SO+.10H2O), 0.443 g was dissolved in 1 litre distilled water,
which gives the concentration 100 µg SO42-
- S ml-l.
b) Gum acacia solution (0.250/" w/v):
Gum acacia0.25 g was dissolved in 100 ml distilled water.
1.3.4Analysis of phosphate
(a) Chemical solution
1- Ascorbic acid solution(10%) was prepared by mixing 10 ml of ascorbic acid with 90
ml of distilled water
2- Ammonium molybdate (0.42Vo) was prepared by dissolved 42gof ammonium
molybdate with 100 ml of in (1N) H2SO4
(b) Working solution
Working solution was prepared by mixed 1 volume of ascorbic acid solution (10%) and
6 volumes of ammonium molybdate (0.42%)
2. Elements standard curves
2.1 Standard ammonium solution (Wainwright and Pugh, 1973)
3.66 g of (NH4)2SO4 and were dissolved it in litre then diluted the solution 10 times (10
ml of ammonium solution with 90ml distal water) = 100µg/NH4+-N ml
-1. 2ml of
previous solution was added to 1ml of EDTA (6%w/v) 7ml of distilled water, 5ml of
phenolate reagent and 3ml of sodium hypochlorite solution (10%v/v). The reaction
mixture was mixed thoroughly and incubated at 25oC for 20min in the dark. The volume

179
was made up to 50ml and mixed and the concentration of the indophenols-blue complex
was measured at 630 nm.
2.2 Standard Nitrate solution ( Sims and Jackson, 1971)
Weight 0.137g of NaNO3 and were dissolved to 100ml of distilled water. Resulting
solution is 1mg nitrate (NaNO3) per ml. Solution was pipette to 6 tubes following
volumes of the standard solution: (1µl=1µg nitrate) (0µl, 10µl, 20µl, 40µl, 80µl, 100µl).
3ml of filtrate was mixed to 7ml chromotropic acid (work solution)then incubated in
water bath for 45 min in 40oC. The yellow colour formed was measured at 41 nm using
spectrophotometer and the concentration of nitrate was determined by reference to a
standard curve of nitrate concentration.(Fig 1 2)
2.3 Standard sulphate-s solution (Hesse, 1971)
1.47 g of ( Na2SO4) and were dissolved in 1 litre of distilled water, which give the
concentration 1000µg/ SO4-2
-S ml-1
then diluted the solution 10 times (10 ml of sodium
sulphate solution with 90 ml of distal water) =100µ g/ SO4-2
-S ml-1
.
5ml of previous solution were added to 1g barium chloride BaCl2 and 2ml of gum
acacia (0.25%w/v) mixed well then the volume was made up to 25ml with distilled
water. The white suspension resulting from precipitation of sulphate was measured at
470 nm. (Fig 13)
2.4 Standard phosphate solution (Hesse, 1971)
Weight 0.4393g of potassium dihydrogen (KH2PO4) into a litre volumetric flask. This
solution was diluted with distilled water to produce 10µg , 20 µg, 40 µg, 50 µg, 60 µg,
70 µg, 80 µg, 90 µg and 100 µg. The control was distilled water without KH2PO4.
Mix 1 vol. of ascorbic acid mixed with 6 vol. of ammonium molybdate. The add 0.7 ml
of working solution to 0.3 ml of sample and incubate at 37oC for 1 hour and read with
blue colour at 820 nm. (Fig 1 4)

180
Fig 1 3: Sulphate standard curve Fig 1 4: Phosphate standard curve
y = 0.0015x - 0.0025R² = 0.9939
-0.02
0
0.02
0.04
0.06
0.08
0.1
0.12
0.14
0.16
0 5 101520253035404550556065707580859095100
AB
S
SO4 Consentration
Fig1 2: Nitrate standard curve Y=0.0105+0.023
R2=0.9991
Fig1 2: Nitrate standard curve Fig1. 1Ammonium standard curve
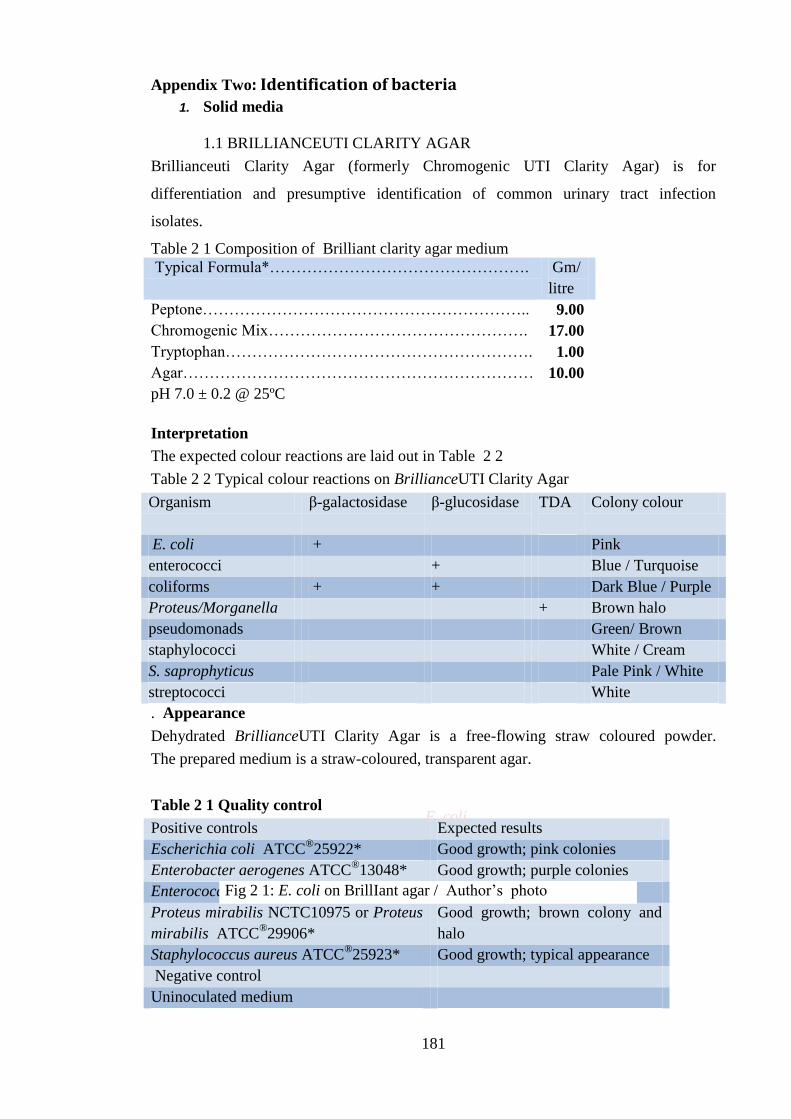
181
Appendix Two: Identification of bacteria
1. Solid media
1.1 BRILLIANCEUTI CLARITY AGAR
Brillianceuti Clarity Agar (formerly Chromogenic UTI Clarity Agar) is for
differentiation and presumptive identification of common urinary tract infection
isolates.
Table 2 1 Composition of Brilliant clarity agar medium
Typical Formula*…………………………………………. Gm/
litre
Peptone…………………………………………………….. 9.00
Chromogenic Mix…………………………………………. 17.00
Tryptophan…………………………………………………. 1.00
Agar………………………………………………………… 10.00
pH 7.0 ± 0.2 @ 25ºC
Interpretation
The expected colour reactions are laid out in Table 2 2
Table 2 2 Typical colour reactions on BrillianceUTI Clarity Agar
Organism β-galactosidase β-glucosidase TDA
Colony colour
E. coli + Pink
enterococci + Blue / Turquoise
coliforms + + Dark Blue / Purple
Proteus/Morganella + Brown halo
pseudomonads Green/ Brown
staphylococci White / Cream
S. saprophyticus Pale Pink / White
streptococci White
. Appearance
Dehydrated BrillianceUTI Clarity Agar is a free-flowing straw coloured powder.
The prepared medium is a straw-coloured, transparent agar.
Table 2 1 Quality control
Positive controls Expected results
Escherichia coli ATCC®
25922* Good growth; pink colonies
Enterobacter aerogenes ATCC®13048* Good growth; purple colonies
Enterococcus faecalis ATCC®29212* Good growth; blue colonies
Proteus mirabilis NCTC10975 or Proteus
mirabilis ATCC®29906*
Good growth; brown colony and
halo
Staphylococcus aureus ATCC®25923* Good growth; typical appearance
Negative control
Uninoculated medium
E. coli
Fig 2 1: E. coli on BrillIant agar / Author‟s photo

182
E. coli on Brillianceuti Clarity Agar by (Authors )
1.2 CHROMagar Orientation
The principle of this medium is the use of Chromogenic substrates revealing metabolic
enzymes. Dehydrated powder was provided by the CHROMagar Company, Paris,
France.
The medium is composed of 169 each of peptone, meat, and yeast extracts and 15g of
agar per Litre and a special chromogenic mixture. The powder was introduced into an
Automatic pippeter, and sterilization process was performed at 120oC for 15 min.
Samples were Streaked onto plate and incubate at 37°C for 18-24 hours.
Table 2 4: Composition of Chromagar Orientation medium
Typical Formula………………………………………………. gm/litre
Agar…………………………………………………………… 15.0 g
Peptone and yeast extract…………………………………… 17.0
Chromogenic mix……………………………………………. 1.0 g
Total…………………………………………………………… 33 g/L
pH 7.0 ± 0.2 @ 25°C

183
Fig, 2 2: The colour of colonies of CHROMagar Orientation media reference
1.3 CHROMagar MRSA
BBL CHROMagar MRSA is a selective and differential medium, which incorporates
cefoxitin, for the detection of MRSA from specimens.
For pre-weighed dose of medium of CHROMagaTMRSA powder, add dry powder to
the corresponding volume of purified water. Alternatively, suspend the powder slowly
in water by rotating for swelling of the agar. Heat and bring to boiling (100"C) while
swirling or stirring regularly. If using an autoclave, do so without pressure. Do not heat
to more than100oC. the mixture may also be brought to a boil in a microwave oven:
after initial boiling, remove from oven, stir gently, then return to oven for short
repeated155
(Merlino et al., 1996)
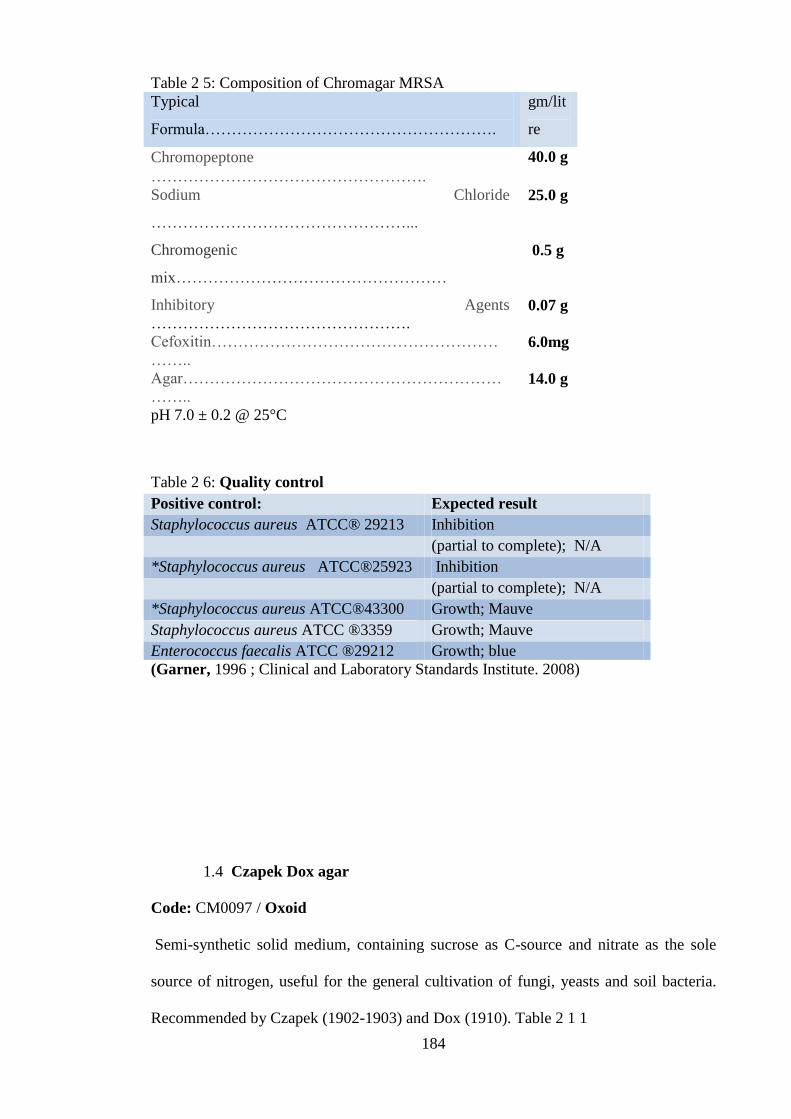
184
Table 2 5: Composition of Chromagar MRSA
Typical
Formula……………………………………………….
gm/lit
re
Chromopeptone
…………………………………………….
40.0 g
Sodium Chloride
…………………………………………...
25.0 g
Chromogenic
mix……………………………………………
0.5 g
Inhibitory Agents
…………………………………………. 0.07 g
Cefoxitin………………………………………………
…….. 6.0mg
Agar……………………………………………………
…….. 14.0 g
pH 7.0 ± 0.2 @ 25°C
Table 2 6: Quality control
Positive control: Expected result
Staphylococcus aureus ATCC® 29213 Inhibition
(partial to complete); N/A
*Staphylococcus aureus ATCC®25923 Inhibition
(partial to complete); N/A
*Staphylococcus aureus ATCC®43300 Growth; Mauve
Staphylococcus aureus ATCC ®3359 Growth; Mauve
Enterococcus faecalis ATCC ®29212 Growth; blue
(Garner, 1996 ; Clinical and Laboratory Standards Institute. 2008)
1.4 Czapek Dox agar
Code: CM0097 / Oxoid
Semi-synthetic solid medium, containing sucrose as C-source and nitrate as the sole
source of nitrogen, useful for the general cultivation of fungi, yeasts and soil bacteria.
Recommended by Czapek (1902-1903) and Dox (1910). Table 2 1 1

185
Table 2.7: Composition of Czapek Dox agar medium
Typical Formula gm/litre
Na NO…………………………………………………. 2.00 g
KCI…………………………………………………….. 0.50 g
Magnesium glycerophosphate………………………… 0.50 g
Fe SO4 (7H2O)………………………………………… 0..01 g
K2 SO4………………………………………………... 0.35 g
Sucrose………………………………………………… 30.0 g
Agar (Oxoid No. 3)………………………………........ 12.0 g
pH 6.8 ± 0.2 @ 25°C
Directions
A proprietary formulation (Oxoid) of Czapek Dox Agar was used for fungal growth. It
was prepared by suspending 45.4 g of the powder in a litre of distilled water. The
medium Was dissolved, and the pH adjusted to 6.8, and sterilised by autoclaving at l2lo
C for 15 min.
Appearance
Dehydrated medium: White coloured, free-flowing powder
Prepared medium: Off-white coloured gel
Table 2 8: Cultural characteristics after 24-48 hours at 35°C.
Organisms (ATCC) Growth
Aspergillus braseliensis (16404) +++
Saccharomyces cerevisiae (9763) +++
Candida albicans (10231) ++
Bacillus subtilis (6633) ++
Staphylococcus aureus (25923) -
1.5 HiCrome (TM) E. coli Agar A
Code: 70722/ Fluka/ Sigma
HiCrome E.coli Agar B is recommended for the detection and enumeration of
Escherichia coli in foods without further confirmation on membrane filter or by indole
reagent.
Table 2 9: Composition of HiCrome (TM) E. coli Agar A
Formula
………………………………………………………………
gm/litre

186
Casein enzymic
hydrolysate…………………………………………..
14.0 g
Peptone
especial………………………………………………………
5.0 g
Bile salts
mixture……………………………………………………….
1.50 g
Disodium
hydrogen…………………………………………………... 1.0 g
Sodium dihydrogen
phosphate………………………………………..
0.6 g
Sodium
chloride………………………………………………………
2.4 g
Glucuronide………………………………………………………... 0.075 g
Agar …………………………………………………………… 12.0 g
pH 7.2 ± 0.2 @ 25°C
Directions :
Suspend 36,6g in 1 litre distilled water. Sterilize by autoclaving at 121°C for 15
minutes. Cool to 50°C and pour into sterile petri plates
Table 2 10: Culture characterisation after 18-24 hours at 44oC
Positive control: Expected results
Escherichia coli ATCC® 25922 * Luxuriant; blue
Klebsiella pneumonia ATCC®
13883
luxuriant colourless, mucoid
Salmonella enteritidis
ATCC® 13076
luxuriant colourless
Staphylococcus aureus
ATCC® 25923
inhibited
Anderson and Baird-Parker., 1975; Hansen and Yourassawsky
Fig 2 3: E. coli on HiCrome agar / Author‟s photo
E. coli

187
1.6 Nutrient Agar (Oxoid)
Code: CM0003 (Powder)
A general purpose medium which may be enriched with up to 10% blood or other
biological fluid.
Table 2 11: Composition of Nutrient Agar
Typical Formula………………………………………. gm/litre
'Lab-Lemco' powder (Oxoid)………………………….. 1.0 g
Yeast extract………………………………………….... 2.0 e
Peptone………………………………………………… 5.0 g
Sodium chloride……………………………………….. 5.0 g
Agar……………………………………………………. 15.0 g
pH 7.4 ± 0.2 @ 25°C
Directions
The medium was prepared by suspending 28g in litre of distilled water, boiled
dissolve completely. Sterilised by autoclaving at l2loC
for 15 minutes.
Table 2 2 12: Quality control
Positive controls: Expected results
Staphylococcus aureus ATCC®
25923 *
Good growth; straw/white
colonies
Escherichia coli ATCC® 25922 * Good growth; straw colonies
Negative control:
Uninoculated medium No change
(Lapage et al. 1970)
1.7 Plate Count Agar
The medium was prepared by suspending 17.5g in litre of distilled water, boiled to
dissolve completely, pH 7.0, sterilised by autoclaving at 121oC for 15 minutes'
Silica gel medium (Parkinson et a1.,1989)
Table 2 13: Composition Plate Count Agar (Oxoid)
Typical Formula………………………………………. gm/litre
Tryptone……………………………………………….. 1.0 g
Yeast extract………………………………………….... 2.5 e
Glucose………………………………………………… 1.0 g
Agar……………………………………………………. 9.0 g

188
pH 7.0 ± 0.2 @ 25°C
Directions
Add 17.5g to 1 litre of distilled water. Dissolve by bringing to the boil with frequent
stirring, mix and distribute into final containers. Sterilise by autoclaving at 121°C for 15
minutes.
Appearance
Dehydrated medium: Straw coloured, free-flowing powder
Prepared medium: Straw coloured gel
Table 2 14: Quality control
Positive control: Expected results
Escherichia coli ATCC® 25922 * Good growth; straw coloured
colonies
Negative control:
Uninoculated plate No change
(PHLS, 1999)
1.8 POTATO DEXTROSE AGAR (EP/USP/JP/BP)
Code: CM0139 (Oxoid)
For the detection and enumeration of yeasts and moulds in butter and other dairy and
food products. Also for the preparation of Aspergillus niger for the Harmonised
Microbial Limit Tests from EP/USP/JP (enumeration test)
Table 2 15: Composition of PAD medium
Formula gm/litre
Potato
tract…………………………………………………...
4.0*
Glucose
………………………………………………………...
20.0
Agar
……………………………………………………………
15.0
pH 5.6 ± 0.2 @ 25°C
Directions
Suspend 39g in 1 litre of water (purified as requested). Bring to the boil to dissolve
completely. Sterilise by autoclaving at 121°C for 15 minutes. Mix well before pouring.

189
Appearance
Dehydrated medium: Off-white, free-flowing powder
Prepared medium: Light straw coloured gel
Table 2 16: Quality Control
Positive control: Expected result
Aspergillus fumigatus ATCC® 9197 * White mycelium, blue green
spores
Negative controls:
Uninoculated medium No change
At pH 3.5 Bacillus subtilis ATCC® 6633
*
No growth
American Public Health Association. (1992)
1.10 XLT-4 AGAR
Code: CM1061 from / Oxoid
A highly selective medium for isolation and identification of Salmonellae from clinical,
environmental and food samples.
Table 17; Composition of XLT-4 Agar
Typical Formula* gm/litre
Proteose Peptone …………………………………………………. 1.6
Yeast extract………………………………………………………. 3.0
Lysine………………………………………………………………. 5.0
Xylose……………………………………………………………… 3.75
Lactose…………………………………………………………….. 7.5
Sucrose……………………………………………………………... 7.5
Ferric ammonium citrate…………………………………………… 0.8
Sodium thiosulphate……………………………………………….. 6.8
Sodium chloride……………………………………………………. 5.0
Phenol Red…………………………………………………………. 0.08
Agar………………………………………………………………… 18.0
pH 7.4 ± 0.2 @ 25°C
Directions
Suspend 59g of XLT-4 Agar Base in 1 litre of distilled water, add 4.6ml of XLT-4
Selective Supplement and bring the medium to the boil.
Do not overheat, do not autoclave.
Cool to approximately 50°C and pour into sterile Petri dishes. It is not advised to hold
the medium at 50°C for longer than 1 hour as this may cause the medium to precipitate.

190
Description
XLT-4 (Xylose Lactose Tergitol™ 4) Agar is a highly selective plating medium used
for isolation and identification of salmonellae from clinical, environmental and food
samples according to Miller
b) XLT-4 SELECTIVE SUPPLEMENT
Code: SR0237/ Oxoid
Table 2 18: Composition of XLT-4 selective supplement
Supplement available in 100 ml (SR0237C) per
litre
Tergitol™
4……………………………………………………….
4.6ml
Appearance: Dehydrated medium: straw coloured, free-flowing powder
Prepared medium: clear red gel
Table 9: Quality control
Positive control: Expected results
Salmonella enteritidis
ATCC®13076 *
Good growth: black or, red with black
centre
Negative controls:
Escherichia coli ATCC®25922 * Reduced growth, yellow
Enterococcus feacalis
ATCC®29212 *
( Miller and Tate, 1990; Dusch and Altwegg, 1995)
Fig 2 4: S. enterica on XLT-4 agar / Author‟s photo
Salmonella enterica

191
192

193

194

195
L 1 2
Fig 2 5: g DNA of isolated bacterial species; (Lane 1) Salmonella and (Lane 2) E. coli,
( lane L); hyper ladder
L 1 2 3
Fig 2 6: PCR- 16Sr RNA, amplification products of Salmonella enteric species
analyzed by electrophoresis in agarose gel lanes represent; ( lane L); hyper ladder;(lane
lane 1); S. enterica R1, (lane 2); S. enerica R2 and (lane 3) positive control.

196
L 1 2
Fig 2 7: PCR- 16Sr RNA, amplification products of Salmonella enteric species
analyzed by electrophoresis in agarose gel lanes represent; ( lane L); hyper ladder;(lane
lane 1); S. enterica R1, (lane 2); S. enerica R2 negative result l.
L 1
Fig 2 8: PCR- 16Sr RNA, amplification products of E. coli analyzed by
electrophoresis in agarose gel lanes represent; ( lane L); hyper ladder;(lane lane 1);
E.coli .

197
Appendix Three: ANOVA tables
Three Way Analysis of Variance Saturday, March 17, 2012, 14:06:28
Data source: E. coli ANOVA of BSFL in BSFL AONVA E. coli
Balanced Design (No Interactions)
Dependent Variable: Y
Normality Test: Failed (P < 0.050)
Equal Variance Test: Passed (P = 1.000)
Source of Variation DF SS MS F P
T 1 1.974E+015 1.974E+015 431.898 <0.001
R 4 1.914E+016 4.784E+015 1046.919 <0.001
C 2 2.713E+013 1.357E+013 2.969 0.109
Residual 8 3.656E+013 4.570E+012
Total 29 2.724E+016 9.394E+014
The difference in the mean values among the different levels of T are greater than
would be expected by chance after allowing for the effects of differences in R and C.
There is a statistically significant difference (P = <0.001). To isolate which group(s)
differ from the others use a multiple comparison procedure.
The difference in the mean values among the different levels of R are greater than
would be expected by chance after allowing for the effects of differences in T and C.
There is a statistically significant difference (P = <0.001). To isolate which group(s)
differ from the others use a multiple comparison procedure.
The difference in the mean values among the different levels of C are not great enough
to exclude the possibility that the difference is just due to random sampling variability
after allowing for the effects of differences in T and R. There is not a statistically
significant difference (P = 0.109).
All Pairwise Multiple Comparison Procedures (Holm-Sidak method):
Overall significance level = 0.05
Comparisons for factor: T
Comparison Diff of Means t Unadjusted P Critical Level Significant?
2.000 vs. 1.000 16221816.000 20.782 <0.001 0.050 Yes
Comparisons for factor: R
Comparison Diff of Means t Unadjusted P Critical Level Significant?
1.000 vs. 5.000 63319106.667 51.305 <0.001 0.005 Yes

198
1.000 vs. 4.000 63293650.000 51.284 <0.001 0.006 Yes
1.000 vs. 3.000 59012683.333 47.815 <0.001 0.006 Yes
2.000 vs. 5.000 36459106.667 29.541 <0.001 0.007 Yes
2.000 vs. 4.000 36433650.000 29.521 <0.001 0.009 Yes
2.000 vs. 3.000 32152683.333 26.052 <0.001 0.010 Yes
1.000 vs. 2.000 26860000.000 21.763 <0.001 0.013 Yes
3.000 vs. 5.000 4306423.333 3.489 0.008 0.017 Yes
3.000 vs. 4.000 4280966.667 3.469 0.008 0.025 Yes
4.000 vs. 5.000 25456.667 0.0206 0.984 0.050 No
Comparisons for factor: C
Comparison Diff of Means t Unadjusted P Critical Level Significant?
1.000 vs. 3.000 2284562.000 2.390 0.044 0.017 No
2.000 vs. 3.000 1536809.000 1.608 0.147 0.025 No
1.000 vs. 2.000 747753.000 0.782 0.457 0.050 No
Power of performed test with alpha = 0.0500: for T : 1.000
Power of performed test with alpha = 0.0500: for R : 1.000
Power of performed test with alpha = 0.0500: for C : 0.288
Least square means for T :
Group Mean
1.000 12725337.333
2.000 28947153.333
Std Err of LS Mean = 551942.360
Least square means for R :
Group Mean
1.000 63333333.333
2.000 36473333.333
3.000 4320650.000
4.000 39683.333
5.000 14226.667
Std Err of LS Mean = 872697.497
Least square means for C :
Group Mean
1.000 21847017.000
2.000 21099264.000
3.000 19562455.000
Std Err of LS Mean = 675988.575

199
Three Way Analysis of Variance Saturday, March 17, 2012, 14:54:58
Data source: ANOVA OF BSFL Salmonella in BSFL ANOVA Salmonella
Balanced Design (No Interactions)
Dependent Variable: Y
Normality Test: Failed (P < 0.050)
Equal Variance Test: Passed (P = 1.000)
Source of Variation DF SS MS F P
T 1 2.293E+013 2.293E+013 955.133 <0.001
R 4 3.360E+014 8.400E+013 3499.420 <0.001
C 2 62712566000.000 31356283000.0
Residual 8 192037221999.938 24004652749.992
Total 29 4.441E+014 1.531E+013
The difference in the mean values among the different levels of T are greater than
would be expected by chance after allowing for the effects of differences in R and C.
There is a statistically significant difference (P = <0.001). To isolate which group(s)
differ from the others use a multiple comparison procedure.
The difference in the mean values among the different levels of R are greater than
would be expected by chance after allowing for the effects of differences in T and C.
There is a statistically significant difference (P = <0.001). To isolate which group(s)
differ from the others use a multiple comparison procedure.
The difference in the mean values among the different levels of C are not great enough
to exclude the possibility that the difference is just due to random sampling variability
after allowing for the effects of differences in T and R. There is not a statistically
significant difference (P = 0.323).
All Pairwise Multiple Comparison Procedures (Holm-Sidak method):
Overall significance level = 0.05
Comparisons for factor: T
Comparison Diff of Means t Unadjusted P Critical Level Significant?
2.000 vs. 1.000 1748433.333 30.905 <0.001 0.050 Yes
Comparisons for factor: R
Comparison Diff of Means t Unadjusted P Critical Level Significant?
1.000 vs. 5.000 8397250.000 93.875 <0.001 0.005 Yes
1.000 vs. 4.000 8379783.333 93.680 <0.001 0.006 Yes

200
1.000 vs. 3.000 8256250.000 92.299 <0.001 0.006 Yes
2.000 vs. 5.000 4309083.333 48.172 <0.001 0.007 Yes
2.000 vs. 4.000 4291616.667 47.977 <0.001 0.009 Yes
2.000 vs. 3.000 4168083.333 46.596 <0.001 0.010 Yes
1.000 vs. 2.000 4088166.667 45.703 <0.001 0.013 Yes
3.000 vs. 5.000 141000.000 1.576 0.154 0.017 No
3.000 vs. 4.000 123533.333 1.381 0.205 0.025 No
4.000 vs. 5.000 17466.667 0.195 0.850 0.050 No
Comparisons for factor: C
Comparison Diff of Means t Unadjusted P Critical Level Significant?
1.000 vs. 3.000 111920.000 1.615 0.145 0.017 No
1.000 vs. 2.000 59470.000 0.858 0.416 0.025 No
2.000 vs. 3.000 52450.000 0.757 0.471 0.050 No
Power of performed test with alpha = 0.0500: for T : 1.000
Power of performed test with alpha = 0.0500: for R : 1.000
Power of performed test with alpha = 0.0500: for C : 0.0826
Least square means for T :
Group Mean
1.000 1701493.333
2.000 3449926.667
Std Err of LS Mean = 40003.877
Least square means for R :
Group Mean
1.000 8400000.000
2.000 4311833.333
3.000 143750.000
4.000 20216.667
5.000 2750.000
Std Err of LS Mean = 63251.683
Least square means for C :
Group Mean
1.000 2632840.000
2.000 2573370.000
3.000 2520920.000
Std Err of LS Mean = 48994.543

201
Three Way Analysis of Variance Saturday, March 17, 2012, 13:00:40
Data source: BSFL AONVA Plate count media in Plate count media ANOVA
Balanced Design (No Interactions)
Dependent Variable: Y
Normality Test: Failed (P < 0.050)
Equal Variance Test: Passed (P = 1.000)
Source of Variation DF SS MS F P
T 1 1.581E+017 1.581E+017 102.181 <0.001
R 4 7.626E+017 1.906E+017 123.201 <0.001
C 2 7.304E+015 3.652E+015 2.360 0.156
Residual 8 1.238E+016 1.547E+015
Total 29 1.560E+018 5.378E+016
The difference in the mean values among the different levels of T are greater than
would be expected by chance after allowing for the effects of differences in R and C.
There is a statistically significant difference (P = <0.001). To isolate which group(s)
differ from the others use a multiple comparison procedure.
The difference in the mean values among the different levels of R are greater than
would be expected by chance after allowing for the effects of differences in T and C.
There is a statistically significant difference (P = <0.001). To isolate which group(s)
differ from the others use a multiple comparison procedure.
The difference in the mean values among the different levels of C are not great enough
to exclude the possibility that the difference is just due to random sampling variability
after allowing for the effects of differences in T and R. There is not a statistically
significant difference (P = 0.156).
All Pairwise Multiple Comparison Procedures (Holm-Sidak method):
Overall significance level = 0.05
Comparisons for factor: T
Comparison Diff of Means t Unadjusted P Critical Level Significant?
2.000 vs. 1.000 145196940.000 10.108 <0.001 0.050 Yes
Comparisons for factor: R
Comparison Diff of Means t Unadjusted P Critical Level Significant?
2.000 vs. 5.000 363737183.333 16.016 <0.001 0.005 Yes
2.000 vs. 4.000 361496500.000 15.917 <0.001 0.006 Yes

202
2.000 vs. 3.000 359237333.333 15.818 <0.001 0.006 Yes
1.000 vs. 5.000 283270516.667 12.473 <0.001 0.007 Yes
1.000 vs. 4.000 281029833.333 12.374 <0.001 0.009 Yes
1.000 vs. 3.000 278770666.667 12.275 <0.001 0.010 Yes
2.000 vs. 1.000 80466666.667 3.543 0.008 0.013 Yes
3.000 vs. 5.000 4499850.000 0.198 0.848 0.017 No
3.000 vs. 4.000 2259166.667 0.0995 0.923 0.025 No
4.000 vs. 5.000 2240683.333 0.0987 0.924 0.050 No
Comparisons for factor: C
Comparison Diff of Means t Unadjusted P Critical Level Significant?
1.000 vs. 2.000 37619750.000 2.138 0.065 0.017 No
1.000 vs. 3.000 24658710.000 1.402 0.199 0.025 No
3.000 vs. 2.000 12961040.000 0.737 0.482 0.050 No
Power of performed test with alpha = 0.0500: for T : 1.000
Power of performed test with alpha = 0.0500: for R : 1.000
Power of performed test with alpha = 0.0500: for C : 0.209
Least square means for T :
Group Mean
1.000 58213993.333
2.000 203410933.333
Std Err of LS Mean = 10156812.630
Least square means for R :
Group Mean
1.000 283333333.333
2.000 363800000.000
3.000 4562666.667
4.000 2303500.000
5.000 62816.667
Std Err of LS Mean = 16059330.839
Least square means for C :
Group Mean
1.000 151571950.000
2.000 113952200.000
3.000 126913240.000
Std Err of LS Mean = 12439504.178

203
Three Way Analysis of Variance Saturday, March 17, 2012, 12:27:59
Data source: E. coli ANOVA in FBL E. coli ANOVA
Balanced Design (No Interactions)
Dependent Variable: Y
Normality Test: Failed (P < 0.050)
Equal Variance Test: Passed (P = 1.000)
Source of Variation DF SS MS F P
R 1 8.554E+015 8.554E+015 455.393 <0.001
T 4 3.470E+016 8.676E+015 461.905 <0.001
C 2 4.231E+013 2.115E+013 1.126 0.371
Residual 8 1.503E+014 1.878E+013
Total 29 7.776E+016 2.681E+015
The difference in the mean values among the different levels of R are greater than
would be expected by chance after allowing for the effects of differences in T and C.
There is a statistically significant difference (P = <0.001). To isolate which group(s)
differ from the others use a multiple comparison procedure.
The difference in the mean values among the different levels of T are greater than
would be expected by chance after allowing for the effects of differences in R and C.
There is a statistically significant difference (P = <0.001). To isolate which group(s)
differ from the others use a multiple comparison procedure.
The difference in the mean values among the different levels of C are not great enough
to exclude the possibility that the difference is just due to random sampling variability
after allowing for the effects of differences in R and T. There is not a statistically
significant difference (P = 0.371).
All Pairwise Multiple Comparison Procedures (Holm-Sidak method):
Overall significance level = 0.05
Comparisons for factor: R
Comparison Diff of Means t Unadjusted P Critical Level Significant?
2.000 vs. 1.000 33771066.667 21.340 <0.001 0.050 Yes
Comparisons for factor: T
Comparison Diff of Means t Unadjusted P Critical Level Significant?
2.000 vs. 5.000 88992000.000 35.566 <0.001 0.005 Yes
2.000 vs. 4.000 88841000.000 35.505 <0.001 0.006 Yes

204
2.000 vs. 3.000 84650000.000 33.830 <0.001 0.006 Yes
2.000 vs. 1.000 71783333.333 28.688 <0.001 0.007 Yes
1.000 vs. 5.000 17208666.667 6.877 <0.001 0.009 Yes
1.000 vs. 4.000 17057666.667 6.817 <0.001 0.010 Yes
1.000 vs. 3.000 12866666.667 5.142 <0.001 0.013 Yes
3.000 vs. 5.000 4342000.000 1.735 0.121 0.017 No
3.000 vs. 4.000 4191000.000 1.675 0.132 0.025 No
4.000 vs. 5.000 151000.000 0.0603 0.953 0.050 No
Comparisons for factor: C
Comparison Diff of Means t Unadjusted P Critical Level Significant?
1.000 vs. 3.000 2812600.000 1.451 0.185 0.017 No
1.000 vs. 2.000 2049200.000 1.057 0.321 0.025 No
2.000 vs. 3.000 763400.000 0.394 0.704 0.050 No
Power of performed test with alpha = 0.0500: for R : 1.000
Power of performed test with alpha = 0.0500: for T : 1.000
Power of performed test with alpha = 0.0500: for C : 0.0630
Least square means for R :
Group Mean
1.000 5377866.667
2.000 39148933.333
Std Err of LS Mean = 1119016.803
Least square means for T :
Group Mean
1.000 17333333.333
2.000 89116666.667
3.000 4466666.667
4.000 275666.667
5.000 124666.667
Std Err of LS Mean = 1769320.918
Least square means for C :
Group Mean
1.000 23884000.000
2.000 21834800.000
3.000 21071400.000
Std Err of LS Mean = 1370510.090

205
Three Way Analysis of Variance Tuesday, January 17, 2012, 21:49:21
Data source: FBL Salmonella ANOVA in FBL Salmonella ANOVA
Balanced Design (No Interactions)
Dependent Variable: Y
Normality Test: Failed (P < 0.050)
Equal Variance Test: Passed (P = 1.000)
Source of Variation DF SS MS F P
R 1 2.473E+017 2.473E+017 237.919 <0.001
T 4 7.879E+017 1.970E+017 189.502 <0.001
C 2 2.672E+015 1.336E+015 1.285 0.328
Residual 8 8.315E+015 1.039E+015
Total 29 1.872E+018 6.454E+016
The difference in the mean values among the different levels of R are greater than
would be expected by chance after allowing for the effects of differences in T and C.
There is a statistically significant difference (P = <0.001). To isolate which group(s)
differ from the others use a multiple comparison procedure.
The difference in the mean values among the different levels of T are greater than
would be expected by chance after allowing for the effects of differences in R and C.
There is a statistically significant difference (P = <0.001). To isolate which group(s)
differ from the others use a multiple comparison procedure.
The difference in the mean values among the different levels of C are not great enough
to exclude the possibility that the difference is just due to random sampling variability
after allowing for the effects of differences in R and T. There is not a statistically
significant difference (P = 0.328).
All Pairwise Multiple Comparison Procedures (Holm-Sidak method):
Overall significance level = 0.05
Comparisons for factor: R
Comparison Diff of Means t Unadjusted P Critical Level Significant?
2.000 vs. 1.000 181583786.667 15.425 <0.001 0.050 Yes
Comparisons for factor: T
Comparison Diff of Means t Unadjusted P Critical Level Significant?
2.000 vs. 5.000 420681950.000 22.601 <0.001 0.005 Yes
2.000 vs. 4.000 420623483.333 22.598 <0.001 0.006 Yes
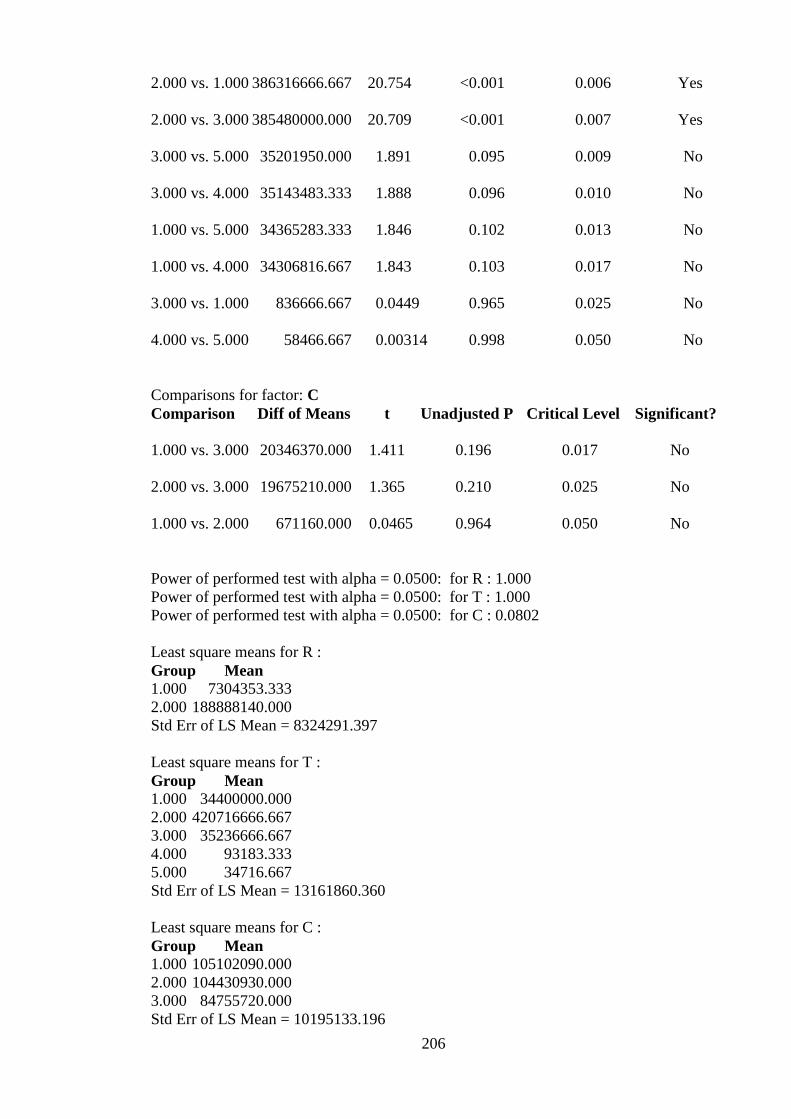
206
2.000 vs. 1.000 386316666.667 20.754 <0.001 0.006 Yes
2.000 vs. 3.000 385480000.000 20.709 <0.001 0.007 Yes
3.000 vs. 5.000 35201950.000 1.891 0.095 0.009 No
3.000 vs. 4.000 35143483.333 1.888 0.096 0.010 No
1.000 vs. 5.000 34365283.333 1.846 0.102 0.013 No
1.000 vs. 4.000 34306816.667 1.843 0.103 0.017 No
3.000 vs. 1.000 836666.667 0.0449 0.965 0.025 No
4.000 vs. 5.000 58466.667 0.00314 0.998 0.050 No
Comparisons for factor: C
Comparison Diff of Means t Unadjusted P Critical Level Significant?
1.000 vs. 3.000 20346370.000 1.411 0.196 0.017 No
2.000 vs. 3.000 19675210.000 1.365 0.210 0.025 No
1.000 vs. 2.000 671160.000 0.0465 0.964 0.050 No
Power of performed test with alpha = 0.0500: for R : 1.000
Power of performed test with alpha = 0.0500: for T : 1.000
Power of performed test with alpha = 0.0500: for C : 0.0802
Least square means for R :
Group Mean
1.000 7304353.333
2.000 188888140.000
Std Err of LS Mean = 8324291.397
Least square means for T :
Group Mean
1.000 34400000.000
2.000 420716666.667
3.000 35236666.667
4.000 93183.333
5.000 34716.667
Std Err of LS Mean = 13161860.360
Least square means for C :
Group Mean
1.000 105102090.000
2.000 104430930.000
3.000 84755720.000
Std Err of LS Mean = 10195133.196

207
Three Way Analysis of Variance Saturday, March 17, 2012, 20:02:03
Data source: FBL Plate count media ANOVA in FBL Plate count media ANOVA
Balanced Design (No Interactions)
Dependent Variable: Y
Normality Test: Failed (P < 0.050)
Equal Variance Test: Passed (P = 1.000)
Source of Variation DF SS MS F P
R 1 2.338E+017 2.338E+017 1114.570 <0.001
T 4 8.676E+017 2.169E+017 1034.149 <0.001
C 2 1.363E+014 6.814E+013 0.325 0.732
Residual 8 1.678E+015 2.097E+014
Total 29 1.815E+018 6.259E+016
The difference in the mean values among the different levels of R are greater than
would be expected by chance after allowing for the effects of differences in T and C.
There is a statistically significant difference (P = <0.001). To isolate which group(s)
differ from the others use a multiple comparison procedure.
The difference in the mean values among the different levels of T are greater than
would be expected by chance after allowing for the effects of differences in R and C.
There is a statistically significant difference (P = <0.001). To isolate which group(s)
differ from the others use a multiple comparison procedure.
The difference in the mean values among the different levels of C are not great enough
to exclude the possibility that the difference is just due to random sampling variability
after allowing for the effects of differences in R and T. There is not a statistically
significant difference (P = 0.732).
All Pairwise Multiple Comparison Procedures (Holm-Sidak method):
Overall significance level = 0.05
Comparisons for factor: R
Comparison Diff of Means t Unadjusted P Critical Level Significant?
2.000 vs. 1.000 176550300.000 33.385 <0.001 0.050 Yes
Comparisons for factor: T
Comparison Diff of Means t Unadjusted P Critical Level Significant?
2.000 vs. 5.000 452886583.333 54.163 <0.001 0.005 Yes
2.000 vs. 4.000 452667666.667 54.137 <0.001 0.006 Yes

208
2.000 vs. 3.000 403100000.000 48.209 <0.001 0.006 Yes
2.000 vs. 1.000 309666666.667 37.035 <0.001 0.007 Yes
1.000 vs. 5.000 143219916.667 17.128 <0.001 0.009 Yes
1.000 vs. 4.000 143001000.000 17.102 <0.001 0.010 Yes
1.000 vs. 3.000 93433333.333 11.174 <0.001 0.013 Yes
3.000 vs. 5.000 49786583.333 5.954 <0.001 0.017 Yes
3.000 vs. 4.000 49567666.667 5.928 <0.001 0.025 Yes
4.000 vs. 5.000 218916.667 0.0262 0.980 0.050 No
Comparisons for factor: C
Comparison Diff of Means t Unadjusted P Critical Level Significant?
3.000 vs. 1.000 5214920.000 0.805 0.444 0.017 No
2.000 vs. 1.000 2822550.000 0.436 0.675 0.025 No
3.000 vs. 2.000 2392370.000 0.369 0.721 0.050 No
Power of performed test with alpha = 0.0500: for R : 1.000
Power of performed test with alpha = 0.0500: for T : 1.000
Power of performed test with alpha = 0.0500: for C : 0.0500
Least square means for R :
Group Mean
1.000 41060666.667
2.000 217610966.667
Std Err of LS Mean = 3739382.136
Least square means for T :
Group Mean
1.000 143333333.333
2.000 453000000.000
3.000 49900000.000
4.000 332333.333
5.000 113416.667
Std Err of LS Mean = 5912482.295
Least square means for C :
Group Mean
1.000 126656660.000
2.000 129479210.000
3.000 131871580.000
Std Err of LS Mean = 4579789.093

209
Larvae Guts
Three Way Analysis of Variance Monday, March 19, 2012, 14:24:45
Data source: ANOVA BSFL gut E. coli in ANOVA BSFL gut E. coli
Balanced Design (No Interactions)
Dependent Variable: Col 4
Normality Test: Failed (P < 0.050)
Equal Variance Test: Passed (P = 1.000)
Source of Variation DF SS MS F P
T 1 3491104687.500 3491104687.500 141.130 <0.001
C 4 5039706996.667 1259926749.167 50.933 <0.001
R 2 91331151.667 45665575.833 1.846 0.219
Residual 8 197894770.000 24736846.250
Total 29 14123564784.167 487019475.316
The difference in the mean values among the different levels of T are greater than
would be expected by chance after allowing for the effects of differences in C and R.
There is a statistically significant difference (P = <0.001). To isolate which group(s)
differ from the others use a multiple comparison procedure.
The difference in the mean values among the different levels of C are greater than
would be expected by chance after allowing for the effects of differences in T and R.
There is a statistically significant difference (P = <0.001). To isolate which group(s)
differ from the others use a multiple comparison procedure.
The difference in the mean values among the different levels of R are not great enough
to exclude the possibility that the difference is just due to random sampling variability
after allowing for the effects of differences in T and C. There is not a statistically
significant difference (P = 0.219).
All Pairwise Multiple Comparison Procedures (Holm-Sidak method):
Overall significance level = 0.05
Comparisons for factor: T
Comparison Diff of Means t Unadjusted P Critical Level Significant?
2.000 vs. 1.000 21575.000 11.880 <0.001 0.050 Yes
Comparisons for factor: C
Comparison Diff of Means t Unadjusted P Critical Level Significant?
2.000 vs. 1.000 34163.333 11.897 <0.001 0.005 Yes
2.000 vs. 5.000 34017.500 11.847 <0.001 0.006 Yes

210
2.000 vs. 4.000 30211.667 10.521 <0.001 0.006 Yes
2.000 vs. 3.000 19218.333 6.693 <0.001 0.007 Yes
3.000 vs. 1.000 14945.000 5.205 <0.001 0.009 Yes
3.000 vs. 5.000 14799.167 5.154 <0.001 0.010 Yes
3.000 vs. 4.000 10993.333 3.828 0.005 0.013 Yes
4.000 vs. 1.000 3951.667 1.376 0.206 0.017 No
4.000 vs. 5.000 3805.833 1.325 0.222 0.025 No
5.000 vs. 1.000 145.833 0.0508 0.961 0.050 No
Comparisons for factor: R
Comparison Diff of Means t Unadjusted P Critical Level Significant?
1.000 vs. 3.000 4167.500 1.874 0.098 0.017 No
2.000 vs. 3.000 2904.500 1.306 0.228 0.025 No
1.000 vs. 2.000 1263.000 0.568 0.586 0.050 No
Power of performed test with alpha = 0.0500: for T : 1.000
Power of performed test with alpha = 0.0500: for C : 1.000
Power of performed test with alpha = 0.0500: for R : 0.145
Least square means for T :
Group Mean
1.000 120.333
2.000 21695.333
Std Err of LS Mean = 1284.182
Least square means for C :
Group Mean
1.000 266.667
2.000 34430.000
3.000 15211.667
4.000 4218.333
5.000 412.500
Std Err of LS Mean = 2030.470
Least square means for R :
Group Mean
1.000 12718.000
2.000 11455.000
3.000 8550.500
Std Err of LS Mean = 1572.795

211
Three Way Analysis of Variance Monday, March 19, 2012, 14:32:22
Data source: ANOVA BSFL gut Salmonella in ANOVA BSFL gut Salmonella
Balanced Design (No Interactions)
Dependent Variable: Col 4
Normality Test: Passed (P = 0.097)
Equal Variance Test: Passed (P = 1.000)
Source of Variation DF SS MS F P
T 1 21075980853.333 21075980853.333 12.305 0.008
C 4 35539650118.133 8884912529.533 5.188 0.023
R 2 2254822678.400 1127411339.200 0.658 0.544
Residual 8 13702023586.667 1712752948.333
Total 29 124078968596.800 4278585124.028
The difference in the mean values among the different levels of T are greater than
would be expected by chance after allowing for the effects of differences in C and R.
There is a statistically significant difference (P = 0.008). To isolate which group(s)
differ from the others use a multiple comparison procedure.
The difference in the mean values among the different levels of C are greater than
would be expected by chance after allowing for the effects of differences in T and R.
There is a statistically significant difference (P = 0.023). To isolate which group(s)
differ from the others use a multiple comparison procedure.
The difference in the mean values among the different levels of R are not great enough
to exclude the possibility that the difference is just due to random sampling variability
after allowing for the effects of differences in T and C. There is not a statistically
significant difference (P = 0.544).
All Pairwise Multiple Comparison Procedures (Holm-Sidak method):
Overall significance level = 0.05
Comparisons for factor: T
Comparison Diff of Means t Unadjusted P Critical Level Significant?
2.000 vs. 1.000 53010.667 3.508 0.008 0.050 Yes
Comparisons for factor: C
Comparison Diff of Means t Unadjusted P Critical Level Significant?
3.000 vs. 1.000 88390.667 3.699 0.006 0.005 No
3.000 vs. 5.000 87605.000 3.666 0.006 0.006 No

212
3.000 vs. 4.000 85338.333 3.572 0.007 0.006 No
3.000 vs. 2.000 48490.000 2.029 0.077 0.007 No
2.000 vs. 1.000 39900.667 1.670 0.133 0.009 No
2.000 vs. 5.000 39115.000 1.637 0.140 0.010 No
2.000 vs. 4.000 36848.333 1.542 0.162 0.013 No
4.000 vs. 1.000 3052.333 0.128 0.902 0.017 No
4.000 vs. 5.000 2266.667 0.0949 0.927 0.025 No
5.000 vs. 1.000 785.667 0.0329 0.975 0.050 No
Comparisons for factor: R
Comparison Diff of Means t Unadjusted P Critical Level Significant?
3.000 vs. 1.000 18648.400 1.008 0.343 0.017 No
3.000 vs. 2.000 18122.000 0.979 0.356 0.025 No
2.000 vs. 1.000 526.400 0.0284 0.978 0.050 No
Power of performed test with alpha = 0.0500: for T : 0.847
Power of performed test with alpha = 0.0500: for C : 0.689
Power of performed test with alpha = 0.0500: for R : 0.0500
Least square means for T :
Group Mean
1.000 39.867
2.000 53050.533
Std Err of LS Mean = 10685.669
Least square means for C :
Group Mean
1.000 119.333
2.000 40020.000
3.000 88510.000
4.000 3171.667
5.000 905.000
Std Err of LS Mean = 16895.527
Least square means for R :
Group Mean
1.000 20153.600
2.000 20680.000
3.000 38802.000
Std Err of LS Mean = 13087.219

213
Three Way Analysis of Variance Monday, March 19, 2012, 16:14:50
Data source: ANOVA BSFL gut Plate count medium in ANOVA BSFL gut Plate
count medium
Balanced Design (No Interactions)
Dependent Variable: Col 4
Normality Test: Failed (P < 0.050)
Equal Variance Test: Passed (P = 1.000)
Source of Variation DF SS MS F P
Col 1 1 795360395700.300 795360395700.300 179.832 <0.001
Col 2 4 1.220E+012 30 5092657541.967 68.982 <0.001
Col 3 2 15524723293.267 7762361646.633 1.755 0.233
Residual 8 35382363173.067 4422795396.633
Total 2 3. 327E+012 1 14719680659.151
The difference in the mean values among the different levels of Col 1 are greater than
would be expected by chance after allowing for the effects of differences in Col 2 and
Col 3. There is a statistically significant difference (P = <0.001). To isolate which
group(s) differ from the others use a multiple comparison procedure.
The difference in the mean values among the different levels of Col 2 are greater than
would be expected by chance after allowing for the effects of differences in Col 1 and
Col 3. There is a statistically significant difference (P = <0.001). To isolate which
group(s) differ from the others use a multiple comparison procedure.
The difference in the mean values among the different levels of Col 3 are not great
enough to exclude the possibility that the difference is just due to random sampling
variability after allowing for the effects of differences in Col 1 and Col 2. There is not a
statistically significant difference (P = 0.233).
All Pairwise Multiple Comparison Procedures (Holm-Sidak method):
Overall significance level = 0.05
Comparisons for factor: Col 1
Comparison Diff of Means t Unadjusted P Critical Level Significant?
2.000 vs. 1.000 325650.200 13.410 <0.001 0.050 Yes
Comparisons for factor: Col 2
Comparison Diff of Means t Unadjusted P Critical Level Significant?
2.000 vs. 5.000 483278.833 12.587 <0.001 0.005 Yes

214
2.000 vs. 1.000 479883.333 12.498 <0.001 0.006 Yes
2.000 vs. 4.000 474980.000 12.371 <0.001 0.006 Yes
3.000 vs. 5.000 320612.167 8.350 <0.001 0.007 Yes
3.000 vs. 1.000 317216.667 8.262 <0.001 0.009 Yes
3.000 vs. 4.000 312313.333 8.134 <0.001 0.010 Yes
2.000 vs. 3.000 162666.667 4.237 0.003 0.013 Yes
4.000 vs. 5.000 8298.833 0.216 0.834 0.017 No
4.000 vs. 1.000 4903.333 0.128 0.902 0.025 No
1.000 vs. 5.000 3395.500 0.0884 0.932 0.050 No
Comparisons for factor: Col 3
Comparison Diff of Means t Unadjusted P Critical Level Significant?
1.000 vs. 3.000 55721.700 1.874 0.098 0.017 No
2.000 vs. 3.000 28027.000 0.942 0.374 0.025 No
1.000 vs. 2.000 27694.700 0.931 0.379 0.050 No
Power of performed test with alpha = 0.0500: for Col 1 : 1.000
Power of performed test with alpha = 0.0500: for Col 2 : 1.000
Power of performed test with alpha = 0.0500: for Col 3 : 0.134
Least square means for Col 1 :
Group Mean
1.000 2563.133
2.000 328213.333
Std Err of LS Mean = 17171.285
Least square means for Col 2 :
Group Mean
1.000 5666.667
2.000 485550.000
3.000 322883.333
4.000 10570.000
5.000 2271.167
Std Err of LS Mean = 27150.185
Least square means for Col 3 :
Group Mean
1.000 193193.700
2.000 165499.000
3.000 137472.000
Std Err of LS Mean = 21030.443

215
Three Way Analysis of Variance Monday, March 19, 2012, 15:50:56
Data source: ANOVA FBL gut E. coli in ANOVA FBL gut E. coli
Balanced Design (No Interactions)
Dependent Variable: Y
Normality Test: Failed (P < 0.050)
Equal Variance Test: Passed (P = 1.000)
Source of Variation DF SS MS F P
T 1 289342177348.033 289342177348.033549.679 <0.001
C 4 865296991978.467 216324247994.617410.963 <0.001
R 2 2437231576.467 1218615788.2332.315 0.161
Residual 8 4211070551.867 526383818.983
Total 29 2.057E+012 70946674171.551
The difference in the mean values among the different levels of T are greater than
would be expected by chance after allowing for the effects of differences in C and R.
There is a statistically significant difference (P = <0.001). To isolate which group(s)
differ from the others use a multiple comparison procedure.
The difference in the mean values among the different levels of C are greater than
would be expected by chance after allowing for the effects of differences in T and R.
There is a statistically significant difference (P = <0.001). To isolate which group(s)
differ from the others use a multiple comparison procedure.
The difference in the mean values among the different levels of R are not great enough
to exclude the possibility that the difference is just due to random sampling variability
after allowing for the effects of differences in T and C. There is not a statistically
significant difference (P = 0.161).
All Pairwise Multiple Comparison Procedures (Holm-Sidak method):
Overall significance level = 0.05
Comparisons for factor: T
Comparison Diff of Means t Unadjusted P Critical Level Significant?
2.000 vs. 1.000 196415.267 23.445 <0.001 0.050 Yes
Comparisons for factor: C
Comparison Diff of Means t Unadjusted P Critical Level Significant?
3.000 vs. 5.000 441169.000 33.305 <0.001 0.005 Yes

216
3.000 vs. 4.000 430199.333 32.477 <0.001 0.006 Yes
3.000 vs. 1.000 418376.167 31.585 <0.001 0.006 Yes
3.000 vs. 2.000 404107.833 30.508 <0.001 0.007 Yes
2.000 vs. 5.000 37061.167 2.798 0.023 0.009 No
2.000 vs. 4.000 26091.500 1.970 0.084 0.010 No
1.000 vs. 5.000 22792.833 1.721 0.124 0.013 No
2.000 vs. 1.000 14268.333 1.077 0.313 0.017 No
1.000 vs. 4.000 11823.167 0.893 0.398 0.025 No
4.000 vs. 5.000 10969.667 0.828 0.432 0.050 No
Comparisons for factor: R
Comparison Diff of Means t Unadjusted P Critical Level Significant?
2.000 vs. 1.000 21282.200 2.074 0.072 0.017 No
3.000 vs. 1.000 15728.900 1.533 0.164 0.025 No
2.000 vs. 3.000 5553.300 0.541 0.603 0.050 No
Power of performed test with alpha = 0.0500: for T : 1.000
Power of performed test with alpha = 0.0500: for C : 1.000
Power of performed test with alpha = 0.0500: for R : 0.204
Least square means for T :
Group Mean
1.000 4731.400
2.000 201146.667
Std Err of LS Mean = 5923.872
Least square means for C :
Group Mean
1.000 23333.333
2.000 37601.667
3.000 441709.500
4.000 11510.167
5.000 540.500
Std Err of LS Mean = 9366.463
Least square means for R :
Group Mean
1.000 90602.000
2.000 111884.200
3.000 106330.900
Std Err of LS Mean = 7255.231

217
Three Way Analysis of Variance Monday, March 19, 2012, 15:59:35
Data source: ANOVA FBL gut Salmonella in ANOVA FBL gut Salmonella
Balanced Design (No Interactions)
Dependent Variable: Y
Normality Test: Failed (P < 0.050)
Equal Variance Test: Passed (P = 1.000)
Source of Variation DF SS MS F P
T 1 5083997648.133 5083997648.133 97.628 <0.001
C 4 3124422187.200 781105546.800 15.000 <0.001
R 2 179414888.467 89707444.233 1.723 0.239
Residual 8 416599594.200 52074949.275
Total 29 13693679987.867 472195861.651
The difference in the mean values among the different levels of T are greater than
would be expected by chance after allowing for the effects of differences in C and R.
There is a statistically significant difference (P = <0.001). To isolate which group(s)
differ from the others use a multiple comparison procedure.
The difference in the mean values among the different levels of C are greater than
would be expected by chance after allowing for the effects of differences in T and R.
There is a statistically significant difference (P = <0.001). To isolate which group(s)
differ from the others use a multiple comparison procedure.
The difference in the mean values among the different levels of R are not great enough
to exclude the possibility that the difference is just due to random sampling variability
after allowing for the effects of differences in T and C. There is not a statistically
significant difference (P = 0.239).
All Pairwise Multiple Comparison Procedures (Holm-Sidak method):
Overall significance level = 0.05
Comparisons for factor: T
Comparison Diff of Means t Unadjusted P Critical Level Significant?
2.000 vs. 1.000 26035.867 9.881 <0.001 0.050 Yes
Comparisons for factor: C
Comparison Diff of Means t Unadjusted P Critical Level Significant?
3.000 vs. 4.000 30753.333 7.381 <0.001 0.005 Yes
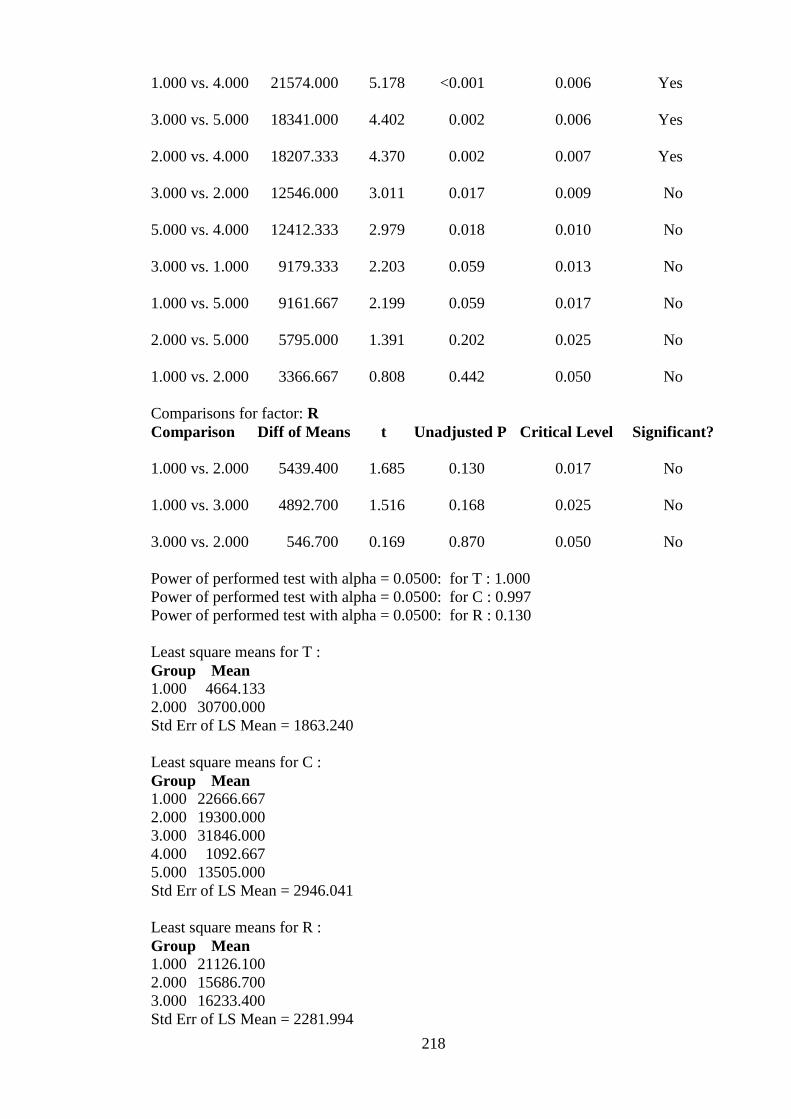
218
1.000 vs. 4.000 21574.000 5.178 <0.001 0.006 Yes
3.000 vs. 5.000 18341.000 4.402 0.002 0.006 Yes
2.000 vs. 4.000 18207.333 4.370 0.002 0.007 Yes
3.000 vs. 2.000 12546.000 3.011 0.017 0.009 No
5.000 vs. 4.000 12412.333 2.979 0.018 0.010 No
3.000 vs. 1.000 9179.333 2.203 0.059 0.013 No
1.000 vs. 5.000 9161.667 2.199 0.059 0.017 No
2.000 vs. 5.000 5795.000 1.391 0.202 0.025 No
1.000 vs. 2.000 3366.667 0.808 0.442 0.050 No
Comparisons for factor: R
Comparison Diff of Means t Unadjusted P Critical Level Significant?
1.000 vs. 2.000 5439.400 1.685 0.130 0.017 No
1.000 vs. 3.000 4892.700 1.516 0.168 0.025 No
3.000 vs. 2.000 546.700 0.169 0.870 0.050 No
Power of performed test with alpha = 0.0500: for T : 1.000
Power of performed test with alpha = 0.0500: for C : 0.997
Power of performed test with alpha = 0.0500: for R : 0.130
Least square means for T :
Group Mean
1.000 4664.133
2.000 30700.000
Std Err of LS Mean = 1863.240
Least square means for C :
Group Mean
1.000 22666.667
2.000 19300.000
3.000 31846.000
4.000 1092.667
5.000 13505.000
Std Err of LS Mean = 2946.041
Least square means for R :
Group Mean
1.000 21126.100
2.000 15686.700
3.000 16233.400
Std Err of LS Mean = 2281.994
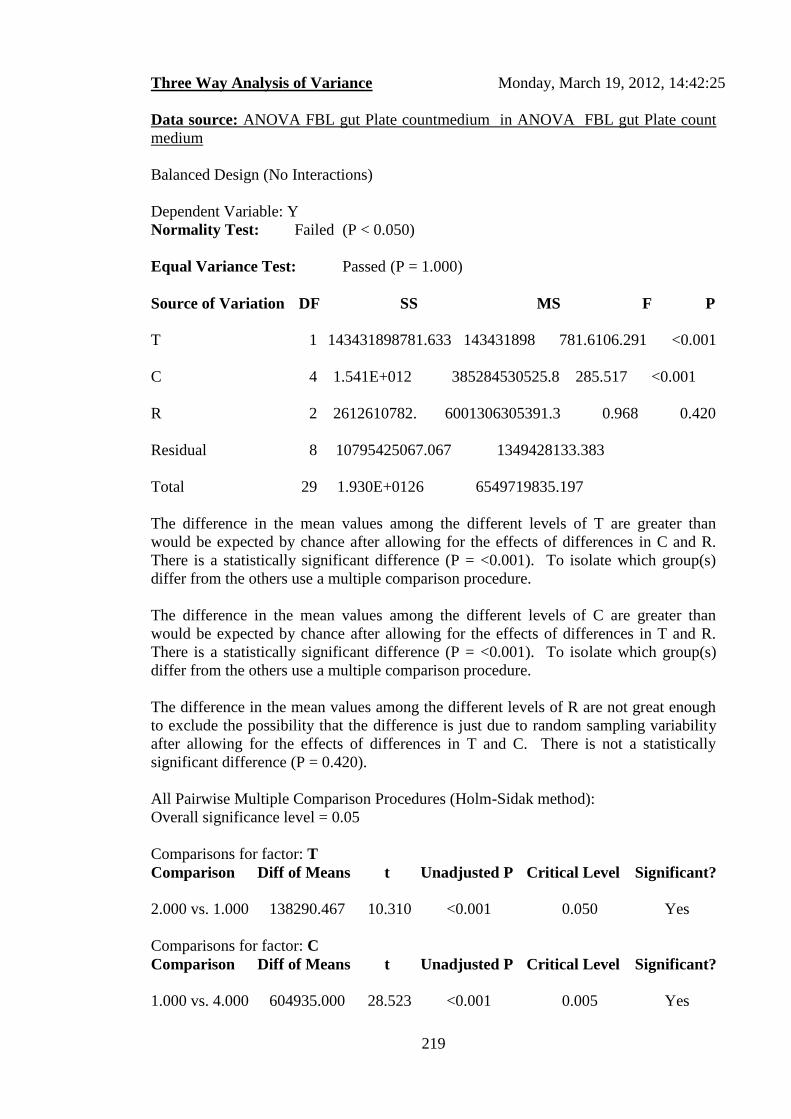
219
Three Way Analysis of Variance Monday, March 19, 2012, 14:42:25
Data source: ANOVA FBL gut Plate countmedium in ANOVA FBL gut Plate count
medium
Balanced Design (No Interactions)
Dependent Variable: Y
Normality Test: Failed (P < 0.050)
Equal Variance Test: Passed (P = 1.000)
Source of Variation DF SS MS F P
T 1 143431898781.633 143431898 781.6106.291 <0.001
C 4 1.541E+012 385284530525.8 285.517 <0.001
R 2 2612610782. 6001306305391.3 0.968 0.420
Residual 8 10795425067.067 1349428133.383
Total 29 1.930E+0126 6549719835.197
The difference in the mean values among the different levels of T are greater than
would be expected by chance after allowing for the effects of differences in C and R.
There is a statistically significant difference (P = <0.001). To isolate which group(s)
differ from the others use a multiple comparison procedure.
The difference in the mean values among the different levels of C are greater than
would be expected by chance after allowing for the effects of differences in T and R.
There is a statistically significant difference (P = <0.001). To isolate which group(s)
differ from the others use a multiple comparison procedure.
The difference in the mean values among the different levels of R are not great enough
to exclude the possibility that the difference is just due to random sampling variability
after allowing for the effects of differences in T and C. There is not a statistically
significant difference (P = 0.420).
All Pairwise Multiple Comparison Procedures (Holm-Sidak method):
Overall significance level = 0.05
Comparisons for factor: T
Comparison Diff of Means t Unadjusted P Critical Level Significant?
2.000 vs. 1.000 138290.467 10.310 <0.001 0.050 Yes
Comparisons for factor: C
Comparison Diff of Means t Unadjusted P Critical Level Significant?
1.000 vs. 4.000 604935.000 28.523 <0.001 0.005 Yes

220
1.000 vs. 5.000 598791.167 28.233 <0.001 0.006 Yes
1.000 vs. 3.000 522166.667 24.620 <0.001 0.006 Yes
1.000 vs. 2.000 357500.000 16.856 <0.001 0.007 Yes
2.000 vs. 4.000 247435.000 11.667 <0.001 0.009 Yes
2.000 vs. 5.000 241291.167 11.377 <0.001 0.010 Yes
2.000 vs. 3.000 164666.667 7.764 <0.001 0.013 Yes
3.000 vs. 4.000 82768.333 3.903 0.005 0.017 Yes
3.000 vs. 5.000 76624.500 3.613 0.007 0.025 Yes
5.000 vs. 4.000 6143.833 0.290 0.779 0.050 No
Comparisons for factor: R
Comparison Diff of Means t Unadjusted P Critical Level Significant?
1.000 vs. 3.000 22800.700 1.388 0.203 0.017 No
2.000 vs. 3.000 12810.200 0.780 0.458 0.025 No
1.000 vs. 2.000 9990.500 0.608 0.560 0.050 No
Power of performed test with alpha = 0.0500: for T : 1.000
Power of performed test with alpha = 0.0500: for C : 1.000
Power of performed test with alpha = 0.0500: for R : 0.0500
Least square means for T :
Group Mean
1.000 130842.867
2.000 269133.333
Std Err of LS Mean = 9484.823
Least square means for C :
Group Mean
1.000 616666.667
2.000 259166.667
3.000 94500.000
4.000 11731.667
5.000 17875.500
Std Err of LS Mean = 14996.823
Least square means for R :
Group Mean
1.000 210918.500
2.000 200928.000
3.000 188117.800
Std Err of LS Mean = 11616.489

221
Appendix Four: Turbo mass spectrometer GC/MS
Fig 4 1: Turbo mass spectrometer detector used in GC/MS; a) Outer view b) Inside view
Fig 4 2: Capillary column (Zebran ZB-S, 30 m length x 0.25 mm
Diameter x 0.25 μm phase thickness)
a b
222
Interactions between invertebrates and pathogenic and non-pathogenic bacteria
S. Jaber and M. WainwrightDepartment of Molecular Biology and Biotechnology, Firth Court, Western Bank, University of Sheffield, S10 2TN, England
The risks of canine waste accumulation in urban environment and agro-ecosystem is an ever-growing issue, pathogenic bacteria such as Escherichia coli and Salmonella Spp. have been isolated from animals faeces including canine faeces. Invertebrates such as slugs and snails play an important role
in the food chain and can act as agricultural pests. (Emma et al, 2006 )observed that the Great Gray Slug, Limax maximus and the Yellow Slug, Limax flavus can carry E. coli O157 from animals manure on their bodies surface and internally as intermediate hosts vectors. Recycling is a sustainable
strategy for disposing of animals waste, and composting can be an important part of a recycling programme. The microorganisms involved oxidize carbon as an energy source for growth and ingest nitrogen for protein synthesis (Taylor 2004). Consequently, the right carbon to nitrogen ratio in composting
systems is required for efficient decomposition of wet dog manure contains 0.7% nitrogen (N),and 0.25% phosphate (P2O4) (compared to wet cattle manure, dog waste which contains 40% more nitrogen, the same amount of phosphate (Hall and Schulte 1979). Insects such as Black soldier fly larvae
have been used in bioremediation to breakdown and recycle animals faeces which lead to a reduction in bacterial number in animal’s faeces in may be used for biodiesel production and animal food-stock. This study aims to investigate the problems resulting from dog faeces accumulation in the
environment and to find scientific solutions for utilizing and converting dogs waste to a safer material which should be more compatible with environmental aspects,
Figure 5. PCR-18Sr RNA, amplification products of fungal
species detecting fungi test analyzed by electrophoresis in
agarose gel lanes represent; ( lane L); hyper ladder; (lane K5
and K6 ) dog faeces samples.
(b)(a)
Bacterial
strain
Colonies colour
on media
(Chromoagar)
Presence of bacterial species in different Samples
Dogs faeces
Slugs Lettuce
Contr
olFed on faeces
Control Contaminated
In Ex In Ex
Enterococcus spp Blue Turquoise + + + + + + +
Enterobacter amnigenus Metallic blue - - + - - - -
Staphylococcus letus Metallic blue + - - + - - +
Acinetobacter sp Beige + - - + + - -
Comamonas sp Blue - - - - + - -
Delftia sp Beige + - - + - +
Proteus spBeige with brown
Halo + - - + - - -
E. coli Pink-red + - - + - - +
Salmonella sp Cream + + - - +
Samples Symbol Reaction
Earth worm (Whole body) RM1 Positive
Dog faeces
Contaminated lettuce
SR1
SR2
Positive
Positive
Control lettuce SR3 Negative
Outside control slug AZ1 Negative
Outside contaminated slug AZ2 Positive
Outside control snails AZ3 Negative
Outside contaminated snails AZ4 Negative
Inside control slugs AZ5 Positive
Inside contaminated slugs AZ6 Positive
inside control snails AZ7 Negative
Inside contaminated snails AZ8 Positive
S/No S/ source Species S %
JS1
JS2
JS3
JS4
JS5
MR1
MR2
MR3
Outside control slugs (M.B)
Inside slugs fed on faeces (B)
Outside slugs fed on faeces (B)
Outside slugs fed on faeces (C)
Contaminated salad (B)
Inside slugs fed on faeces (MB)
Inside slugs fed on faeces (C)
Contaminated salad ( P.R)
Enterobactr amnigenus
Acinetobacter sp
Comamonas sp
Acinetobacter sp
Delftia sp
Staphylococcus lentus
Salmonella sp
E. coli
99%
99%
91%
100%
99%
100%
99%
100%
Figure 3. PCR amplification products of bacterial
species detecting bacteria test analyzed by
electrophoresis in agarose gel lanes represent; (
lane L); hyper ladder;(lane MR1) Inside slugs fed
on faeces (MB); (lane MR 2) Inside slugs fed on
faeces (C); (lane MR3) Contaminated salad
.
Figure 4. Polymerase chain reaction (PCR) detection of
Mycoplasma species in Dog faeces and lettuce samples, EZ-
PCR- detecting Mycoplasma test analyzed by electrophoresis in
2% agarose gel; the lanes represent ( lane L); 1kb hyper ladder,
( lane AZ 2); contaminated slugs (lane AZ 3); control slugs(lane
(lane AZ 4) contaminated lettuce; (lane AZ 5); control lettuce
Figure 2. PCR amplification products of four bacterial
species analyzed by electrophoresis in agarose gel lanes
represent; ( lane L); hyper ladder;(lane JS1) outside control
slugs (MB); (lane JS 2) Inside slugs fed on faeces (B); (lane
JS3) outside slugs fed on faeces( B); (lane JS 4) outside
slugs fed on faeces (C); (lane 5) Contaminated salad
Time(week)
week 0 week 1 week 2 week 3 week 4
lipid
s m
l/ ig
0.00
0.05
0.10
0.15
0.20
0.25
0.30
M Dog+ BSFL
M DOG+ FBL
M BSFL
M FBL
I thank my supervisor Prof. M. Wainwright for the
valuable guidance and advice . I also thank my advisors
Dr. D. J. Gilmour and Dr L. Partridge for their assistance.
I am grateful to Mr S. J. Thorpe from chemistry dept forhis help in GC/MS. and Mr C.J. Hill in SEM/TEM.
Figure1:A)Bacteria isolated from dog faeces grown on Chromagar medium .1. S. letus;
2. Enterococcus spp; 3. Proteus sp; 4.S. entreica; 5. E. coli; 6. Delftia sp; 7.
Acinetobacter sp. B) Bacteria grown on Petri-dish isolated from slugs gut following; 1.
S. letus; 2. S. enterica 3. Enterococcus spp; 4. E. coli; 5. Proteus sp; 6. Delftia sp. C)
E. coli and D) S. enterica are bacteria grown on selective media isolated from public
park and E ) Aspergillus niger and A, flavus
2 17
53
64
A C
D
B E
1
2
3
4
56
The results (Figure 1.A) show seven differently coloured bacterial
colonies which were isolated from dog faeces grown on
CHROMagar media. Six of them were transmitted to the inside (gut)
of slugs fed on dog faeces (Figure 1.B); as well, Staphylococcus
lentus grow in the slime on the surface of slugs. However, in the
contaminated lettuce samples, four colonies, different from
Enterococci, were isolated. The colonies were initially identified
using colour reference as. S. lentus, Delftia sp, E. coli and S.
enterica in addition to Enterococci spp which were isolated
everywhere (Table. 1)
Further identification of bacterial species using 16S rRNA procedure
has been investigated. The isolations JS1, JS2, JS3 , JS4 and JS5
(Table. 2) were subjected to the extraction of genomic DNA (Figure
3.4) which were isolated from; outside control slugs (Metallic blue),
Inside slugs fed on faeces (Beige), outside slugs fed on faeces
(Beige), outside slugs fed on faeces( Cream) and contaminated
salad(Beige) respectively. In addition to three isolations MR1, MR2
and MR3 (Table. 2) which were isolated from the Inside of slugs
Table 3. The presence of Mycoplasma in various samples
JS1 JS2 JS3 JS4 JS5 L
L MR
1
MR
2
MR
3
Table 2. Bacterial identification using gDNA-16SrRNA
3. Summary of the caninewaste accumulation Problems
Dog faeces can carry7 species of bacteria,mycoplasma andpathogenic fungi
contaminated Slugsand snails can carry6 species of bacteriaand mycoplasma
5 species of bacteriaand mycoplasmacan be transmittedto lettuce by slugs
Insert BSF and FB Larvaeas a solution suggestedfor bioremediation ofdog faeces
Total bacterial count
Time( days)
0 time 7 days 14 days 21 days 28 days
Bacte
ria ( l
og10
CFU
/ g)
1e+2
1e+3
1e+4
1e+5
1e+6
1e+7
1e+8
1e+9
1e+10
Treatment dog faeces with BSFL on E. coli media
Control dog faeces with out BSFL on E. coli media
Treatment dog faeceswith BSFL on Salmonlla media
Control dog faeces without BSFL on Salmonella media
Treatment dog faeces with BSFL on Agar count media
Control dog faeces without BSFL on Agar count m
Total bacterial count
Time ( days )
0 time 7 days 14 days 21 days 28 days
Bacte
ria (
log10
CFU
/ g)
1e+3
1e+4
1e+5
1e+6
1e+7
1e+8
1e+9
1e+10
Treatment dog faeces with FBL on E. coli media
Control dog faeces without FBL on E.coli media
Treatment dog faeces with FBL on Salmonella media
Control dog faeces without FBL with on Salmonella media
Treatment dog faeces with FBL on agar count media
Control dog faeces without FBL on agar count media
Figure 6. Influence of BSFL on
bacterial activity on dog faeces.
Total bacterial count
Time(days)
day 0 day 7 day 14 day 21 day 28
Bacte
ria (l
og10
CFU/
g)
1e+1
1e+2
1e+3
1e+4
1e+5
1e+6
1e+7
Control BSFL gut without dog faeces on E. coli media
Treatment BSFL gut with dog faeces on E. coli media
Control BSFL gut without dog faeces on Salmonella media
Treatment BSFL gut with dog faeces on Salmonella media
Control BSFL gut without dog faeces on agar count media
Treatment BSFL gut with dog faeces on agar count media
Total bacterial count
Time (days)
0 time 7 days 14 days 21 days 28 days
Bacte
ria (lo
g10 C
FU/ lo
g)
1e+1
1e+2
1e+3
1e+4
1e+5
1e+6
1e+7
Control FBL gut without dog faeces on E. coli media
Treatment FBL gut with dog faeces on E. coli media
Control FBL gut without dog faeces on Salomnella media
Treatment FBL gut with dog faeces on Salmonella media
Control FBL gut without dog faeces on agar count media
Treatment FBL gut with dog faeces on agar count media
Figure 8. The Influence of BSFL gut on
bacterial in dogsfaeces
Figure 9. The Influence of BFBL gut on
bacterial in dogs faeces
Figure 7. Influence of FBL on
bacterial activity on dog faeces.
K5
K6
L
Table 1. Different colours of bacteria species grown on CHROMagar medium
Figure 10. The final compound of
untreated dog faeces after 28 days
Figure 11. The final compound of treatment dog faces
a) treated with FBL; b) treated with BSFL after 28 days
Figure12. Illustrates; a) the lettuce seeds planted in
different concentration of treated dog faeces with BSFL
No; 1, control dog faeces 2, 3 and 4 are 75, 50 and 25%
of dog faeces concentration and 5 is a control compost.
From 6 to 10 are the turnip seeds planted at the same
concentration b) the lettuce seeds planted in different
concentration of treated dog faeces with FBL No; 1,
control dog faeces 2, 3 and 4 were 75, 50 and 25% of
dog faeces and 5 is a control compost. From 6 to 10 are
the turnip seeds planted at the same concentration
The results of this study show out that seven species of bacteria were
found in dogs’ faeces. Six out these seven species were confirmed for
being carried by slugs and snails, when obligatory fed on dog’s
faeces. Slugs transmitted four bacterial species i.e.: E.coli sp,
Salmonella enterica, Staphylococcus lentus and Delftia sp to fresh
lettuce. Our study suggests a range of different solutions to convert
the dog faeces from a poisonous substance to a less offensive
material using insect larvae. Bioremediation of dog faeces was
successful in converting dog waste to modified compost for
agricultural purpose. Lipids of poetical use as befouls were also
extracted from dog faeces treated with larvae.
AA
A
B
ba ed
i
c
hgf j
8
54321
6 7 9 10
1 5432
6 7 8 9 10
a b
Figure 13. The effect of hemolymph and whole body secretions of BSF and FB Larvae
on the morphological of MRSA,(a-e), E. coli (f-j), Internal morphology different bacterial
species(k-o). Z and y the effect the secretion of larvae on E. coli and MRSA growth
Figure 14. The amount of lipids in dry weight
of 1g of dog faeces and BSF and FB larvae
Emma, L. S., M. Macrae., I. D. Ogden., M. J. Wilson and N. J.
C. Strachan1 (2006). Slugs: Potential Novel Vectors of
Escherichia coli O157. Applied and Environmental
Microbiology. 72: 144–149
Hall, RE., Schulte, E.F. (1979). Using dog and cat manure
onhome gardens. University of Wisconsin, Madison, College of
Agriculture and Life Sciences.
Taylor, L. (2004). Poop, Scoop and Compost: Proposal to
Explore the Feasibility of Composting Dog Waste in Public
Parks. Vancouver, Canada: National Coalition for People and
Dogs, Handout, pgs. 1-7
, 16-Mar-2012 + 22:25:01Sample A1 (chloroform)
4.02 6.02 8.02 10.02 12.02 14.02 16.02 18.02 20.02 22.02 24.02 26.02 28.02Time0
100
%
11wainwright01 Scan EI+ TIC
1.85e718.10
20.04
19.84
19.80
21.42
23.83 25.79
C16 : 1
(mainlib) Tetradecanoic acid
60 80 100 120 140 160 180 200 220 2400
50
100
55
60
69
73
8397 115
129
138
143157
171
185
199211
228
OH
O
15. Use the GC/MS to identify the extracted fatty
acids from dog's faeces, BSF and FB Larvae
, 16-Mar-2012 + 22:25:01Sample A1 (chloroform)
0
100
%
13 33 53 73 93 113 133 153 173 193 213 233 253 273 293 313 333 353 373 393 413m/z0
100
%
6057
54
73
6961 1298374
8597 115111
125 256213157143 171 185 199 227
11wainwright01 1 (18.100) 1.16e6
605743
41
45
73
7161 129
8374 9787
115101125
213157143130 171 185 199256
227
Hit 1R:796 Nist 198159: N-HEXADECANOIC ACID
M.W
L
AZ
2
AZ
3
AZ
4
AZ
5
l k m o
Bacterial number
time(h)
0 time 2.0 h 4.0 h 6.0 h 8.0 h
Bacte
ria (
log10
CFU
/ ml)
1e+7
1e+8
1e+9
1e+10
1e+11
1e+12
1e+13
1e+14
1e+15
Control MRSA
FBL Lymph secretion with MRSA
FBL Whole secretion with MRSA
Bacterial total count
Time(h)
0 time 2 h 4 h 6 h 8 h
Bact
eria
(log
10 C
FU/ m
l)
1e+7
1e+8
1e+9
1e+10
1e+11
1e+12
1e+13
1e+14
1e+15
1e+16
Control E. coli
Lymph secretion of BSFL+ E.coli
Whole secretion of BSFL + E. coliz y
Poster Presentation Relating to Some of the Work Described in this Thesis
222