Embed Size (px)
Citation preview

1
An Equipment Selection Methodology for Continuous Manufacturing of Small-Molecule Drugs by
Kevin Peng B.S. Chemical Engineering Cornell University, 2009
Submitted to the MIT Sloan School of Management and the
Department of Chemical Engineering in Partial Fulfillment of the Requirements for the Degrees of
Master of Business Administration
and Master of Science in Chemical Engineering
In conjunction with the Leaders for Global Operations Program at the
Massachusetts Institute of Technology
June 2017
© Massachusetts Institute of Technology. All rights reserved. The author hereby grants to MIT permission to reproduce and to distribute publicly paper and electronic copies of this thesis document in whole or in part in any medium now known or hereafter created. Signature of Author __________________________________________________________________________
MIT Sloan School of Management, Department of Chemical Engineering May 12, 2017
Certified by __________________________________________________________________________
Richard D. Braatz, Thesis Supervisor Edwin R. Gilliland Professor of Chemical Engineering
Certified by __________________________________________________________________________
Roy E. Welsch, Thesis Supervisor Eastman Kodak Leaders for Global Operations Professor of Management
Accepted by __________________________________________________________________________
Maura Herson, Director of MIT Sloan MBA Program MIT Sloan School of Management
Accepted by __________________________________________________________________________
Daniel Blankschtein, Herman P. Meissner Professor of Chemical Engineering, Graduate Officer Department of Chemical Engineering

2
This page has been intentionally left blank.
3
An Equipment Selection Methodology for Continuous Manufacturing of Small-Molecule Drugs by
Kevin Peng
Submitted to the MIT Sloan School of Management and the Department of Chemical Engineering on May 12, 2017, in Partial Fulfillment of the Requirements for the Degrees of
Master of Business Administration and Master of Science in Chemical Engineering
Abstract
Flexible, modular, continuous manufacturing small-scale plants (MCSPs) for small-molecule drugs have been recognized as potential safe and economical solutions for pharmaceutical manufacturing. However, among the variety of equipment technologies required for an MCSP platform, there are only a few technologies that have publicly available methodologies for equipment selection. In this study, a new method and tool for computer-assisted equipment selection was developed, which use key engineering correlations and design criteria to match off-the-shelf equipment with the synthesis processes of interest. Furthermore, the tool allows simultaneous equipment selection for multiple synthesis processes to allow the identification of the most flexible MCSP assets. The long-term goal of this tool is to encompass the entire span of technologies that could be used in an MCSP skid and to serve as a communal storage location for vendor-available equipment information to facilitate collaboration and design of a mainstream continuous manufacturing (CM) system. This methodology was applied to equipment selection for the continuous manufacturing of an actual Amgen small-molecule drug substance (API) as a case study. The results from this study showed that the new tool can improve the speed at which equipment is selected and can aid the process developer in decision-making for choosing the most suitable CM asset. Thesis Supervisor: Richard D. Braatz Edwin R. Gilliland Professor of Chemical Engineering Department of Chemical Engineering Thesis Supervisor: Roy E. Welsch Eastman Kodak Leaders for Global Operations Professor of Management MIT Sloan School of Management

4
This page has been intentionally left blank.

5
Acknowledgements
To my academic advisors, Professors Richard D. Braatz and Roy E. Welsch, thank you for your guidance and contributions to this work. To my industry advisor, Dr. Roger Hart, and colleagues at Amgen, thank you for your mentorship, enthusiasm, and efforts to ensure that the research and internship was a high priority and a success. To the Leaders for Global Operations (LGO) Program and Professor Richard D. Braatz, thank you for granting me this opportunity for professional and personal growth at MIT. To my professors, classmates, and roommates at MIT, thank you for providing such a rich and diverse learning environment. To my parents, my brother and his wife, my uncle, my aunt, my grandmother, and my in-laws, thank you for your endless encouragement and motivation. To our new baby Charlotte, for bringing so much joy to us during our time at MIT. Most importantly, to my wife, thank you for your unconditional support and patience.

6
This page has been intentionally left blank.

7
Parameter Legend
Variable Description[ain] molarconcentrationofProduct‘a’enteringvessel
[aout] molarconcentrationofProduct‘a’exitingvessel
Ac cross-sectionalarea
Afilter filtrationcross-sectionalareaAs heattransfersurfacearea
cp averagespecificheatcapacity(constantpressure)
D innerdiameterofaplug-flowreactor(PFR)
d32 Sautermeandiameter
DH hydraulicdiameter
Dimp impellerdiameter
dp diameterofsphericalparticles
dxw heattransferwallthickness
E piperoughness
forfD Darcyfrictionfactor
GC geometricalcorrectiong gravitationalaccelerationconstanth convectiveheattransfercoefficient
Hcake filtercakeheight
Hliquid heightofliquid
k genericconstantforanygivencorrelationorequation
kh thermalconductivity
KH proportionalityvolumeoffiltercake/volumeoffiltrate
Kp powernumber(fromtheliterature)
kr,a(Trxn) reactionconstantforProduct'a'asafunctionofrxntemperatureL lengthofPFRLC sizeofacrystalm overallreactionorderMW molecularweightN impellerrotationalspeednc populationdensityofcrystals(#ofcrystalsofaunitsizeperunitvolume)NC numberofcrystalsperunitvolumeofaparticularsizerange
NJD just-dispersedimpellerspeed
NJS just-suspendedimpellerspeedP pressureQ totalvolumetricflowrate

8
Parameter Legend (Continued)
q0 heatflux
Ra molarrateofformationofProduct'a'
Re Reynold'snumber(pipe)
Rm specificresistanceoffiltermedia
S geometricalconstantt timeU overallheattransfercoefficientV reactorVolumex characteristiclengthY massratioofsolidtoliquidz axialposition
αH specificresistanceoffiltercakerelativetocakethickness
β thermalexpansioncoefficientγ shearrate
ΔHR molarheatofreactionforalloccurringreactions
Δp pressuredropΔTad adiabaticchangeintemperature
ΔTHTF log-meanchangeintemperatureforreactorheattransferfluid
Δρ differencebetweentwoimmiscibleliquidsorbetweensolidandliquidϵ energydissipationε ratioofvoidvolumetototalvolumeinafiltercakeorpackedbed
θ95 blendtimerequiredfor95%homogeneity
φ dispersedphaseliquidvolumetricfractionμc fluidviscosityofcontinuousphase
μd fluidviscosityofdispersedphase
μ fluid'sbulkviscosityν meankinematicviscosityρ averagefluiddensity
ρc fluiddensityofcontinuousphase
ρd fluiddensityofdispersedphase
ρs soliddensity
τ meanresidencetime(volume/meanvelocity)inPFRυ meanvelocitythroughPFR

9
Table of Contents
Abstract ........................................................................................................................................... 3Acknowledgements ......................................................................................................................... 5Parameter Legend ........................................................................................................................... 7Parameter Legend (Continued) ....................................................................................................... 8Table of Contents ............................................................................................................................ 9Chapter 1: Introduction ................................................................................................................. 11
1.1 Current Status of Continuous Manufacturing ..................................................................... 111.2 Project Drivers: Needs for Novel Equipment Selection Strategies .................................... 121.3 Problem Statement .............................................................................................................. 151.4 Amgen, Inc. ......................................................................................................................... 161.5 Project Focus ....................................................................................................................... 201.6 Project Goals ....................................................................................................................... 211.7 Thesis Overview ................................................................................................................. 21
Chapter 2: Pharmaceutical Manufacturing: Overview ................................................................. 222.1 Manufacturing Process Overview ....................................................................................... 222.2 Conventional (Batch) Manufacturing of Drug Substances ................................................. 232.3 Continuous Manufacturing of Drug Substances ................................................................. 232.4 CM of Drug Substance: Equipment Technology Overview ............................................... 25
Chapter 3: Hypothesis ................................................................................................................... 29Chapter 4: Problem Analysis ........................................................................................................ 29
4.1 State of the CM Equipment Selection Process prior to Project Implementation ................ 304.2 Improvements to the Current Equipment Selection Process ............................................... 31
Chapter 5: Redesign of the Equipment Selection Process ............................................................ 325.1 Overview of Software Tool Design .................................................................................... 325.2 Equipment Selection: General Design Requirements ......................................................... 345.3 Equipment Selection: CSTR-specific Design Requirements .............................................. 365.4 Equipment Selection: PFR-specific Design Requirements ................................................. 485.5 Equipment Selection: Packed Bed Reactor-specific Design Criteria ................................. 525.6. Equipment Selection: Mixed-Suspension Mixed-Product Removal Crystallizers ............ 565.7. Equipment Selection: Motionless Mixer-specific Design Criteria .................................... 585.8 Equipment Selection for Multiple Processes ...................................................................... 595.9 Equipment Selection: Other Equipment Information ......................................................... 605.10 Equipment Selection: Feature-based Analysis .................................................................. 60
Chapter 6: Case Study Analysis .................................................................................................... 616.1 Case Study Methodology .................................................................................................... 616.2 Results: New Tool vs. Original Equipment Selection Process ........................................... 62
Chapter 7: Conclusions ................................................................................................................. 657.1 Tool Performance ................................................................................................................ 65
10
7.2 Future Studies and Endeavors ............................................................................................. 667.3 Recommendations ............................................................................................................... 677.4 Summary ............................................................................................................................. 69
Appendix ....................................................................................................................................... 70A.1: Summary of CSTR Selection Inputs and Calculations ..................................................... 70A.2: Summary of PFR Selection Inputs and Calculations ........................................................ 74A.3: Summary of PBR Selection Inputs and Calculations ....................................................... 78A.4: Summary of MSMPR Selection Inputs and Calculations ................................................. 81A.5: Summary of Motionless Mixer Selection Inputs and Calculations .................................. 85
Bibliography ................................................................................................................................. 87

11
Chapter 1: Introduction
1.1 Current Status of Continuous Manufacturing
Pharmaceutical companies have traditionally used batch manufacturing processes for drug
production since the industry’s inception. Batch manufacturing processes have associated
inefficiencies, which are estimated to cost the industry $50 billion annually [14]. In response,
pharmaceutical companies are developing continuous manufacturing (CM) processes for
synthesizing small-molecule drugs to reduce their manufacturing footprint, improve safety, and
adopt more efficient chemistries that are not cost effective or safe to use in batch processes [5].
Since 2015, significant progress has been made by both regulatory agencies and pharmaceutical
companies in implementing continuous manufacturing (CM) processes for the development and
commercial production of pharmaceutical drugs [10]. For example, in 2015 the FDA published
its draft guidance for the advancement of emerging technologies to encourage the modernization
of pharmaceutical manufacturing through technologies such as CM [11], and large
pharmaceutical companies such has Eli Lilly, Janssen, Novartis, and Vertex Pharmaceuticals
have all developed commercial-size continuous processes for drug substance and/or drug product
production.
Although there is increasing use of commercial CM facilities, these facilities have been costly,
due to heavy customization and the limitation of only producing one drug substance or one drug
product per facility. To reduce the costs associated with customized CM facilities and redundant
setups, modular continuous manufacturing platforms for small-molecule drugs (MCSPs) using
off-the-shelf equipment are being developed in both academia and industry as a potential

12
solution. In industry, initiatives such as the European FP7 Research Project are trying to
introduce flexibility and modularization to continuous manufacturing with the goal of identifying
a “fast, flexible, future” (“F3”) factory [3]. In academia, the MIT “Pharmacy on Demand”
project, funded by DARPA, investigates the possibility of producing over 16 drug substances
using one CM setup [12]. Though significant progress has been made for CM advancement to
become mainstream, there are still very few, if any, commercial-sized MCSP platforms for
manufacturing multiple drug substances and products.
1.2 Project Drivers: Needs for Novel Equipment Selection Strategies
While there is interest for MCSPs, a major challenge for designing these platforms is equipment
selection. Figure 1 depicts the major elements of the product lifecycle for the pharmaceutical
industry. Among these four general phases in the life cycle, the two steps in which equipment
selection is most important are: process development and commercial production of the drug
substance and product.
Figure 1: Pharmaceutical Product Lifecycle
For equipment selection, there are two important steps: (1) the selection of equipment technology
and (2) the selection of the actual make and model of the equipment. The selection of the proper
equipment technology is essential in the process development step in the drug development
lifecycle, because the technology is typically kept the same from lab to commercial production, it
is only scaled up with each step [15]. The selection of the right makes and models is essential
R&D(MoleculeDiscovery)
PD(Process
DevelopmentandCharacterization)
Manufacturing(CommercialProduction)
MarketingandSales

13
for process development so that the assets can provide the right chemical reactions, facilitate data
collection, and can be reused as a manufacturing platform for various synthesis steps and drug
types.
For commercial production, specific equipment selection is critical to ensure the satisfaction of
market demand, process efficiency, safety, and reliability.
In 2013, Commenge et al. [7] introduced a fast and effective method that covers the first step of
equipment selection – determining the most suitable equipment technologies based on specific
process chemistries and process limitations. Although their method filters for the appropriate
types of equipment, their method does not include the selection of real, usable equipment makes
and models for a specific synthesis process (Fig. 2).
In 2014, Krasberg et al. [6] proposed a computer-assisted method to cover the second step of
identifying appropriate off-the-shelf Plug Flow Reactors (PFRs) for a process based on: (1) a set
quantitative process inputs that characterizes the specific synthesis chemistry, (2) the production
scale, and (3) a set of quantitative selection criteria based on first principles of reaction. While
the method is rigorous and effective for determining the correct PFR model for a continuous
manufacturing process, there has been no follow-up to expand this approach for selecting makes
and models for other types of equipment technologies that are critical to drug production, such as
continuous stirred tank reactors (CSTRs), static mixers, mixed suspension, and mixed product
crystallizers (MSMPRs). Figure 2 highlights the need for additional identification methods for
specific, usable equipment models.

14
Figure 2: Equipment Selection Process Reveals Need for Make and Model Identification
Moreover, neither of the proposed equipment selection methods suggest a way to choose
equipment simultaneously for multiple synthesis processes. Thus, the development of a
standardized manufacturing platform (MSCP) can be time-consuming, inefficient, and iterative.
From a process development perspective, choosing equipment for each individual process can
also be costly because it can lead to the purchase of equipment assets that are redundant or rarely
reused.
The business driver for faster process development and faster CM equipment selection is clear.
In addition to reducing the $50 billion annual waste associated with batch manufacturing, CM
equipment platforms need to be developed as efficiently as possible because the economics
behind drug development provide strong incentive for speed and efficiency. Research indicates
that first-to-market drugs with over $100M annual sales have an average of 6% greater market
share than its competitors [1], which is a primary incentive for pharmaceutical companies to
accelerate all aspects of the drug development process for each of their pipeline drugs.
ProposedSynthesis
ProcessLimitIdentification
OperationandIntensification
StrategyFormulation
EquipmentTechnologyIdentification
EquipmentMakeandModel
Identification(?)
CoveredbyCommengeetal.[7]
OnlyPFRscoveredbyKrasbergetal.
[6]

15
Furthermore, studies have shown that annual expenditures for Phase I, II, and III clinical trials
cost $17M, $34M, and $27M per year of trial, respectively [2]. These numbers imply that there
are significant cost savings if scientists can choose equipment for manufacturing its drug
substances more quickly.
1.3 Problem Statement
While Commenge et al. [7] has introduced a well-developed process for identifying the correct
equipment technologies, there is clearly a business need to develop a tool that makes the
selection of makes and models of equipment more efficient. One approach is to build on
Krasberg’s research [6] for selecting makes and models for other equipment technologies, in
addition to PFRs. Expanding on the Krasberg research would allow specific equipment to be
selected for an entire continuous manufacturing process. Furthermore, there needs to be a
method to more-easily identify flexible CM equipment assets that can be reused for multiple
syntheses in both a process development setting and a commercial CM setting so that
manufacturing platforms can be easily developed.
Concisely, the industry needs an equipment selection tool for essential equipment
technologies that (1) chooses equipment based on first-principles design criteria and key
process inputs [6] and (2) allows the identification of the equipment models that are
appropriate for a portfolio of drug syntheses.

16
1.4 Amgen, Inc.
1.4.1 Manufacturing Strategy
As publicly stated in Amgen’s R&D Strategy,1 Amgen is a modality-independent company “with
a focus on biologics while ensuring world-class small-molecule capabilities.” Amgen’s small-
molecule products include Corlanor®, Sensipar®, and Kyprolis® with six additional small-
molecule candidates across all phases of its pipeline.2 Furthermore, since its acquisition of Onyx
Pharmaceuticals in 2013, Amgen has plans to build a facility in Singapore for commercial
manufacturing of the drug substance for Kyprolis® [13].
As a strategy to maintain “world-class small-molecule capabilities” and strength in
manufacturing, Amgen has released plans to pursue technology to support Manufacturing of the
Future (MoF) using standardized, modular, flexible manufacturing facilities with the goals of
reducing costs associated with waste and facility footprint.3
In other words, Amgen’s manufacturing goals are consistent with those in the industry,
regulatory agencies, and academia. Thus, Amgen also has a vested interest in the advancement
of MCSPs and a continuous manufacturing platform that can be used to synthesize their portfolio
of small-molecule drugs.
1. As of 9/16/16 (www.amgen.com/science/research-and-development-strategy/) 2. As of 9/16/16 (www.amgenpipeline.com) 3. Amgen Transforming Biotech Manufacturing Infographic, October 11, 2015

17
1.4.2 Stakeholder Analysis: The Value of the MIT LGO Partnership
Clearly, a selection tool for identifying production equipment aligns with Amgen’s strategy to
develop a continuous manufacturing platform. While this project is a high priority, significant
resources are required including: (1) expertise in continuous manufacturing technology, (2)
expertise in integrating new tools into business processes, and (3) a project manager to combine
the contributions from all stakeholders and ensure timely progress.
While Amgen has significant internal capabilities to develop this tool, the project benefits greatly
from external collaborations, such as with faculty at MIT who can provide additional
perspectives and information on CM technology, selection strategy, and integration of the tool
into the Process Development workflow. The stakeholder analysis (Figure 3) indicates that an
MIT Leaders for Global Operations (LGO) Research Internship is ideal for combining the
technological and process expertise of Amgen and MIT.
More specifically, the LGO Intern can frequently interact with its Group 1, 2, and 3 stakeholders
(Figure 3) to develop a tool that will be value-adding and frequently used and updated. Group 1
stakeholders are Amgen’s internal customers from the Process Development organization. These
stakeholders will be the primary users of the tool but are also the technology experts for CM at
Amgen that can provide detailed feedback on how to abstract the information that they need into
a software tool. Feedback from these users will be critical to ensure that the software developed
will include the necessary features and be used in the long term. Group 2 stakeholders include
the vast LGO Alumni network at Amgen and the LGO Program leaders at Amgen who have a
vested interest in the success of the intern (and thus, the Amgen-LGO partnership) and can also

18
provide expertise in implementation of the new tool and integrating it with existing practices.
Group 3 stakeholders include the MIT Faculty advisors who can provide the intern with deep
technical expertise and general guidance to ensure that the Intern provides a tool that covers the
most relevant equipment technologies in enough technical depth and includes the most recent
information in the field of continuous manufacturing. Finally, the LGO Intern can also serve as a
project manager to ensure that the deliverables are completed efficiently and on-schedule.
The direct link to all of these stakeholders makes the MIT LGO Internship an ideal program for
developing and implementing this project, because Amgen is provided with an Intern that is low
cost; versatily trained in project management, engineering, and implementation; and has a vast
network of experts that can contribute significantly to developing an industry-leading equipment
selection tool.

19
Figure 3: Project Stakeholder Analysis
Group1Stakeholders
CoreTechnicalTeam
Group2Stakeholders
Group3Stakeholders
1.ProjectSupervisor
MITLGOIntern
2.ProjectChampion
3.SimulationEngineer
7.ProjectControlsDirector
4.CMProcessChemists
10.AmgenLGOAlumni
8.SeniorScientists
9.LGOSponsors&
ProgramLeader
5.PDEngineers
6.PDManager
11&12.MIT
Faculty

20
1.5 Project Focus
More specifically, the Amgen organization that is sponsoring this study (Pivotal Drug Substance
Process Development) has envisioned an equipment selection tool to aid their group in the
identification of low-cost, flexible off-the-shelf CM equipment to be used for a continuous
manufacturing platform for drug substance production. This project will focus on developing a
new methodology for equipment make and model selection for the continuous manufacturing of
drug substances; however, the equipment selection approach shall be designed in a general
manner so that its use can be expanded to other steps in the drug manufacturing process (e.g.,
drug product and batch production processes).
This study builds on the Krasberg method [6] that uses five quantitative selection criteria to
determine the appropriate equipment makes for a given process. Given the six-month time
constraint, this project will only focus on applying four out of the five proposed selection steps to
other equipment technologies. These four selection criteria (e.g., operating temperature, mixing
and pressure drop criteria) are based on design parameters and the overall steady-state material
and energy balance equations around the entire reactor. This study does not incorporate the fifth
criterion presented in the paper [6], which requires numerical methods to solve differential
energy balance equations to determine potential formations of local reactor hot spots.
Furthermore, the development of the equipment selection tool will be limited to the most
commonly used reactor, mixer, and crystallizer technologies for drug substance manufacturing –
specifically: (1) plug flow and microchannel reactors, (2) continuous stirred tank reactors, (3)
packed bed reactors, (4) static mixers, and (5) mixed-product, mixed-suspension crystallizers. An

21
overview describing each equipment technology is presented in Chapter 2.
Future studies on CM equipment selection are expected to build on the methodology introduced
in this thesis and be applied to other essential CM equipment technologies, such as continuous
filtration, pumps, distillation equipment, liquid-liquid extraction equipment, and drug product
manufacturing equipment.
1.6 Project Goals
The tool resulting from this research is also applied as a proof-of-concept to identify usable
equipment for three experimental continuous synthesis steps for an actual drug substance that is
in Amgen’s pipeline. The array of equipment identified by the tool for each synthesis step is
then compared with the set of equipment that was chosen by Amgen scientists for the same
syntheses, using their current equipment selection approach.
The general approach for equipment identification using this tool is also compared with the
equipment selection approach that Amgen scientists currently use. Any relative advantages and
disadvantages using the new method are noted.
1.7 Thesis Overview
Chapter 2 is an overview of the drug manufacturing process, including a high-level qualitative
description of the equipment technologies
Chapter 3 provides a hypothesis for the study.
Chapter 4 provides the data collection methodology and analysis to understand the state of

22
equipment selection prior to this research.
Chapter 5 is a detailed discussion of the approach for improving upon the current methods used
for equipment selection, including a design of a new computer-assisted equipment selection tool.
Chapter 6 is a discussion of the results and analysis of a case study conducted at Amgen, where
the new tool is applied to select equipment for the CM of an actual pipeline drug.
Chapter 7 provides detailed recommendations based on the aforementioned analysis and a
discussion of how to integrate the tool into the current process development work flow and the
potential for long term and future applications of the new tool.
Chapter 2: Pharmaceutical Manufacturing: Overview
2.1 Manufacturing Process Overview
Pharmaceutical manufacturing can be separated into two general categories. The “upstream”
side of manufacturing is the production of the drug substance or the active pharmaceutical
ingredient (API). The “downstream” side is the manufacturing of the drug product or the final
formulation of the drug that is administered in patients. The drug product contains both the API
and excipients, which are chemicals that serve various purposes including stabilization and
bulking up the formulation.
From a manufacturing perspective, small-molecule drugs, aka synthetics, differ from large-
molecule drugs, aka biologics, in the sense that synthetic drug substances are typically produced
via traditional organic chemistry reactions, while biologic drug substances are typically proteins
produced in bioprocesses, where cellular organisms produce and secrete the drug substance.
23
2.2 Conventional (Batch) Manufacturing of Drug Substances
Traditionally, both biologics and synthetics have been produced in batch processes, where raw
materials are charged into a closed system and processed completely before the proceeding to the
next batch step. In other words, batch manufacturing is comprised of sequential, time-dependent
processing steps that transform raw materials into a final drug product.
Drug substance batch manufacturing steps typically involve a (1) chemical reaction to synthesize
the API, (2) a step to crystallize the API out of solution, and (3) a method to filter out the
solution and retain the dry solid form of the drug substance [8]. Each step is completed before
proceeding to the next step. In addition to storage vessels, typical batch manufacturing facilities
include one or two stirred vessels for chemical reaction and crystallization processes and a filter
dryer vessel to isolate the drug substance solids. Often, the same stirred vessel can be used for
the reaction and crystallization steps.
Advantages to batch manufacturing are that the equipment technology is well-established and
that the vessels can be easily scaled up or become modular and reused for various operations [9].
Drawbacks are that the batch handling between steps and the cycle time for each batch are often
significant and can require larger batch sizes and the need for larger equipment and facility
footprint. In addition to the associated costs with larger manufacturing systems, a large batch
size can also dissuade process developers from pursuing highly exothermic chemistries for safety
reasons, even if they are the most efficient option [5,8].
2.3 Continuous Manufacturing of Drug Substances
Continuous manufacturing processes are similar to batch processes in the sense that their

24
equipment performs similar unit operations (e.g., mixing, reaction, crystallization, filtration, and
drying), but differ from batch processes because, after initial startup, all continuous processes are
operating simultaneously, and material continuously flows from one step to the next. In the
context of drug substance manufacturing, in a fully continuous process, the reaction,
crystallization, and filtration steps are all operating at the same time, and the reactants, products,
solvents, and other materials are all continuously flowing through from one step to another. In
other words, raw materials are continuously consumed, while drug substance is continuously
produced [9]. After an initial startup, all of the above-listed CM operations have the capacity of
operating at quasi-steady conditions in which the inputs, outputs, and states only have small
variations over time. With some abuse of notation, such operations will be referred to as being
in “steady-state” in this thesis, although some time variations always occur during manufacturing
due to process disturbances. Some CM operations such as continuous chromatography do not
operate under quasi-steady conditions, but are more prevalent in biologic rather than synthetic
drug substances.
A major advantage of continuous processing is the reduction of handling, downtime, and setup in
between processing steps, which allows more time dedicated to production. The additional
production time relative to a batch process allows for smaller equipment and thus a smaller
factory footprint [9], which directly reduces costs. Moreover, smaller equipment and less
material holdup give process developers the option to choose potentially more efficient, highly
exothermic reactions for synthesizing their drug substance without incurring the safety risks
associated with those chemistries when using large batch equipment.

25
Though CM is promising in theory, the equipment classes used for continuous drug substance
production can vary greatly, depending on reaction and crystallization needs. The variety of CM
equipment technologies and lack of process flexibility relative to batch technologies has been
recognized as a hurdle for adopting continuous manufacturing processes as a mainstream
production strategy [3]. One of the major challenges to CM standardization and modularization
is choosing from the numerous makes and models and types of technology for a flexible
continuous manufacturing platform.
2.4 CM of Drug Substance: Equipment Technology Overview
In this section, the general characteristics and diagrams are presented for the equipment covered
in this study. The detailed design equations that govern the operations and performance of each
type of equipment are presented in Chapter 5.
2.4.1 Continuous Reactors
For the reaction step, numerous types of continuous reactors are available for the synthesis
process. The reactors covered in this study include: plug flow reactors (PFRs), microchanneled
reactors (microreactors), packed bed reactors (PBRs), and continuous stirred tank reactors
(CSTRs). Each reactor is chosen based on different chemistry needs, such as the need for solid
catalysts, or better heat transfer, mixing, conversion, and selectivity requirements. At steady
state, all continuous reactors are designed to have little to no accumulation of material or energy
in the vessels and are fed a continuous stream of reactants and have a continuous stream of crude
product mixture exiting the system.
26
2.4.1.1 Continuous Stirred Tank Reactors (CSTRs)
CSTR is a broad category of reactors with mechanical stirrers, such as impellers, inside the
vessel that maintain a well-mixed slurry or solution. The vessel is typically upright and
cylindrical with a convex (e.g., conical) bottom outlet to prevent solids settling. Other reagents
or chemicals needed to control reaction conditions are introduced to the reactor using feed lines,
and a jacket for heating and/or cooling is often present to control system conditions. For
traditional first- and second-order kinetic reactions, CSTRs, in general, have a lower overall
conversion per unit volume when compared with other reactors such as the PFR. CSTRs are the
most suitable reaction type for certain reaction types that require significant mixing or
suspension, and for autocatalytic reactions, in which CSTRs have higher overall conversion per
unit volume [15].
2.4.1.2 Plug Flow Reactors (PFR) and Microreactors
The PFR, aka tube or tubular reactor, is a category of tube-shaped reactors with continuous flow
that is often simply a tube or pipe with controlled operating conditions (e.g., temperature and
pressure) to yield the desired reaction results. Because a mechanical agitator is present, reaction
conditions are highly non-uniform throughout the tube and can vary both radially and axially,
depending on component concentrations. For classic first- and second-order reactions, PFRs are
often preferred over CSTRs when high conversion is desired, because the reactant concentrations
towards the entrance of the tube are higher, allowing a higher overall conversion per unit volume
of reactor relative to that of a CSTR of the same volume. In other words, a CSTR will often
need a larger volume to achieve the same conversion as that of a PFR for first- and second-order
reactions [15]. This well-known result can be seen mathematically from the mass balance design
27
equations for each type of reactor, which is discussed in Chapter 5.
Microreactors are reactors with volumes on the scale of microliters (µl) that often have multiple
channels and bends to reduce footprint. Microreactors are often used by process developers for
small-scale syntheses and can be approximately characterized using the design equations for
normal tube reactors, using hydraulic diameters and equivalent pipe lengths. Their advantages
include ease of use and good heat transfer, but their tortuous channel paths can cause a high
frictional pressure drop, making these reactors difficult to scale up geometrically.
2.4.1.3 Packed Bed Reactors
The PBR is a general category of reactors in which cylindrical vessels or columns are filled with
beds of solid packing that are essential for the proper reaction(s) to occur. Typically, the packing
is a catalyst that significantly aids in the kinetics and selectivity of the reaction. This type of
reactor is common for chemistries such as hydrogenation that require a solid catalyst in contact
with a gaseous and/or liquid reactant stream. These flow reactors are commonly used in the
petroleum refining industry to saturate aromatic compounds, crack large organic compounds, or
remove sulfur from organic material.
2.4.2 Static Mixers
Depending on reactant or product mixing requirements, mixers could also be an essential
equipment class for the synthesis process. This study focuses on the selection of static mixers,
which is a class of equipment that does not have any mechanically powered mixing components.
The mixing is driven mostly by the fluid velocity in contact with fixed baffles and walls within

28
the mixer that create a tortuous path. The performance of mixing is strongly correlated with
frictional pressure drop [16].
2.4.3 Crystallization
For crystallization technology, this study focuses on mixed-suspension mixed-product removal
crystallizers (MSMPRs), as that technology is the most mature in industry [31]. MSMPRs are
continuous stirred vessels that can also be used for CSTR applications. In addition to having
mechanical stirrers, MSMPRs often also have a cooling jacket and chemical feed lines to control
key crystallization variables such as pH or yield. MSMPRs are advantageous when strong
agitation or stirring is needed, but other crystallization technologies are preferred if crystals are
sensitive to shear induced by the impellers (e.g., [33]).
2.4.4 Filtration and Drying
After the crystallization step, the slurry is pumped or fed gravitationally to a set of filters and
dryers, where the solid API crystals are separated from the liquid filtrate. Several reagents are
often passed over the slurry to fully remove solvents and to ensure a dry API cake of adequate
purity. While commercial equipment for continuous filtration and drying are available, first-
principles models are not yet well validated for pharmaceutical applications, so filtration and
drying are not a focus of this study.

29
Chapter 3: Hypothesis
As seen in the previous chapter, there are numerous different CM equipment technologies and
makes and models that are governed by a variety of equations and principles. This diversity of
available CM equipment can make equipment selection very complex, especially when choosing
the most flexible equipment assets to be used for multiple synthesis steps.
It is hypothesized that a novel tool providing computer-assisted equipment selection for each
equipment technology with a feature allowing simultaneous equipment selection for multiple
processes will positively impact the equipment selection process in terms of: (1) selection speed
and (2) the identification of lower cost or more flexible, usable assets.
Chapter 4: Problem Analysis
All interviews, data collection, and analysis were conducted at Amgen, Inc. primarily at the
Process Development site in Cambridge, Massachusetts.
The data collection and analysis methodology was divided into three distinct parts: (1)
understanding the current state of equipment selection, (2) understanding the needs of key
stakeholders who will use the tool, and (3) continuously requesting feedback from users as the
tool is developed.

30
The needs of the stakeholders were summarized in the Problem Focus in Chapter 1. This chapter
discusses the current state of equipment selection, which was used as the basis for developing the
software tool to ensure that the tool improved upon the status quo.
4.1 State of the CM Equipment Selection Process prior to Project Implementation
Figure 4 is a schematic of the generalized form of the existing equipment selection process at
Amgen prior to the implementation of the tool developed from this research. First, a compatible
equipment technology is chosen for the proposed continuous synthesis being studied, and then
process information such as fluid properties and reaction kinetics are either modeled or collected
through experimental data. Then the equipment is sized using an equipment design software
suite such as DynoChem®, based on physical and chemical properties of the process and the
production scale. Then the equipment make and model were chosen by manually searching
through catalogs from common vendors or by contacting a sales representative to identify
equipment that matches the design from the software suite. Occasionally, if an off-the-shelf
model is not available, sales representatives are contacted to discuss the possibility of customized
equipment. Approximately 75% of the time, scientists have been able to reuse equipment assets
that have already been purchased, and about 25% of the time, scientists have had to purchase
new equipment assets. The feedback about this process was that it requires significant time
resources and is very tedious – too tedious to complete the design requirement calculations for
multiple processes.

31
Figure 4: Existing Equipment Selection Decision-making Process (Prior to Project)
4.2 Improvements to the Current Equipment Selection Process
As discussed in Chapter 1, the focus of this project is to improve how the equipment makes and
models are identified, assuming that the equipment technology has already been selected. For
this aspect of equipment selection, surveys indicated that there were two key areas of
improvement that are strongly desired.
First, the search for equipment models manually through numerous catalogs and the wait for
sales representatives were significant time-consuming steps in the equipment selection process.
Therefore, there was strong demand for a tool that could facilitate the search by combining
information from various vendors about makes and models of the same equipment technology
into one searchable tool or database. In other words, the goal is to create a software equipment
selector tool that provides a “one stop shop.”
Additionally, there was a request for software that could conduct all of the tedious calculations
that characterized the performance for each make and model of equipment and all of the
calculations that characterized the equipment design requirements for the given process. For
example, there is currently no software available at Amgen that estimates both the heat transfer

32
rate capabilities (performance) of each make and model of CSTRs and the required heat transfer
rate for a given chemistry (requirement). Consequently, to compare the heat transfer
requirements with a product’s capabilities, calculations, and comparisons had to be done either in
separate software suites or manually. There was no “one stop shop.”
Chapter 5: Redesign of the Equipment Selection Process
The demand for computer assistance for engineering calculations, as presented in Chapter 4, is
consistent with the strategy to build upon the Krasberg approach for selecting equipment [6].
Figure 5 is a schematic for a proposed new process for equipment selection with modifications
shown in green.
Figure 5: Proposed Equipment Selection Process with New Tool
5.1 Overview of Software Tool Design
Specifically, each equipment technology has a tool that includes five different types of
spreadsheets. First, there is a sheet for the user to input values for extensive and intensive
chemical and physical properties (“Process Inputs Sheet”) related to the synthesis process (e.g.,

33
production scale, reaction exothermicity, fluid viscosity and density). Second, there is a sheet
used as a database to store parametric information for each make and model of equipment
(“Equipment Inputs Sheet”) that is needed to characterize its size and performance (e.g.
geometric dimensions, material of construction, allowable temperatures, and maximum agitator
speed). The information from these two sheets provides inputs into the third spreadsheet
(“Calculation Sheet”), which includes the formulas that execute the design requirement
calculations and the Boolean logic that determines if the equipment make and model
performance satisfies the design requirements. If all design requirements are satisfied, the tool
indicates that the equipment model is ‘appropriate’ for the process.
Lastly, there was a fifth spreadsheet (“Results Sheet”) proposed that included pivot tables to
easily generate pivot charts to quickly and visually categorize equipment makes and models
based on specific design parameters (e.g., flexibility, cost, and pressure drop).
The first and third spreadsheets are designed to allow inputs and calculations for multiple CM
processes being studied so that appropriate equipment can be identified for each process
simultaneously. This design allows the user to easily identify the most flexible equipment assets
for his or her portfolio of chemistries and drug synthesis steps.
For each of the equipment technologies listed in the Project Focus in Chapter 1, a set of
quantitative and qualitative design requirements are chosen to determine if an equipment make
and model are appropriate for the synthesis process. The next sections explain each design
requirement and selection criterion in detail for each equipment technology. As a reminder, the

34
previous ‘Parameter Legend’ section defines each parameter in the equations displayed in this
chapter.
5.2 Equipment Selection: General Design Requirements
While each equipment technology has its specific performance design requirements, there are
three general safety and reliability requirements that can be applied to all equipment. These
three requirements are: material compatibility, and the ability for the equipment models to
withstand process temperatures and pressures.
5.2.1 Material Compatibility Requirement
Material compatibility of the equipment model with the process chemistry is important to ensure
that the solvents, reactants, products, and reagents can be operated safely within the equipment
without significant corrosion or other damage to the vessel that could cause an unplanned or
accelerated loss of containment. Furthermore, the equipment material of construction must be
inert and not react with the process material to ensure that the synthesis reactions occur as
designed.
In the Process Inputs sheet, the user specifies the required material of construction for the vessel,
based on his or her knowledge of the process chemistry and its compatibility with certain
materials. For each equipment make and model, there is a column in the Equipment Inputs
spreadsheet that documents the material of construction for each vessel, as specified by the
vendor. In the Calculations sheet, there is a column that contains Boolean Logic comparing the
material of construction of the equipment with the material of construction requirements

35
specified by the user. If the material of construction of the equipment does not meet the
requirements, the equipment model is considered inappropriate for the process chemistry.
For future versions of this tool, it is recommended that a material compatibility matrix be added
as a spreadsheet. Newer versions of the tool should include features that allow the user can
specify the specific chemical components of the process fluid and use algorithms to search
through the matrix for the materials of construction that are compatible with the components.
This extension would allow the material of construction requirements to be determined
automatically by the tool as opposed to being determined manually by the user.
5.2.2 Process Temperature Requirement
The process temperature requirement column in the “Calculations” spreadsheet is Boolean logic
that compares the desired process operating temperature (user-specified) with the allowable
temperature range for each CSTR vessel (vendor-specified) that is documented in the
“Equipment Inputs” spreadsheet. If the process temperature is not within the allowable
temperature range of the equipment, the equipment model is considered unusable for the process
being studied.
5.2.3 Process Pressure Requirement
Similar to the Process Temperature Requirement in Section 5.2.2, there is also a pressure
requirement in the “Calculations” spreadsheet. This column includes Boolean logic that
compares the desired operating pressure (user-specified) with the allowable pressure range for
each CSTR vessel (vendor-specified). If the process pressure is not within the window of

36
allowable pressures for the equipment, the equipment model is considered unusable for the
process being studied.
For PFRs, packed bed reactors, and micromixers, the pressure drop across the vessel must be
added to the maximum expected outlet pressure to estimate the maximum inlet pressure. This
inlet pressure is then compared to the maximum pressure of the vessel. Instructions for pressure-
drop calculations are detailed in the below sections.
5.3 Equipment Selection: CSTR-specific Design Requirements
In addition to the general design requirements, an appropriate CSTR make and model must meet
the four additional design requirements: (1) the heat transfer fluid (HTF) temperature
requirement, (2) the maximum temperature difference requirement, (3) the impeller speed
requirement, and (4) the residence time requirement.
5.3.1 Heat Transfer Fluid Temperature Requirement
To ensure that the manufacturing process maintains steady-state conditions during normal
operations, the CSTR make and model must be capable of satisfying the steady-state energy
balance equations with no accumulation. In other words, the process must be able to provide a
heat transfer rate that is fast enough to fully expel the heat generated or replenish the heat
consumed by the reaction within the vessel. An approximate energy balance equation for a non-
adiabatic CSTR is
Equation 1: Steady State Energy Balance Around Ideal CSTR; Bibliographical Source: [6]
!"#Δ%&'( = *+,-./0([34567] − [345:;<])>−Δ@AB + *+,-./04D(%67 − %:;<)

37
To describe this equation in words, the heat transfer rate (left-hand side) is the product of the
overall heat transfer coefficient, the heat transfer surface area, and the change in temperature of
the heat transfer fluid (HTF). At steady state with no accumulation in the system, this heat
transfer rate equals the heat released/absorbed based on the overall molar heat of reaction and the
overall reaction conversion and the heat resulting from the inlet fluid temperature change (right-
hand side), along with the heating or cooling required to bring the inlet fluid to reaction
temperature. For computation purposes, it is practical to solve for the difference between the
process temperature and the inlet heat transfer fluid temperature ∆THTF and subsequently the
required inlet HTF temperature (THTF,in), which equals the ∆THTF added to the process
temperature (Tprocess+∆THTF). The determined value of THTF,in must be within the allowable
operating temperatures listed by the vendor for the specific equipment make. If THTF,in is outside
of allowable temperature limits for the equipment model, the equipment model is considered
inappropriate for the process. In order to solve for these values, Tprocess must be known, as well
as the other parameters in the equation.
The parameters on the right-hand side of Equation 1 are all process inputs that are specified by
the user and depend only on the process chemistry and not the specific equipment make/model.
These parameters are the desired volumetric flow rate (Qdesign), the desired reaction conversion
(i.e., change in reactant concentration), inlet fluid heat capacities (cp), desired reaction
temperature (Trxn), and the expected inlet temperature. The parameters on the left-hand side,
however, depend on the specific equipment dimensions.

38
This form of the energy balance equation around the entire CSTR assumes that there is an
isothermal reaction and that temperature and concentration do not vary across the CSTR, and
that there is only one process stream entering the reactor. While Equation 1 is generally a good
first approximation, the user must still understand whether the inherent assumptions are
acceptable for the specific process development project and whether revisions are needed to the
design equation.
The overall heat transfer coefficient U is a complex parameter that is a function of convective
and conductive heat transfer, as seen in
Equation 2: Overall Heat Transfer Coefficient; Bibliographical Source: [17]
The overall heat transfer coefficient U is a function of the convective heat transfer coefficient of
the HTF (hHTF), the convective heat transfer coefficient of the process fluid (hrxn fluid), the
conductivity of the vessel walls (kh), and the heat transfer surface area (As).
Values for conductivity (kh) can be found in tables in the literature for common materials of
construction. Convective heat transfer coefficients are functions of several phenomena including:
fluid properties, equipment geometry and design, and mixing intensity. These coefficients can
be quantified using empirical correlations between dimensionless numbers that characterize these
phenomena for a variety of process fluids.
1
!"#,,GH.IJ,0K.0K,L.ML=
1
ℎLO0PQH.+"#,,GH.IJ,0K.0K,L.ML+
1
ℎ&'("#,,GH.IJ,0K,OK,L.ML+
RST
UV"#,,GH.IJ,0K.0K,L.ML

39
For impeller-stirred vessels such as CSTRs, the convective heat transfer coefficients for both the
process fluid and the HTF are characterized by the Nusselt number:
Equation 3: Nusselt Number for Process Fluid and HTF; Bibliographical Source: [18]
In this equation, the kh is the fluid conductivity, which can be found in literature for common
reagents and solvents used in process fluids and for heat transfer fluids (HTFs). For the process
side, the characteristic length x for convective heat transfer is the inner diameter of the CSTR.
For the HTF side of the system, the characteristic length can vary. For a jacketed CSTR where
the HTF is pumped, the dominant heat transfer is considered to be forced convection, and the
characteristic length is the hydraulic diameter of the annulus between the outer and inner walls of
the jacket. The hydraulic diameter of an annulus can be estimated using
Equation 4: Hydraulic Diameter of an Annulus
In most heat transfer correlations, the Nusselt number and convective heat transfer is a function
of two dimensionless numbers: (1) the Prandtl number, which characterizes momentum
diffusivity of heat relative to thermal diffusivity of heat and (2) the Reynolds number (forced
convection), which characterizes forced convection fluid flow.
For the process fluid, the Nusselt number can be estimated using the correlations specific to
agitated stirred vessels such as CSTRs:
Equation 5: Nusselt Correlation for Turbulent Flow in Stirred Tanks; Bibliographic Source: [16]
Nu = ℎY
UV
Nu =VS
Z[= 0.32Re.JI
b/dPrg/d h
ijklm
inollpq.gr
(foranchorimpellers)

40
Parametric values for the exponents and constants can be found in the literature.
For the heat transfer fluid, the Nusselt number can be estimated using the Gnielinski correlation:
Equation 6: Nusselt Correlation for Turbulent and Laminar Forced Convection Flow without Stirring or Agitation; Bibliographic Source: [23]
This correlation is specific to forced convection fluids in the turbulent flow regime, such as the
HTF flowing in a jacketed CSTR. For laminar HTF fluid flow, the Nusselt number is
approximately a constant value of 4.36.
In the Gnielinski correlation, the Darcy friction factor f can be estimated using the Colebrook-
White correlation for turbulent flow and Poiseuille’s Law for laminar flow:
(for turbulent flow)
Equation 7: Colebrook-White Correlation for the Darcy Friction Factor in Turbulent Flow; Bibliographic Source: [24]
(for laminar flow)
Equation 8: Poiseuille’s Law for the Darcy Friction Factor in Laminar Flow; Bibliographic Source: [24]
The pipe roughness E can be found in the literature for common materials.
Nu =ℎY
UV=
st8v (Rew − 1000)Pr
1 + 12.7 st8vg/b
(Prb/d − 1)
(Gnielinskiforturbulentflow)
Nu =ℎY
UV≈ 4.36(forlaminarflow)
t =64
ReI.I,

41
The Prandtl Number is the same for all calculations:
Equation 9: Prandtl Number
For forced convection systems, the Reynolds number can have various forms, depending on the
type of system. For systems that are mixed or agitated by one or more impellers (e.g., a process
fluid in a CSTR), the appropriate Reynolds number is the Impeller Reynolds number,
Equation 10: Impeller Reynolds Number; Bibliographic Source: [15]
This form of the Reynolds number depends on the impeller diameter (Dimp) and the impeller
speed (N) in addition to the fluid properties of density and viscosity. The estimation of the
impeller speed is discussed later in this section.
For forced convection systems with no agitation such as flow through an annulus or pipe, the
Reynolds number takes the form of the traditional pipe flow Reynolds number, which is
Equation 11: Pipe Flow Reynolds Number; Bibliographic Source: [15]
The pipe flow Reynolds number differs from the impeller Reynolds number, because the
characteristic length is now the hydraulic diameter of the flow space, and the impeller speed is
replaced by the velocity of the fluid flow (Qdesign/Ac).
Pr = 4Dâ
UV
Re.JI = ä.JIãå
â
ReI.I, =åä&*+,-./0
â"ç

42
For each form of the Reynolds number, the fluid properties (flow rate, density ,and viscosity) are
determined by the user, while the equipment geometries (Dx and Ac) are specified by the vendor
for each equipment make and model listed in the ‘Equipment Inputs’ database spreadsheet.
The impeller speed N in the Impeller Reynolds Number depends on the type of process fluid in
the CSTR along with the mixing constraints, as specified by the user. Typically, the major
mixing constraints that determine mixing speed include:
1. Minimum mixing power per unit volume: For turbulent mixtures, mixing power is
estimated using
Equation 12: Mixing Power; Bibliographical Source: [16]
In this equation, Kp is the power number which depends on the number of impellers and
the impeller type, which can be found in the literature, and r is the fluid density. The
mixing power increases cubically with impeller speed and has a quintic relationship with
impeller diameter. Thus, when scaling-up a vessel geometrically, the mixing power can
become too costly to maintain a constant impeller speed from lab to commercial scale.
To avoid costly power consumption, while maintaining adequate mixing, engineers often
maintain or specify a minimum mixing power per unit volume,
Equation 13: Energy Dissipation; Bibliographical Source: [16]
Maintaining power per unit volume in most systems leads to a constant energy
dissipation, which approximately maintains mass transfer rates in turbulent flow regimes
mixingpower(turbulent) = ëDåãdä.JI
í
ì =mixingpower
å̅ï

43
[19]. To ensure proper mass transfer for the chemical reaction, the user must specify a
desired power per unit volume for the CSTR in the ‘Process Inputs’ spreadsheet.
2. Minimum and maximum shear rates: If information about shear rate limits is available,
the user can also input a desired minimum or maximum shear rate (optional). A
maximum shear rate can be an important constraint to prevent the shearing destruction of
catalyst particles or crystals that are suspended within the CSTR process fluid, while a
minimum shear rate could be important to maintain the proper crystal or bubble sizes [16].
The shear rate is a function of mixing power and can be calculated using
Equation 14: Shear Rate; Bibliographical Source [20]
3. Just-suspended speed for liquid-solid slurries: For liquid-solid slurries, such as a
mixture of solid catalyst in a liquid reaction solution of reactants, the solid catalyst must
often be fully suspended in the liquid for the reaction to progress properly. Therefore, the
minimum impeller speed required to fully suspend a solid in a liquid is an important
constraint for solid-liquid mixtures. According to Carpenter and Atherton [21], this ‘just-
suspended’ impeller speed can be calculated using
Equation 15: Just-suspended Impeller Speed; Bibliographical Source [21]
Per this equation, the impeller speed is a function of the kinematic viscosity (n), particle
diameter (dp), difference between solid density and liquid density (Dr), liquid density (r),
solid mass to liquid mass ratio (Y), and impeller diameter (Dimp). Specific values of
geometric constant ‘S’ can be found in the bibliographical source for Equation 15.
ñ(turbulent) = ómixingpower
âïò
g/b
= óëDåã
dä.JIí
âïò
g/b
ãôö = õúq.gRDq.b s
ù∆å
åüvq.rí
†q.gdä.JI°q.¢í

44
4. Just-dispersed speed for immiscible liquid-liquid mixtures: For a multi-phase liquid
mixture, such as an organic phase dispersed in an aqueous solution, the extent of
dispersion is often critical for creating the proper reaction conditions. The minimum
impeller speed required to disperse an immiscible liquid phase into another can be
calculated using
Equation 16: Minimum energy dissipation required for liquid-liquid dispersion. Heavy phase is continuous; Bibliographical Source: [22]
Equation 17: Minimum energy dissipation required for liquid-liquid dispersion. Heavy phase is dispersed; Bibliographical Source: [22]
The choice between these equations to calculate the ‘just-dispersed’ speed depends on
whether the ‘heavy’ fluid with the higher density is the dispersed phase or the continuous
phase. The densities of each liquid phase are specified by the user in the ‘Process Inputs’
spreadsheet. To calculate the minimum energy dissipation needed to disperse the fluid,
the volume fraction of each phase (jfd) and fluid viscosities are also required inputs in the
“Process Inputs” spreadsheet. The minimum just-dispersed impeller speed can then be
determined from Equations 13 and 14, which relate energy dissipation and mixing power
to impeller speed.
An impeller speed is back-calculated for each of the five mixing constraints. Of the five speeds
that have been calculated, the fastest impeller speed is chosen for the Nusselt number
calculations, or the impeller speed that yields the maximum allowed shear rate. The impeller
speed is chosen using this strategy so that it satisfies all minimum constraints (power per unit
ìü°& = 6.138×10°§åçq.••∆åq.¶•âç
°q.rß®©.br
ì&°ü = 1.89×10°d∆åg.gâ©q.bgß®©
.d•

45
volume, minimum energy to disperse, minimum energy to suspend, and minimum shear rate) and
the maximum shear constraint.
Once all the parameters have been determined for the Nusselt number coefficient correlations,
the convective heat transfer coefficients and thus the overall heat transfer correlation U can be
determined, which allows the required inlet THTF to be determined. If the THTF falls within the
allowable temperatures of the equipment model, the equipment model has passed this criterion;
otherwise, this criterion has failed and the equipment model is inappropriate for the process.
5.3.2 CSTR Maximum Temperature Difference Requirement
In Section 5.3.1, the heat transfer fluid temperature (THTF) was calculated using multiple heat
transfer correlations and process parameter inputs. In addition to determining whether the THTF
is within the allowable temperature range of the vessel, it is important to ensure that the
difference between the expected process temperature and the required HTF temperature can be
withstood by the vessel. This step ensures that the temperature difference will not cause any
thermal expansion issues that would cause the vessel to rupture or cause a loss of containment.
Therefore, in addition to comparing THTF with Tmax and Tmin for each vessel, the tool must also
compare (Tprocess − THTF) with maximum allowable temperature difference (DTmax) for each
vessel, as specified by the vendor. If the difference between process and HTF temperatures
exceeds this limit, the equipment model fails this criterion and the equipment is considered
inappropriate for the process.
5.3.3 CSTR Impeller Speed Requirement
In Section 5.3.1, the required impeller speed N was also estimated based on mixing constraints.
The required impeller speed must be compared with the vendor-specified maximum impeller
46
speed for each equipment model. If the equipment model is unable to provide the required
impeller speed, it fails this criterion and is considered inappropriate for the process.
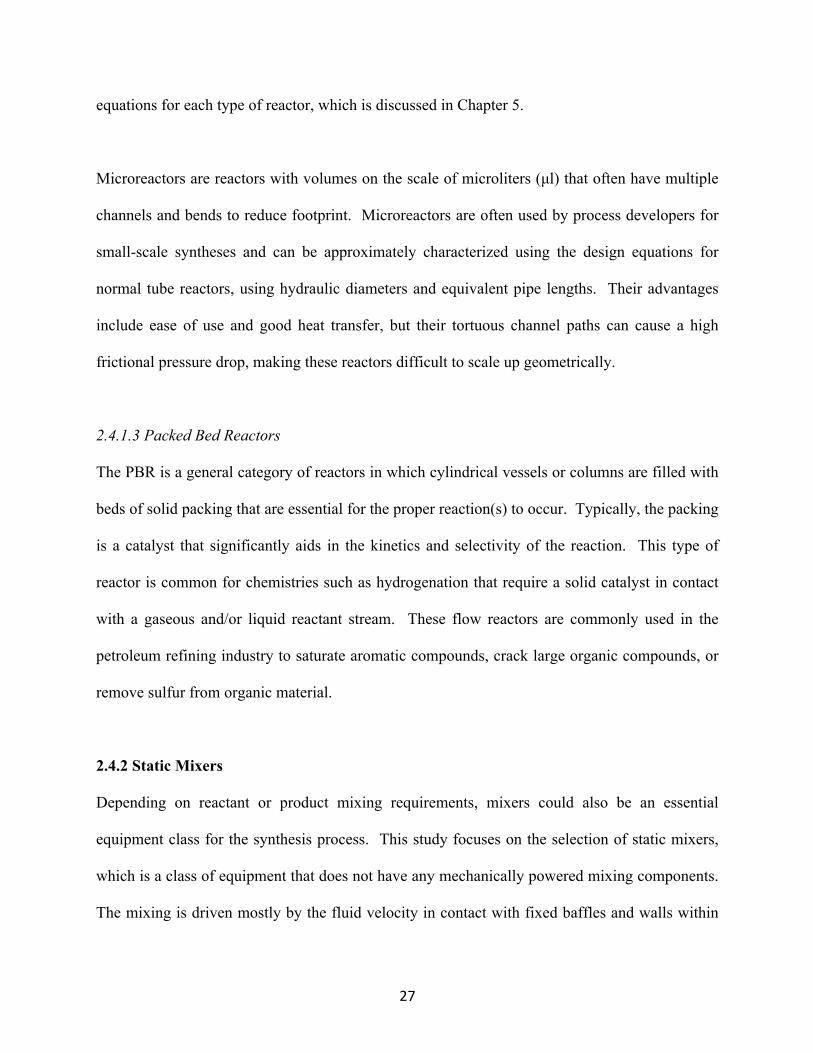
5.3.4 CSTR Residence Time Requirement
A critical design parameter for any continuous reactor is the residence time of a fluid in the
reactor, which reflects the extent of reaction within a vessel. The proper residence time must be
specified to ensure that the desired conversion and selectivity are achieved. The average
residence time can be calculated using
Equation 18: Average CSTR Residence Time; Bibliographical Source: [15]
For ideal CSTRs with uniform concentrations in the process fluid, the steady-state mass balance
can also be expressed in the form of the average residence time, which in this case is a function
of the change in concentration and the reaction rate (Ra), which is a function of the process fluid
concentration.
In order to ensure an adequate extent of reaction, the user must specify the production scale
(volumetric design flow rate) and the allowable minimum and maximum residence time in the
“Process Inputs” spreadsheet. The design flow rate is then used to estimate the residence time
for each equipment model, and if the expected residence time is within the allowable residence
time window, this criterion has passed.
´ =ï,GH.IJ,0K
*+,-./0=
[¨67] − [¨:;<]
3≠([¨:;<])

47
Furthermore, to ensure that the chemical reaction is not limited by mixing or slow reaction
kinetics, the expected residence time must be greater than the mixing time required to have 95%
uniformity and the characteristic reaction time:
Equation 19: Mixing Time to 95% Uniformity; Bibliographical Source: [16]
Equation 20: Characteristic Reaction Time; Bibliographical Source: [6]
If the expected residence time within a CSTR is greater than either of these characteristic times,
the equipment is considered to have failed this criterion.
Appendix Section A.1 provides four tables that describe the CSTR selection process: (1) a
snapshot of the Process Input Spreadsheet, (2) a list of the required Equipment Parameter Inputs,
(3) a list of the design criteria, and (4) a list of the required calculations for CSTR identification.
5J.O = ƶí(turbulent) =5.20
∞ä.JI
b
äK±0≤
g/b ≥ãëDg/d
5LO0 =1
ULO0[reactants]qµ°g

48
5.4 Equipment Selection: PFR-specific Design Requirements
5.4.1 Heat Transfer Fluid Temperature Requirement
Similar to the CSTR, a steady-state PFR system must also provide enough heat transfer to expel
or replenish any heat generated or consumed by the reaction and the process inlet fluid. The
same approach from Section 5.3.1 can again be used to determine if heat transfer is adequate in a
specific PFR system. The overall energy balance around the reactor can be expressed by
Equation 1, and the overall heat transfer coefficient U can be expressed with Equation 2. Once
again, the tool will solve for the required DTHTF and THTF and determine if these values fall
within the allowable temperature windows of each off-the-shelf PFR. The conductivity of the
PFR wall and the process fluid can be found in the literature for common materials.
For PFRs there are generally two types of heat transfer methods used to maintain reaction
temperature: (1) jacketed PFRs where HTF is pumped through the annulus between the jacket
wall and PFR wall and (2) PFRs submerged in baths (e.g., ice water baths) or open to ambient air.
In the jacketed system, the HTF transfers heat primarily by forced convection, while in the bath
and natural air-cooled systems the HTF transfers heat primarily through natural convection.
For jacketed systems, the Reynolds number for both the HTF and the process fluid can be
expressed using the ‘pipe flow’ Reynolds number (Equation 11), and the Nusselt number can be
approximated as a function of Reynolds number and Prandtl number (Equation 6) using the
Gnielinski correlation for turbulent flow or the ‘4.36’ constant for laminar flow. For the Nusselt
number, the characteristic lengths used are the hydraulic diameters, and Equations 7 and 8 can be
used to estimate the Darcy friction factors for both the process fluid and HTF in a CSTR.

49
For a non-jacketed PFR in a thermal bath (e.g. an ice water bath) or in ambient air, the HTF
convection is a natural convection and the fluid flow is characterized using the Rayleigh number,
instead of the Reynold’s number. The Rayleigh number is dimensionless and depends on the
difference between the heat transfer surface temperature and the quiescent temperature (Ts – T∞),
the thermal expansion coefficient (b), the characteristic length that is the outer diameter of the
PFR, and the Prandtl number parameters:
Equation 21: Rayleigh Number; Bibliographic Source: [18]
After calculating the Rayleigh and Prandtl numbers, the convective heat transfer coefficient for
the HTF can be estimated using the Churchill Chu correlation:
Equation 22: Heat Transfer Coefficient for Natural Convection Around a Horizontal Cylinder; Bibliographic Source: [18]
With the heat transfer coefficients calculated, THTF and DTHTF can be determined using Equations
1 and 2. If the value for THTF falls within the range of allowable temperatures for a PFR, the
equipment has passed this criterion.
5.4.2 PFR Maximum Temperature Difference Requirement
Analogous to the procedure for choosing CSTRs, the next step after calculating the inlet THTF is
to compare the difference between the HTF and process temperatures. This temperature
difference must be compared to the maximum allowable temperature for an equipment model, as
Ra = ù∂(%# − %∑)Y
d
úUVå4D

50
specified by the vendor. If the estimated temperature difference exceeds the maximum allowable
temperature, this criterion fails and the PFR model is considered inappropriate for the process.
5.4.3 PFR Pressure Drop Calculation
For tube reactors and PFRs, the pressure of the vessel will generally vary along the length of the
reactor due to frictional pressure drop. The maximum allowable pressure for a PFR must be able
to withstand the expected outlet pressure (user-specified) plus the estimated pressure drop based
on volumetric flow rate and the Darcy friction factor. The Darcy friction factor was determined
using the Colebrook-White correlation (Equation 7) or Pouseuille’s law (Equation 8) when
calculating the Nusselt number for the process fluid and can be used to estimate the pressure
drop via the Darcy-Weisbach correlation:
Equation 23: Darcy-Weisbach Equation; Bibliographical Source: [23]
If the expected outlet pressure plus the pressure drop is within the vendor-specified allowable
pressure window for a PFR, then that PFR has passed the pressure requirement criterion.
5.4.4 Residence Time Requirement The residence time requirement for PFRs is similar to that for the CSTRs. The residence time of
the PFR at the design flow rate must be within the residence time window specified by the user.
In other words, the PFR volume must be the right size to yield an appropriate residence time at
the design flow rate. If not, then the PFR has failed the criterion to provide the required
residence time.
∆∏
π= t
å
2
*+,-./0b
"çbäI.I,

51
The average residence time in a PFR can be calculated as
Equation 24: Average Residence Time; Bibliographical Source: [15]
For ideal PFRs, the assumption is that there is no axial mixing and that the concentration varies
along the length of the reactor. The residence time is related to conversion by
Equation 25: Material Balance Equation for Ideal PFRs; Bibliographical Source: [15]
which is the integral form of the differential material balance equation for a PFR. This equation
can be used to estimate the required residence time window based on the desired conversion.
Furthermore, the mixing time and characteristic reaction time must also be less than the reactor
residence time to ensure that the reaction is not limited by mixing or the reaction rate. For PFRs,
the reaction time can be estimated using Equation 20 and the mixing time from
Equation 26: Mixing Time in Cylindrical Vessels; Bibliographical Source: [6]
Equation 27: Energy Dissipation in PFRs; Bibliographical Source: [6]
´ =ï,GH.IJ,0K
*+,-./0
∫R[¨]
3≠
[≠]ªºΩ
[≠]æø
= ∫R¿
¡̅
ü
q
5J.O =1
0.058sú̅
ìvg/b
ì =*Δ∏
å̅ï

52
Appendix Section A.2 provides four tables that describe the PFR selection process: (1) snapshot
of the Process Input Spreadsheet, (2) a list of the require Equipment Parameter Inputs, (3) a list
of the design criteria, and (4) a list of the required calculations for PFR identification.
5.5 Equipment Selection: Packed Bed Reactor-specific Design Criteria
5.5.1 Heat Transfer Temperature Requirement
As in the PFR and CSTR selection tool, the packed bed reactor tool calculates the required HTF
temperature for the process and determines if each off-the-shelf PBR can operate at the required
temperature.
While the overall energy balance can still be approximated with Equation 1 for packed bed
reactors, the convective heat transfer coefficient on the process side (hrxn, fluid) in Equation 2
becomes an ‘overall’ convective heat transfer coefficient. This overall coefficient can be
calculated as the reciprocal of the sum of the resistance contributions from convection in the
packed bed and convection at the reactor wall (Equation 28).
Equation 28: Overall Convection Coefficient for Process Side in Packed Bed Reactors;
Bibliographical Source: [25]
The convective heat transfer coefficient of the bed (hbed) can be approximated as a function of
the reactor radius (R), the effective conductivity (ke), and a temperature-dependent parameter (b)
[25]:
ℎ¬,+ = ∂U√3
1
hLO0,PQH.+=
1
ℎ¬,++
1
ℎ≈±QQ

53
Equation 29: Convective Heat Transfer Coefficient of a Packed Bed; Bibliographical Source: [25]
Assuming that the temperature within the reactor does not vary axially, and the radial reaction
rate is approximately constant, b can be assumed to be approximately a constant value of 4. The
effective conductivity ke is estimated from
U√U®=U√q
U®+ReI±LK.∆Q,Pr
PeV
Equation 30: Effective Conductivity Function; Bibliographical Source: [25]
In this equation, kf is the conductivity of the fluid, which can be found in literature tables for
most common solvents and reagents, U√q is the effective conductivity at stagnant flow which can
be estimated as a reciprocal of the sum of resistances due to various paths of conduction:
1
U√q =
1
UI±∆≤.0/+
1
UPQH.++
1
UI±∆≤.0/-HLP±∆,+
1
UP.QJQ±«,L
Equation 31: Effective Conductivity Function; Bibliographical Source: [25]
The particle Reynolds number (Reparticle) is calculated in the same way as the pipe-flow Reynolds
number but with the packing particle diameter (Dp) used as the characteristic length instead of
the hydraulic diameter of the flow path:
Equation 32: Particle Reynolds Number; Bibliographical Source: [25]
For packed beds, the Peclet number for heat transfer (Peh) is often estimated to be the same as
the Peclet Number for mass transfer (Pem), which assumes that the radial heat and mass transfer
diffusivities are the same [25]. For particle to reactor diameter ratios between 0.1 to 0.6, Pem can
be estimated using
Peµ = 6.3 + 34.7äI±LK.∆Q,
äL,±∆KML
ReI±LK.∆Q, = åäI±LK.∆Q,*+,-./0
â"ç

54
Equation 33: Correlation for Peclet Number for Mass Transfer in Packed Bed Reactors; Bibliographical Source: [25]
Using this ‘Variable Peclet Approach’ [25], the wall heat transfer coefficient (hw) in a packed
bed reactor for spherical packing can be approximated by the wall Nusselt Number correlation:
NuT = 4.9äI±LK.∆Q,
äL,±∆KML
q.b•
ReI±LK.∆Q,q.rí Prq.dd
Equation 34: Wall Nusselt Number Correlation for Packed Bed Reactors with Spherical Packing; Bibliographical Source: [25]
While these equations are used to determine the required HTF temperature in the selector tool,
the user must understand the underlying assumptions stated by Peters et al. [25] and determine
whether or not they are valid for the system. If not, a separate calculation must be completed.
For the HTF heat transfer coefficients, the Gnielinski correlation or laminar constant (Equation 6)
can be used for approximation for forced convection heat transfer fluid, and the Churchill and
Chu correlation (Equation 22) can again be used as an approximation for natural convection HTF.
5.5.2 Packed Bed Reactor Maximum Temperature Difference
Once the inlet THTF is calculated using the methods presented in Section 5.5.1, the expected
temperature difference between the process fluid and THTF must be below the maximum
allowable temperature difference, as specified by the vendor. Otherwise, the Packed Bed
Reactor is considered inappropriate for the process.
5.5.3 Packed Bed Reactor Pressure Drop Calculation

55
Similar to PFRs, packed bed reactors require frictional pressure drop calculations to determine
the maximum inlet pressure. The frictional pressure drop in a packed bed reactor can be
estimated using the Ergun equations:
Equation 35: Reynolds Number for Packed Beds; Bibliographical Source: [26]
Equation 36: Friction Factor Correlation for Packed Beds; Bibliographical Source: [26]
Equation 37: Ergun Equation for Frictional Pressure Drop in a Packed Bed; Bibliographical
Source: [26]
In these equations, e is the void volume within the reactor.
The pressure drop across the packed bed reactor must then be added to the maximum outlet
operating pressure to calculate the maximum inlet pressure. If the maximum inlet pressure to the
reactor exceeds the maximum allowable pressure, the PBR should not be used for the process.
5.5.4 Packed Bed Reactor Mean Residence Time Requirement
For the mean residence time requirement, the void volume must be used, instead of the
equipment volume, because the fluid can only travel through the voids:
Equation 38: Packed Bed Reactor
ReI±∆≤,+¬,+ =åäI±LK.∆Q,*+,-./0
â"ç(1 − »)
t =150
ReI±∆≤,+¬,++1.75
∆∏
π= t
å*+,-./0b
"çbRD
s1 − »
»dv
´ =ï…M.+
*+,-./0=ï,GH.IJ,0K»
*+,-./0

56
This residence time must fall within the range of the minimum and maximum mean residence
time as specified by the user. A reactor’s residence time must also be greater than the
characteristic reaction time and the mixing time, which are estimated by Equations 20 and 26,
respectively.
Appendix Section A.3 provides four tables that describe the PBR selection process: (1) snapshot
of the Process Input Spreadsheet, (2) a list of the require Equipment Parameter Inputs, (3) a list
of the design criteria, and (4) a list of the required calculations for PBR identification.
5.6. Equipment Selection: Mixed-Suspension Mixed-Product Removal
Crystallizers
As mentioned in Chapter 2, MSMPR equipment is very similar to CSTRs and the same
equipment models are often used for either or both operations. While the material and energy
balances are fundamentally different between the two unit operations, the correlations and
selection criteria are very similar.
5.6.1 MSMPR Heat Transfer Fluid Requirement
In an idealized process, crystallization is assumed to be the only operation within the MSMPR
(i.e., no reactions). The overall energy balance equation differs by replacing the molar heat of
reaction by a heat of crystallization, which is often approximated as the negative value of the
heat of solution [27], which can be found in the literature:
Equation 39: Overall Energy Balance around MSMPR; Bibliographical Source: [28]
!"#Δ%&'( = *+,-./0([õ ÀÃ5Õ67] − [õ ÀÃ5Õ:;<])>−Δ@-MQ0B + *+,-./04Då(%ŒœŒ–— − %67)

57
The extent of crystallization depends on the quantity of solute that has been crystallized out of
solution.
Because the same equipment models for CSTR operations can be used for MSMPR operations,
Equations 2 through 15 apply for MSMPRs when calculating the overall heat transfer coefficient
U and the inlet THTF. Because at steady state the process fluid in the MSMPR is a solid-liquid
slurry, the just-suspended impeller speed must be calculated using Equation 13 to ensure that the
equipment can provide a speed that is fast enough to suspend the crystals in the stirred slurry.
Once again, if the inlet THTF is within the allowable temperature range for the vessel, this
criterion passes.
5.6.2 MSMPR Temperature Difference Requirement
The difference between the THTF and the MSMPR temperature must also be below the maximum
allowable temperature difference between the two fluids, as specified by the vendor.
5.6.3 MSMPR Impeller Speed Requirement
As mentioned in Section 5.3.3, the MSMPR motor must be able to provide speed fast enough to
ensure the suspension and the adequate mixture of the slurry in the vessel. The desired speed
was calculated using Equations 10 through 15. If the motor cannot provide adequate speed, the
MSMPR model is considered unusable for the process.
5.6.4 MSMPR Mean Residence Time Requirement

58
Although typically no major reactions are taking place within the MSMPR, the mean residence
time is still an important design parameter when determining the correct equipment for
crystallization, as seen by the population balance,
Equation 40: Population Balance for an MSMPR Crystallizer; Bibliographical Source: [29]
In this equation, nc is the population density, GC is the crystal growth rate, and LC is the crystal
length. When integrated, this population balance will generate the crystal size distribution as a
function of mean residence time. Thus, the mean residence time is also an important design
parameter for MSMPRs to ensure the formation of properly sized crystals. The crystallizer
volume must be large enough to provide adequate mean residence time at the specified design
flow rate, otherwise this criterion has failed and the MSMPR is considered ‘inappropriate’ for
the process.
Appendix Section A.4 provides four tables that describe the MSMPR selection process: (1)
snapshot of the Process Input Spreadsheet, (2) a list of the require Equipment Parameter Inputs,
(3) a list of the design criteria, and (4) a list of the required calculations for MSMPR
identification.
5.7. Equipment Selection: Motionless Mixer-specific Design Criteria
5.7.1 Pressure Drop Calculation
The pressure requirement calculation for motionless mixers requires a pressure-drop calculation
at the design flow rate to estimate the maximum inlet pressure. Because motionless mixers have
proprietary designs for their tortuous paths, the vendors often supply the correlation or a graph
R(nc×GC)
RLC= −
*(nc)
ï-QHLL«‘4

59
that shows the relationship between flow rate and pressure drop. These pressure-drop
correlations for off-the-shelf motionless mixers were added into the calculation spreadsheet. If
the maximum inlet pressure exceeds the maximum allowable pressure for the motionless mixer,
the mixer is considered unusable for the process.
5.7.2 Energy Dissipation Requirement
To maintain the same mixing properties, such as mass transfer, at different production scales, the
energy dissipation of the mixer must remain constant [30]. As such, in the Process Inputs
spreadsheet, the user must specify a minimum and maximum range of energy dissipation desired.
Using Equation 27, the energy dissipation across the motionless mixer can be estimated. If the
dissipation falls within the user-specified range of desired energy dissipations, the mixer passes
this criterion.
Appendix Section A.1 provides four tables that describe the CSTR selection process: (1)
snapshot of the Process Input Spreadsheet, (2) a list of the require Equipment Parameter Inputs,
(3) a list of the design criteria, and (4) a list of the required calculations for CSTR identification.
5.8 Equipment Selection for Multiple Processes
The previous sections of this chapter discuss the design criteria in detail that determine the
usability of an equipment model for a specific continuous synthesis process. In order to identify
strong candidates for a flexible manufacturing platform, usable equipment models must be
identified for multiple processes. The Process Input spreadsheets must be built to allow users to
enter chemical and fluid property values for multiple synthesis processes, and the Calculation

60
Spreadsheet must evaluate each equipment make and model for each synthesis process.
Furthermore, the calculation spreadsheet shall make note of the number of processes for which
an equipment model is usable (i.e., passes all design criteria). The equipment model(s) that is
appropriate for the most processes is considered the most flexible.
5.9 Equipment Selection: Other Equipment Information
Because non-engineering considerations such as cost and footprint often affect the equipment
selection process, this information is also stored for each make and model of equipment in the
‘Equipment Inputs’ spreadsheet database. The user can then use the feature-based analysis
described in the next section to easily categorize equipment based on non-design features as well.
Furthermore, the equipment selector tool allows users to specify the quantity of each product to
be purchased and whether he or she desires to place the equipment in series or parallel. For
example, if a user desires a 5 mL PFR, he or she has the option of purchasing two 2.5 mL PFRs
and placing them in parallel or in series to achieve the desired operation. The information about
the quantity of each equipment model desired and their arrangement (series or parallel) is stored
in the “Equipment Inputs” spreadsheet. A snapshot of this spreadsheet can be found in the
Appendix for each equipment technology.
5.10 Equipment Selection: Feature-based Analysis
In the Results Spreadsheet, a pivot table will be available to quickly sort each equipment model
based on feature (e.g., highest to lowest flexibility, highest to lowest cost, and highest to lowest

61
pressure drop). By graphically expressing such information, the user can visually and more
quickly identify the most desirable equipment based on feature or cost.
Chapter 6: Case Study Analysis
The tool described in Chapter 5 was built and tested for choosing equipment for a continuous
manufacturing experiment led by the Pivotal Drug Substance organization at Amgen. Because
of the proprietary nature of the experiment, specific data and input values are not discussed in
detail. Instead, this chapter compares the equipment identification results using the new tool
with the results from the original equipment selection process. The specific names of each
equipment model and vendor have also been redacted and replaced with generic names.
6.1 Case Study Methodology
The equipment technologies required for the synthesis were identified in the beginning of the
case study. These technologies included MSMPRs, CSTRs, PFRs, and motionless mixers.
Although a tool was built for Packed Bed Reactor (PBR) technology, no off-the-shelf equipment
was available to choose from. For these technologies, the required process and equipment input
parameter values were collected from the literature, estimated using modeling software, or
measured via experimentation for each synthesis step in the process. For this report, the results
for CSTR selection are discussed, as this selection was a main focus during the case study.
Subsequently, the parametric information for each step was input into the new equipment
selector tool spreadsheets. The results were evaluated using four steps:

62
1. The list of equipment identified by the new tool as ‘usable’ for each process was
compared to the list of usable equipment identified by the scientists manually, using the
original equipment selection process.
2. Usable equipment models were ranked based on flexibility and cost to determine if there
were available assets that were cheaper and/or more flexible than the models purchased
or chosen using the original process.
3. Scientists were then interviewed to determine if other features other than flexibility and
cost strongly influenced their decisions. If these ancillary features could not be ranked by
the new tool, they were noted to be added to the tool in the near future.
4. Scientists were interviewed to provide qualitative feedback on the new equipment
selection tool, especially in terms of speed and ease of use.
a. NOTE: if the duration of the project was longer, a formal speed test would be
conducted for an end-to-end equipment selection using the new tool; however,
because of time constraints, interviews were used as approximate estimates for
speed improvements.
6.2 Results: New Tool vs. Original Equipment Selection Process
Snapshots from the CSTR ‘Results’ spreadsheets are shown in the below figures with proprietary
information redacted and made into generic names.
Using the original equipment selection process, the user identified only one usable equipment
model for each equipment technology, due to the time-consuming nature of equipment
identification and selection, while clearly, the new tool identified multiple usable models.

63
For the CSTR, one model that was identified by the new tool but not by the original process was
both the low cost and most flexible asset, because it was usable for the most number of
continuous synthesis processes.
Figure 6: Snapshot of ‘Results’ Spreadsheet for Identifying Usable CSTRs in Case Study

64
Figure 7: Pivot Charts for Visual Feature-Based Analysis Top graph: The number of processes for which a CSTR make/model is suitable
Bottom graph: The cost of each CSTR make/model
Although this equipment model was the lowest cost and most flexible, it was not chosen for the
Process Development experiment, because the scientists required an equipment model that had
an automated system for data collection, so that they could collect larger sets of data without the
need for manual process monitoring. Thus, a higher cost, less flexible asset with more robust
data collection features was chosen for the PD experiment. This decision was noted in the team
reflection and interview, and as a future follow-up, the new equipment selection tool should
include the ability to rank equipment based on ancillary features such as the availability of
automated data collection.

65
Although a different equipment model was chosen for the PD study, the team agreed during the
reflection that the lower cost, more flexible asset could be the top candidate for a platform for
commercial manufacturing, where not as much data are needed to be collected as in PD.
During the reflection, users also expressed interest in ranking equipment models based on design
parameters, such as by pressure drop for micromixers. This helped scientists choose the mixer
with the lowest pressure-drop, so that they could use lower cost pumps and piping that generated
less upstream pressure.
Lastly, although a formal speed test was not completed to estimate the time savings by using this
new tool instead of the current equipment selection process, the users confirmed qualitatively in
the interviews and reflections that the tool would indeed save significant time and provide the
team with useful information to make more insightful decisions when purchasing flexible assets.
Chapter 7: Conclusions
7.1 Tool Performance
As discussed in the previous section, the feedback on the tool performance from the subject
matter experts in the Amgen PD organization was that the “one stop shop” tool saved significant
time and improved the business decision-making process in terms of equipment selection.
Furthermore, because the equipment design information was extracted from catalogs and
abstracted into sets of common design parameters, “apples-to-apples” comparisons between
different equipment models were significantly easier.

66
Lastly, the automated identification of usable equipment using spreadsheet engineering
calculations and Boolean logic for multiple processes, along with the ease of use of the pivot
charts for visual analysis, significantly improved the team’s ability to identify lowest cost and the
most flexible equipment. This improvement was considered a significant step towards the
identification of a continuous manufacturing platform.
7.2 Future Studies and Endeavors
While new equipment selector tools were built to identify usable equipment for a multitude of
equipment technologies during this research fellowship as seen in Chapters 4 and 5, numerous
equipment technologies still require tools to be built. These technologies include:
1. Continuous and batch filters and dryers
2. Process Analytical Technology (PAT)
3. Pumps
4. Distillation columns
5. Specialty reactors (e.g., spinning disc reactors)
6. Liquid-liquid extractors
Furthermore, several technologies were identified to have “gaps” in terms of availability of off-
the-shelf equipment models for continuous manufacturing of pharmaceuticals. These include:
1. Continuous filter-dryers
2. Packed Bed Reactors
3. Distillation columns (including solvent swap)
67
4. Liquid-liquid extractors
5. Specialty reactors (e.g., spinning disc reactors)
6. Continuous oscillatory baffled crystallizers
Given the significant demand and lack of supply for off-the-shelf products for these equipment
technologies, it was concluded that there is significant business opportunity for vendors to
collaborate with CM experts to develop off-the-shelf equipment models for these technologies.
7.3 Recommendations
Based on the user feedback that the new equipment selector tool does indeed improve speed and
quality of decision-making for equipment selection, the below subsections detail the
recommended strategy for integrating the new tool into the Process Development Workflow.
7.3.1 Integrating the New Tool with Process Optimization
During the reflection period, a plan was developed to integrate the tool with current process
development practices for the study of continuous manufacturing of small-molecule drugs. The
recommended integration strategy has three key aspects:
1. Create a seamless transfer between process modeling software and laboratory experiment
data tables and the Process Input spreadsheet of the new tool. In other words, the process
input spreadsheets should be formatted so that parametric values can easily be added
from process modeling software, such as DynoChem, or data tables from laboratory
experiments to minimize the time required to transfer data and information.
2. The information about equipment cost and footprint should be tabulated in the selector
tool’s database (‘Equipment Inputs’ spreadsheet), the cost and footprint information for

68
the chosen equipment, along with the raw material information from the ‘Process Inputs’
spreadsheet should be transmitted to the plant simulation experts to determine the cost
effectiveness of the continuous manufacturing process.
3. Based on the results of the plant simulation, if there are any parts of the process (e.g.,
solute concentrations, reaction conditions) that the plant simulation team identifies as cost
reduction areas, the team shall collaborate further with the scientists from Process
Development to further optimize the process.
The aforementioned process optimization strategy with the integrated equipment selector tool is
summarized in Figure 8.
Figure 8: Integration of New Equipment Selector Tool with Process Development Workflow
7.3.2 Publishing the Tool as Public Domain
One major conclusion from the post-project reflection was that the new equipment selection tool
would actually benefit Amgen the most if it was published as property of the public domain.
Process & Equipment Modeling
1. Determineprocess&equipmentperformancerequirements2. CommonlyUsedTools:Dynochem,In-houseTools
Plant Simulation
1. Providecostanalysis&schedulingsimulations todetermineplantrequirements
2. Assistdecision-makerstopursuehighestvalueinvestment
Equipment Selector
Tool
1. Characterizeperformanceforoff-the-shelfequipmentmodels2. Identifyequipmentmodelsthatcansatisfyprocess&equipment
performancerequirements
Optim
izatio
n

69
While improving the framework for identification and selection of flexible equipment using the
new tool can provide a competitive advantage for a company, it was concluded that the
bottleneck for the development of a continuous manufacturing platform was the lack of
availability and variety of off-the-shelf equipment models for the various equipment
technologies listed in Section 7.1. In other words, the new equipment selector tools can benefit
the most from an increase in information about new equipment models, and thus, require vendor
contributions to the Equipment Inputs database.
Therefore, using this tool as a public database for equipment information would facilitate
collaboration between pharmaceutical companies and equipment vendors in terms of not only
gap assessment but also product development for the next generation of continuous
manufacturing equipment.
7.4 Summary
Integrating this new equipment selector tool into the Process Development workflow will likely
help Amgen improve their consistency and speed at which off-the-shelf equipment is identified
to be used for a continuous manufacturing platform for synthetic drug substances and will
improve the speed at which continuous manufacturing processes are optimized. However, as
noted in the case study, there are a significant number of equipment technologies where off-the-
shelf equipment is unavailable, presenting a gap in the assets available on the market. By
publishing the equipment selector tool as public domain, the experts in the pharmaceutical
industry can then use this tool as a basis for collaboration with vendors to discuss industry and
market needs for off-the-shelf equipment and facilitate product development to bridge these gaps.

70
Appendix
A.1: Summary of CSTR Selection Inputs and Calculations
Table A.1.1: Process Inputs Spreadsheet for CSTRs

71
Table A.1.2: Equipment Inputs Spreadsheet for CSTRs

72
DesignCriterion BooleanLogictoPassCriterionMaterialCompatibilityCriterion MaterialConstructionRequirement=MaterialConstructionofEquipmentMax/MinHTFTemperature
CriterionTHTF>MinimumAllowableTempforEquipmentTHTF<MaximumAllowableTempforEquipment
TemperatureDifferenceCriterion THTF-TProcess<MaximumAllowableTemperatureDifferenceImpellerSpeedCriterion ImpellerSpeedRequired<MaximumAllowableImpellerSpeed
Max/MinPressureCriterion OperatingPressure>MinimumAllowablePressureforEquipmentOperatingPressure<MaximumAllowablePressureforEquipment
Max/MinResidenceTimeCriterion ReactorVolume/Q(design)>MinimumDesiredResidenceTimeReactorVolume/Q(design)<MaximumDesiredResidenceTime
Max/MinProcessTempCriterion Tprocess>MinimumAllowableTempforEquipmentTprocess<MaximumAllowableTempforEquipment
Table A.1.3: CSTR Selection/Design Criteria (Make/Model usable if all criteria are passed)

73
RequiredCalculationsforCSTREquipmentIdentification Equation(s) ForwhichDesignCriterion?
ImpellerSpeedforMinimumShear 14
ImpellerSpeedandHTFTemperatureRequirements
ImpellerSpeedforMaximumShear 14
ImpellerSpeedtoJustSuspendLiquid-solidmixture 15
ImpellerSpeedtoJustDisperseLiquid-liquidmixture 16–17
ImpellerSpeedtoachievedesiredPower/Vol 12–13
DesiredImpellerSpeedbasedontheabovecalculations 12
ProcessFluidReynoldsNumber 10
HTFTemperatureRequirement
ProcessFluidPrandtlNumber 9
ProcessNusseltNumber 3
ProcessFluidConvectiveHeatTransferCoefficient 5HeatTransferFluid(HTF)ReynoldsNumber(ifforced
convection/jacketedCSTR)11
HTFDarcyFrictionFactor 7–8
HTFPrandtlNumber 9
HTFNusseltNumber 3
HTFConvectiveHeatTransferCoefficient 6
OverallHeatTransferCoefficient 2
HTFTemperatureRequired 1
ExpectedresidencetimethrougheachCSTRadjustedforthenumberofCSTRsneededandparallelvs.seriesarrangement
18
ResidenceTimeRequirementReactiontime 20
Mixingtime 19
Table A.1.4: CSTR Calculations Required
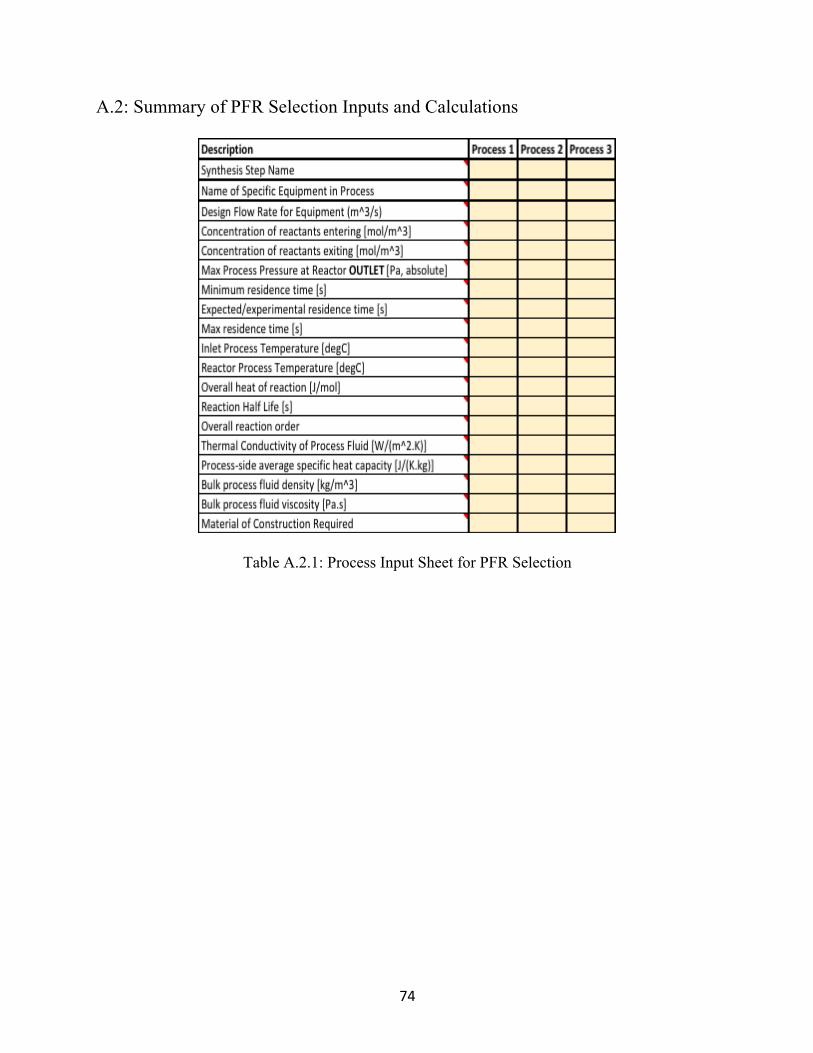
74
A.2: Summary of PFR Selection Inputs and Calculations
Table A.2.1: Process Input Sheet for PFR Selection

75
Table A.2.2: Equipment Input Sheet for PFR Selection

76
DesignCriterionforPFR BooleanLogictoPassCriterion
MaterialResistanceCriterion MaterialConstructionRequirement=MaterialConstructionofEquipment
Max/MinHTFTemperatureCriterion
THTF>MinimumAllowableTempforEquipmentTHTF<MaximumAllowableTempforEquipment
TemperatureDifferenceCriterion THTF–TProcess<MaximumAllowableTemperatureDifference
Max/MinPressureCriterion OperatingPressure>MinimumAllowablePressureforEquipmentOperatingPressure<MaximumAllowablePressureforEquipment
Max/MinResidenceTimeCriterion ReactorVolume/Q(design)>MinimumDesiredResidenceTimeReactorVolume/Q(design)<MaximumDesiredResidenceTime
Max/MinProcessTempCriterion TProcess>MinimumAllowableTempforEquipmentTProcess<MaximumAllowableTempforEquipment
Table A.2.3: PFR Selection/Design Criteria (Make/Model usable if all criteria are passed)

77
RequiredCalculationsforPFREquipmentIdentification Equations ForwhichDesignCriterion?
ProcessFluidReynoldsNumber 11
HTFTemperatureRequirement
ProcessDarcyFrictionFactor(REQUIRESMacroExecution) 7–8
HeatTransferFluid(HTF)ReynoldsNumber(ifforcedconvection/jacketedPFR)
11
HTFRayleighNumber(ifnaturalconvection/Bath) 21-22
HTFDarcyFrictionFactor 7-8
ProcessFluidPrandtlNumber 9
HTFPrandtlNumber 9
ProcessNusseltNumber 3
HTFNusseltNumber 3
ProcessFluidConvectiveHeatTransferCoefficient 6
HTFConvectiveHeatTransferCoefficient 6
OverallHeatTransferCoefficient 1–2
HTFTemperatureRequired 1–2
ExpectedresidencetimethroughPFR 24–25
ResidenceTimeRequirement
Reactiontime 20
ProcessFluidReynoldsNumber 11
DarcyFrictionFactorforProcessFluid(REQUIRESMacroExecution) 7–8
PressuredropthroughPFR 23
EnergydissipationthroughPFR 27
Mixingtime 26
Table A.2.4: PFR Calculations Required

78
A.3: Summary of PBR Selection Inputs and Calculations
Table A.3.1: MSMPR Process Inputs Spreadsheet

79
Table A.3.2 Equipment Inputs Spreadsheet for PBR Selection

80
DesignCriterionforPBR BooleanLogictoPassCriterion
MaterialResistanceCriterion MaterialConstructionRequirement=MaterialConstructionofEquipment
Max/MinHTFTemperatureCriterion
THTF>MinimumAllowableTempforEquipmentTHTF<MaximumAllowableTempforEquipment
TemperatureDifferenceCriterion THTF–TProcess<MaximumAllowableTemperatureDifference
Max/MinPressureCriterionOperatingPressure>MinimumAllowablePressureforEquipmentOperatingPressure<MaximumAllowablePressureforEquipment
Max/MinResidenceTimeCriterionReactorVolume/Q(design)>MinimumDesiredResidenceTimeReactorVolume/Q(design)<MaximumDesiredResidenceTime
Max/MinProcessTempCriterionTProcess>MinimumAllowableTempforEquipmentTProcess<MaximumAllowableTempforEquipment
Table A.3.3 Summary of PBR Design Criteria (Make/Model usable if all criteria are passed)
RequiredCalculationsforPBREquipmentIdentification Equations ForwhichDesign
Criterion?ProcessFluidReynoldsNumber 11
HTFTemperatureRequirement
ProcessDarcyFrictionFactor(REQUIRESMacroExecution) 7–8
HeatTransferFluid(HTF)ReynoldsNumber(ifforcedconvection/jacketedPBR)
11
HTFRayleighNumber(ifnaturalconvection/Bath) 21–22
HTFDarcyFrictionFactor 7-8
ProcessFluidPrandtlNumber 9
HTFPrandtlNumber 9
ProcessNusseltNumber 3
HTFNusseltNumber 3
ProcessFluidConvectiveHeatTransferCoefficient 28–34
HTFConvectiveHeatTransferCoefficient 6
OverallHeatTransferCoefficient 1–2
HTFTemperatureRequired 1–2
ExpectedresidencetimethroughPBR 38
ResidenceTimeRequirement
Reactiontime 20
ProcessFluidReynoldsNumber 35
DarcyFrictionFactorforProcessFluid(REQUIRESMacroExecution) 35-37
PressuredropthroughPBR 23
EnergydissipationthroughPBR 27
Mixingtime 26
Table A.3.4: Summary of PBR Calculations Required

81
A.4: Summary of MSMPR Selection Inputs and Calculations
A.4.1: MSMPR Process Inputs Spreadsheet

82
Table A.4.2 Equipment Inputs Spreadsheet for MSMPR Selection

83
DesignCriterion BooleanLogictoPassCriterion
MaterialResistanceCriterionMaterialConstructionRequirement=MaterialConstructionof
EquipmentMax/MinHTFTemperature
CriterionTHTF>MinimumAllowableTempforEquipmentTHTF<MaximumAllowableTempforEquipment
TemperatureDifferenceCriterion THTF–TProcess<MaximumAllowableTemperatureDifferenceImpellerSpeedCriterion ImpellerSpeedRequired<MaximumAllowableImpellerSpeed
Max/MinPressureCriterionOperatingPressure>MinimumAllowablePressureforEquipmentOperatingPressure<MaximumAllowablePressureforEquipment
Max/MinResidenceTimeCriterion
ReactorVolume/Q(design)>MinimumDesiredResidenceTimeReactorVolume/Q(design)<MaximumDesiredResidenceTime
Max/MinProcessTempCriterionTProcess>MinimumAllowableTempforEquipmentTProcess<MaximumAllowableTempforEquipment
Table A.4.3 Summary of MSMPR Design Criteria (Make/Model usable if all criteria are passed)

84
Calculation Equation DesignRequirement
ImpellerSpeedforMinimumShear 14
ImpellerSpeedandHTFTemperatureRequirement
ImpellerSpeedforMaximumShear 14
ImpellerSpeedtoJust-SuspendedLiquid-solidmixture 15
ImpellerSpeedtoJust-DispersedLiquid-liquidmixture 16–17
ImpellerSpeedtoachievedesiredPower/Volume 12–13
DesiredImpellerSpeedbasedonabovecalculations 12
ProcessFluidReynoldsNumber 10
HTFTemperatureRequirement
ProcessFluidPrandtlNumber 9
ProcessNusseltNumber 3
ProcessFluidConvectiveHeatTransferCoefficient 5
HeatTransferFluid(HTF)ReynoldsNumber(ifforcedconvection/jacketedMSMPR)
11
HTFDarcyFrictionFactor 7–8
HTFPrandtlNumber 9
HTFNusseltNumber 3
HTFConvectiveHeatTransferCoefficient 6
OverallHeatTransferCoefficient 2
HTFTemperatureRequired 1
AdjustedexpectedresidencetimethrougheachMSMPR 40 ResidenceTimeRequirementMixingtime 19
Table A.4.4: Summary of MSMPR Calculations

85
A.5: Summary of Motionless Mixer Selection Inputs and Calculations
Table A.5.1: Motionless mixer Process Inputs Spreadsheet
Table A.5.2: Equipment Inputs Spreadsheet for Motionless Mixer Selection

86
DesignCriterionforPBR BooleanLogictoPassCriterion
MaterialResistanceCriterion MaterialConstructionRequirement=MaterialConstructionofEquipment
Max/MinPressureCriterionOperatingPressure>MinimumAllowablePressureforEquipmentOperatingPressure<MaximumAllowablePressureforEquipment
Max/MinResidenceTimeCriterionReactorVolume/Q(design)>MinimumDesiredResidenceTimeReactorVolume/Q(design)<MaximumDesiredResidenceTime
Max/MinProcessTempCriteriaTProcess>MinimumAllowableTempforEquipmentTProcess<MaximumAllowableTempforEquipment
Table A.5.3: Summary of Motionless Mixer Design Criteria (Make/Model usable if all criteria
are passed)

87
Bibliography
[1] Cha, M. and Yu, F. “Pharma’s first-to-market advantage.” Pharmaceuticals & Medical Products. McKinsey and Company, Aug. 2014.
[2] Adams, C.P. and Brantner, V.V. “Spending on new drug development.” Health Econ.
19.2: 130–141, 2010.
[3] Buchholz, S. “Future manufacturing approaches in the chemical and pharmaceutical industry.” Chemical Engineering and Processing: Process Intensification 49.10: 993–995, 2010.
[4] Singh, R., Godfrey, A., Gregertsen, B., Muller, F., Gernaey, K., Gani, R., and Woodley,
J., “Systematic substrate adoption methodology (SAM) for future flexible, generic pharmaceutical production processes.” Computers and Chemical Engineering 58: 344–368, 2013.
[5] Gutmann, B., Cantillo, D., and Kappe, C.O. “Continuous-flow technology—A tool for
the safe manufacturing of active pharmaceutical ingredients.” Angewandte Chemie International Edition 54.23: 6688–6728, 2015.
[6] Krasberg, N., Hohmann, L., Bieringer, T., Bramsiepe, C., and Kockmann, N. “Selection
of technical reactor equipment for modular, continuous small-scale plants.” Processes, 2(1), 265-292, 2014.
[7] Commenge, J.-M., and Falk, L. "Methodological framework for choice of intensified
equipment and development of innovative technologies.” Chemical Engineering and Processing: Process Intensification 84: 109–127, 2014.
[8] Lee, S.L., O’Connor, T.F., Yang, X., Cruz, C.N., Chatterjee, S., Madurawe, R.D., Moore,
C.M., Lawrence, X.Y. and Woodcock, J. “Modernizing pharmaceutical manufacturing: From batch to continuous production.” Journal of Pharmaceutical Innovation 10(3), pp.191–199, 2015.
[9] Sharratt, P.N., editor, Handbook of Batch Process Design. Springer Science & Business
Media, London, UK, 1997.
[10] Yu, L. “Continuous manufacturing has a strong impact on product quality.” FDA Voice. U.S. Food and Drug Administration,Silver Spring, Maryland, April 12, 2016. Web.
[11] Lee, S., Advancement of Emerging Technology Applications to Modernize the
Pharmaceutical Manufacturing Base Guidance for Industry DRAFT GUIDANCE. U.S. Department of Health and Human Services, Food and Drug Administration, Center for Drug Evaluation and Research (CDER), Silver Spring, Maryland, December 2015.

88
[12] Adamo, A., Beingessner, R.L., Behnam, M., Chen, J., Jamison, T.F., Jensen, K.F., Monbaliu, J.C.M., Myerson, A.S., Revalor, E.M., Snead, D.R. and Stelzer, T., “On-demand continuous-flow production of pharmaceuticals in a compact, reconfigurable system.” Science 351.6281: 61–67, 2016.
[13] Root, C. “Amgen opens biologics manufacturing facility in Singapore.” Bioprocess
Online, November 25, 2014. Web.
[14] Neuman, B.S. “Pharmaceutical industry wastes $50 billion a year due to inefficient manufacturing.” The Source. Washington University in St. Louis, Missouri, October 9, 2016. Web.
[15] Nauman, E.B. Chemical Reactor Design, Optimization, and Scaleup. John Wiley & Sons,
Hoboken, NJ, USA, 2008.
[16] Paul, E.L., Atiemo-Obeng, V.A., and Kresta, S.M., editors. Handbook of Industrial Mixing: Science and Practice. John Wiley & Sons, Hoboken, New Jersey, USA, 2004.
[17] Bell, K.J. “Overall heat transfer coefficient.” In A-to-Z Guide to Thermodynamics, Heat
and Mass Transfer, and Fluids Engineering, 2017. http://www.thermopedia.com/content/1007/
[18] Churchill, S.W. and Chu, H.H., “Correlating equations for laminar and turbulent free
convection from a vertical plate.” International Journal of Heat and Mass Transfer, 18.11: 1323–1329, 1975.
[19] Cullen, P.J., Abatzoglou, N. and Rielly, C.D. eds., Pharmaceutical Blending and Mixing.
John Wiley & Sons, Hoboken, NJ, USA, 2015.
[20] Sánchez Pérez, J.A., Rodríguez Porcel, E.M., Casas López, J.L., Fernández Sevilla, J.M., and Chisti, Y. “Shear rate in stirred tank and bubble column bioreactors.” Chemical Engineering Journal 124.1–3: 1–5, 2006.
[21] Atherton, J.H. and Carpenter, K.J. Process Development: Physicochemical Concepts.
pp.1–88, 1999.
[22] Lines, P.C., and Carpenter, K.J. “The effect of physical property ranges on correlations for minimum impeller speeds to disperse immiscible liquid mixtures.” IChemE Symposium Series 121: 167–182, 1990.
[23] Bergman, T.L., Incropera, F.P., DeWitt, D.P. and Lavine, A.S., Fundamentals of Heat
and Mass Transfer. John Wiley & Sons, Hoboken, New Jersey , USA, 2011.
[24] Colebrook, C.F., Blench, T., Chatley, H., Essex, E., Finniecome, J., Lacey, G., Williamson, J. and Macdonald, G., “Turbulent flow in pipes, with particular reference to the transition region between the smooth and rough pipe laws (includes plates).” Journal of the Institution of Civil Engineers, 12.8: 393–422, 1939.
89
[25] Peters, P.E., Schiffino, R.S. and Harriott, P., “Heat transfer in packed-tube reactors.” Ind. Eng. Chem. Res. 27.2: 226–233, 1988.
[26] Ergun, S. “Fluid flow through packed columns.” Chem. Eng. Prog. 48: 89–94, 1952.
[27] Perry, R.H., and Green, D.W. Perry’s Chemical Engineers’ handbook. McGraw-Hill
Professional, New York, NY, USA, 1999.
[28] Mersmann, A., “Crystallization technology handbook.” Drying Technology 13.4: 1037–1038, 1995.
[29] Mullin, J. Crystallization. Butterworth-Heinemann, Oxford, UK 2001.
[30] Plouffe, P., Bittel, M., Sieber, J., Roberge, D.M. and Macchi, A. “On the scale-up of
micro-reactors for liquid–liquid reactions.” Chemical Engineering Science 143: 216–225, 2016.
[31] Nagy, Z.K. and R. D. Braatz, R.D. “Advances and new directions in crystallization
control.” Annu. Rev. Chem. Biomol. Eng. 3: 55–75, 2012.
[32] Jiang, M. Zhu, Z., Jimenez, E., Xu, J., Papageorgiou, C., Waetzig, J., Hardy, A., and Braatz, R.D. “Continuous-flow tubular crystallization in slugs spontaneously induced by hydrodynamics.” Crystal Growth & Design 14: 851–860, 2014.