Embed Size (px)
Citation preview

Fighting Fires in Testing Times: Exploring a Staged Response
Hypothesis For Blame Management in Two Exam
Fiasco Cases
Christopher Hood, Will Jennings and Brian Hogwood, with Craig Beeston
ESRC Centre for Analysis of Risk and Regulation
The London School of Economics and Political ScienceHoughton StreetLondon WC2A 2AE
tel: +44 (0)20 7955 6577fax: +44 (0)20 7955 6578email: [email protected]
www.lse.ac.uk/collections/carr
the centre for analysis of risk and regulationAn ESRC Research Centre
DISCUSSION PAPER NO: 42DATE: July 2007
Fighting Fires in Testing Times: Exploring a Staged Response Hypothesis for Blame
Management in Two Exam Fiasco Cases
Christopher Hood, Will Jennings and Brian Hogwood, with Craig Beeston
Contents
Abstract ...................................................................................................................... 1
Acknowledgements.................................................................................................... 1
Exam Crises, Blame Avoidance and Staged Retreat ................................................. 2
A Staged-Response Hypothesis for Blame-Avoidance ............................................. 3
Data, Cases and Method ............................................................................................ 6
Results...................................................................................................................... 10
Discussion................................................................................................................ 20
References................................................................................................................ 23
Appendices............................................................................................................... 25
1
The support of the Economic and Social Research Council (ESRC) is gratefully acknowledged. The
work was part of the programme of the ESRC Centre for Analysis of Risk and Regulation.
Published by the Centre for Analysis of Risk and Regulation at the London School of Economics and Political Science
Houghton Street London WC2A 2AE
UK
© London School of Economics and Political Science, 2007
ISBN 0 8532 8067 5
All rights reserved. No part of this publication may be reproduced, stored in a retrieval system, or transmitted, in any form
or by any means, without the prior permission in writing of the publisher, nor be otherwise circulated in any form of binding or cover other than that in which it is published and without a similar condition
including this condition being imposed on the subsequent purchaser.
Printed and bound by Kube, July 2007
2

Fighting Fires in Testing Times: Exploring a Staged Response Hypothesis for Blame
Management in Two Exam Fiasco Cases
Christopher Hood, Will Jennings and Brian Hogwood, with Craig Beeston1
Abstract This paper tests a 'staged-response’ hypothesis about the blame management strategies of public officeholders facing blame firestorms in the media after serious failures in the public-exam system for school-leavers in Scotland in 2000 and England in 2002. The authors develop a method for systematic analysis and comparison of the behaviour of officeholders confronted with such firestorms and construct time series intervention models to estimate the impact of strategies upon the next day’s blame level. The findings do not fit the hypothesis precisely, but are consistent with the underlying thrust of theories of blame avoidance. The findings also raise questions over claims about the effectiveness of presentational strategies for managing blame, the idea that administrative delegation can protect ministers in parliamentary systems when being criticized for operational failures, and that the appointment of inquiries is used to put tricky issues into the political ‘long grass’. Acknowledgements The authors wish to thank Dr Ruth M. Dixon for her work and comments on the manuscript, the three anonymous CARR reviewers for valuable feedback, and CARR for providing funds for research.
1 Correspondence: Will Jennings, Centre for Analysis of Risk and Regulation, London School of Economics and Political Science, Houghton Street, London WC2A 2AE. ([email protected]).
1

Exam Crises, Blame-Avoidance and Staged Retreat Major fiascos in a central function of a key public service provide political scientists with important windows into blame-avoidance dynamics in modern politics and bureaucracy. How do officeholders (ministers, bureaucrats, regulators) behave when a media ‘firestorm’ breaks out over serious public-service mistakes that cannot plausibly be attributed to unforeseeable events alone? The ‘blame-avoidance’ perspective that has developed in political science, particularly since Kent Weaver’s (1986) seminal contribution, would lead us to expect that officeholders facing a media firestorm would follow a ‘staged rearguard action’ pattern, in which they abandon higher-level defensive positions only when such positions become untenable, moving at that point to lower-level defensive positions that come progressively closer to acceptance of culpability. Accordingly, this paper sketches out a simple style-phase model of blame-avoidance dynamics along those lines, and examines how far it fits the responses of officeholders to two similar public-service fiascos in the UK in the early 2000s. One is a major failure (producing missing and incorrect grades) of the public examination system for high-school-leavers in Scotland in the summer of 2000, and the other is a serious failure in the equivalent exam system for England two years later. In both cases the failure concerned a public service that affects a large and growing number of ‘customers’ and requires for its successful operation the full and correct processing of increasingly complex data within a very narrow time-frame. In both cases the extent of the failures was uncertain at the outset, and it took some time before the smoke cleared and the numbers affected were established. And, also in both cases, the consequences of error or delay were substantial, avoidable and salient, since they involved major potential damage to the university entrance prospects of an entire cohort of school-leavers (including, in the English case, the Prime Minister’s son).
We analyze the blame-avoidance dynamics in these two cases by exploring officeholder responses to approximately 100 days of blame in half-a-dozen selected tabloid and broadsheet newspapers, classifying their responses over time and comparing the observed response pattern with the staged-response style-phase model of blame-avoidance that was briefly referred to above and is developed in the next section. We find a loose fit with the style-phase model, in the sense that the pattern of responses by the various officeholders (bureaucratic and ministerial) involved in the two firestorms did have a tendency to admit both problem and responsibility only after passing through stages in which either problem or responsibility were not fully acknowledged. In both cases it took between two and three weeks from the onset of the media firestorm for government ministers to reach the point of full admission of both problem and responsibility. But the fit was loose both in the sense that something more – or other – than ‘problem denial’ was the opening stance in both cases, and that there were ‘aftershocks’ after cathartic episodes, such as ministerial resignations, in which another round of blame management began.
2

A Staged-Response Hypothesis for Blame-Avoidance The literature on blame-avoidance is scattered and diffuse, but at least three major strategies for officeholders can be distinguished from that literature, namely agency strategies (involving attempts to avoid blame by delegation or other ways of limiting formal responsibility), policy strategies (involving attempts to avoid blame by constructing policies or procedures that remove discretion or are otherwise designed to attract the least criticism) and presentational strategies (involving attempts to avoid blame by affecting public attitudes or perceptions, for instance by ‘spin’, excuses or justificatory arguments, in the face of actual or expected criticism) (see Hood 2002; Sulitzeanu-Kenan and Hood 2005). Whereas presentational strategies can be used before or after a ‘blame firestorm’ breaks out, agency and policy strategies need to be in place before the event if they are to deflect blame - a distinction sometimes expressed in separating ‘blame-avoidance’ from ‘blame management’ (see for instance McGraw (1991: 1135) who uses the latter term for after-the-fact blame limitation activity). Once a blame firestorm erupts, officeholders have to rely largely on presentational strategies, though they may revise policy and agency strategies for the future. However, presentational strategies can themselves take several forms. As Figure 1 suggests, officeholders exposed to blame face a basic choice between denying or admitting the existence of some problem in the provision of the service for which they are responsible. Denying the existence of any problem implies there is no blame to be assigned2. However, if officeholders choose to admit there is a problem, the issue of blame necessarily arises and officeholders then face a further choice between denying or admitting responsibility for the problem. Figure 1: Blame-Avoidance Through Problem Denial and Responsibility Denial: Some Basic Choices for Officeholders
“Crisis”
Problem denial Problem admission
Responsibility admission Responsibility denial
Following the idea that officeholders’ presentational responses to crisis and fiasco will normally be dominated by considerations of blame-avoidance, the hypothesis to be explored here is that the basic options depicted in Figure 1 will tend to be adopted 2 As in Felstiner et al’s well-known ‘naming, blaming and claiming’ analysis of the stages of development in legal disputes, and in McGraw’s distinction between justifications and excuses (Felstiner at al 1980, McGraw 1991).
3

in a sequence of stages, as shown in Figure 2. The expectation is that officeholders facing media blame firestorms could normally be expected to stage their responses in the order of (1) problem denial, (2) problem admission but responsibility denial, and (3) both problem and responsibility admission. Figure 2: Blame-Avoidance Stances During Media Blame Firestorms: A Staged-Retreat Hypothesis. (‘The staircase analysis’)
Problem denial A1- Pure denial A2- Qualified denial A3- Denial plus counter-attack
Admit problem, not responsibility
B1- Open stance B2- Claim others responsible
Level of defensiveness
B3- Admit only limited responsibility
Admit problem and take responsibility
C1- Explanatory stance C2- Institutional action C3- Admit personal culpability
t0 t1 t2 t3
Time in duration of firestorm
We would expect problem denial to be the preferred initial position for would-be blame-avoiding officeholders since, as already noted, if it can be plausibly maintained that there is no (real) problem – that is, no significant avoidable loss, risk or harm – then the issue of blame cannot arise. So our expectation is that only if the problem denial stance is, or becomes, unfeasible, will officeholders choose a problem admission stance of some kind. And even then we might expect officeholders’ preferred initial position to be one in which problem admission is matched with responsibility denial (that is, claiming that blame has yet to be determined or that it lies elsewhere). And only if that position becomes untenable might we expect officeholders to move to a third and less politically palatable stage, namely admission both that there is a problem and that the officeholder has some degree of responsibility for it. In suggesting that blame-avoiding officeholders might ordinarily be expected to stage their responses to a blame firestorm in that sequence, we do not argue that every such firestorm will follow such a pattern. For some kinds of crisis, a stance of problem denial may be short-lived or altogether indefensible from the outset, so that officeholders are likely to move immediately to the ‘problem admission, responsibility denial’ phase. Similarly, we might expect some kinds of crisis never to
4

go beyond the stage of problem denial or of problem admission but denial of responsibility. Only if pressure is sustained over a period might we expect those more exposed defensive positions on the bottom-right corner of the map in Figure 2 to be reached. But if officeholders do in fact move straight to the stage of admitting responsibility, we would clearly need to modify the ideas discussed earlier of blame avoidance as a dominant bureaucratic and political imperative, and conclude that officeholder behaviour is better explained by other kinds of imperative. More tentatively, we can distinguish some different forms or variants of each of those three officeholder stances, which are described in Appendix 1 and summarized in Figure 2. For the problem denial stance, we can distinguish pure problem denial (in which no problem whatsoever is acknowledged by officeholders) from a more qualified type of problem denial (in which the existence of some problem is acknowledged, but accompanied by a denial that the problem in question is serious or significant, or by justificatory arguments to the effect that the problem is really part of a desirable change, for instance short-term pain for long-term gain). We can also distinguish simple problem denial of either type from the sort of problem denial that is accompanied by a counter-attack on those who assert there is a problem (for instance, in the form of allegations of ulterior political motives on the part of those raising the issue (see Kurtz 1998: 302), threats of sanctions against moles or whistle-blowers, attempts to shift the onus of proof from the accused to the critics). For the ‘problem admission but responsibility denial’ stance, we can similarly distinguish an open stance on who might be responsible (for instance, when some inquiry is set up to discover who might be to blame for the problem) from a stance definitely attributing responsibility (but to others, in the classic blame-shifting mode). Further, we can distinguish pure responsibility denial from a more qualified type of denial. Examples of qualified denial might include officeholders offering excuses or pleas of mitigation, accepting only technical rather than real responsibility, or only minor responsibility rather than serious culpability on their part. For the ‘problem and responsibility admission’ stance, we can distinguish the sort of response that ends with offering explanations of what went wrong from responses that invoke remedial action of some kind on the part of the officeholders’ organization (such as official apologies, compensatory action, staff dismissals or discipline). We can in turn distinguish both of those responses from that in which officeholders accept significant personal culpability for what went wrong, and offer some act of personal penitence or resignation (as for instance with US President Bill Clinton’s shift from his original ‘privacy’ stance to one of confessional contrition over the Lewinsky affair in 1998 (see Lee and Barton 2003)). Overall, the style-phase hypothesis we explore here, as depicted in Figure 2, is the idea that officeholders exposed to a continuing media firestorm will in general follow a ‘staged retreat under fire,’ moving from problem denial through problem admission and responsibility denial to problem and responsibility admission. We do not necessarily expect the different forms or variants (e.g. A1, A2, A3) of the three main types of response to come in any particular sequence, because there is no obvious logic that would allow us to posit those as logical stages of retreat.
5

Data, Cases and Method To explore the staged-response hypothesis of responses to blame, as set out in the previous section, we explore officeholders’ responses to approximately 100 days of media blame firestorms in the two exam-grading-fiasco cases mentioned earlier – that of Scotland in the summer of 2000 and of England in 2002. In both cases, the firestorms followed major avoidable errors potentially affecting the university entrance prospects of an initially unknown number of teenage school-leavers, resulting from administrative reorganization, IT developments, human error or inappropriate interventions. Both involved formal systems of ministerial responsibility to legislatures of which the ministers are members. Both involved Labour (or Labour-dominated) executives following though on policies begun under a previous Conservative government. And in both cases a key part of the problem arose from modularization of previously simpler examinations (meaning a much larger number of grades to be collected, processed and collated). Briefly, the chain of events is shown in Table 1 (page 7).
In Scotland, significant errors occurred in the marking of ‘higher’ examinations (broadly equivalent to university entrance) in the summer of 2000. Those errors resulted from the interaction of three separate but simultaneous developments. One was the introduction of a new public-exam qualification at a higher level, which was called ‘Higher Still’. The second was the merger of two previously separate examination boards (Scotvec and SCE) into a single organization, and the third was the introduction of a new IT system to support the processing of exam results. According to a report produced later in 2000 on the Scottish Qualifications Authority, some 16,748 Scottish candidates out of a total of approximately 147,000 (and approximately 2.7 per cent of results) were affected by missing or incomplete data, leading to a fivefold increase in urgent appeals for university entrance (Deloitte and Touche 2000, sec 1.1 and 3.2.2). As Table 1 shows, at the beginning of August in that year, immediately before results were due to be notified to candidates, the bureaucratic agency responsible (the Scottish Qualifications Authority) informed the Scottish Executive (the executive arm of the then newly-established Scottish Parliament) that there were around 5,000 missing unit results affecting some 4,000 candidates. But the eventual total proved to be much higher than that, and the problems quickly came to the attention of the news media as anxious students and their parents expressed their concerns3.
In the case of England, problems with the A-Level public exams (broadly equivalent to university entrance) in the summer of 2002 were much slower in coming to light in media discussion than those experienced in Scotland, mainly because there were no missing results on the day that exam results were due to be notified to candidates. The problem in England, in contrast to the Scottish case, was not a failure of information management and processing producing missing or incomplete results, but rather confusion about the appropriate standards, producing the allegation that ‘grade boundaries’ of examination results, particularly for a newly-introduced ‘A2’ component of the examinations, had been altered at the behest of the heads of England’s three examination boards to an extent greater than those officially recomm-
3 For accounts of the problem and how it was handled, see Raffe, Howieson and Tinklin (2000) and Education and Culture Committee (Scottish Parliament) (2000).
6

7
Table 1: A Brief Chronology of the Two Cases (Highlighted date = ‘Day 0’)
Scotland 2000 England 2002 28 Jun: SQA chief executive claims SQA is on course for 10 August deadline
19 Jun: Five-year review of QCA recommends unchanged function & status
26 Jul: unminuted meeting between chair of QCA and chief execs of exam boards interpreted by exam boards as pressure to contain increase in awards of top grades
9 Aug: SQA press release claims successful delivery of results, but at press conference SQA announces results for 1,200 candidates are missing. Minister for Children and Education announces review
10 August: Results due 15 August: Results date 12 Aug: SQA Chief Executive 'resigns' 13 Aug: SQA announces validation check 18 Aug: SQA announces 5,000 (5%) of Higher and CYYS affected by incomplete data
20 Aug: SQA announces 16,700 pupils' results (2.7%) inaccurate or incomplete
30 Aug: SQA Head of Operations suspended and Director of Rewards 'relinquished his position'
1 Sep: Observer runs story about pupil with previous 'A's getting unclassified grades
6 Sep: 2 Scottish Parliament Committees (Education, Culture & Sport and Enterprise and Lifelong Learning) announce inquiries
mid-Sep: QCA orders OCR to report findings of internal inquiry
20 Sep: Completion of results of urgent appeals (for university or college entry)
20 Sep: terms of reference of Tomlinson inquiry into A level standards announced
24 Sep: new chief exec of QCA reports that only 979 OCR candidates have AAU profiles (0.5%)
27 Sep: Tomlinson interim report published, recommending regrading of some A2 units. Chair of QCA 'resigns'
14 Oct: Report on Outcomes of Review of A-Level Grading: 9,800 candidate entries in 18 units had unit grades changes (all OCR). 1,1945 received at least one revised A/AS level grade (of whom 168 eligible to switch to first choice university)
31 Oct: Deloitte Touche Report published 24 Oct: Estelle Morris resigns as Education Secretary. New QCA chair announced
2 Dec: Tomlinson Final Report published

ended, perhaps to allay recurrent public and media concerns about alleged devaluation of A-Level standards (see Education Guardian 2002; Lightfoot 2005). A later report by a former senior civil servant identified some 104 individual units or modules where such interventions had apparently occurred, leading to a re-grading exercise for over 300,000 entries submitted by 91,525 candidates. Some 9,800 candidates (out of a total of 258,000) had their grades within units (that is, components of their courses) improved after this re-grading exercise. Of those, 1,945 candidates (2.1 per cent of those re-graded) received higher overall exam grades in their university entrance AS and A-Level examinations (see Tomlinson 2002, Introduction para 10). The grades that proved to be problematic were concentrated in only one of the three English examination boards, namely OCR (the Oxford, Cambridge and RSA Board), for which 29 per cent of total entries submitted were corrected in the re-grading exercise.
Those numbers suggest that the relative scale of the problem in England, in terms of the proportion of school-leaver candidates eventually found to be affected by faulty exam grading, was considerably smaller than applied to the Scottish case. Moreover, in sharp contrast to the Scottish case, the number of candidates eventually found to be wrongly graded in England was smaller rather than larger than the early official estimates had suggested. However, as we shall see shortly, the political consequences were if anything greater in the English case. Furthermore, the details set out above were not known at the time when the grading problems first came to light and the media firestorm was at its height. For some time, there was uncertainty about the number of candidates affected, and the effect on their prospects for university entrance were unknown - leading to a high level of anxiety and public recrimination in both cases.
For this analysis, the ‘heat’ coming onto the relevant officeholders from the media in the aftermath of the exam crises was explored by identifying all the stories appearing in a set of six major newspapers (detailed in Appendix 2) for each day of approximately one hundred days4 after the relevant exams results were announced, and grading each of those day’s stories according to a ‘blame thermometer’ to reflect the degree of blame they represented. The ‘blame thermometer’ that was used is shown in Appendix 3, and it represents an attempt to describe a spectrum running from a wholly benign environment when even the ‘usual suspect’ opponents of a government or officeholder show support for their policies and actions to, at the opposite extreme, a position in which even the corresponding ‘usual suspect’ supporters, such as cronies and ‘payroll voters’, have turned hostile and are calling for officeholders’ resignations. Accordingly, Figure 3 (page 13) shows the ‘blame pattern’ represented by each of these cases, as a product of the number of stories and the level of blame they involved. As can be seen, there were significantly more press stories about the Scottish exam fiasco than the corresponding English one (431 against 231), and higher proportionate levels of blame, though both cases attracted substantial media coverage. The old adage that ‘the fire that burns half as long burns twice as bright’ does not seem quite to apply here. It is true that the shorter-lived English media blaze did burn more brightly than its Scottish counterpart for a short period and it is also true that in both cases, the storm was at its height for a few 4 . Though ‘a hundred days’ is a much-invoked unit of political time, we took that only as an approximate guide to the duration of the ‘blame episode’ in these cases, as Figure 3 shows. In both cases ‘day 1’ represents the day on which the exam results were announced, and the analysis is extended to the final point of significant press coverage approximately 100 days out from day 1.
8

weeks, represented by the product of high press coverage and a high proportion of ‘top-blame-level’ stories. But as Figure 3 shows, there were subsequent flare-ups and aftershocks reflecting the reporting of inquiries, legislative debates and committee hearings. Against the development of the media firestorms represented by Figure 3, what were the responses of the high officeholders in the relevant governments? In this analysis the responses of two sets of officeholders were explored (Figure 4, page 14). One was that of the education ministers in the parliamentary government systems involved. In the English case, it was the education minister in the Westminster parliament, Estelle Morris, who resigned on day 71 after exam results came out (the Prime Minister, Tony Blair, offered a public apology on day 50 but the education minister continued to blame ‘the system’ at that point). In the Scottish case, the ministers concerned were members of the Scottish Executive who had been elected in the previous year when a separate legislature for Scotland was established to supersede the previous structure of administrative devolution to a set of offices headed by a UK cabinet minister. Responsibility for the Scottish Qualifications Authority (the body that administered the exams) turned out to be ambiguously determined between the ‘Lifelong Learning’ minister and the education minister. The former minister offered a public apology on days 13 and 14 of the firestorm but did not resign; the latter, Sam Galbraith, was moved sideways (to Environment) in a reshuffle on day 82 of the firestorm, and the new education minister, Jack McConnell, proceeded to sack the members of the Scottish Qualifications Authority board immediately after his appointment.
The other set of officeholders examined in this analysis were those in the exam bureaucracies concerned, comprising examination boards and exam regulation bodies.5 The structure of these bodies was subtly different between the two countries, but in ways that are quite important for ‘agency strategies’ for blame-avoidance. In Scotland, there was a single examination body (the Scottish Qualifications Authority, as already mentioned), whose chief executive resigned on day 3 of the firestorm, leaving ministers with no-one else to fire (until the members of the SQA board were sacked on day 87). In the English case, there was a double-decker structure, comprising both a number of examination boards responsible for organizing the grading of the exams, and a regulatory structure (the Qualifications and Curriculum Authority) to oversee the exam boards. The education minister sacked the head of the QCA on day 45 (who proceeded to deny responsibility and attack his former boss). But the head of the examination board principally involved, the OCR, remained in office and did not accept personal responsibility for the problems at any point.6 To explore the responses of those two sets of officeholders systematically over the period of the two firestorms, we categorized the responses of each set of officeholders to each of the stories that were shown in Figure 3. Their responses were categorized into the three types (with the nine sub-types) described in Appendix 1 and summarized in Figure 2, and we analyzed the time-distribution of those responses across the approximately 100 days of firestorm in each case. We then explored the 5 . In principle we might also extend the analysis to the bureaucrats in the ministerial departments, but in practice these actors were not readily identifiable in the analysis described below. 6 . Indeed, the minister had no legal powers to dismiss him, since OCR is not formally a public sector body.
9

pattern of those responses in two ways. One was to see how far officeholder responses over time corresponded to the ‘staged-retreat’ pattern, as discussed in the previous section. The other was to explore the relationship between officeholders’ responses on one day and the level of blame appearing in the press on subsequent days, to see how far those responses were followed by a calming or an exacerbation of the firestorm. Results Figure 4 (page 14) shows the time-pattern of responses for ministers as a group in the two countries and for the exam bureaucracies – the Scottish Qualifications Authority in the Scottish case and the Examination Boards (chiefly OCR) and Qualifications and Curriculum Authority in the English case. Appendix 4 breaks those responses down further into the nine sub-categories identified in Figure 2.
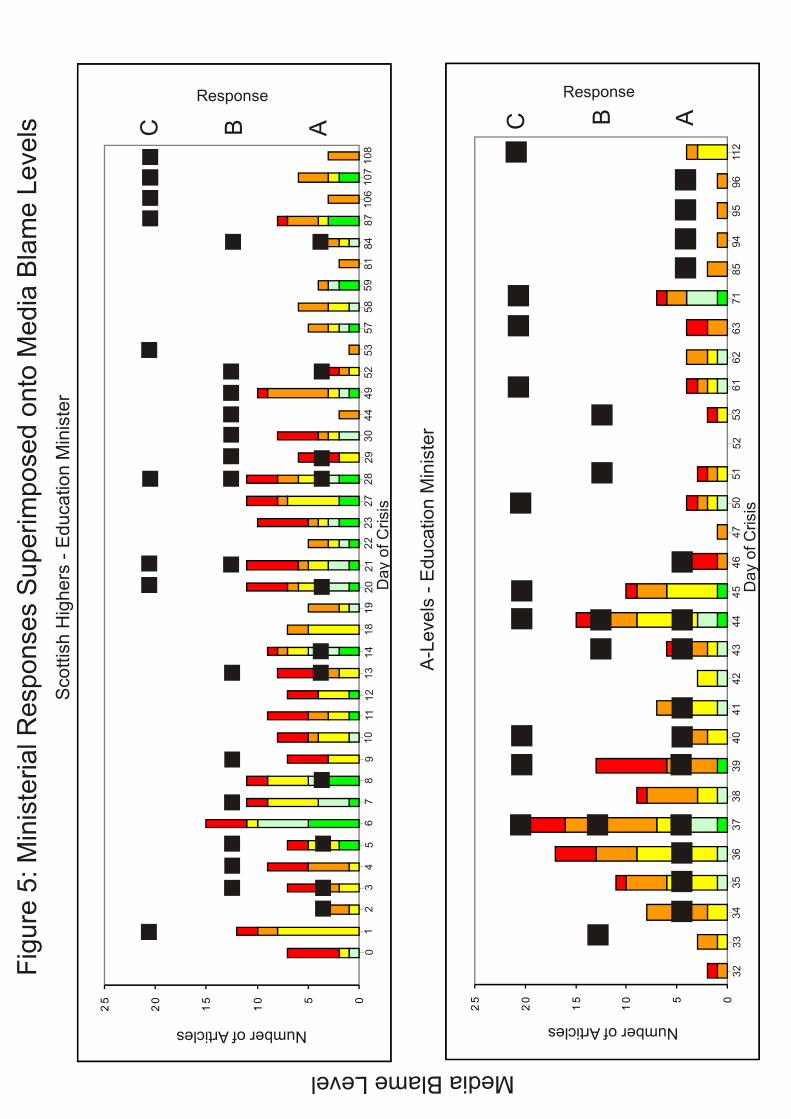
Figures 5 and 6 (pages 15 and 16) superimpose those responses onto the chart of media ‘firestorms’ shown in Figure 3 for the ministerial actors and the bureaucracies respectively. To show the pattern diagrammatically on a single page, we have excluded the numerous ‘no response’ days in the run of approximately one hundred days selected for each case. So the figures represent days of action only. However, in the analysis we also considered ‘no response’ as a strategic choice, as will be discussed shortly.
As far as education ministers’ responses are concerned, Figures 4 and 5 and Appendix 4 show that in neither case did the pattern of response exactly fit the simple ‘staircase’ progression – or ‘staged retreat’ hypothesis – that was portrayed in Figure 2. But, there are key parts of the action that approximate to that progression, for example the Scottish pattern from day 28 to the end and the English pattern from day 34 to 40, 41 to 45 and 46 to 71. The opening pattern of the action sequence (which, as already noted, began much later after results came out in England than in Scotland) is much messier than the ‘staircase progression’ depicted in Figure 2 suggested, with announcement of inquiries (B2) in both cases coming before problem denial, and responses including elements of C2 (announcements of organizational remedies short of resignation) occurred early in the sequence – before the first problem denial response in Scotland and shortly after it in England. In Scotland, as already noted, the head of the exam bureaucracy resigned very early in the picture, on day 3, and by then ministers had already announced an inquiry (on day –1), meaning that they had run out of their heaviest blame-avoidance ammunition early in the sequence. Moreover, in both cases there are signs of a double cycle as the stories and the blaming went on, with a new cycle starting in Scotland at about day 28 – after the resignation of the top exam bureaucrat on day 3 and the eventual acceptance by the “Lifelong Learning” minister of responsibility for the actions of the SQA on days 13 and 14 - and in England at about day 51 - after the head of the English QCA had been sacked and produced damaging allegations about ministerial involvement which required a new round of defensive responses. There were evidently ‘aftershock’ responses too, particularly in the English case where the discovery that the number of students affected seemed to be smaller than had originally been supposed opened the door to a new round of problem denial on day 85 and 94 to 97.
10

However, if we step back from such details, the broader observed pattern does fit the expected one in some important ways. As Figure 4 and Appendix 4 show, from the outset of the relevant ‘firestorm’ it took 14 days in Scotland for ministers to adopt a ‘C3’ response (that is, a relatively full admission of both problem and responsibility), and in England it took 18 days after the commencement of the firestorm. In both cases, Figure 4 shows that C3 comes after various blame-avoidance responses of types A and B, and in the very broad sense fit the idea of a ‘staged retreat.’ In England, ministerial resignation only came after all the alternative responses (as described in Figure 2) had been used. In Scotland there was no ministerial resignation (as explained, the Lifelong Learning minister took responsibility but did not resign and the education minister did not resign either, but was eventually reshuffled late in the sequence), but here too we see all of the other types of responses deployed by ministers, with the sole exception of B3 (that is, acceptance of only minor or technical responsibility). Turning to the analysis shown in Figure 6 (with further detail in Appendix 4), exploring the responses of the examination bureaucracies against the media heat in the two cases, we can see that the Scottish Qualifications Authority had many more ‘days of action’ than its English counterparts. We can also see that the SQA’s responses covered the whole range included in Figure 2, in several iterations – perhaps reflecting the greater seriousness of the problem in the Scottish case and the much higher level of media coverage. In contrast to the ministers of the Scottish Executive, the SQA from day 1 (actually from day –2!) made responses at the third level represented in Figure 2 – that is, admission of both problem and responsibility, with six days of ‘C3’ responses – including the resignation of the head of the body on day 3 - in contrast to three days of such responses by Scottish Executive ministers. This bureaucracy evidently ‘took the rap’ from the outset. By contrast, the equivalent English bureaucracies seem to show a less extreme and certainly less drawn-out pattern of response. As can be seen from Figure 6 and Appendix 4, the English QCA responded largely with variants of problem denial, with only eight days of responses that acknowledged a problem but denied responsibility, and no C-type responses at all (as explained, the head of the QCA was sacked by the minister on day 45, but did not resign and did not accept responsibility for the problems, so we did not count that as a C3 response). Even OCR, the English exam board in which a substantial number of grades in the affected subjects turned out to be wrong, showed far less in the way of penitential C-type responses than the SQA (a total of 5 days compared to 31) and never reached the stage of C3 at all.
From this analysis, we might conclude that the ‘staircase’ pattern of response depicted in Figure 2 works much less well as a description of the observed pattern for the bureaucracies concerned. In the case of the SQA, the organization seems to have started the action at both ends of the staircase, contrary to prediction (mixing calming noises with apology and resignation right at the outset), and thereafter moved in ways that roughly approximated the ‘staged-retreat’ pattern, for instance between days 23 and 85. In the English case, the QCA chose to stay on the higher part of the staircase throughout, never descending beyond the second landing as it were, and even the OCR exam board had relatively few days of action, in a sequence that does not obviously fit the ‘staircase’ hypothesis.
11

A further question that can be explored from this pattern of responses concerns the relationship between officeholders’ responses at any point in the firestorm, and subsequent developments in the firestorm. We have to be careful about attributing causality in complex conditions where many things are happening simultaneously, but it is illuminating to see whether there is any connection between responses to blame at one point in time and the level of blame that develops at the next point in time. And indeed, such an analysis in these two cases raises some puzzling issues about common propositions in the blame-avoidance literature. To explore further the impact (or lack thereof) of the presentational strategies for handling blame described earlier, time series intervention analysis (Box and Tiao 1975) is used to estimate the effect of discrete events in the presence of noise7. This technique helps distinguish deterministic from stochastic variations in a series with a high degree of confidence. The method is appropriate for this analysis, because what is of interest here is the effect that presentational strategies adopted by officeholders (ministers, in this instance) on a particular day have on the blame level the following day, independent of other effects arising from relationships between blame levels at different points in time. Thus, it restricts specification of the models to pulse inputs (i.e. the temporary, next day impact of the strategies of officeholders). 8 Consider, for example, the analogy between a blame firestorm and the development of a real firestorm. In the latter case, if we want to evaluate the impact of interventions by a fire crew (such as turning on water hoses or creating fire breaks) on the development of a fire over time, we need to control for the inherent dynamics of fire, such as increasing blaze while the combustible material lasts and a dying away as the fire runs out of fuel, plus other variables such as rain or wind speed and direction. The observed size of that firestorm, at a given point in time, is also subject to random fluctuations (i.e. ‘noise’). In this case, those presentational strategies available to officeholders are equivalent to the repertoire of actions a fire crew might undertake, while the next day's level of the blame thermometer is equivalent to the size and intensity of a fire the following day. The Box-Tiao method is premised upon systematic and iterative specification of a model that is consistent with a defined theory of causation. Thus, it is postulated that certain strategies were - on the surface at least - integral to dynamics of blame in each of the cases. Table 2 reports the effects of recorded interventions in each 'blame game' that were tested in order to construct final, reduced versions of the Box-Tiao models. The parameter estimates and diagnostic statistics for both models are reported in Table 3. To start with, the Scottish Higher and A-Level blame series are estimated
7 It is possible to express a model, adapted from Hibbs (1977) and Moe (1982), of dynamic responses of the blame thermometer (Yt) to interventions by officeholders (X1, t−n1 , X2, t−n2 , … Xj, t−nj ) of the form:
µB)(B)(1
θ(B)aθXω...XωXωY
dt0
njtj,jn2t2,2n1t1,1t +−
+++++= −−− ϕ
. That is where ωj is the weighting of an
intervention Xj at a lag of t − nj, at is white noise disturbances, φ is the autoregressive noise parameter, θ is the moving average parameter, θ0 is the deterministic trend, d is the degree of differencing required to achieve stationarity, B is the backshift operator where Yt = BYt−1, and µ is the mean or level of the series.
8 This indicates that an intervention is temporary at time tj, such that ⎪⎩
⎪⎨⎧
=
≠=
j
jj t tif 1
t tif 0 X
12


17
with Box-Jenkins methodology as an autoregressive integrated moving average (ARIMA) (1,0,0), i.e. AR(1), process (Box-Jenkins 1970). This implies that each observation consists of an autoregressive component capturing the effects of past observations(φ), plus a random error component (at). There is no moving average component (θ), which means that errors do not persist in either series. Thus, random fluctuations do not cause the ‘blame game’ to spiral out of control. Also, both series are found to be stationary with the Augmented Dickey-Fuller (1979) test, so there is no evidence of an underlying trend in patterns of blame (i.e. differencing is not required). The related coefficients reported in Table 3 are helpful for understanding the conditions for blame management faced by officeholders in Scotland and England. First, the weight of the autoregressive component for the English case (0.86***) is greater than for the Scottish case (0.58***). In practice, this means that past observations are a superior predictor of the present in dynamics of blame for the A-Level fiasco. Second, the white noise disturbances component, which captures the random volatility of each series, is greater in the Scottish case (15.23***) than in the English (9.90***) case. Third, at the same time the mean level of blame (µ) for the Scottish Highers fiasco (17.71***) is significant, unlike its English counterpart. Thus, it appears that blame is more persistent at a higher level (albeit with a higher degree of stochastic variation). As such, the dynamic of the blame game for A-Levels is more sporadic - with brief outbreaks of blaming - and does not revert to a status quo that is significant at the 95 per cent confidence level. For these reasons, we can surmise that blame today tended to be more strongly related to blame yesterday in the English case, and was also less volatile, perhaps creating more scope for blame management than in Scotland. Indeed, what this analysis shows is that none of the key interventions in the Scottish case was correlated at the 95 per cent confidence level with alterations in the next day's blame level on the blame thermometer, suggesting that - outside the estimated autoregressive and noise components of the series - nothing the officeholders did in the way of response acted as either petrol or water on the flames. By contrast, Table 2 shows that in the English case seven out of twelve interventions are correlated at the 95 per cent confidence level with changes in the next day's blame level. Out of those seven cases, the correlation runs in the wrong direction for two of them (suggesting those interventions, both attempts at instant rebuttal, worked as petrol on the flames) and in the anticipated water-on-flames direction for five. Out of those five, all except one (on day 46) involved the C2 strategy of admission of both problem and responsibility coupled with apology and/or institutional remedial action. This analysis suggests intriguing differences between the Scottish and English pattern, and further suggests that some commonly advanced propositions about the effect of various presentational strategies for handling blame require further attention. For those like Bovens et al. (1999), who claim that presentational strategies can be an effective alternative to “agency strategies” in the handling of blame, the apparent lack of impact of any of the interventions tested in the Scottish case on the next day’s blame level, presents something of a challenge. Even in the English case, less than half of the interventions tested appear to have had a water-on-flames impact, and ironically the only full C3 ministerial response – full admission of culpability and

Table 2. Interventions (Scotland and England)
(a) Scotland, Highers, 2000
Description
Day
StrategyT
ype E
ffect?
1: Minister announces inquiry, prom
ises rem
edy etc 1
A2, B
1, C1,
C2
No
2: Drop from
C1 to A
2 blame strategy
2 A
2 N
o
3: Jump from
A2 to B
2 and refusal to resign 9
B2
No
4: Minister refuses to resign, states he w
ill stay to sort out the m
ess 13
A2, A
3, B2
No
5: Minister refuses to go, w
ill give statement to
Parliament in appropriate tim
e for debate 20
A1, A
2, A3,
C2
No
6: Minister plays dow
n extent of problem
23 A
2 N
o
7: Minister apologizes, blam
es SQA
, problem
being resolved, no case for ministers to
answer
28 A
2, B2, C
2 N
o
8: Reserved response (can’t reveal
information)
44
B1
No
9: Minister adm
its problem but says
responsibility limited/partial
49B
2, B3
No
10: Shift from A
3/B1 to C
1 53
C1
No
11: Day the report com
es out: no response M
inisters leave it to the SQA
etc to respond 88
-N
o
(b) England, A-Levels, 2003
Description
D
ayStrategyT
ype E
ffect?
1: Minister denies responsibility and refuses
independent inquiry 35
A1
Yes (but
wrong
direction!)
2: Minister rejects reissue of grades but orders
partial remarking, denies allegations of having
interfered in the process
36 A
1, C2
Yes (but
wrong
direction!)
3: Minister prom
ises remedy. launches
independent inquiry into QC
A etc
37 A
1, B3, C
2 Y
es
4: Minister denies interference, blam
es QC
A
39 A
1, C2
Yes
5: Minister denies involvem
ent, offers to disclose m
inutes 40
A1, C
2 Y
es (90%
confidence level)
6: Minister re-prom
ises remedy and
disciplinary action 44
A1, B
1, C2
No
7: Minister sacks exam
regulator, promises
regrading and new university places for
affected students
45
C2
No
8: Minister counter-attacks Stubbs’ com
plaints 46
A3
Yes
9: Minister and junior m
inister blame Q
CA
, deny responsibility
51B
2N
o
10: Minister re-re-prom
ises remedy, financial
help to universitiess, secure places etc. 63
C2
Yes
11: Minister resigns, accepts full responsibility
71 C
3 N
o
12: Rebuttal of exam
regulator’s allegations 85
A1
No

Table 3. Effects of blame management
(a) Scotland, Highers
Independent Variable Dependent Variable (Xt)
Blame V2
Noise Components and Diagnostics
ARIMA (1,0,0)
Autoregressive (φ) 0.58*** (0.09)
Moving Average (θ) -
Mean (µ) 17.71*** (4.81)
White Noise Disturbances (at) 15.23*** (1.24)
Note: OLS regression coefficients, * p < .10, ** p < .05, *** p < .01 (two-tailed tests) with standard errors in parentheses.
(b) England, A-Levels
Independent Variable Dependent Variable (Xt)
Parameter Day Blame V2
Intervention 1 (I1) ω1 35 28.66*** (5.28)
Intervention 2 (I2) ω2 36 34.08*** (5.32)
Intervention 3 (I3) ω3 37 -38.03*** (3.93)
Intervention 4 (I4) ω4 39 -43.82*** (4.31)
Intervention 5 (I5) ω5 40 -9.09** (3.72)
Intervention 6 (I6) ω6 46 -27.69*** (9.73)
Intervention 7 (I7) ω7 63 -15.92*** (5.33)
Noise Components and Diagnostics
ARIMA (1,0,0)
Autoregressive (φ) 0.86*** (0.04)
Moving Average (θ) -
Mean (µ) 9.22 (9.74)
White Noise Disturbances (at) 9.80*** (0.48)
Note: OLS regression coefficients, * p < .10, ** p < .05, *** p < .01 (two-tailed tests) with standard errors in parentheses.
19

resignation – is not one of them. If, as conventional wisdom often has it, politicians live from day-to-day and are only concerned with the following day’s headlines, it therefore seems that the ‘long grass’ effect does not always come into play immediately, and it may be that in some cases the ‘long grass’ is more about postponing condemnation by legislative committees, audit bodies and the like rather than silencing the media. Further, this analysis suggests that the relative payoff for beleaguered office-holders of doing something rather than doing nothing was rather different in the two cases. ‘Don’t just stand there, do something,’ is a common saying in a crisis, but equally it is often said that ill-judged interventions to try and calm things down can lead, unintentionally, to intensifying the problem. Table 4 compares the payoff of any action on the part of officeholders (that is, any of the blame management strategies analyzed earlier) as against no action in the two cases. What it suggests is that ‘Don’t just stand there, do something’ was, on balance, more likely to produce a reduction in the next day’s blame level than a strategy of no response for all the actors in Table 4 except the English QCA. But this ‘headless chicken’ bias was much stronger for the English education minister than for her Scottish equivalent, who was apparently more in a ‘damned if you do and damned if you don’t’ position – in line with the results of the ‘nothing works’ intervention models reported above. Table 4: ‘Don’t Just Stand There, Do Something!’ Action Versus Inaction and Next Day’s Blame Level (Percentage of next day's press articles assigning more or less blame, or showing no change - divided into instances where organizations did or did not take action. “No Change” is taken to be equal to or less than 2 ‘blame points’.) Education Ministers Exam Bureaucracies Scotland England SQA English
Exam Boards
QCA
Less Blame 42% 50% 52% 54% 33% No Change 25% 41% 26% 23% 33% Did take
action More Blame 33% 9% 21% 23% 33%
Number of articles 35 24 41 13 15
Less Blame 11% 2% 15% 10% 8% No Change 69% 87% 52% 76% 87%
Did not take
action More Blame 19% 11% 32% 14% 5%
Number of articles 78 89 72 100 98 Discussion What conclusions can we draw from this analysis? One is that the ‘staged-retreat hypothesis’ described earlier and set out in Figure 2 is evidently not a universal or mechanical pattern followed by beleaguered ministers and officials, in spite of the analytic appeal of ‘blame-avoidance’. The broad stages posited in Figure 2 did not fully predict the pattern of response to the fiascos, and in both cases B-type responses
20

(admitting there was a problem but not responsibility, particularly by appointing an inquiry) came very early in the sequence. The pattern, particularly in the opening stages, was quite varied, producing the impression of a scatter-gun response rather than the clear sort of ‘staged retreat’ hypothesized in Figure 2. Nevertheless, for ministers at least, the idea that admission of personal responsibility as well as acknowledgement of a problem, comes only (if it comes at all) after a variety of other responses have been adopted, is generally consistent with the pattern of responses in both of these cases.
The messier-than-expected observed response might be accounted for in at least three ways. One is that in cases of this type, personalities and individual styles of officeholders may better account for the variation in responses than the abstract logic of their political positions. For example, if Estelle Morris, the Education Minister in England in 2002, and Sam Galbraith, the Education Minister in Scotland in 2000, had swapped places, we might well have seen differences in the observed pattern of responses in more than detail. While institutionalists insist that institutions matter in politics, individuals matter as well, and only an extension of this sort of analysis to many other cases could indicate how much variation might be accounted for by the particular individuals concerned.
Second, as already mentioned, it seems entirely plausible that in some circumstances the ‘problem denial’ stage of politico-bureaucratic response may simply be untenable from the outset, for instance in cases of major terrorist attack. The Scottish case, where substantial numbers of exam grades were simply missing from the outset might well be considered a fiasco of that type, in which B-type responses come into play at once, and there is no real possibility for a ‘problem denial’ stage9.
A third possible way to explain the apparently messy pattern of observed response, especially in the opening stages of the firestorm, may be that blame of officials (C1-2) may come earlier in the sequence of responses than Figure 2 suggests, and in both cases there was a complex bureaucratic structure that made such a response possible. In both cases ministers took an early stance of blaming the delegated administrative bodies involved, and such responses, especially when accompanied by resignations, early retirements or dismissals, do seem to have been followed by at least a short-lived reduction in the heat of the firestorm.
Another broad conclusion is that the method followed here merits extension and development. Mapping out a sequence of responses against media heat during a defined period offers a way of comparing officeholder responses to blame firestorms that is a way of organizing the conventional case-narrative approach, lends itself to the method of time series intervention analysis and allows for readier and more systematic comparison across jurisdictions - although the coding of responses inevitably involves some tricky judgement calls. In this case, comparing fairly similar cases relatively close in time, between two contiguous countries or states that are part of the same overall jurisdiction and institutional tradition enables the analysis to focus on relatively fine differences in patterns of response. But the method is also applicable
9 . The practical obstacles to the sequencing of a staged-retreat might be compared with the difficulties of ‘street-level’ escalation in the form proposed by theories of responsive regulation (see Ayres and Braithwaite 1992; Braithwaite 2002).
21

in principle to comparisons of firestorms in very different institutional systems and at quite different points in time.
A third broad conclusion is that this analysis raises some rather basic questions about at least two standard assumptions in the blame-avoidance literature. One, as already mentioned, is the conventional assumption that the establishment of inquiries allow officeholders to damp down blame firestorms for a time. In both cases observed here, the establishment of an inquiry seemed to have relatively little effect on the blaze in the short term. It is, however, true that in neither case was a public inquiry of a fully independent judicial type established, and it may be that inquiries of the independent and judicial type might have had more of a discernable ‘long grass’ effect than seemed to apply here.
The other question raised by this analysis relates to an equally conventional assumption in blame-avoidance analysis, namely that administrative delegation can help to shield ministers from political heat when administrative fiascos come to light. That assumption would lead us to expect the ability for ministers to avoid having to make C3 responses to be conditioned by the extent to which they had delegated responsibility in advance, in a way that allowed them to blame or fire those delegatees when trouble struck. But in this case, the ministerial survival rate was no better in the country in which delegation was more extensive (England) than in the country where there were fewer delegates to blame and fire when the heat came on (Scotland). And that, added to the wide variety of outcomes in the relationship between types of blame-avoidance response and the blame level in the following day’s media stories, suggests that blame-avoidance is as yet a far-from-determinate science.
22

References
Ayres, I. and Braithwaite, J. (1995). Responsive Regulation: Transcending the Deregulation Debate, Oxford, Oxford University Press
Bovens, M. and ‘t Hart, P. (1996) Understanding Policy Fiascoes, London, Transaction Books
Box, G.E.P., and Jenkins, G.M. (1970) Time Series Analysis: Forecasting and Control. San Francisco: Holden-Day
Box, G.E.P., and Tiao,G.C. (1975) ‘Intervention Analysis with Applications to Economic and Environmental Problems.’ Journal of the American Statistical Association 70 (March): 70-79
Braithwaite, J. (2002). Restorative justice & responsive regulation, Oxford, Oxford University Press.
Deloitte and Touche (2000) A Review into Exam Results Issues Concerning the Scottish Qualifications Authority, Final Report 31 October 2000, Edinburgh, Scottish Qualifications Authority/Deloitte and Touche
Dickey, D.A. and Fuller, W.A. (1979) ‘Distribution of the Estimators for Autoregressive Time Series with a Unit Root’ Journal of the American Statistical Association, 74: 427-431. Education, Culture and Sport Committee (Scottish Parliament) (2000) 11th Report 2000: Exams Results Inquiry, Vol 1 – Report, SP Paper 234 Session 1 (2000), Edinburgh, Scottish Parliament http://www.scottish.parliament.uk/business/committees/historic/education/reports-00/edr00-11-v1-02.htm#05 (accessed April 2006)
Education Guardian (2002) ‘How the Figures Add Up’ Wednesday Oct 16 2002 Guardian Election Coverage 2002 http://education.guardian.co.uk/alevels2002/story/0,,812713,00.html (accessed April 2002)
Felstiner, W.L.F., Abel, R.L. and Sarat, A. (1980) ‘The Emergence and Transformation of Disputes: Naming, Blaming, Claiming’ Law & Society Review 15 (3/4): 631-654
Hibbs, D.A., Jr. (1977). ‘On Analyzing the Effects of Policy Interventions: Box-Jenkins and Box-Tiao vs. Structural Equation Models.’ Sociological Methodology 8: 137-79
Hood, C. (2002) ‘The Risk Game and the Blame Game’ Government and Opposition 37 (1): 15-37
Kurtz, H. (1998) Spin Cycle: Inside the Clinton Propaganda Machine, New York, Free Press
Lee, R. and Barton, M.H. (2003) ‘Clinton’s Rhetoric of Contrition’ Ch 9 in R.E. Denton, Jr and R.L. Holloway (eds) Images, Scandal and Communication Strategies of the Clinton Presidency, Westport, Connecticut, Praeger: 219-46
Lightfoot, L (2005) ‘A-levels Are Getting Easier, Says Report’ Daily Telegraph 15.8.2006: 6
23

McGraw, K.M. (1991) ‘Managing Blame: An Experimental Test of the Effects of Political Accounts’ American Political Science Review 85(4): 1133-1157
Moe, T.M. (1982). ‘Regulatory Performance and Presidential Administration.’ American Journal of Political Science 26 (March): 197-224
Public Administration Select Committee (2005) Government by Inquiry: First Report of Session 2004-5, Vol 1, HC 51-1 2004-5, London, HM Stationery Office
Raffe, D., Howieson, C. and Tinklin, T. (2000) An analysis of the policy process of unification’, ESRC research project on Introducing a Unified System http://www.ces.ed.ac.uk/IUS/IUS_papers/IUSWP2.pdf (accessed April 2006)
Sulitzeanu-Kenan, R. (2006) ‘Blame Avoidance and the Politics of Public Inquiries in the UK 1984-2003’, DPhil thesis, University of Oxford
Sulitzeanu-Kenan, R. and Hood, C. (2005) ‘Blame Avoidance with Adjectives? Motivation, Opportunity, Activity and Outcome’ paper presented at ECPR Joint Sessions, Blame Avoidance and Blame Management Workshop, Granada, Spain,14th-20th April 2005
Tomlinson, M. (2002) Inquiry Into A Level Standards: Final Report, London, Department of Education and Skills
Weaver, K. (1986) ‘The Politics of Blame Avoidance’ Journal of Public Policy 6 (4): 371-98
Wood, B.D. (1988) ‘Principals, Bureaucrats and Responsiveness in Clean Air Enforcements’ American Political Science Review 82 (1): 213-34
Woodhouse, D. (1995) ‘Matrix Churchill: A Case Study in Judicial Inquiries,’ Parliamentary Affairs 48: 24-39
24

Appendix 1: Some Basic Strategic Options for Officeholders Facing Media Firestorms: Denial and Admission of Problem and Responsibility A: Problem Denial B: Problem Admission but
Responsibility Denial C: Problem and Responsibility Admission
1. Pure denial ('crisis, what crisis?')
1. Open stance on who is responsible (announce or agree to investigation to determine who is responsible, without accepting responsibility)
1. Explanation-only response, offering some account of what went wrong, but not accepting culpability
2. Qualified denial (admission that there is some problem but denial that it is serious or significant, e.g. through justificatory arguments)
2. Assert others to be responsible (blame victims, other agents, predecessors, successors, subordinates, super-ordinates, colleagues, etc.)
2. Institutional action-taking response, offering institutional apology, compensation, remedial action (e.g. dismissal or disciplining of subordinates)
3. Denial plus counter-attack (portrayal of critics as whingers, knockers, politically motivated etc., assertion that onus of proof rests on critics, threats of lawsuits, dismissals of moles and leakers, and other sanctions)
3. Admission of some responsibility, but denial of major or ultimate responsibility (e.g. by offering 'wrong kind of snow' excuses or admission of only partial or 'technical' but not substantial responsibility)
3. Admission of personal culpability (e.g. offer act of penance or resignation)
25

Appendix 2: Newspapers Analyzed for ‘Media Heat’ i) Newspapers by Circulation Name Circulation Scotland: Herald 71,689 Sunday Herald 54,625 Evening News1 56,135 Daily Record 412,563 The Scotsman 60,088 Scotland on Sunday 74,362 England: The Times 638,451 Sunday Times 1,140,467 Evening Standard 289,254 The Guardian 335,317 The Observer 402,665 Daily Mail 2,212,727 Figures represent average net circulation for period 28 August –1 October 2006 (www.abc.org.uk) except: 1 www.nsdatabase.co.uk 1 March 2006 ii) Number and Length of Articles on Exam Crises by Newspaper Number of Articles by Length (relative to individual newspaper)
High Average Low Total Scotland (10th August 2000-29th November 2000) Herald 53 92 22 167 Sunday Herald 5 12 2 19 Evening News 11 34 19 64 Daily Record 9 42 7 58 The Scotsman 25 74 8 107 Scotland on Sunday 2 9 5 16 Total 431 England (14th August 2002-4th December 2002) The Times 11 46 7 64 Sunday Times 7 7 1 15 Evening Standard 12 24 7 43 The Guardian 23 32 - 55 The Observer 5 6 1 12 Daily Mail 23 16 3 42 Total 231
26
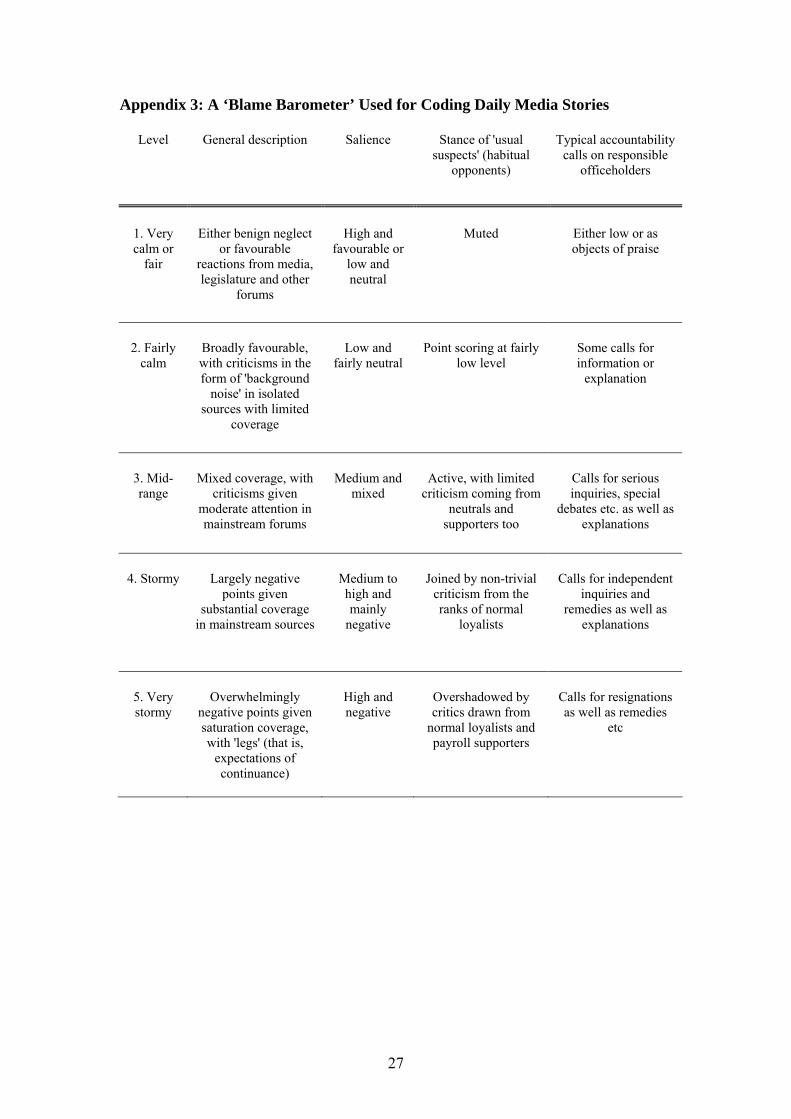
Appendix 3: A ‘Blame Barometer’ Used for Coding Daily Media Stories
Level General description Salience Stance of 'usual suspects' (habitual
opponents)
Typical accountability calls on responsible
officeholders
1. Very calm or
fair
Either benign neglect or favourable
reactions from media, legislature and other
forums
High and favourable or
low and neutral
Muted Either low or as objects of praise
2. Fairly
calm Broadly favourable, with criticisms in the form of 'background
noise' in isolated sources with limited
coverage
Low and fairly neutral
Point scoring at fairly low level
Some calls for information or
explanation
3. Mid-range
Mixed coverage, with criticisms given
moderate attention in mainstream forums
Medium and mixed
Active, with limited criticism coming from
neutrals and supporters too
Calls for serious inquiries, special
debates etc. as well as explanations
4. Stormy Largely negative
points given substantial coverage
in mainstream sources
Medium to high and mainly
negative
Joined by non-trivial criticism from the ranks of normal
loyalists
Calls for independent inquiries and
remedies as well as explanations
5. Very stormy
Overwhelmingly negative points given saturation coverage, with 'legs' (that is,
expectations of continuance)
High and negative
Overshadowed by critics drawn from
normal loyalists and payroll supporters
Calls for resignations as well as remedies
etc
27