Embed Size (px)
Citation preview

General rights Copyright and moral rights for the publications made accessible in the public portal are retained by the authors and/or other copyright owners and it is a condition of accessing publications that users recognise and abide by the legal requirements associated with these rights.
• Users may download and print one copy of any publication from the public portal for the purpose of private study or research. • You may not further distribute the material or use it for any profit-making activity or commercial gain • You may freely distribute the URL identifying the publication in the public portal
If you believe that this document breaches copyright please contact us providing details, and we will remove access to the work immediately and investigate your claim.
Downloaded from orbit.dtu.dk on: Jun 11, 2018
An estimation of population doses from a nuclear plant during normal operation
Forskningscenter Risø, Roskilde
Publication date:1975
Document VersionPublisher's PDF, also known as Version of record
Link back to DTU Orbit
Citation (APA):Nowicki, K. (1975). An estimation of population doses from a nuclear plant during normal operation. (Risø-M;No. 1808).

A. E. K. Risø Risø-M-LaaaJ T W t aid author(s)
An Estimation of population Doses from a
•uclear Power Plant During Normal Operation
t y C. Bowickl
0 m J u l y 1975
Department or group
Health Phys i c s
Group's own registration number(s)
Abstract
Zn this report a model is presented for estima
tion of the potential submersion and inhalation
radiation doses to people located within a dis
tance of 1000 km from a nuclear power plant
during normal operation. The model was used to
calculate these doses for people living 200-
1000 km from a hypothetical nuclear power facil
ity sited near the geographical centre of Den
mark. Two cases of sources are considered for
this situation
- unit release of 15 isotopes of noble gases
and iodines*
- effluent releases from two types of 1000 HNe
Light Hater Power Reactors: PHR and BMR.
Parameter variations were made and analyzed in
order to obtain a better understanding of the
mechanisms of the model.
Copies to
J Available on request {rem the Library «f flw Danish AMIr Xangf Coamnstloa (AtomeaergllfwninHslopens HHMsk), Hie*, Roskilde, Denmark. Telephone! (01) » »1 01. est. » 4 , telex. 5072.

«tW Iff if MSI

- 1 -
CCWTEHTE
Page
1. Introduct ion . , . . . . 3
2, Dos« to Kan - General Calculat ion Scheme 7
3 . Source Tern Models - . . . - 11
3.1. Souxces and Amount« of Radioactivity Contined
in Light Water Power Reactors 11
3 . 2 . Radioactive Eff luent« fro« UfiU 12 3 . 2 . 1 . Introduction 12 3 . 2 . 2 . Origin of the Gsmeou« Radwaste 12
3 . 2 . 2 . 1 . BW System« 12 3 . 2 . 2 . 2 . FWt S y « t < u 13
3 . 2 . 3 . Gaseous Radwaate TreatBent Processes . . IS 3 . 2 . 4 . Principal Parameter« Used In the
Sourc« Ten* c a l c u l a t i o n « 17
4 . Environoiental Transport Model 40
4 . 1 . Introduction 40 4 . 2 . Meteorological Dispersion Pactoi 43
4 . 2 . 1 . Dif fusion Parameter - o 4S 7.
4.3. Depletion of Cloud by Deposition and
Radioactive Decay 48
4.3.1. Depletion of Cloud by Deposition 48
4.3.1.1. Depletion of CJoud by
Dry Deposition 44
4.3.1.2. Depletion of Cloud by
Wet Deposition ., 52
4.3.2. Depletion of Cloud by Radioactive Decay 53 5. Dos« Models 56
5 . 1 . Individual Dot« 56
5 . 1 . 1 . Suimmrsion D««* r a c t c r 57
5 . 1 . 2 . Inhalat ion Dose raC-or 59
5 . 2 . Populat ion Do««« 62
i. n i r t t ' •' nm rs—tiT« 67
» . 1 . » o u w * Team Mg*«l - Oj 67
6 . 1 . 1 , Unit Krleaee Ratei - Q 68
6 . 1 . 2 . Actual U l a i M Itnt«« for PW* an1 WfR . . it
e.2. Hr Trmntpoct Model - C 71
- 2 -
J»9»
5.3. Subversion and Inhalation Individual
Don Model 73
6.3.1. Submersion Individual D D M Modal 71
5.3.2. Inhalation Individual D O M Modal 73
6.4. Submersion and Inhalation Population
D O M Model 74
6.4.1. Submersion Population Dos« ............ 75
6.4.2. Inhalation Population D M * 77
6.4.3. The Population Distribution azouad
Nuclear Power Plants Sited near the
Geographical Centre of Denaark 78
6.5. Sensitivity Studies: Effect« of Parameter
Variations 82
6.5.1. Mixing Depth 82
6.5.2. Stability Class 83
6.5.3. Deposition Velocity S3
6.5.4. Washout Coefficient 83
6.5.5. Rainfall variations 84
7. Suanary 84
Acknowledgements ........................................ 97
References 97
Appendix A - Individual D O M S free, Unit Releases
Appendix B - Population Doses from Unit Releases
Appendix C - Individual and Population Doses from PMt
Releases
Appendix D - Individual and Population Doses fsoa M R
Releases
Appendix B - Variation of Parameters

^ i -
i. IBTSOOOCTIO*
Hith Increasing use of nuclear energy for electrical gener
ation considerable attention baa bean focused on the question of
the radiation doees to Man aad other organises which atqht re-
salt froa ase of asclsar facllitlaa in the electric sowar in
dustry [1,2,3]. The potential lapset on the eavirooaeat fro« the
conatrootlon and operation of unclear facilities includes the
radiological lapset on nan aad other biota fsoa routine operation
of the facilitlea and ttom transportation of radioactive mate
rials (cl«aa feel. Irradiated fuel and vestas).
» a proper evaluation of radiation doses to people and
other organ«—a fro* environaentel radiation sources requires
the swaaetloa of dose contributions from all nuclides and pos
sible exposure pathways-in qaeation. frequently the relative
iaportaaoe of a particular pethway-aucllde combination cannot
be Judged without calculating its contribution to the total
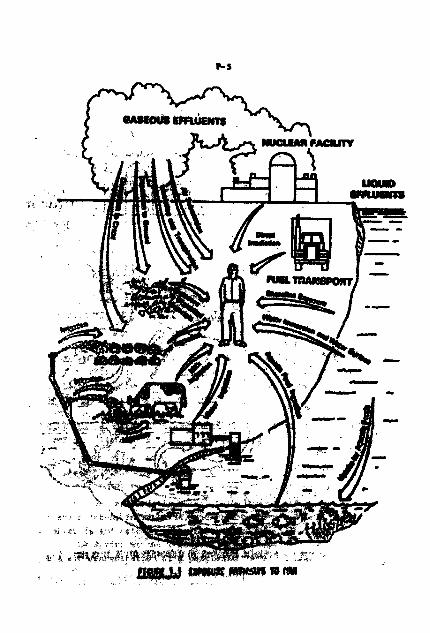
doss. The pathways by which aan and other orgaaiaas in the en-
vlroaasat coald be ayansei Co radiation are shown in figures l-l
and 1-2 respectively.
The exposure pathways for Ban can be classed as those as
sociated with i
a) gaseous effluents - air pathways
b) ligttid effluents - water pathways
e) external radiation f*oc the nuclear power plant or
from transportation of radioactive aaterials to or
froa the plant -direct radiation pathways.
the principal air pathways froa nuclear power plant are
the foOUowingi
• ai§ eobnerslon
- external dnydaote to deposited aatorial
"* i»gae*lo«j #£ fjatd drasMj
- ingestion of aaiaal prodatt*. "
taa principal '»»ta^petlayra f»a naelaar power plant are
tbj following! "'"^"Zi~

* 4 -
- vater iantersion and water surface
- external exposure to shoreline
- Ingestion of water
- ingestion of fish, shellfish and waterfowl
- ingestion of irrigated food crops
- ingestion of products produced by anlaal fed irrigated
foods.
The principal direct radiation pathways from nuclear power
plant are the followingi
- direct radiation frost facility
• exposure during transport of nestes - exposure during transport of fuel .
Many of the pathoays of exposure for organise* other than •en are similar to those for inn. These pathways include Ingestion of wa^er and aquatic foods, sobaersion in a ir , i—eraion in water and exposure to sediment« and shorelines. Other pathways such as inhalation and direct radiation froe air deposition of radionuclides on so i l s are not considered significant in the total dose to such organisms.
F-5

ffgjff 1.2 imsm WTKJAYS TB vxmim mm nsw rew uUEft

- J -
2 . BOSS tO MM - CRURAL CALCUXATIOK SCHEME
The report aaalyaea the) radiation potentially received by the population located up to 1000 kn froa a nuclear power plant during l ta noraal operation. Tan air pathways are coaaldered for 15 laotopea of noble gases and iodines: air subaeralon and inhalation of a i r .
Releases of radioactivity to the environment during normal operation of a nuclear power plant r e m i t in exposure of the population to ionising radiation. The assesannt of the exposure of the population i s dependent upon the types of nuclear f a c i l i t i e s and radioactive mate treatment systems assumed, on the unoertalntles in the role of various processes la transporting radionuclides through the environment leading to human exposure, and on the approximations required in the mathematical aodelllng of these processes [ 2 ] .
In a general study aa t h i s i t i s very d i f f icul t to t*ks in to account a l l possible variations. However, sensit ivity studies were performed to evaluate the effects of uncertainties in the parameters belleved to be most significant in their effects on the dose. Moreover, the doses received by individuala in the vic inity of the nucleer power plant are subject to a wide variation depending on location, age« dietary and other habits, and other s ta t i s t i ca l factors. More generally th i s can be expressed in a dose distribution la tl.s population. The area under the distribution curve represents the total population dose. The assessment of the. total population dose that may result fro« normal operation of a particular nuclear power plant Is dependent apon a master of assumptions. The calcolational Models used srs i generally categorised as follows 1
- - øource tara aodele transport aodels
' »Oures term modelling include* assasaaent of pollutant gen-aratl«« J É ^ / ; i a ^ t o « o « i i f , ' % i ^ l | s ^ r ' a n a chealcal charact e r i s t i c s • § • retens* n r ^ : i t » tn% e*s»spberlc carrier. "*""' Tos wminmAmt ^Æiff^mki "»rsats an est laets of
W-ÉÉ Aéemttition *fc f p t ø J r a l i r point i» th* space-tim*

8 -
continuum. The Dose Modal allows an estlaete of the energy deposition
and biological effectiveness frea exposure to the air concentration of radionuclides.
The general calculation sen—e Of the population dose i» presented in table 1.
Model for ertUaatlno the population doses from a nuclear power plant
tfat'i'l
source T e n Models Environaanb.1 Transport Model«
Radioactive naif-lives
Chewleal and physical behaviour of radionuclides
Production rates
Release rates
Dispersion
Met and dry depletion
Radioactive Decay
Inhalation dose
Distribution of population
Meteorology
Radionuclide source«
air oonoenerafclon to dose conversion factors
Air stoleSody and organ
The determination of radiation dose to saw by tte release of a radioactive Material to the environaeni iavolye« a i«il*ipliei*y of factors. In order to develop satTn»»|lliffar«^rÉailOi|a for radiation dose a variety tens must be coupled te tb* n»«*tifc* of the radionuclide released to, the env*nuieiw_t.; T l ^ are, the » treasier function (T) and d o » a . ; c o i ^ s ^ f * ^ , ^ ^ «ay differ Spending upon tb« rsdlonucH* ( i ) , pathway ^ ' ^ ' organ (j), and group, of peop^ Jn) und^ oofls^station. ^.addition, . the. pathway transtar fuMtKm p p ^«s**r»A. J ^ fn»j>|
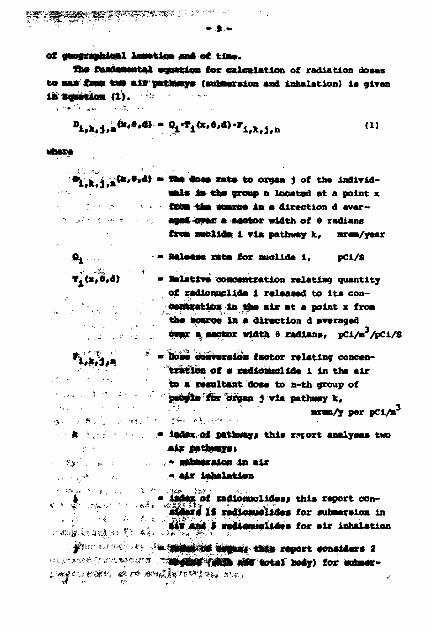
of aeogxaphioal location ea* of t l a s . to* fonaaaantal equation for calculation of radiation doses
to «an frea *M» airpathways (subversion and inhalation) Is given 1« Boaotlo* (1>. - • - -
*l,fc 4,&<*•*»*> * A * **•» *•*• to organ j of the individuals In the group a located at a point x
- fr«a the source i n a direction d aver-'- - ' ' aoad -oyar a sector width of 9 radians
fro« molide i via pathway k, area/year
Qt ,-;, - Hal—a rat« fox nuclide i , pCi/S
Tjdt^/d) - Relative concentration relating quantity of radionuclide 1 released to i t s concentration in the a ir a t a point x fro« the eouroa in a direction d averaged over a, sector width 6 radians« pCi/w.3/pCi/S
' i k j it " """* cMtarwleii factor relating concen-' ' "' * tration of a radionuclide 1 in the a ir
tea resultant dose to n-th group of ' ' ' '" '" -' people for organ j via pathway k,
aran/y per pCl/ta3
- k - . » Index of pathway; this rctort analyses two ; « * T J^awaasjfwi
. , ->» - air inhalation
i „„ . . . . , : " A"*"* o f radloiaiclldes* th i s report con-" ' . V " »l^ar«' H radionwiides for »ubaersion In
""" r , * , ' V air aad 5 radionuclides for air inhalation
-#*"' "••^"•fv - - ' la^B^M M^uri th i s » s o r t oonaiders 2 ::'-•'•." 'v v.-,:-:.-<• ''»»gJttBf-fa«^l ana' total body) for eubaar-
4 " ••?'•

- 10 -
aion and 2 organs for inhalation
(thyroid and total body)
n •> index of group of people; this report con
siders three groups of people (children,
teenagers and adults) for inhalation and
one group for submersion
x - the distance front the sourcei this report
considers distancea up to 1000 ka fro* the
source
d « the direction frea the sourcei this report
examines 12 sectors around the nuclear
power plant
9 • the sector width! in this case the sector
width is j, i.e. a 12-polttt ooapess rose.
The above equation yields the yearly (aurae/y) dose to specific
organ j-th individuals in the group it located at a point x fro«
the source, in a direction d, averaged over a sector width of 9
radians from nuclide i via pathway k. The population dose in Ban*
rea/year to a specific organ j for Individuals in the group n
from nuclide i, via pathway k, is determined by Eultiplylnij the
individual dose to the sane organ j , of the sane group of people
n, from the sane nuclide 1, via the saae pathway k, by the num
ber of the population group n located within the sector in ques
tion. Values of the dose at the point (x,e,d) are assned to be
applicable to all individuals located in that sector (d,») fro«
distance x-Ax to x+fix.

3.
Sine« Light water Reactor Plaata amt) ara by far the pre-dominent type of nuclear power plants being purchased aad installad la the world [1,4,5] at tal« present t i s « , they ara the major subj ec t of thi« report. Tha tao erertnartnant typa« of Light water Powar Beecbors currently la use ara the Boiling water fteactor (BNI), ao oel led becauae t t generates ataaa by direct boiling of water in tha reactor eora, aad tbe rraaaurliad MUr xeactor (PWR) l a wnleh water eeolaat i a net allowed to balk bo l l , but produces ataae l a aa eaternal ataaai eenerator. The endear coaseaents of beta types ace etal lar . To-day the mmelmz feel seed in coaner-e i e l power zeeetor* of the 8MB and PWI typaa eaaslata of antnlun dloeioe - tOB l feat pellet« amflapealetod ia slrcaloy or »tainle«« • tea l cladding { 1 ] .
3 .1 . Source« aad ascent« of Radioactivity confined In Light water
The radioactive substance« that accumulate in the reactors are primarily the result of three processes
- f iss ion which occur« within the uraniua dioxide «K>2) foal pal le ts daring reactor operation,
- f i ss ion of tranp uranlae which occurs outside the fuel cladding,
- neutron activation which Is the process la which neutron« are captvred by the various non-radioactive atomic nuclei
- tlnwwalwur the reactor core region which then beeoaea radioactive. _ ^ t ••
' : Of tea three aroc«««««, f lwion witnia the fuel pellet« 1« by fa* the ap«t pradomlnant aerøie of radioactivity. Under typical operating condition« law quantity of radioactivity contained in tha f W e f a WW than t i * økMttlty of OTHHaantivtty U>, a m v a t t c * aeodast«, throughout t tw>a«B^rMa«»^4a1e ig i^ o*
i|tiøit4ifi{ft%ipipt3t^^ Ma* ^WPWer* the ••war 'ttoVJfØ)Tf|#la- • ( •WWW BMa^i ,J4ft»ar-• j s3 fej -»-, '

- 12 -
3.2. Radioactive Effluents from LWR
3.2.1. Introduction
During normal operation of a LNR there are three kinds of
radweste:
- Gaseous radwaste
- Liquid radwaste
- Solid radwaste
. In this report only gaseous radwaste is considered and only
some isotopes of Iodines and noble gases which constitata the
major radiation hasards in gaseous radwaste (4 ,S, 6 ].
LMRs require equipment for the control of gaseous radioac
tive materials. The gaseous radwaste treatment system« preeeaced
in this report illustrate the methods used to control the ef
fluent gases to the environment. They range from minimal treat
ment with attendant relatively high releases to advanced and
complex treatment systems for which the releases are very low.
In all 16 conceptual gaseous radwaste systems are presented
14,5 ] to cover the range of the state-of-the-art treatment tech
nology for BMR and PHR systems considering ? cases for BWft Caseous
Radwaste Treatment Systems and 9 cases for MR. The cases la each
category show the effects of varying the types and degree of waste
treatment provided. Case Mo. 1 in each category is Intended to
provide a basis for comparison to demonstrate the effectiveness
of the subsequent treatment system. The succeeding cases were
developed to evaluate modifications in radwaste systems to reduce
radioactive emissions.
In considering the discharge of gaseous radioactive effluents
from a U R it is necessary to consider certain distinctions be
tween BMR and PNR design features.
3.2.2. origin of the Caseous Radwaste
3.2.2.1. em Systems. In all BMts the coolant is eifestate*
through the reactor core where steam is produced. The stem* 1*
then routed through the turbine, condensed, and the iwmrtameita
returned to the core. Separate aid« streams of s*IMr* cwolant are
withdrawn from the primary system, processed throaglr the" reMtor
cleaning system, and returned to the reactor. "> ••-,-•> trr*.-.:
-§.

- u -
fan principal aoithtnl aa that affect the concentrations of radloaotiva aateriala la the ntiaary coolant ara
- fission prodact laakaga to the coolant Because of de-facta la the fuel cladding,
- activation product« la tha core.
She vent majority of tha radloauclldea produced by fiaaioa a n retained within taa paUata uatil the foal la eventually removed from taa raaotor aadrapcooaaaad. tone of taa aore volatile (krypton*« amnaae aad lodlnea) flaaloa proancta diffuse ont of tha fuel pallata and nermally oaoapy the aanalar ajaaa bat—in o > foal and cladding. Darin? reactor operation cladding defecta can roault from mechanical or thermal atrasaea, corroalon and other causes aad allow aacape of avail aaoamta of the volatile flaaloa product* into tha primary coolant. Fieslon products alao enter froa the traap araniaa aa tha claddlaa —rfaces, ami« activation product« are generated la the reactor cere.
Cs—one reduestea are removed from the prlaary coolant to the ataoeppere by tha following vays {Which are shown In figure
j - i ) i* .
• - ataea-jet air ejectora
- rddwaste building ventilation ayataa.
'^\/$iØMtøMm' ** * • » > • ***-»* coolant circulate. i» ta j|<Ma« siroait, ataaa being generated la • aecondary circuit. i^^llJ^Mif&^'%ét^i^V^WKkkå^''li^ la than condensed and
to the ataaa f t ^ n i M « . The prlaary coolant Mater flow
" ? fadloectlve »kataa are claesifisd ai
•" -m-fffafSfi . .y^f f * * *»»—*» .eanlna* aiae« aoneist of cat
. ,.•;.:-,.. • <ttm tjaX •nlaa»f»«arMTl,<asjh W War »aver en* raorjula
- 14 -
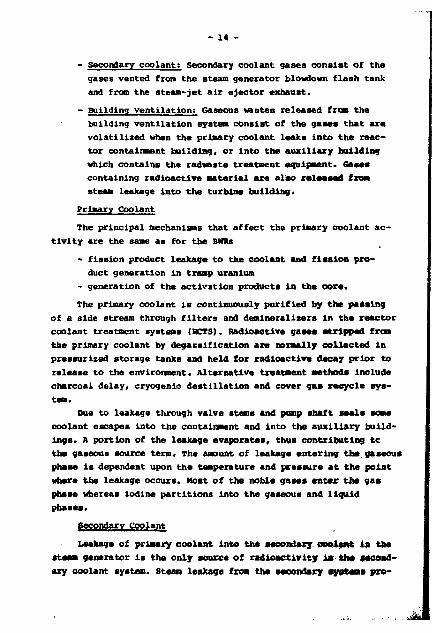
- Secondary coolant: Secondary coolant gases consist of the
gases vented from the steam generator blowdown flash tank
and from the steam-jet air ejector exhaust.
- Building ventilation: Gaseous wastes released from the
building ventilation system consist of the gases that are
volatilized when the primary coolant leaks into the reac
tor containment building, or into the auxiliary building
which contains the radwaste treatment equipment. Cases
containing radioactive material are also released from
steam leakage into the turbine building.
Primary Coolant
The principal mechanisms that affect the primary coolant ac
tivity are the same as for the BWRs
- fission product leakage to the coolant and fission pro
duct generation in tramp uranium
- generation of the activation products In the cor«.
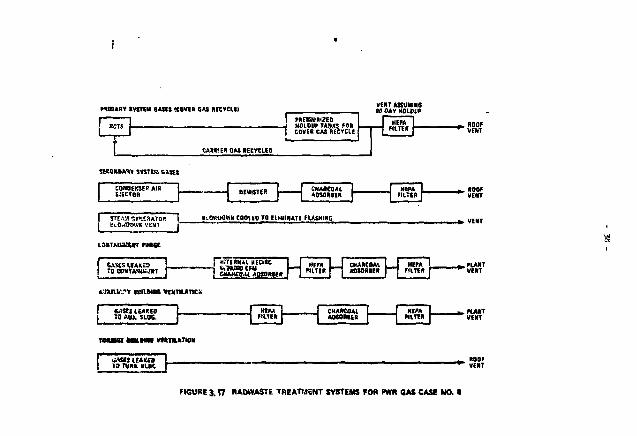
The primary coolant is continuously purified by the passing
of a side stream through filters and demineralizers in the reactor
coolant treatment systems (RCTS). Radioactive gases stripped from
the primary coolant by degassification are normally collected in
pressurized storage tanks and held for radioactive decay prior to
release to the environment. Alternative treatment methods include
charcoal delay, cryogenic destillation and cover gas recycle sys
tem.
Due to leakage through valve stems and pump shaft seals some
coolant escapes Into the containment and into the auxiliary build
ings. A portion of the leakage evaporates, thus contributing tc
the gaseous source term. The amount of leakage entering the gaseous
phase is dependent upon the temperature and pressure at the point
where the leakage occurs. Most of the noble gases enter the gas
phase whereas iodine partitions into the gaseous and liquid
phases.
Secondary Coolant
Leakage of primary coolant into the secondary coolant in the
steam generator is the only source of radioactivity in the second
ary coolant system. Steam leakage from the secondary systems pro-

- 15 -
vide« significant inputs to the gaseous radwaste treatment sys-tena. For the reactor« considered in this evaluation a primary-to-secondary leakage rate of 50 kg/day was assumed [4,5] . Sources of radioactive wastes from the secondary system are the offgases fro« the turbine condenser, vent gases from the turbine gland seal and vent gases froa the steam generator blowdown. The radwaste effluents froa PNRs are shown schematically in figure 3-2.
3 .1 .3 . Gaseous Badwaate Treatment Processes
Gaseous Radwasts Treatment systems are designed to control, measure and reduce the amounts of radioactive material in gaseous effluents froa a nuclear power plant. The degree of treatment should be based on a cost analysis balancing treatment requirements against the costs of alternative treatment processes.
Several treatment methods are used to reduce radioactivity materials In gaseous effluents:
- holdup of the waste to permit radioactive decay - reducing the source of radioactivity entering the ef
fluent steam - se lect ively removing radioactive materials prior to
discharge.
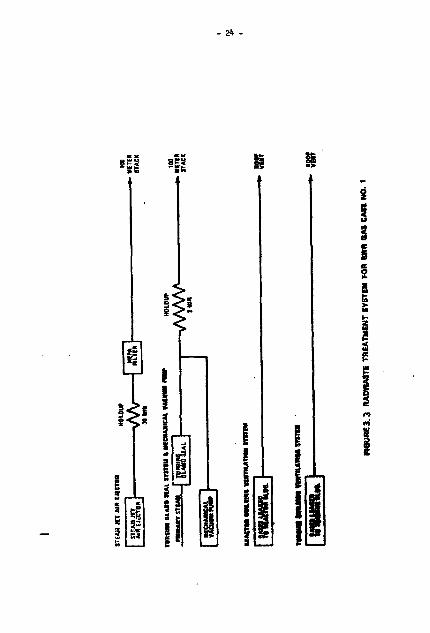
One of the methods used to reduce radioactivity in gaseous effluents i s to delay the release of a gaseous stream to permit the radionuclides to decay to an acceptable l eve l . In this report systems with holdup times ranging from 2 minutes to 90 days have bean considered [ 4 , 5 ] . Holdup pipes providing a 2-minute delay are ussd for BUR gland seal vent releases. The main condenser off-gas holdup l ine for « BUR i s designed for a 30-minute holdup.
The 30-«iiJUte holdup l ine used In early BMt f a c i l i t i e s provided l i t t l e reduction of radioactive gaseous effluents with half-l i ves exceeding a few minutes. Similarly, the PHR base case u t i l ise« a 7-day preseurlted holdup tank to delay primary system gase«. The practical difference in delay times between the BMt and MR cases la the result of the difference in the volumetric flow Mrtes." » l*of f -g»» flow i s approximately }«o m3/h whereas PMB primary syaVsmga* stripping flow la approximately 0.1? m3/h
* In the nm æs*é" evaluated, pressurized storage tanks ara .

16 -
used to provide up to a 60-day delay for prlaary system gases.
Alternative treatment sys tees, i.e. cryogenic destillation, cover
gas recycle and charcoal systems, were used to provide longer de
lay times and to reduce the volueetric requirements of holdop
tanks.
For BWR off-gas systems additional treatment processes are
necessary to increase holdup tines froa a few minutes to boon
or days. In evaluation of off-gases froa the steaa-jet air ejec
tor a catalytic recoabiner is used to decrease the BUR off-gas
volumetric flov rate froa 340 m3/h to 34 a3/h to reduce the size
of components used for subsequent treatment [4]. Treatment proc
esses range from charcoal adsorbers to large charcoal delay sys
tems and cryogenic distillation systems to holdop the noble gases
and to provide almost complete removal of iodine. Charcoal delay
trains and cryogenic distillation units provide delay times up
to 90 days [4].
Another method used to reduce radioactive gaseous releases
is to reduce gaseous leakage Into a building atmosphere. In the
early BWR facilities (e.g. BHR Gas Case Ho. 1) the radioactive
material released into the turbine building ventilation air was
insignificant as compared with the total radioactive gases re
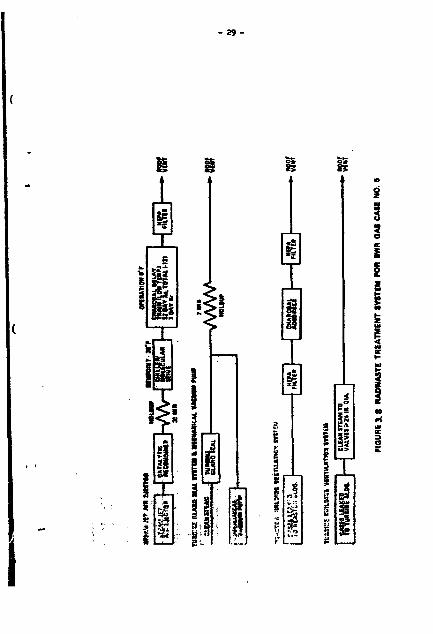
leased from the facility [4,5 J. It. the BHR facilities employing
more advanced treatment systems (e.g. BHR Case Ho. 5) the radio
active materials present in the turbine building ventilation be
come significant. The radioactivity released into the turbine
building ventilation air can be reduced either by treatment prior
to discharge or taking measures to reduce the radioactivity en
tering the building atmosphere. The steam leakage and thus the
radioactive gas leakage can be reduced by using more efficient
seals on valve stems in steam service [4].
Treatment equipment with the capability of selectively re
moving specific radionuclides may also be used. Charcoal ad*
sorbers are effective for the removal of radiolodlne frem air
streams. The charcoal adsorbers considered In thi« report are
deep-bed units capable of reducing the iodine concentrations by
a factor of 10 [4], charcoal dr ay systems are large enarcoai ,
bad« which remove iodine and selectively delay.tin« flow of aoble
gases. Their performance is dependent upont
iS

- 17 -
- taa flow rate
- the temperature
- the moisture content of the stream.
The performance is also influenced by the type, mass, and
physical characteristics of the charcoal used, the imparities in
the carrier gas, the system pressure and the carrier gas velocity.
The length of time a nuclide is delayed increases with (1)
the amount of charcoal used, (2) decreasing temperature and humidity
of the charcoal bad, (3) decreasing carrier gas flow rate.
In the caaea consider«! la this report the holdup times were
changed by
1) reducing gas flow rate by reconblning the hydrogen with
the oxygen into water
2) reducing the temperature and relative humidity of the
carrier gas.
In this report charcoal delay systems provide nearly com
plete removal of Iodine, a delay of 1 to 2 days for Kr and a delay
of 13 to 35 days for Xe [4}.
X cryogenic distillation unit may be used to selectively re
move radionuclides. In a cryogenic system the waste gas Btream
temperature is reduced to approximately -195°C with liquid nitro
gen. The Kr, Xe.and I are separated from the carrier gas by distil
lation. These liquefied radionuclides are stored for radioactive
decay prior to release. Catalytic r»combiners are used to reduce
process volumes and increase operating safety by forming water from
hydrogen and oxygen.
K summary of the variables for BWR and not gaseous radwaste
treatment systems is presented in table 3-1 (BNK-7 cases) and
table 3-2 (MR-9 cases). The flowsheets in figures 3-3 through
l-» show bow the BUR gaseous wastes are treated for seven cases
considered. The flowsheets In figures 3-10 through 3-18 show how
the PMR gaseous wastes are treated for nine cases considered.
3.2.t. Principal Parameters g—d m the Source Term Calculation
It 1« necessary to obtain basic parameters whan calculating
the radioactive source terms expected fro« a nuclear power reactor.
The parameters •ssimisil in thi« report are identical with those used

18 -
in licensing evaluations of radioactive waste treatment systems
in the D.S. [4,5], The source tern parameters are based on avail
able operating reactor data, laboratory data and on field tast
ing cabined with judgement as to the east practical application
of the available infomation. When necessary, theoretical con
siderations and engineering judgement have been applied. In gen
eral parameters which provide realistic radioactive source terns
based on state-of-the-art technology have been presented [1,4,5].
The estimation of release rata« (pCi/s) of 10 isotopes of
noble gases and iodines in gaseous effluents for a 1000 HMe re
actor - type Biffi and PWR - is presented in table 3-3. The values
are given for seven BUR Caseous Radwaste Treatment cases and
nine PWR Gaseous Radwaste Treatment cases [4,5]. The total annual
costs of particular radwaste systems are also presented in the
table 3-3 [5]. These costs are stated in teros of early 1973
dollars, no attempt has been made to Include the effect of in
flation.

&: Table. 3-1
»u—Mity of variables f*r BMt osfeou* radvaate systems*
&*r Case *
;<^-««« » - * l n »01*9 mer* f i lur , 16s*mter stack
IWh&a* f/lwed m l ***•«:
•MCtor ki B S l l a t i . *V«4»e building
;tt*Uea
*y 1
**rtn hOldup, 109-aotwr sti
Ho treatment
M> treatnefit
Catalytic recoM- catalytic reco*-" -• blnnr, 30-mln
hol'lup 4 charcoal dalay eyate«, 13-day xa, Ifl-hr Kr
clean staea
blner, 30-« in holdup, charcoal adsorber• 1O0-neter stack
catalytic r e e « -biner, SO^iln holdup, charcoal dolay aysten 13-day Xa, l*-hir Kr
Clean stnwn
catalytic recon- Catalytic rocon-hiner, 10-« In holdup, charooal delay Byatorn, 13-day X«, 18-hr Kr, 100-nctcr atack Claan >tea*
blnar, in-nln holdup, charcoal. da lay systue, 52-day Xa, 3-day Kr
Claan stean
Catalytic recoe-biner, 30-«tn heIdup, cryogenic d is t i l la t ion 90-day holdup tank
Clean steam rrteary stean, 2*kin holdup 100«swtar atack leQ-Mter atack Chaxcoal adaorbar Charcoal adsorber Charcoal absorber Charcoal adsorber Charcoal adaorbar
Ho treatment Claan ateem on valves 24 inch«« valves 2-1/2
100-steter stack 100-BWtor stack
in dia. larqnr
tnchr>* in dia. and larger. Internal rsclr-culAtlon, charcoal adaorbar
Claan ataaji on valves 2*1/2 inches in dia. and larger
Clean steam on valve« 2-1/2 inches in dia. and larger. Internal recirculation, charcoal adsorber
km a effluents released through roof or building vent unless a stack is indicated.

Tabic 3iLa„,
Summary of variables for PHR gaseous radweete treatment syatensa
Primary system 94SBB
Secondary system g a s e s Condenser a i r e j e c t o r
&toam Stenorator blowdovn tank
C o n t a i n ment per«« I n t e r n a l c l e a n u p
Purga »ont
A u x i l i a r y b u i l d i n g v e n t i l a t i o n Turbime b u i l d i n g vant n a t i o n
7-day holdup p r e s s u r i s e d a torago t a n k s . UEPA f i l t e r s
No t r e a t ment
Vent t o atmosphere
Ho t r e a t ment
HO t r e a t ment Hu t W t -mant
Ho t r e a t ment
45-day holdup progsur-ized s t o r a g e t a n k s . IIBPA f i l t e r «
Mo t r e a t -nent
Vent thru condenser
4 , 0 0 0 -efm c h a r c o a l adsorber Ho troat-> went
MO t r e a t « » e n t
No t r e a t -M a t
45-day holdup p r e s s u r ized s torage t a n k s . HEPA f i l t e r s
Charcoal adsorber
Vent thru condenser
2o,oca-ciU c h a r c o a l adsorber Mo t r e a t ment Ito • m a t -uont
No t r e a t -Kent
60-day holdup p r e s s u r i z e d atorago tan);n. HtPA f i l t e r « )
Charcoal adsorber
Vent thru condenser
2 0 , 0 0 0 -cfm c h a r c o a l adsorber Charaoal Odaorber
Charcoal adsorber
Clean ate am on v a l v e s 2 - 1 / 2 Inches in d i a . and l a r g e r
C a t a l y t i c roconJbiner, charcoal doaiy Byjjtem, pro&Eurized s torage tanks - t o t a l holdup 60 days Xe 31 days Kr
Charcoal adsorber
Vent thru Condenser
2 0 , 0 0 0 -cfm charcoal adsorber
Charcoal adsorber
Charcoal adaorber
Ho treatment
Catalyt ic-reconhinr-r cryaqenic d i s t i l l a t i o n . 90-day holdup p r e s s u r ized s torage tanks
Charcoa1 adsorber
Vent to condenser
Ho treatment
Charcoal adsorber
Charcoal adsorber
Ho treatment
45-day holdup
i»«d Bt-oraga t a n k s . HE PA f i l t e r s
No t r e a t ment
Ho blowdown (on.se-through steam generator)
1 0 , 0 0 0 -cfm c h a r c o a l adsorber Charcoal adaorber
Charcoal adsorber
No treatment
Cover gja r o c y c l o 90-day holdup p r e s s u r ized ncoroge tanks
Charcoal adsorber
Heat e x changer blowdown tank, ion exchange
2 1 , 0 0 0 -cfm charcoa l adsorber Charcoal adaorber
Charcoa1 adsorber
Ho treatment
60-day holdup p r e s s u r ized Storage tanJ-s, HEPA f i l t e r « lno-meter s tack
Charcoal adsorber 100-neter stack Vent thru condenser 100-meter stack
2 0 , 0 0 0 -efm c h a r coa l adsorber charcoal adsorber
Charcoal adsorber 100-meter stack Charcoal adsorber 100-meter • tack
'nil 9«*eou» effluents released through root or building vent unlean a stack is indicated.

mOiomeliåm r i l H M rata« for 1000 HHa U"jht Mtar powvir ranetat, pCl/n
1.
• as»
"•» » M
*M» m» »» U J D l l »
•u, to
I
1 . « 1«) *..-U 171 *.a7 (9) 1.13(10) 1.75 (») » . « Ml «.7» (9> 1.91(10) 1.92 (»1 1.24 •»)
ua
I I
1 . « O) J.01 (7) :*7 (>) 1.11(101 1.7S (7) 2.41 (>) 1-Jl (»1 1.91(10) 1.01 (4) » . H 14)
m '
Sottino; watar »Meter
I I I
2.11(1) 2.01(7) 1.511«) i .Mia i a.s»i() 4.44(f) 1.91(9) 1.10(7)
».•*»> 1.92(4)
457
IV
2.11III 2.01(7) 7.11(5) i.?a<«) B.09MI 4.44(t> 1.11(9) 1.10(7) 7.05(1) 1.92(4)
941
V
2.11(•) 2.01(7) l.77(«) 1.24(A) 9.03(4) 4 .44«) 1.11(9) 1.1517) 0.47(1) 4.94(4)
• 2 0
VI
1.91(C) 2.01(7) 2.61(5) 2.87(5) 2.12(6)
>1.<IID 1.11(9) 9. ar.it) i . a 11) 1.03(4)
715
VII
9.94(5) 1,14(7) 2.44 (C) 3.13(4) 7.83(4) 2.4114) 4.00(7) 1.15(7) 4.10(2) 1.11(3)
1110
1
1.11(5) 2.53(1) l .a i (S) 5.74(51 1.17(7) 4.441«) 1.1119) 9.92(5) 1.1114) 1.54(4)
68
II
3.13(5) 2.53(7) 2.09(5) 5.74(5) 1,64(6) 7.05(5) 7.05(7) 9.92(5) (.61(1) 4.96(1)
40
I I I
3.11(5) :.53(7) 2.09(5) 5.74(5) 1.67(6) 7.05(5) 7.05(7) 9.92(5) 1.41(3) 9.92(2)
244
Fraimirli«!) «nter
IV
3.13(5) 2.5)171 1.57(5) 5.74(51 9.4 (51 7.05(5) 6.26(7) 9.92(5) 7.11(2) 5.74(2)
442
V
2.61(5) 2.51(7) 2.0915) 4.10(5) 1.B3U) 1.51(5) 1.11)7) 6.26(5) 1.31(1) 9.14(3)
299
roactor
VI
1.11(5) 2.51(71 1.5115) 5.74(5) 5.22(51 7.05(51 4.26(7) 9.92(5) 3.09(1) 9.14(2)
745
VII
1.11-105
2.51(71 2.09(5) 5.74(5] l . i7(«) 7.05(5) 7.0517) 9.42(5) 1.44(1) 1.7 (2)
264
VIII
2.61(5) 2.51(7) 1.57(5) 4.70(5) 1.13(5) 1.57(51 1.02(7) 6.26(5) 1.15(11 0.09(2)
400
I«
1.11(9 2.53(1 2.09(1 5.7415 4.4 (5 7.05.5 6,26(7 9.92(5 7.1112 5.74(2
731
Ri*«* aMitv**. eostft * w «ff>lic*b&« for 1}Q0 Hto RHR or PlfR radwnat* ayatom.

i II m Q il i i!
CONOENtER -*
«—<g>^ P
• • .ii - i i—W..I.IH
(S) •OEMNCRAUZER
(K) •miHAnYCOOLANl
FIGURES.! LIQUID AND GASEOUS ftASU'ASTE EFFLUENTS FROM BOILING WATER REACTORS

FIGURE 3.2 LIQUID AND GASEOUS RADWASTE EFFLUENTS FROM PRESSURIZED WATER REACTORS
- 24 -
•12 m IS
m
i!

mw*T*mcanM
W^H^&]^r-f^^n-*m»
(IlfM r nun,,, ""I
Irøtm i—.
THMHuniaumlRiaHan<ui«miMi nas.
tan ^ MIMR
I1MUEM SWtMjt VSKIIUtflii SVCTM
-»•IHTM
TnwnuMnniuinimni
?ssaagg^.|- „HM!
HOURE 3. i RADWMCTI TREATMENT SYSTEM NM nm OM CASE Na 2

26
l i
I
S i

27
p>
3 3
s„

- 28 -
! i i i
I
I
- 2 9 -
g
E
p
sg
3 o
o s
I

JTEUI JET Am uiera«
{ SUA* Mr J_J Mnurnc A A
At» 1JECTQ« ^ »tCWIIHIHI ^ f V V
TOMWC « IA !» SMI IT-.TtM 1 UCCMWUI VACUUM raw
CUAHITW "I MTU h
!( TÅ
8
VNT UOAIIO WTIIOSEII MtKXt, lANOMtWICr CAMIE« OVM WTH MTflOOEII
mmy 1MIN
«g»a»h VWW^
HeiBVF
Mf
I tWjJSflMft««, -[Ml—i »«8» VMTWMIM (TUMI tlXIMMT MTI MM WW
tWMSSBUt. —-1 CUM BUM T» V A i v n > » i n - n mt
netmca• HAOWAITI TRIATMENT SVSTCM FOR am OA* CAM NO. I

}
itavwiw? •*»Rf
'£ i gaMwar H
*!SSf
X&XSl h
.fy*1 ,
WIT
•*8ff
1 yg.vTA
WflUW 3. tO RADWAITI TWEATMINT SVtTtMS FOR PWR OAS CAM NO. 1

I
PP.IUMV Sft lUI CUES
RCrs ME5SUKI2E3 HOLDUP TANKS AS DAV HOLDUP
HEPA FILTE«
SECOHOASV SVSTEH CASES
CONDI"iSill MP. LJtCtOS
ssszssr VENT
CONGfNM«
CCAT'.tfJUliKT PURSE
'.V.SCS UAKEO 50 CSH1AIHt!l«>T
K'EMIAL »ECI»C V. -UJO CFfc' MANUAL ADSOKDEII
AUXiiUitV BtrtiGIHC VCKTIlATIaS
GASES tIAKtO 10 AIM. tlllw.
TgMUU IWMHi* VMntATHW
I I K K H U I I 1 j TB TUM U85,
FIGURE 3.11 RAOWASTE TREATMENT SYSTEMS FOR PWfl 6AS CASE NO. i

I
13" SfSSHfe. — H ^
BS81 1— L
sssMSfySfr }-tuiiw'ii I'm >
AHonfi
v»»1
nnnuMiMCMt nuacni OU>M««l.«B»HIMII
' «MT
. ruwr VWT
»»numre nmtwc vomurmi
•MilltMCO T»*m.«.w
CKMCOM, trnms*
. flMfT vinr
I W W H m u m vamuan*
uaauAtta 1« YUM. tun.
FIGURE 3.12 RADWASTE TREATMENT SVSTEMS FOR FWR GAS CASE NO. 3

I
KKWWV srsn« CASK
PRESSURIZED HOLOUP TANIIS SO DAV HOLDUP
SCCCKBARV SYSTEM GASES
H;PA FIUEH
-».HOOF VENT
STSAB GCNEHATOP.
ngniOMveia VEMT
COMIMSEB
COOTttMen HASE
| C»St5 LEAKED I IS'WITAillUHT L. , „.,„
"»USUAL »KM
I jAUSOAL APSOBBTB _ J H E P » 1 — CKAHCOAl _
) I'LTEB [ AOSOMS« . »IANT
VINT
A3SIIIMV lOHDIM VENTIMTMl*
TO A«J(. JL06. HEM
HUE.1 CKAICOAL AOSOHbEP.
„PLANT vim
ta?sm MMiww vnjnunou BASES LEAnEti TO Tum. 5LOO.
C LEAK STf AH OH • - STIAU LIKE VALVES
»HMCHEJDIA.
F I G U H E J . I 3 RADWASTE TREATMENT SYSTEMS FOR PWR OAS CASE NO. 4

3i •
IS
I m
a ft
1 1 s * SS
I • * * * i
Cl
s o
i O
i
i i
Ir ?! Se I

I
WIWARY SYSTEM GASES
, HTCS
S £ t 9 K M X Y SYSTEM GASES
r r » t Y 5
Sf [ 1.
r* 0
. _«
VERTUOUIOII ITRaOEN WO.Ol S OF X i . 1
A N O U K S S O F « . FROM FEED STEAM
LIQUID STORAGE « CRVOGEMC TEMP M OAV HOLOUP
HEPA »ILTER
'n
•OOF VENT
.HOOF VEHT
CHARCOAL AQSURREft
HEPA FILTE«
ROOF "VERT
CCUTAieUtRI MtDCI
1 GAiESLEAAEO | TOCOKTAKItFKT
HEPA FILTER
* CHARCOAL AOSORIER
HEP« FILTER
. H A R T * V E » T
AlIXitlAKIr 3 l ' I H « t e VtSTI tATlOa
OASES LEAKED I C Mfct. S U M
TUHEIM MBLUCO VEHTHATIOS
OASES LEAKE« TSTWB.MKS.
„ROOF VlUT
FIGURE 3. IS RAOWASTE TREATMENT SVSTEMS FOR FWR GAS CASE NO. 6

- 37 -
n 3 |
§5
I
0
S
il
m » A H V SYSTEM I K K (COVE*
BCTS
t SECONDARY SYSTEM CASK
CONDENSER AID EJÉCTOH
| STE.V« SE'iESATOB B<.0-røOWN VENT
lOaTAUi isn H I M E
[ GASCSlfAKEO | TC CO«TA«lli.«tT
ABULIA."* K I L M K > tElil
BASESLEAKEO TO AUX SLOG.
T H U H I MHIWM VO
JASES ItAKEB 1 u n i s n u t
ITU
1LAT1C
»HON
BAS RECYCLE!
CARRIER GAS RECYCLED
OEWSTER -
I PRESSURIZED J HOLDUP TANKS FOD \ COVER GAS TECYCIE
CHARCOAL AOSORBER
VENT ASSUMIKG
HEPA FILTER
"
. » E M FILTER _
RiOWOOWl C0OIE0 TO EUIMNATE HASHING
f "C 1 CM.
ERNAL KSCHC » 3 « CFU AHCOAl ADSORKR
K
HEM FILTE*
_ J HEPA ^ FILTER
CHARCOAL AOSOMEB
CHARCOAL ABSORBER
f~ 1 HEPA 1 FILTER
H E M RITER
(
r
^
ROOF VENT
ROOF VENT
PLANT VEHT
H Å N T VEHT
ROOF VENT
FIGURE 3.17 RADWASTE TREATMENT SYSTEMS FOR PWR QAS CASE NO. •

- 3 9 -
•g
i X gi
10
at * K M
• s
ii
I
8
i
g
»II
I
i «
Ses
1 1 1 i l
is SS
S*
ss i
o
I
1

- 40 -
4. ENVIRONMENTAL TRANSPORT MODEL
4.1. Introduction
Radioactivity materials such as aerosols, vapours or gases
released in gaseous effluents from a nuclear power plant become
dispersed in the surrounding air through variations in wind di
rection and turbulence of the atmosphere. The average concentra
tion of radioactive material in air will depend upon the amount
of release and the joint distribution of wind speed, wind direc
tion and atmospheric stability for the site. Geographical fea
tures including hills, valleys and large bodies of water greatly
influence the dispersion patterns around a site by affecting
wind directions and stability conditions. Surface roughness, in
cluding vegetation cover, also affects the degree of mixing [7].
Airborne aerosols and vapours in the atnosphere are eventu
ally reduced by deposition or by the scavenging action of precip
itation. Noble gases are absorbed to some extent by precipitation
but most simply continue t» mix with the atmosphere. In all cases
the amount of radioactive material released will decrease by ra
dioactive decay.
In practical application there is frequently a distinction
between local and regional dispersion. However, there Is no gen
erally recognized definition of the local and the regional range.
Since the range concerned is dupendent on the properties of the
source and on the specific environmental conditions, any final
determination of the range limits would be problematical. There
fore, the distinction between local and regional dispersion
should be established according to the practical applications.
Typical examples of local dispersion problems are environmental
impact studies of single sources and assessments of the critical
population group. More far-reaching environmental studies in con
nection with planning for area use on which the superimposed ef
fects of a large number of sources are to be taken into consider
ation, or analysis of the population doses, are characteristic
problems of regional dispersion.
The local range would in general correspond to • short time
period after release before appreciable mixing or diffusion ha*
occurred* the physical limits of the cloud will be quite sharply

- 41 -
defined. Tbo cloud will hava a Halted aixe and steep concentra
tion gradients. Consequently the effect of the releaae at near
downwind locations may be quite critically affected by minor
topographical features (i.e. buildings, hills and trees) by minor
fluctuations in meteorological variabias (i.e. wind direction,
stability category, wind speed, etc.) and by release parameters
(i.e. finite else of a source and rate of release). In the local
range, the requirements for the application of the dispersion
equations are generally fulfilled, and the diffusion la known
with sufficient accuracy [7,8]. As regards the regional disper
sion as a cloud moves farther from the point of release, continual
diffusion will cause the concentration gradients to decrease. At
greater diataacea the cloud will be relatively insensitive to lo
cal Irregularities, but will be affected by major topographical
features, gross changes in the meteorological conditions, limi
tation of vertical dispersion, and losses of pollut wits due to
disposition to make use of the dispersion concept up to areas of
acme hundred km extension, the decreasing reliability of the dis
persion calculations for large/regional distances is caused by
shortcomings of the model rather than by the decreasing accuracy
of the diffusion parameters [7]. An essential fact is that the
requirement of homogeneous dispersion conditions is not fulfilled
in large regions since, on the one hand, systematic variations in
wind direction due to Corlolls forces have to be considered, and
on the other hand the meteorological conditions are subject to
change during transport times of several hours. Frequent shifts
of wind direction and changes in stability and wind apeed may
causa the plume to move to unforeseen areas.
Tha air transport model, presented in this report, simulates
that spreading of released radionuclides Into the environment via
acaosmhsre mechanisms, and uses a one-dimensions 1 version of the
normal equation to estimate vertical diffusion of the radionu
clides baaed on meteorological variables assessed on a yearly
average basis (8,9,10,11], Lateral distribution on an annual
average basis is assigned individually to each of 12 compass-
point sectors. Depletion of the airborne radionuclides by wet
and dry precipitation processes Is considered. During the tranalt
of xsdioraelides, depletion by radioactive decay is taken into

- 42
account. The scheme of this nodal is shown In figure 4-1.
The air transport model> presented in this report, is de
signed to calculate the atmospheric radionuclide concentration
at a particular point to distances up to about 1000 km from the
nuclear power plant.
The general expression for calculation of the ataosphsrlc
radionuclide concentration is the following [12,13] s
6 C ' d , > « , < ( 0.01-f -M -F, ,) (4-1)
where
CH » the atmospheric concentration of i radionuclides 1 3 at the location of interest; pCi/ta
0, = release rate for nuclide 1; pCl/a
f = the frequency of the occurrence of particular
stability condisions A,B,C,D,E, and P; percent
H - meteorological dispersion factor for the location
of interest for particular stability condition "s*
[pCi>3 l/[pCi/s ]
F, = the correction factor for depletion due to dry i, s and wet deposition for radionuclide '1* at the
location of interest for particular stability
condition *s"
R. » the correction factor for depletion due to decay
for radionuclide "i" at the location of interest.
When both sides of the equation are divided by 0,, we obtain i
?i " k ' 'sil °'01 '-''."i,.1"! M"2)
where
T± » g Pathway model conversion factor relating the
quantity of radionuclide "i* released to its
concentration in the air at the location of
interest, [ pCiAi3]/[pCl/s].
- 43 -
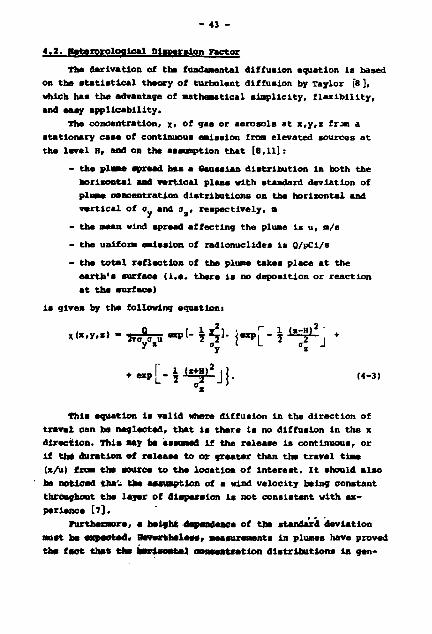
1.2. Heteroroloqlcal Dispersion Factor
The derivation of the fundamental diffusion equation Is based
on the statistical theory of turbulent diffusion by Taylor [8 ],
which has the advantage of mathematical simplicity, flexibility,
and easy applicability.
The concentration, x. of gas or aerosols at x,y,z frjm a
stationary case of continuous emission from elevated sources at
the level H, and on the assumption that [8, ll]:
- the plum« spread has a Gaussian distribution In both the
horisontal and vertical plans with standard deviation of
plume concentration distributions on the horizontal and
vertical of o and o^, respectively, m
- the mean wind spread affecting the plume is u, n/s
- the uniform emission of radionuclides is Q/pCi/s
- the total reflection of the plume takes place at the
earth's surface (i.e. there is no deposition or reaction
at the surface)
is given by the following equation:
• « « . [ - i j f i " l i j j . ,4-3) °s
This equation is valid where diffusion in the direction of
travel can be neglected, that is there Is no diffusion in the x
direction. This may be assumed if the release is continuous, or
If the duration of release to or greater than the travel time
(x/u> from the source to the location of interest. It should also
be noticed tha- the assumption of s wind velocity being constant
throughout tba layer of dispersion Is not consistent with ex
perience [7].
Furthermore, a height dependence of the standard deviation
must be expected. Nevertheless, measurements in plumes have proved
the fact that eh* horisontal concentration distributions in gen-

44
eral have a nearly Gaussian distribution! while the vertical concentration profile is apparently at least not such In contradiction to the Gaussian distribution [7,8,11]. Consequently the problem of evaluating the diffusion lies in an adequate determination of the standard deviation.
If the reactor is located on the ground level (* - 0), then
*<*.»> • . . føj «* [- * fy2 j "p [" * fy'j • (4-4)
The ground-level crosswind-lntegrated concentration Is often of interest. For a continuous elevated source this concentration is obtained by integrating (4-4) with respect to y frost (-» to ••) which yields (4-5)
2 0.5 0 T 1 H* i z ^ *
For a source that emits at a constant rate from hour to hour and day to day estimates seasonal or annual average concentrations can be made for any distance in any direction if stability wind "rose" data are available for the period under consideration. X wind rose gives the frequency of occurrence for each wind direction (usually from 12 to 16 points) and wind speed class (usually from 4 to 9 classes of wind speed).
If the wind directions are taken to n points and It is assumed that the wind direction within each sector is distributed randomly over a period of a month, season or year, it can further be assumed that the effluent is uniformly distributed in the horizontal direction within the sector [2,3,8]. The appropriate equation for average concentration is then received through multiplication of equation (4-5) by the frequency of wind directions in a given sector and divided by the width of that sector at the distance of interest, which gives
Z . ,2,0.5 0.01-f-Q / I H 2 \ . . . . <52,S(2tx/n) V 2 aluJ
Dividing both sides by Q, this equation givesi
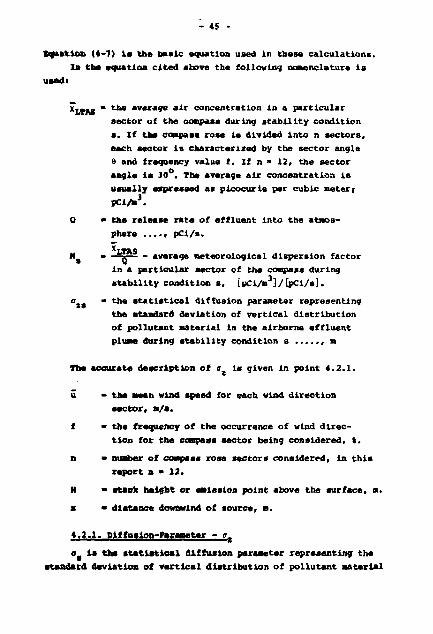
- 45 -
Equation (4-7) l a the basic equation uaed In these calculations. In the equation cited above the following nomenclature la
us*di
- the average air concentration In a particular
»actor of the compass during stabi l i ty condition
a. If the compase rose la divided into n sectors,
each sector i s characterized by the sector angle
» and frequency value f. If n » 12, the sector
angle i s 30°. The average air concentration la
usually expressed as plcocurie per cubic meter i
PCI/«3.
• the release rate of effluent into the atmos
phere . . . . . pCi/s.
X.TAS
- -=7g average meteorological dispersion factor
In a particular sector of the compaaa during
stability condition s, [pCi/m3]/[pCi/s].
- the statistical diffusion parameter representing
the standard deviation of vertical distribution
of pollutant material in the airborne effluent
plume during stability condition s , m
The accurate description of a is given In point 4.2.1.
u - the swan wind speed for each wind direction
sector, a/a,
f - the frequency of the occurrence of wind direc
tion for the compass sector being considered, t.
n - number of compass rose sectors considered, in this
report a » 12,
H - stack height or emission point above the surface, m.
x » distance downwind of source, a.
4.2.1. Diffusion-Parameter - ot
ø la the statistical diffusion parameter representing the
standard deviation of vertical dlatribution of pollutant material
*I*M
\

- 46 -
in the airborne effluent pluae - the diffusion paraaeter. This is
usually assumed to be a Gaussian distribution for relatively
short distances [2,3,8], but for long travel distances a stable
layer existing abov an unstable layer will have the effect of
restricting the vertical diffusion. The dispersion calculation
can be modified for this situation by considering the height of
the base of the stable layer L (mixing layer). At a height 2.15
a above the plume centerline the concentration is one-tenth
the plume centerline concentration at the same distance.
when one-tenth the plume centerline concentration extends
to the stable layr, a height L, it is reasonable to assume that
the distribution starts being affected by the "lid". The follow
ing method is suggested to take this situation [2,3,14,15] into
account. Allow a to increase with distance to a value of » »
or 0.47 L. At this distance x,, the pluae is assumed to have a
Gaussian distribution in the vertical direction. Assume that by
the time the plume travels twice this far 2x,, it has become
uniformly distributed between the surface of the earth and the
height L.
Establishment of the vertical diffusion variable o. is ac-z
complished by two methods for relatively short travel distances.
oz was obtained by Interpolation of the so-called "Pasquill"
curves given in references [8,13], while for longer distances
the methods developed at the National Reactor Testing Station
(NRTS) are used [15] for three ranges of downwind distances. - For distance x < xL - Gaussian Distribution
oz(x) is evaluated using the following expression [16],
log o2(x) - aQ + ax log(x) + a2[log(x)]2 (4-9)
where aQ> a^, and a^ are parameters associated with each stability
classification. For each stability category, numerical values for ao' al' a n d a2 w e r e obtained by fitting the graphs in reference
[11] and listed below.

- 47 -
>**bjf «
K
B
C
0 E P
- For
U H I U b M U U
d i s t a n c e
»
* T <
"o 2.611617
2.044469 1.786247
1.484478 1.329482
1.137662
x < 2xt -
"1 2.021631
1.057002 0.0918815
9.733034 0.680872 0.655019
"2 0.548155
0.0303405 -0.00397974 -0.0745961
-0.105925 -0.121964
Medium Di s t r ibut ion between Gaussian D i s t r i b u t i o n and Uniform D i s t r i b u t i o n
o (x) for this range is evaluated using the following expres
sion [l5]i
(x-x ) 0.465 I + —;-=- (0.335 L) (4-10)
wherei
diffusion parameter, a.
L • the nixing height which can be derived from the
temperature gradient and which is dependent on th%
diffusion category, meters.
x, » a downwind distance beyond which vertical mixing
would be inhibited. This Is also the downwind point
where the vertical distribution of the pollutant
loading nay be considered to conmence changing from
Gaussian to uniform.
x • the downwind distance.
- Tor the distance« * > 2xL - uniform Distribution (where
the vertical distribution of pollutant load concentration may be
assumed to be uniform) [15].
ff_ " 0.8 L 2
(4-11)

- 48 -
4.3. Depletion of Cloud by Deposition and Radioactive Decay
As a release cloud travels downwind, material will be re
moved from it progressively by deposition of radionuclides on the
ground and by radioactive decay.
The general correction factor for the depletion of the cloud
may be estimated from the following equation:
G, - F.-R. (4-12)
where:
G, - the general correction factor for depletion of cloud
for radionuclide "i" at the location of interest.
F. = the correction factor for depletion due to dry and
wet deposition for radionuclide "i" at the location
of interest.
R. = the correction factor for depletion due to radioac
tive decay for radionuclide "i" at the location of
Interest.
4.3.1. Depletion of Cloud by Deposition
A number of processes other than natural atmospheric turbu
lent diffusion can be significant in the f»te of radioactive ma
terial emitted into the atraosphere [8,18]. One of these processes
is deposition. The mechanisms by which radioactive material will
deposit on surfaces vary depending on whether the cloud passage
is associated with precipitation. Dry deposition may result from
gravitational settling or Impaction on surfaces deflecting turbu
lent atmospheric flow. When precipitation occurs below the rain-
forming level, the radioactive substances are washed out by fall
ing raindrops.
Then the correction factor for depletion due to deposition
of radionuclide "1" may be derived from the following equation:
r > "PI fD * Mwi fw
where

- «3 -
F, • the correction factor for depletion due to deposition
of radionuclide "1" at the location of interest.
H_, * the correction factor for depletion due to dry deposi
tion of radionuclide "I* at the location of Interest.
f_ - effective period of time in which dry deposition
process is active, t.
H " the correction factor for depletion due to vet deposi
tion.
N , - deposition of radionuclide "i* at the location of
interest.
f - effective period of tine in which the uet deposition
process is active, ».
«.3.1.1. Depletion of Cloud by Pry Deposition, tilth the ex
ception of xenon, krypton and other noble gases, and the possible
exception of iodine in true molecular farm, the radioactive sub
stances released froa nuclear power plants would be in particu
late for« [6,19]. The physical process governing the deposition
of aerosols and vapours is variously complicated and only partly
understood at present, and it is impossible to give a precise
prediction of the quantitative effects of deposition on the vari
ation of radionuclide concentration with the distance that the
cloud travels. With the exception of noble gases (krypton, xenon,
etc.), the radioactive substances released from nuclear power
plants would deposits on the ground to sane extent as the cloud
travels downwind. In the absence of rain, which would give rise
to washout of a proportion of the radioactive substances, deposi
tion would occur by [6,8,20] t
- sedimentation of the larger particle* in the area
closest to the reactor
- by processes of diffusion and Jjopactlcn of the
•taller particles
- by diffusion and chemical reaction of vapours at
all distances.
The depletion of radioactive substances in the plume due to
a dry deposition process daring downwind travel is derived from
the relationship given by I. Van der Hoven [8] as expressed in

- 50 -
the following expressions:
- For distances x < x^ pollutant local concentration may be assumed to be Gaussian)
° XI •• 2°tl (4-14)
where
NDil'x,u,Vdi' = the correctlon factor for depletion due
to dry deposition of radionuclide "1" for downwind distances less than xT
v., = the deposition velocity of radionuclide "i", n/s the description of V.. is given in point 4.3.1.1.
u,h = as in equation (4-8).
°zl is given by equation (4-9) (Gaussian Distribution).
- For distance i, t x < 2xL (where the vertical distribution of pollutant load concentration nay be assumed to be midway between Gaussian and uniform)
NDtII(x,U,Vdi) - ND1I(xL,U,Vdi) x
» exp ) -(f)* ^ /" J _ exp I- J%- , dx | (4-15) u xL"*n - *«;„
where
NDill'x'u,vdi' * the correction factor for depletion due to dry deposition of radionuclide "i" for downwind distances between x, and 2x,
NDiI<xL'u,vdi' " the <5orrection factor for depletion due
to dry deposition of radionuclide "1" for downwind distance x L - expression (4-14)
vdl' u , n " aB in the axPcesslon (4-14)
o Z I I - is given by the equation (4-10) (Mediate
Distribution).

- 51 -
iiollutant load concentration nay be assu,aed to be uniform)
N DiIII< X ' t t ' V dl> • B D i I I < 2 x f U ' V d i ) "
« exp H f ) * i * ; ^ - exp [- - t i - dx I (4-16)
where
N-jjjjIx.u.V^,) - the correction factor for depletion due
to dry deposition of radionuclide "i"
for downwind distances greater than 2x,
•L.1.-(2x,aulvd,)> the correction factor for depletion due
to dry deposition of radionuclide "1" for
downwind distance 2x, - expression (4-15)
v..,u,h » as in the expression (4-14)
0 - T H * i s 9iven by the equation (4-11) (Uniform
Dlsribution).
4.3.1.1. Deposition Velocity. The deposition velocity of
windborne materiel varies with the size, shape and density of the
particle and with the chemical propoerties of the material of which
the particle is composed [6]. However, even if the size and com
position of the particles could be predicted in advance, this would
not be sufficient to warrant sore than a very approximate predic
tion of the deposition velocity since this has been found to vary
with wind velocity and turbulence, and also with the nature of the
surface upon which Imposition occurs [6,19]. Iodine, which is
specially considered in this report, presents exceptional diffi
culties when one attempts to assign a representative value to the
deposition velocity. Some iodine would be released in molecular
form, and a value of Vg » 2,5 cm/s has been found experimentally
for this form [6,19]. Some Iodine, initially in molecular form,
would become attached to condensation nuclei, metal fumes and
other submicron particles, and in this form the deposition veloci
ty might be about 0.1 cm/s or even lower [19]. The presence of
iodine in this form would probably account for the deposition
velocities of 9.1-0.5 cm/s determined during the Windscale ac
cident In 1957 [21}• 'urther information on deposition velocities

- 52 -
la available from a series of field tests of fission product re
leases carried out in the U.S.A. [22,23]. There were 9 experiments
in which fuel was melted and effluent released near ground level.
The overall result for iodine was Vg * 0.2 cn/s on gummed paper
samples and 1.5 cm/s on a smaller number of grass samples. The
measured deposition velocities for inversion and lapse conditions
were not significantly different from each other. These data and
experiments showed that the deposition velocity of iodine varies
between about 0.1 cm/s and 3 cn/s depending on meteorological con
ditions, and whether the surface is grass, snow, or carbon, and
on the physical and chemical form of the iodine, with most values
falling between 0.2 and 2 cm/s. In this report it is assumed that
the deposition velocity for the noble gases is 0 and for Iodine
0.5 cm/B.
4.3.1.2. Depletion of cloud by Wet Deposition. Depletion of
a fraction of the material from the cloud may occur due to wash
out of particles or soluble vapours from any vertical section of
the plume by rain or snow falling through it.
The depletion of the plume downwind by a washout process is
accounted for by assuming that this process may be represented
by an exponential term of the form [8]
NHi = exp(-Ai i) (4-17)
where:
Nwi = the correction factor for depletion due to wet
deposition of radionuclide "1" at the location
of interest
x,u = as in equation (4-8)
AA = the vashout coefficient of radionuclide "i", s j
the description of A is given In point 4.3.1.2.1.
4.3.1.2.1. Washout coefficient. The fraction which Is washed
out in unit time is called the wash-out coefficient, A. The value
of A depends on the particle size, the precipitation Intensity
and the size of drops. The difficulty in making a suitable choice
of value from the experimental or theoretical Information available
is at least as great a* in the case of V. for dry deposition [6,8].

- 53 -
Predicted values of the washout coefficient A for iodine gas range from 10 to 10" s in rainfall rates of 0.1 to 1 nm/h [6 ] . The three Measurements for iodine gas gave values ranging fro« 3 » 10 to 2 * 10~ * , I . e . one or two orders of magnitude lower. This large difference i s attributed to differences in their respective reaction rates with vater [24]. During snowfall, washout coefficients were lower than in rain,
—8 —1 for inorganic iodine i t was about 5 * 10 s in powder snow of 0.2 ma/h of rate [16].
Engleaann [24) presents a survey of experimental results for washout coefficient measured at Harwell, Washington and The values of A vary between 3 « 10 s at a rainfall rate of 0.1 mat/h to 10"3 t~X at 100 aa/h.
These data and experiments showed that the washout coef--7 -3
f icient of iodine varies between 10 to 10 / s with most values fall ing between 10' and 10~ / s j the highest values occurring when the effluent gaa has a high water content and atmospheric conditions are conducive to condensation.
Englenann [18,24 ] discusses scavenging by snow and water scavenging of gases. He concludes that for particles of about 1 an or xess in diameter, i . e . those of interest in reactor releases, i t i s generally agreed that washout by rain is insignificant. In this report i t i s assumed that the washout coef-
-4 flcient for the noble gases i s always 0 and for iodine 2 x 10 .-1
4.3.2. Depletion of Cloud by Radioactive Decay
When the source material is radioactive, correction factors
must be included to account for the depletion by radioactive de
cay en route to the reactor. The depletion of concentrations for
radioactive decay of the radionuclides is determined by the ex
pression!
", - «P(- I4*2* jj ) . (4-18) i l u «
where•
active decay for radionuclide "1" at the locat.cn
of interest
- 54 -
x,u - as in equation (4-8)
T, ± = the radioactive hal f - l i fe of radionuclide "i", a.

55 -
A Scha— of Air Tramport Model
REGIONAL METEOROLOGY
SOURCE
RELEASE
LOCAL
METEOROLOGY
I K
SOURCE
SITE LOCATION
RECEPTOR
SITE LOCATION
_ DIFFUSION _
JOINT PROBABILITY}.
DATA
TRAVEL
DISTANCE
DIRECTION
DEPLETION DRY DEPOSITION NET DEPOSITION
DECAY
J_ RESIDUAL AIRBORNE
CONCENTRATION
RADIONUCLIDE CONCENTRATION
OF RECEPTOR SITf
Figure 4-1

- 56 -
5. DOSE MODELS
In the event of the release of radioactive materials to the
atmosphere the radiation dose received by people and animals can
be considered in two phases [8]; the initial or acute phase while
the airborne material is passing the receptor and the recovery
phase following the passage of the cloud.
The radiation dose in the initial phase will include the ex
ternal radiation from the cloud passage, some contribution from
the materials deposited on the ground, body or other surfaces,
and the radiation from any material inhaled during the cloud
passage.
The dose received in the latent phase will consist of ex
ternal radiation from material deposited on the ground or other
surfaces and internal radiation from ingestion of foodstuffs or
liquids that have become contaminated by the passage of the cloud.
Possibly an additional internal dose could be received during
this phase by inhalation of resuspended dust in the contaminated
area.
This report takes into account only the initial phase of
recovery radiation dose, i.e.
- the dose from submersion in air
- the dose from inhalation of air during the passage of
the cloud.
5.1. Individual Dose
The fundamental equation for calculation of the individual
radiation dose from submersion in air and inhalation air is given
by the following equation:
Di,k,j,n-Qi-Ti'Fi,k,j,n f5'1'
where:
i.k,j,n in the group n from nuclide 1, via pathway k,
at the location of interest mrsm/year
31 - release rate for nuclide 1, pCi/s; the de
scription of Q. is given in point 3 of this
report.
- 57
T. - pathway »odel conversion factor relating
quantity of radionuclide i released to Its
concentration in the air at the location of
interest, pCl/m /pCi/st Oie description of
T, is given in point 4 by equation (4-2) of
this report.
r. . , - Doslaetry conversion factor (Dose Factor) *fK,3»n
relating concentration of radionuclide i in
the air to resultant dose to n group of people
on organ j via pathway k, mren/y per pCi/m .
The dose factor is a mooter which can be used to calculate
tha radiation dona to a person (or organ) from external exposure
to a given concentration of radionuclides in environmental air
(Submersion Dose Factor) and from the inhalation of radionuclides
(Inhalation Dose Factor).
5.1.1. Submersion Dose Factor
The Submersion Dose Factor (mrem/y per pCl/m ) was calcu
lated by multiplying the Hourly Submersion Dose Factor (mrem/h
per pCi/n ) by the occupancy factor (h/y) [2,3].
The occupancy factor
Sine« tha principal contributions to the external air sub
mersion dose are from noble gases, the assumption was made that
the air concentration of radionuclides was essentially the same
indoors as out of doors. Thus no shielding and occupancy factor
are applied. Therafore 8784 hr/yr (24 hr/day »30.5 dayg/month
x 12 months/year) Is used for calculation of the submersion dose
factor.
The Hourly Submersion poae Factor
In this report the hourly Submersion Dose Factor from ex
ternal exposure to air was derived on the assumption that the
amount of contaminated air waa large enough to be considered as
an infinite volume relative to the ranga of the radiation emitted
[2,3,14]. Under this assumption the energy emitted per gram of
air is equivalent to the energy absorbed per gram of air. The
dos« factor merely converts HsV per disintegration per gram to
rem and corrects for the differences in energy absorption between

- 58 -
air and tissue.
It is important to notice that the concept of a semi-Infinite
cloud is not valid unless the dimensions of the actual cloud ex
ceed approximately 3-5 mean free paths of the radiation in air.
The mean free path of gamma rays is of the order of 100 meters,
and the dimensions of the cloud are the same order of magnitude
at distances which vary from 1 to 100 kilometers depending upon
weather conditions [6]. At points nearer to the source of release,
the dimensions of the cloud would be much smaller than the mean
free path of gamma rays. Consequently the dimensions of the cloud
and distribution of activity within have to be taken into account .
if a proper estimate is to be made of the T dose from the cloud.
The mean range of beta rays in air is roughly 1 to 10 meters
for beta energies of 0.5 to 2 MeV [6]. Since the dimensions of
the cloud will be greater than this at any appreciable distance
from the point of the release, and a human body would serve as a
nearly perfect absorber, the semi-infinite cloud formula can be
used with good accuracy to calculate the beta dose. The dose from
submersion in air is an external dose to either the akin only or
both the skin and total body, depending upon the penetrating
power of the radionuclide emitted by the airborne radionuclides. 2
Only beta and gamma radiation, which would penetrate 7 ag/cm of
tissue, were considered in calculating the skin dose. A gamma
radiation dose at 5 cm depth In tissue was used for calculating
the external dose to the total body (and for Internal organs).
The 2ir geometry was used for a person standing on the ground
surrounded by a very large semi-Infinite hemisphere of contami
nated gas for both beta and gamma radiation. The geometry follows
from the half-infinite volume for gamma radiation. For the beta
radiation with shorter ranges in air the physical arrangement ap
proaches the infinite volume (4ir), but since the beta radiation
is of limited penetrating power, it will irradiate the skin from
one side only, not two sides as with the penetrating gamma radi
ation.
The equation for calculating the hourly Submersion Dose Fac
tor is given below [2,3].
(H.S.D.F.K = B.87'10"7 (ff. + B ) (5-2) 1 P« Yt
- 59 -
wherei
the Hourly Submersion Dose Factor for nuclide
(1) in units mrem/hr per pCi/m based on a
half-infinite cloud geometry and corrected for
the fractional penetration of beta and gamma
radiations to the appropriate tissue depth
(7 > 10~ cm for skin and 5 cm for total body)
Eg, - the effective beta energy per disintegration
of radionuclide (1) in unit Mev, at the ap
propriate depth in tissue.
B , - the effective gamma energy per disintegra
tion of radionuclide (i) in unit MeV, at the
appropriate depth in tissue.
8,87 « 10~ - the constant which takes into consideration
the density of air as well as the conversion
from MeV to rem.
In application of this equation, the Hourly Submersion Dose
Factor is independent of body size. This follows from an assump
tion that the presence of the person does not significantly per-
turbate the radiation field.
The value of the Submersion Dose Factor is presented in
Table 5-1 (for fifteen isotopes of noble gases and iodines and
for two organsi total body and skin) [2,3],
5.1.2. Inhalation Pose Factor 3
The inhalation Dose Factor (mrem/y per pCi/m ) was calculated
by multiplying the person's breathing rate (m /hr), an occupancy
factor (hrs/year), and the Intake Dose Factor (mrem/pCl intake).
Inhalation rates
The ICRF [25} has defined the inhalation rate of Standard
Man as 20 m /day. nils rate «as adopted for the adult. Data on
inhalation rata versus age are limited [2,3], Values selected
for this report wee« those derived by Rohmr and Kaye [ 2,3 ] from
oxygen consumption, oxygen concentration in ambient, air (20.9%),
and Cxygen content of exhaled air. The data of Rohnsr and Kaye
for male and female children were averaged to yield rates of
- to -
14 m /day for the teenager (14 yrs old) and 7.3 m /day for the
child (4 yrs old).
The occupancy factor
The occupancy factor was assumed to be 24 hr/day « 30.5
days/month * 12 months/year (S784 hrs/yr), assuming that the
person spends the major portion of this time in the place where
he resides.
The Intake dose factor
Inhaling radioactive materials can result in a radiation
dose to (1) lungs and upper respiratory tract from isotopes de
posited in the passages, (2) gastrointestinal tract (GI tract)
from isotopes originally deposited in the respiratory tract and
later removed by ciliary action and swallowed, (3) other organs
in which the isotopes may be deposited after they are absorbed
into the bloodstream from either the lung or GI tract.
The radiation dose rate to each organ will depend upon the
physical and chemical characteristics of the radionuclides in the
cloud and the distribution and retention of these materials in
the body. Although in many instances it is difficult to predict
the biological fate of the source material released from a facili
ty, radioiodine in most forms will be quickly absorbed from the
lungs into the blood stream and translocated to the thyroid. The
noble gases do not enter into the body metabolism but may be dis
solved to some extent in body fluids or fat.
The mathematical relationship that governs the accumulation
of a radionuclide in an organ during a period of exposure is not
known exactly. The ICRP [25] and NCRP [26] have assumed that for
each isotope there is one or more critical organ having a charac
teristic rate of accumulation and excretion. The radionuclides
are assumed to accumulate in the critical organ at a rate deter
mined by the amount present in air, the rate of inhalation, the
rate of metabolic transfer to the critical organ, and the rate
at which the body eliminates the radionuclides. It is assumed
that elimination is exponential, a constant fraction of the organ
burden being eliminated in unit tim«. Use of the exponential
model permits the concept of the "biological half-life" Tfc, a, ,
factor which can be used conveniently, in conjunction with the
radioactive half-life Tr. The overall rata at which the radio-
- SI -
a c t i v i t y owing t o a radionucl ide diminishes i n the c r i t i c a l organ can be expressed a s the e f f e c t i v e h a l f - l i f e T, which i s expressed by the fol lowing express ion .
The exponential model I s undoubtedly an o v e r s i m p l i f i c a t i o n but i t i s used because of i t s convenience as wel l a s i t s conservat ism. The intake Dose Factor can be c a l c u l a t e d from the equations g iven by the ICRP [ 2 5 ] ,
U . O . r . ) . 0.07* € T fa ( 1 . e ^.KSMt, ( 5 - 4 )
where:
(I.D.F.) » intake dose factor (farero/pCl intake).
£ » effective absorbed energy of the specific
nuclide in the specific organ under consider
ation, MeV
fa » the fraction of the Inhaled material that
reached the organ under consideration.
T - the effective half-life of the nuclide in
the organ under consideration/days.
t - length of time over which the dose is cal
culated, days. For present application t was
1 year.
a » mass of the organ, gram.
Values of the parameters required for these equations were
taken from the ICRP [25] for the adult. Values of the parameters
for children and teenagers for calculation of the radiation dose
to the thyroid from radioiodine were taken from the literature
[2 J and are presented in table 5-2.
Effective decay energies were derived for children's organs
by utilising the model of the ICRP, whereby the nuclide is con
sidered to be concentrated in the center of a spherical organ of
effective radius (x) [25]. The values of x were determined from
organ weights, using the assumptions that (x) was proportional

- 62 -
to the cube root of the organ weight, and the proportionality
factor was the same as that for the corresponding adult organ.
Decay schenes chosen were those of Lederer et al. [27], average
beta energies were estimated frost the graphs of E/EQ given by
Stack and Kay |_28]. organ weights for thyroid and total body
were derived from the literature [2] listed in Table 5-3.
The calculated value of the Inhalation Dose Factor is
presented in Table 5-4 (for five isotopes of iodines, three
groups of people: child, teenager and adult, and two organs:
thyroid and total body). The Inhalation Dose Factor represents
the dose in the first year after intake.
5.2. Population Doses
The Population Dose (Dp) in man-rea/year to organ (j) of the
Individuals in the group n from nuclide 1, via pathway k, is de
termined by multiplying the average individual dose to the same
organ j of the same group of people n froa the saw nuclide 1,
via the sane pathway k, by the number of the population group n
located within the sector in question [29,30] and summing over
all subgroups of people in this sector. Mathematically this can
be expressed:
" •» D ( p , i k -i " I D< Ir i n ' V 1 0
i<k,3 j ^ i , f c , ] , n n
where
D(p> it-; - Population Dose from release of radionuclide
i via pathway k to j organ .fithin a given
sector, man-rem/year
D. ., . _ = The average individual dose within a given *•,*» 3 »n
sector from radionuclide i via pathway k to
organ i of group a of the population,
mrea/year
Nn « the number of people in n group of the ex
posed population within a given sector.
Submersion population doses and inhalation population doses
ware calculated from the above expressions.
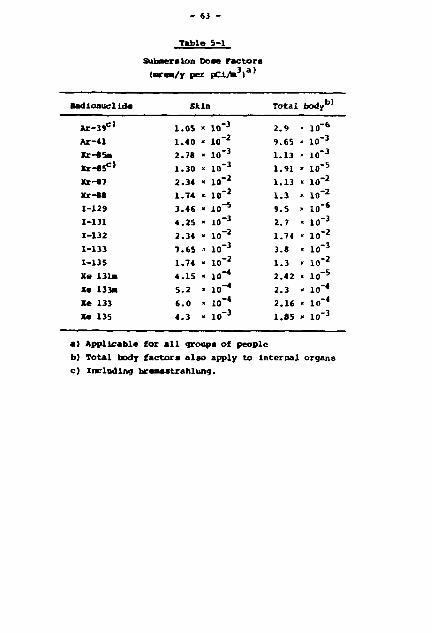
- 63 -
Table 5-1
Submersion Dose Factors
(nrea/y per pCi/m3)*'
Radionuclide Skin Total body'
*r-39c>
Ar-41
KT-SSM
Kr-85c>
ar-87
Kr-88
1-129
1-131
1-132
1-133
1-135
Xe 131a
Xe 133a
Xe 133
Xe 135
1.05
1.40
2.78
1.30
2.34
1.74
3.46
4.25
2.34
7.65
1.74
4.15
5.2
6.0
4.3
X
x
X
x
x
X.
K
-x
.= X
X
x
X
X
lo"3
lo"2
lo'3
lo"3
lo"2
ID"2
ID"5
ID"3
lo"2
lo'3
ID"2
IO"4
lo"4
lo"«
lo"3
2.9
9.65
1.13
1.91
1.13
1.3
9.5
2.7
1.74
3.8
1.3
2.42
2.3
2.16
1.85
» « , X
x
» X
« x
* X
X
X
» X
lo"«
lo"3
10-3
lo'5
IC'2
ID'2
lo'6
lo'3
IQ"2
lo"1
IC'2
lo"5
io-4
lo'4
lo"3
a) Applicable for all groups of people
b) Total body factors also apply to internal organs
c) Including hreasstrahlung.
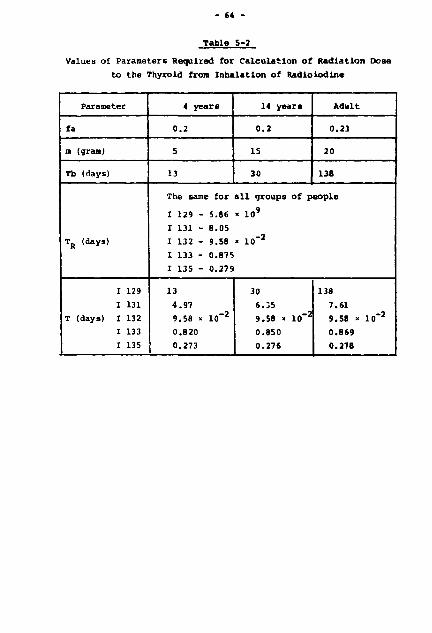
- 64 -
Table 5-2
Values of Parameters Required for Calculation of Radiation Doae
to the Thyroid from Inhalation of ttadiolodine
Parameter
fa
m (gram)
Tb (days)
TR (days)
I 129
I 131
T (days) I 132
I 133
I 135
4 y e a r s
0 .2
5
13
14 years
0.2
15
30
Adul t
0.23
20
136
The sane for a l l groups of p e o p l e
I 129 - 5.86 « 10 9
I 131 - 8.05
I 132 - 9.58 • 1 0 " 2
I 133 - 0.875
I 135 - 0.279
13
4.97
9.58 « 10" 2
0.820
0.273
30
6.35
9.58 x 10" 2
0.850
0.276
138
7.61
9.58 * 1 0 " 2
0.869
0.278
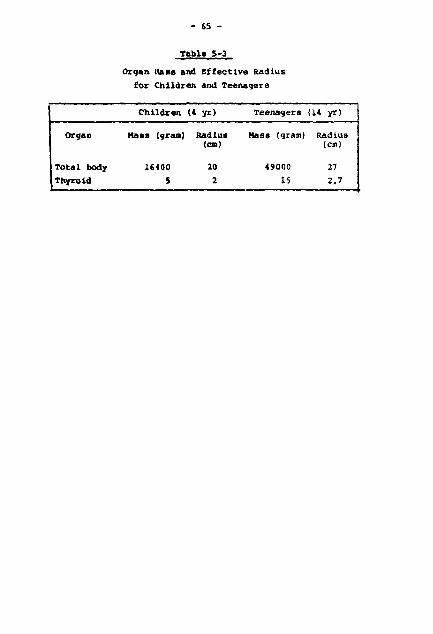
es
Table 5-3
Organ Haas and Effective Radlus
for Children and Teenagers
Organ
Total body
Thyroid
Children (4 yr)
Naaa Igran) Radius (en)
16400 20
5 2
Teenagers
Mass (gram)
49000
15
(14 yr)
Radius (cm)
27 2.7

Table 5-4
Inhalation Dose Factor
(mrem/y per pCi/m )
Radionuclide
I 129
I 131
I 132
I 133
I 135
Child
T. body
5.58 x 10~3
1.65 x 10~2
1.52 » 10"3
5.0 « 10~3
3.06 x 10~3
Thyroid
4.86
8.2
0.48
2.98
1.08
Teen
T. body
4.23 » 10-3
1.22 x io-2
1.13 x io"3
3.48 x lo-3
2.28 x io-3
Thyroid
3.6
5.75
0.33
1.97
0.74
Adult
T. body
3.26 x io~2
1.83 » 10"2
1.2 x in-3
3.85 x lo"3
2.47 x io-3
Thyroid
3.4 « 101
1.04« 101
0.427
2.57
0.98

- 67 -
6 . APPLICATION - EXAMPLE
The model of c a l c u l a t i o n submersion populatio doses and i n halat ion populat ion doses presented in t h i s report i s used t o c a l c u l a t e these doses for people located within 200-1000 kin's d i s t a n c e from a hypothet ica l nuclear power plant s i t e d near the geographical centre of Denmark during normal operation [3S). The scheme of t h i s model i s the fo l lowing:
SOURCE TERN
MODEL
_i_ AIR
TRANSPORT MODEL
SUBMERSION AND INHALATION INDIVIDUAL DOSE MODEL
SUBMERSION AND INHALATION POPULATION DOSE MODEL
6.1. Source Term Model - Q.
In this example two cases are considered.
- Unit release rates of 15 Isotopes of noble gases and iod
ines.
- Actual release rates for two types of Light water Reactor
Plants (LWR) i the Boiling Mater Reactor (BHR) and the
Pressurized Water Reactor (PWR).

- 68 -
6.1.1. Unit Release Rates - 0 , - 1 pCi/s
In this example unit release rates (1 pCi/s) are considered
of 15 isotopes of noble gases and iodines which are listed belov.
Radionuclide
Ar-39 Ar-41
Kr-85m Kr-85 Kr-87 ltr-88
1-129 1-131
1-132 1-133
1-135 Xe-131m Xe-133m Xe-133 Xe-135
Halt Life
270 y 1.83 h
4.4 h 10.76 y
76 m 2.8 h
1 . 6 - 1 0 7 y 8 .05 d
2 .3 h 21 h 6.7 h
12 d
2.3 d 5.27 d
9 .2 h
6.1.2. Actual Release Rates for FUR and BWR
The estimation of release rates of radioactive substances
(ten isotopes of noble gases and iodines) in gaseous effluents
for a 1000 MWe reactor, type BWR (for 7 BWR Gaseous Radwaste
Treatment Cases) or PWR (for 9 PWR Caseous Radwaste Treatment
Cases), perhaps located in the middle of Denmark, is presented
below. An accurate description of these values is given in
point 3 of this report [4,5].
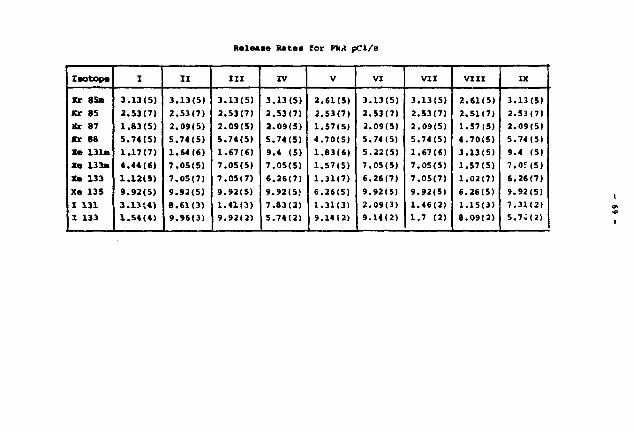
Release Rate* for PK4 pCi/s
Isotope
Kr 85B
Kr 85
Xr 87
Kr 88
Xe 131m
Xe 133M
X* 133
Xe 135
I 131 I 133
I
3.13(5)
2.53(7)
1.83(5)
5.74(5)
1.17(7)
4.44(6)
1.12(9)
9.92(5)
3.13(4)
1.54(4)
II
3.13(5)
2.53(7)
2.09(5)
5.74(5)
1.64(6)
7.05(5)
7.05(7)
9.92(5)
8.61(3)
9.96(3)
III
3.13(5)
2.53(7)
2.09(5)
5.74(5)
1.67(6)
7.05(5)
7.05(7)
9.92(5)
1.41(3)
9.92(2)
IV
3.13(5)
2.53(7)
2.09(5)
5.74(5)
9.4 (5)
7.05(5)
6.26(7)
9.92(5)
7.83(2)
5.74(2)
V
2.61(5)
2.53(7)
1.57(5)
4.70(5)
1.83(6)
1.57(5)
1.31(7)
6.26(5)
1.31(3)
9.14(2)
VI
3.13(5)
2.53(7)
2.09(5)
5.74(5)
5.22(5)
7.05(5)
6.26(7)
9.92(5)
2.09(3)
9.14(2)
VII
3.13(5)
2.53(7)
2.09(5)
5.74(5)
1.67(6)
7.05(5)
7.05(7)
9.92(5)
1.46(2)
1.7 (2)
VIII
2.61(5)
2.51(7)
1.57(5)
4.70(5)
3.13(5)
1.57(5)
1.02(7)
6.26(5)
1.15(3)
8.09(2)
IX
3.13(S)
2.53(7)
2.09(5)
5.74(5)
9.4 (5)
7.Of(5)
6.26(7)
9.92(5)
7.31(2)
5.7^(2)

- 70 -
Releasa Rates for BHR pCi/s
Isotope
Kr 85m
Kr 85
Kr 87
Kr 88
Xe 13in
Xe 133m
Xe 133
Xe 135
I 131
1 133
I
3.65(9)
2.01(7)
8.67(9)
1.12(10
1.75(7)
2.43(8)
6.79(9)
1.91(10:
3.92(5)
2.24(6)
11
3.65(9)
2.01(7)
8.87(91
1.12(10)
1.75(7)
2.43(8)
6.79(9)
1.91(10)
1.02(4)
5.74(4)
III
2.11(8)
2.01(7)
1.51(6)
1.28(B)
8.09(6)
4.44(6)
1.31(9)
1.10(7)
7.05(3)
3.92(4)
IV
2.11(8)
2.01(7)
7.31(6)
1.28(8)
8.09(6)
4.44(6)
1.31(9)
1.10(7)
7.05(3)
3.92(4)
V
2.11(8)
2.01(7)
1.77(6)
1.28(8)
8.09(6)
4.44(6)
1.31(9)
H 5 ( 7 )
8.87(3)
4.96(4)
VI
1.91(6)
2.01(7)
2.61(5)
2.87(5)
2.22(6)
2.61(4)
1.31(8)
9.66(6)
1.8 (3)
1.02(4)
VII
9.66(5)
l.9«(7)
2.48(6)
3.13(6)
7.83(4)
2.61(4)
6.00(7)
1.15(7)
4.18(2)
1.33(3)

- 71 -
6.2. M r Transport Modal - Cx
In this example Is calculated the atmospheric radionuclide
concentration from 200 km up to 1000 kn (250 km, 350 km, 450 km,
S50 km, 650 kn, 750 km, 850 km, 950 kn) downwind distances from
a hypothetical nuclear power plant sited near the geographical
centre of Denmark to each of 12 compass-point sectors for unit
release rates of IS radionuclides and actual release rates (BWR
and PNR).
The expressions for calculating the atmospheric radionuclide
concentration are given In section 4 (4-1, 4-7, 4-13, 4-14, 4-15,
4-16, 4-17, and 4-18). The values of the parameters used in the
calculations are the following:
fs " the frequency of the occurrence of particular
stability conditions A, B, C, D, E, and F. In this
example is used the values of fs which are obtained
by measurements along the Risø tower in the period
from February 1st, 19S8, to December 31st, 1967:
1.1771> 1.741*| 3.3411; 60.257%; 27.108%* 6.526%
correspondingly for the A, B, C, D, E, and F cat
egories.
L » the mixing height. This calculation uses the val
ues of L attributed to Klug [7,17j for Mest Germany
which are given below for A - 1500 mj B - 1500 m>
C - 1000 mj D - 500 n| E - 200 m; F - 196 m.
u - the mean wind speed for each wind direction sector;
the values of u in this calculation were obtained
by measurements along the Risø tower in the period
from February 1st, 1958, to December 31st, 1967,
and are presented below.
Wind direction
sectors
ii| m/s
0
7.7
1
8 .0
2
8 .0
3
8 .7
4
8 .0
5
6.9
6
6.4
7
5 .9
8
4 . 9
9
8 .3
10
8 .8
11
8 .2
f - the frequency of the occurrence of wind direction
for th« compass sector being considered. The values

of f were also obtained by measurements at the Ris«
tower during the same period as u and fs and are
listed below: for 0 - 7.4%| 1 - lO.Slj 2 - 14«;
3 - 12.9%J 4 - 7.7%* 5 - «.01# 6 - 6.2%» 7 - 5.1%»
8 - 4.1»» 9 - 7.4%» 10 - 9.4%j 11 - 9.1% [31].
n = number of compass sectors considered) in this case
n - 12.
h = stack height or emission point above the surface!
this calculation uses h » 0.
f = the effective period of time in which the dry
deposition process is active* In this calculation
it is assumed that f_ is equal to 56.5%.
fw • the effective period of time in which the wet
deposition process is active; this example uses fw
for Denmark that is equal to 43.5% (percentage of
days with rain) [32].
V,, = the deposition velocity of radionuclide ij in this
report it is assumed that noble gases and iodine
have deposition velocities of 0 and 0.5 cm/a respec
tively [16].
A, » the washout coefficient of radionuclide ij in this
report it is assumed that the noble gases and iodine
have washout coefficients of 0 and 2 * 10* sec"
respectively [ 16].
6.3. Submersion and Inhalation Individual Dose Model
In this report the submersion and inhalation individual doses
are calculated at the following distances) 250 k», 350 to, 450 km,
550 km, 650 km, 750 km, 850 km, and 950 km from a nuclear powar
plant to each of 12 compass point sectors for unit release rates
of 15 radionuclides (isotopes, noble gases, and iodines) and
actual release rates from a BWR or a PWR (9 cases for a FUR and
7 cases for a BWR).
6.3.1. Submersion Individual Dote Model
The Submersion Individual Dose was only calculated for one
group of people because it is independent of body six*. This fol-
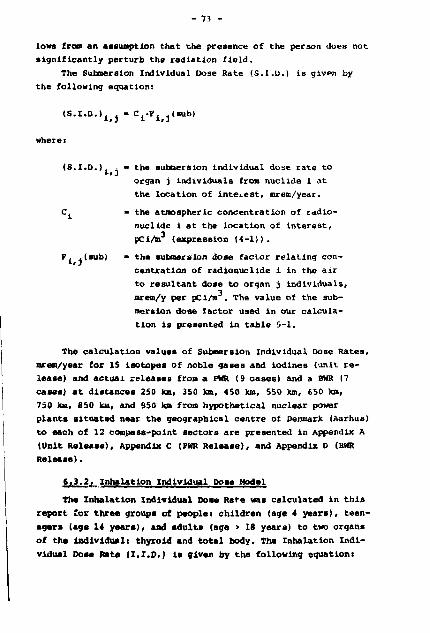
- 73 -
lows from an assumption that the presence of the person does not
significantly perturb the radiation field.
The Submersion Individual Dose Rate (S.l.u.) is given by
the following equation:
<«.I.D.I1#J-C1.Flfjt«.bl
( S . I . D . ) . . « the submersion ind iv idua l dose rate t o organ j Indiv iduals from nucl ide 1 at the l oca t ion of i n t e r e s t , rarem/year.
C, - the atmospheric concentrat ion of rad io
nucl ide i a t the l o c a t i o n of i n t e r e s t ,
pCi/m3 (express ion ( 4 - 1 ) > .
P, .(sub) • the submersion dose factor r e l a t i n g con-centra t ion of radionucl ide i in the a i r to r e s u l t a n t dose t o organ j ind iv idua l s , ntrem/y per pCi/m . The value of the submersion dose fac tor used in our c a l c u l a t i o n i s presented In t a b l e 5 - 1 .
The c a l c u l a t i o n values of Submersion Individual Dose Rates , mrem/year for IS Isotopes of noble g a s e s and i od ines (unit r e l ease ) and ac tua l r e l e a s e s from a PWR (9 c a s e s ) and a BWR (7 cases ) a t d i s t a n c e s 250 km, 350 km, 450 km, 550 km, 650 km, 750 ku, 850 km, and 950 km from hypothe t i ca l nuclear power p lan t s s i t u a t e d near the geographical centre of Denmark (Aarhus) t o each of 12 compass-point s e c t o r s are presented in Appendix A (Unit R e l e a s e ) , Appendix C (PWR R e l e a s e ) , and Appendix D (BHR R e l e a s e ) .
6 . 3 . 2 . inha la t ion Individual pose Model
The Inhalat ion Individual Dose Rare was ca lcu la ted in t h i s report for three groups of people) c h i l d r e n (age 4 y e a r s ) , t e e n agers (age 14 y e a r s ) , and adul t s (age > 18 years) t o two organs of the Indiv idual ! thyroid and t o t a l body. The Inhalat ion I n d i vidual Dose Rate ( I . I . D . ) i s g iven by the fo l lowing equation!
I

<I-I-D-»l.j.B-cr'i.j.n(1,,h>
where:
II.I.D.). . _ = the inhalation individual dose rate to *, 3»n
organ j ind iv idua l s In the group n from nuclide i at the loca t ion of i n t e r e s t , mrem/year.
C - the atmospheric concentration of r a d i o nuclide i at the locat ion of i n t e r e s t . pCi/m3 (expression ( 4 - 1 ) ) .
F< -i - ( i n n > - t n e inhalat ion dose factor r e l a t i n g t o radionuclide i in the a i r to resu l tant dose to n group of people on organ j , mrem/y per pCi/m . The value of Inhalat ion dose fac tors for three groups of people t o thyroid and t o t a l body are l i s t e d i n tab le 5 -4 .
The ca lcu la t ion va lues o f Inhalation Individual Dose Rates, mrem/year for 15 Isotopes of noble gases and iod ines (unit r e l ease ) and actual r e l e a s e from a PWR (9 cases) and a BWR (7 cases ) a t d i s tances 250 km, 350 km, 450 km, 550 km, 650 km, 750 kn, 850 km, and 950 km from hypothet ical nuclear power p lants s i tuated near the geographical centre of Denmark (Aarhus) to each of 12 compass-point s e c t o r s are presented in Appendix A (Unit Re lease ) , Appendix C (PUR Release ) , and Appendix D (BWR R e l e a s e ) .
6 . 4 . Submersion and Inhalat ion Population Pose Model
In t h i s report are est imated the submersion population dose and inhalat ion individual does a t the fol lowing range of d i s tances: 200-300 km, 300-400 km, 400-500 km, 500-600 km, 600-700 km, 700-800 kn, 800-900 km, 900-1000 km from a n u c l u r power plant to each of 12 compass-point s e c t o r s ( t o t a l l i n g 96 sec tor segments) for un i t r e l e a s e r a t e s o f 15 radionucl ides ( I so topes , noble g a s e s , and Iodines) and actual r e l e a s e r a t e s from a BWR or a PWR.

- 75
6.4.1. Submersion Population Dose - (S.P.D.)
The Submersion Population Ooses (S.P.O.) vlthln the m sector
segment In question axe given by the following equation:
(S.P.D.) . . m - (S.I.D.K . -N » 10"3 i,J,m i.J.m m
(S.P.D.)j . » the Submersion population dose iron a release of radionuclide 1 to organ j of people within m sector segment in question, man-rem/year.
(S . I .D. ) . j _ " the average submersion individual dose 1,3, m ra te to organ j individuals from radionuclide i within sector segment m in question, mreiTi/year.
N » the number of people within m sector segment in question, man.
The Submersion Population Dose (S.P.D.) within a given sector (whole) i s given by the following equation:
' " • ' • D - ) i . l . q " J i ( s - p - D - , i . 3 .™
(S.P.D.). , « the submersion population dose from a release of radionuclide 1 to organ j of people for wind direction sector q (In fcha range of 200-1000 km), man-rem/ year.
(S.P.D.), . _ » the submersion population dose from a release of radionuclide 1 to organ j of people within each m segments of wind-direction sectors q (8 segments for one d i rect ion wind sector) , man-rem/year.
1

The Submersion Population Do«« (S.P+U.} for on« ring sector
to all wind direction .vectors is given by the following equation:
(S-p-I,-,i.j.«-2l ,B-P-D'i.i.-
(S.F.D.). . . = the aufanerslon population dose from a i# J,*
release of radionuclide i to organ j
of people within x ring sector for all
wind direction sectors (12),
man-rem/year.
(S.P.D.) . • = the suhaersion population dose from a
release of radionuclide i to organ j
of people within each a segment of ring
sectors q (12 segments for one ring
sector), man-rea/year.
The Submersion Population Dose for all ring sectors is given
by the following expression:
where:
(S.P.D.), . - the sutanersion population dose from a release of radionuclide i to organ j of people within al l ring sectors (8), man-rem/year.
(S.P.D.), . • the eubaersion population dose frost released radionuclide i to organ j of people within each ring sector z (8 ring sectors), nan-rsa/year.
The calculated values of Submersion Population Dose Ratas, man-ram/year, for 15 isotopes of noble gas«* and Iodines (unit release) and actual releases frost PUB (9 caaea) and BHR (7 cases) for each of 96 (8 x 12) sector segments, each of 12 wind direction sectors, each of 8 ring sectors, and for a l l ring sec-

- 77 -
tora around a hypothet i ca l nuclear paner plant eventual ly s i t u ated near the geographical centre of Denark (Aarhus) are pre sented i n Appendix B (Unit Re lease ) , Appendix c (PMR Re lease s ) , and Appendix D (BUR R e l e a s e s ) .
t . 4 . 2 . Inhalat ion Population Dose - ( I . P . P . )
The Inhalat ion Population Doses ( I .P .O. ) wi th in a s t a t e r segments In quest ion are g iven by the fol lowing equation:
( I . P . D . ) . . - I U . P . D . ) . -N * 10 J
1»]#" fj^i 1 ,3 ,n ,a n,n
wheres
(I.P.D.), . " the inhalation population dose from 1,3,m
a release of radionuclide i to organ j
of people within a sector segment in
question, man-rem/year.
(I.P.O.), 4 _ • the average inhalation individual dose
rate to organ ] of group n of people
frost a releab of radionuclide i within
m sector segnent in question, mrem/year;
the inhalation individual dose rate was
calculated for three groups of people:
child (age 4), teenager (age 14), and
adult (age > 19).
N _ * the mother of n group of people within n,m
m sector segment in question, man; in
this report is considered the following
groups of people: children (age 0-9);
teenagers (age 10-19), and adults (age
> 19).
The Inhalation Population Doses for each wind direction sec
tor, each ring saetor and all ring sectors were calculated in the
same way as the Submersion Population Doses.
The calculation value* of Inhalation Population Dose Rates,
man-raa/year, for 15 isotopes of noble gases and iodines (unit
ralaasa), and actual relaasa froa PMR (9 cases) and BMR (7 cases)
for each of 9C (8 * 12) sector segnents, each of 12 wind direction

- 78 -
sec tors , each of 8 ring s e c t o r s and for a l l rlnet sector« around hypothetical nuclear power plants located near the geographical centre of Denmark (Aarhus) are presented i n Appendix 8 (Onit Release) , Appendix C (PWR Release ) , and Appendix D (BMR Release ) .
6 . 4 . 3 . The population Dis tr ibut ion around Hypothetical Muclear Power Plants located Hear the Geographical Centre of Denmark - Aarhus
The population was considered front 200 Urn t o 1000 km around a hypothetical nuclear power plant s i tuated near the geographical centre of Denmark, The area around the plant W B divided i n t o 96 (B x 12) sector segments and the population within these sec tor segments W B determined according to 1972 census f igures [33] 38 reported by the United Nations . The population d i s t r i b u t i o n by sector segment and for three groups oE peoples chi ldren {age n-9) , teenagers (age 10-19) , and adul t s (age > 19) are shown below and in figure 6*1.
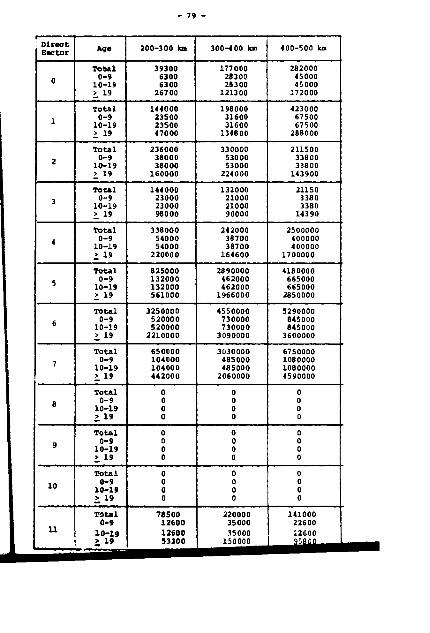
- 79
1 ! Direct Sac tor
0
1
2
3
4
5
6
7
8
9
10
11
Age
Total 0-9
10-19
i 19
Total 0-9 10-19 i 19
Total 0-9 10-19 i 19
Total 0-9 10-19 I 19
Total 0-9 10-19 L 19
Total 0-9 10-19 I 19
Total 0-9
10-19 i 19
Total 0-9
10-19
11' Total 0-9
10-19 i 1'
Total 0-9
10-19 > 19
Total 0-9
10-19 > 19
Total 0-9
10-19 > 19
200-300 km
39300 6300 6300 26700
144000 23500 23500 47000
236000 38000 38000 160000
144000 23000 23000 98000
338000 54000 54000
220000
825000 132000 132000 561000
3250000 520000 520000 2210000
650000 104000 104000 442000
0 0 0 0
0 0 0 0
0 0 0 0
78500 12600 12600 53300
300-400 km
177000 28300 28300
121300
198000 31600 31600
134800
330000 53000 53000 224000
132000 21000 21000 90OO0
242000 38700 38700
164600
2890000 462000 462000 1966000
4550000 730000 730000
3090000
3030000 485000 485000 2060000
0 0 0 0
0 0 0 0
0 0 0 0
220000 35000 35000
150000
400-500 km
282000 45000 45000 172000
423000 67500 67500 288000
211500 33800 33800 143900
21150 3380 3380
14390
2500000 400000 400000
1700000
4180000 665000 665000 2850000
52900QO 845000 845000 3600000
6750000 1080000 1080000 4590000
0 0 0 0
0 0 0 0
0 0 0 0
141000 22600 12000
^ ^ 9 5 8 0 ^ ^ _

- 80 -
500-600 km
346000 55400 55400
235200
516000 82500 82500
351000
1403959 226000 226000 851959
0 0 0 0
3050000 490000 490000
2070000
4000000 640000 640000
2720000
5840000 930000 930000
39B0O00
8280000 1300000 1300000 5680000
0 0 0 0
0 0 0 0
0 0 0 0
259000 41500 41500
176000
600-700 km
410000 655O0 65500
279000
610000 975 00 97500
415000
76200 12200 12200 518 00
374000 60000 60000
254000
3600000 575000 575000
2450000
4140000 660000 660000
2820000
7640000 1220000 1220000 4200000 •
10210000 1630000 1630000 6950000
1110000 177000 177000 756000
0 0 0 0
0 0 0 0
163000 26000 26000
111000
700-800 km
540000 85000 85000
334000
355000 57000 57000
241000
109000 17500 17500 74000
1570000 250000 250000
1070000
4720000 755000 755000
3210000
4340000 695000 695000
2950000
9850000 1580000 1580000 6690000
9850000 1580000 1580000 6690000
10200000 1630000 1630000 6940000
7050000 1130000 1130000 4790000
510000 81500 81500
347000
0 0 0 0
800-900 km
312000 50000 50000
212000
400000 64000 64000
272000
498000 79500 79500
339000
2230000 356000 356000
1518000
4700000 750000 750000
3200000
4700000 750000 750000
3200000
11000000 1760000 1760000 7480000
5110000 820000 820000
3470000
15600000 2500000 2500000
106 00000
6270000 1000000 10 00000 4270000
294 000 47000 47000
200000
0 0 0 0
i
900-1000 km
198000 32000 32000
134000
623000 100000 100000 423000
1507000 240000 240000
1027000
1640000 260000 260000
1120000
5250000 835000 835000
3500000
5960000 950000 950000
4060000
9920000 1590000 1590000 6740000
5720000 915000 915000
3890000
12100000 1940000 1940000 8220000
1640000 260000 260000
1120000
410000 65500 65500
279000
0 0 0 0
£
353

6_._5. Sensitivity Studies: Effects of raraneter Variations
Parameter variations were made and analysed to better under
stand the mechanises ir. the model of calculation. In a oer.eral
study such as this it is virtually impossible to take into ac
count all variations which night occur; however, sensitivity
studies were perfooed to evaluate the effects of uncertainties
in the parameters believed to be most significant in their ef
fects on the radiation potentially received by the population.
A series of calculations was made to estimate the effects of
variations in meteorological conditions on individual doses.
Changes were ar.sumed in mixing layer depth, atmospheric stabil
ity, deposition velocity, washout coefficient, and frequency of
precipitation.
6.5.1. Mixing Depth
In this report different versions of the depth of the nix
ing layer are:
a) at first are used the values of thti depth of the mixing
layer (L) attributed to Klug i.7,17] for West Germany
which are the following for A - 1500 m; B - 1500 m;
C - 1000 mj [) - 500 mj E - 200 aij F - 196 in (base case).
b) in the second case it is assumed that the value of L
is 1.5 times higher chan in the base case (with the ex
ception of value L for stability category F, because
the depth of the mixing layer fcr this category must be
less than 196 m in this calculation model) . This gives
the following values: for A - 2250 ni| B - 2250 m; C -
1500 m; D - 750 m; E - 300 m* F - 196 m.
c) in the third case it is assumed that the value of L
is 1.5 times lower than in the base case. The values
of L are the following: for A - 10*.' nj B - 1000 mj
C - 666 raj D • 333 mj E - 133 m» F - 130 m.
Because Kr „s unaffected by any depletion mechanism - other
than diffusion - thit radionuclide was chosen for this text.
The results of the calculation« are presented in Appendix
E.

- 83 -
6.5.2. S tab i l i ty Class
In t h i s report three different versions f;f s t a b i l i t y class are considered:
a) in the f i r s t case (base casu) an* used the values of the fretjuency of the occurrence of a par t icular s t a b i l i ty c lass (fs) which were obtained by measurements along the Rise* tower. The values of fs are the following: for A - 1.177%; B - 1.741%? C - 3.341"*; D - ^0.257-; E - 27.10*| F - f.,c-n [31].
b) in the second case i t i s assumed tha t the average daytime s t a b i l i t y c l a s s i f i ca t ion could be approximated by type C and the night-time c l a s s i f i c a t i o n by type D. Then the values of fs are the following: for A - 0*j E - 0*; C - 50«} D - 50%; E - 0%; F - OS.
c) in the third case it is assumed that the average stabil
ity classification during the whole time is D; then the
values of fs are the following: for A - 0%; B - 0%j
C - 0%; D - 100*; E - 0%; F - 0%.
Because Kr is unaffected by any depletion process - other than
diffusion - this radionuclide was chosen for this test.
The results of the calculation are presented in Appendix K.
f.5.3. Deposition Velocity
In this report five values of deposition velocity are taken
into account - Vg
- 0 cm/s - 0.2 cm/s - 0.5 cm/s (base case) - 1 cm/s - 2 cm/s
Iodine-131 was chosen for t h i s t e s t . The r e s u l t s of the calculat ioi are presented in Appendix E.
6 .5 .4 . washout Coefficient
In t h i s report five values of washout coeff ic ient are con-

- 84 -
- 0 sec
- 10 sec
- 5 * l o " sec " (base case)
- 2 * 10 sec
- I d " 3 s e c " 1
Iod in - -131 was chosen for t h i s t e s t . The r e s u l t s of t h e c a l c u l a
t i o n s a r e p r e s e n t e d in Appendix E.
6 . 5 . 5 . R a i n f a l l V a r i a t i o n s
In t h i s r e p o r t f i ve va lues of t n e p e r c e n t frequency of
r a i n f a l l - fw - were cons idered
- 0%
- 25%
- 43.5% (base case)
- 758
- 100«
Iod ine-131 was chosen for t h i s t e s t . The r e s u l t s of the c a l c u l a
t i o n s a r e g iven in Appendix E.
7 . SUMMARY
h model for e s t i m a t i o n of t h e p o t e n t i a l submersion and i n
h a l a t i o n r a d i a t i o n doses to people l o c a t e d w i t h i n a d i s t a n c e of
1000 km from a nuc lea r power p l a n t dur ing i t s normal o p e r a t i o n
i s p r e sen t ed m t h i s r e p o r t . The model was used to c a l c u l a t e
t he se doses for people l i v i n g 200-1000 km from a hypothet ica l nuc lea r f a c i l i t y s i t u a t e d near the g e o g r a p h i c a l centre of Den
mark. For t h i s s i t u a t i o n two c a s e s of sources are considered:
- u n i t r e l e a s e of 15 i s o t o p e s of noble g a s e s and iod ines ( l i s t e d in 6 .1 .1) which c o n s t i t u t e the major radiat ion hazards in gaseous e f f l u e n t s ,
- e f f l u e n t r e l e a s e s from two types of 1000 MWe Light Water Power R e a c t o r s : the B o i l i n g Hater Reactor (BWR) and the P r e s s u r i z e d Water Reactor (PWR).
Th i s r e p o r t c o n s i d e r s 16 c o n c e p t u a l gaseous radwaste t r e a t
ment systems cover ing t h e range of the s t a t e - o f - t h e - a r t in t r e a t -

- 85 -
ment technology for BWR and PWR Bystens: 7 cases for BUR and 9
cases for PWH. Case No. 1 In each category is intended to provide
a basis for comparison to demonstrate the effectiveness of sub
sequent treatment systems. The succeeding cases are developed to
evaluate modifications in radwaste systems to reduce radioactive
emission.
Radionuclide releases from these facilities are estimated,
transport through the region is modelled, and the resulting con
centrations are used to calculate submersion and inhalation doses
to 235 million inhabitants of the study area.
The results of the study based on selected radiation waste
treatment systems for PWR and BWR reactors show that the radia
tion potentially received by the population from discharges of
radionuclides from these reactors represents only a small fraction
of the radiation received from natural background radiation. Table
7.1 presents a tabulation of the various sources of radioactivity
to which man is usually or occasionally exposed [34].
The total average annual whole body dose to the population
of the study area (rarem/capita) from natural _nd man-made sources
(without doses from radioactive effluents from the nuclear in
dustry) is about 136-351 mrem/capita. The average annual whole
body dose to the population of the study area from nuclear ef
fluents from PWR releases is about 2.0 * 10 - 2.0 * 10 nrem/
capita and BWR releases 1 » 10 - 7 » 10~ mrem/capita. The re
sults of the study indicate that the radiation doses generally
received by people in this region as the result of the operation
of a hypotehtical nuclear power plant located in Denmark would
be a very small addition to the unavoidable dose due to natural
background radiation, medical treatment, fallout from nuclear
weapons, and a variety of miscellaneous scurces of radiation.
In table 7.2 and table 7.3 are presented the average indi
vidual dose rates for the whole region of study (mrem/year per
capatl) for PWR releases and BWR releases respectively for 9
PWR Gaseous Treatment Systems and 7 BWR Gaseous Treatment Systems.
Average Individual doses for particular wind directions for
all rings and for particular rings for all wind direction sectors
are listed i.i tables 7.4 and 7.5 respectively (for PWR case 7).
Parameter variations were made and analysed to better under
stand the mechanism in the model. Because of the large contribu
tions from airborne radionuclides, uncertainties in meteorologi-
- 86 -
cal parameters can have relatively large effecta on radiation
potentially received by the population. A aeriea of calculations
m a Bade to estimate the effecta of variations in Meteorological
conditions on airborne radionuclide transport. Changes were as
sumed in mixing layer depth (Figure 7-1). atmospheric stability
(Figure 7-2), frequency of precipitation (Figure 7-3), deposi
tion velocities (Figure 7-4), and washout coefficients (Figure
7-5). Extreme variations of any one parameter could affect doses
by a factor of ten or greater. However, variations of this type
are expected to be short-lived and Mould not affect the Mason-
average values used in the study.

Table 7.1
Average annual whole body dose to population of study region
from various environmental sources, urea
Source
Natural ly occurring background r a d i a t i o n [34] F a l l o u t {34] Medical-dental sources o f r a d i a t i o n [34] Miscel laneous aan-aade sources of r a d i a t i o n (*V, watch, d i a l * , e t c . ) [34]
TOTAL
Potent ia l r a d i a t i o n i r o n 1000 MB* MR Nuclear Power F a c i l i t y a f f l u e n t s (•brawl operat ion)
P o t e n t i a l rad ia t ion from 1000 MHs PWR nuclear Power F a c i l i t y a f f l u e n t s Otoraal operat ion)
Annual dose area
100 5
30-200
1
136-351
1 * 10" 6 - 7 * 10~4
2 x 10"7 - 2 » 10~ 5

Table 7.2
Average individual doses for PWR release
(for all aectors and all rings)
mrem/year per capita
Case
1
2
3
4
5
6
7
• 9
I
Annual coata ($ thousands)
68
90
244
442
289
245
264
400
731
Av. individual submersion dose, mrem/y per capita
Skin
5.02 x lo"5
5.79 x io"*
5.79 x lo"*
5.45 x 10"*
3.34 x io"S
5.40 x 10"*
5.79 x 10"*
3.14 x 10"*
5.45 x 10"*
Total body
1.72 x 10"5
1.16 x 10"*
1.16 x 10"*
1.03 x 10"*
2.66 x lo"7
1.03 x 10"*
1.16 x 10"*
2.19 x lo"'
1.03 x lo"6
Av. individual inhalation dose, mren/y per capita
Thyroid
2.77 x io"*
7.70 x lo"7
1.29 x 10"'
7.15 x lo"8
1.20 x lo"'
1.84 x 10"'
1.41 x lo"8
1.05 x 10"'
6.72 x 10"8
Total body
5.02 •* 10"' 1.39 x lo"'
2.31 x 10"10
1.29 x 10"10
2.15 x lo"10
3.32 x lo"10
2.52 » 1 0 " U
1.89 x 10"10
1.21 » 1 0 " "
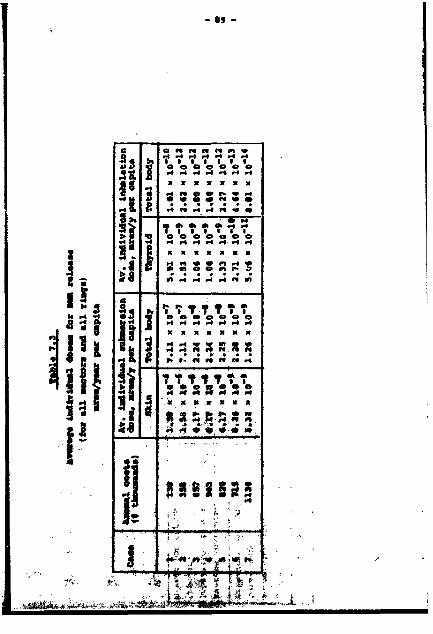
• 9
s
S h i1 li s
SS
's s s s's s s X X X X X X X
s 's 's 's Vs s
S S S 8 S S S x* ** w rt M « tn
ssVssVs
X X X X X X X
s's*««:
8 3 B 3 S S S
' i w ni
«fS#»<jP»jj»^a ><af i^
" • * " .1 i-i * A i f' l#'-» 1 : _ .*^^afatjfeterJ-;rf;lfeg.^^#

Table 7.4
Average individuals doses for particular wind directions for a l l rings (PHR ease 7)
ntrein/year per capita
Doses
Average individual
•utswralon dose to
total dody.
area/year per capita
Average individual
Inhalation dose to
ttqpraid,
a/year pax capita
0
1.34
x 10~6
2.05
x 10"8
1
1.61 x 10"6
3.06
x ID"8
2
2.49
x 10"C
4.14
x lo"8
3
1.6
x 10"6
2.16
« 10"8
4
1.17
x 10"'
1.63
x 10~8
5
1.20
« 10"6
1.67
x 10"8
6
1.33
x 10"6
1.76
x 10"8
7
1.14
x 10"6
1.24
x 10"8
6
7
x 10"7
3.05
x 10"'
9
8.73
x 10 "7
9.6
« 10"9
10
9.92
x 10 '
1.14
x 10"8
11
2.27
x 10"€
4.7 x 10"8
te
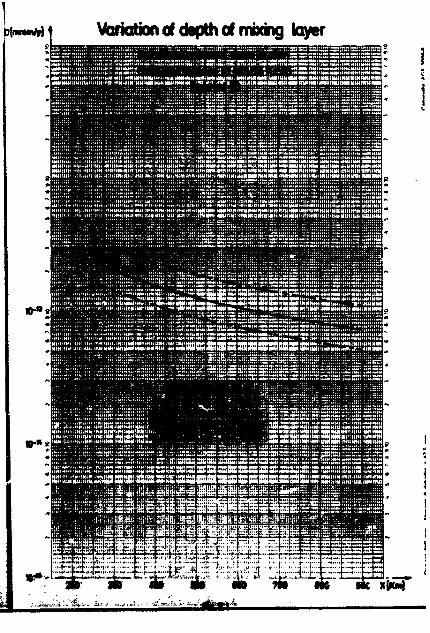
pimmiA\ Variation of depth of mixing layer

Table 7.5
Average individual doses for particular rings
for all wind directions (PWR case 7)
mrem/year per capita
Ring
200- 300 km
300- 400 k*
400- 500 ka
500- 600 In
C00- 700 ka
700- 800 ka
•00- 900 k»
900-1000 km
Average individual submersion dose to total body
nrem/year per capita
3.77 » lo"9
2.40 x 10"9
1.75 x lo"9
1.45 x 10"9
1.13 x lo~9
9.47 « 10""9
0.12 x lo"10
7.3« x lo"10
Average individual dose to thyroid
mrem/year per capita
9.18 » 10"11
4.67 x 10"11
2.76 x lo"11
1.9 x 1 0 " U
1.18 x 10"11
8.35 x io"12
5.87 x io"12
4.49 x lo"12
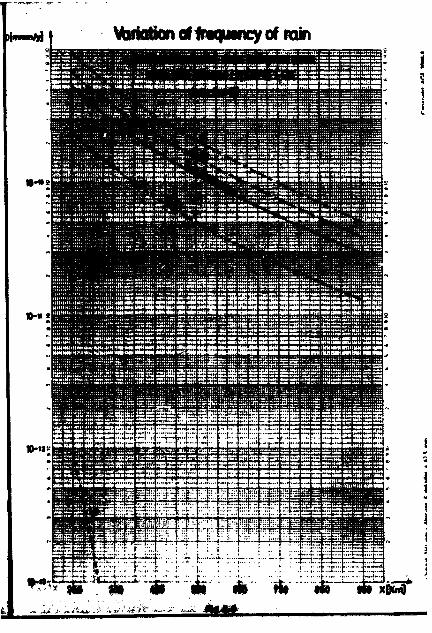
Moriation of treojutncy of Run
x(M
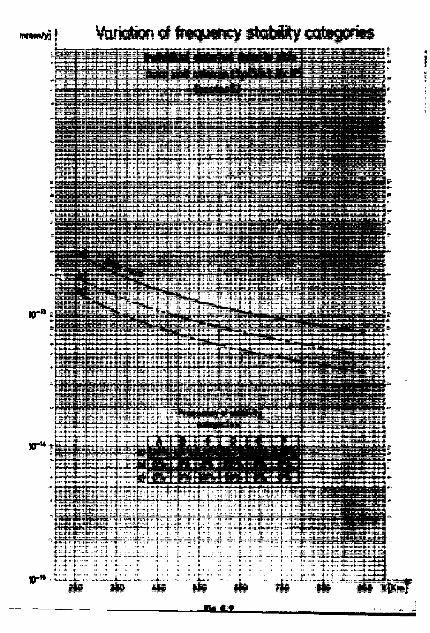
Variation of frequency stability categories
KT°s
WrH2
»*•
"»•»
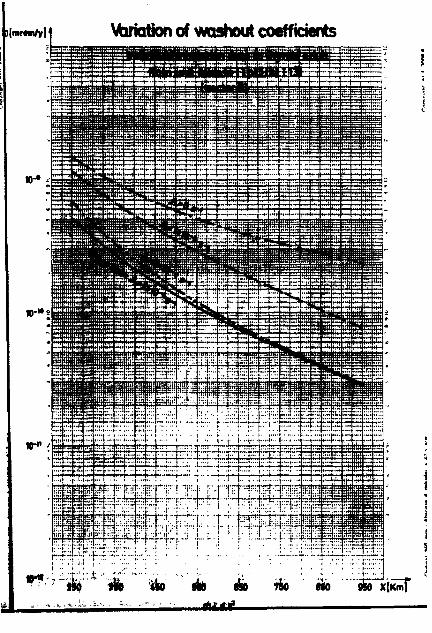
)[mrtm/y] Variation of washout coefficients
'i "lilt i I— If i j - i ' i l 1 .. - w . . „ . l i , „ I . . . . I . -f ,J>—^1-»_J.. „j. ..'iniii
J r W ;;::••[:•:(:, • • .r •;• •: .•• . ' .' :.."-.;-.-|.r * • : : » :
^ • m .Alk ••rli
wo no thitt
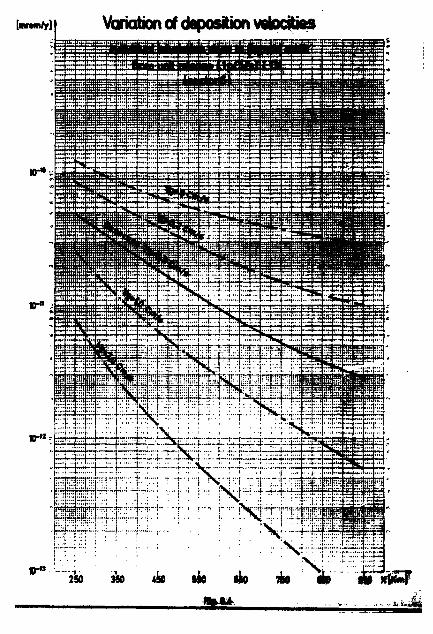
[mmn/y] Variation of deposition velocities

- P7 -
X wo ld Ilka to express ay sincere thanks to Mr. Ole aalnod-Larsen, Mr. Saras Thykier-Mielsen, and Mr. Per nedeaann Jensen for their helpful discussions and review of this aanaacrlpt. I am also grateful to Mr. Bedenaim Jensen for writing the computer prograa used In these calculations.
1) The Safety of Nuclear Power Raaetora (Light Water-cooled) and Relatod Fac i l i t i e s , MA6H-12SO (July 1973).
2) The Potential Radiological Implications of Nuclear Facil-i t i ea In the Opper Mississipi River Basin the the Year 2000, MMR-1Z09 (January 1)73).
3) Berneet A Digital Ccapvter Code for Estimating Regional Radiological Effacta fron the Nuclear Power Industry, HRDL-OB 71-166 (December W71).
4) Pinal Knviroaaental g f tenant Concerning Proposal Rule Making Action i Muaerical Guides and Llalting conditions for Operation to Meet the Criterion "As Low as Practicable" for Radioactive Material In the Light-water-Cooled Nuclear Power Reactor Bffluents, EI8-AA-73-1252-P-1 (July 1973).
5) Draft Enrlronaental stateaent Concerning Proposed Rule Making Aet Jon t Hamr Inal Soldes for Design Objectives and Malting Condition* for Operation to Meet the Criterion •As Low as Practicable" for Radioactive Material In Light-Mater-Cooled Nuclear Power Reactor Effluents, 0 .8 . Atonic BaeceyCoaaiaalon (Januar 1J73).
C) 3M. Beattle and Panela M. Bryant, Assesnsent of Environ-neatal Hasards fron Reactor Fission Product Releases, A»BR(«)R U 5 (May l»70) .
7) K.J. VOgt, Dispersion of Alrbmnw Radioactivity Released
(IMft, t l -1« l i n n H w %m, vlaana). .

- 98 -
8) Meteorology and Atomic Energy. TID-M190 (July 19C8).
9) F. Pasqull, The Estimation of Dispersion of Wlndborne Mater ia l , Meteorological Magazine 90, 1063, 33-49 (19(1).
10) J.M. Eisenbund, Environmental Radioactivity, Academic Press (1973).
11) D.B. Turner, Workbook of Atmospheric Dispersion Estimate*. Environmental Protection Agency (1970).
12) Environmental Analysis of tha Uranium Fuel Cycle, EPA-520-9-73-3-D (October 1973).
13) Environmental Radiation floss Commitmenti An Application to the Nuclear Power Industry, U.S. Environmental Protection Agency (February 1974).
14) J.F. Fletcher e t a l . , "Modelling the Regional Transport of Radionuclides in a Major United States River. Basin*, Symposium on the Envlromental Behaviour of Radionuclide Released in the Nuclear Industry (IAEA, 14-18 Hay 1973, Alx-En-Provence).
15) C.R. Dickson, Meteorology for the Loss of Fluid Test Reactor - Progrese Report, IDO-12059 (1987).
16) Reactor Safety Study, An Assessment of Accident Risks in U.S. Commercial Nuclear Power Plants, M&8H-140Q (August 1974).
17) A. Bayer et a l . . Population Doss Considerations for the Release of Tritium, Noble Oases and 1 3 1 I in • Special Region, Symposium on the Population Dose Evaluation and Standards for Man and His Environment (IAEA, 20-24 May 1974, Portoroz).
18) R.J. Engelmann, Calculation of Precipitation Scavenging of Particulates and Gases from the Atmosphere, Nuclear Safety 7 (3), 354 (1966).
19) J.R. Beattie, An Assessment of Environmental Hazards from Fission Product Releases, AHSB(3)R 9 (May 1981).
20) R.M. Clarke, Physical Aspects of the fffacta of Nuclear Reactors in Working and Public Environments, Berkley Nuclear Laboratories, Central Electricity Osnsrsting Board (January 1973). k : "

'»s. •" : - »» -
211- M.B. Stawrt and R.H. Crook«, Long-rang« Travel of the Radioactive Cloud Iron the Accident at Windacale, Nature Vol. M I , p. C27 {195«).
22) B . t . Air Force Report NARP-59-32I, Flaaion Product Yield Raleaaa (1959).
23) H.I. Plalda, Mpoaltloa Velocitie« of Airborne Fiaaion Product«, convalr deport PHI 1985 (I960).
24) R.J. tnoelaam, Waah-Oot Coeffiolanta for Selected Gaaea and Particolataa, BflRL-Sft-657 (1966).
25) Report on Coaaittae II on Peralssibla Dose for Internal Radiation, ICKP Publicationa 2 (195?).
26) National COnnoil on Radiation Protection and Measurement«, Baste Radiation Protection Criteria, NCRP Report No. 39 (January 1971).
27} C J«, Lederer at a l . . Table of Isotope*, 6-th Bd., John Wiley sad son«, inc . , new York (1967).
21) I.. sheok and K. My, Radiations from Radioactive Atoaa in Frequent Baa, 0 .8 . Atomic Energy Coaaission, Washington, D.C. (1959).
29) J . r . Soldat at a l . , 'Application« of a General Computational Model tot Composite Bnrironaantal Radiation Doses, Syapoeium on the Bnvlronaental Behaviour Radionuclide« Released in the nuclear Industry (XAXA, 14- l i Kay 1973, Alx-sh-Provence).
30) J.K. Soldat e t a t . , Coaputatlonal Motel for Calculating Doses fee« Badlonuollde« l a the twireote i : ; . Battle Pacific Northwest Laboratories (Ray 1973).
31} » .« , Jansaai, occurrences of Stabil i ty Classes Miad speeds aa« K*ad Directions as Observed at Bias, Riss-M-1666 (0c-
[piriøimgmni : ' • • • •
'• 32) ^a>s<f)t* »tat lat ik . Statist isk Årbog, 1972.
33) Drtograohts » a « s * « ugt, Unit«! sat ion«.

- lOO -
35) Per Hedeeann Jensen, POPDOS, A Conputer Model for Calculat
ing Individual and Population Doses Within a Radius ox
1000 km. Health Physics Department - Rls«, March 1975.