Embed Size (px)
Citation preview
Service sectors restrictiveness and economic performance: an
estimation for the MENA1 region
Novella Bottini, Mohamed Ali Marouani and Laura Munro
2
Abstract This article aims at assessing barriers to service provision in the banking and telecom (fixed and
mobile) sectors of four MENA countries, and the impact of these restrictions on firm performance. The
analysis is focused on computation of aggregate and modal trade restrictiveness indexes (TRIs) by
sector, drawing on information gathered from detailed questionnaires. These TRIs are used as
regressors of firms‟ economic performance indicators. The estimated coefficients of the TRIs are then
used to compute aggregate and modal tax equivalents of service restrictions by sector. The first
conclusion of this article is that significant regulatory reforms have taken place in the service sectors
over the last decade, but that a broad range of restrictions still remain. The most significant change in
these service sectors has been the lifting or softening of constraints on foreign equity participation.
These regulatory reforms, however, have had varying degrees of impact on market structure depending
on the country and the sector. The second conclusion is that service restrictions have an impact on
economic performance in the three studied sectors. While a rent-creating effect seems to dominate
restrictions on banking and fixed telecom sectors, a cost-inefficiency effect seems to dominate the
mobile telecom sector. Finally, interactions between modal restrictions seem to be taking place,
especially in the telecom sectors.
I Introduction
Given the large share of services in the world‟s GDP (around 60%) and their much lower
share in world trade (around 30%) trade theorists and practitioners have to understand the
reasons behind this difference and the contribution of regulatory service barriers to the
relatively low level of trade in services (Dee, 2003). Once we improve our knowledge of the
impediments to trade in services, we also need to understand the links between these
impediments and economic performance.
As argued by Konan and Kim (2004), the MENA region is a good candidate for an
examination of service trade policies due to its low economic performance in comparison to
other regions in the world. Moreover, high unemployment rates in the region, especially
among educated youth, argue in favor of developing service sectors, which are more intensive
in skilled labor.
1 Middle East and North Africa
2 Bottini : OECD and Cattaneo University -LIUC- ([email protected]); Marouani: Université Paris 1-
Panthéon-Sorbonne, DIAL, ERF and OECD visiting expert for this study ([email protected]);
Munro: OECD and Columbia University ([email protected]).
Acknowledgement: The authors would like to thank Raed Safadi for his constant support. The paper
has benefited from helpful comments from Dale Andrew, Bernard Hoekman, Douglas Lippoldt, Margit
Molnar, Hildegunn Nordas, Ben Shepherd, delegates at the Working Party of the Trade Committee,
and participants at the ERF 15th
Annual Conference in Cairo, Egypt. The authors also gratefully
acknowledge the financial support of the International Development Research Centre (IDRC) for the
realization of this study.

Measuring service restrictions provides a more objective basis for domestic policy debates, as
well as for bilateral, regional and international negotiations through more transparent
evaluations of reciprocity in concession-making (Findlay & Warren, 2000). Our investigation
can in this regard be useful in view of the Euro-Mediterranean negotiations on services
liberalization that were launched in the Marrakech Ministerial on 24 March 2006 with
participation from the EU, Egypt, Israel, Jordan, Lebanon, Morocco, the Palestinian Authority
and Tunisia. The EU has also begun to engage in bilateral negotiations with Egypt, Morocco
and Tunisia since the end of 2006.
However, assessing trade in services barriers is more difficult than assessing barriers to trade
in goods. Indeed, as noted by Hoekman (2006), given the domestic regulatory nature of
barriers to trade in services, there is no information on these restrictions in the form of
databases (as in the case of tariffs, for example). The quantification of these barriers must be
preceded by a collection of information on a sector-by-sector basis, relying on government
documents and the expertise of sector specialists (Mattoo, Stern, & Gianni, 2008). A useful
tool to synthesize this qualitative information is the Trade Restrictiveness Index (TRI)34
.
Although this method has been mainly applied in manufacturing sector analysis (Irwin, 2007),
it has also been adapted for services studies. The TRI translates qualitative information on
services regulations into an aggregated quantitative score by sector.
The two main benefits of synthesizing qualitative information in a quantitative index are first,
to enable the comparison of restrictions across countries at the sectoral level, and second, to
determine the impact of barriers on trade in services and on different variables of economic
performance. The main risk of such an exercise, however, is the traditional one researchers
face when moving from qualitative information on policy to a synthetic quantitative index:
some dose of subjectiveness. The methodological improvements proposed by researchers on
these subjects such as the use of factor analysis techniques try to minimize the subjectivity5.
The first objective of this article is to improve the estimation of service restrictions of barriers
in the banking and telecom (fixed and mobile) sectors of four MENA countries (Egypt,
Jordan, Morocco and Lebanon (for the banking sector only)). The choice of these sectors has
been driven by the idea that further integration of the MENA region into the world economy
would require the development of telecommunication sectors (mainly for backbone service
sectors where the region seems to have a comparative advantage) but also of efficient banking
services to help exporters better compete in the international markets.
Country selection for this study is primarily driven by recent reforms that have been
implemented in these sectors. The four countries included in this study have started domestic
reform programs to varying degrees in the analyzed service sectors. It is, thus, interesting to
assess the progress of reforms implemented at this stage. Given the scarce evidence available
for the MENA region and for developing countries in general, our analysis improves the
understanding of service barriers and offers useful policy implications.
This analysis covers the evolution of the regulatory framework of service sectors, as well as
the implementation of these regulations and their degree of restrictiveness. From this
perspective, we consider the following questions: Which reforms have reduced barriers to
trade in services in recent years? What disparities exist between regulations in principle and
in practice? How does the government maintain control despite the implementation of liberal
3 The concept of the Trade Restrictiveness Index was first proposed by Anderson & Neary (1994).
4 It is worth noting that this index captures restrictions to both foreign and domestic firms. Hence it is
not a pure „trade‟ restrictiveness index but it includes also constraint on domestic provision. 5 See Boylaud & Nicoletti (2000) for the use of factor analysis in determining the weights of the
different components of a synthetic index.

reforms? Foreign equity limits, for example, have been relaxed in most MENA countries in
recent years, yet many service markets remain dominated by state-owned or domestic
enterprises. High levels of state control persist in such cases through conflicting regulations
that protect current market structures.
The second objective of this study is to capture the impact of impediments to trade in services
on firm performance. Following Dihel and Shepherd (2007) we use sectoral firm performance
indicators as a proxy for the price-cost margin and we estimate the impact of TRI (both
aggregate and modal TRI) on them. In particular, the inclusion of modal TRI (the four modes
defined by the GATS6) allows us to investigate the issue of complementarity and substitution
between modes. The innovation of this work includes improvement in the regression‟s
econometric specification and greater reliance on developing countries data in the samples.
Different useful policy insights could be drawn from this analysis. Indeed, the sign of the TRI
coefficient in the regression also offers relevant policy conclusions. A positive impact of the
TRI on the price-cost margin suggest a rent-creating effect, i.e. policy that protects the local
market by allowing firms to charge a price mark up over marginal costs. On the other side, a
negative sign indicates a cost-creating effect, and consequently, a cost-inefficient market. The
implicit hypothesis behind this analysis is that firms in an uncompetitive environment charge
a lower mark up because they are constrained by higher costs induced by the higher levels of
protection. Accordingly, a negative TRI in the regression is associated with a cost-inefficient
market. As suggested by Hoekman (2006), “if the policies generate real costs, removing them
may give rise to much greater welfare gains than is the case if the policies generate rents that
are captured by domestic agents”. Indeed, while in the first case we would remove a market
inefficiency, in the second case we support a redistribution of income. While domestic firms
could suffer market share losses owing to the increased competition, local consumers (final
and intermediate) would gain in terms of better service quality, wider choice and lower prices.
However, in reality, service barriers are always rent-creating and cost-creating at the same
time. Given that performance indicators include both effects, the sign of the coefficient gives
us the dominant effect. A powerful tool to disentangle the two different effects would be to
separately regress the TRI on costs and prices. However, as these kinds of data are rarely
available, we follow the literature and rely on price-cost margins, which are accessible
through company account databases.
The third objective of this study is to compute tax equivalents of service restrictions. A tax
equivalent is the wedge between the actual price and the price that would prevail without
service barriers. The estimation of tax equivalents of services barriers was pioneered by the
Australian Productivity Commission. They can be used as inputs for modelling exercises such
as those performed by Konan and Kim (2004) or Konan and Maskus (2006).
The rest of the article is organized as follows: section two presents the methodology of the
article, section three presents the results and section four concludes.
6 Cross-border supply (mode 1) refers to the supply of a service from the country of the supplier into
the country of the consumer. Consumption abroad (mode 2) involves the purchase of services by the
consumer while abroad in the country of the supplier. Commercial presence (mode 3) entails the
supplier providing services through foreign-based establishment in the country of the consumer.
Movement of natural persons (mode 4) relates to the supply of services by an individual from the
country of the supplier (for short or long-term) in the country of the consumer.

II Methodology
In service sectors, barriers take the form of quotas, prohibition, licenses and government
regulation, none of which can be directly quantified. Owing to these features, our analysis
requires different steps of analysis. The first step is the computation of TRIs. Then, the
computed restrictions are regressed on sectoral performance7 to identify their economic
impact. Finally, the estimated TRI coefficients are matched with the TRI index and
transformed into tax equivalents. This section provides a detailed explanation of the
methodology applied in the three steps enumerated above.
II.1 The First Step: The TRI Computation
To compute the TRI, we have gathered qualitative information through questionnaires
completed by government agencies and country reports written by trade experts in the MENA
region8, as well as supplementary research. The qualitative information has been used to
determine the values of the different components of the sectoral aggregate and modal indexes.
The weight of each component has been determined through principal component analysis
(Marouani and Munro, 2009).
Assessing the restrictiveness of barriers to trade in services involves the identification of the
relevant barriers, their classification and their quantification, and the assessment of their
impact on trade and/or economic performance. This section discusses the different
methodological approaches to identification, classification and quantification.
The identification
To develop our questionnaires we relied on a similar set of questions to those put forward in
Dihel & Shepherd (2007), who draw on work by the Australian Productivity Commission
(Mcguire & Schuele, 2000). The indexes address key issues for each sector, such as foreign
equity limits and movement of workers. Relying on these indexes allows us to use data on
non-MENA developing countries gathered by Dihel & Shepherd (2007) in the factor analysis
(discussed further in the following section), which is a necessary input given the small size of
the MENA countries sample.
The classification
Service barriers can be classified according to various criteria such as by mode or de facto
versus de jure. As services are traded by mode, and as WTO and bilateral negotiations are
categorized accordingly, it is useful to disaggregate the sectoral trade restrictiveness indexes
by mode (Dihel & Shepherd, 2007). Cross-border supply (mode 1) refers to the supply of a
service from the country of the supplier into the country of the consumer. Consumption
abroad (mode 2) involves the purchase of services by the consumer while abroad in the
country of the supplier. Commercial presence (mode 3) entails the supplier providing
services through foreign-based establishment in the country of the consumer. Movement of
natural persons (mode 4) relates to the supply of services by an individual from the country of
the supplier in the country of the consumer. This classification offers a clearer picture of the
7 Performance indicators are not the same for banking and telecom: the net interest margin (NIM) used
in the banking sector is more important for consumers, while the performance indicator used in
telecom, EBITDA is more a profit index for firms. 8 Qualitative information was gathered in the context of the OECD-IDRC-ERF project “Promoting
trade in services in the MENA region”. Country reports were drafted by Lahcen Achy (Morocco), Jad
Chaaban (Lebanon), Ahmed Ghoneim (Egypt), and Marwan Kardoosh (Jordan). As information from
the four country reports is used heavily throughout our analysis, we do not cite the former on every
occasion.

nature of services restrictions and permits the isolation of barriers with the highest potential
impact on services trade.
To the extent possible, we also classify restrictions as de facto versus de jure. While our
assessment of the individual index components is based primarily on national legislation,
certain components take into account the absence of implementation due to other constraints,
such as conflicting legislations. For example, if a country puts no restrictions on the
commercial establishment of foreign banks, but at the same time no foreign bank exists in the
country, we take indirect restrictions into account in the index computation to the extent that
information is available.
The quantification
The index is constructed so that each component could have either a „yes or no‟ answer or
three or more response categories (see Marouani and Munro (2009) for index components).
We relied on the statistical method, drawing from data gathered for Dihel & Shepherd (2007).
The variant of factor analysis used for these sectors is principal component analysis. This
approach was used to determine the weight of each component in the aggregate TRIs and the
weight of each component in the modal TRIs. With this approach, weights are computed in
order to maximize the variance of scores within the sample of countries. Each weight is the
contribution of the given component to the index variance and does not reflect a subjective
judgment of the component‟s relative relevance or importance to trade.
The sectoral principal component analyses (PCA) are thus run at two levels: the first level is
performed with all the components of the index to determine aggregate sectoral weights,
while the second group of PCAs are run at the modal level (with the different components of
each mode separately) to determine sectoral modal weights. The aggregate and modal weights
calculated can be found in Marouani and Munro (2009). Index components are normalized9
before the computation of aggregate and modal scores. The scores obtained are then rescaled
to avoid negative values. This is in line with the Dihel and Shepherd methodology, permitting
the comparison of results across the two studies.
Given the estimation techniques used to calculate the TRI, the interpretation of results
requires particular care and should be viewed within the bounds of the approach. In view of
the way the analysis is structured, it is not useful to compare TRI across sectors because each
sector‟s TRI evaluates different components. At the same time, cross-country comparisons
are more robust.
II.2 The Second Step: the Economic Impact of TRI.
The best way of estimating the impact of the TRI on banking and telecom companies‟
performance would be to use price data10
as a dependent variable (Kalirajan et al (2000) for
9 To normalize, the average and standard deviation of the country values are first computed for each
index component. The difference between the raw indicator value and the average is then
divided by the standard deviation to derive the normalized indicator value. This calculation
converts all indicators to a common scale with an average of zero and a standard deviation of
one.
10 Also quantitative data could be used as dependent variable in the regression (Warren, 2000 for
telecom). In this case, calculating the tax equivalent requires additional information: the elasticity of
demand which allows us to transform percentage variation in quantities into percentage variation in
prices (%ΔP=%ΔQ/η)

banking; Trewin (2000) for telecommunications services). However, owing to the lack of this
kind of information, we use price-cost margins, which are readily available from accounting
datasets.
The main advantage of this kind of data is that problems of international comparability are
overcome, as data included in the financial statements follow international standards11
. There
are drawbacks to this approach, but they do not seriously compromise the results.
First of all, MNEs operate on both domestic markets and overseas, and often engage in other
activities (for example some fixed telecom companies also participate in mobile services).
Since company financial statements are derived from consolidated balance sheets, data refer
to general firm activities and hence include profit, assets and liabilities related also to other
markets and activities. We control for this problem by excluding from our dataset firms that
rely much more on overseas activities, such as in Mexico.
Secondly, price-cost margin could include changes in prices and costs due to „second round
effects‟, which dilute the direct effects of the restrictions. Consequently, the real direct effects
could be underestimated (Kalirajan, 2000).
Given our objectives, the first best would be to use data only for MENA countries or at least
for similar developing countries. As explained in the previous section, the estimated
coefficient of the TRI on sector performance plays a key role in the tax equivalent
computation and hence the original sample needs to be fairly representative to obtain a
consistent analysis (Dee, 2003). However, this approach is not feasible as the small size of the
sample impedes a reliable econometric analysis. This problem could be partially overcome in
the first step of analysis since we use firm level data (although the number of banks and
telecom companies in each country is limited). However, it persists in the second stage owing
to the narrow variability of our main variable, the TRI, which is computed only for one year
in each country. Hence, we try to defeat the limited time variability by increasing the
longitudinal dimension of the panel, i.e. adding more countries. As a result, we use both data
for developing and developed countries. In doing so, we fulfil the variability requirement and,
although the differences in the business environment in these countries, we still base our
estimates on a fairly representative sample12
.
II.2.1 Data Source and Variable Description
The estimation of this type of model requires the availability of both firm and country-level
data. Consequently, data are collected from different sources. Firm level data, for firms in
both developed and developing countries, are derived from the financial statements reported
by Datastream13
. Regulation data for the banking sector are taken from the Banking
Regulation Survey (2003-2005), the quarterly interest rates are from IMF data, and telecom
sectoral indicators are from the ITU Yearbooks of Statistics (1996-2005). TRI computation
for non-MENA countries (both aggregate and modal) are taken from Dihel and Shepherd
(2007).
11
However the use of this kind of data is widespread in trade and service literature; see for example
Nguyen-Hong (2000). 12
The decision to add both developing and developed countries can be considered as a second best
choice due to the limited data availability for developing countries: relying on a mixed sample is
preferable than using only data for developed countries (see also the productivity commission‟s
analysis for the APEC economies in Dee (2003)). 13
Data for the Egyptian telecom sector and for some Lebanese banks are taken from the financial
statement available online.

The main variables in this stage of the analysis are the aggregate and modal TRIs.
Our estimation analysis also requires the inclusion of different controls, both at the firm and
country level, which are described in the following section.
II.2.1.a Banking Services
Following the literature, the specification of the econometric model for the banking sector is
based on the Ho and Saunders (1981) theoretical model that investigates bank margin
determinants. This model has been the basis of many empirical analyses and has been
enhanced with the inclusion of other variables such as the effect of regulation (Saunders and
Schumacher, 1997; Kalirajan et al, 2000; Dihel and Shepherd, 2007).
Price-cost margin in the banking sector is usually captured by the net interest margin (NIM).
NIM is computed as the sum of total net interest income (interest earned minus interest paid
on borrowed funds) divided by total interest-earning assets (any asset, such as a loan, that
generates interest income). This measure is closest to the price customers pay for bank
services and, hence, is better suited to the aim of our analysis. Moreover, it is usually
preferred to other bank performance indicators, such as return on equity (ROE).
Saunders and Schumacher identify three main determinants of NIM: prudential regulation;
net expenses from other activities, and the pure spread. Prudential regulation is measured as
liquidity (LIQ_ratio) and capital requirement (K_ratio) ratios. These requisites are necessary
to limit risk of default and preserve the solvency of banks. Usually these requirements
represent additional costs for banks and could be compensated by raising NIMs (Kalirajan et
al., 2000). For this reason, we would expect positive estimated coefficients of these two
regressors.
Net expenses from other activities are measured as the difference between other operational
costs, other than interest expenses, and other earnings divided by total assets (NIERAT). Also
in this case, an increase in net non-interest operating expenses could be covered by an
increase in NIMs.
Finally, the „pure spread‟ represents country-specific features, i.e. economy-wide
characteristics that are constant across all banks in a specific country. It includes the market
structure computed as the fraction of deposits held by the five largest banks14
(concentration
ratio or C5); the interest rate volatility computed as the variance of annualised quarterly
deposit rates (INT_VAR); and prudential regulation (3.1 = capital adequacy, 7.1 = existence
of explicit diversification requirements, 7.3.1 = liquidity reserves, 8.10 = compulsory deposit
insurance, 9.1 = formal definition of non-performing loans). The aggregate TRI (TRI_AGG)
and the different TRIs by mode (TRI_M1; TRI_M2; TRI_M3; TRI_M4) are important
components of the pure spread as well.
II.2.1.b Telecom Services
Specification of the econometric model for the telecommunication sectors relies on a general
specification that is based on models for other sectors that emphasize the importance of
controlling for both firm and country level features (Betancourt and Gautschi, 1993; and
Saunders and Schumacher, 1997).
Following the empirical analysis for other services (engineering, accounting, and
distribution), the price-cost margin is measured as the EBITDA margin, i.e. earnings before
14
The market structure is captured also by a firm-level variable that measures the bank‟s market share.

interest, taxes and accounting depreciation divided by revenues. Among the firm-level
determinants of telecom sector performance15
we identify capital intensity (K_int), which
measures the firm‟s use of capital in producing services and is measured as the ratio of capital
over total sales. It represents both support capacity for the innovation process and the
availability of transmission infrastructure16
and thus should exert a positive impact on firm
profit. Sales (net_sales) and total employment (tot_empl) are used as proxies for firm size.
Large firms are expected to be more stable, as they would generally offer a wider assortment
of products, have broader network coverage, and have reached a critical size to stay in the
market. Hence, size is expected to correlate positively with profit levels. Growth in sales
(g_sales) captures the firm performance and competitiveness. Indeed, it is always linked to an
increase in demand boosted by the introduction of a new product, the acquisition of other
companies, etc. The increase in sales induces an increase in firm profits. Market share
(mkt_share) is computed as firm revenue divided by total telecom revenues. Given that some
firms operate in both the fixed and mobile sectors, the denominator is computed as the sum of
mobile and fixed revenues. An increase in market share mirrors an increase in the firm‟s
market power and could lead to an increase in its profit.
Moving to the economy-wide features, we control for specific fixed and mobile elements. The
sector performance data are captured by the recent growth in fixed telecom or mobile revenue
(fx_revenue_g, mobile_revenue_g), the number of main lines per capita (fx_tel_lines_pop),
or the number of cellular subscribers per capita in the case of mobiles (mob_subs_pop). All of
these elements should have a positive impact on firm profit. The quality of service provision
and the technological level are captured by the percentage of digital mainlines
(mob_subs_digitalshare). Finally, we control for regulation (calculated as the first principal
component of different indicators, as in from Dihel and Shepherd (2007)) and for trade
restrictions (both aggregate and by mode).
II.2.2 Estimation Strategy
The Australian Productivity Commission proposes a two-stage approach to estimating the
impact of TRI on firm performance. The first stage estimation investigates the firm-level
determinants of firm performance in order to capture the sectoral performance due solely to
specific country features17
, the so-called „adjusted price-cost margin‟. The estimation
equation for the first stage is the following:
)= (1)
where i refers to the firm in a particular sector, j to the country. PCM is the firm performance
(NIM for banks and EBITDA margin for telecom firms), X is the firm level characteristics
described above, c is the country dummy. All the variables are average values over the period
2002-2006. Equation (1) is estimated using country-level fixed effect.
The country dummies capture the adjusted price-cost margin and then are used as dependent
variables in the second stage:
= (2)
Where Zj includes all the country-specific features presented above and TRI refers both to the
aggregate and modal TRI. Equation (2) is estimated using OLS. TRI is the base for the tariff
15
These variables are the same both for the mobile and for the fixed telecom firms. 16
However telecom firms often rent transmission supports rather than buying them. 17
It corresponds to the „pure spread‟ in the banking sector. It doesn‟t take a specific name in the
telecom sectors.
equivalent computation. The main rationale behind the two-stage approach is to avoid a bias
estimation due to the inclusion of both firm and sectoral-level regressors. In the presence of
group effects of firms within an economy errors may be correlated and a single-stage
estimation could produce a bias estimate (Moulton, 1986). Conversely, this technique has
three severe drawbacks. First, it assumes two independently distributed error terms, but the
first step ignores it (Nguyen-Hong, 2000). Second, the country dummy estimation heavily
depends on the regressor choice in the first stage and this could impact the TRI significance in
the second stage. Lastly, the second step estimation relies on a very limited variation (we
have just one observation for each country). The final drawback is particularly striking in the
estimation for the telecom sector where the limited number of observations for the mobile
adjusted price-cost margin leads us to put fixed and mobile telecom companies in the same
sample.
The single-step estimation, with the inclusion of both firm-level and country-level data,
allows us to overcome these shortcomings. In particular, this approach directly captures the
impact of barriers on each firms‟ profit margin instead of only explaining the economy wide-
effect of restrictions on each country. In doing so, it exploits the firm level variation in price-
cost margin as opposed to an aggregate fixed effect. Thanks to this additional variability we
estimate separately the impact of TRI on the fixed and mobile sector. Moreover, the bias-
estimation problem is evaded by clustering the errors at the country level, after testing for the
real importance of the country level effect. The main problem using this approach is the
multicolinearity among country level variables. However, the variables that were dropped
owing to multicolinearity were usually not significant in the two-stage approach. The
estimated model is the following:
)= (3)
We estimate the impact of TRI on banking and telecom firm performance using both the two-
stage and one-stage approach. However, we base our comments on the two-stage results and
use the one-stage approach as a robustness check. Finally, while in the two-stage approach
errors are corrected by heteroschedasticity, in the one-stage approach the clustering of data at
country level already gives robust standard errors.
II.3 The Tax Equivalent Estimation
The econometric model above estimates the impact of restrictions on sectoral performance.
Coefficient estimates and TRI values are all the necessary information to transform the TRI
into a tax equivalent that is the hypothetical tax imposing a similar effect on firm‟s
performance as the barriers captured by TRI. A tax equivalent is generally defined as the
percentage price18
increase arising from barriers, i.e how much current prices are exceeding
efficient prices as a consequence of barriers. Mathematically, the tax equivalent is computed
by applying the following formula:
where PCM0j indicates the price-cost margin in country j in the case of no restrictions (i.e.
TRI equal to zero), ceteris paribus. The inclusion of the minimum and maximum of the
estimated 95% confidence interval provides policymakers with a more flexible tool, which is
necessary given the nature of the analysis. Unlike Shepherd and Dihel (2007), we do not
18
In our analysis we refer to the increase in price–cost margin due to barriers.
apply the bootstrapping technique, since it often produces non-significant coefficients and,
consequently, wide intervals that are not very relevant for policy reform design.
III RESULTS
III.1 TRI
III.1.1 Introduction
The following section discusses the results of the TRI indices estimated according to the
methodology presented above. TRI scores provide a point of comparison, indicating which
MENA countries have higher levels of restrictions on trade in services for each sector.
Drawing conclusions about the economic impact of these restrictions is limited, however,
given the subjective nature of the index.
In aggregate, no single country ranked most open or most restricted across all sectors.
Jordan‟s TRI values were generally lower than those of the other MENA countries in this
study. For other countries, however, the TRIs have revealed varying levels of openness across
the various service sectors.
Data included in our calculations are the most current information available through the end
of 2007. We rely heavily on country chapters for our cross-country analysis19
. Comparisons
are frequently drawn to TRI scores from the Dihel & Shepherd (2007) study, for which data
were gathered up to 2005.
III.1.2 Banking
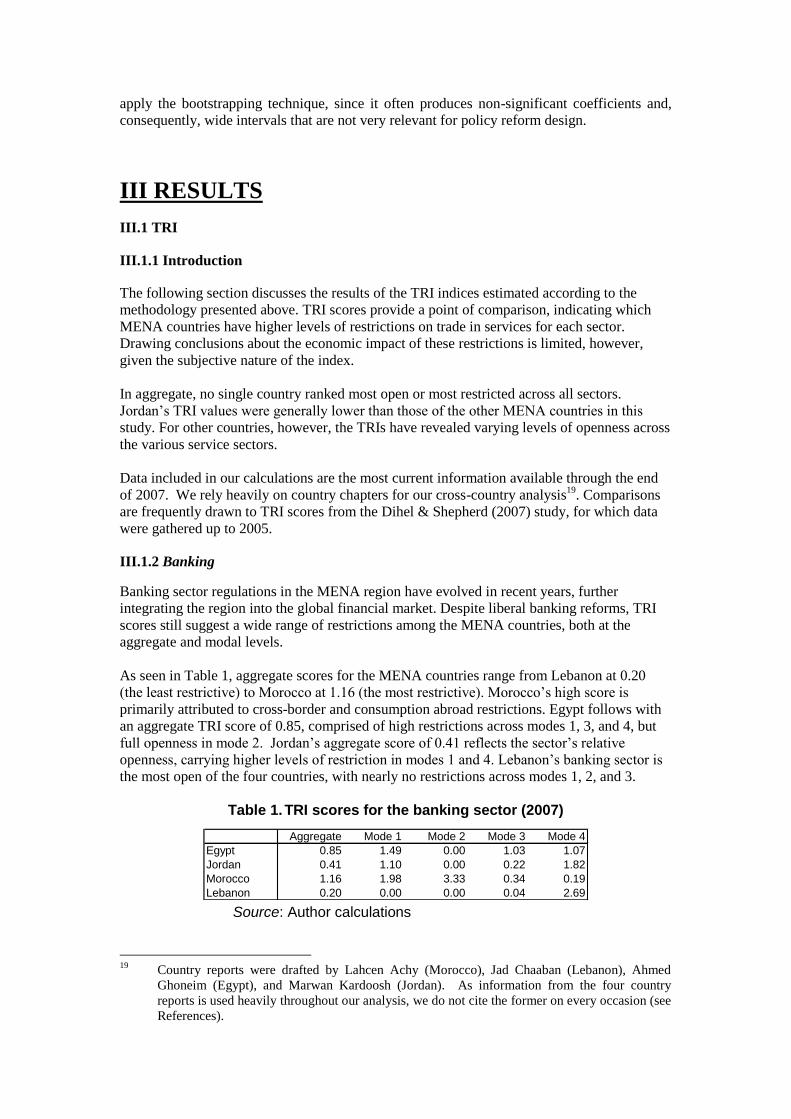
Banking sector regulations in the MENA region have evolved in recent years, further
integrating the region into the global financial market. Despite liberal banking reforms, TRI
scores still suggest a wide range of restrictions among the MENA countries, both at the
aggregate and modal levels.
As seen in Table 1, aggregate scores for the MENA countries range from Lebanon at 0.20
(the least restrictive) to Morocco at 1.16 (the most restrictive). Morocco‟s high score is
primarily attributed to cross-border and consumption abroad restrictions. Egypt follows with
an aggregate TRI score of 0.85, comprised of high restrictions across modes 1, 3, and 4, but
full openness in mode 2. Jordan‟s aggregate score of 0.41 reflects the sector‟s relative
openness, carrying higher levels of restriction in modes 1 and 4. Lebanon‟s banking sector is
the most open of the four countries, with nearly no restrictions across modes 1, 2, and 3.
Table 1. TRI scores for the banking sector (2007)
Aggregate Mode 1 Mode 2 Mode 3 Mode 4
Egypt 0.85 1.49 0.00 1.03 1.07
Jordan 0.41 1.10 0.00 0.22 1.82
Morocco 1.16 1.98 3.33 0.34 0.19
Lebanon 0.20 0.00 0.00 0.04 2.69 Source: Author calculations
19
Country reports were drafted by Lahcen Achy (Morocco), Jad Chaaban (Lebanon), Ahmed
Ghoneim (Egypt), and Marwan Kardoosh (Jordan). As information from the four country
reports is used heavily throughout our analysis, we do not cite the former on every occasion (see
References).

Regarding mode 1, Lebanon is the only country in this study with no cross-border restrictions
in the banking sector. Banks, corporations, and households in Lebanon are permitted to both
borrow and make deposits on a cross-border basis, i.e. from foreign banks situated abroad.
Lebanon and Jordan‟s lower mode 1 scores are reasonable given the large cross-border trade
of services that has historically been taking place in the region (Jordan mainly with the
Palestinian territories and Lebanon with Syria and many other MENA countries). Morocco
and Egypt record higher restriction levels, but these levels have relaxed in recent years. Prior
to 1991, Moroccan companies, for example, were not allowed to borrow from abroad.
Lowering restrictions on foreign exchange control has allowed Attijari Wafa Bank to open a
subsidiary in Senegal and to take majority ownership of the former Tunisian „Banque du
Sud‟.
TRI results for mode 2 reveal Morocco‟s banking sector to be the most restrictive. Residents
of Morocco are not authorized to purchase financial services abroad. Residents of Egypt,
Jordan, and Lebanon, meanwhile, are completely unrestricted in mode 2.
Mode 3 barriers have decreased across Egypt, Jordan, and Morocco relative to TRI scores
from the Dihel & Shepherd (2007) study. Egypt‟s aggregate score for mode 3, however, still
reflects high restrictiveness. Morocco has slightly lower mode 3 restrictions, but is the only
country of those analyzed in this study that imposes foreign equity limits. While Moroccan
regulation previously limited foreign ownership to 49%, this restriction was recently lifted.
The new Moroccan banking law reserves however the right to limit foreign ownership in a
major bank20
if acquiring such interests would imply majority control21
.
Egypt has liberalized as well, reforming several regulations in 1991 that had previously
discriminated against private, and thus foreign, banks. For example, foreign partners are now
allowed majority equity holdings in joint venture banks. Liberalization reforms such as these,
however, have been slow to generate an impact in practice. Of Egypt‟s four banks, three
remain 100% domestically-owned public banks. The Bank of Alexandria (the smallest of the
four banks) was recently privatized and is now 80% foreign-owned. There has been
discussion of further plans for privatization, but nothing has materialized as of yet.
Lebanese regulation on foreign equity limits was liberalized more recently. In 2001, foreign
ownership rights in the banking sector rose from 30% to 100% in an effort to promote an
influx of FDI. Five of Lebanon‟s six largest banks currently include foreign equity, two of
which have a foreign majority holding.
Meanwhile, four of Jordan‟s six largest banks have a majority foreign ownership. Two of
Morocco‟s six largest banks have a majority foreign ownership (four of the six are partially
foreign-owned). Likewise, two of Lebanon‟s six largest banks have a majority of foreign
ownership (five of the six are partially foreign-owned).
TRI analysis reveals that Morocco and Lebanon are the most liberal in regards to the issuance
of banking licenses. Jordan‟s license procedures are relatively open apart from a higher fee
than that of the other countries in this study. Alternatively, license issuance in Egypt is more
restricted, as it is determined by discretionary approval of the Central Bank of Egypt. Entry in
the Egyptian banking sector is restricted according to economic needs, limiting both the entry
of new domestic and foreign banks and the number of foreign bank branches. (All other
20
Represents more than 12% in terms of assets, deposits, or credits of the entire Moroccan
banking system. 21
As an example of use of this discretionary power we can cite the refusal by Bank Al Maghrib of
the French Caisse d‟Epargne offer to buy 25% of BMCE bank (one of the largest banks in
Morocco).

countries studied have no policy restrictions on the entry of new banks.) The historical trend
in Egypt of favoritism of public banks over private banks has lessened, however, in recent
years. A bank privatization program was also introduced to promote market consolidation
and increase competition in the private sector.
Mode 4, the movement of natural persons, poses varying levels of restrictions across the
MENA countries. TRI scores indicate that Jordan is the most restrictive in mode 4 overall,
while Morocco is the most liberal. The entrance of short-term corporate transfer employees is
relatively unrestricted across all countries, but time limits are imposed more stringently on the
movement of natural persons for temporary movement longer stays. While Morocco has had
no restrictions on the Board of Director composition for many years now, restrictions have
only recently been eliminated in both Egypt and Jordan. Lebanon‟s Board of Director
restrictions remain high.
Working permits pose restrictions of varying levels across the four countries. Egypt is the
most restrictive, issuing work permits according to numerical limits determined by an
Economic Needs Test, as imposed by a decree in 2003. The number of foreigners allowed to
work in any one establishment is capped at 10% of total employees. In some industries (e.g.
tourism), foreigners are not allowed to work at all. Lebanon, Jordan, and Morocco have lower
restriction levels than Egypt, limiting work permits according to professional qualifications
and basic approval processes.
It seems that the least restrictive countries on mode 3 (Lebanon and Jordan) are the most
restrictive on mode 4. Opening on mode 3 facilitates the influx of foreign capital (mainly
from GCC countries), while closing on mode 4 protects white-collar workers and important
stakeholders in the banking system. Both Lebanon and Jordan impose particularly short
limitations on the time allowed in the temporary movement of long stay employees.
Lebanon‟s high mode 4 TRI score is also derived from the country‟s requirement that a
majority of the Board of Directors be Lebanese nationals (while Egypt, Jordan, and Morocco
have no restrictions in this area).
In conclusion, the banking sector‟s recent transformation in the MENA region has had a large
impact on many countries‟ regulatory frameworks, particularly with regard to the
involvement of private and foreign capital.
The main reforms that introduced or amended the banking law in the four countries of interest
(1993 and 2001 in Lebanon; 2000 in Jordan; 2003 in Egypt and 2006 in Morocco) have lifted
the foreign equity limits on the ownership of banks. This has prompted an increase of foreign
participation, namely in Lebanon, Morocco and Jordan. In Egypt, despite the regulatory
reform, most of the largest banks are currently publicly owned, which demands a
privatization (as in the case of the Bank of Alexandria), or at least a partial opening to private
capital needs to accompany the regulatory reform. In Morocco the liberalization process has
also been cautious since the Moroccan authorities control foreign participation in their largest
banks. They also constrain the operations of foreign banks by the amount of capital allocated
to their business in Morocco.
III.1.3 Telecom
Dihel & Shepherd (2007) noted that Middle East countries ranked among the most restrictive
for trade in fixed telecom services (relative to Asian and Transition economies). For Egypt,
Jordan and Morocco, however, aggregate scores have declined since the former study. As
Table 3 shows, the aggregate TRI scores for fixed telecom range from 0.80 in Morocco to
1.22 in Egypt. The mobile sector is more open than fixed telephony in all three countries,
ranging from 0.59 in Morocco to 0.99 in Egypt (Table 4). The main reason behind this is
certainly the need for foreign investment to expand the mobile network capacities as well as
the relative infancy of the mobile industry and its corresponding regulations. Indeed, the
historical operators tried in many countries to develop a mobile network on their own but
failed to match the needs of an exploding demand at the beginning of the decade (lines were
rationed in many countries).
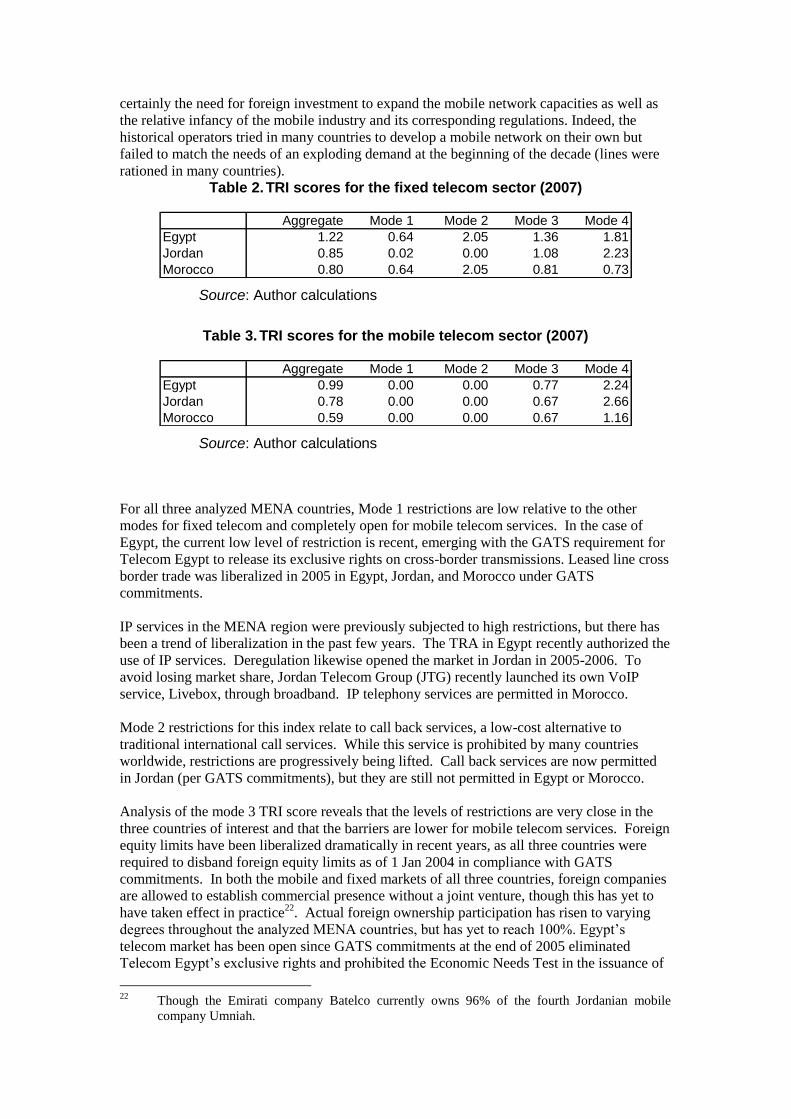
Table 2. TRI scores for the fixed telecom sector (2007)
Aggregate Mode 1 Mode 2 Mode 3 Mode 4
Egypt 1.22 0.64 2.05 1.36 1.81
Jordan 0.85 0.02 0.00 1.08 2.23
Morocco 0.80 0.64 2.05 0.81 0.73
Source: Author calculations
Table 3. TRI scores for the mobile telecom sector (2007)
Aggregate Mode 1 Mode 2 Mode 3 Mode 4
Egypt 0.99 0.00 0.00 0.77 2.24
Jordan 0.78 0.00 0.00 0.67 2.66
Morocco 0.59 0.00 0.00 0.67 1.16
Source: Author calculations
For all three analyzed MENA countries, Mode 1 restrictions are low relative to the other
modes for fixed telecom and completely open for mobile telecom services. In the case of
Egypt, the current low level of restriction is recent, emerging with the GATS requirement for
Telecom Egypt to release its exclusive rights on cross-border transmissions. Leased line cross
border trade was liberalized in 2005 in Egypt, Jordan, and Morocco under GATS
commitments.
IP services in the MENA region were previously subjected to high restrictions, but there has
been a trend of liberalization in the past few years. The TRA in Egypt recently authorized the
use of IP services. Deregulation likewise opened the market in Jordan in 2005-2006. To
avoid losing market share, Jordan Telecom Group (JTG) recently launched its own VoIP
service, Livebox, through broadband. IP telephony services are permitted in Morocco.
Mode 2 restrictions for this index relate to call back services, a low-cost alternative to
traditional international call services. While this service is prohibited by many countries
worldwide, restrictions are progressively being lifted. Call back services are now permitted
in Jordan (per GATS commitments), but they are still not permitted in Egypt or Morocco.
Analysis of the mode 3 TRI score reveals that the levels of restrictions are very close in the
three countries of interest and that the barriers are lower for mobile telecom services. Foreign
equity limits have been liberalized dramatically in recent years, as all three countries were
required to disband foreign equity limits as of 1 Jan 2004 in compliance with GATS
commitments. In both the mobile and fixed markets of all three countries, foreign companies
are allowed to establish commercial presence without a joint venture, though this has yet to
have taken effect in practice22
. Actual foreign ownership participation has risen to varying
degrees throughout the analyzed MENA countries, but has yet to reach 100%. Egypt‟s
telecom market has been open since GATS commitments at the end of 2005 eliminated
Telecom Egypt‟s exclusive rights and prohibited the Economic Needs Test in the issuance of
22
Though the Emirati company Batelco currently owns 96% of the fourth Jordanian mobile
company Umniah.

licenses. International services and leased-line services have sold a minority share, but local
and long-distance services remain 100% owned by Egypt Telecom. Potential market entrants
have been discouraged by market saturation and the high set-up costs of establishing a new
network. Egypt Telecom has refused to lease its network to new market entrants, as has been
done by the incumbent in Morocco since 2007, thus overcoming this obstacle and facilitating
consumer choice. Egypt‟s mobile telecom market has been liberalized more quickly than
fixed telecom and currently has foreign ownership in all three mobile operators.
Jordan‟s formerly government-owned incumbent in fixed line services was privatized in
2000, to be followed by a declaration of market openness in 2005 in compliance with GATS
commitments. The Jordanian mobile market is much more open as four firms operate in this
sector (relative to two or three mobile companies in the other countries despite much larger
populations), the three largest of which are foreign majority-owned (Zain, Orange Jordan,
Umniah). The internet sector also appears very competitive with currently 12 service
providers.
Foreign ownership is permitted in Morocco, and was first introduced by the incumbent Maroc
Telecom who sold 35 percent to Vivendi Universal of France in 2001 (further shares were
later sold in 2004). A second and third fixed telecom licenses were issued (to Meditel and
Maroc Connect) in 2005, further widening the market. Morocco‟s mobile telecom sector first
opened to competition in 1999 with the issuance of a license to Meditel. A further succession
of licenses was released in 2004. Morocco currently has three operators competing in each
segment, i.e. fixed, mobile, and internet.
The Moroccan Government and telecom regulator (ANRT) restrict the entry of new firms in
both the fixed and mobile telecom markets, as exclusive rights are believed necessary to
attract strategic investment, as well as in order to allow the provision of universal service in
fixed telecom services. In this regard the second mobile operator was offered exclusive rights
for a four-year period, as well as a direct international access from 1st Jan 2002. Here marks a
difference with Jordan where licenses do not grant exclusivity periods.
Varying levels of restrictiveness affect license regulation in the analyzed MENA countries.
Egyptian fixed and mobile licenses are issued according to the discretionary decision of the
licensing authority. Selections were made according to economic needs until the end of 2005,
but this measure was lifted by GATS commitments. Jordanian fixed licenses are issued with
basic entry requirements, and mobile licenses are awarded by competitive tender. Moroccan
fixed and mobile licenses are issued by competitive tender, but are issued individually for
specific services as opposed to general licenses covering all telecom services (as in the EU).
Mode 4 restrictions are similar to those in the other services sectors. Jordan records the
highest restriction levels in Mode 4, while Morocco is the most liberal23
.
In conclusion, the main issues for the telecom sectors in the MENA region are how to
improve the quality and coverage of the telecom service while lowering prices. Indeed the
quality and price of telecom services are an important determinant of the attractiveness of
backbone services in the region but also of the countries competitiveness.
Competition across the MENA countries is greater in the mobile sector than the fixed sector,
which has only opened recently. Foreign capital has risen dramatically during the current
decade due to the MENA telecom market‟s growing potential. New firms (joint-ventures
between foreign and domestic capital) have in some cases been offered periods of exclusivity.
23
See discussion in the previous section on the banking sector for more information.

Despite the lifting the monopoly of the Public Telecommunication Operators (PTOs) on the
fixed sector, high barriers to entry remain. This market would be more competitive if the
PTOs would lease their networks to competitors as has been the case in Morocco. IP
telephony development can also have a dramatic impact on telecom prices. But the studied
countries are still reluctant to promote commercial use of this technology on a higher scale.
III.3 The impact of TRI on economic performance.
III.3.1 Banking
In the first stage, firm level estimations24
(Table 1 –left side- in Appendix 1) show that the
capital ratio and the liquidity ratio are positive and significant. This is the expected sign, as
these two ratios are prudential factors that ensure the solvency of banks. The non-interest
expenses ratio is also positive and significant, which could mean that banks charge a higher
interest margin to compensate for higher non-interest costs. These results are coherent with
the wide empirical evidence on net interest margin determinants (Kunt and Huizinga, 1998).
The market share is not significant. The estimations are robust to the introduction of dummies
for MENA and developing countries.
Moving to the second stage of the analysis25
, where we regress country level variables on the
estimated „pure spread‟, our results suggest that the main variable of interest, the aggregate
TRI, is positive and significant (Table 1 -right side- in Appendix 1). In particular a 1%
increase in the aggregate TRI would induce a 0.1% increase in the „pure spread‟ in MENA
countries, on average and ceteris paribus 26
. Hence, a higher TRI would lead to a higher pure
spread and consequently an increase in the rent effect, which dominates the cost-inefficiency
effect. This result is robust to the inclusion of different controls and is confirmed by the one-
stage regressions (see Table 1 in Appendix 2). Removing restrictions in the banking sector
would favor income redistribution from banks to customers.
The analysis at the modal level (regression mode by mode, Table 2 in Appendix 1) reveals
that mode 3 is positive and highly significant27
. In particular, a 1% increase in mode 3 would
induce a 0.25% increase in the „pure‟ spread, on average and ceteris paribus 28
. The impact of
a change in mode 3 is more effective then a general change in the aggregate TRI. This
suggests that restrictions to commercial presence are rent-creating. However, it is possible
that some restrictions composing mode 3 could be cost-creating while others could be rent-
24
When the variables are significant, the null hypothesis of coefficients non-different from zero is
rejected at the 1% level. However, given the presence of non-normally distributed residuals, their
significance could actually be lower. The same holds for the estimation of country dummies, which are
used as dependent variables in the second stage of the analysis, but there is no reason to expect
insignificant coefficients. The R-square is around 0.8 meaning that the regression explains 80% of the
estimated model.
25
The R-squared at the second level of the analysis are generally lower (below 20%) but the regression
specification tests are largely satisfied since they fail to reject the null hypothesis at the 10% level.
26
The increase in developing and developed countries would be of 0.14% and 0.04%, respectively. It is
important to highlight that a percentage increase of TRI is not easy to determine given the nature of the
index.
27
Not surprisingly, the aggregate TRI and the variable that presents the higher weight in its
computation present the same sign and same significance level.
28
The increase in developing and developed countries would be of 0.51% and 0.4%, respectively.

creating, since what we observe is the net effect. It would thus be interesting to regress
individual index modal components on the performance indicator to disentangle the different
effects. Finally mode 4 is negative but not robust and modes 1 and 2 are not significant. This
is not surprising given the low importance of these modes in the banking sector29
. If we put
the four modal TRIs together in the regression we obtain the same results except that mode 4
turns to be strongly significant30
. The possible interaction between modes is carefully studied
by adding the interacted mode to the last specification (results not reported). The results
suggest that restrictions to cross-border supply (mode 1) and FDI (mode 3) are
complementary: if both are high, they would cause cost inefficiency. Indeed, if MNE
established in a country cannot supply their service abroad, it could reduce the scope of
economies of scale and increase costs. Finally, although the interaction between mode 3 and
mode 4 is not statistically significant, if we include it in the specification mode 3 loses its rent
creating effect. It could suggest that the presence of MNEs has a rent creating effect only if
employee movement is not restricted and hence if MNEs can hire national employees. In the
banking sector, staff plays a key role and it is important to hire competent persons or at least
to provide proper training.
With regards to other control variables, they are almost stable across different models. First of
all, among the prudential regulation variables, the only significant one is the „compulsory
deposit insurance‟ (eight_one), which has a negative impact on the pure spread. This is
understandable since countries that are subject to this requirement face lower risk and hence
lower interest spreads. The net interest variation presents the expected positive sign31
but is
not significant. A possible explanation for this result is that our sample included countries that
were hit by financial crises during the period of analysis (in particular Argentina and
Uruguay) and consequently report very high interest variation. Excluding these countries
from the sample, the interest variation turns to be significant. Countries recently hurt by
financial crises deserve special attention. Indeed, these countries simultaneously present
lower net interest margins (the financial crisis dummy is negative and significant) and
aggregate TRI above the sample mean. As a result aggregate TRI in these countries is not
significant (TRI_aggFinancialCrisis). These results could suggest that the financial crisis has
induced a strengthening of the banking regulation, which had a positive impact on banking
sector performance32
.
III.3.2 Fixed telecom
The first stage regression for telecom (Table 3 in Appendix 1, left side)33
suggests that capital
intensity and market share have a positive impact on EBITDA, which conforms to the theory.
29
Moreover, these two modes turn to be significant in the one-stage approach. So, evidence of their
influence on the pure spread is not clear and requires further analysis.
30
Statistical test supports the adoption of this specification where all the modes are introduced at the
same time.
31
The literature suggests that a higher interest variation induces a higher net interest margin to
compensate for higher risk.
32
Evidence on the improvement in the financial sector indicators are provided by the World Bank
(2007) with regards to the sharp decrease in the share of non-performing loans and, more generally, by
Turner (2007).
33
As we already highlighted for the banking sectors, the first stage regressions in the fixed telecom
sector are also characterized by high R-squared (the model estimation explains around 80% of
dependent variable variation) and non-linear residuals. The second stage regressions are very strong:
the R-squared is around 60% and the diagnostic test usually does not reject the null hypothesis.

On the other side, net sales have a negligible impact (also when transformed in elasticity) and
sales growth is not significant. Once again these results are robust to the inclusion of MENA
and developing dummies.
Moving to the second stage of the analysis, the impact of the aggregate TRI on „country level
EBITDA‟ is positive and significant (Table 3 in Appendix 11, right side). In particular, a 1%
increase in the aggregate TRI induces a 0.33% increase in the „country level EBITDA‟, on
average and ceteris paribus 34
. The estimation results are robust to different specifications and
are corroborated by the results in the one-stage approach (Table 2 in Appendix 2). We can
infer that restrictions in the fixed telephony sector TRI have mainly a rent-creating effect. At
the modal level, TRI_M3 is positive and significant. In particular, a 1% increase in the TRI
mode 3 induces a 0.34% increase in the „country level EBITDA‟, on average and ceteris
paribus35
. Once again, it mirrors the sign and significance of the aggregate TRI. TRI_M1,
TRI_M2 and TRI_M4 are not significant36
(Table 4 and 5 in Appendix 1). Moreover, any of
the interaction modes turns to be significant. Hence, in the fixed and the mobile telecom
sector, a policy focused only on mode 3 restrictions would have a greater impact than in the
banking sector.
If we observe the other control variables, prudential regulation in fixed telecom has a positive
effect on EBITDA. The rate of fixed lines over population has a negative impact on EBITDA,
which can be explained by lower opportunities to increase the size of the domestic market in
countries where this rate is high (i.e. mature sectors). Finally, while the mobile subscribers
digital share is not significant, the share of mobile subscribers over the population has a
positive coefficient. This could seem counterintuitive given the expected substitution between
fixed and mobile services. A possible explanation could be that many companies that offer
fixed telecom services also entered into the mobile telecom business, and the increase in the
number of subscribers had a positive impact on their profits.
III.3.3 Mobile telecom
Looking at the first stage regression results (Table 7 in Appendix 1, left side)37
we notice that
capital intensity is not significant, while sales growth has a positive and significant effect on
EBITDA. These results shed light on the structural difference between the mobile and the
fixed telecom sectors. Unlike the latter, the mobile sector is younger and more dynamic,
mainly in terms of sales growth in developing countries, and it requires lower capital intensity
(in terms of tangible fixed assets)38
.
Moving to the second stage regression, Table 7 in Appendix 1 (right side) shows that the
aggregate TRI has a negative and significant effect on EBITDA in the mobile telephony,
34
The increase in developing and developed countries would be of 0.30% and 0.06%, respectively.
35
The increase in developing and developed countries would be of 0.28% and 0.07%, respectively.
36
Also in this case the statistical test supports the adoption of the specification where all the modes are
introduced at the same time.
37
Regression results for the mobile sector are less sound than for other sectors. Indeed, while the other
sector is high in the first stage and the residuals are non-normally distributed; in the second stage the R
squared are very low and the null hypothesis of the diagnostic test are not rejected. The one stage
approach presents a discrete R squared (48%, closed to the fixed telecom one).
38
For example mobile companies can rent the signal towers which can be shared by different
companies.

suggesting a cost-creating effect. In particular, a 1% increase in the aggregate TRI induces a
0.59% increase in the „country level EBITDA‟, on average and ceteris paribus 39
. At the
modal level (Table 8 in Appendix 1), TRI_M1, TRI_M2 and TRI_M4 are not significant40
,
while TRI_M3 is negative and significant. In particular, a 1% increase in the TRI mode 3
induces a 0.50% increase in the „country level EBITDA‟, on average and ceteris paribus41
.
Also in this case, as already emphasized for the fixed telecom sector, aggregate TRI and
mode 3 would have a similar impact on the sector performance. Interaction modes are not
significant. These results show that the policy implications of liberalizing mobile and fixed
telephony markets will not be the same. The gains in terms of mobile liberalization should be
higher because it should induce a reduction in production costs and the removal of market
inefficiencies.
However, one can wonder why barriers to fixed telephony liberalization are more rent-
creating while restrictions on mobile telephony are more cost-increasing. This result observed
for the aggregate TRI is echoed by the mode 3 coefficient. The main difference could thus
come from the different implications of foreign investments in the two sectors. Indeed, while
a significant part of the fixed network is already there, the cellular network is still in progress,
especially in developing countries. Thus, increased foreign participation in the fixed
telephony would mainly have an impact on the rent distribution, while an increase in
investment in mobile telephony could reduce costs by expanding the network (i.e. increasing
the number of subscriber permits to reduce fixed costs per subscriber).
Concerning interactions between modes, we observe that mode 2 turns to be non significant
when the four modes are included simultaneously in the regression. However, the sign of
mode 3, which is by far the main vector of trade in mobile telephony, remains negative and
strongly significant. This would indicate that mode 3 is not influenced by modal interaction in
the mobile sector (while the opposite result was found for fixed telephony).
III.4 Tax equivalents
Analysis of the tax equivalents results provides two main insights. First, our results are higher
than those obtained in previous studies (e.g. Dihel and Shepherd, 2007), an expected result
given of our reliance on developing countries‟ firm data in the sample. Indeed, the impact of
TRI on economic performance is usually higher in developing countries than in developed
countries.
Second, in table 4 we note that tax equivalents are higher in the mobile sector than in the
fixed sector, despite higher restrictions in the fixed sector in the three studied countries. This
is due to the fact that the impact of restrictions is higher in mobile telephony. Indeed, tax
equivalents result from the combination of a level of restrictions and an impact of these
restrictions on the price-cost margin.
Table 4: Tax equivalents of restrictions in banking, fixed and mobile telecom
39
The increase in developing and developed countries would be of 0.58% and 0.11%, respectively.
40
However, they are positive and significant in the one-stage approach (Table in Appendix 2). We can
thus not draw any strong conclusions on the significance of these variables. However, given their
limited impact on the mobile sector, this result is not too worrying.
41
The increase in developing and developed countries would be of 0.50% and 0.08%, respectively.

in four MENA countries (in %)
Banking Fixed Telecom Mobile telecom
Val Min Max Val Min Max Val Min Max
Egypt
AGG 35 21 50 54 33 79 101 9 271
M1 28 17 40 15 1 30 0 0 0
M2 5 3 8 2 0 47 0 0 0
M3 136 96 184 67 40 98 51 5 118
M4 63 44 84 68 5 169 356 267 466
Jordan
AGG 15 10 22 35 22 50 73 7 181
M1 20 12 28 0 0 1 0 0 0
M2 5 3 8 0 0 0 0 0 0
M3 20 15 25 50 31 72 43 4 97
M4 129 86 183 89 6 239 506 368 684
Morocco
AGG 50 30 74 33 21 46 52 5 118
M1 39 23 56 15 1 30 0 0 0
M2 853 187 3063 2 0 47 0 0 0
M3 32 25 41 35 22 50 43 4 97
M4 9 12 7 23 2 49 119 96 145
Lebanon
AGG 7 5 10
M1 0 0 0
M2 5 2 8
M3 3 2 4
M4 241 150 365

IV Conclusions
Our study aimed to assess the restrictiveness of barriers to trade in banking and telecom
services in the MENA region. Focusing on a select group of MENA countries, the analysis
goes beyond previous studies to consider the environment in which these restrictions have
evolved (e.g. regulatory framework, government behavior, etc.). Each index has been
computed at both the aggregate and modal levels to provide a more comprehensive picture of
current restrictions for policymakers involved in domestic reform and regional and
multilateral negotiations. The sectoral aggregate and modal trade restrictiveness indexes
developed have then been used as explanatory variables in firm level regressions to assess
their impact on economic performance.
One of the main contributions of this study is its collection of information not available from
secondary sources. The level of detail offered by this research strengthens the reliability of
our TRI results and helps us to better understand the interactions between regulatory reforms,
implementation and actual restrictiveness. De facto/ de jure gaps revealed in our analysis
supports the case for future detailed, regular assessments of service barriers in practice as well
as in the legislation.
Among the innovations in the empirical framework, we increase the dataset coverage by
adding firms from developing countries and we cover a more recent time period than previous
studies.
The first conclusion of this article is that there have been significant regulatory reforms over
the last decade in the selected service sectors of the four studied countries, but that a broad
range of restrictions still remain. The most significant change in these service sectors has
been the lifting or softening of constraints imposed on foreign equity participation. These
regulatory reforms, however, have had varying degrees of impact on market structure
depending on the countries and the sectors.
The second conclusion is that service restrictions have an impact on economic performance in
the three studied sectors. While a rent-creating effect seems to dominate restrictions on
banking and fixed telecom sectors, a cost-inefficiency effect seems to dominate the mobile
telecom sector. This means that liberalizing mobile sector telephony would induce potentially
higher gains than liberalizing the two other sectors. But this conclusion could be modified if
we think in terms of input-output analysis. Indeed, fixed telephony for example is the main
input of internet providers and is an important input of many back-bone services. Thus, a
reduction of fixed telephony prices is not simply a matter of rent redistribution, but also a
matter of technical development and of competitiveness.
At the modal level, mode 3 seems to be the most critical feature in all the sectors. Liberalizing
mode 3, by relaxing limitations on commercial presence, would have the greatest impact on
firms‟ performance and on income redistribution. However, in the banking sector, mode 4
also matters. Studying the possible interactions between modes is also particularly significant
for policy makers. Indeed, the impact of reforming regulations concerning one of the four
modes will be different depending on the regulations dealing with the other modes interacting
with the former. Our results suggest that mode 3 and mode 1 are complementary in the
banking sector: if an MNE establishes an affiliate in a country and it cannot supply their
services abroad, this restriction could reduce the scope of economies of scale and increase
costs. Finally, we found some evidence of a substitution effect between mode 3 and mode 4.
Indeed, if we include the interaction between these two modes, the former turns to be non
significant. This could suggest that the presence of MNEs has a rent creating effect only if
employee movement is not restricted and hence if MNEs can hire national employees. For the

telecom and mobile sector we don‟t find any evidence of an interaction between modes.
Hence, in the fixed and the mobile telecom sector, a policy focused only on mode 3
restrictions would have a greater impact than in the banking sector.
With regards to the technical issues, future work could improve the analysis by further
exploiting the time dimension. In particular, we would apply a random effect estimator on a
firm level panel, which would allow us to estimate time-invariant firm features, such as the
TRI. Moreover, the tax equivalent estimations would be more accurate if we could rely only
on developing country data and if we could use price data instead of firm performance data as
dependent variables. However, data availability is a major constraint for such improvements.
As a next step, an assessment of the impact of the different reforms implemented by the
analyzed countries would be useful. However, such an evaluation is not an easy task given the
multiplicity of direct and indirect effects. Ex ante and ex post qualitative and quantitative
assessments must be conducted at the sectoral level but also at the economy-wide level to
capture the interaction between the various sectoral reforms.

Annex 1: Two-Stage Estimation Table 1: Banking Sector -First and Second Stage (TRI agg) Estimation
FE_1
_1 FE_1
_2 FE_1
_3 FE_2
_1 FE_2
_2 FE_2
_3 FE_2
_4 FE_2
_5 FE_2
_6 FE_2
_7 FE_2
_8
ln_K_RATIO 0.203 0.203 0.206
(6.34)***
(5.18)***
(6.00)***
ln_LIQ_RATIO 0.06 0.06 0.06
(3.47)***
(3.66)***
(4.22)***
ln_NIERAT 0.289 0.289 0.292
(9.61)***
(8.83)***
(9.52)***
MENA_dummy -2.381
(1.83)
* ln_mkt_share 0.003 (0.41) TRI_agg 0.225 0.241 0.278 0.285 0.248 0.187 0.266 0.259
(2.03)
** (1.98)
* (2.00)
* (1.95)
* (1.89)
* (1.93)
* (1.85)
* (1.96)
* C5 0.437 0.448 0.474 0.285 0.45 0.432 0.475 0.503 (1.28) (1.28) (1.32) (1.12) (1.28) (1.27) (1.32) (1.27) eight_ten -0.389 -0.401 -0.413 -0.341 -0.397 -0.398 -0.42 -0.382
(2.52)
** (2.53)
** (2.50)
** (2.33)
** (2.49)
** (2.49)
** (2.38)
** (2.35)
** int_var 0.001 0.002 0.001 0 0.001 0.001 0.001
(1.19) (1.55) (1.22) (0.19) (0.99)
(1.21) (1.24)
Financris_dummy -0.371 -0.453 -0.637 -0.564 -0.312 -
0.486 -0.483
(2.79)***
(2.41)**
(2.68)**
(2.28)** (1.63)
(2.39)**
(2.34)**
TRI_agg Financial Crisis -0.21
(2.32)
** seven_one -0.198 (1.53)
three_one -
6.047 (0.72) nine_one -0.113 (0.68) Country Dummy Yes Yes Yes No No No No No No No No
Constant -1.855 -1.868 -1.925 -1.774 -1.874 -1.738 -
1.347 -1.843
(6.47)***
(6.32)***
(6.09)***
(8.53)***
(6.30)***
(6.63)***
(2.33)**
(6.78)***
Observations 923 923 923 46 46 46 46 46 46 46 46 Adjusted R-squared 0.77 0.77 0.77 0.11 0.09 0.09 0.22 0.08 0.11 0.11 0.08 Breusch-Pagan: Ho=constant variance 0.25 0.25 0.21 0.04 0.02 0.01 0 0.02 0 0 0.01 Ramsey-Reset Test: Ho=no omit. Var 0.09 0.11 0.12 0.13 0.18 0.15 0 0.11 0.29 0 0.16 Shapiro-Wilk W test: Ho=normality 0 0 0 0 0 0 0 0 0 0 0 Absolute value of t statistics in parentheses
* significant at 10%; ** significant at 5%; *** significant at 1%
Table 2: Banking Sector - Second Stage (modal TRI) Estimation

FE_2_1
FE_2_2
FE_2_3
FE_2_4
FE_2_5
FE_2_6
FE_2_7
FE_2_8
FE_2_9
FE_2_10
FE_2_11
FE_2_12
FE_2_13
FE_2_14
FE_2_15
tri_m1
0.123
0.122
0.138
0.07
7 0.06
9 0.12
(1.41)
(1.39)
(1.16)
(0.92
) (0.76
) (1.17
)
tri_m2
0.049
0.052
0.043
-
0.032
-0.02
3
-0.10
3
(0.89)
(0.91)
(0.52)
(0.5) (0.32
) (1.35
)
tri_m3
1.006
1.038
0.984
0.96
8 0.97
8 0.97
5
(1.92)*
(1.94)*
(1.78)*
(2.18)**
(2.16)**
(2.22)**
tri_m4
-0.21
4
-0.21
5
-0.25
1
-0.19
5
-0.19
3
-0.22
4
-1.63 -1.6
(1.92)*
(2.08)**
(2.06)**
(2.54)**
C5
0.414
0.416
-0.41
5
0.382
0.386
0.41 0.39 0.4 0.41
8 0.43
0.429
0.394
0.443
0.446
0.45
(1.24)
(1.22)
(2.25)**
(1.18)
(1.17)
(0.99)
(1.35)
(1.35)
(1.15)
(1.43)
(1.41)
(1.11)
(1.66)
(1.64)
(1.32)
eight_ten
-0.413
-0.41
6
-0.45
5
-0.38
9
-0.39
6
-0.41
4
-0.33
5
-0.34
9
-0.37
3
-0.41
1
-0.40
9
-0.44
3
-0.38
3
-0.38
7
-0.40
7
(2.49)**
(2.43)**
(1.83)*
(2.29)**
(2.25)**
(2.14)**
(2.35)**
(2.40)**
(2.25)**
(2.70)***
(2.65)**
(2.97)***
(3.07)***
(3.04)***
(2.87)***
financial_crisis_dummy
-0.278
-0.29
2 0
-0.13
8
-0.17
5
-0.30
4 -0.56
-0.65
2
-0.77
6
-0.06
4
-0.05
6 -0.1
-0.59
8 -0.63
-0.70
6
(2.20)**
(2.06)**
(0.68)
(1.23)
(1.24)
(1.36)
(2.32)**
(2.23)**
(2.75)***
(0.43)
(0.39)
(0.48)
(2.48)**
(2.30)**
(2.79)***
interest_variaton
0 -
8.287
0 0.00
1
0.001
0.002
0 0 0 0.00
1
(0.27)
(0.86)
(0.57
) (0.97)
(1.36
) (1.65
)
(0.11)
(0.01)
(0.6) (0.73
)
three_one
-0.13
9
-7.18
2
-3.15
2
-2.35
3
0.553
(0.58)
(0.76)
(0.5) (0.37
) (0.1)
nine_one
1.047
-
0.04
-0.08
6
-0.01
2
-0.12
5
(1.41)
(0.21)
(0.43
)
(0.07)
(0.62
)
seven_three_one
-
0.082
0.93
4
0.275
0.54
5
-0.02
9
(0.54)
(1.45)
(0.45
)
(0.85)
(0.05
) seven_one - - - - -

0.154
0.148
0.122
0.307
0.269
(0.73)
(0.93)
(0.8) (1.70
)*
(1.59)
Country Dummy
No
No No No No No No No No No No No No No No
Constant
-1.793
-1.79
3 43
-1.71
5
-1.71
7
-1.02
3
-2.49
8
-2.52
6
-2.07
6
-1.44
2
-1.44
1
-1.01
4
-2.26
5
-2.27
7
-2.03
5
(6.34)***
(6.27)***
(0.1) (6.79)***
(6.72)***
(1.46)
(4.53)***
(4.51)***
(4.53)***
(7.90)***
(7.78)***
(1.6) (5.55)***
(5.45)***
(4.58)***
Observations 46 46 46 46 46 43 46 46 43 46 46 43 46 46 43 Adjusted R-squared
0.09
0.07 0.06 0.05 0.03 0.05 0.3 0.3 0.29 0.17 0.15 0.22 0.39 0.38 0.42
Breusch-Pagan: Ho=constant variance
0.02
0.02 0 0.23 0.18 0 0 0 0 0 0 0 0 0 0
Ramsey-Reset Test: Ho=no omitted var
0.04
0.05 0 0.56 0.38 0.09 0 0 0 0 0 0 0 0 0
Shapiro-Wilk test: Ho=normality
0 0 0 0 0 0 0 0.01 0.04 0 0 0 0.06 0.08 0.39
Absolute value of t statistics in parentheses * significant at 10%; ** significant at 5%; *** significant at 1%
Table 3: Fixed Telecom Sector -First and Second Stage (TRI agg) Estimation
FE_1_1
FE_1_2
FE_1_3
FE_1_4
FE_2_1
FE_2_2
FE_2_3
FE_2_4
FE_2_5
FE_2_6
FE_2_7
FE_2_8
K_intensity 0.217 0.217 0.217 0.197 (2.07)
** (2.08)
** (2.07)
** (1.85)
*
net_sales 0 0 0 (2.29)
** (2.31)
** (2.29)
**
tot_empl 0 (0.56) mkt_share 1.22 1.22 1.22 1.021 (3.64)
*** (3.67)***
(3.64)***
(2.36)**
sales_growth -0.017 -0.017 -0.017 -0.002 (0.32) (0.33) (0.32) (0.04) tri_agg_fx 0.5 0.599 0.592 0.601 0.562 0.388 0.395 0.354 (2.28)
** (2.77)
** (2.77)
** (2.75)
** (2.56)
** (2.01)
* (2.03)
* (2.02)
* developing_dummy
-1.371 0.451 -1.509 (5.27)
*** (0.75) (2.26)
** mena_dummy -1.811 -1.732 -0.132
-0.213 (6.12)
*** (4.61)***
0.5 0.9 fx_tel_lines_pop -0.008 -0.009 -
0.008 -
0.009 -
0.001 0.003 0.004 -0.012
(2.19)**
(2.61)**
(2.38)**
(2.38)**
0.1 0.52 0.61 1.36 fx_revenue_g -0.507 -0.719 -
0.814 -
0.796 -
0.729 -0.193 -0.252 -0.388
(0.96) (1.39) (1.57) (1.51) (1.36) (0.28) (0.36) (0.61) Regulation FX 0.125 0.139 0.132 0.124 0.082 0.076 0.093 (1.82)
* (2.01)
* (1.84)
* (1.72) (0.81) (0.75) (1.03)
mob_subs_digitalshare
-0.014
-0.012
-0.012
-0.013 -0.008 -0.014 (1.19) (0.94) (1.04) (1.16) (0.67) (1.36) regvarspc1_mob 0.047 0.027 0.048 (0.41) (0.24) (0.47) mob_subs_pop 0.013 0.014 0.022 (3.21)
*** (3.29)***
(4.10)*** mobile_revenue
_g -0.462 -0.296 -0.302
(0.66) (0.41) (0.47) Country_dummy
yes yes yes yes no no no no no no no no

Constant -2.072 -2.111 -
0.768 -
0.937 -
1.323 -0.505 -0.956 1.058
(9.04)***
(9.62)***
(0.67) (0.77) (0.96) (0.42) (0.73) (0.82) Observations 120 118 120 110 27 27 27 27 27 27 27 27 Adjusted R-squared
0.77 0.78 0.77 0.79 0.54 0.58 0.59 0.57 0.58 0.7 0.7 0.75 Breusch-Pagan 0 0 0 0 0.34 0.51 0.4 0.45 0.45 0.71 0.82 0.82 Ramsey-Reset Test
0 0 0 0 0.18 0.04 0.07 0.05 0.01 0.37 0.11 0.94 Shapiro-Wilk W test
0 0 0 0 0.55 0.41 0.34 0.56 0.55 0.85 0.45 0.71 Robust t statistics in parenthesis * significant at 10%; ** significant at 5%; *** significant at 1%
Table 4: Fixed Telecom Sector -Second Stage (TRI Mode 1 and 2) Estimation
FE_2_1 FE_2_2 FE_2_3 FE_2_4 FE_2_5 FE_2_6 FE_2_7 FE_2_8 FE_2_9 FE_2_10 FE_2_11 FE_2_12
m1_tri_fx 0.211 0.178 0.157 0.187 0.174 0.186
(2.81)** (1.78)* (1.43) (3.45)*** (2.88)** (2.50)**
m2_tri_fx 0.208 0.178 0.176 0.034 -0.002 0.109
(2.48)** (1.89)* (1.76)* (0.32) (0.01) (1.21)
fx_tel_lines_pop -0.011 -0.012 -0.012 0.003 0.003 -0.013 -0.008 -0.01 -0.009 0.003 0.003 -0.012
(3.75)*** (3.19)*** (3.06)*** (0.53) (0.58) (1.53) (2.29)** (2.07)* (1.85)* (0.69) (0.54) (1.46)
fx_revenue_g -0.341 -0.416 -0.515 0.447 0.38 0.212 -0.508 -0.554 -0.656 0.008 -0.005 -0.323
(0.58) (0.73) (0.85) (0.92) (0.77) (0.44) (0.77) (0.88) (0.97) (0.01) (0.01) (0.52)
Refulation FX 0.051 0.067 0.041 0.037 0.057 0.047 0.063 0.05 0.042 0.073
(0.8) (1.12) (0.44) (0.4) (0.72) (0.77) (1.11) (0.5) (0.42) (0.83)
mob_subs_digitalshare -0.013 -0.014 -0.011 -0.015 -0.015 -0.013 -0.009 -0.013
(2.78)** (2.58)** (1.64) (3.04)*** (3.22)*** (2.38)** (1.28) (3.09)***
mena_dummy -0.152 -0.194
(1.13) 1.15
developing_dummy -1.62 -1.766
(2.30)** (2.39)**
Regulation MOB 0.042 0.028 0.043 0.033 0.029 0.006
(0.42) (0.27) (0.49) (0.28) (0.24) (0.05)
mob_subs_pop -0.016 -0.016 -0.024 -0.015 -0.016 -0.025
(4.22)*** (4.14)*** (5.75)*** (3.83)*** (3.79)*** (5.46)***
mobile_revenue_g -0.932 -0.784 -0.754 -0.453 -0.346 -0.174
(1.98)* (1.61) (1.61) (0.72) 0.6 (0.34)
Constant -1.76 -1.718 -0.432 -0.055 -0.38 1.591 -1.909 -1.849 -0.447 -0.261 -0.569 1.332
(18.12)*** (17.23)*** (0.91) (0.09) (0.54) (1.52) (16.76)*** (15.08)*** (1.03) (0.39) (0.84) (1.35)
Observations 27 27 27 27 27 27 27 27 27 27 27 27
Adjusted R-squared 0.47 0.46 0.46 0.66 0.65 0.73 0.48 0.46 0.47 0.63 0.62 0.71
Breusch-Pagan 0.04 0.03 0.02 0.15 0.15 0.19 0.08 0.05 0.03 0.29 0.35 0.38
Ramsey-Reset Test 0.79 0.71 0.81 0.93 0.91 0.83 0.84 0.95 0.9 0.98 0.87 0.97
Shapiro-Wilk W test 0.47 0.24 0.08 0.28 0.18 0.34 0.69 0.29 0.16 0.45 0.2 0.64
Robust t statistics in parentheses
* significant at 10%; ** significant at 5%; *** significant at 1%
Table 5 Fixed Telecom Sector -Second Stage (TRI Mode 3 nd 4 Estimation)
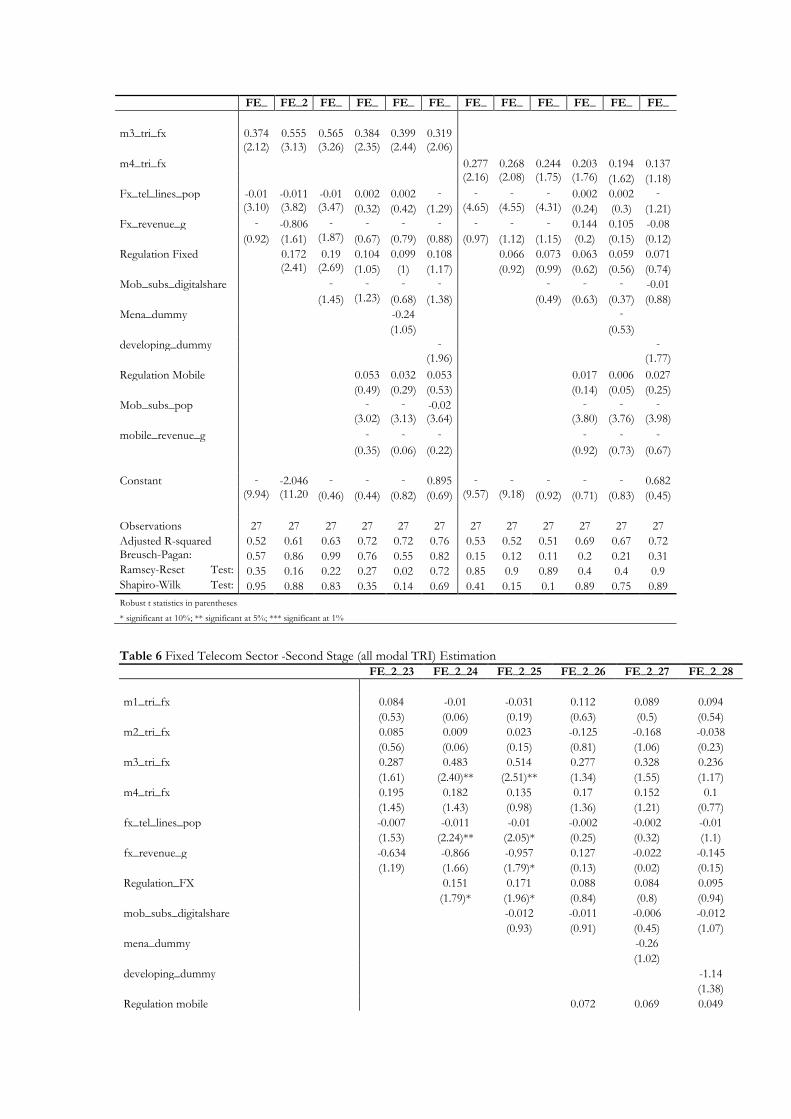
FE_2_12
FE_2_13
FE_2_14
FE_2_15
FE_2_16
FE_2_17
FE_2_18
FE_2_19
FE_2_20
FE_2_21
FE_2_22
FE_2_23
m3_tri_fx 0.374 0.555 0.565 0.384 0.399 0.319
(2.12)**
(3.13)***
(3.26)***
(2.35)**
(2.44)**
(2.06)*
m4_tri_fx 0.277 0.268 0.244 0.203 0.194 0.137
(2.16)**
(2.08)**
(1.75)*
(1.76)*
(1.62) (1.18)
Fx_tel_lines_pop -0.01 -0.011 -0.01 0.002 0.002 -0.011
-0.013
-0.014
-0.014
0.002 0.002 -0.011 (3.10)
*** (3.82)***
(3.47)***
(0.32) (0.42) (1.29) (4.65)***
(4.55)***
(4.31)***
(0.24) (0.3) (1.21)
Fx_revenue_g -0.491
-0.806 -0.927
-0.472
-0.554
-0.576
-0.517
-0.606
-0.641
0.144 0.105 -0.08
(0.92) (1.61) (1.87)*
(0.67) (0.79) (0.88) (0.97) (1.12) (1.15) (0.2) (0.15) (0.12)
Regulation Fixed 0.172 0.19 0.104 0.099 0.108 0.066 0.073 0.063 0.059 0.071
(2.41)**
(2.69)**
(1.05) (1) (1.17) (0.92) (0.99) (0.62) (0.56) (0.74)
Mob_subs_digitalshare -0.016
-0.013
-0.008
-0.014
-0.007
-0.008
-0.005
-0.01
(1.45) (1.23) )
(0.68) (1.38) (0.49) (0.63) (0.37) (0.88)
Mena_dummy -0.24 -0.132
(1.05) (0.53)
developing_dummy -1.328
-1.334 (1.96)
* (1.77)
* Regulation Mobile 0.053 0.032 0.053 0.017 0.006 0.027
(0.49) (0.29) (0.53) (0.14) (0.05) (0.25)
Mob_subs_pop -0.012
-0.013
-0.02 -0.015
-0.015
-0.023 (3.02)
*** (3.13)***
(3.64)***
(3.80)***
(3.76)***
(3.98)*** mobile_revenue_g -
0.242 -
0.045 -
0.141 -
0.668 -
0.557 -
0.468 (0.35) (0.06) (0.22) (0.92) (0.73) (0.67)
Constant -1.953
-2.046 -0.495
-0.513
-1.028
0.895 -1.993
-1.955
-1.283
-0.921
-1.161
0.682
(9.94)***
(11.20)***
(0.46) (0.44) (0.82) (0.69) (9.57)***
(9.18)***
(0.92) (0.71) (0.83) (0.45)
Observations 27 27 27 27 27 27 27 27 27 27 27 27
Adjusted R-squared 0.52 0.61 0.63 0.72 0.72 0.76 0.53 0.52 0.51 0.69 0.67 0.72 Breusch-Pagan: Ho=constant variance
0.57 0.86 0.99 0.76 0.55 0.82 0.15 0.12 0.11 0.2 0.21 0.31 Ramsey-Reset Test: Ho=no omitted var
0.35 0.16 0.22 0.27 0.02 0.72 0.85 0.9 0.89 0.4 0.4 0.9 Shapiro-Wilk Test: Ho=normality
0.95 0.88 0.83 0.35 0.14 0.69 0.41 0.15 0.1 0.89 0.75 0.89
Robust t statistics in parentheses
* significant at 10%; ** significant at 5%; *** significant at 1%
Table 6 Fixed Telecom Sector -Second Stage (all modal TRI) Estimation
FE_2_23 FE_2_24 FE_2_25 FE_2_26 FE_2_27 FE_2_28
m1_tri_fx 0.084 -0.01 -0.031 0.112 0.089 0.094
(0.53) (0.06) (0.19) (0.63) (0.5) (0.54)
m2_tri_fx 0.085 0.009 0.023 -0.125 -0.168 -0.038
(0.56) (0.06) (0.15) (0.81) (1.06) (0.23)
m3_tri_fx 0.287 0.483 0.514 0.277 0.328 0.236
(1.61) (2.40)** (2.51)** (1.34) (1.55) (1.17)
m4_tri_fx 0.195 0.182 0.135 0.17 0.152 0.1
(1.45) (1.43) (0.98) (1.36) (1.21) (0.77)
fx_tel_lines_pop -0.007 -0.011 -0.01 -0.002 -0.002 -0.01
(1.53) (2.24)** (2.05)* (0.25) (0.32) (1.1)
fx_revenue_g -0.634 -0.866 -0.957 0.127 -0.022 -0.145
(1.19) (1.66) (1.79)* (0.13) (0.02) (0.15)
Regulation_FX 0.151 0.171 0.088 0.084 0.095
(1.79)* (1.96)* (0.84) (0.8) (0.94)
mob_subs_digitalshare -0.012 -0.011 -0.006 -0.012
(0.93) (0.91) (0.45) (1.07)
mena_dummy -0.26
(1.02)
developing_dummy -1.14
(1.38)
Regulation mobile 0.072 0.069 0.049
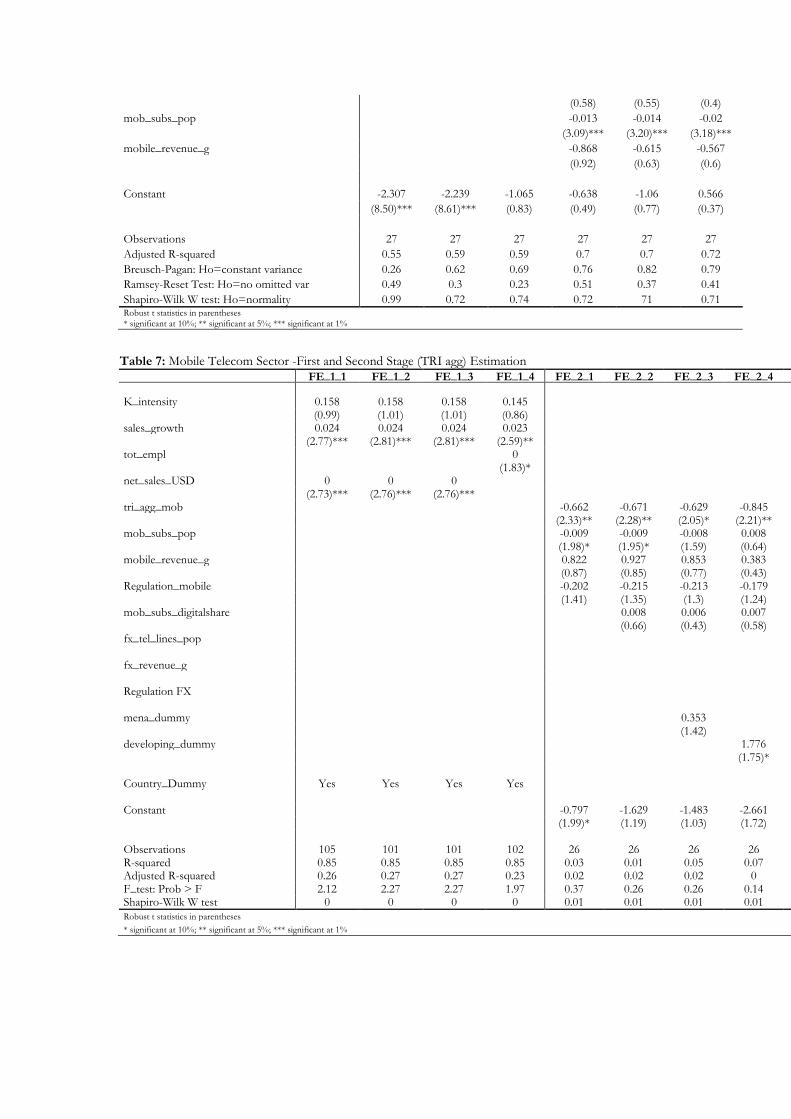
(0.58) (0.55) (0.4)
mob_subs_pop -0.013 -0.014 -0.02
(3.09)*** (3.20)*** (3.18)***
mobile_revenue_g -0.868 -0.615 -0.567
(0.92) (0.63) (0.6)
Constant -2.307 -2.239 -1.065 -0.638 -1.06 0.566
(8.50)*** (8.61)*** (0.83) (0.49) (0.77) (0.37)
Observations 27 27 27 27 27 27
Adjusted R-squared 0.55 0.59 0.59 0.7 0.7 0.72
Breusch-Pagan: Ho=constant variance 0.26 0.62 0.69 0.76 0.82 0.79
Ramsey-Reset Test: Ho=no omitted var 0.49 0.3 0.23 0.51 0.37 0.41
Shapiro-Wilk W test: Ho=normality 0.99 0.72 0.74 0.72 71 0.71 Robust t statistics in parentheses
* significant at 10%; ** significant at 5%; *** significant at 1%
Table 7: Mobile Telecom Sector -First and Second Stage (TRI agg) Estimation
FE_1_1 FE_1_2 FE_1_3 FE_1_4 FE_2_1 FE_2_2 FE_2_3 FE_2_4 FE_2_5 FE_2_6 FE_2_7 K_intensity 0.158 0.158 0.158 0.145 (0.99) (1.01) (1.01) (0.86) sales_growth 0.024 0.024 0.024 0.023 (2.77)*** (2.81)*** (2.81)*** (2.59)** tot_empl 0 (1.83)* net_sales_USD 0 0 0 (2.73)*** (2.76)*** (2.76)*** tri_agg_mob -0.662 -0.671 -0.629 -0.845 -0.762 -0.552 -0.652 (2.33)** (2.28)** (2.05)* (2.21)** (2.13)** (1.88)* (2.08)* mob_subs_pop -0.009 -0.009 -0.008 0.008 -0.004 -0.004 -0.009 (1.98)* (1.95)* (1.59) (0.64) (0.57) (0.69) (1.81)* mobile_revenue_g 0.822 0.927 0.853 0.383 0.552 2.959 0.836 (0.87) (0.85) (0.77) (0.43) (0.51) (1.67) (0.74) Regulation_mobile -0.202 -0.215 -0.213 -0.179 -0.171 -0.305 -0.134 (1.41) (1.35) (1.3) (1.24) (1.21) (1.33) (0.48) mob_subs_digitalshare 0.008 0.006 0.007 0.006 0.026 0.009 (0.66)
) (0.43) (0.58) (0.48) (1.83)* (0.68)
fx_tel_lines_pop -0.013 (1.22) fx_revenue_g -1.98 (1.01) Regulation FX -0.096 (0.45) mena_dummy 0.353 (1.42) developing_dummy 1.776 (1.75)* Country_Dummy Yes Yes Yes Yes Constant -0.797 -1.629 -1.483 -2.661 -1.012 -3.75 -1.655 (1.99)* (1.19) (1.03) (1.72) (0.76) (2.33)** (1.25) Observations 105 101 101 102 26 26 26 26 26 24 26 R-squared 0.85 0.85 0.85 0.85 0.03 0.01 0.05 0.07 0.02 0 0.06 Adjusted R-squared 0.26 0.27 0.27 0.23 0.02 0.02 0.02 0 0.01 0.01 0.02 F_test: Prob > F 2.12 2.27 2.27 1.97 0.37 0.26 0.26 0.14 0.71 0.48 0.8 Shapiro-Wilk W test 0 0 0 0 0.01 0.01 0.01 0.01 0.02 0.01 0
Robust t statistics in parentheses
* significant at 10%; ** significant at 5%; *** significant at 1%

Table 8: Mobile Telecom Sector -Second Stage (modal TRI) Estimation
FE_2_
1
FE_2_2
FE_2_3
FE_2_4
FE_2_5
FE_2_6
FE_2_7
FE_2_8
FE_2_9
FE_2_10
FE_2_11
FE_2_12
FE_2_13
FE_2_14
FE_2_15
m1_tri_mob 0.129
0.217
0.06 0.362 0.404 0.236
(0.61)
(0.94)
(0.29)
(1.56)
(1.54)
(1.08) m2_tri_mob -
0.601
-0.56
9
-0.57
6
-0.448
-0.448
-0.345 (2.5
4)** (2.36)**
(2.50)**
(1.73)
(1.66)
(1.33) m3_tri_mob -
0.586
-0.56
5
-0.69
3
-0.693
-0.672
-0.728 (2.3
7)** (2.12)**
(2.36)**
(2.28)**
(2.11)*
(2.35)** m4_tri_mob 0.334 0.29
4 0.405 0.05 0.006 0.189
(1.49)
(1.27)
(1.68)
(0.19)
(0.02)
(0.73) mob_subs_p
op 0 0.00
2 0.01
1 0 0.00
1 0.01 -
0.01 -
0.01 0.00
6 0 0.00
1 0.016 -
0.009 -
0.008 0.006
(0.02)
(0.5) (0.73)
(0.08)
(0.12)
(0.69)
(2.37)**
(1.97)*
(0.55)
(0.11)
(0.29)
(1.01)
(2.00)*
(1.61)
(0.46) mobile_reve
nue_g 0.86
4 0.66
8 0.54
5 1.26
4 1.13
8 0.93
2 0.73
3 0.70
3 0.16
8 0.754 0.67 0.287 0.923 0.863 0.341
(0.75)
(0.59)
(0.53)
(1.06)
(0.94)
(0.87)
(0.71)
(0.66)
(0.19)
(0.63)
(0.56)
(0.29)
(0.86)
(0.81)
(0.32) Regulation_
Mobile -
0.055
-0.06
-0.02
1
-0.21
9
-0.22
1
-0.17
1
-0.21
7
-0.21
5
-0.17
2
-0.071
-0.08 -0.012
-0.304
-0.301
-0.241 (0.4
3) (0.47)
(0.18)
(1.32)
(1.29)
(1.12)
(1.38)
(1.33)
(1.24)
(0.56)
(0.62)
(0.11)
(1.58)
(1.51)
(1.33) mena_dum
my 0.92
2 0.52
9 0.17
9 0.49
7 0.384
(2.45)**
(2.42)**
(0.69)
(1.94)*
(0.96)
developing_dummy
1.05 1.011
1.721
1.411 1.51
(0.87)
(0.86)
(1.77)*
(1.13)
(1.59) mob_subs_d
igitalshare 0.00
7 0.00
3 0.00
4 -
0.033
-0.03
4
-0.03
3
0.015
0.013
0.014
0.005 0.002
0.003 -0.005
-0.007
-0.002 (0.4
6) (0.19)
(0.28)
(2.78)**
(2.83)**
(3.01)***
(1.1) (0.87)
(1.1) (0.42)
(0.16)
(0.29)
(0.39)
(0.51)
(0.17)
Constant -2.54
7
-2.30
3
-3.06
4
1.563
1.635
0.732
-2.21
7
-2.12
4
-3.36
4
-2.759
-2.43
6
-3.814
-0.444
-0.281
-1.995 (1.4
6) (1.35)
(1.5) (1.29)
(1.34)
(0.49)
(1.6) (1.42)
(2.07)*
(1.79)*
(1.53)
(1.82)*
(0.36)
(0.21)
(1.27)
Observations
26 26 26 26 26 26 26 26 26 26 26 26 26 26 26 Adjusted R-squared
0.15 0.15 0.16 0.04 0.07 0.04 0.04 0.01 0.12 0.09 0.13 0.06 0.08 0.04 0.12 Breusch-Pagan
0.03 0.03 0 0.01 0.01 0 0.01 0.01 0 0.06 0.05 0 0 0 0 Ramsey-Reset Test
0.72 0.9 0.2 0.22 0.09 0.06 0.29 0.22 0.1 0.56 0.58 0.17 0.13 0.03 0.18 Shapiro-Wilk test
0 0 0.01 0 0 0.01 0.01 0.01 0.01 0 0 0.01 0.06 0.06 0.01
Robust t statistics in parentheses
* significant at 10%; ** significant at 5%; *** significant at 1%
Bibliography
Anderson, J.E. and Neary, J.P. (1994) Measuring the Restrictiveness of Trade Policy, World
Bank Econ Review; 8: 151-169.
Betancourt, R. and Gautschi, D. (1993). “The Outputs of Retail Activities: Concepts,
Measurements, and Evidence from U.S. Census Data”, Review of Economics and Statistics
(1993), 294–301.
Boylaud, O. and G. Nicoletti (2000), Regulation, market structure and performance in
telecommunications. OECD Economics Department Working Papers No. 237.
Brock, P.L. and Suarez, L.R. (2000). “Understanding the Behaviour of Bank Spreads in Latin
America”, Journal of Development Economics, 63, 113-135.
Colecchia, A. (2000), Measuring barriers to market access for services: a pilot study on
accounting services. In C. Findlay, & T. Warren, Impediments to Trade in Services (pp.
245-266). Routledge.
Dee, P. (2003), Modelling the policy issues in services trade. Économie internationale , no. 94-
95, 283-300.
Dihel, N., and Shepherd, B. (2007). “Modal Estimates of Services Barriers”, OECD Trade
Policy Working Papers, No. 51 .
Doove, S., Gabitas, O., Nguyen-Hong, D., and Owen, J. (2001). “Price Effects of Regulation:
Telecommunications, Air Passenger Transport and Electricity Supply”, Productivity
Commission Staff Research Paper, AusInfo, Canberra.
Findlay, C. and D. Round (2006), The 'three pillars of stagnation': challenges for air transport
reform:. World Trade Review , 5: 2, 251–270.
Findlay, C., and Warren, T. (2000). “Introduction” in FINDLAY, C. and WARREN, T. (eds).
(2000), Impediments to Trade in Services: Measurement and Policy Implications, Routledge,
London.
Hoekman, B. (2006). “Liberalizing Trade in Services: A Survey”, World Bank Policy
Research Working Paper No. 4030.
Ho, T. and Saunders, A. (1981). “The Determinants of Bank Interest Margins: theory and
empirical evidence”, Journal of Financial and Quantitative Analysis, 4: 581-600.
Irwin, D. A. (2007). “Trade Restrictiveness and Deadweight Losses from U.S. tariffs, 1859-
1961” NBER Working Paper, Cambridge, MA.
Johnson, M., Gregan, T., Gentle, G., and Belin, P. (2000). “The Price Impact of Restrictions
on Banking Services” in FINDLAY, C. and WARREN, T. (eds). (2000), Impediments to
Trade in Services: Measurement and Policy Implications, Routledge, London.
Kalirajan, K. (2000). “Restrictions on Trade in Distribution Services”, Productivity
Commission Staff Research Paper, AusInfo, Canberra, August.
Kalirajan, K., McGuire, G., Nguyen-Hong, D. and Schuele, M. (2000). “The Price Impact of
Restrictions on Banking Services” in FINDLAY, C. and WARREN, T. (eds). (2000),
Impediments to Trade in Services: Measurement and Policy Implications, Routledge, London.

Kang, J.S. (2000). “Price Impact of Restrictions on Maritime Transport Services” in
FINDLAY, C. and WARREN, T. (eds). (2000), Impediments to Trade in Services:
Measurement and Policy Implications, Routledge, London.
Lewis, J. B. (2000). “Two-stage Approaches to Regression Models in Which the Dependent
Variable is Based on Estimates”, Princeton University, mimeo.
Konan, D. E. and Kim, K. E. (2004), “Beyond Border Barriers: The Liberalisation of Services
Trade in Tunisia and Egypt”. The World Economy, Vol. 27, No. 9, pp. 1429-1447
Konan, D. E., and Maskus, K. (2006). “Quantifying the Impact of Services Liberalization in a
Developing Country”, Journal of Development Economics 81, 142-162.
Kunt, A.D and Heizing, H. (1998). “Determinants of Commercial Bank Interest Margins and
Profitability. Some International Evidence”, Policy Research Working Paper, 1900, World
Bank Development Research Group.
Marouani, M.A. and L. Munro (2009), "Assessing Barriers to Trade in Services in the MENA
Region," OECD Trade Policy Working Papers 84, OECD.
Mattoo, A., R. Stern and Z. Gianni (2008), A Handbook of International Trade in Services.
Oxford University Press.
Mcguire, G., & Schuele, M. (2000). Restrictiveness of international trade in banking services.
In C. Findlay, & T. Warren, Impediments to trade in services (pp. 201-214). Routledge.
Moulton, B.R. (1986). “Random Group Effects and the Precision of Regression Estimates”,
Journal of Econometrics, 32: 385-97.
Nguyen-Hong, D. (2000). “Restrictions on Trade in Professional Services”, Productivity
Commission Staff Research Paper, AusInfo, Canberra, August.
Saunders, A. and Schumacher, L. (2000). “The determinants of bank interest rate margin: an
international study”, Journal of International Money and Finance, Vol. 19, pp. 813-832.
Saunders, A. and Schumacher, L. (1997). “The Determinants of Bank Interest Rate Margins:
An International Study”, Washington D.C: George Washington University.
Trewin, R. (2000). “A Price-impact Measure of Impediments to Trade in Telecommunication
Services” in FINDLAY, C. and WARREN, T. (eds). (2000), Impediments to Trade in
Services: Measurement and Policy Implications, Routledge, London.
Turner, P. (2007). “Are Banking System in East Asia Stronger?”, Asian Economic Policy
Review, 2, 75-99.
World Bank (2007a), Morocco's backbone services sectors: Reforms for higher productivity
and deeper integration with Europe. Draft Report No. 39755 - MA.
World Bank (2007b). “Ten Years After the Crisis. Special Focus: sustainable Development in
East Asia‟s Urban Fringe”, The World Bank East Asia and Pacific Region.