Embed Size (px)
Citation preview

An Evaluation of Availability Latency in Carrier-based VehicularAd-Hoc Networks
Shahram Ghandeharizadeh1, Shyam Kapadia1 and Bhaskar Krishnamachari1,2
1Department of Computer Science2Department of Electrical Engineering
University of Southern CaliforniaLos Angeles, CA 90089, USA
Email:shahram,kapadia,[email protected]
Abstract
On-demand delivery of audio and video clips in peer-to-peer vehicular ad-hoc networks is an emerging area ofresearch. Our target environment uses data carriers, termed zebroids, where a mobile device carries a data item onbehalf of a server to a client thereby minimizing its availability latency. In this study, we quantify the variation inavailability latency with zebroids as a function of a rich set of parameters such as car density, storage per device,repository size, and replacement policies employed by zebroids. Using analysis and extensive simulations, we gainnovel insights into the design of carrier-based systems. Significant improvements in latency can be obtained withzebroids at the cost of a minimal overhead. These improvements occur even in scenarios with lower accuracy inthe predictions of the car routes. Two particularly surprising findings are: (1) a naive random replacement policyemployed by the zebroids shows competitive performance, and (2) latency improvements obtained with a simplifiedinstantiation of zebroids are found to be robust to changes in the popularity distribution of the data items.
1 Introduction
Technological advances in areas of storage and wireless communications have now made it feasible to envision on-demand delivery of data items, for e.g., video and audio clips, in vehicular peer-to-peer networks. In prior work,Ghandeharizadehet al. [11] introduce the concept of vehicles equipped with a Car-to-Car-Peer-to-Peer device, termedAutoMata, for in-vehicle entertainment. The notable features of an AutoMata include a mass storage device offeringhundreds of gigabytes (GB) of storage, a fast processor, and several types of networking cards. Even with today’s500GB disk drives, a repository of diverse entertainment content may exceed the storage capacity of a single AutoMata.Such repositories constitute the focus of this study. To exchange data, we assume each AutoMata is configured withtwo types of networking cards: 1) a low-bandwidth networking card with a long radio-range in the order of miles thatenables an AutoMata device to communicate with a nearby cellular or WiMax base station, and 2) a high-bandwidthnetworking card with a limited radio-range in the order of hundreds of feet.
The high bandwidth connection supports data rates in the order of tens to hundreds of Megabits per second [4] andrepresents the ad hoc peer to peer network between the vehicles. This is labelled as the data plane and, as suggested byits name, is employed to exchange data items between devices. The low-bandwidth connection serves as the controlplane, enabling AutoMata devices to exchange meta-data with one or more centralized servers. This connection offersbandwidths in the order of tens and hundreds of Kilobits per second. The centralized servers, termed dispatchers,compute schedules of data delivery along the data plane using the provided meta-data. These schedules are transmittedto the participating vehicles using the control plane. The technical feasibility of such a two-tier architecture is presentedin [9], with preliminary results to demonstrate that the bandwidth of the control plane is sufficient for exchange ofcontrol information needed for realizing such an application.
1

In a typical scenario, an AutoMata device presents a passenger with a list of data items1, showing both the name ofeach data item and its availability latency. The latter, denoted asδ, is defined as the earliest time at which the clientencounters a copy of its requested data item. A data item is available immediately when it resides in the local storage ofthe AutoMata device serving the request. Due to storage constraints, an AutoMata may not store the entire repository.In this case, availability latency is the time from when the user issues a request until when the AutoMata encountersanother car containing the referenced data item. (The terms car and AutoMata are used interchangeably in this study.)
The availability latency for an item is a function of the current location of the client, its destination and travel path, themobility model of the AutoMata equipped vehicles, the number of replicas constructed for the different data items, andthe placement of data item replicas across the vehicles. A method to improve the availability latency is to employ datacarriers which transport a replica of the requested data item from a server car containing it to a client that requested it.These data carriers are termed ‘zebroids’.
Selection of zebroids is facilitated by the two-tiered architecture. The control plane enables centralized informationgathering at a dispatcher present at a base-station.2 Some examples of control information are currently active requests,travel path of the clients and their destinations, and paths of the other cars. For each client request, the dispatcher maychoose a set ofz carriers that collaborate to transfer a data item from a server to a client (z-relay zebroids). Here,z is the number of zebroids such that0 ≤ z < N , whereN is the total number of cars. Whenz = 0 there areno carriers, requiring a server to deliver the data item directly to the client. Otherwise, the chosen relay team ofzzebroids hand over the data item transitively to one another to arrive at the client, thereby reducing availability latency(see Section4.1 for details). To increase robustness, the dispatcher may employ multiple relay teams of z-carriers forevery request. This may be useful in scenarios where the dispatcher has lower prediction accuracy in the informationabout the routes of the cars. Finally, storage constraints may require a zebroid to evict existing data items from itslocal storage to accommodate the client requested item.
In this study, we quantify the following main factors that affect availability latency in the presence of zebroids: (i)data item repository size, (ii) car density, (iii) storage capacity per car, (iv) client trip duration, (v) replacement schemeemployed by the zebroids, and (vi) accuracy of the car route predictions. For a significant subset of these factors, weaddress some key questions pertaining to use of zebroids both via analysis and extensive simulations.
Our main findings are as follows. A naive random replacement policy employed by the zebroids shows competitiveperformance in terms of availability latency. With such a policy, substantial improvements in latency can be obtainedwith zebroids at a minimal replacement overhead. In more practical scenarios, where the dispatcher has inaccurateinformation about the car routes, zebroids continue to provide latency improvements. A surprising result is thatchanges in popularity of the data items do not impact the latency gains obtained with a simple instantiation of z-relayzebroids called one-instantaneous zebroids (see Section4.1). This study suggests a number of interesting directions tobe pursued to gain better understanding of design of carrier-based systems that improve availability latency.
The rest of this paper is organized as follows. Section2 provides a brief overview of the related work in the area.Section3 provides an overview of the terminology along with the factors that impact availability latency in the presenceof zebroids. Section4 describes how the zebroids may be employed. Section5 provides details of the analysismethodology employed to capture the performance with zebroids. Section6 describes the details of the simulationenvironment used for evaluation. Section7 enlists the key questions examined in this study and answers them viaanalysis and simulations. Finally, Section8 presents brief conclusions and future research directions.
2 Related Work
In this section, we provide a brief overview of the related work in the area. First, we provide a description of thevarious studies on replication in mobile ad-hoc networks. Subsequently, we present related works in the area of delay
1Without loss of generality, the term data item might be either traditional media such as text or continuous media such as an audio or video clip.2There may be dispatchers deployed at a subset of the base-stations for fault-tolerance and robustness. Dispatchers between base-stations may
communicate via the wired infrastructure.
2

tolerant networks where data carriers such as zebroids have been employed.
2.1 Replication in MANETs
Replication in MANETs has been explored in a wide variety of contexts. Hara [12] proposes three replica allocationmethods. The first one that allocates replicas to nodes only on the basis of their local preference to data items.The second technique extends the first by considering the contents of the connected neighbors while performingthe allocation to remove some redundancy. The last technique discovers bi-connected components in the networktopology and allocates replicas accordingly. The frequency of access to data items is known in advance and doesnot change. Moreover, the replica allocation is performed in a specific period termed the relocation period. Severalextensions to this work have been proposed where replica allocation methods have been extended to consider dataitems with periodic [14, 16] and aperiodic [19, 15] updates. Further extensions to the proposed replica allocationmethods consider the stability of radio links [21], topology changes [22] and location history of the data item accesslog [17, 18]. In [20], the authors consider data items that are correlated by virtue of being requested simultaneously andpresent the performance of the replica allocation methods proposed earlier. Related studies [28, 34, 13] have appearedin the context of cooperative caching in mobile ad-hoc networks where the objective is to use caching to reduce themobile node’s latency in accessing data items. All the above studies are based on simulations of the proposed replicaallocation methods.
Our study differs from the above in the following ways. We use cars as data carriers (zebroids) to reduce the latencyof a currently active request. The choice of a zebroid and the process of transferring the requested item from a serverto an appropriate zebroid is made possible by the presence of a two-tier architecture comprising a low bandwidthcontrol plane and a high bandwidth data plane [9]. This architecture was used to predict the list of data items thatwill be encountered by a client during its journey. In prior work [10], we evaluated the latency performance of threepopular static replication schemes: linear, square-root and random in a vehicular ad-hoc network. The square-rootscheme provided a competitive performance across a large parameter space. In this study, we extend our prior workby employing zebroids as data carriers to improve the client observed latency. Once a static square-root replicationscheme has allocated the replicas across the cars, we study the role of dynamic data reorganization to better equipthe system storage to the active user requests. Since the zebroids are AutoMatas whose local storage is fully utilized,we use different cache replacement policies that yield different replica distributions as a function of time. We are notaware of related work that employs dynamic data reorganization, across a distributed storage environment comprisedby mobile vehicles, to improve user latency.
2.2 Delay Tolerant Networks
Recently, several novel and important studies such as ZebraNet [23], DakNet [26], Data Mules [29], Message Fer-ries [35], SWIM [30], and Seek and Focus [31] have analyzed factors impacting intermittently connected networksconsisting of data carriers similar in spirit to zebroids. Table1 provides an overview of these studies. Factors con-sidered by each study are dictated by their assumed environment and target application. A novel characteristic of ourstudy is the impact on availability latency for a given database repository of items. In future work, it may be useful tointegrate these diverse studies along with our work under a comprehensive general model/framework that incorporatesall possible factors, environmental characteristics, and application requirements.
Below, we provide an overview of the different projects and their target applications. In ZebraNet, data sensed bysensors attached to zebras is collected by humans as they drive by in a vehicle. In DakNet, vehicles are used to transportdata between villages and cities using a store and forward mechanism. Message Ferries capture a more generalizedscenario where the movement of the ferries can be controlled to carry data from a source node to a destination node.With Data Mules, intermediate carriers that follow a random walk mobility model are used to carry data from staticsensors to base-stations. When all nodes move as per this mobility model, end-to-end routing can be performed usinga Seek and Focus strategy presented in [31]. With the Shared Wireless Infostation Model (SWIM), data collected bysensors on whales is replicated when two sensors are in the vicinity of each other and ultimately relayed to a small
3

Study Potentially Mobility Model Delivery Energy Optimize How many StorageMobile Efficiency Delay copies ConstraintNodes created?
ZebraNet [23] All Controlled + species Many to One X Many Xdependent
DakNet [26] One Controlled One to One OneMessage Ferries [35] All Random + One to One X X One
ControlledSWIM [30] Most Random without Many to Some X Many
predictionsData Mules [29] Some Random without Many to One One X
predictionsSeek and Focus [31] All Random without One to One X X One
predictionsOur Work All Random with Any to One X One or More X
predictions
Table 1:Related studies on intermittently connected networks.
number of static on-shore base-stations when the whales come to the surface.
We now describe how the previous studies are different from ours, detailing the novel features of our study. None ofthese studies predict the future movement trajectory of the nodes to accomplish data delivery as we do in our study withzebroids. Moreover, while DakNet, Message Ferries, and Seek and Focus employ end-to-end data delivery, studiessuch as Data Mules, ZebraNet and SWIM require data from many nodes to be sent to a single (or a few) base-station(s)yielding a many-to-one or many-to-some delivery mode. In our study, the mode of data delivery is any-to-one since arequest for a certain data item can be satisfied by any node that stores that item.
Studies such as ZebraNet, Message Ferries, and Seek and Focus seek to optimize the energy usage, especially withsensors. This is not a constraint with a AutoMata environment. Instead, we seek to optimize meeting time or latencyto request satisfaction in the presence of storage constraints. This metric is similar to that considered in the seek andfocus study which ignores storage constraints per node. Also, even though the Data Mules study considers a storageconstraint per node, it does not optimize for latency subject to this constraint. Instead, that study provides the scalingbehavior needed in the storage per sensor (and mule) to maintain the data delivery ratio over a certain threshold.
While reliable data delivery is required with DakNet, Seek and Focus, and Message Ferries, storage constraints maycause data loss, preventing Data Mules and Zebranet from achieving the same. In our study, the notion of reliable datadelivery has a different connotation. This is because for each data item request, the client stipulates a deadline, whichis the maximum amount of time it is willing to wait to encounter a copy of the requested item. Zebroids are employedto improve the availability latency for each request, increasing the likelihood of the client’s deadline being met.
Finally, studies like ZebraNet, DakNet and Data Mules can tolerate high delay as long as the appropriate data isdelivered. However, the Seek and Focus and Ferries approach use delay as a metric of interest. Also, with zebroids,SWIM, and ZebraNet, multiple replicas of the data are employed to facilitate reduction in the delivery latency. Replicasare created when two nodes encounter each other. While there are no storage constraints with SWIM, with ZebraNet,excess data is dropped from the sensors using a drop-tail like scheme. Moreover, none of the studies mentioned aboveuse a two-tier architectural framework like ours that facilitates intelligent selection of data carriers and creation ofappropriate data replicas to reduce latency for currently active requests. With storage constraints, we also explore awide variety of replacement policies deployed at the zebroids.
In prior work, Ghandeharizadehet al. [8] examine the performance of replacement policies that employ locationdemographic information about the areas native to a zebroid in order to perform a replacement. The key extensionhere is the use of z-relay zebroids.
4

Database ParametersT Number of data items.Si Size of data itemifi Frequency of access to data itemi.
Replication ParametersRi Normalized frequency of access to data itemiri Number of replicas for data itemin Characterizes a particular replication scheme.δi Average availability latency of data itemiδagg Aggregate availability latency,δagg =
PTj=1 δj · fj
AutoMata System ParametersG Number of cells in the map (2D-torus).N Number of AutoMata devices in the system.α Storage capacity per AutoMata.γ Trip duration of the client AutoMata.ST Total storage capacity of the AutoMata system,ST = N · α.
Table 2:Terms and their definitions
3 Overview and Terminology
Table2 summarizes the notation of the parameters used in the paper. Below we introduce some terminology used inthe paper.
Assume a network ofN AutoMata-equipped cars, each with storage capacity ofα bytes. The total storage capacity ofthe system isST =N · α. There areT data items in the database, each with sizeSi. The frequency of access to dataitem i is denoted asfi, with
∑Tj=1 fj = 1. Let the trip duration of the client AutoMata under consideration beγ.
We now define the normalized frequency of access to the data itemi, denoted byRi, as:
Ri =(fi)n
∑Tj=1(fj)n
; 0 ≤ n ≤ ∞ (1)
The exponentn characterizes a particular replication technique. A square-root replication scheme is realized whenn = 0.5 [6]. This serves as the base-line for comparison with the case when zebroids are deployed.Ri is normalized toa value between 0 and 1. The number of replicas for data itemi, denoted asri, is: ri = min (N, max (1, bRi·N ·α
Sic)).
This captures the case when at least one copy of every data item must be present in the ad-hoc network at all times. Incases where a data item may be lost from the ad-hoc network, this equation becomesri = min (N, max (0, bRi·N ·α
Sic)).
In this case, a request for the lost data item may need to be satisfied by fetching the item from a remote server.
The availability latency for a data itemi, denoted asδi, is defined as the earliest time at which a client AutoMata willfind the first replica of the item accessible to it. If this condition is not satisfied, then we setδi to γ. This indicatesthat data itemi was not available to the client during its journey. Note that since there is at least one replica in thesystem for every data itemi, by settingγ to a large value we ensure that the client’s request for any data itemi will besatisfied. However, in most practical circumstancesγ may not be so large as to find every data item.
We are interested in the availability latency observed across all data items. Hence, we augment the average availabilitylatency for every data itemi with its fi to obtain the following weighted availability latency (δagg) metric: δagg =∑T
i=1 δi · fi
We have identified the following critical parameters that affect availability latency in the presence of zebroids: (i) titledatabase size (T ), (ii) car density (N ), (iii) storage per car (α), (iv) trip duration (γ), (v) replacement scheme employed
5

by the zebroids (see Section4.2), and (vi) prediction accuracy of the car routes. We study the variation in availabilitylatency as a function of each of these parameters in the presence of zebroids. Next, we present our solution approachdescribing how zebroids are selected.
4 Solution Approach
4.1 Zebroids
When a client references a data item missing from its local storage, the dispatcher identifies all cars with a copy ofthe data item as servers. Next, the dispatcher obtains the future routes of all cars for a finite time duration equivalentto the maximum time the client is willing to wait for its request to be serviced. Using this information, the dispatcherschedules the quickest delivery path from any of the servers to the client using any other cars as intermediate carriers.Hence, it determines the optimal set of forwarding decisions that will enable the data item to be delivered to the clientin the minimum amount of time. Note that the latency along the quickest delivery path that employs a relay teamof z zebroids is similar to that obtained with epidemic routing [33] under the assumptions of infinite storage and nointerference.
A simple instantiation of z-relay zebroids occurs whenz = 1 and the client’s request triggers a transfer of a copy of therequested data item from a server to a zebroid in its vicinity. Such a zebroid is termedone-instantaneous zebroid. Insome cases, the dispatcher might have inaccurate information about the routes of the cars. Hence, a zebroid scheduledon the basis of this inaccurate information may not rendezvous with its target client. To minimize the likelihood ofsuch scenarios, the dispatcher may schedule multiple zebroids. This may incur additional overhead due to redundantresource utilization to obtain the same latency improvements.
The time required to transfer a data item from a server to a zebroid depends on its size and the available link bandwidth.With small data items, it is reasonable to assume that this transfer time is small, especially in the presence of the highbandwidth data plane. Large data items may be divided into smaller chunks enabling the dispatcher to schedule oneor more zebroids to deliver each chunk to a client in a timely manner. This remains a future research direction.
Initially, number of replicas for each data item replicas might be computed using Equation1. This scheme computesthe number of data item replicas as a function of their popularity. It is static because number of replicas in the systemdo not change and no replacements are performed. Hence, this is referred to as the ‘no-zebroids’ environment. Wequantify the performance of the various replacement policies with reference to this base-line that does not employzebroids.
One may assume a cold start phase, where initially only one or few copies of every data item exist in the system. Manystorage slots of the cars may be unoccupied. When the cars encounter one another they construct new replicas of someselected data items to occupy the empty slots. The selection procedure may be to choose the data items uniformlyat random. New replicas are created as long as a car has a certain threshold of its storage unoccupied. Eventually,majority of the storage capacity of a car will be exhausted.
4.2 Carrier-based Replacement policies
The replacement policies considered in this paper are reactive since a replacement occurs only in response to a requestissued for a certain data item. When the local storage of a zebroid is completely occupied, it needs to replace oneof its existing items to carry the client requested data item. For this purpose, the zebroid must select an appropriatecandidate for eviction. This decision process is analogous to that encountered in operating system paging where thegoal is to maximize the cache hit ratio to prevent disk access delay [32]. We present below a list of carrier-basedreplacement policies employed in our study which are adapted from different page replacement policies.
6

1. Least recently used (LRU)LRU-K [25] maintains a sliding window containing the time stamps of theKth
most recent references to data items. During eviction, the data item whoseKth most recent reference is furthestin the past is evicted. Here, we consider the case withK = 1. Depending on whether the evictions are basedon the least recently used data item across all client requests (lru-global ) or only the individual client’s requests(lru-local ), we consider global or local variants of the LRU policy.
2. Least frequently used (LFU) (a) Local (lfu-local): Each AutoMata keeps track of the least frequently useddata item within its local repository. During eviction3, this is the candidate replica that is replaced. (b)Global(lfu-global): The dispatcher maintains the frequency of access to the data items based on requests from allclients. When a zebroid contacts the dispatcher for a victim data item, the dispatcher chooses the data item withthe lowest frequency of access.
3. Random policy (random) In this case, the chosen zebroid evicts a data item replica from its local storagechosen uniformly at random.
The replacement policies incur the following overheads. First, the complexity associated with the implementation ofa policy. Second, the bandwidth used to transfer a copy of a data item from a server to the zebroid. Third, the averagenumber of replacements incurred by the zebroids. Note that in the no-zebroids case neither overhead is incurred.
The metrics considered in this study are aggregate availability latency,δagg, percentage improvement inδagg withzebroids as compared to the no-zebroids case and average number of replacements incurred per client request whichis an indicator of the overhead incurred by zebroids.
Note that the dispatchers with the help of the control plane may ensure that no data item is lost from the system. Inother words, at least one replica of every data item is maintained in the ad-hoc network at all times. In such cases,even though a car may meet a requesting client earlier than other servers, if its local storage contains data items withonly a single copy in the system, then such a car is not chosen as a zebroid.
5 Analysis Methodology
Here, we present the analytical evaluation methodology and some approximations as closed-form equations that cap-ture the improvements in availability latency that can be obtained with both one-instantaneous and z-relay zebroids.First, we present some preliminaries of our analysis methodology.
• Let N be the number of cars in the network performing a 2D random walk on a√
G×√G torus. An additionalcar serves as a client yielding a total ofN + 1 cars. Such a mobility model has been used widely in theliterature [31, 29] chiefly because it is amenable to analysis and provides a baseline against which performanceof other mobility models can be compared. Moreover, this class of Markovian mobility models has been usedto model the movements of vehicles [3, 27, 36].
• We assume that all cars start from the stationary distribution and perform independent random walks. Althoughfor sparse density scenarios, the independence assumption does hold, it is no longer valid whenN approachesG.
• Let the size of data item repository of interest beT . Also, data itemi hasri replicas. This impliesri cars,identified as servers, have a copy of this data item when the client requests itemi.
All analysis results presented in this section are obtained assuming that the client is willing to wait as long as it takesfor its request to be satisfied (unbounded trip durationγ = ∞). With the random walk mobility model on a 2D-torus,
3The terms eviction and replacement are used interchangeably.
7
there is a guarantee that as long as there is at least one replica of the requested data item in the network, the client willeventually encounter this replica [2]. Later, we extend our analysis to consider finite trip durationγ.
Consider a scenario where no zebroids are employed. In this case, the expected availability latency for the data itemis the expected meeting time of the random walk undertaken by the client with any of the random walks performed bythe servers. Aldouset al. [2] show that the the meeting time of two random walks in such a setting can be modelledas an exponential distribution with the meanC = c ·G · log G, where the constantc ' 0.17 for G ≥ 25. The meetingtime, or equivalently the availability latencyδi, for the client requesting data itemi is the time till it encounters any oftheseri replicas for the first time. This is also an exponential distribution with the following expected value (note thatthis formulation is valid only for sparse cases whenG >> ri): δi = cGlogG
ri
The aggregate availability latency without employing zebroids is then this expression averaged over all data items,weighted by their frequency of access:
δagg(no− zeb) =T∑
i=1
fi · c ·G · log G
ri=
T∑
i=1
fi · Cri
(2)
5.1 One-instantaneous zebroids
Recall that with one-instantaneous zebroids, for a given request, a new replica is created on a car in the vicinity of theserver, provided this car meets the client earlier than any of theri servers. Moreover, this replica is spawned at thetime step when the client issues the request. LetN c
i be the expected total number of nodes that are in the same cell asany of theri servers. Then, we have
N ci = (N − ri) · (1− (1− 1
G)ri) (3)
In the analytical model, we assume thatN ci new replicas are created, so that the total number of replicas is increased
to ri + N ci . The availability latency is reduced since the client is more likely to meet a replica earlier. The aggregated
expected availability latency in the case of one-instantaneous zebroids is then given by,
δagg(zeb) =T∑
i=1
fi · c ·G · log G
ri + N ci
=T∑
i=1
fi · Cri + N c
i
(4)
Note that in obtaining this expression, for ease of analysis, we have assumed that the new replicas start from randomlocations in the torus (not necessarily from the same cell as the originalri servers). It thus treats all theN c
i carriersindependently, just like theri original servers. As we shall show below by comparison with simulations, this approx-imation provides an upper-bound on the improvements that can be obtained because it results in a lower expectedlatency at the client.
It should be noted that the procedure listed above will yield a similar latency to that employed by a dispatcher employ-ing one-instantaneous zebroids (see Section4.1). Since the dispatcher is aware of all future car movements it wouldonly transfer the requested data item on a single zebroid, if it determines that the zebroid will meet the client earlierthan any other server. This selected zebroid is included in theN c
i new replicas.
5.2 z-relay zebroids
The expected availability latency with z-relay zebroids can be calculated using a coloring problem analog similar to anapproach used by Spyropouloset al. [31]. Consider a data itemi requested by the client. Recall that, there areN total
8
cars andri replicas for data itemi. Assume that each of theseri replicas is colored red, while the other cars includingthe client are colored blue. Whenever a red car encounters a blue car, the latter is colored red.
The expected number of steps until the client is colored red then gives the average availability latency with z-relayzebroids. If at a given step, there arek red cars (k ≥ ri), then there will beN − k blue cars. Recall that meeting timebetween cars can be modelled as an exponential distribution. Hence, by the property of exponential distribution, theaverage time until any of thek red cars meets any of theN + 1 − k blue cars is C
k·(N+1−k) . Now, the expected time
until all the cars are colored red is∑N
k=ri
Ck·(N+1−k)
Note that the client may be colored red in any one of these steps with equal probability. Consequently, the expectedtime till the client is colored red is given by,
δi =C
N + 1− ri
N∑m=ri
m∑
k=ri
1k · (N + 1− k)
(5)
Evaluating the above expression, we get,
δi =C
N + 1· 1N + 1− ri
· [N · logN
ri− log (N + 1− ri)] (6)
Now, the aggregate availability latency (δagg) with z-relay zebroids is obtained by definition,
δagg(zeb) =T∑
i=1
[fi · C
N + 1· 1N + 1− ri
·
(N · logN
ri− log (N + 1− ri)) ] (7)
6 Simulation Methodology
The simulation environment considered in this study comprises of vehicles such as cars that carry a fraction of thedata item repository. A prediction accuracy parameter inherently provides a certain probabilistic guarantee on theconfidence of the car route predictions known at the dispatcher. A value of100% implies that the exact routes ofall cars are known at all times. A70% value for this parameter indicates that the routes predicted for the cars willmatch the actual ones with probability0.7. Note that this probability is spread across the car routes for the entire tripduration. We now provide the preliminaries of the simulation study and then describe the parameter settings used inour experiments.
• Similar to the analysis methodology, the map used is a 2D torus. A Markov mobility model representing aunbiased 2D random walk on the surface of the torus describes the movement of the cars across this torus.
• Each grid/cell is a unique state of this Markov chain. In each time slot, every car makes a transition from a cellto any of its neighboring8 cells. The transition is a function of the current location of the car and a probabilitytransition matrixQ = [qij ] whereqij is the probability of transition from statei to statej. Only AutoMataequipped cars within the same cell may communicate with each other.
• The parametersγ, δ have been discretized and expressed in terms of the number of time slots.
9
• A AutoMata device does not maintain more than one replica of a data item. This is because additional replicasoccupy storage without providing benefits.
• Either one-instantaneous or z-relay zebroids may be employed per client request for latency improvement.
• Unless otherwise mentioned, the prediction accuracy parameter is assumed to be100%. This is because thisstudy aims to quantify the effect of a large number of parameters individually on availability latency.
Here, we set the size of every data item,Si, to be1. α represents the number of storage slots per AutoMata. Eachstorage slot stores one data item.γ represents the duration of the client’s journey in terms of the number of time slots.Hence the possible values of availability latency are between0 andγ. δ is defined as the number of time slots afterwhich a client AutoMata device will encounter a replica of the data item for the first time. If a replica for the data itemrequested was encountered by the client in the first cell then we setδ = 0. If δ > γ then we setδ = γ indicating thatno copy of the requested data item was encountered by the client during its entire journey. In all our simulations, forillustration we consider a5× 5 2D-torus withγ set to10. Our experiments indicate that the trends in the results scaleto maps of larger size.
We simulated a skewed distribution of access to theT data items that obeys Zipf’s law with a mean of0.27. Thisdistribution is shown to correspond to sale of movie theater tickets in the United States [7]. We employ a replicationscheme that allocates replicas for a data item as a function of the square-root of the frequency of access of thatitem. The square-root replication scheme is shown to have competitive latency performance over a large parameterspace [10]. The data item replicas are distributed uniformly across the AutoMata devices. This serves as the base-lineno-zebroids case. The square-root scheme also provides the initial replica distribution when zebroids are employed.Note that the replacements performed by the zebroids will cause changes to the data item replica distribution. Requestsgenerated as per the Zipf distribution are issued one at a time. The client car that issues the request is chosen in around-robin manner. After a maximum period ofγ, the latency encountered by this request is recorded.
Initially, all cars are distributed across the map as per the steady-state distribution governed byQ. This initial place-ment of cars across the map is determined by a random number generator initialized with a seed. All results presentedin this section are averages over 10 such seeds each invoking 20,000 requests. Hence, each point in all the presentedresults is an average of 200,000 requests.
The95% confidence intervals are determined for all sets of results. These intervals are quite tight for the metrics of la-tency and replacement overhead, hence, we only present them for the metric that captures the percentage improvementin latency with respect to the no-zebroids case.
7 Results
In this section, we describe our evaluation results where the following key questions are addressed. With a wide choiceof replacement schemes available for a zebroid, what is their effect on availability latency? A more central questionmay be: Do zebroids provide significant improvements in availability latency? What is the associated overheadincurred in employing these zebroids? What happens to these improvements in scenarios where a dispatcher mayhave imperfect information about the car routes? What inherent trade-offs exist between car density and storage percar with regards to their combined as well as individual effect on availability latency in the presence of zebroids? Wepresent both simple analysis and detailed simulations to provide answers to these questions as well as gain insightsinto design of carrier-based systems.
7.1 How does a replacement scheme employed by a zebroid impact availability latency?
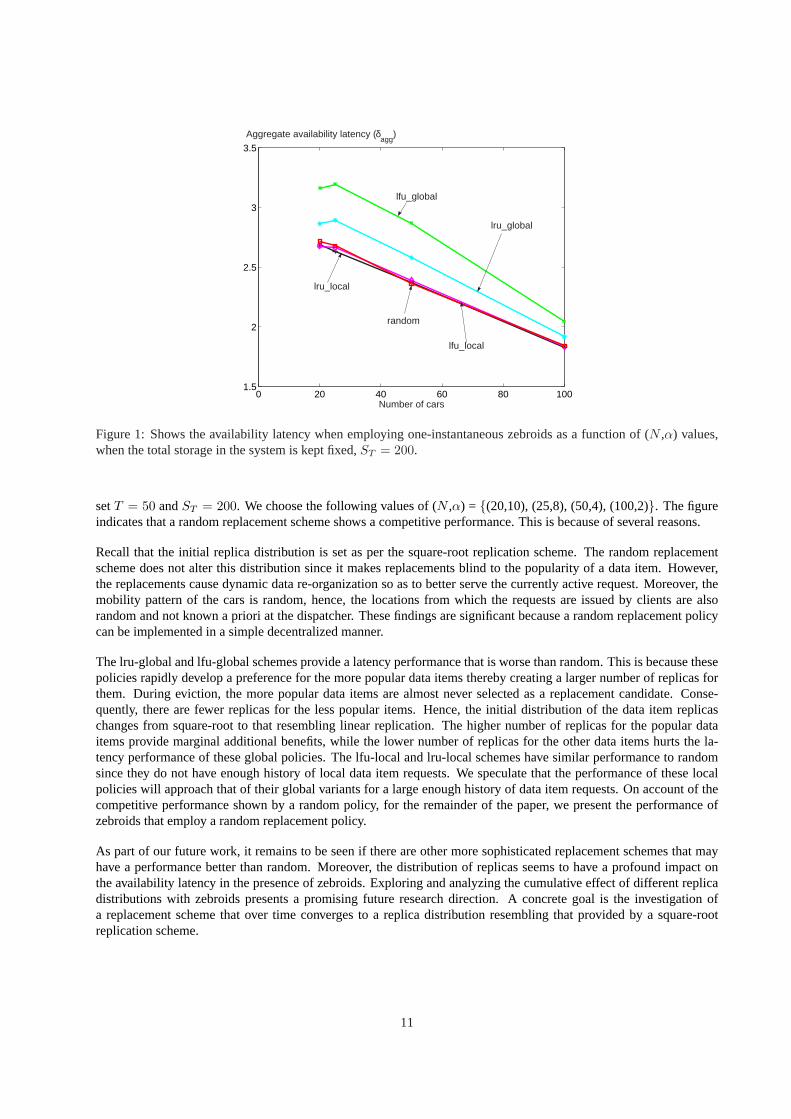
For illustration, we present ‘scale-up’ experiments where one-instantaneous zebroids are employed (see Figure1). Byscale-up, we mean thatα andN are changed proportionally to keep the total system storage,ST , constant. Here, we
10
0 20 40 60 80 1001.5
2
2.5
3
3.5
Number of cars
Aggregate availability latency (δagg
)
lru_global
lfu_global
lru_local
lfu_local
random
Figure 1:Shows the availability latency when employing one-instantaneous zebroids as a function of (N ,α) values,when the total storage in the system is kept fixed,ST = 200.
setT = 50 andST = 200. We choose the following values of (N ,α) = {(20,10), (25,8), (50,4), (100,2)}. The figureindicates that a random replacement scheme shows a competitive performance. This is because of several reasons.
Recall that the initial replica distribution is set as per the square-root replication scheme. The random replacementscheme does not alter this distribution since it makes replacements blind to the popularity of a data item. However,the replacements cause dynamic data re-organization so as to better serve the currently active request. Moreover, themobility pattern of the cars is random, hence, the locations from which the requests are issued by clients are alsorandom and not known a priori at the dispatcher. These findings are significant because a random replacement policycan be implemented in a simple decentralized manner.
The lru-global and lfu-global schemes provide a latency performance that is worse than random. This is because thesepolicies rapidly develop a preference for the more popular data items thereby creating a larger number of replicas forthem. During eviction, the more popular data items are almost never selected as a replacement candidate. Conse-quently, there are fewer replicas for the less popular items. Hence, the initial distribution of the data item replicaschanges from square-root to that resembling linear replication. The higher number of replicas for the popular dataitems provide marginal additional benefits, while the lower number of replicas for the other data items hurts the la-tency performance of these global policies. The lfu-local and lru-local schemes have similar performance to randomsince they do not have enough history of local data item requests. We speculate that the performance of these localpolicies will approach that of their global variants for a large enough history of data item requests. On account of thecompetitive performance shown by a random policy, for the remainder of the paper, we present the performance ofzebroids that employ a random replacement policy.
As part of our future work, it remains to be seen if there are other more sophisticated replacement schemes that mayhave a performance better than random. Moreover, the distribution of replicas seems to have a profound impact onthe availability latency in the presence of zebroids. Exploring and analyzing the cumulative effect of different replicadistributions with zebroids presents a promising future research direction. A concrete goal is the investigation ofa replacement scheme that over time converges to a replica distribution resembling that provided by a square-rootreplication scheme.
11

101
102
103
10−1
100
101
102
Number of cars
no−zebroidsanal
no−zebroidssim
one−instantaneousanal
one−instantaneoussim
Aggregate Availability latency (δagg
)
101
102
103
0
10
20
30
40
50
60
70
80
90
100
Number of cars
% Improvement in δagg
wrt no−zebroids (ω)
analytical upper−bound
simulation
2.a)δagg 2.b) ω
Figure 2: Shows the latency performance with one-instantaneous zebroids via simulations along with the analyticalapproximation for a10× 10 torus withT = 10.
7.2 Do zebroids provide significant improvements in availability latency?
We find that in many scenarios employing zebroids provides substantial improvements in availability latency.
7.2.1 Analysis
We first consider the case of one-instantaneous zebroids. Figure2.a shows the variation inδagg as a function ofN forT = 10 andα = 1 with a10× 10 torus using Equation4. Both the x and y axes are drawn to a log-scale. Figure2.bshow the % improvement inδagg obtained with one-instantaneous zebroids. In this case, only the x-axis is drawn to alog-scale. For illustration, we assume that theT data items are requested uniformly.
Initially, when the network is sparse the analytical approximation for improvements in latency with zebroids, obtainedfrom Equations2 and4, closely matches the simulation results. However, asN increases, the sparseness assumptionfor which the analysis is valid, namelyN << G, is no longer true. Hence, the two curves rapidly diverge. The pointat which the two curves move away from each other corresponds to a value ofδagg ≤ 1. Moreover, as mentionedearlier, the analysis provides an upper bound on the latency improvements, as it treats the newly created replicas givenby N c
i independently. However, theseN ci replicas start from the same cell as one of the server replicasri. Finally,
the analysis captures a one-shot scenario where given an initial data item replica distribution, the availability latencyis computed. The new replicas created do not affect future requests from the client.
Next, we consider the case where z-relay zebroids are employed (see Figure3). Similar observations, like the one-instantaneous zebroid case, apply since the simulation and analysis curves again start diverging when the analysisassumptions are no longer valid. However, the key observation is that the latency improvement with z-relay zebroidsis significantly better than the one-instantaneous zebroids case, especially for lower storage scenarios. This is becausein sparse scenarios, the transitive hand-offs between the zebroids creates higher number of replicas for the requesteddata item, yielding lower availability latency. Moreover, it is also seen that the simulation validation curve for theimprovements inδagg with z-relay zebroids approaches that of the one-instantaneous zebroid case for higher storage(higherN values). This is because one-instantaneous zebroids are a special case of z-relay zebroids.
12

101
102
103
10−1
100
101
102
Number of cars
no−zebroidssim
no−zebroidsanal
z−relayssim
z−relaysanal
Aggregate availability latency (δagg
)
101
102
103
0
10
20
30
40
50
60
70
80
90
100
Number of cars
analytical upper−bound
simulation
% Improvement in δagg
wrt no−zebroids (ω)
3.a)δagg 3.b) ω
Figure 3:Shows the latency performance with z-relay zebroids via analysis and simulations for a10 × 10 torus withT = 10.
7.2.2 Simulation
We conduct simulations to examine the entire storage spectrum obtained by changing car densityN or storage percarα in order to also capture scenarios where the sparseness assumptions for which the analysis is valid do not hold.We separate the effect ofN andα by capturing the variation ofN while keepingα constant (case 1) and vice-versa(case 2) both with z-relay and one-instantaneous zebroids. Here, we set the repository size asT = 25. Figure4and5 respectively capture the two cases mentioned above. With Figure4.b, keepingα constant, initially increasingcar density has higher latency benefits because increasingN introduces more zebroids in the system. AsN is furtherincreased,ω reduces because the total storage in the system goes up. Consequently, the number of replicas per dataitem goes up thereby increasing the number of servers. Hence, the replacement policy cannot find a zebroid as often totransport the requested data item to the client earlier than any of the servers. On the other hand, the increased numberof servers benefits the no-zebroids case in bringingδagg down. The net effect results in reduction inω for larger valuesof N . Similar trends are seen by keepingN constant and increasingα (see Figure5.b).
The trends mentioned above are similar to that obtained from the analysis. However, somewhat counter-intuitivelywith relatively higher system storage, z-relay zebroids provide slightly lower improvements in latency as compared toone-instantaneous zebroids. We speculate that this is due to the different data item replica distributions enforced bythem. Note that replacements performed by the zebroids cause fluctuations in these replica distributions which mayeffect future client requests. We are currently exploring suitable choices of parameters that can capture these changingreplica distributions.
7.3 What is the overhead/cost associated with achieving improvements in latency with ze-broids?
We find that the improvements in latency with zebroids are obtained at a minimal replacement overhead (< 1 perclient request).
13

0 50 100 150 200 250 300 350 4000
1
2
3
4
5
6
Number of cars
Aggregate availability latency (δagg
)
no−zebroids
one−instantaneous
z−relays
0 50 100 150 200 250 300 350 4000
10
20
30
40
50
60
Number of cars
% Improvement in δagg
wrt no−zebroids (ω)
one−instantaneous
z−relays
4.a 4.b
Figure 4:Depicts the latency performance with both one-instantaneous and z-relay zebroids as a function of the cardensity whenα = 2 andT = 25.
7.3.1 Analysis
With one-instantaneous zebroids, for each client request a maximum of one zebroid is employed for latency improve-ment. Hence, the replacement overhead per client request can amount to a maximum of one. Recall that to calculatethe latency with one-instantaneous zebroids,N c
i new replicas are created in the same cell as the servers. Now areplacement is only incurred if one of theseN c
i newly created replicas meets the client earlier than any of theri
servers.
Let Xri andXNci
respectively be random variables that capture the minimum time till any of theri andN ci replicas
meet the client. SinceXri andXNci
are assumed to be independent, by the property of exponentially distributedrandom variables we have,
Overhead/request = 1 · P (XNci
< Xri) + 0 · P (Xri ≤ XNci) (8)
Overhead/request =ri
C
ri
C + Nci
C
=ri
ri + N ci
(9)
Recall that the number of replicas for data itemi, ri, is a function of the total storage in the system i.e.,ri = k ·N · αwherek satisfies the constraint1 ≤ ri ≤ N . Using this along with Equation2, we get
Overhead/request = 1− G
G + N · (1− k · α)(10)
Now if we keep the total system storageN · α constant sinceG andT are also constant, increasingN increases thereplacement overhead. However, ifN · α is constant then increasingN causesα to go down. This implies that ahigher replacement overhead is incurred for higherN and lowerα values. Moreover, whenri = N , this means that
14
0 2 4 6 8 100
1
2
3
4
5
6
Storage per car
no−zebroids
one−instantaneous
z−relays
Aggregate availability latency (δagg
)
0 2 4 6 8 100
10
20
30
40
50
60
Storage per car
% Improvement in δagg
wrt no−zebroids (ω)
one−instantaneous
z−relays
5.a 5.b
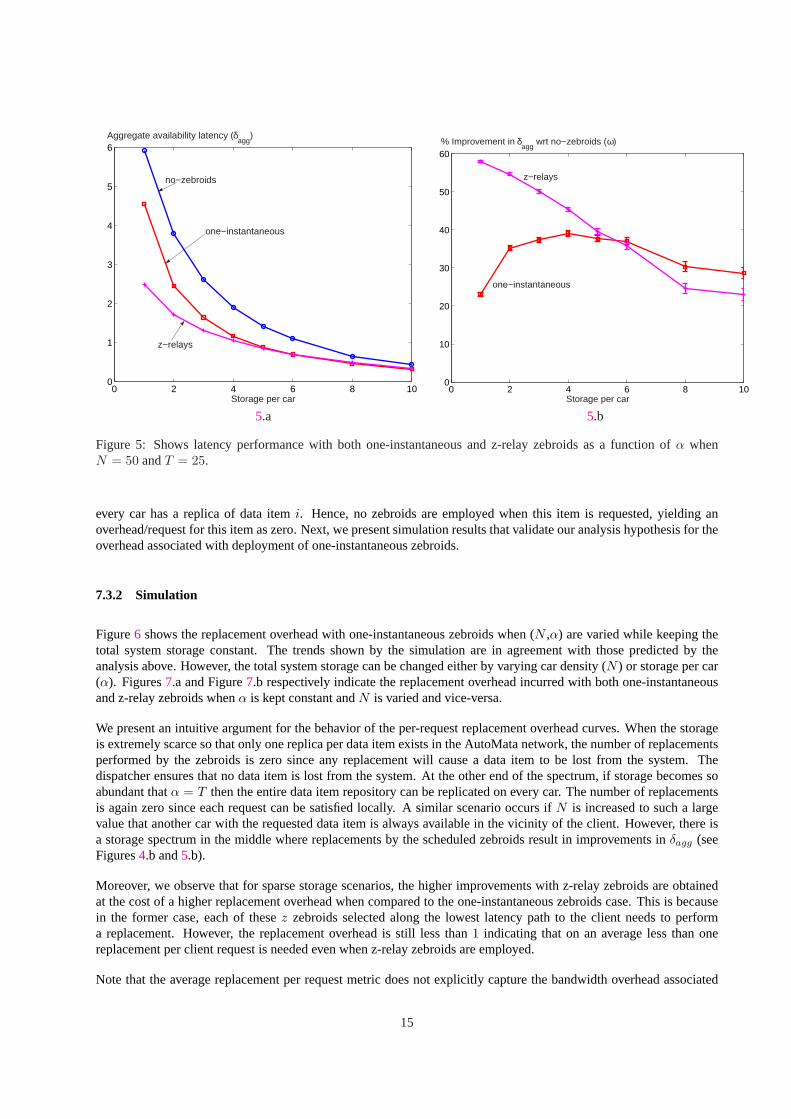
Figure 5: Shows latency performance with both one-instantaneous and z-relay zebroids as a function ofα whenN = 50 andT = 25.
every car has a replica of data itemi. Hence, no zebroids are employed when this item is requested, yielding anoverhead/request for this item as zero. Next, we present simulation results that validate our analysis hypothesis for theoverhead associated with deployment of one-instantaneous zebroids.
7.3.2 Simulation
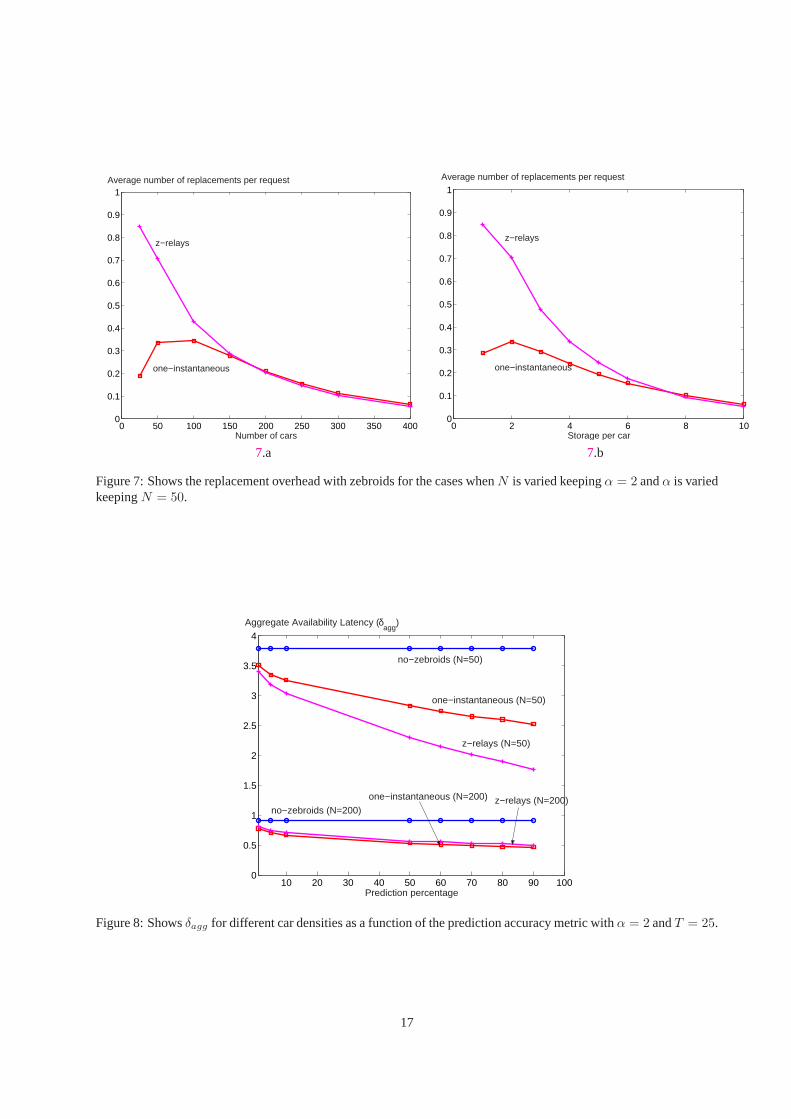
Figure6 shows the replacement overhead with one-instantaneous zebroids when (N ,α) are varied while keeping thetotal system storage constant. The trends shown by the simulation are in agreement with those predicted by theanalysis above. However, the total system storage can be changed either by varying car density (N ) or storage per car(α). Figures7.a and Figure7.b respectively indicate the replacement overhead incurred with both one-instantaneousand z-relay zebroids whenα is kept constant andN is varied and vice-versa.
We present an intuitive argument for the behavior of the per-request replacement overhead curves. When the storageis extremely scarce so that only one replica per data item exists in the AutoMata network, the number of replacementsperformed by the zebroids is zero since any replacement will cause a data item to be lost from the system. Thedispatcher ensures that no data item is lost from the system. At the other end of the spectrum, if storage becomes soabundant thatα = T then the entire data item repository can be replicated on every car. The number of replacementsis again zero since each request can be satisfied locally. A similar scenario occurs ifN is increased to such a largevalue that another car with the requested data item is always available in the vicinity of the client. However, there isa storage spectrum in the middle where replacements by the scheduled zebroids result in improvements inδagg (seeFigures4.b and5.b).
Moreover, we observe that for sparse storage scenarios, the higher improvements with z-relay zebroids are obtainedat the cost of a higher replacement overhead when compared to the one-instantaneous zebroids case. This is becausein the former case, each of thesez zebroids selected along the lowest latency path to the client needs to performa replacement. However, the replacement overhead is still less than1 indicating that on an average less than onereplacement per client request is needed even when z-relay zebroids are employed.
Note that the average replacement per request metric does not explicitly capture the bandwidth overhead associated
15

0 20 40 60 80 1000
0.05
0.1
0.15
0.2
0.25
0.3
0.35
0.4
0.45
0.5
Number of cars
one−instantaneous zebroids
Average number of replacements per request
(N=20,α=10)
(N=25,α=8)
(N=50,α=4)
(N=100,α=2)
Figure 6:Captures replacement overhead when employing one-instantaneous zebroids as a function of (N ,α) values,when the total storage in the system is kept fixed,ST = 200.
with the transfer of items to the zebroids. This bandwidth overhead may be significant in the case of multiple simulta-neous active requests. We intend to explicitly incorporate these bandwidth considerations in our model as part of ourfuture research.
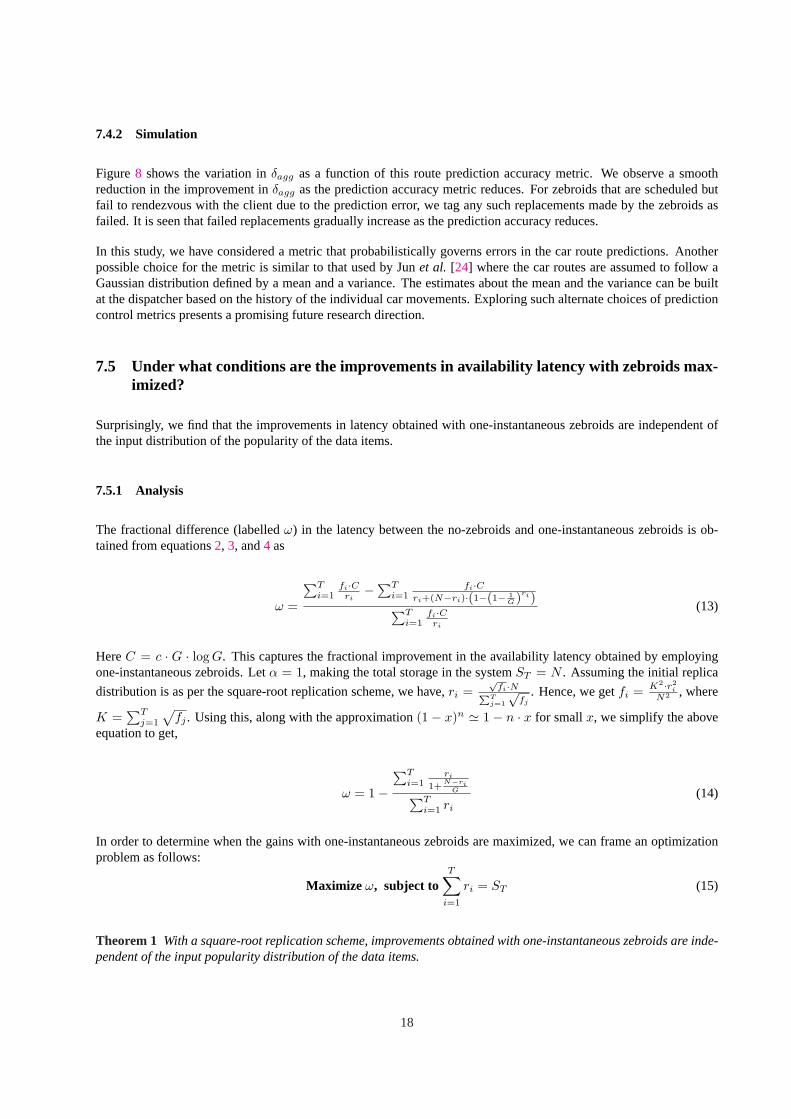
7.4 What happens to the availability latency with zebroids in more practical scenarios withinaccuracies in the car route predictions?
We find that zebroids continue to provide improvements in availability latency even with lower accuracy in the carroute predictions. We use a single parameterp to quantify the accuracy of the car route predictions. This parameterinherently provides a certain probabilistic guarantee on the confidence of the car route predictions for the entire tripduration.
7.4.1 Analysis
Sincep represents the probability that a car route predicted by the dispatcher matches the actual one, hence, the latencywith zebroids can be approximated by,
δerragg = p · δagg(zeb) + (1− p) · δagg(no− zeb) (11)
δerragg = p · δagg(zeb) + (1− p) · C
ri(12)
Expressions forδagg(zeb) can be obtained from Equations4 (one-instantaneous) or7 (z-relay zebroids).
16
0 50 100 150 200 250 300 350 4000
0.1
0.2
0.3
0.4
0.5
0.6
0.7
0.8
0.9
1
Number of cars
z−relays
one−instantaneous
Average number of replacements per request
0 2 4 6 8 100
0.1
0.2
0.3
0.4
0.5
0.6
0.7
0.8
0.9
1
Storage per car
Average number of replacements per request
z−relays
one−instantaneous
7.a 7.b
Figure 7:Shows the replacement overhead with zebroids for the cases whenN is varied keepingα = 2 andα is variedkeepingN = 50.
10 20 30 40 50 60 70 80 90 1000
0.5
1
1.5
2
2.5
3
3.5
4
Prediction percentage
no−zebroids (N=50)
one−instantaneous (N=50)
z−relays (N=50)
no−zebroids (N=200)
one−instantaneous (N=200) z−relays (N=200)
Aggregate Availability Latency (δagg
)
Figure 8:Showsδagg for different car densities as a function of the prediction accuracy metric withα = 2 andT = 25.
17
7.4.2 Simulation
Figure8 shows the variation inδagg as a function of this route prediction accuracy metric. We observe a smoothreduction in the improvement inδagg as the prediction accuracy metric reduces. For zebroids that are scheduled butfail to rendezvous with the client due to the prediction error, we tag any such replacements made by the zebroids asfailed. It is seen that failed replacements gradually increase as the prediction accuracy reduces.
In this study, we have considered a metric that probabilistically governs errors in the car route predictions. Anotherpossible choice for the metric is similar to that used by Junet al. [24] where the car routes are assumed to follow aGaussian distribution defined by a mean and a variance. The estimates about the mean and the variance can be builtat the dispatcher based on the history of the individual car movements. Exploring such alternate choices of predictioncontrol metrics presents a promising future research direction.
7.5 Under what conditions are the improvements in availability latency with zebroids max-imized?
Surprisingly, we find that the improvements in latency obtained with one-instantaneous zebroids are independent ofthe input distribution of the popularity of the data items.
7.5.1 Analysis
The fractional difference (labelledω) in the latency between the no-zebroids and one-instantaneous zebroids is ob-tained from equations2, 3, and4 as
ω =
∑Ti=1
fi·Cri
−∑Ti=1
fi·Cri+(N−ri)·(1−(1− 1
G )ri)∑Ti=1
fi·Cri
(13)
HereC = c · G · log G. This captures the fractional improvement in the availability latency obtained by employingone-instantaneous zebroids. Letα = 1, making the total storage in the systemST = N . Assuming the initial replica
distribution is as per the square-root replication scheme, we have,ri =√
fi·NPTj=1
√fj
. Hence, we getfi = K2·r2i
N2 , where
K =∑T
j=1
√fj . Using this, along with the approximation(1− x)n ' 1− n · x for smallx, we simplify the above
equation to get,
ω = 1−∑T
i=1ri
1+N−ri
G∑Ti=1 ri
(14)
In order to determine when the gains with one-instantaneous zebroids are maximized, we can frame an optimizationproblem as follows:
Maximize ω, subject toT∑
i=1
ri = ST (15)
Theorem 1 With a square-root replication scheme, improvements obtained with one-instantaneous zebroids are inde-pendent of the input popularity distribution of the data items.
18
0 20 40 60 80 100
0
10
20
30
40
50
60
Number of cars
% Improvement in δagg
wrt no−zebroids (ω)
one−instantaneous zebroids
(N=20,α=10)
(N=25,α=8)
(N=50,α=4)
(N=100,α=2)
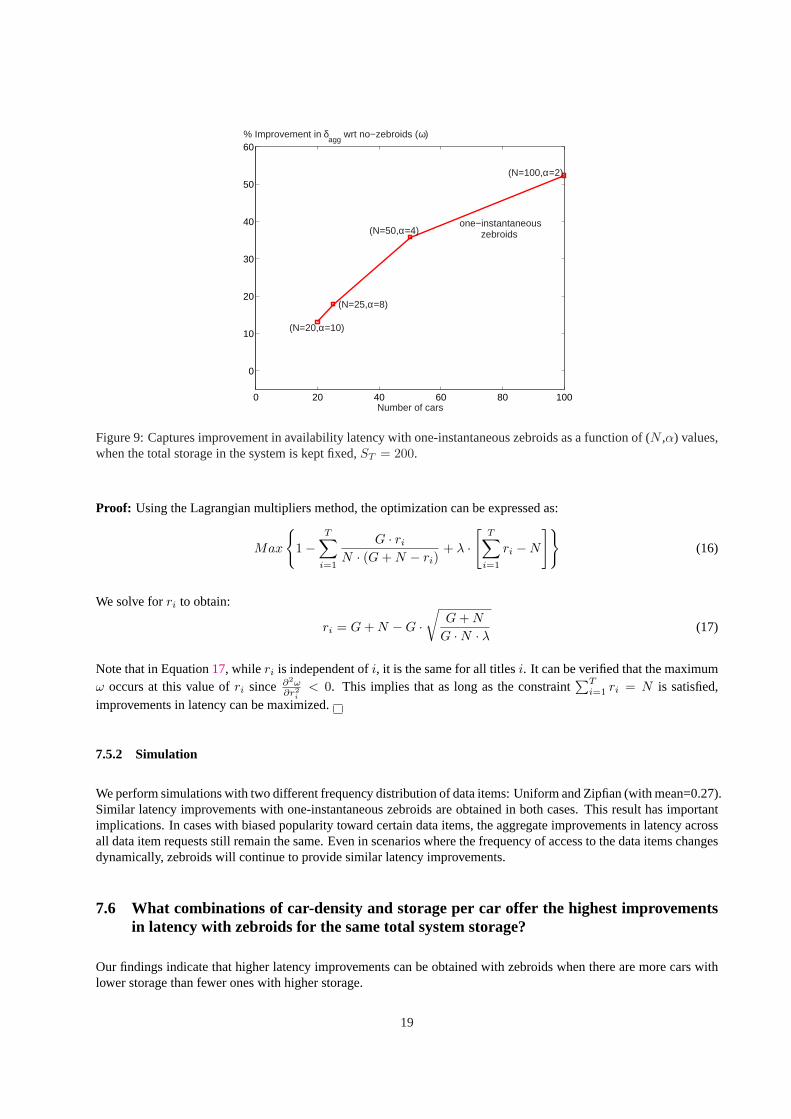
Figure 9:Captures improvement in availability latency with one-instantaneous zebroids as a function of (N ,α) values,when the total storage in the system is kept fixed,ST = 200.
Proof: Using the Lagrangian multipliers method, the optimization can be expressed as:
Max
{1−
T∑
i=1
G · ri
N · (G + N − ri)+ λ ·
[T∑
i=1
ri −N
]}(16)
We solve forri to obtain:
ri = G + N −G ·√
G + N
G ·N · λ (17)
Note that in Equation17, while ri is independent ofi, it is the same for all titlesi. It can be verified that the maximumω occurs at this value ofri since ∂2ω
∂r2i
< 0. This implies that as long as the constraint∑T
i=1 ri = N is satisfied,improvements in latency can be maximized.
7.5.2 Simulation
We perform simulations with two different frequency distribution of data items: Uniform and Zipfian (with mean=0.27).Similar latency improvements with one-instantaneous zebroids are obtained in both cases. This result has importantimplications. In cases with biased popularity toward certain data items, the aggregate improvements in latency acrossall data item requests still remain the same. Even in scenarios where the frequency of access to the data items changesdynamically, zebroids will continue to provide similar latency improvements.
7.6 What combinations of car-density and storage per car offer the highest improvementsin latency with zebroids for the same total system storage?
Our findings indicate that higher latency improvements can be obtained with zebroids when there are more cars withlower storage than fewer ones with higher storage.
19

7.6.1 Analysis
Consider the case of one-instantaneous zebroids. The fractional difference (labelledω) in δagg between the no-zebroidsand one-instantaneous zebroids cases is obtained in Equation13. Using the approximation(1 − x)n ' 1 − n · x forsmallx, we simplify the above equation to get,
ω = 1−∑T
i=1G·fi
ri·(G+N−ri)∑Ti=1
fi
ri
(18)
Recall that the number of replicas for data itemi, ri, is a function of the total storage in the system i.e.,ri = k ·N · αwherek has to satisfy the constraint that1 ≤ ri ≤ N . Given a total system storageN · α, we find that except forNall other terms in Equation18 are constant. Also, with increasingN , ω increases. However, for a constantN · α, ifN increases,α has to reduce. This indicates for a given system storage, higher improvements in latency with zebroidsare obtained with higher car density and lower storage per car.
7.6.2 Simulation
Figure9 validates the insight obtained from the analysis in that the improvements in latency go up with higherN andlowerα values whenN · α = 200. The increase inN increases the zebroid density enabling the dispatcher to almostalways find a zebroid that can deliver the requested data item to the client earlier than any of the potential servers. Thistrade-off between the two system parameters of number of cars and storage per car may have important implicationsin the design of carrier-based networks that improve availability latency.
Although we have assumed a constant storage per car for all cars, in practical scenarios, there may be variable storageper car. Part of the AutoMata device storage space may be reserved by a user for his preferred titles which the usermay not seek to erase/evict. These considerations may create a more heterogeneous environment with variable storageper car. In addition, zebroids may need to take into account user preferences prior to making these replacements.Incorporating all these considerations into the model is likely to pay richer dividends in estimating latency in realdeployments.
7.7 What is the impact of different trip durations and repository sizes on availability latencyin the presence of zebroids?
7.7.1 Analysis
In most practical scenarios, the client will wait for a maximum duration within which it expects its issued request tobe satisfied. Here, we consider the case where the client has a finite trip durationγ, similar to that considered in thesimulation environment (γ = 10). The availability latency,δi, can be any value between0 andγ − 1. If the client’srequest is not satisfied, we setδi = γ indicating that the client’s request for itemi was not satisfied.
Recall that latency in the case of a 2D-random walk on a torus can be modelled as an exponential distribution as:
P (δi > t) = λ · exp (−λ · t) (19)
whereλ = ri
c·G·log G . The average availability latency with finite trip durationγ is then given by,
20

0 20 40 60 80 1000
5
10
15
20
25
30
35
40
45
Replicas per data item
% Improvement in δagg
wrt no−zebroids (ω)
γ=5
γ=20
γ=10
0 20 40 60 80 1000
5
10
15
20
25
30
35
40
45
Replicas per data item
% Improvement in δagg
wrt no−zebroids (ω)
γ=5
γ=10
γ=20
10.a) Analysis 10.b) Simulation
Figure 10:Shows improvement inδagg with one-instantaneous zebroids for different client trip durations in case of10× 10 torus with a fixed car density,N = 100.
δi =∫ γ
0
x · λ · exp (−λ · t)dx +∫ ∞
γ
γ · λ · exp (−λ · t)dx (20)
Hence, we get
δi =c ·G · log G
ri· [1− exp (
−γ · ri
c ·G · log G)] (21)
The aggregate availability latency with finite trip duration is then given by,
δagg(no− zeb) =T∑
i=1
fi · c ·G · log G
ri· [1− exp (
−γ · ri
c ·G · log G)] (22)
In the presence of one-instantaneous zebroids, the aggregate availability latency can be obtained using a proceduresimilar to that used in Section5.1, giving
δagg(zeb) =T∑
i=1
fi · c ·G · log G
(ri + N ci )
· [1− exp (−γ · (ri + N c
i )c ·G · log G
)] (23)
The above equations yield the improvements in latency with finite trip duration. We consider a10 × 10 torus withN = 100 cars each with one storage slot (α = 1). The distribution of data item replicas is assumed to be uniform.Hence, as we increase the size of the data item repository (T ) the number of replicas per data item decreases. Specif-ically, the value ofT is varied as{1, 2, 4, 10, 20, 25, 50, 100}. Then, the number of replicas per data item changes as{100, 50, 25, 10, 5, 4, 2, 1}. Figure10.a and10.b capture the latency performance obtained via analysis and simula-tions respectively for different trip durations.
21
0 50 100 150 2000
10
20
30
40
50
60
70
Number of cars
% Improvement in δagg
wrt no−zebroids (ω)
T=5
T=10
T=20
T=25
T=50
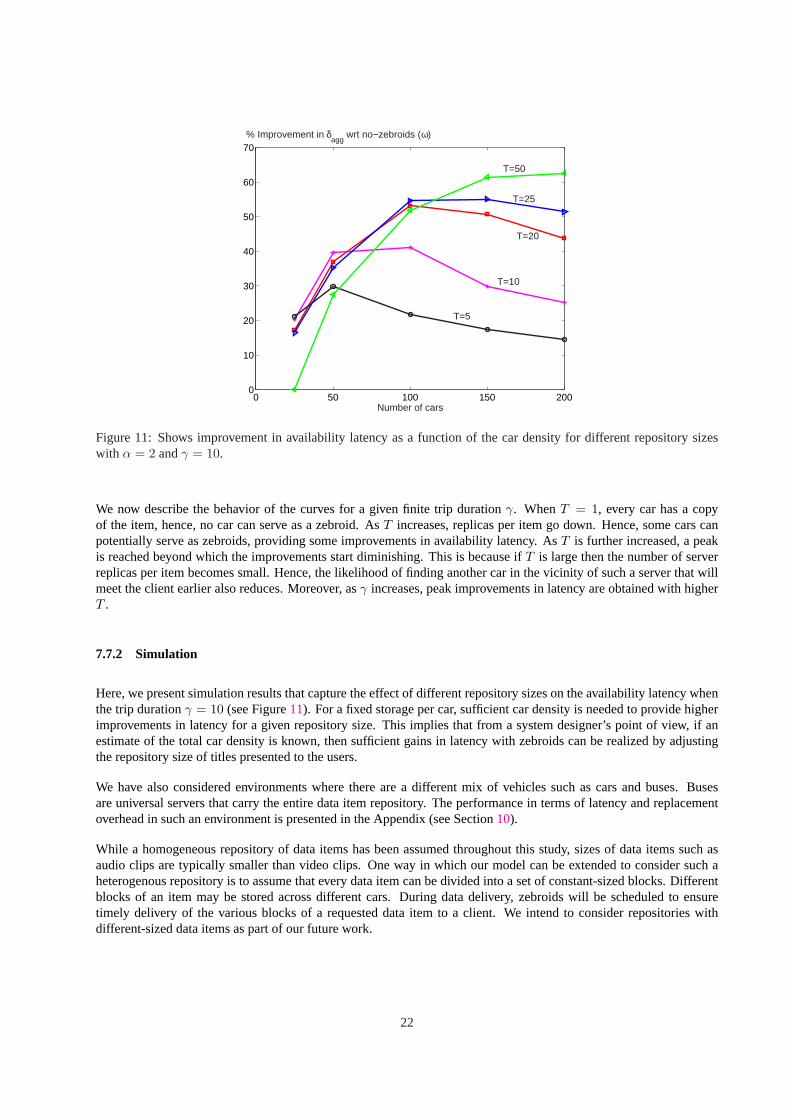
Figure 11:Shows improvement in availability latency as a function of the car density for different repository sizeswith α = 2 andγ = 10.
We now describe the behavior of the curves for a given finite trip durationγ. WhenT = 1, every car has a copyof the item, hence, no car can serve as a zebroid. AsT increases, replicas per item go down. Hence, some cars canpotentially serve as zebroids, providing some improvements in availability latency. AsT is further increased, a peakis reached beyond which the improvements start diminishing. This is because ifT is large then the number of serverreplicas per item becomes small. Hence, the likelihood of finding another car in the vicinity of such a server that willmeet the client earlier also reduces. Moreover, asγ increases, peak improvements in latency are obtained with higherT .
7.7.2 Simulation
Here, we present simulation results that capture the effect of different repository sizes on the availability latency whenthe trip durationγ = 10 (see Figure11). For a fixed storage per car, sufficient car density is needed to provide higherimprovements in latency for a given repository size. This implies that from a system designer’s point of view, if anestimate of the total car density is known, then sufficient gains in latency with zebroids can be realized by adjustingthe repository size of titles presented to the users.
We have also considered environments where there are a different mix of vehicles such as cars and buses. Busesare universal servers that carry the entire data item repository. The performance in terms of latency and replacementoverhead in such an environment is presented in the Appendix (see Section10).
While a homogeneous repository of data items has been assumed throughout this study, sizes of data items such asaudio clips are typically smaller than video clips. One way in which our model can be extended to consider such aheterogenous repository is to assume that every data item can be divided into a set of constant-sized blocks. Differentblocks of an item may be stored across different cars. During data delivery, zebroids will be scheduled to ensuretimely delivery of the various blocks of a requested data item to a client. We intend to consider repositories withdifferent-sized data items as part of our future work.
22

8 Conclusions andFuture Research Directions
In this study, we examined the improvements in latency that can be obtained in the presence of data carriers, termedzebroids, that deliver a data item from a server to a client. We quantified the variation in availability latency as afunction of a rich set of parameters such as car density, storage per car, title database size, and replacement policiesemployed by zebroids. Our key findings are as follows. A naive random replacement policy employed by the zebroidsexhibits competitive latency benefits at a minimal replacement overhead. Zebroids continue to provide improvementseven in the presence of lower accuracy in the predictions of the car routes. Improvements in latency obtained withone-instantaneous zebroids are independent of the input distribution of the popularity of the data items. Also, for agiven total system storage, presence of more cars with a low storage capacity yields higher improvements in latencywhen compared with fewer cars with a high storage capacity.
A contribution of this work is to identify a significant research direction for each question presented and discussed inSection7. Comprehensive analytical models that enable a study of the different factors for each question remain animportant future research topic. Below we summarize some key future research directions we intend to pursue. First,we are currently investigating the effect of different replica distributions on availability latency in the presence ofzebroids. Second, we intend to explore alternate definitions for the parameter that controls the prediction accuracy ofthe car routes known at the dispatcher. Third, to better reflect reality we would like to validate the observations obtainedfrom this study with some real world simulation traces of vehicular movements (for example using CORSIM [1]). Thiswill also serve as a validation for the utility of the Markov mobility model used in this study. We are currently analyzingthe performance of zebroids on a real world data set comprising of an ad-hoc network of buses moving around a smallneighborhood in Amherst [5].Fourth, we intend to include bandwidth constraints in our model so that it can be betterequipped for scenarios where multiple simultaneous requests are active in the system. Finally, zebroids may also beused for delivery of data items that carry delay sensitive information with a certain expiry. Extensions to zebroids thatsatisfy such application requirements presents an interesting future research direction.
9 Acknowledgments
This research was supported in part by NSF grants numbered CNS-0435505 (NeTS NOSS), CNS-0347621 (CA-REER), IIS-0307908 and an Annenberg fellowship.
References
[1] Federal Highway Administration. Corridor simulation (corsim/tsis). Version 5.1,http://www.ops.fhwa.dot.gov/trafficanalysistools/cors im.htm.
[2] D. Aldous and J. Fill. Reversible markov chains and random walks on graphs. Under preparation.
[3] A. Bar-Noy, I. Kessler, and M. Sidi. Mobile Users: To Update or Not to Update. InProc. IEEE Infocom, 1994.
[4] S. Bararia, S. Ghandeharizadeh, and S. Kapadia. Evaluation of 802.11a for streaming data in ad-hoc networks. InASWNBoston, MA, 2004.
[5] J. Burgess, B. Gallagher, D. Jensen, and B. Levine. MaxProp: Routing for Vehicle-Based Disruption-Tolerant Networking.In Proc. of IEEE Infocom, April 2006.
[6] E. Cohen and S. Shenker. Replication strategies in unstructured peer-to-peer networks.SIGCOMM Comput. Commun. Rev.,32(4):177–190, 2002.
[7] A. Dan, D. Dias, R. Mukherjee, D. Sitaram, and R. Tewari. Buffering and Caching in Large-Scale Video Servers. InProc. ofthe 40th IEEE Computer Society International Conference (COMPCON), 1995.
[8] S. Ghandeharizadeh and S. Kapadia. An Evaluation of Location-Demographic Replacement Policies for Zebroids. InIEEEConsumer Communications and Networking Conference (CCNC), 2006.
23

[9] S. Ghandeharizadeh, S. Kapadia, and B. Krishnamachari. PAVAN: A Policy Framework for Content Availabilty in VehicularAd-hoc Networks. InVANET, New York, NY, USA, 2004. ACM Press.
[10] S. Ghandeharizadeh, S. Kapadia, and B. Krishnamachari. Comparison of Replication Strategies for Content Availability inC2P2 networks. InProc. of 6th International Conference on Mobile Data Management (MDM), May 2005.
[11] S. Ghandeharizadeh and B. Krishnamachari. C2P2: A Peer-to-Peer Network for On-Demand Automobile Information Ser-vices. InFirst International Workshop on Grid and Peer-to-Peer Computin g Impacts on Large Scale Heterogeneous Distrib-uted Database Systems (Globe), 2004.
[12] T. Hara. Effective Replica Allocation in Ad Hoc Networks for Improving Data Accessibility. InProc. of IEEE Infocom, pages1568–1576, 2001.
[13] T. Hara. Cooperative caching by mobile clients in push-based information systems. InProc. of the eleventh internationalconference on Information and knowledge management (CIKM), 2002.
[14] T. Hara. Replica allocation in ad hoc networks with periodic data update. InProc. of the Third International Conference onMobile Data Management(MDM), pages 79–86, Washington, DC, USA, 2002. IEEE Computer Society.
[15] T. Hara. Replicating Data with Aperiodic Update in Ad Hoc Networks. InProc. of IASTED Int’l Conf. on Communications,Internet and Information Technology (CIIT), pages 242–247, 2002.
[16] T. Hara. Replica allocation methods in ad hoc networks with data update.ACM/Kluwer Journal on Mobile Networks andApplications (MONET), 8(4):343–354, 2003.
[17] T. Hara. Location management of data items in mobile ad hoc networks. InProc. of the 2005 ACM symposium on Appliedcomputing (SAC), pages 1174–1175, New York, NY, USA, 2005. ACM Press.
[18] T. Hara. Strategies for data location management in mobile ad hoc networks. InProc. of IEEE Int’l Conf. on Parallel andDistributed Systems (ICPADS), 2005.
[19] T. Hara and S. Madria. Dynamic data replication using aperiodic updates in mobile ad-hoc networks. InProc. of InternationalConference on Database Systems for Advanced Applications (DASFAA), pages pp.869–881, Jeju Island, Korea, 2004.
[20] T. Hara, N. Murakami, and S. Nishio. Replica allocation for correlated data items in ad hoc sensor networks.SIGMOD Rec.,33(1):38–43, 2004.
[21] T. Hara, Y.-H.Loh, and S.Nishio. Data Replication Methods Based on the Stability of Radio Links in Ad Hoc Networks. InProc. of International Workshop on Mobility in Databases and Distributed Systems (MDDS), pages 969–973, 2003.
[22] H. Hayashi, T. Hara, and S. Nishio. A Replica Allocation Method Adapting to Topology Changes in Ad Hoc Networks. InProc. of International Conference on Database and Expert Systems Applications (DEXA), 2005.
[23] P. Juang, H. Oki, Y. Wang, M. Martonosi, L. Peh, and D. Rubenstein. Energy-efficient computing for wildlife tracking: designtradeoffs and early experiences with zebranet.SIGARCH Comput. Archit. News, 2002.
[24] H. Jun, M. Ammar, and E. Zegura. Power Management in Delay Tolerant Networks: A Framework and Knowledge-BasedMechanisms. InProc. of IEEE SECON, September 2005.
[25] E. O’Neil, P. O’Neil, and G. Weikum. The lru-k page replacement algorithm for database disk buffering. InACM SIGMOD,pages 297–306, 1993.
[26] A. Pentland, R. Fletcher, and A. Hasson. DakNet: Rethinking Connectivity in Developing Nations.Computer, 37(1):78–83,2004.
[27] I. Rubin and C. Choi. Impact of the Location Area Structure on the Performance of Signaling Channels in Wireless CellularNetworks.IEEE Communications Magazine, pages 108–115, February 1997.
[28] F. Sailhan and V. Issarny. Cooperative caching in ad hoc networks. InProc. of 4th International Conference on Mobile DataManagement (MDM), 2003.
[29] R. Shah, S. Roy, S. Jain, and W. Brunette. Data mules: Modeling and analysis of a three-tier architecture for sparse sensornetworks.Elsevier Ad Hoc Networks Journal, 1, September 2003.
[30] T. Small and Z. J. Haas. The shared wireless infostation model: a new ad hoc networking paradigm (or where there is a whale,there is a way). InProc. of the 4th ACM international symposium on Mobile ad hoc networking and computing (MobiHoc),pages 233–244, New York, NY, USA, 2003. ACM Press.
[31] T. Spyropoulos, K. Psounis, and C. Raghavendra. Single-Copy Routing in Intermittently Connected Mobile Networks. InProc. of IEEE SECON, April 2004.
[32] A. Tanenbaum.Modern Operating Systems, 2nd Edition, Chapter 4, Section 4.4. Prentice Hall, 2001.
[33] A. Vahdat and D. Becker. Epidemic routing for partially-connected ad hoc networks. Technical report, Department ofComputer Science, Duke University, 2000.
24
0 5 10 15 200
0.5
1
1.5
2
2.5
3
3.5
4
4.5
5
Number of buses
no−zebroids
one−instantaneous
Aggregate Availability Latency (δagg
)
0 5 10 15 200
5
10
15
20
25
30
35
40
45
50
Number of buses
% Improvement in δagg
wrt no−zebroids (ω)
12.a 12.b
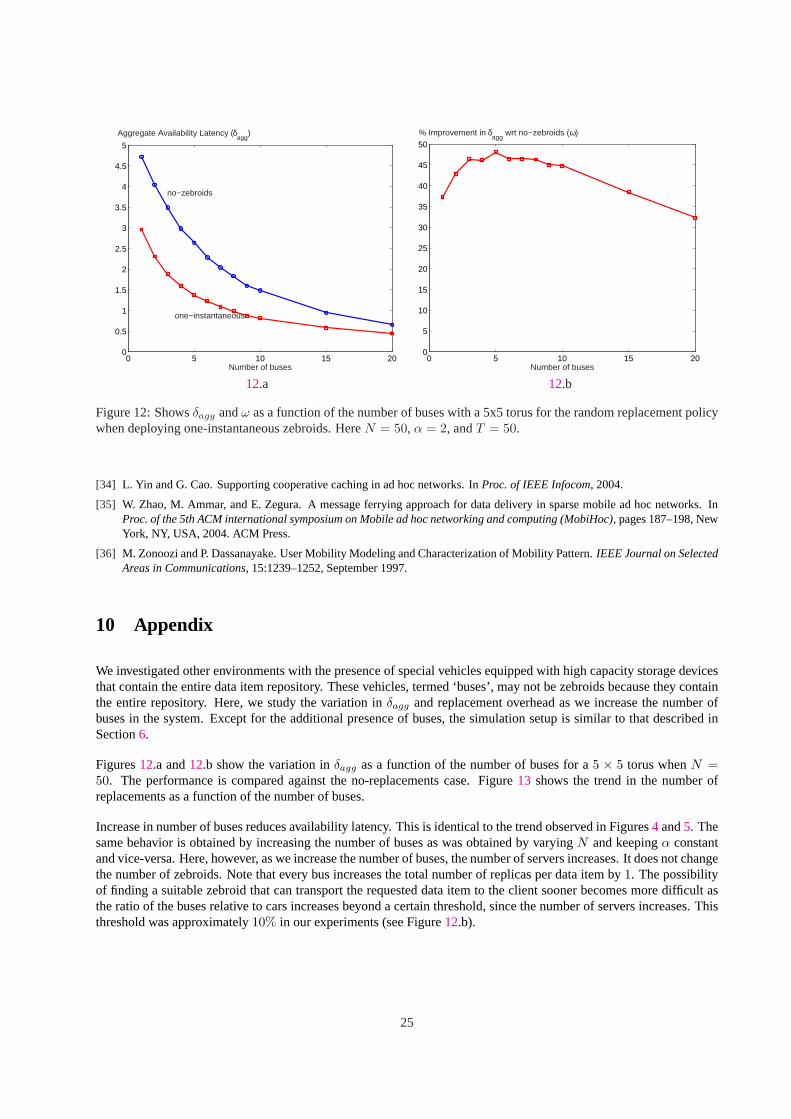
Figure 12:Showsδagg andω as a function of the number of buses with a 5x5 torus for the random replacement policywhen deploying one-instantaneous zebroids. HereN = 50, α = 2, andT = 50.
[34] L. Yin and G. Cao. Supporting cooperative caching in ad hoc networks. InProc. of IEEE Infocom, 2004.
[35] W. Zhao, M. Ammar, and E. Zegura. A message ferrying approach for data delivery in sparse mobile ad hoc networks. InProc. of the 5th ACM international symposium on Mobile ad hoc networking and computing (MobiHoc), pages 187–198, NewYork, NY, USA, 2004. ACM Press.
[36] M. Zonoozi and P. Dassanayake. User Mobility Modeling and Characterization of Mobility Pattern.IEEE Journal on SelectedAreas in Communications, 15:1239–1252, September 1997.
10 Appendix
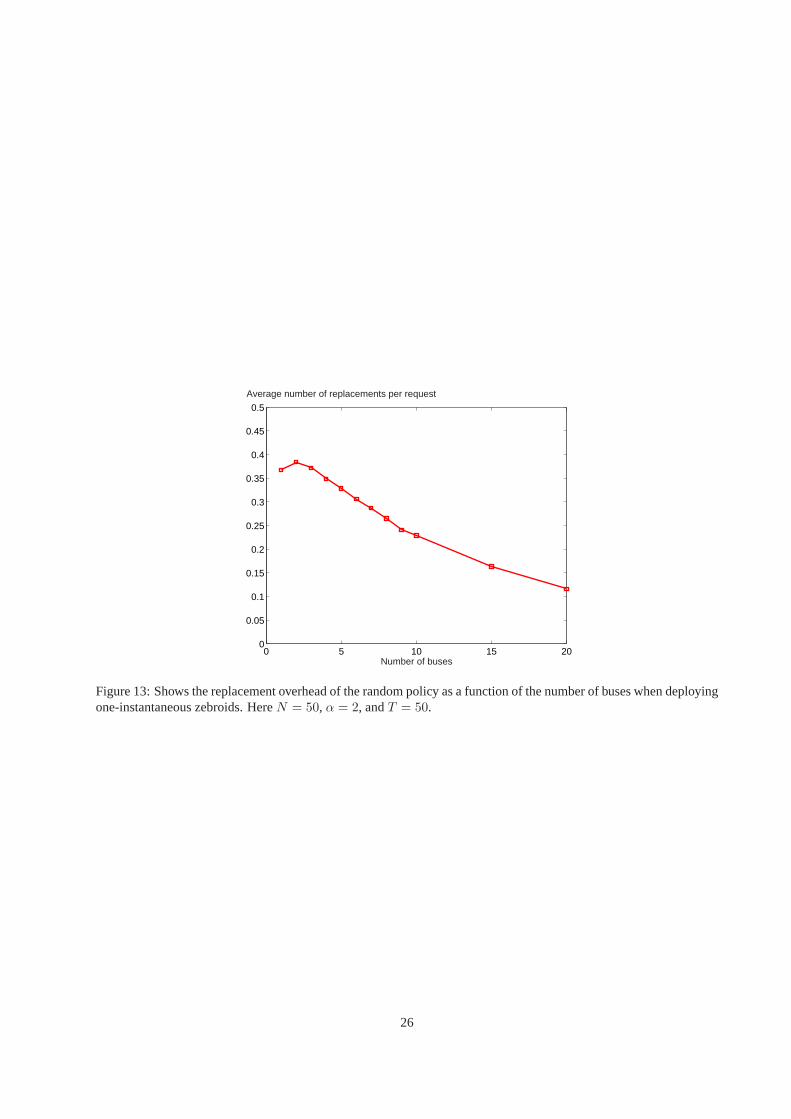
We investigated other environments with the presence of special vehicles equipped with high capacity storage devicesthat contain the entire data item repository. These vehicles, termed ‘buses’, may not be zebroids because they containthe entire repository. Here, we study the variation inδagg and replacement overhead as we increase the number ofbuses in the system. Except for the additional presence of buses, the simulation setup is similar to that described inSection6.
Figures12.a and12.b show the variation inδagg as a function of the number of buses for a5 × 5 torus whenN =50. The performance is compared against the no-replacements case. Figure13 shows the trend in the number ofreplacements as a function of the number of buses.
Increase in number of buses reduces availability latency. This is identical to the trend observed in Figures4 and5. Thesame behavior is obtained by increasing the number of buses as was obtained by varyingN and keepingα constantand vice-versa. Here, however, as we increase the number of buses, the number of servers increases. It does not changethe number of zebroids. Note that every bus increases the total number of replicas per data item by1. The possibilityof finding a suitable zebroid that can transport the requested data item to the client sooner becomes more difficult asthe ratio of the buses relative to cars increases beyond a certain threshold, since the number of servers increases. Thisthreshold was approximately10% in our experiments (see Figure12.b).
25
0 5 10 15 200
0.05
0.1
0.15
0.2
0.25
0.3
0.35
0.4
0.45
0.5
Number of buses
Average number of replacements per request
Figure 13:Shows the replacement overhead of the random policy as a function of the number of buses when deployingone-instantaneous zebroids. HereN = 50, α = 2, andT = 50.
26