Embed Size (px)
Citation preview
AN EVALUATION OF GLOVE BAG CONTAINMENT IN ASBESTOS REMOVAL
Prepared under NIOSH Interagency Agreement No. 88-22
EPA Interagency Agreement No. DW75931849-01-1
Bruce A. HolLett Phillip A. Froehlich
Paul E. CapIan Thomas C. Cooper Stanley A. Shulman
U.S. DEPARTMENT OF HEALTH AND HUMAN SERVICES Public Health Service
Centers for Disease Control National Institute for Occupational Safety and Health
Division of Physical Sciences and Engineering Cincinnati, Ohio 45226
andU.S. ENVIRONMENTAL PROTECTION AGENCY Office of Research and Development Industrial Waste and Toxics Division
Manufacturing and Service Industries Branch Cincinnati, Ohio 45268
O c t o b e r 1 9 9 0
DISCLAIMERMention of company names or products does not constitute endorsement by the National Institute for Occupational Safety and Health or the U.S. Environmental Protection Agency.
An EPA/NIOSH Publication
DHHS(NIOSH) Publication No. 90-119
PREFACEUnder the Occupational Safety and Health Act of 1970, the National Institute for Occupational Safety and Health (NIOSH) has been given a number of responsibilities including the identification of occupational safety and health hazards, evaluation of these hazards, and recommendation of standards to regulatory agencies to control the hazards. Located in the Department of Health and Human Services (formerly DHEtf), N10SH conducts research separate from the standard setting and enforcement functions conducted by the Occupational Safety and Health Administration (OSHA) in the Department of Labor. An important area of NIOSH research deals with methods for controlling occupational exposure to potential chemical and physical hazards. The Engineering Control Technology Branch (ECTB) of the Division of Physical Sciences and Engineering has been given the lead within NIOSH to study the engineering aspects relevant to the control of these hazards in the workplace.In 1984, researchers from the Division of Physical Sciences and Engineering conducted a pilot study to survey the use of engineering controls in asbestos removal. A major recommendation from that study was to obtain documentation of the effectiveness of control techniques in current use. The use of glove bags was selected as the first control to be evaluated. Because the Environmental Protection Agency (EPA) also needed information as to the efficacy of glove bag removal technology, a joint study of the control of asbestos emissions from pipe lagging removal was conducted in June and July of 1985.This report presents an evaluation of glove bag control techniques used to contain the emission of asbestos fibers during the removal of asbestos- containing pipe lagging. The data were obtained during week-long surveys in each of four public school buildings. Reports detailing the specific conditions and operations observed at each pipe lagging removal site surveyed were prepared.Copies of these reports may be purchased from the National Technical Information Service (NTIS), Port Royal Road, Springfield, Virginia 22161.
i i i
ABSTRACT
This report examines the effectiveness of the glove bag control method to prevent asbestos emissions during the removal of asbestos-containing pipe lagging. Glove bags have been used for asbestos removal without supplemental engineering controls or respiratory protection. This study has two objectives: (1) to evaluate the efficacy of glove bags to contain asbestos fibers, thereby protecting abatement workers from exposure to asbestos and preventing subsequent contamination of the building and environment during the removal of asbestos-containing materials; and (2) to evaluate aggressive vs. nonaggressive sampling methods for determining the efficacy of asbestos abatement.Workplace airborne asbestos exposures were determined during asbestos removal operations in four public schools. The same work crew removed asbestos- containing pipe lagging in all four schools. Personal exposures to airborne fibers were determined using NIOSH Method 7400 phase contrast microscopy (PCM) methods. Exposure measurements determined from personal samples indicated short-term exposures as high as 9.0 f/cc (9,000,000 f/m ) and time-weighted average exposures of 0.3 f/cc (300,000 f/m ) occurred during asbestos removal operations.In conjunction with the U.S. Environmental Protection Agency (EPA), additional evaluations were made to measure residual work site contamination resulting from incomplete glove bag containment. Airborne asbestos contamination was determined in the work area before and after removal. Aggressive and nonaggressive sampling techniques were used for collecting area samples both before removal, and after removal and subsequent cleaning. Sample analysis was performed using both PCM and transmission electron microscopy (TEM) methods. Samples taken during nonaggressive sampling procedures and analyzed by PCM typically indicated concentrations below 0.01 f/cc (10,000 f/m ), both for pre- and post-removal. TEM analysis of side-by-side samples detected much higher asbestos concentrations than PCM for both pre- and post-removal because PGM does not detect fibers less than about 0.25 pm in diameter.Higher fiber concentrations were also observed when TEM analysis was compared with PCM analysis for both nonaggressive and aggressive sampling. In addition, samples collected by aggressive sampling demonstrated a greater magnitude of asbestos contamination following asbestos removal with glove bags compared to the pre-removal samples. The choice of sampling method (aggressive or nonaggressive) and of analytical method (PCM or TEM) could thus have an effect on the perceived level of asbestos contamination. It could lead to different conclusions regarding the presence or absence of low level asbestos contamination.
i v
Exposure concentrations found at these four schools indicate that glove bags, as used during this study, did not completely contain the asbestos being removed. In three of the four facilities studied, workers were exposed to airborne asbestos concentrations above the OSHA PEL. The asbestos concentrations observed in the last of the surveys indicated that glove bags may provide some degree of containment under certain conditions. Although worker training and experience are important components of a reliable system of control measures, the present study does not provide a basis to specify conditions under which adequate containment can be assured. It is prudent to assume that the use of glove bags results in unpredictable exposure levels that may present an exposure hazard to workers and contamination of the work site.
v
Disclaimer.......................................................... ÜPreface............................................................ iiiAbstract............................................................ ivAcknowledgments......................................................ixGlossary.............................................................xAcronyms.......................................................... xiii1. Introduction.......................................................11.1. Background..... ............................................... 21.1.1. Technical.................................................. 21.1.2. Environmental Regulation..................................... 31.1.3. Analytical................................................. 31.1.3.1. Phase Contrast Microscopy.................................41.1.3.2. Electron Microscopy...................................... 5
1.1.4. Facilities Surveyed..........................................52. Discussion of the Hazard and Exposure Criteria......................... 62.1. Occupational Exposure Criteria..................................... 62.2. Environmental Exposure Criteria...................................9
3. Site and Process Description........................................ 163.1. Site Description.............................................. 163.2. Process Description............................................ 163.2.1. Generic Overview of an Asbestos Removal Activity............... 193.2.1.1. Preparation............................................ 193.2.1.2. Removal................................................193.2.1.3. Decontamination.........................................20
3.2.2. Asbestos Removal Practices Observed in this Study.............. 203.2.2.1. Preparation............................................ 203.2.2.2. Removal................................................203.2.2.3. Decontamination.........................................22
4. Methodology.......................................................254.1. Air Sampling Strategy.......................................... 254.1.1. Overview.................................................. 254.1.2. Personal Air Samples........................................254.1.3. Area Air Samples........................................... 254.1.4. Direct-Reading Monitors..................................... 274.1.5. Pre- and Post-Removal Air Sampling............................ 27
4.2. Evaluation Methods............................................. 274.2.1. Personal Sampling.......................................... 274.2.2. Workplace Area Sampling..................................... 274.2.3. Pre- and Post-Removal Air Sampling............................ 284.2.4. Real-Time Fiber Monitoring...................................28
CONTENTS
v i
CONTENTS - C o n t i n u e d
4.3. Analysis...................................................... 284.3.1. Phase Contrast Microscopy....................................284.3.1.1. Manual.................................................284.3.1.2. Magiscan II............................................ 29
4.3.2. Transmission Electron Microscopy..............................295. Results and Discussion............................................. 305.1. Field Blanks and Lower Limits of Detection........................ 305.1.1. Phase Contrast Microscopy....................................305.1.2. Transmission Electron Microscopy............................. 30
5.2. Confidence Limits.............................................. 305.2.1. Phase Contrast Microscopy....................................305.2.2. Transmission Electron Microscopy............................. 31
5.3. Sampling Results............................................... 335.3.1. Vork Activity Samples................ ....................... 335.3.1.1. Personal Samples........................................ 335.3.1.2. Area Samples........................................... 405.3.1.3. Discussion of Work Activity Exposure Results............... 40
5.3.2. Environmental Sampling...................................... 425.4. Other Observations............................................. 485.4.1. Magiscan II................................................485.4.2. Engineering Controls........................................ 515.4.3. Work Practices............................................. 515.4.4. Contractor and School Board Monitoring........................ 515.4.5. Personal Protection.........................................525.4.6. Safety Considerations....................................... 52
6. Conclusions and Recommendations..................................... 536.1. Efficacy of Glove Bag Containment................................ 536.2. Clearance Methodology.......................................... 546.3. Monitoring and Recommended Work Practices for Glove Bag Use.......... 556.4. Research Needs................................................ 58
7. References........................................................59
v i i
FIGURES2-1. Comparison by Laboratory of Asbestos Structure Counts on Blanks........122-2. Probability of Passing Z-Test (0.005 f/cc Ambient)...................122-3. Probability of Passing Z-Test (0.02 f/cc Ambient)................... 153-1. Preparation for Removal of Asbestos-Containing Pipe Lagging.......... 213-2. Working in a Glove Bag........................................... 233-3. Moving a Glove Bag.............................................. 244-1. Area Sampling Equipment.......................................... 265-1. TWA Personal Samples During Asbestos Abatement...................... 355-2. Personal Exposure During Preparation and Removal of
Asbestos-Containing Pipe Lagging...................................365-3. Average Asbestos Structures by TEM Analysis........................ 465-4. Comparison of Total Fibers by PCM and TEM Analysis.................. 475-5. Cumulative Size Distribution of Asbestos Fibers..................... 50
TABLES3-1. Asbestos Pipe Lagging Removal Study................................173-2. Description and Linear Feet of Pipe Cleaned During Survey............. 185-1. 90% Confidence Limits for a Single PCM Analysis by NIOSH Method 7400-B.. 325-2. Daily TWA Samples During Asbestos Abatement.........................345-3. Average TWA Personal Samples During Asbestos Abatement...............375-4. Summary of Sampling Results During Preparation for Pipe Lagging Removal.385-5. Summary of Sampling Results During Pipe Lagging Removal.............. 395-6. TWA Concentrations Calculated from TEM and PCM Analyses.............. 415-7. Average Asbestos Contamination in Rooms and Facilities (PCM Analysis).. .43 5-8. Average Asbestos Contamination in Rooms and Facilities (TEM Analysis).. .45 5-9. Average Per Cent Asbestos in Structures and Fibers.................. 49
APPENDIXESAppendix A - Summary Tables from Reports of Individual Facilities Appendix B - Tabulation of Data Obtained Using PCM and Magiscan II Appendix C - Tabulation of Data Obtained Using TEM Appendix D - Statistical Analysis
v i i i
ACKNOWLEDGMENTS
The authors would like to acknowledge the assistance and support of many persons in both the public and private sector. We express our gratitude to the following organizations and individuals for administrative, technical, consultative, analytical, and field support.From NIOSH: Dr. James A. Gideon and Mr. James H. Jones for project planningand administrative support; Mr. Frank W. Godbey and Mr. John Frede for support of field survey activities; Dr. Paul A. Baron, Mr. Thomas J. Fischbach, and Mr. William T. Stringer for technical and statistical support; Ms. Debra Lipps for stenographic support; Ms. Karen Lenihan and Ms. Jo Anna Bennett for data entry; Mr. Philip J. Bierbaum, Dr. Hugh Hansen, Dr. Nelson Leidel, and Mr. Ralph D. Zumwalde for manuscript review; Mr. Frank W. Godbey for safety and health review; Mr. James W. Qarter III, Dr. Charles L. Geraci, and Dr. Donald D. Dollberg for laboratory coordination; and DataChem, formerly UBTL Inc., for PCM analytical support. We are especially grateful for the extensive effort Mr. Zumwalde and Dr. Gideon also contributed in editorial assistance.From USEPA, The Manufacturing and Service Industries Branch of the Industrial Wastes and Toxics Technology Division in the Office of Research and Development: Mr. Roger Wilmoth, Mr. William Cain, and Mr. Tom Powers forinteragency agreement support and technical support; Mr. Chris Frebus and Mr. George Csordas for TEM data processing and statistics; and Mr. Pat Clark for analytical support.From PEI, Inc. through an EPA contract: Mr. Bob Amick and Mark Karaffa fortechnical and field support; Mr. Ronald Sollberger and Mr. Vincent Passaro for field support; and Ms. Eugenia Strom and Mr. Frank Welbom for analytical support.From the Cincinnati School System: Mr. Harold T. Flaherty for exceptionalcooperation and enthusiastic support.We also wish to recognize Dr. Joseph H. Guth, Interscience Research Inc., and Mr. William Ewing, The Environmental Management Group, Inc., formerly with Georgia Institute of Technology, for technical review.
i x
GLOSSARY
NOTE: This study was conducted using both NIOSH and EPAanalytical methods. In general, NIOSH methods were used for occupational exposures. Both NIOSH and EPA methods were used to determine asbestos abatement evaluations. For PCM samples analyzed by Method 7400, * the total count is reported asfibers. For TEM samples analyzed by the revised Yamate Method,I * separate counts are made for fibers, bundles, clusters, and matrixes and the sum of these categories is reported as structures. The original NIOSH Method 7402^1, in place at the time of this study, also followed this method of reporting. (In May 1989, a révision of Method 7402 *was issued, wherein only particles fitting the definition of Method 7400 are counted and are reported as fibers.) The terminology used in the present study is fibers for PCM results and structures for TEM results.
Abatement
AggressivesamplingAmended water
Removal or otherwise treating ACM to prevent contamination of buildings with asbestos.A sampling method using blowers and/or fans to keep particulates suspended during the sampling period.Water containing wetting agents, penetrants, and/or other agents to enhance the wetting of ACM and thereby reduce the generation of dust.
Asbestos A group of impure magnesium silicate minerals which occur infibrous form. These heat and chemical resistant materials with high tensile strength have been fabricated into a multitude of forms to utilize these characteristics. The more common mineral forms are known as: actinolite, amosite, anthophyllite,chrysotile, crocidolite, and tremollte.
Aspect ratio The ratio of the length to the width of a particle or fiber.Bundle EPA:t J A structure composed of three or more fibers in a
parallel arrangement with each fiber closer than one fiber diameterNIOSH:I J A compact arrangement of parallel fibers in which separate fibers or fibrils may only be visible at the ends of the bundle. Asbestos bundles having aspect ratios of 3:1 or greater and less than 3 pm in diameter are counted as fibers.
x
G l o s s a r y ( C o n t i n u e d )
Cluster
F i e l d B l a n k
Fiber
f/ccf/m3Filterbackgroundlevel
Grid
Intersection
LpmMatrix
Nonaggressivesampling
EPA:t ) A structure with fibers in a random arrangement such that all fibers are intermixed and no single fiber is isolated from the group. Groupings must have more than two intersections.NIOSH: A network of randomly-oriented interlockingfibers arranged so that no fiber is isolated from the group. Dimensions of clusters can only be roughly estimated and clusters are defined arbitrarily to consist of more than four individual fibers.A clean filter cassette assembly which is taken to the sampling sitet handled in every way as the air samples, except that no air is drawn through it.EPA:^^ A structure having a minimum length equal to 0.5 and an aspect ratio (length to width) of 5:1 or greater with substantially parallel sides.NIOSH: I 1 "A Rules" - Count only fibers longer than 5 pm. Measure the length of curved fibers along the curve. Count only fibers with a length-to-width ratio equal to or greater than 3:1. "B Rules" - Each fiber must be longer than 5 /<m and less than 3 /mi in diameter . . . with a length-to-width ratio equal or greater than 5:1.Fibers per cubic centimeter.Fibers per cubic meter.
The concentration of structures per square millimeter of filter that is considered indistinguishable from the concentration measured on a blank (filters through which no air has been drawn).
An open lattice for mounting on the sample to aid in its examination by TEM. The term is used by the EPA to denote a 200-mesh copper lattice approximately 3 mm in diameter.Nonparallel touching or crossing of fibers, with the projection having an aspect ratio of 5:1 or greater.Liters per minute.EPA: Fiber or fibers with one end free and the other endimbedded in or hidden by a particulate. The exposed fiber must meet the fiber definition.NIOSH: L * One or more fibers attached to or imbedded in a nonasbestos particle.An environmental sampling method performed in a quiescent atmosphere.
x i
G l o s s a r y ( C o n t i n u e d )
Operations & Maintenance Program (O&M P)
Pipe lagging
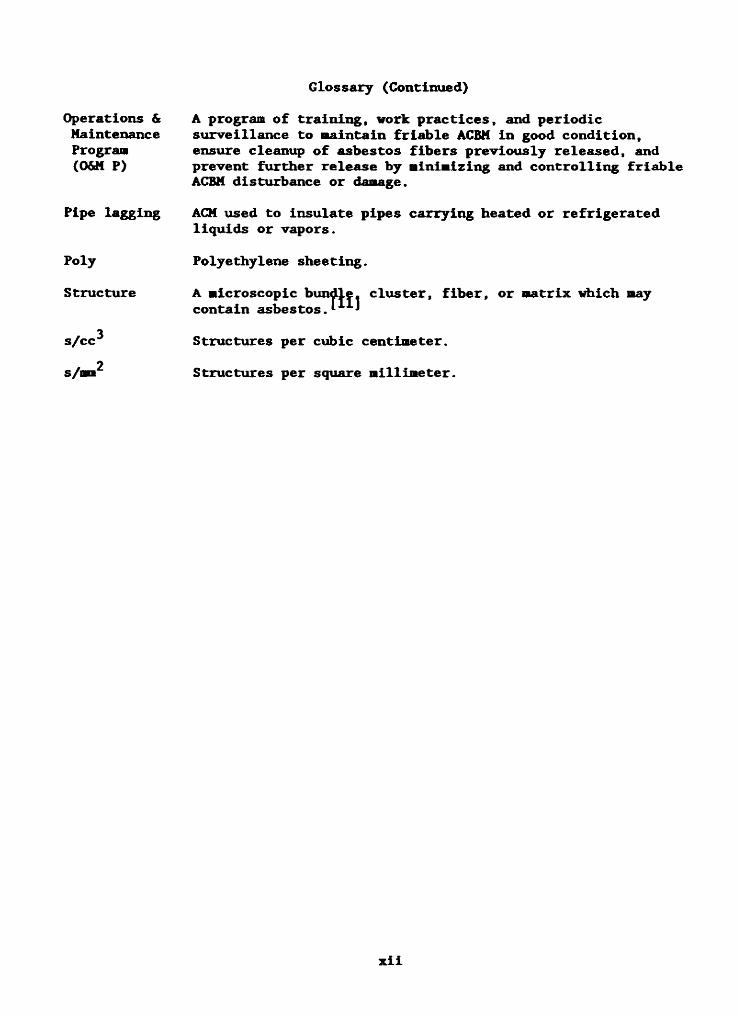
PolyStructure
s/cc's/mm:
A program of training, work practices, and periodic surveillance to maintain friable ACBM in good condition, ensure cleanup of asbestos fibers previously released, and prevent further release by minimizing and controlling friable ACBM disturbance or damage.ACM used to insulate pipes carrying heated or refrigerated liquids or vapors.Polyethylene sheeting.A microscopic bundle, cluster, fiber, or matrix which may contain asbestos.* JStructures per cubic centimeter. Structures per square millimeter.
x i i
ACMAHERAC V
EDXAEPAFAMHEPA
LODLOQ
MSHANIOSHOSHAPBZ
PCM
PEL
REL
RSDSAEDSEMSTDSTEMTEMTWA
ACBM
ACRONYMS
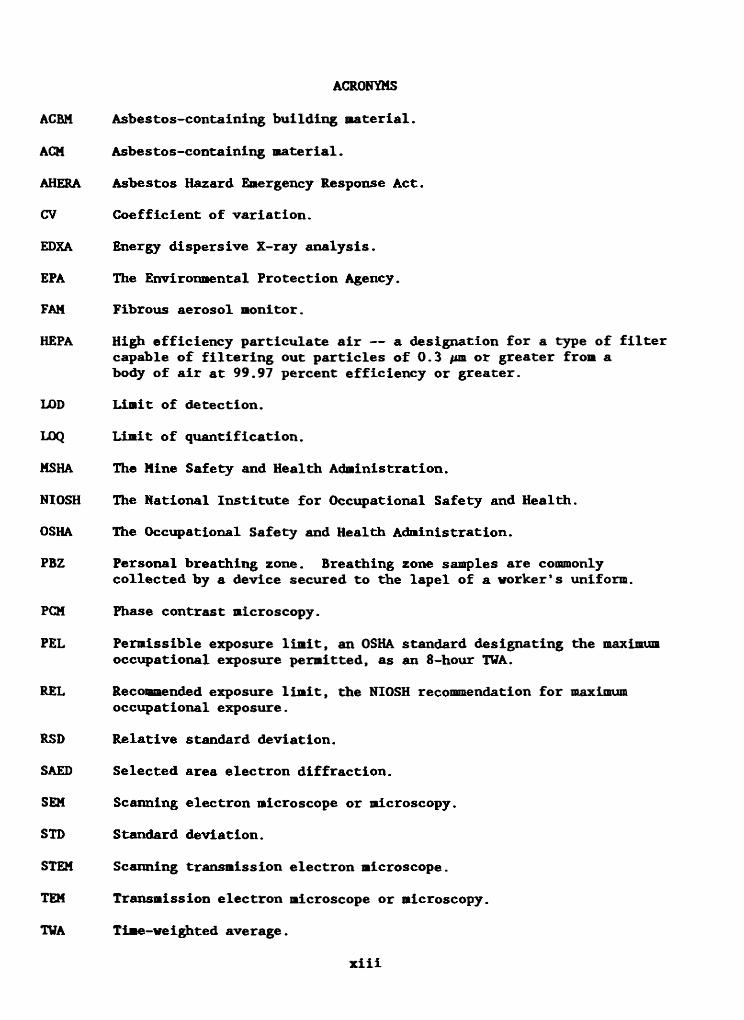
Asbestos-containing material.Asbestos Hazard Emergency Response Act.Coefficient of variation.Energy dispersive X-ray analysis.The Environmental Protection Agency.Fibrous aerosol monitor.High efficiency particulate air — a designation for a type of filter capable of filtering out particles of 0.3 ftm or greater from a body of air at 99.97 percent efficiency or greater.Limit of detection.Limit of quantification.The Mine Safety and Health Administration.The National Institute for Occupational Safety and Health.The Occupational Safety and Health Administration.Personal breathing zone. Breathing zone samples are commonly collected by a device secured to the lapel of a worker’s uniform.Phase contrast microscopy.Permissible exposure limit, an OSHA standard designating the maximum occupational exposure permitted, as an 8-hour TWA.Recommended exposure limit, the NIOSH recommendation for maximum occupational exposure.Relative standard deviation.Selected area electron diffraction.Scanning electron microscope or microscopy.Standard deviation.Scanning transmission electron microscope.Transmission electron microscope or microscopy.Time-weighted average.
A s b e s t o s - c o n t a i n i n g b u i l d i n g m a t e r i a l .
x i i i

1 . INTRODUCTION
Under the Occupational Safety and Health Act of 1970, the National Institute for Occupational Safety and Health (NIOSH) was assigned responsibilities for conducting research in occupational safety and health, for disseminating information emerging from those studies, for recommending standards to regulatory agencies, and for supporting the training of professionals in occupational safety and health. It was placed in the Department of Health and Human Services (formerly, the Department of Health, Education, and Welfare) to conduct research and education programs separate from the standard setting and enforcement functions conducted by the Occupational Safety and Health Administration (OSHA) in the Department of Labor.An important area of NIOSH research deals with methods for controlling occupational exposure to potential biological, chemical, and physical hazards. The Engineering Control Technology Branch (ECTB) of the Division of Physical Sciences and Engineering has been given the lead within NIOSH to study the engineering aspects relevant to the control of these hazards in the workplace. Since 1976, the ECTB has conducted assessments of control technology methods used in industry on the basis of controls used within a selected industry, controls used for common industrial processes, or specific control techniques. The objective of these studies has been to document and evaluate effective control techniques (e.g., isolation or the use of local ventilation) that reduce the risk of potential health hazards, and to create an awareness of the need for or the availability of effective hazard control measures. A number of these studies on control assessments, including the present research study on the use of glove bags in asbestos removal, have been performed in collaboration with the Environmental Protection Agency (EPA) .The original objective for this study was concerned primarily with control of occupational exposure; however, in collaboration with the EPA, environmental aspects were also included. Because the EPA was preparing legislation for asbestos abatement, that Agency was interested not only in the efficacy of glove bags for asbestos containment, but also in the development of test methods to evaluate asbestos contamination at very low concentrations. As a result, the study was undertaken with two objectives:
• To evaluate the efficacy of the use of glove bags as a control technique to prevent occupational exposure to airborne asbestos during the removal of asbestos-containing pipe lagging, and as a control technique to prevent contamination of the building environment. NOTE: The occupational exposure and buildingcontamination aspects are discussed separately in the present report because they involve different analytical methods and regulatory agencies.
1
• To evaluate sampling and analytical techniques for determining concentrations of airborne asbestos for asbestos abatement clearance, specifically: (a) to compare airborne asbestosconcentrations determined by "aggressive” and "nonaggressive" sampling methods, and (b) to compare analytical results determined by PCM and TEM procedures.
The evaluations were conducted during the removal of asbestos-containing pipe lagging in four public school buildings; all removal operations were conducted by the same work crew. The authors have attempted to accurately describe the operations and conditions observed during the surveys and to delineate the major difficulties encountered in the evaluations of the sampling and analytical methodologies. In many cases, the high variability of asbestos analytical results precluded the ability to obtain sufficient data to determine statistical differences; however, the data and observations reported indicate trends and other information useful to members of the asbestos removal industry for reducing asbestos emissions.1.1. BACKGROUND1.1.1. TechnicalA pilot study of asbestos abatement operations conducted in 1984 revealed novel approaches that have been and are being developed to control asbestos fiber exposure of workers engaged in the removal of asbestos-containing materials (ACM). I J Two principle methods currently used to control airborne exposure are wetting the ACM and the use of negative air pressure in the workplace. Vetting methods utilize fluids to saturate ACM before and during the removal of these materials to reduce the potential for asbestos fibers to become airborne. Exposure control by negative pressure is accomplished by the use of fans or exhaust devices to remove contaminated air from enclosed or controlled areas and to draw clean air Into these areas. In order to contain and reduce airborne asbestos, this exhausted air is filtered through high efficiency particulate air (HEPA) filters before being released to the atmosphere.The evaluation of source controls, such as containment or local ventilation applied at the source of the emission, is of particular interest because these are generally the most effective in controlling both occupational exposure and environmental releases. An asbestos abatement activity that is frequently performed is the removal of pipe lagging (i.e., ACM used to insulate pipes carrying heated or refrigerated liquids or vapors). Glove bags are often used as source controls during the removal of pipe lagging. These are large plastic bags which contain long gloves sealed into the body. The worker seals the bag around the material to be removed and then manipulates various tools within the bag by means of the gloves sealed Into the side of the bag to remove the lagging. The debris falls to the bottom of the bag, where it is contained for final disposal as asbestos waste in accordance with regulations promulgated by the EPA and by State and local governments. Glove bags may also be used for general plant maintenance. They are often used without other means of containment, such as total enclosure of the removal area with plastic barriers and/or die use of negative pressure. The effectiveness of glove bags to control asbestos emissions is extremely important to assure the health of
2
workers and to prevent contani.nati.on of the adjoining workplaces and the environment.This study was initiated to determine if the use of glove bags can reliably control asbestos emissions during abatement operations. In addition, EPA methodologies for measuring room contamination levels of airborne asbestos for post-abatement clearance were evaluated.1.1.2. Environmental RegulationThe EFA has been involved in regulatory activities to reduce asbestos emissions and contamination of the environment since 1972. *■ * ' A major concern of this Agency is that degradation or disturbance of in-place ACM in buildings may cause asbestos to contaminate the buildings. The debris may become airborne from repeated episodes of agitation and thereby create a potential for exposure to the occupants. Although the application of asbestos fireproofing material is not permitted in buildings today, the eventual management and removal of in-place ACM poses a technical and economic dilemma. A P9ft of the Toxic Substances and Control Act, the Asbestos-In-Schools Rule, I ' requires administrators of primary and secondary schools, both private and public, to have all buildings inspected for ACM; to document its presence and condition; and to inform their employees, the PTA or parents, and the State authority.In the past, rather than promulgate specific regulations for asbestos abatement activities, the EPA has issued "Guidance Documents"' which havepresented the "best engineering judgment" approach at that time. Based on these guidelines and on the present requirements of the Asbestos Hazard Emergency Response Act (AHERA), •* ACM must be routinely monitored throughan established operation and maintenance program. If abatement is needed, the accepted methods are: (1) encapsulation with a penetrating or bridgingchemical; (2) enclosure to prevent access to public or to airflow disturbances; or (3) removal. EPA regulations also require the removal of ACM prior to demolition of a building, ' so eventual removal of ACM is virtuallyinevitable.Because the efficacy of certain control methods for asbestos removal is not well known, EPA and NIOSH initiated an Interagency Agreement to add to the planned evaluations of glove bag containment by NIOSH researchers. The added work involved documenting the effectiveness of glove bags in controlling airborne emissions that could potentially add to long term, low level building contamination. This required the determination of the airborne asbestos concentrations in work areas before asbestos removal was started and also after the activities were completed in order to determine whether there was a release of airborne asbestos during the removal. Two sampling methods, "aggressive" and "nonaggressive", were used to compare the effectiveness of these methods in evaluating asbestos contamination for building clearance assessment. They are described in detail in the Section 4.1.5, Pre- and Post-Removal Air Sampling.1.1.3. Analytical MethodsAt the time of the study, phase contrast microscopy (PCM) was the primary method used to determine airborne asbestos concentrations in the workplace.
3
Several investigators had developed transmission electron microscopy (TEM) methods with the capability of detecting fibers smaller than those visible by PCM. Another part of the Interagency Agreement was to provide some evaluation of these methods for detecting airborne asbestos at the very low concentrations encountered in environmental evaluations by using side—by-side sampling and subsequent analysis by both PCM and TEM.1.1.3.1. Phase Contrast Microscopy—PCM has historically been used for the purpose of analyzing occupational exposures to airborne asbestos. It was developed for determining occupational exposure in industrial environments where airborne fibers were known to consist essentially of asbestos. Epidemiologic studies have correlated health effects to PCM fiber counts. However, PCM does not differentiate between asbestos and other fibrous matter such as organic textile or cellulose fibers, nor does it detect very thin or small fibers. The Occupational Safety and Health Administration (OSHA) permissible exposure limit (PEL) is based on a method that utilizes PCM to manually count the number of fibers greater than 5 micrometers (pm) in length and with an aspect ratio of at least 3:1 (length to width) collected on cellulose ester filter media.I JNIOSH Method 7400 describes sampling and analytical procedures for determining fiber concentrations by PCM. This method was first issued February 15,1984.1 J I t w a s r e v i s e d M a y 15, 1985,1 a n d a s e c o n d r e v i s i o n w a s m a d e
A u g u s t 15, 1987; I * t h e t h i r d a n d c u r r e n t r e v i s i o n w a s i s s u e d M a y 15.1989.1 ] The NIOSH Method 7400, in place at the time of the study, L lincluded two sets of counting rules: "A” rules and ”B" rules. PCM samplesfrom this study were analyzed using the ”B" rules, which define a fiber as having an aspect ratio of 5:1 or greater. A note under the "B" rules in this version states: "... The B rules are preferred analytically because of theirdemonstrated ability to improve the reproducibility of fiber counts. * In the third and current revision of Method 7400, *■ * the "B" rules are onlyincluded as Appendix C and an introductory note concludes: "NIOSH recommendsthe use of the 3:1 aspect ratio in counting fibers.11 (As discussed in Section2.1, Occupational Exposure Criteria, it is not possible to estimate accurately "A" rule fiber counts based on "B" rule results.)A note on the applicability of NIOSH Method 7 4 0 0 states: "... Themethod gives an index of airborne fibers . . . Fiber [less than about]0.25 pm diameter will not be detected by this method.” The method requires a microscopist to count the number of fibers collected on several very small areas of the filter used to capture these fibers. Unfortunately, the deposition of the fibers on the filter is not uniform. Baron and Deye* ■* note that "... The change in particle trajectories caused by [electrostatic] charge effects can result in nonuniform deposits on the collecting filter surface and net loss of sample . . . Therefore, in spite of attempts to randomize counting areas, the specific fields counted may not be representative of the entire filter. For this and other reasons as discussed in Section 5.2, Confidence Limits, the interlaboratory coefficient of variation (CV — 0.45) is quite large. The term "index” is properly applied to the result of microscopic fiber counts, because quantitation of analytical results contains more uncertainty than does the analysis of most chemicals. However, this method does have the capability of producing results rapidly (less than 24 hours) and relatively inexpensively.
4
1.1.3.2. Electron Microscopy—In addition to PCM, transmission electron microscopy (TEK) was evaluated for asbestos counting both because of the greatly enhanced resolution and contrast, and of the analytical capability to differentiate between asbestos and nonasbestos structures. The greater power of the TEM method becomes important where the airborne fibers with diameters less than 0.25 pa (the limit of the resolving power of PCM) are present. For example, in relatively clean buildings and in the surrounding ambient environment, there is a proportionately lower concentration of airborne fibers greater than 0.25 pm because of the rapid settling of the heavier material. Even though a proportionately higher concentration of airborne fibers <0.25 pm in diameter may be present in these circumstances, they will not be observed at all with PCM. Thus, under these conditions, no conclusion can be made about their presence or absence. Because of the lower resolving power of the PCM method, requires the TEM method to be used for quantitating asbestosfibers. 9
Widespread use of TEM has been limited by the relative high cost of analysis, the availability of equipment and trained personnel, a n d the absence of a standardized method of analysis. NIOSH Method 7402,1 in place at the timeof this study, used the same cellulose ester filter medium as does the PCM method. (Method 7402 was revised on May 15, 1989,1 J but the use of a cellulose ester filter is still required.) The EPA has developed a provisional method for TEM analysis of asbestos which requires a polycarbonate filter medium. * * This method was further modified for regulatory purposes when the Asbestos Hazard Emergency Response Act (AHERA) was promulgated in1986, and is considerably different than the NIOSH method 7402 and the requirements of the OSHA Standard; this is discussed further in Section2.2, Environmental Exposure Criteria.1.1.4. Facilities SurveyedIn the summer of 1983, a public school board employed a consultant to survey the school buildings to determine the type, location, and condition of ACM. Asbestos-containing pipe and/or boiler lagging was found in 90% of the buildings surveyed; asbestos-containing acoustical plaster, flreproofing, and/or acoustical ceiling tile were found in only a few buildings . * ' Inaddition, there were numerous occurrences of miscellaneous building materials (pressed asbestos~board, asbestos-cement sheeting, etc.) and other products (asbestos protective clothing, pot holders, gaskets, etc.) observed in these buildings. The consultant's recommendations for minimizing the risk of asbestos exposure included the removal of significantly deteriorated acoustical plaster and flreproofing, the repair and repainting of acoustical plaster in some areas, and the repair or removal of damaged and/or exposed asbestos pipe and boiler insulation. The establishment of an asbestos hazard management program was recomended to provide for employee training, monitoring, and management of all ACM that remained in these buildings. These recommendations were implemented by the school board and the priority asbestos removal and repair projects were completed. In 1985, a contractor was employed to remove all remaining asbestos-containing pipe lagging and materials. Arrangements were made with the school board for the NIOSH research team to conduct surveys at four school buildings and to collect samples to determine airborne asbestos contamination levels before, during, and after the removal of pipe lagging.
5
2 . D IS C U S SIO N OF THE HAZARD AND EXPOSURE C R IT E R IA
2.1. OCCUPATIONAL EXPOSURE CRITERIA
Because of the potential carcinogenicity of asbestos NIOSH recommends that exposure of workers to asbestos be reduced to the lowest feasible limit. In 1984, NIOSH reaffirmed its previously recoonended exposure limit (REL) not to exceed 100,000 fibers greater than 5 /a» In length per cubic meter (f/m ) or 0.1 fibers per cubic centimeter (f/cc) based on the limit of quantification for analysis of samples by PCM. t J On Nay 9, 1990, at the hearing on OSHA's Notice of Proposed Rulemaking on Occupational Exposure to Asbestos, Tremolite, Anthrophyllite, and Actinollte,^ * this position was summarized as follows:
”... On June 21, 1984, NIOSH testified at the OSHA public hearings on occupational exposure to asbestos and presented supporting evidence that there is no safe airborne fiber concentration for any of the asbestos minerals. L * NIOSH stated that not even the lowest fiber exposure limit could assure all workers of absolute protection from exposure-related cancer. This conclusion was consistent with previous positions taken by NIOSH in the 1976 criteria document on asbestos * and the jointNIOSH/OSHA report of 1980.126] In the NIOSH/OSHA report, NIOSH also reaffirmed its position that there is no scientific basis for differentiating health risks between types of asbestos fibers for regulatory purposes. In its 1984 testimony, NIOSH urged that the goal be to eliminate asbestos fiber exposures.^ Where exposures cannot beeliminated, exposures should be limited to the lowest concentration possible."When recommending an occupational exposure limit in its 1984 testimony, NIOSH acknowledged the limitations imposed by currently accepted methods of sampling and analysis. NIOSH concluded that for regulatory purposes, phase contrast microscopy (PCM) was still the most practical technique for assessing asbestos fiber exposures when using the criteria given in NIOSH Analytical Method 7400. I * NIOSH also recognized that phase contrast microscopy (1) lacked specificity when asbestos and other fibers occurred in the same environment, and (2) was not capable of detecting fibers with diameters less than approximately 0.25 micrometers. NIOSH further stated that it might be necessary to analyze samples by electron microscopy where both electron diffraction and microchemical analysis can be used to help identify the type of mineral and assist in ascertaining asbestos fiber concentrations."
In the 1990 testimony, NIOSH recommends the following to be adopted for regulating exposures to asbestos:
"The current NIOSH asbestos recommended exposure limit is 100,000 fibers greater than 5 micrometers in length per cubic meter of air, as determined
6
in a sample collected over any 100-minute period at a flow rate of 4L/min. This airborne fiber count can be determined using NIOSH Method 7400, or equivalent. In those cases when mixed fiber types occur in the same environment, then Method 7400 can be supplemented with electron microscopy, using electron diffraction and microchemical analysis to improve specificity of the fiber determination. NIOSH Method 74021 provides aqualitative technique for assisting in the asbestos fiber determinations. Using these microscopic methods, or equivalent, airborne asbestos fibers are defined, by reference, as those particles having (1) an aspect ratio of 3 to 1 or greater; and (2) the mineralogic characteristics (that is, the crystal structure and elemental composition) of the asbestos minerals and their nonasbestiform analogs . . . ."
NIOSH also includes the following statement on asbestos in pertinent Health Hazard Evaluations:
"NIOSH recommends as a goal the elimination of asbestos exposure In the workplace; where it cannot be eliminated, the occupational exposure to asbestos should be limited to the lowest possible concentration.' *This recommendation is based on the proven carcinogenicity of asbestos in humans and on the absence of a known safe threshold concentration."NIOSH contends that there is no safe concentration for asbestos exposure. Virtually all studies of workers exposed to asbestos have demonstrated an excess of asbestos-related disease. NIOSH investigators therefore believe that any detectable concentration of asbestos in the workplace warrants further evaluation and, if necessary, the implementation of measures to reduce exposures."NIOSH investigators use phase contrast microscopy (NIOSH Method 74001^1) to determine airborne asbestos exposures, and electron microscopy (NIOSH Method 7402* ') to confirm them. The limits of detection andquantitation depend on sample volume and quantity of interfering dust. The limit of detection is 0.01 fiber/cc [10,000 fibers/m ] in a 1,000-liter air sample for atmospheres free of interferences. The quantitative working range is 0.04 to 0.5 fiber/cc [40,000 to 500,000 fibers/m ] in a 1,000-liter air sample."The Occupational Safety and Health Administration (0SHA) permissible exposure limit (PEL) for asbestos limits exposure to 0.2 fiber/cc [200,000 f/m ] as an 8-hour TWA. * 0SHA has also established an asbestosexcursion limit for the construction industry that restricts worker exposures to 1.0 fiber/cc [1,000,000 f/m ] averaged over a 30-minute exposure period.I
At the time of this study (1985), the OSHA PEL was 2.0 fibers greater than 5 pm in length per cubic centimeter (2,000,000 f/m ), averaged over an 8-hour work day, with a celling concentration of 10.0 f/cc (10,000,000 f/m ), not to be exceeded over a 15-minute period.‘• •I There was also a provision for medical monitoring of workers routinely exposed to fiber concentrations in excess of 0.1 f/cc (100,000 f/m ).
7
On June 20, 1986, OSHA Issued a revised standard which reduced the PEL to 0.2 f/cc (200,000 f/m ) greater than 5 ua in length, as an 8-hour tine-weighted average (TWA) exposure.* J It also set an action level of 0.1 f/cc (100,000 f/m ) that triggers other requirements, including worker training and medical monitoring; in 1988 the standard was revised to establish a 1.0 f/cc (1,000,000 f/m ) excursion limit.1 7]Many employees of local, state, or federal governmental agencies are exempt from OSHA regulations. To protect all workers in public schools where asbestos removal is performed, the EPA first adopted the provisions of the OSHA standard in effect in 1985 and then the June 1986 OSHA revisions in February 1987.* *
As stated, the determination of occupational exposure to asbestos according to the criteria contained in the NIOSH REL and the OSHA PEL are based on the use of the PCM analytical method. This method has inherent limitations based on the optics of the microscope and upon the ability of the microscopist to reliably discriminate fiber length to width ratios in a complex sample matrix. NIOSH Method 74001 ' stipulated that only fibers longer than 5 pm becounted with a length to width ratio of either 3:1 (A rules) or 5:1 (B rules). The A rules use the same aspect ratio required in the earlier NIOSH analytical method P&CAM 2391 1 and the current OSHA PEL, and thus have the advantage ofrelating fiber concentrations to current and historical exposure data. There Is no means to generically extrapolate fiber concentrations determined from the use of the B rules to that which may have been derived if the A rules had been used, because the distribution of fibers may vary from case to case. However, fiber counts of samples collected in this study at two schools were compared using TEM analysis to determine fiber dimensions and type of fiber. Using the fiber size distribution determined by TEM for samples in the present study, the difference between the number of fibers counted having aspect ratios greater than 5:1 and those having aspect ratios greater than 3:1 was under 20%.There are several other factors in addition to aspect ratio that can affect the result of asbestos counting methods. Perhaps the most important is that PCM is used for counting total fibers greater than 5 pm in length and 0.25 pm in diameter. On the other hand, TEM counts include only fibers verified by crystalline asbestiform identification. Furthermore, the minimum fiber diameter that can be routinely observed by PCM is approximately 0.25 pm.Because many asbestos fibers have diameters less than 0.25 pm, they are not usually visible during PCM analysis. Thus the use of TEM provides the opportunity to identify and characterize all airborne fibers present in the work environment. Total fiber counts by TEM are often far higher than counts of the same sample obtained by PCM. However, once fibers are speciated, TEM counts of asbestos fibers could actually be lower than the PCM count, especially for relatively low concentrations of mixed fiber type containing a high proportion of nonasbestos fibers. In spite of these limitations, PCM analysis is recognized by occupational health professionals as an appropriate index of exposure for approximating disease potential.Exposures to airborne asbestos fiber concentrations are usually reported as the number of fibers per cubic centimeter (f/cc) of air. In this report, concentrations are also expressed as fibers per cubic meter (f/m ), because the amount of inspired air over the work shift of asbestos removal workers
8
would typically be 1 to 2 cubic meters of air per hour. In an environment contaminated at the OSHA PEL of 0.2 f/cc [200,000 f/m ], a worker with no respiratory protection could inhale over 2 million fibers visible by PCM during an 8-hour work shift! As noted above, because of the small size of airborne fibers, fibers observed and counted by PCM often represent only a small percentage of the total number of fibers inhaled by an unprotected worker.2.2. ENVIRONMENTAL EXPOSURE CRITERIAThe EPA had established "clearance” guidelines for determining when reoccupancy may occur after asbestos removal. These guidelines were initially published as "recommended practices." In 1984 and 1985, the recommended practicewas to perform visual inspection of the work area after asbestos removal, followed by quiescent air sampling using PCM for fiber analysis. Fiber concentrations were required to be below the lower quantifiable limit of detection using NIOSH Method P&CAM 239.I J This limit ranged from 30,000 to10.000 f/m (0.03 to 0.01 f/cc) at the recommended sample volumes of 1,000 to3.000 liters. If fiber concentrations in the building, after asbestos abatement activities, exceeded this limit, then the work areas were required to be recleaned until exposures were brought under control.The revised EPA guidelines issued in 1985 recognized NIOSH Method 7400 and recommended a 3,000 liter sample in order to provide a minimum quantification limit of 0.01 f/cc (10,000 f/m ). These guidelines also recommended using aggressive sampling and the use of TEM analysis to determine asbestos concentrations. To permit reoccupancy using this evaluation methodology, the average fiber concentration of five samples collected from a "homogenous" area was to be statistically equal to or less than the ambient background fiber concentration. A typical„ambient asbestos concentration is approximately 0.005 f/cc (5,000 f/m*).[3XjThe field work for the present study was conducted in June and July of 1985, based on the 1985 revised EPA guidelines, I J for sampling and analysis. Forthe sake of completeness, a discussion of legislative revisions ofenvironmental exposure criteria which have occurred since 1985 that affect current asbestos removal work is given in the following text.In October 1986, the Asbestos Hazard Emergency Response Act (AHERA)^^ was passed which required the EPA to regulate asbestos in schools. On October 30,1987, the final rule "Asbestos-Containing Materials in Schools" was published in the Federal Register. I J This rule requires the use of aggressive air sampling to determine if a response action (an asbestos containment or removal operation and clearance procedure for reoccupancy) has been satisfactorily completed. For the first 2 years after the effective date of the rule (December 14, 1987), "... a local education agency (LEA) may analyze air monitoring samples for clearance purposes by PCM to confirm completion of removal, encapsulation or enclosure of ACBM [asbestos-containing building material] that Is less than or equal to 3,000 square feet or 1,000 linear feet. The section [response action] shall be considered complete when the result of samples collected in the affected functional space show that the concentration of asbestos for each of five samples is less than or equal to thelimit of quantitation for PCM, or 0.01 f/cc [10,000 f/m ] of air."
9
After the first 2 years or if the job exceeds the ■inimm size criteria, the regulation requires a three-step process using TEN analysis for determining successful completion of a response action. After visual inspection, the final two steps involve a sequential evaluation of five samples taken inside the work site, five samples taken outside the work site, two field blanks, and one sealed blank. Final clearance is granted if the average asbestos fiber concentration determined from the samples collected in the work site is below the prescribed limit of detection (LOD) for the TEN method. Additional evaluations are required if the LOD test fails.A previous EPA guidance publication^^ noted that the basis for collecting five samples was to increase the statistical confidence in the measurement and thus reduce the possibility of wrongly approving a contaminated facility. Statistically, seven samples are required for a method with a CV of 1.5 to provide a 90% confidence of detecting a fivefold difference from the ambientconcentration; however, for practical reasons, a minimum sample size of fivewas recommended. The same EFA publication also recommended that samples from the work site should be taken from one homogeneous area which is defined as "a contiguous area in which one type of abatement procedure was performed to remove the same type of ACM.N Asbestos removal at most abatement sites is performed using various removal procedures to remove different types of ACM from a number of separated areas within a building. Even within contiguous areas, several different types of abatement procedures may be employed. The "homogenous area" requirement was omitted in the enactment of the AHERA regulation.In addition to these changes in the sampling protocol and clearance strategy, AHERA prescribed a new TEN protocol which differs from NIOSH method 7402 and OSHA reference method (Appendix A of the revised standard J) in several ways:Aspect Ratio - Fibers must have a 5:1 or greater aspect ratio to be counted, asopposed to the 3:1 ratio prescribed by NIOSH and OSHA for evaluating airborneexposure. A reviewL * of several EFA studies (including this project) indicated that fiber counts based on a 5:1 aspect ratio ranged from 13 to 61 percent lower than fiber counts obtained using a 3:1 aspect ratio. Thus, lower airborne asbestos concentrations are reported when the 5:1 aspect ratio is used.Filter Nedla - Air samples may be collected either on polycarbonate or cellulose ester media; however, the cellulose ester media specified is a 0.45 /in pore size filter with a 5.0 /m pore size backing filter. Both NIOSH Method 7402 and the OSHA standard specify a 0.8 pm pore size filter.This difference may affect the distribution and orientation of the fibers collected.Filter Blank Cnnt-_*wf ration and Inter laboratory Variability - A more complicated issue involves the analysis of fiber contamination found on unused (blank) filters and the determination of the LOD. In 1985, the EPA provided polycarbonate filters from the same production lot for this and several other studies. The investigators for these studies reported high and variable fiber counts on blank filters as they were received from the EPA. A peer review
1 0
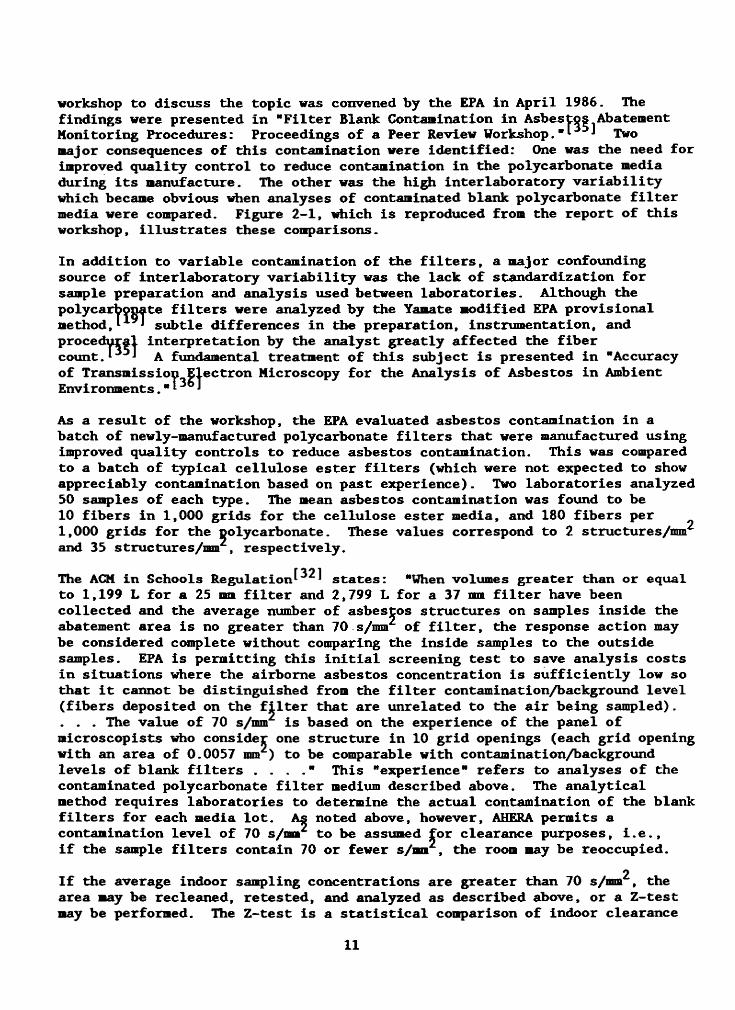
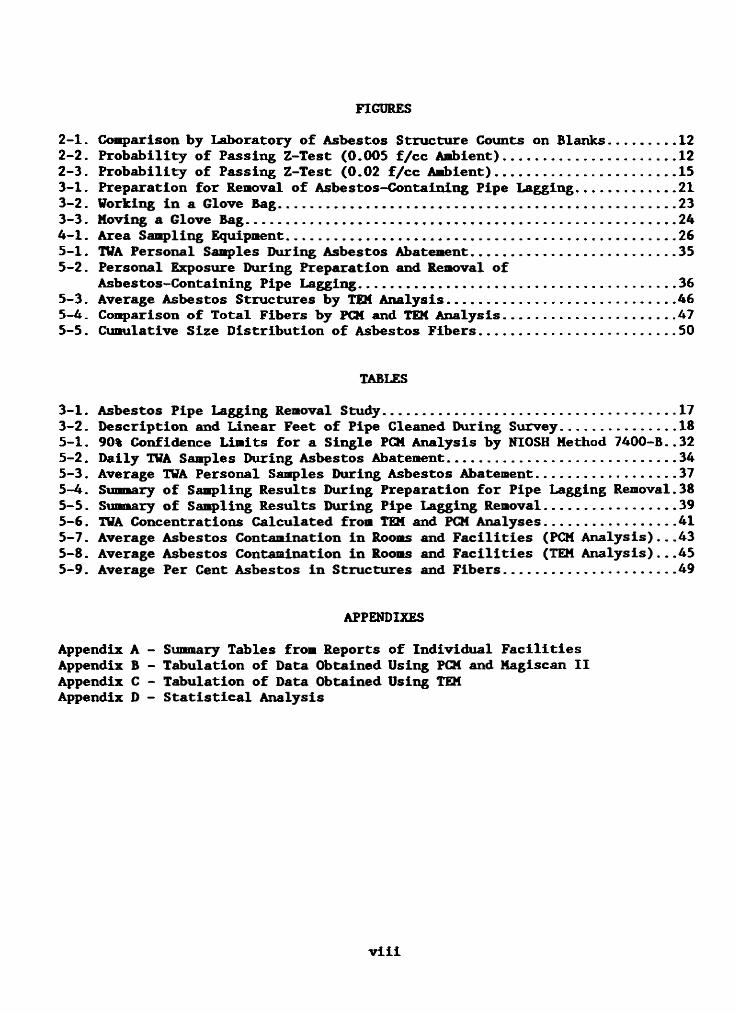
workshop to discuss the topic was convened by the EPA in April 1986. The findings were presented in "Filter Blank Contamination in Asbestos Abatement Monitoring Procedures: Proceedings of a Peer Review Workshop. "I * Twomajor consequences of this contamination were identified: One was the need forimproved quality control to reduce contamination in the polycarbonate media during its manufacture. The other was the high interlaboratory variability which became obvious when analyses of contaminated blank polycarbonate filter media were compared. Figure 2-1, which is reproduced from the report of this workshop, illustrates these comparisons.In addition to variable contamination of the filters, a major confounding source of interlaboratory variability was the lack of standardization for sample preparation and analysis used between laboratories. Although the polycarbonate filters were analyzed by the Yamate modified EPA provisional method,^ J subtle differences in the preparation, instrumentation, and procedural interpretation by the analyst greatly affected the fiber count. I J A fundamental treatment of this subject is presented in "Accuracy of Transmission Electron Microscopy for the Analysis of Asbestos in Ambient Environments. " *■ *
As a result of the workshop, the EPA evaluated asbestos contamination in a batch of newly-manufactured polycarbonate filters that were manufactured using improved quality controls to reduce asbestos contamination. This was compared to a batch of typical cellulose ester filters (which were not expected to show appreciably contamination based on past experience). Two laboratories analyzed 50 samples of each type. The mean asbestos contamination was found to be 10 fibers in 1,000 grids for the cellulose ester media, and 180 fibers per1,000 grids for the polycarbonate. These values correspond to 2 structures/mm and 35 structures/mm , respectively.The ACM in Schools Regulation^states: "When volumes greater than or equalto 1,199 L for a 25 mm filter and 2,799 L for a 37 mm filter have been collected and the average number of asbestos structures on samples inside the abatement area is no greater than 70 s/mm of filter, the response action may be considered complete without comparing the inside samples to the outside samples. EPA is permitting this initial screening test to save analysis costs in situations where the airborne asbestos concentration is sufficiently low so that it cannot be distinguished from the filter contamination/background level (fibers deposited on the filter that are unrelated to the air being sampled).. . . The value of 70 s/mm is based on the experience of the panel of micros cop is ts who consider one structure in 10 grid openings (each grid opening with an area of 0.0057 mm ) to be comparable with contamination/background levels of blank filters . . . ." This "experience" refers to analyses of the contaminated polycarbonate filter medium described above. The analytical method requires laboratories to determine the actual contamination of the blank filters for each media lot. As noted above, however, AHERA permits a contamination level of 70 s/mm to be assumed for clearance purposes, i.e., if the sample filters contain 70 or fewer s/mm , the room may be reoccupied.
oIf the average indoor sampling concentrations are greater than 70 s/mm , the area may be recleaned, retested, and analyzed as described above, or a Z-test may be performed. The Z-test is a statistical comparison of indoor clearance
11
Figure 2-1Comparison by Laboratory of Asbestos Structure Counts on Blanks*
sample icanCROUP LAS WMF » ___I KM
1MC CRONE
YAMATE
1œ 2 samples *
— i— n 4 SAWLI5 1
2 MC CRONE
YAMATE
11
D 2 SAMPLES I
3 MC CRONE
NIOSH
ISAMPLES
1 1 SJWPLE1
4 MC CRONE NICSH r ~ : z 4— 1 2 SAMP1£S
1T 11 SAMPLES
1
S MC CRONE
NIOSH
1»LES1 1
1 1 SAMPLE1 1
6 ETC *>LES
7m: crone
NICSH
1 I 1 1S1 — " " 1 4 l
i1 1 sample
1
9tc CRONEEPANIOSH
1 = I' r-1 2 samples
ED 3 samplesi
i3 SAMPLES
10MC CRONEEPANICSH
1 r r -T ------- ï 2 SAMPLES
3 SWi?US j
3 SAMPLES
C 1C 2D 30 «0 SC
assIstss structures in ic « : s openiigs at 2c.coq*
* From: Filter Blank Contamination in Asbestos Abatement MonitoringProcedures: Proceedings of a Peer Review Workshop. t 6]
12
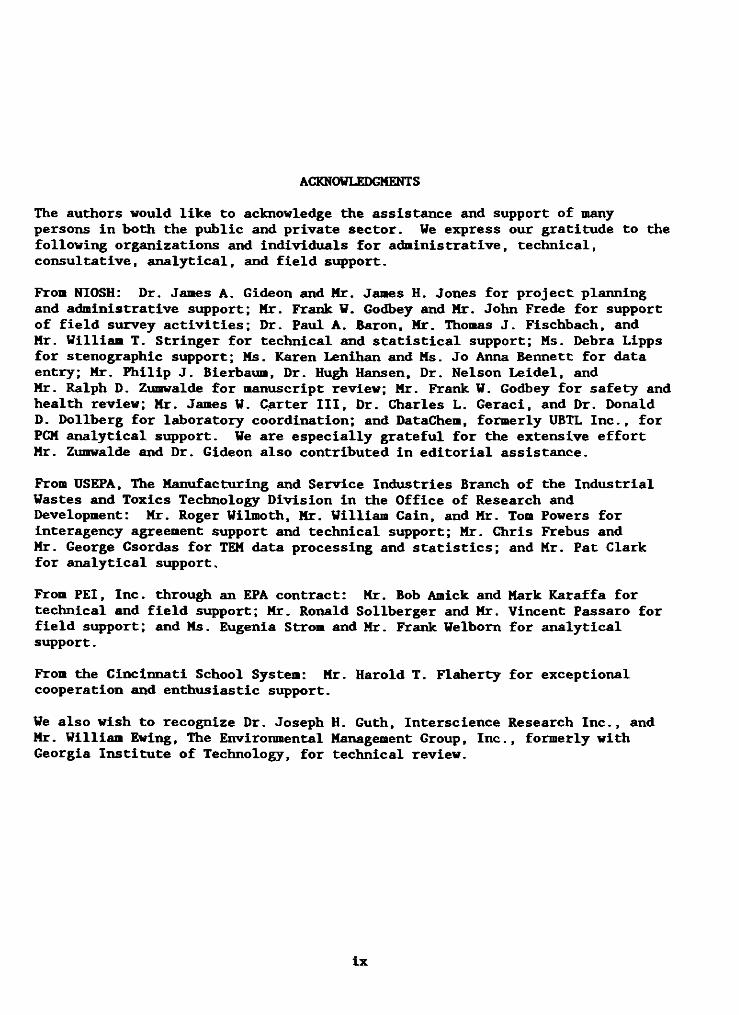
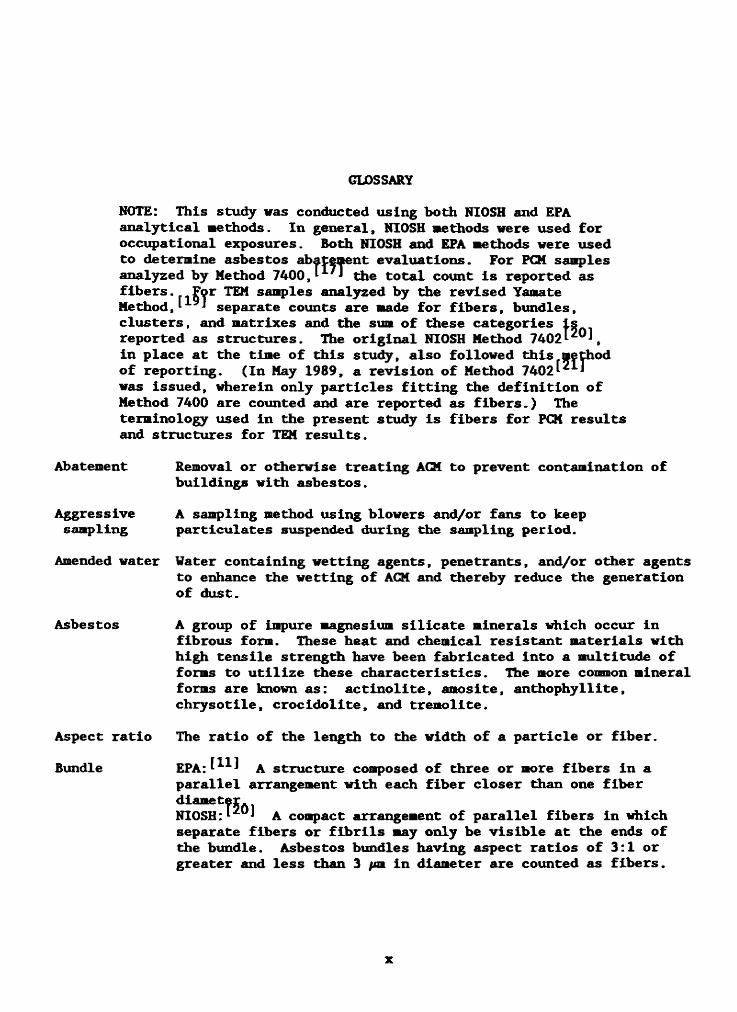
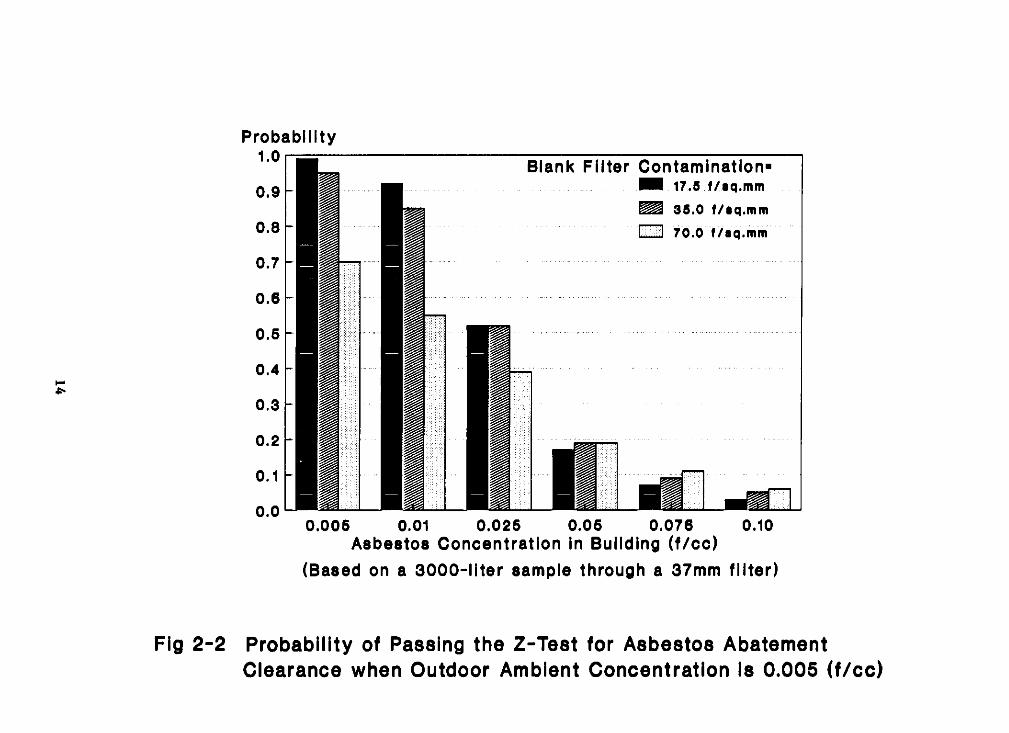
samples vs. outdoor ambient samples. It Is used to determine whether the abatement response action is complete, i.e., if clearance has been achieved for reoccupancy. Powers and Cain reported the probability of passing the Z-test for various room, filter media, and ambient asbestos structure concentrations, as shown in Figures 2-2 and 2-3.I * To illustrate the use of these figures, suppose that the filter media are contaminated with 70 s/mm and a room is cleaned to the 0.005 s/cc (5,000 s/m ) ambient asbestos concentration. The probability of passing is only 70%, whereas if the filter media contamination is less than 17 s/mm , the probability of passing is 99%. Thus the media contamination can lead to false positives for room contamination which would potentially require additional but unwarranted cleaning.As noted above, the ACM in Schools Regulation states that clearance can be achieved without comparing inside samples to the outside samples if the inside samples pass a screening clearance criteria of 70 s/mm . This is done ”... to save analysis costs where airborne asbestos concentration is sufficiently low so that it can not be distinguished from the filter contamination . . . ." *• 'The value, 70 s/mm, is 4 times the analytical sensitivity of the polycarbonate method. The analytical sensitivity is stated to be no greater than 1 fiber in 10 grids, or 0.005 s/cc (5,000 s/m ) for a 37 mm filter.Based on these assumptions, the clearance limit for TEM, using a 3,000 liter sample and a 37 mm filter, is 4 x 0.005 s/cc, or 0.02 s/cc (20,000 s/m ).Ambient asbestos concentrations are usually an order of magnitude lower than this, typically in the range of 0.002 to 0.005 s/cc (2,000 to5,000 s/m3).I31J
13
Probability 1 . 0
0.9
0 . 8
0.7
0 . 6
0.5
0.4
0.3
0 . 2
0 . 1
0 . 00.006 0 . 0 1
Blank Filter Contamination- H i 17.5 f/sq.mm¡HH 35.0 f/ iq.mmi....I 70.0 f/sq.mm
0.025 0.05 0.076 0 . 1 0
Asbestos Concentration in Building (f/cc)(Based on a 3000-liter sample through a 3 7 m m filter)
Fig 2 - 2 P r o b a b i l i t y of P a s s i n g t h e Z - T e s t fo r A s b e s t o s A b a t e m e n t C l e a r a n c e w h e n O u t d o o r A m b ie n t C o n c e n t r a t i o n Is 0 . 0 0 5 ( f / c c )
Ln
Fig 2
Probability 1 . 0
0 . 0 2
Blank Filter Contamination-■ ■ 17.5 f/sq.mm
P H 35,0 f/aq,mm
r~ 1 70.0 f/sq.mm
u p
0.04 0.1 0.2 0.3Asbestos Concentration in Building (f/cc)
Based on a 3000-liter sample through a 37-mm filter
0.4
3 P r o b a b i l i t y of P a s s i n g t h e Z - T e s t fo r A s b e s t o s A b a t e m e n t C l e a r a n c e W h e n O u t d o o r A m b ie n t C o n c e n t r a t i o n is 0 . 0 2 ( f / c c )
3 . SITE AND PROCESS DESCRIPTION
3.1. SITE DESCRIPTIONThis study was conducted In public school buildings typical of those found in a large city. Two roons in each of four schools were selected for the measurement of airborne asbestos concentrations. The roons were visually inspected and found to be fairly dean, having no apparent danage to the pipe lagging and little potential for contanination from the other types of fibers,e.g., textile and cellulose fibers from drapes, carpets, ceiling, etc. These "controlled areas" were isolated to restrict interaction with areas and activities outside the study area. All air ducts, holes, and windows In these roons were sealed with polyethylene sheeting (poly) and duct tape; door openings were sealed off with a two-sheet poly baffle. After sealing the rooms, pre-removal asbestos levels were determined in each room using nonaggressive, then aggressive sampling methods. During ACM removal, personal and area samples were taken to determine asbestos expo stir es of removal workers during these operations. Finally, after the rooms were cleaned, but before final inspection by the removal contractor, nonaggressive and aggressive sampling methods were again used to determine asbestos in each room after the removal was completed.Table 3-1 lists the survey dates and the dimensions of the rooms in which the asbestos abatement was performed and evaluated. The analyses of bulk samples taken from the pipe lagging indicated varying percentages of chrysotile (Table 3-1). No actinolite, tremolite, amosite, or anthophyllite asbestos were detected in these samples. Table 3-2 lists the number and types of pipe fittings and the linear feet of pipe from which lagging was removed at each site. The renovation included concurrent removal of ACM from other areas in the buildings at the time of these surveys. As can be determined by Table 3-2, the amount of pipe lagging removed from the rooms designated for study was roughly 10 to 40% of the total asbestos removal work performed in any one building. Personal and area samples of airborne asbestos were obtained during removal work in a third room in two buildings in order to increase the amount of data collected.3.2. PROCESS DESCRIPTIONAsbestos removal is a complex and labor-intensive task which requires special knowledge, training, experience, and exceptional care to be performed safely. There is a need for careful planning and coordination of the activities involved. If an expert in asbestos removal is not available within the responsible organization, a competent consultant should be engaged to assure that the building owner, occupants, and removal workers are protected by a definitive and complete specification of work and that a reputable asbestos removal contractor is selected. On-site monitoring and control by a
16
TABLE 3*1. AS8EST0S-CONTAINING PIPE LAGGING REMOVAL STUDY
FacilitySurvey Dates Volwe Bulk Sanole AnalysisWalk- Pre- Post- Throui Renoval Reaoval Renoval Dimensions (Cibic Location (Feet) Feet) Chrysotile Cellulose/ Asbestos Other fiber
«1 06/04 06/14 06/18-21 07/09
Room A 35 x 23 x 13.5 10,868
Roo« B 35 x 33 x 12.5 14,438 Room C 116 x 35 x 12.5 50,750
3-inch Pipe Lagging 1%2-inch Pipe Lagging 20-25%
Pipe Lagging 30-35%
#2 06/04 06/12 06/25-28 07/11Room D 33 x 22 x 15 10,890
Room E 41 x 36 x 15 22,140
Pipe Lagging 20-25%
#3 06/04 06/13 07/01-03 07/10
Room F 32 x 23 x 12 8,832
Roon G 42 x 25 x 12 12,000
Airseal lagging 30-40% 40-50%Joint cement 10-15% 1-2%Pipe lagging 10-15% 1-2%
ft 06/04 07/12 07/15-17 07/18
Roon H 29 x 25 x 11 7,975
Room I 30 x 25 x 9 6,750
Room J 29 x 24 x 11 7,656
Pipe lagging 5% 10-15%Pipe lagging 5-7% 2-3%Pipe lagging 20% 10-15%
17
TABLE 3-2 . DESCRIPTION AND LINEAR FEET OF PIPE LAGGING REMOVED
Facility/RooaPine Fittings Pipe Pipe*/ Hangers Swfaces No. No.
Linear Feet Rasowd During Survey Roaoval Contract**Ells TeesNo. No. FlangesNo. Pipe Size 6-in 5-in 4-in 3-in 2-in 1.5-inTotalFeet LinearFeet feMier of loanfAreas
Facility #1Room A 15 5 - 7 7 - - - 45 53 - 98Rogb B 13 5 - 6 5 - 40 - - 25 - 65Roob C 10 5 - 7 4 - - 91 9 25 -Total 288 1800 15Facility #2Roob d 21 7 2 7 6 - 58 - 70 15 - 143Room E 9 4 1 3 6 45 - - 12 2 - 59Room E*** 13 4 1 5 6 30 - - 45 2 - 77Total 279 1230 13Facility #3Roob F 13 6 - 10 9 30 - 15 30 85 - 160Room G 18 6 - 4 8 45 - 15 9 - MTotal 229 2350 12Facility Ktoo H 10 4 - 4 5 - - - 42 9 14 65
Room I 10 5 - 4 9 - 30 - 50 28 5 113Room J 11 6 - 4 6 - * - 50 28 4 82Total 260 710 10
* Intersections of pipe with walls or ceiling.** Total linear feet of asbestos pipe lagging rawwd and mafaer of areas cleaned in each facility.*** Uorfc completed by the rewoval crew prior to the post-fpvat study* but observed by the survey teas. In addition, prostiaately 27* of 6-inch pipe lagging was reportedly rwwwd fr* a storage area adjacent to the original poly enclosure without the use of glove bag control techniques and liiile the poly barriers were open to the control lad area.
1 8
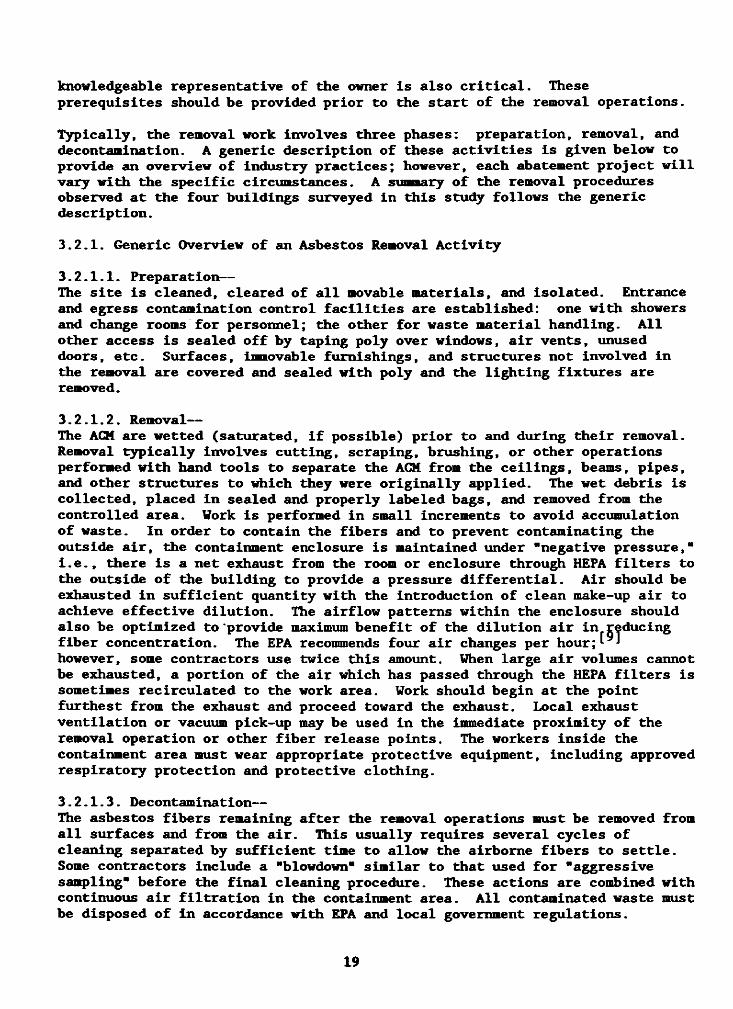
Typically, the renoval work involves three phases: preparation, removal, anddecontamination. A generic description of these activities is given below to provide an overview of industry practices; however, each abatement project will vary with the specific circumstances. A summary of the removal procedures observed at the four buildings surveyed in this study follows the generic description.3.2.1. Generic Overview of an Asbestos Removal Activity3.2.1.1. Preparation—The site is cleaned, cleared of all movable materials, and isolated. Entrance and egress contamination control facilities are established: one with showersand change rooms for personnel; the other for waste material handling. All other access is sealed off by taping poly over windows, air vents, unused doors, etc. Surfaces, imovable furnishings, and structures not involved in the removal are covered and sealed with poly and the lighting fixtures are removed.
know ledgeab le r e p r e s e n t a t iv e o f th e owner i s a l s o c r i t i c a l . Thesep r e r e q u i s i t e s sh o u ld b e p ro v id e d p r i o r to th e s t a r t o f th e rem oval o p e r a t io n s .
3.2.1.2. Removal—The ACM are wetted (saturated, if possible) prior to and during their removal. Removal typically involves cutting, scraping, brushing, or other operations performed with hand tools to separate the ACM from the ceilings, beams, pipes, and other structures to which they were originally applied. The wet debris is collected, placed in sealed and properly labeled bags, and removed from the controlled area. Work is performed in small increments to avoid accumulation of waste. In order to contain the fibers and to prevent contaminating the outside air, the containment enclosure is maintained under "negative pressure,"i.e., there is a net exhaust from the room or enclosure through HEPA filters to the outside of the building to provide a pressure differential. Air should be exhausted in sufficient quantity with the introduction of clean make-up air to achieve effective dilution. The airflow patterns within the enclosure should also be optimized to'provide maximum benefit of the dilution air in reducing fiber concentration. The EPA recommends four air changes per hour; * however, some contractors use twice this amount. When large air volumes cannot be exhausted, a portion of the air which has passed through the HEPA filters is sometimes recirculated to the work area. Work should begin at the point furthest from the exhaust and proceed toward the exhaust. Local exhaust ventilation or vacuum pick-up may be used in the immediate proximity of the removal operation or other fiber release points. The workers inside the containment area must wear appropriate protective equipment, including approved respiratory protection and protective clothing.3.2.1.3. Decontamination—The asbestos fibers remaining after the removal operations must be removed from all surfaces and from the air. This usually requires several cycles of cleaning separated by sufficient time to allow the airborne fibers to settle. Some contractors include a "blowdown" similar to that used for "aggressive sampling" before the final cleaning procedure. These actions are combined with continuous air filtration in the containment area. All contaminated waste must be disposed of in accordance with EPA and local government regulations.
19
3.2.2. Asbestos Removal Practices Observed in this StudyFor the present study, in which only asbestos pipe lagging was removed, glovebags were used as the primary control of asbestos release. Observations are summarized below. Based on these observations, many of the techniques delineated in Section 6 Recommendations should be considered.3.2.2.1. Preparation—The contract for asbestos removal in the buildings that were studied specified the use of glove bags as the primary emission control in lieu of total room containment and ventilation. It also required the installation of polybarriers in stairways and hallways to separate work areas from the rest of thebuilding. Decontamination showers were not required. The floors beneath the pipes being abated were covered with poly to facilitate cleanup, except where concrete floors contained a floor drain. As noted previously, the rooms in which abatement clearance measurements were made were also enclosed in poly barriers, but neither exhaust nor make-up air was supplied to the enclosed areas.
Before starting the removal, the contractor enclosed all of the piping in an envelope fabricated from poly sheeting and duct tape. The surface of the lagging was misted with amended water (water containing wetting agents, penetrants, and/or other agents to enhance the wetting-down process) to control surface dust prior to enclosing it in the poly. A length of poly sheeting was brought up from underneath the pipe and draped over the pipe lagging. The two edges were rolled together and stapled at the top of the lagging to form a loose-fitting, cylindrical envelope around the pipe. Duct tape was used to seal the longitudinal seam and the ends of the envelope to the pipe lagging. Figure 3-1 shows two workers «V-tng an enclosure of poly around a pipe and a room ready for removal activity.3.2.2.2. Removal—Workers donned disposable work clothing and approved respirators before entering areas where the asbestos removal took place. Although the work crew in this study had had experience in the general removal of asbestos, they were not trained in the proper use of glove bags. During the first day of asbestos removal, the glove bags were hung at widely separated intervals and taped to the poly envelope over the pipe lagging with duct tape. The workers did notuse the gloves in the bags, but rather used the bags as receptacles forcollecting the debris. The top of the bag was left open and the workersreached in through the open top to cut away the poly envelope, loosen thelagging and allow it to drop into the bag. The bag was then moved along the pipe and the process was repeated. The lagging was wetted as it was removed from the pipe. Water sprayers (2- to 3-gallon, hand-pump garden sprayers) fitted with 30-inch hoses were elevated to the working level and were often hung from the pipes. This required workers on ladders and platforms to climb down periodically to refill the sprayer with amended water and pump up the pressure. The pipe was washed with water and rags, usually after the bag had been moved to the next location.As the work progressed, the workers learned to better utilize the glove bags based on recommendations from the survey team, on trial and error, on
20
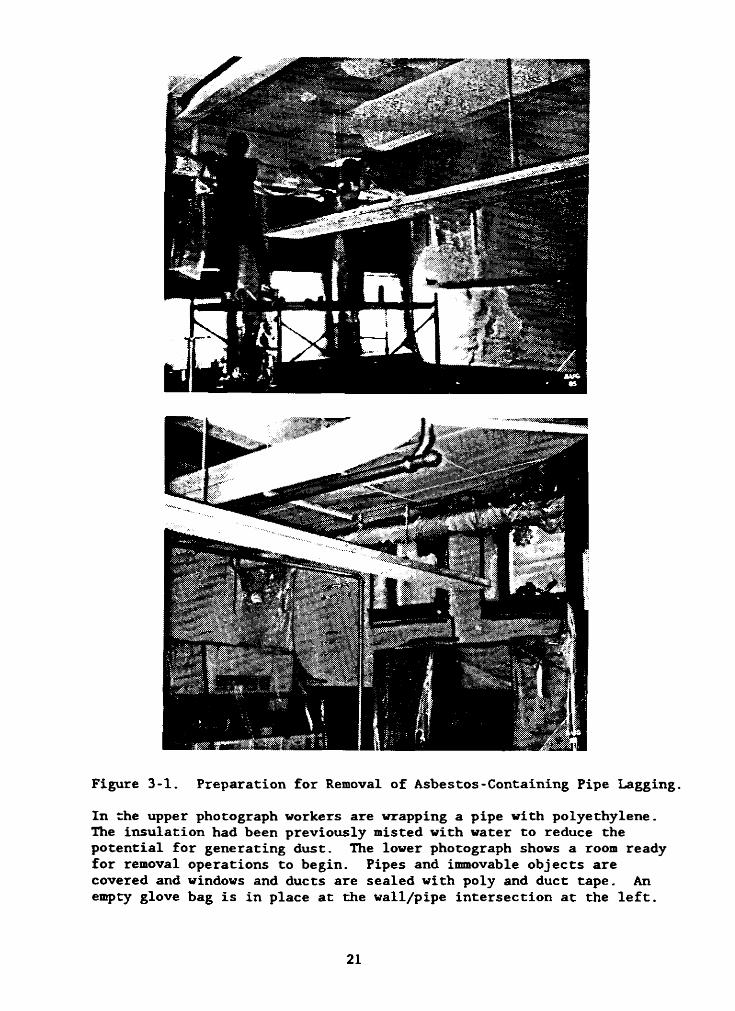
Figure 3-1. Preparation for Removal of Asbestos-Containing Pipe Lagging.In the upper photograph workers are wrapping a pipe with polyethylene. The insulation had been previously misted with water to reduce the potential for generating dust. The lower photograph shows a room ready for removal operations to begin. Pipes and immovable objects are covered and windows and ducts are sealed with poly and duct tape. An empty glove bag is in place at the wall/pipe intersection at the left.
21
videotaped instructions. j J and on training by a National Asbestos Council glove bag instructor. *■ ' Although the study was not designed to providethese instructions, it was the opinion of the NIOSH researchers that much improvement in work practices had been achieved by the end of the study. The following techniques were in general use by the end of the study, and the authors believe them to be appropriate work practices and procedures:
• Tools for cutting metal bands and lagging were placed insidethe glove bag, and the bag was hung from the poly wrapped, lagged pipe. Depending on the type of bag, it was taped or zipped to form a seal along the length of pipe and the bag ends (sleeves) were taped or strapped to the poly-jacketed pipe. The workers preferred to use straps for sealing the bag ends.
• The poly-envelope and metal bands enclosed within the sealedbag were first cut and removed. Then the lagging was wetted, cut longitudinally along the full length of one preformed block, and circumferential cuts were made with a wire saw or blade, preferably at the block joints. The asbestos block was pried apart at the seam, rewetted, and dropped to the bottom of the bag. Amended water was sprayed onto the lagging and the bare pipe within the glove bag was washed clean with wet rags.
• Hard-to-clean places were brushed with a nylon-bristle bottle brush. All work was performed within the bag using the gloves (Figure 3-2). The end sleeve straps were loosened or the sleeves were untaped and the bag was slid along the poly—covered pipe to the next removal site (Figure 3-3).
• The spray nozzles and wands were inserted into the bags through special ports and sealed with duct tape if necessary.They were fitted with 10- to 15-foot hoses, so that the tanks did not have to be elevated to the working level. A support worker, at floor level, refilled the sprayer tank with amended water and pumped up the pressure. It greatly enhanced the ability and inclination of the removal workers to use sufficient wetting for control of fiber emissions.
• After sufficient debris had been collected, the interior surface of the bag was washed down; a HEPA-flltered vacuum system was used to evacuate air from the bag and a strap was used to cinch the bag closed prior to release of the seal and removal from the pipe. The bags were then resealed and then placed in a second bag on which asbestos warning labels were printed. The outer bag was also sealed and subsequently removed for disposal.
3.2.2.3. Decontamination—Spilled material was removed from the floor with a HEPA-filtered vacuum cleaner throughout the shift. As work was completed in each area, the floor was wet mopped. The sealed bags of waste were removed from the enclosure prior to post-removal air sampling, but the poly seals on windows, vents, and doors were kept in place to minimize contamination from other areas and activities.
22
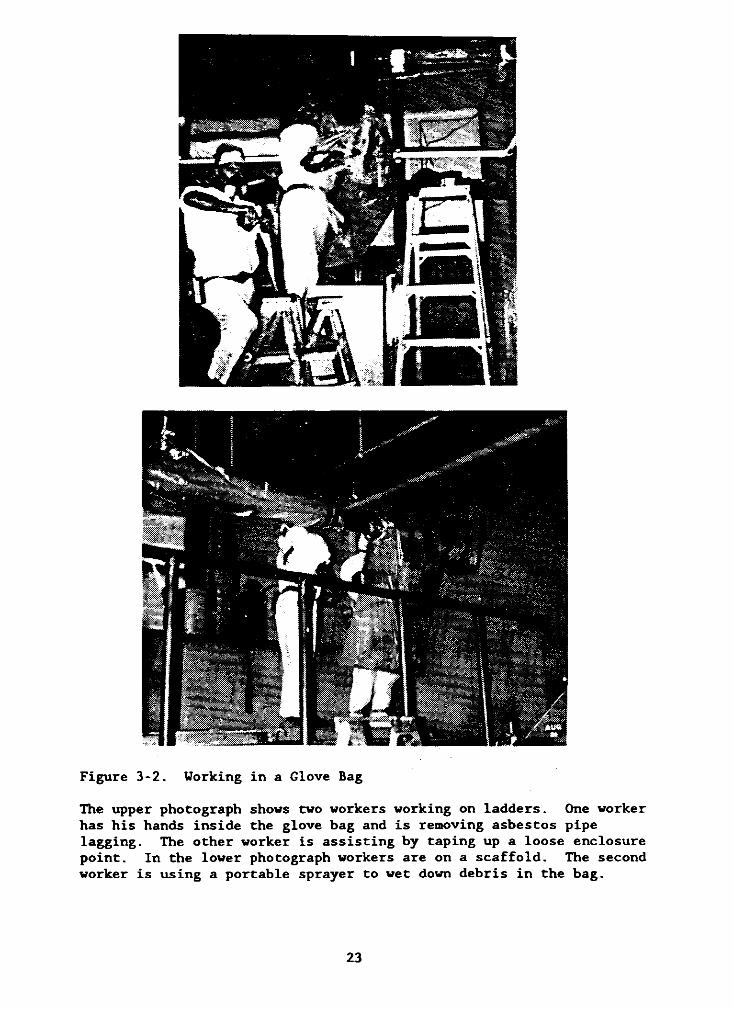
F ig u re 3 -2 . W orking in a G love Bag
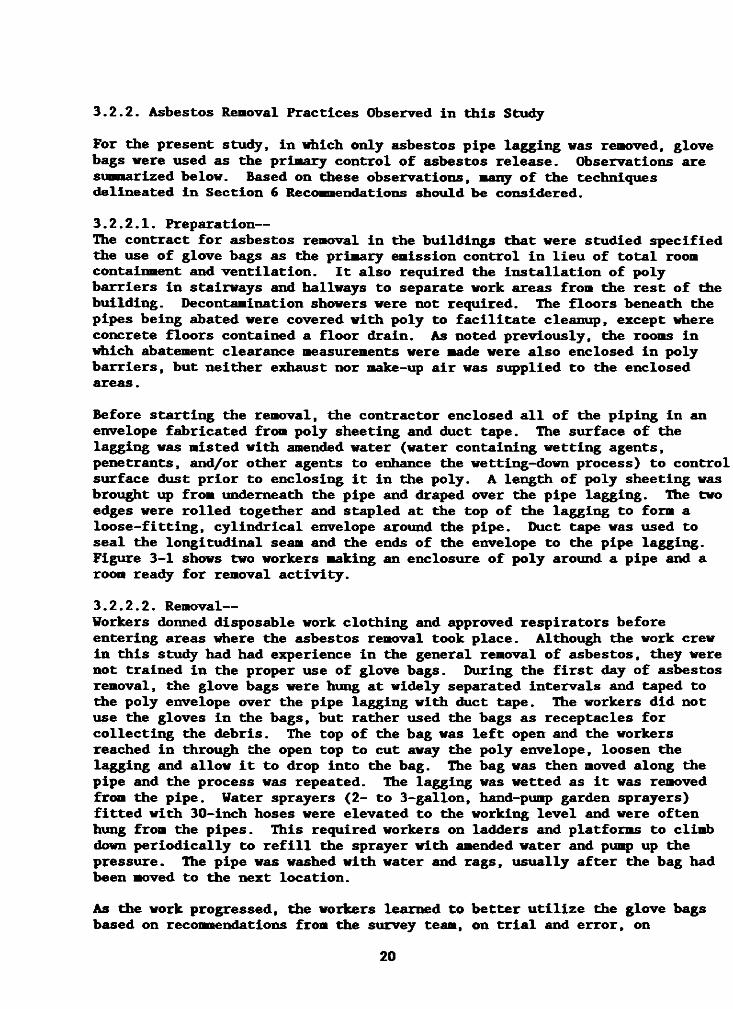
The upper photograph shows two workers working on ladders. One worker has his hands inside the glove bag and is removing asbestos pipe lagging. The other worker is assisting by taping up a loose enclosure point. In the lower photograph workers are on a scaffold. The second worker is using a portable sprayer to wet down debris in the bag.
23
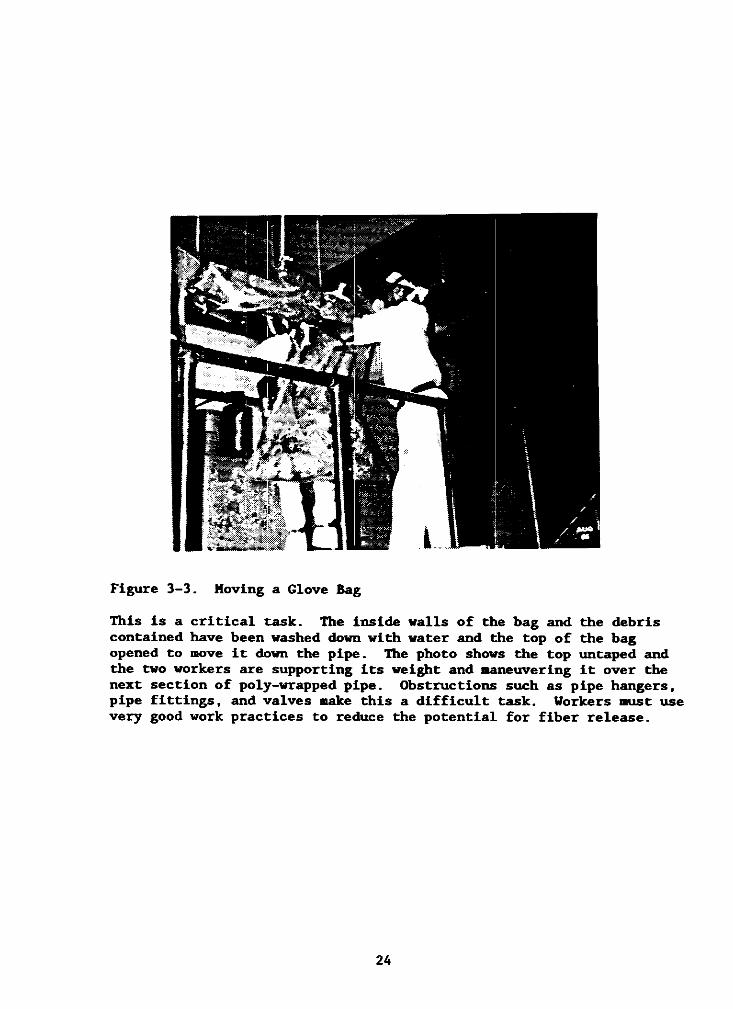
Figure 3-3. Moving a Glove Bag
This is a critical task. The inside walls of the bag and the debris contained have been washed down with water and the top of the bag opened to move it down the pipe. The photo shows the top untaped and the two workers are supporting its weight and maneuvering it over the next section of poly-wrapped pipe. Obstructions such as pipe hangers, pipe fittings, and valves make this a difficult task. Workers must use very good work practices to reduce the potential for fiber release.
24
4 . METHODOLOGY
4.1. AIR SAMPLING STRATEGY4.1.1. OverviewIn order to characterize the effectiveness of containment by glove bags, personal breathing zone (PBZ) samples were collected on workers and area air samples were taken within the work enclosure. Area samples were also taken in adjoining hallways outside the work enclosure to determine the potential interaction with other removal activities occurring outside and within the controlled areas. Ambient samples were taken outside the building to establish background fiber concentrations. To assess the overall efficacy of the asbestos removal and cleanup operations, additional samples were taken prior to and following the completion of the removal work. Because of time constraints, the post-removal samples were collected after initial cleaning by the removal crew, but prior to the clearance testing performed by the contractor.4.1.2. Personal Air SamplesPBZ samples were collected only while workers were actively engaged in site preparation, asbestos removal, and other associated activities including waste collection and disposal, decontamination, and equipment operation and maintenance. Normally, two sequential 2- to 3-hour personal samples were taken daily for each of the four workers to determine time-weighted-average exposures. In addition, six to eight 15-minute, short-term exposure samples were collected during the performance of work tasks. As a result, about 14 to 16 PBZ samples were collected during each 5- to 6-hour work shift.4.1.3. Area Air SamplesArea samples were collected both inside and outside the controlled work area on approximately the same schedule as the personal samples. Two 2- to 3-hour interior samples were collected daily using a cart-mounted, mobile, sampling tree that was positioned proximate to the removal activity. These samples were located so as to provide an indication of the effectiveness of the source controls and the magnitude of exposure during different activities. A similar series of area samples was collected in the middle of the room, away from the workers, during the removal activity to determine the fiber concentration in the room during preparation and removal. Figure 4-1 is a photograph showing both the cart-mounted apparatus used to collect samples proximate to the work site and the stationary sampling tree used to obtain background samples of the general room contamination. Daily samples were collected in the hall adjacent to the survey area, and ambient samples were taken by drawing outside air through filters located in open windows well removed from the work area.
25
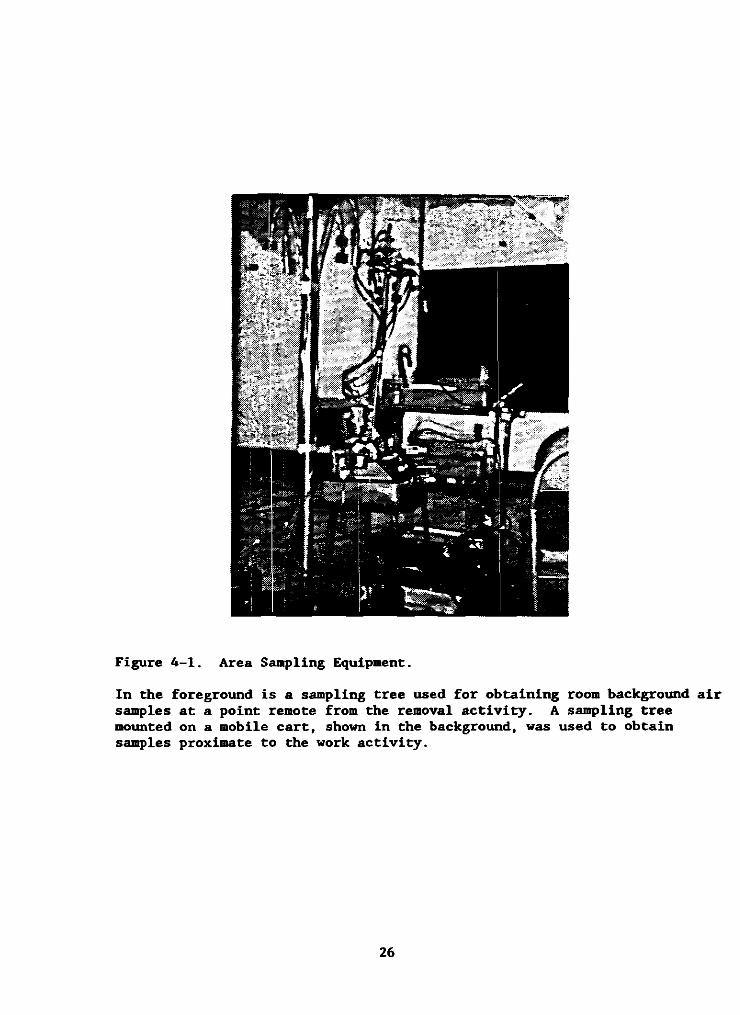
In the foreground is a sampling tree used for obtaining room background air samples at a point remote from the removal activity. A sampling tree mounted on a mobile cart, shown in the background, was used to obtain samples proximate to the work activity.
F ig u re 4 -1 . A rea S a n p lin g Equipm ent.
26
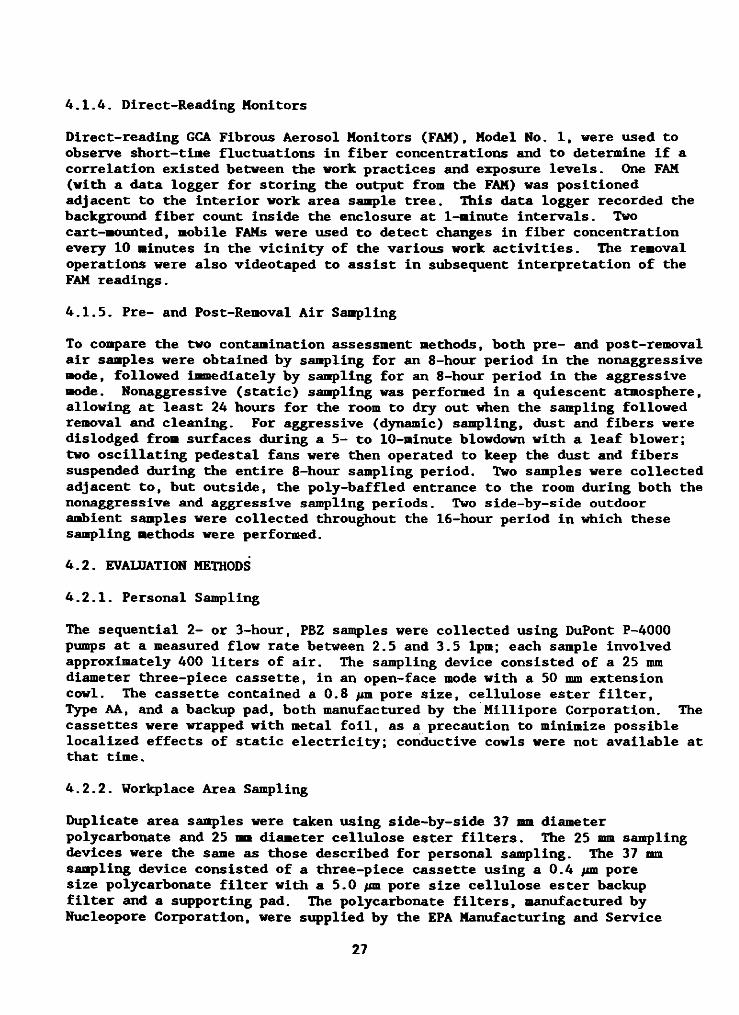
4.1.4. Direct-Reading MonitorsDirect-reading GCA Fibrous Aerosol Monitors (FAM), Model No. 1, were used to observe short-tine fluctuations in fiber concentrations and to determine if a correlation existed between the work practices and exposure levels. One FAM (with a data logger for storing the output from the FAM) was positioned adjacent to the interior work area sample tree. This data logger recorded the background fiber count inside the enclosure at 1-minute intervals. Two cart-mounted, nobile FAMs were used to detect changes in fiber concentration every 10 ninutes in the vicinity of the various work activities. The removal operations were also videotaped to assist in subsequent interpretation of the FAM readings.4.1.5. Pre- and Post-Removal Air SamplingTo compare the two contamination assessment methods, both pre- and post-removal air samples were obtained by sampling for an 8-hour period in the nonaggressive node, followed immediately by sampling for an 8-hour period in the aggressive ■ode. Nonaggressive (static) sampling was performed in a quiescent atmosphere, allowing at least 24 hours for the room to dry out when the sampling followed removal and cleaning. For aggressive (dynamic) sampling, dust and fibers were dislodged fron surfaces during a 5- to 10-minute blowdown with a leaf blower; two oscillating pedestal fans were then operated to keep the dust and fibers suspended during the entire 8-hour sampling period. Two samples were collected adjacent to, but outside, the poly-baffled entrance to the room during both the nonaggressive and aggressive sampling periods. Two side-by-side outdoor ambient samples were collected throughout the 16-hour period in which these sampling methods were performed.4.2. EVALUATION METHODS4.2.1. Personal SamplingThe sequential 2- or 3-hour, PBZ samples were collected using DuPont P-4000 pumps at a measured flow rate between 2.5 and 3.5 1pm; each sample involved approximately 400 liters of air. The sampling device consisted of a 25 mm diameter three-piece cassette, in an open-face mode with a 50 mm extension cowl. The cassette contained a 0.8 pm pore size, cellulose ester filter,Type AA, and a backup pad, both manufactured by the Millipore Corporation. The cassettes were wrapped with metal foil, as a precaution to minimize possible localized effects of static electricity; conductive cowls were not available at that time*4.2.2. Workplace Area SamplingDuplicate area samples were taken using side-by-side 37 mm diameter polycarbonate and 25 mm diameter cellulose ester filters. The 25 mm sampling devices were the same as those described for personal sampling. The 37 mm sampling device consisted of a three-piece cassette using a 0.4 /an pore size polycarbonate filter with a 5.0 m pore size cellulose ester backup filter and a supporting pad. The polycarbonate filters, manufactured by Nucleopore Corporation, were supplied by the EPA Manufacturing and Service
2 7
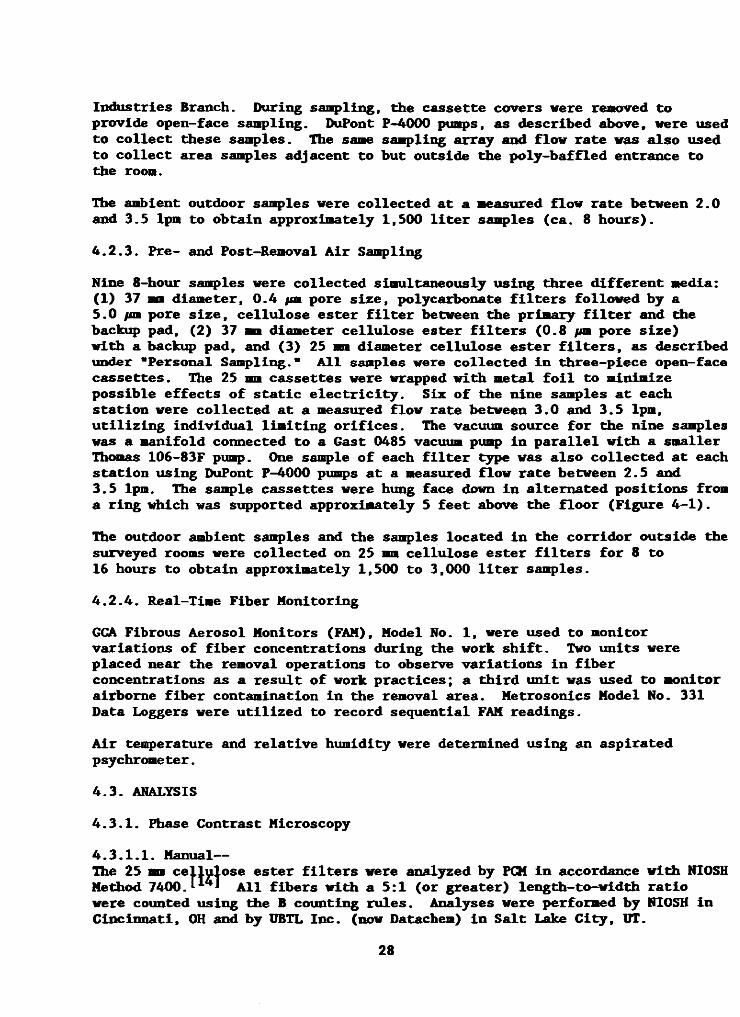
Industries Branch. During sampling, the cassette covers were removed to provide open-face sampling. DuPont P-4000 pumps, as described above, were used to collect these sanples. The same sampling array and flow rate was also used to collect area sanples adjacent to but outside the poly-baffled entrance to the roon.The ambient outdoor sanples were collected at a neasured flow rate between 2.0 and 3.5 lpn to obtain approximately 1,500 liter sanples (ca. 8 hours).4.2.3. Pre- and Post-Renoval Air SamplingNine 8-hour sanples were collected simultaneously three different media:(1) 37 mi diameter, 0.4 /¡m pore size, polycarbonate filters followed by a5.0 /m pore size, cellulose ester filter between the primary filter and the backup pad, (2) 37 ni diameter cellulose ester filters (0.8 job pore size) with a backup pad, and (3) 25 mm diameter cellulose ester filters, as described under "Personal Sampling." All samples were collected in three-piece open-face cassettes. The 25 mm cassettes were wrapped with metal foil to minimize possible effects of static electricity. Six of the nine samples at each station were collected at a measured flow rate between 3.0 and 3.5 lpn, utilizing individual Uniting orifices. The vacuun source for the nine sanples was a manifold connected to a Gast 0485 vacuun pump in parallel with a smaller Thomas 106-83F pump. One sanple of each filter type was also collected at each station using DuPont P—4000 pumps at a measured flow rate between 2.5 and 3.5 1pm. The sanple cassettes were hung face down in alternated positions from a ring which was supported approximately 5 feet above the floor (Figure 4-1).The outdoor ambient samples and the samples located in the corridor outside the surveyed rooms were collected on 25 mm cellulose ester filters for 8 to 16 hours to obtain approximately 1,500 to 3,000 liter samples.4.2.4. Real-Time Fiber MonitoringGCA Fibrous Aerosol Monitors (FAM), Model No. 1, were used to monitor variations of fiber concentrations during the work shift. Two units were placed near the removal operations to observe variations in fiber concentrations as a result of work practices; a third unit was used to monitor airborne fiber contamination in the removal area. Metrosonics Model No. 331 Data Loggers were utilized to record sequential FAM readings.Air temperature and relative humidity were determined using an aspirated psychrometer.4.3. ANALYSIS4.3.1. Phase Contrast Microscopy4.3.1.1. Manual—The 25 mb cellulose ester filters were analyzed by PCM in accordance with NIOSH Method 7400.1 J All fibers with a 5:1 (or greater) length-to-width ratio were counted using the B counting rules. Analyses were performed by NIOSH in Cincinnati, OH and by UBTL Inc. (now Datachem) in Salt Lake City, UT.
2 8
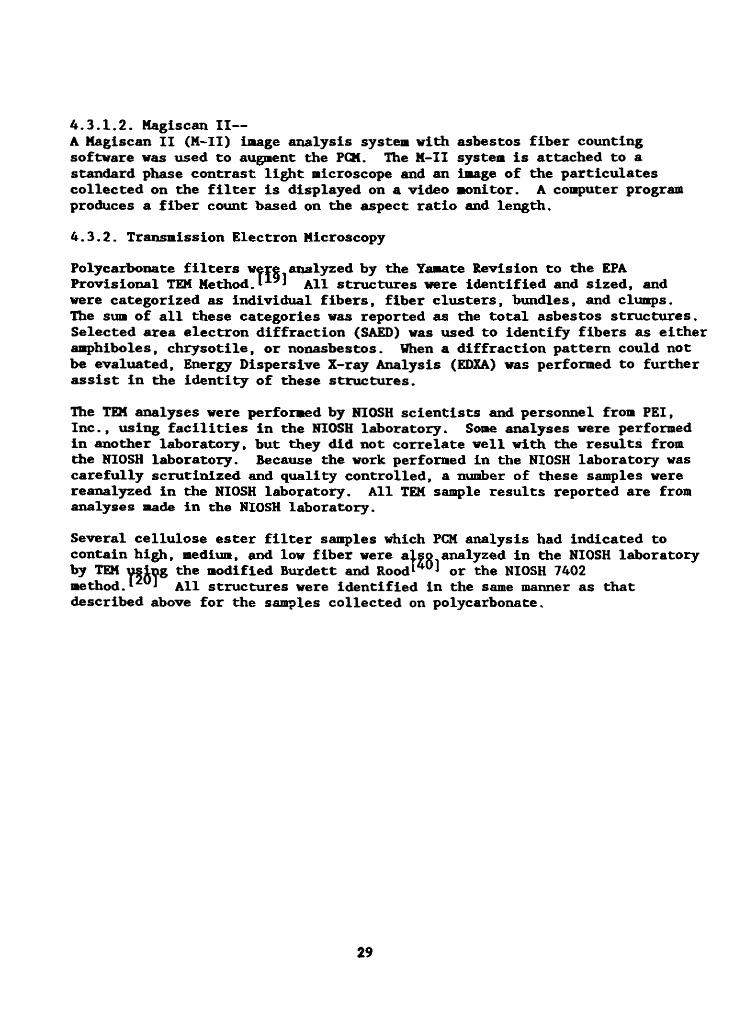
4.3.1.2. Magiscan II—A Magiscan II (M-II) image analysis system with asbestos fiber counting software was used to augment the PCM. The M-II system is attached to a standard phase contrast light microscope and an image of the particulates collected on the filter is displayed on a video monitor. A computer program produces a fiber count based on the aspect ratio and length.4.3.2. Transmission Electron MicroscopyPolycarbonate filters were analyzed by the Yamate Revision to the EPA Provisional TEM Method.I * All structures were identified and sized, and were categorized as individual fibers, fiber clusters, bundles, and clumps.The sum of all these categories was reported as the total asbestos structures. Selected area electron diffraction (SAED) was used to identify fibers as either amphiboles, chrysotile, or nonasbestos. Vhen a diffraction pattern could not be evaluated, Energy Dispersive X-ray Analysis (EDXA) was performed to furtherassist in the Identity of these structures.The TEM analyses were performed by NIOSH scientists and personnel from PEI,Inc., using facilities in the NIOSH laboratory. Some analyses were performed in another laboratory, but they did not correlate well with the results from the NIOSH laboratory. Because the work performed in the NIOSH laboratory was carefully scrutinized and quality controlled, a number of these samples were reanalyzed in the NIOSH laboratory. All TEM sample results reported are from analyses made in the NIOSH laboratory.Several cellulose ester filter samples which PCM analysis had indicated to contain high, medium, and low fiber were also analyzed in the NIOSH laboratory by TEM using the modified Burdett and Rood J or the NIOSH 7402method.^ J All structures were identified in the same manner as thatdescribed above for the samples collected on polycarbonate.
29
5 . RESULTS AND DISCUSSION
5.1. FIELD BLANKS AND LOWER LIMITS OF DETECTIONIn Sections 1 and 2, some of the uncertainties of the analytical methods were discussed. In this section, further delineation of these Issues and how they affected the interpretation of the analytical results is presented.5.1.1. Phase Contrast MicroscopyOnly one of 74 field blanks analyzed by PCM was above the limit of detection (LDD); thus, no correction for fiber contamination of the cellulose ester filters was necessary. The estimated LOD for Method 7400 is 7 fibers/» of filter area J This is equivalent to about 1,500 fibers per filter for25 mm diameter filters and 3,500 fibers per filter for 37 mm diameter filters; thus, for a 1,500 liter sample, the LOD is 1,000 and 2,000 f/m , respectively. When sample results were reported to be "less than the detection limit," a value of one-half of the LOD was used for statistical computations.5.1.2. Transmission Electron MicroscopyAs discussed in Section 2.2, two problems affecting the validity of TEM analyses were identified by the EPA: high interlaboratory variability ofanalytical results and asbestos contamination of the polycarbonate sampling media during manufacture. Both of these problems were encountered in the present study. First, analysis of samples obtained from two of the buildings surveyed and analyzed in the EPA laboratory were reported to have very low fiber counts and many were reported nonde tec table. When reanalyzed in the N10SH laboratory, substantial numbers of fibers were found. Second, the analyses of the blank polycarbonate filters from this study exhibited the same range of asbestos contamination as did the polycarbonate filters supplied by the EPA to other laboratories (illustrated in Figure 1). To overcome this difficulty and to reduce the cost of analyses, the EPA has assumed that for clearance purposes the contamination level of the filter media is 70 f/mm .A 37 mm filter has an effective collection area of 855 mm ; therefore, for the contamination level assumed, about 60,000 fibers per filter, the LOD for a3,000 liter sample is 20,000 f/m .5.2. CONFIDENCE LIMITS5.2.1. Phase Contrast MicroscopyFor PCM fiber analysis, the coefficient of variation, CV (also known as the relative standard deviation, RSD), has two components. One component of the CV for counting randomly (Poisson) distributed fibers on a filter surface is a function of the number of fibers counted. This is related to the sample loading (the number of fibers on the filter) and, hence, the CV m ay differ for
30
each sample collected. The other component of the CV, termed the subjective component of variability, is a function of differences in the counts of the analyst(s) due to the amount of training and experience of the microscopist, differences in microscope equipment, and quality assurance practices.The two laboratories used in this study showed a PCM analysis correlation coefficient of 0.91 and an inter laboratory coefficient of variation of 0.41 was demonstrated based on a 25-sample comparison. Additional discussion of inter laboratory comparability is included in NIOSH method 7400 A * Because of the wide variation of inter laboratory results and in the absence of a known CV between laboratories, a value of 0.45 is used in this method for the subjective component of variability. A graph is included in the method to illustrate the interlaboratory precision of fiber counts, whereby a 90% confidence interval on the mean count can be estimated from a single sample fiber count. Immediately preceding the graph, it is stated that ". . . a further approximation is to simply use +213% and -49% as the upper and lower confidence values of the mean for a 100 fiber count." These percentages can be applied directly to the air concentrations as well.Table 5-1 was prepared to demonstrate the range of upper and lower 90% confidence limits which would be expected if a group of laboratories having an interlaboratory CV of 0.45 analyzed identical samples. The table shows the confidence limits for a 10 grid or 100 fiber count. (Part A of Table 5-1 is for use with 25 mm filters and Part B is for 37 mm filters.) Because the range varies with the number of fibers counted and the sample volume, computations were also made for several fiber counts using the three sample volumes that are relevant to the present study: 400 liters, the approximate volume collectedfor personal samples; 1,500 liters, for pre- and post-removal and daily ambient samples; and 2,500 liters, for ambient samples. These tables may be used to approximate the range of values to be applied with 90% confidence when interpreting the results of individual samples analyzed by the same laboratory with respect to an occupational exposure or clearance standard.5.2.2. Transmission Electron MicroscopyAn intralaboratory CV of 0.35 was calculated for the fiber analysis by TEK used in this study. In general, there is insufficient experience with TEH to fully establish interlaboratory confidence limits. EPA has reported results of similar studies which indicate an overall CV of about 1.5 with an analytical component of about 1.0. The assumptions used in the preparation of the range of PCM confidence limits presented in Table 5-1 may not hold for the greater variability associated with TEM. To provide some insight as to how a CV of 1.5 affects the 90% confidence limits, it is assumed, for the purpose of illustration, that the (natural) logarithm of the asbestos counts as determined by TEM is normally distributed. If tills is the case, then the approximate 90% confidence limit for a true mean count of 1,250,000 f/m by TEM on a 37 mmfilter would be 378,000 to 13,500,000 f/m3. As seen in Table 5-1, thecorresponding interval for a 1,250,000 f/m PCM count on a 37 mm filter is638,000 to 3,913,000 f/m . These intervals are an indication of theuncertainty that can arise when interpreting the result of a single field sample with respect to an exposure or clearance standard.
3 1
TABLE 5-1- 90S CONFIDENCE LDIITS FOR A SINGLE POI ANALYSIS NT NIOSM HETNOD 7400-«(ASSUMING AN INTERLABGRATCRT SUBJECTIVE OWJHEBT OF .45)FiberscomtecV Fiberspw Factor for: Louer Itoper Mean ml {Jtange} 90X Confi<of Fiber Concentrations (f/k}) irittiin fence Liait» fior Sanie Volumes:10D grids Filter Liait Liait 400 liters 1500 liters 2500 liters
A. LIMITS FOR 25-a CEILWOSE ESTER FILTERS• 500,500 0.51 3.13 1,251,000 {638,000 - 3,916,000} 334,000 (170,000 - 1,0(5,000} 200,000 (102,000 - 626,000}100 49,045 0.51 3.13 123,000 <63,000 - 385,000} 33,000 (17,000 - 103,000} 20,000 00,000 - 63,000}50 24,522 0.51 3.18 61,000 01,000 - 194,000} 16.000 €8,000 - 51,000} 10,000 €5,000 - 32,000}10 4,904 0.43 3.57 12,000 15,000 - 43,000} 3,000 (1,000 - 11,000} 2,000 (1,000 - 7,000}7(NIOSH La 3,433) 0.40 3.78 9,000 (4,000 - 34,000} 2,000 (1,000 - 8,000} 1,000 (0 - 4,000}3 | 1.471 (UBTL LCD)
10.31 4.66 4,000 (1,000 - 19,000} 1,000 (0 - 5,000} 1,000 (0 - 5,000}
B. LIMITS FOB 37-m miUOSF ESTER FILTERS• 1,111,500 0.51 3.13 2,779,000 (1,417,000 - 8,698,000} 741,000 078,000 ~ 2,319,000}
445,000 <227,000 - 1,393,000}460 500,000 0.51 3.13 1,250,000 (638,000 - 3,913,000} 333,000 (170,000 - 1,042,000} 200,000 (102,000 - 626,000}100 108,917 0.51 3.13 272,000 (139,000 - 851,000} 73,000 <37,000 - 228,000} 44,000 <22,000 ' 138,000}50 54,459 0.51 3.18 136,000 <69,000 - 432,000} 36,000 (18,000 - 114,000} 22,000 (11,000 - 70,000}10 10,892 0.43 3.57 27,000 (12,000 - 96,000} 7,000 (3,000 - 25,000} 4,000 (2,000 - 14,000}7(NIOSM La 7,624>) 0.40 3.78 19,000 (8,000 * 72,000} 5,000 (2,000 - 19,000} 3,000 (1,000 - 11,000}3 | 3,268 (UBTL LCD) 0.31 4.66 8,000 (2,000 - 37,000} 2,000 (1,000 - 9,000} 1,000 (0 - 5,000}
* Naxiu Allowed Loadiig ■ 1300 fibers/sq wm.
32
5 .3 . SAMPLING RESULTS
Subsequent tables summarize data from the four survey reports.( )Appendix A consists of the tables Included in each of the facility reports.The tables in Appendix A are based on analytical data obtained by PGM and Magi scan II, tabulated in Appendix B, and by TEH, tabulated in Appendix C.5.3.1. Work Activity SamplesAlthough this study was not undertaken to determine compliance with asbestos standards, the OSHA PEL (200,000 f/m3) and the NIOSH REL (100,000 f/m3) concentrations are used in the following discussion as points of reference.5.3.1.1. Personal Samples—Daily time-weighted-average (TWA) asbestos concentrations for each worker at each facility are shown in Table 5-2. The TWA values reported are the sum of two sequential samples (morning and afternoon of the same day) averaged over the total time of the sampling periods (approximately 5 to 6 hours):TWA — (C x T + C__ x T__) / (T__ + T__); C — Concentration, T — Time, am am pm pm ' am pm' *
If one or both of the daily samples were overloaded with particulates so that the fibers could not be counted, the TWA exposures were not calculated. The normal workday consisted of one half-shift (morning) of preparation and one half-shift (afternoon) of removal activities. However, on 4 days (6/20, 6/26, 6/28, and 7/2) both shifts were spent in removal activities and on 4 other days (6/21, 7/3, 7/16, and 7/17) the crew only worked a half shift doing removal activities. As would be expected, the TWA concentrations appear to be somewhat higher on these days (except at Facility 1 on 6/21). Figure 5-1 illustrates the range of the TWA exposures, whereas Figure 5-2 illustrates exposures due to preparation and removal activities, separately.Included in Table 5-2 are daily area sampling results calculated as a TWA in the same manner as the personal samples. The "Prox" samples were taken proximate to the work activity; the "Dist“ samples were taken in the middle of the room at a distance from the work activity. The average concentrations of the personal samples and both types of area samples on any given day are not statistically different (at the 5% significance level), although the actual personal sample measurements are usually somewhat higher.The upper confidence limits for the PBZ samples were below the 2.0 f/cc (2,000,000 f/m ) OSHA PEL in effect at the time of this study. However, only exposures which occurred in Facility 4 were below the current PEL of 0.2 f/cc (200,000 f/m ). The average TWA exposure over the 3 or 4 days worked in each facility are shown in Table 5-3. Of the 45 daily TWA exposures, 3 (7%) were in excess of 626,000 f/m , 17 (38%) were in excess of 313,000 f /m , and 27 (60%) were in excess of 200,000 f/m , only 13 (29%) were less than 100,000 f/m3.
Table 5-4 shows the average fiber concentrations, as analyzed by PCM, for each room during the preparation activities. These concentrations averaged about20,000 f/m . As shown in Table 5-5, fiber concentrations during removal
33
TABLE 5-2. MILT TIM SWLES DURING ASBESTOS ABATBEKTDate/ Concentration (f/tr) Date/ Concentration if/a*)Activity Worker TUA* Pro«* Di st# Activity Worker Tim* Prax* Dist*
Facility 1 Facility 26/18 A 250,000 6/25 A 30,000Half Shift B - Half Shift B 340.000Preparation C - Preparation C 220,000Half Shift 0 210,000 Half Shift D -Reaoval Avfl 230,000 190.000 220,000 Reaoval Avg 200,000 270.000 310,0006/19 A 300,000 6/26 A -
Half Shift B 100,000 Full Shift B 350.000Preparation C 250,000 Reaoval C -Half Shift D 320.000 0 290,000Reaoval Avg 240,000 240.000 2(0,000 Avg 320.000 140,000 170,0006/20 A 470.000 6/27 A -
Full Shift B 330,000 Half Shift B -Reaoval C 490,000 Preparation C 310,000D 310,000 Half Shift D -
Avg 400,000 270.000 260,000 Reaoval Avg 310.000 200,000 -6/21 A 170.000 6/28 A 250,000Half Shift B 120,000 Full Shift B 200,000Reaoval C 120,000 Ranval C 350,000D 150,000 D -
Avg 140,000 110,000 110.000 Avg 270,000 170,000 180.000Facility 3 Facility 4
7/1 A 350,000 7/15 A 11,000Half Shift B 300,000 Half Shift B 10,000Preparation C 340,000 Preparation C 3,000Half Shift D 160,000 Half Shift D 13,000Reaoval Avg 290,000 230.000 220.000 Rwwal Avg 9,000 7,000 8.0007/2 A 550,000 7/16 A 15,000Full Shift B 560,000 Half Shift B 13,000Reaoval C 660,000 Rcamal C -
D 640,000 D -Avg 600,000 620.000 630,000 Avg 14,000 13.000 32.000
7/3 A 800,000 7/17 A 9,000Half Shift B 410,000 Half Shift B 5,000Reaoval C 480,000 Reaoval C 8,000D 610,000 D 10,000Avg 570.000 620,000 550,000 Avg 8.000 4.000 9.000
* Tiae-Uei jited Average over actual wrfcing tine * 4 to 6 hours.+ Average of are* saaples taken prariaate to rwwal operations.# Average of area saaples taken in the row but at a distance frca operations
34
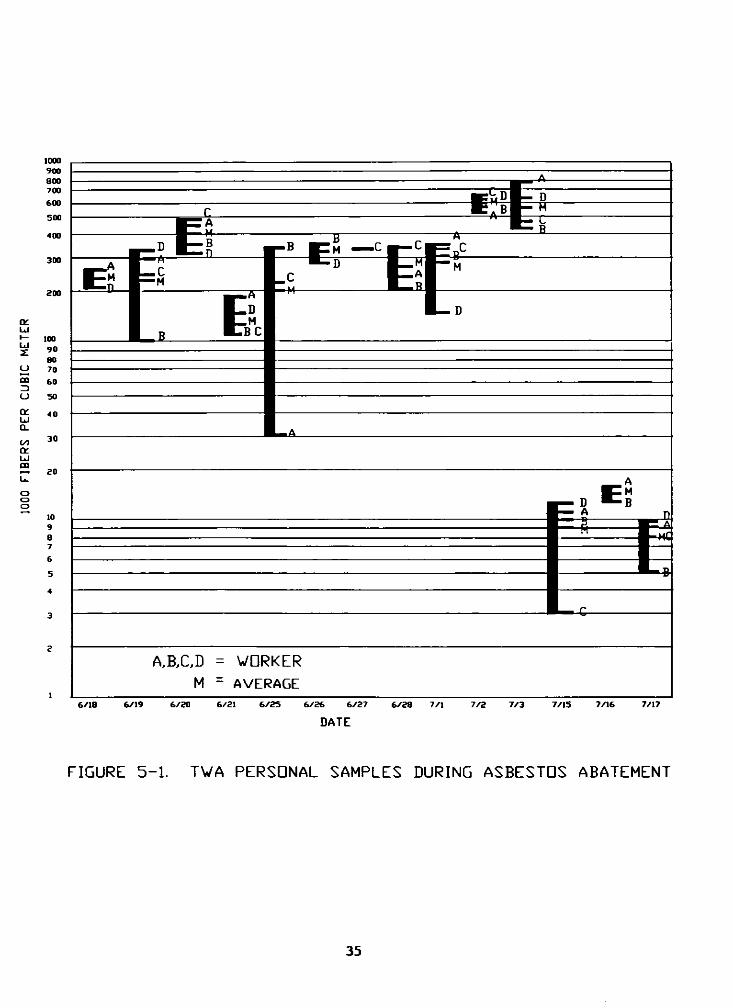
1000
FIBER
S PE
R CU
BIC
METE
R
1000900800700600500
300
200
10090807060
50
40
30
I
ÈDM
B C
E m — <n
- CM-
20
A,B,C,D = WDRKER M = AVERAGE
6 /1 8 6 /1 9 6 /2 0 6 /21 6 /2 S 6 /2 6 6 /2 7 6 /2 8 7 /1 7 /2 7 /3 7 /15 7 /16 7/17
DATE
FIGURE 5-1. TVA PERSONAL SAMPLES DURING ASBESTOS ABATEMENT
35
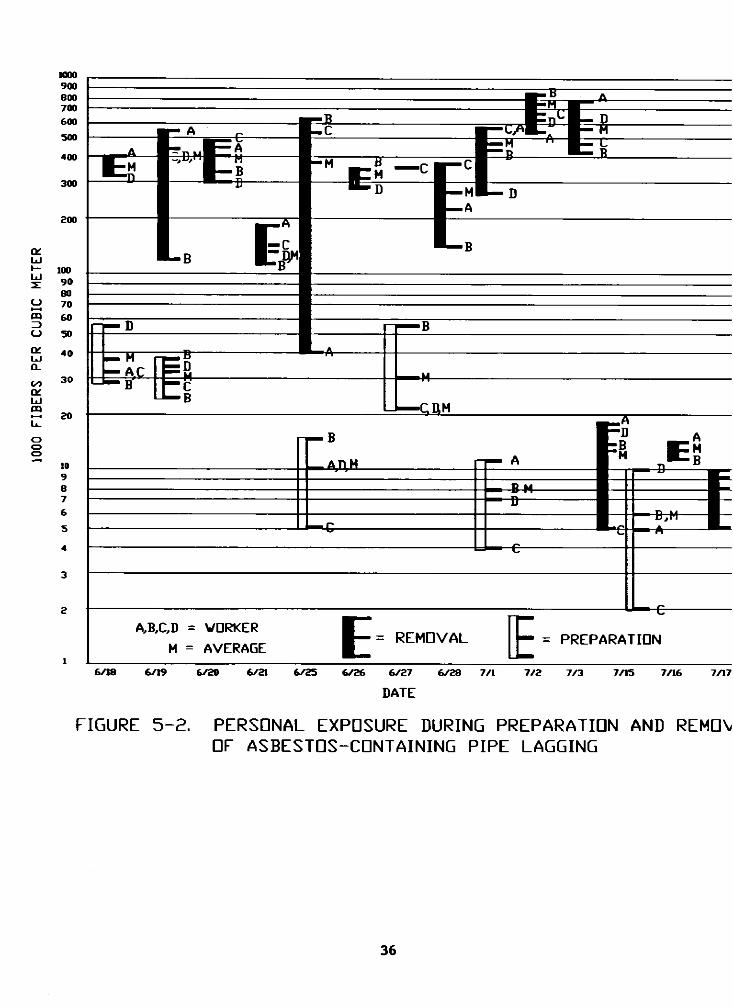
1000 FIB
ERS PER CUBIC
METER
1000900800700600500
400
300
20 0
1009080706050
40
30
2 0
FIGURE 5 - 2 . PERSONAL EXPOSURE DURING PREPARATION AND REMDN, □F ASBESTOS-CONTAINING P IP E LAGGING
36
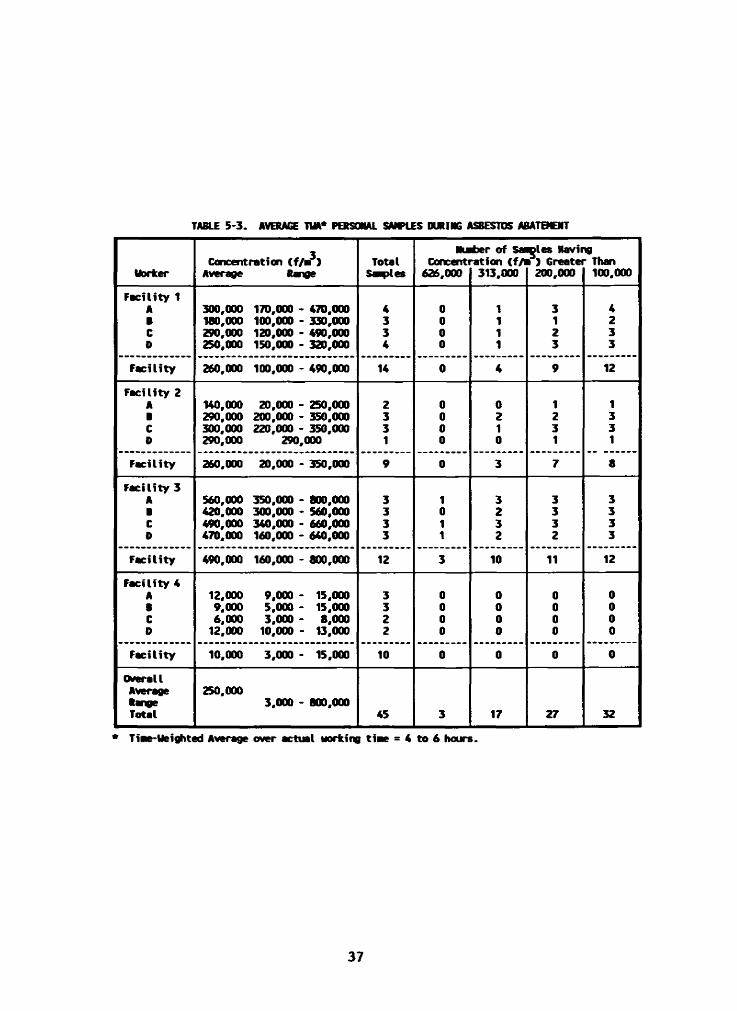
TABLE 5-3. AVERAGE TUA* PERSONAL SAMPLES DURING AS8ESTDS ABATEMENT
Worker Concentration (f/ri*) Average Range TotalSauriesNuConcenti626,000Éjer of Sa ration if/% 313.000
nles Havii • ) Great« 200,000>0■ Than 100,000
Facility YA 300,000 170,000 - 470.000 4 0 1 3 4B 180,000 100,000 - 330,000 3 0 1 1 2C 290,000 120,000 - 490,000 3 0 1 2 3D 250,000 150,000 - 320,000 4 0 1 3 3Facility 260,000 100,000 - 490,000 14 0 4 9 12Facility 2A 140,000 20,000 - 250,000 2 0 0 1 1B 290,000 200,000 - 350,000 3 0 2 2 3C 300,000 220,000 - 350,000 3 0 1 3 3D 290,000 290,000 1 0 0 1 1Facility 260,000 20,000 - 350,000 9 0 3 7 8Facility 3A 560,000 350,000 - 800,000 3 1 3 3 3B 420.000 300,000 - 560,000 3 0 2 3 3C 490,000 340,000 - 660,000 3 1 3 3 3D 470,000 160,000 - 640,000 3 1 2 2 3Facility 490,000 160,000 - 800,000 12 3 10 11 12Facility 4A 12,000 9,000 - 15,000 3 0 0 0 0B 9,000 5,000 - 15,000 3 0 0 0 0C 6,000 3,000 - 8,000 2 0 0 0 0D 12,000 10,000 - 13,000 2 0 0 0 0Facility 10,000 3,000 * 15,000 10 0 0 0 0OverallAverage 250,000Range 3,000 - 800,000Total 45 3 17 27 32
* Tiae-Ueighted Average over actual working tiae = 4 to 6 hours.
37
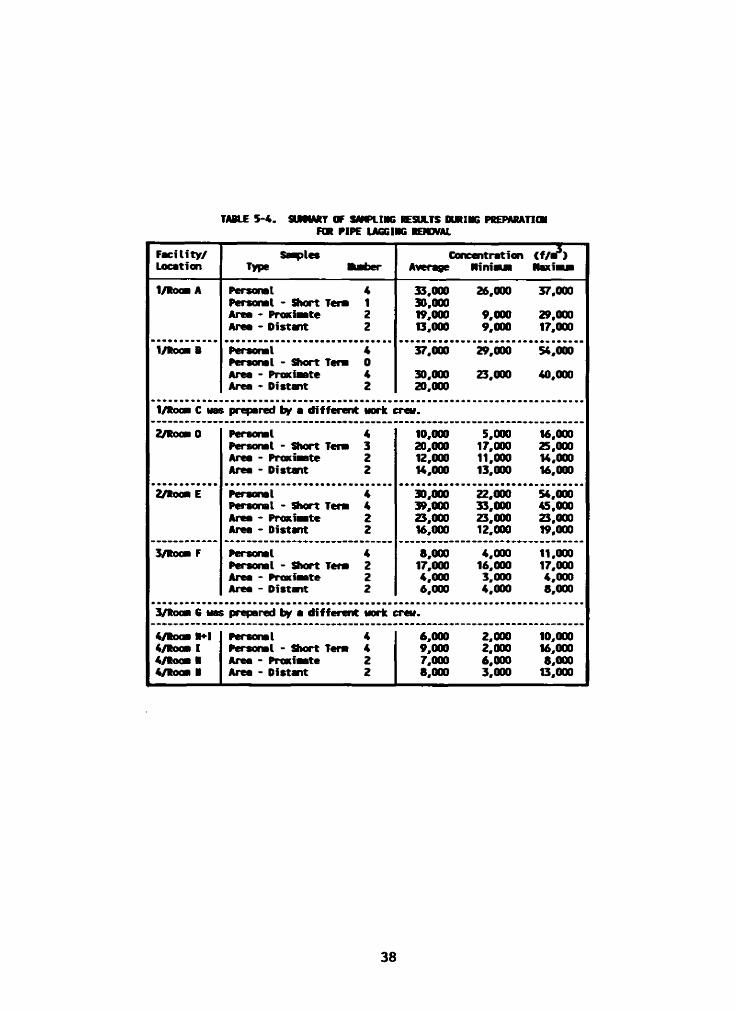
TABLE 5-4. SUMMIT OF SAMPLING RESULTS DURING PREPARATION FOB PIPE LAGGING REMOVALFacility/Location Samples Type Mafcer Concentration Average Mi nisua < f /Allaxi mm
1/Rooa A Personal 4 33,000 26,000 37,000Personal - Short Tera 1 30,000A m * Prcatiaate 2 19,000 9,000 29,000Area - Distant 2 13,000 9,000 17,0001/Rooa B Personal 4 37,000 29,000 54,000Personal - Short Ten 0Area - Pnwiaate 4 30,000 23,000 40,000Area * Distant 2 20,0001/Rooa C was prepared by a different work crew.2/Rom 0 Personal 4 10,000 5,000 16,000Personal - Short Tera 3 20,000 17,000 25,000Area - Prtwiaate 2 12,000 11,000 14,000Area - Distant 2 14,000 13,000 16,0002/Rooa E Personal 4 30,000 22,000 54,000Personal - Aort Tera 4 39,000 33,000 45,000Area * Proxiaste 2 23,000 23,000 23,000Area - Distant 2 16,000 12,000 19,0003/Roca F Personal 4 8,000 4,000 11,000Personal - Short Tern 2 17,000 16,000 17,000Area * Prootiaate 2 4,000 3,000 4,000Area - Distant 2 6,000 4,000 8,0003/Roca G was prepared by a different work crew.4/Rota N*I Personal 4 6,000 2,000 10,0004/Roan I Personal - Short Tern 4 9,000 2,000 16,0004/Roca ■ Area - Prootiaate 2 7,000 6,000 8,0004/Roaa ■ Area - Distant 2 8,000 3,000 13,000
38
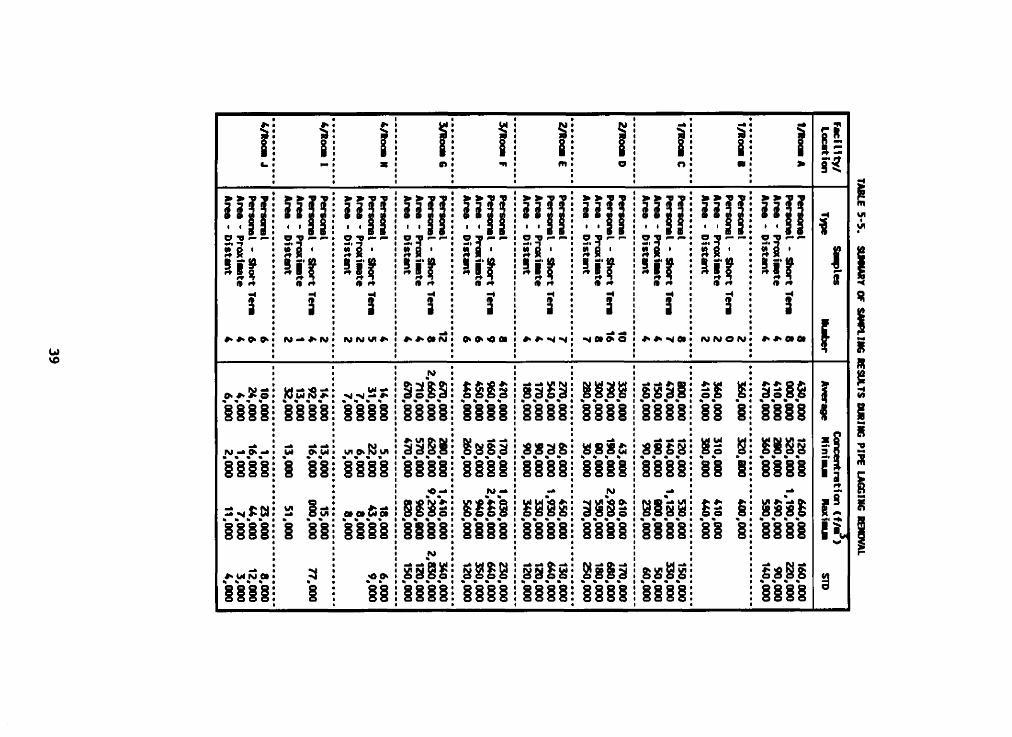
W
i l! ?
22% IO 8 8 ' 5 1 ?
** 0» *
fi K f i8 8 1 Si’S?
► j
' ' § 3w' 6 •
1 »<* »*I
> > 22
> > 22
sirA *3
i r*1!
I■ifIt rt
ni f m
i
ilHlf> > 22 22
I V
' 1 1
i
tst — * IV im ro
H?<•
N N O N
?
Ml <* #*I
*■>*■> m e »
ru ^ 0> *>«»o KIm » « * *
W O' w
1 i i2 i s § i l
K
fccS
3SS8i l i l
m i
i i s ' i
sa 'gS
ISIS « » « « § § § §
| g £ § • * * * S83S% m m *
g § 2 3§ 1 1 1
888fi
I 2 a §% % m %
g i £ § • % » * 1 1 1 1
S2SB « * « «
£S§S' i l l ' s
S a l s % « % «
3SS£w * * *
1 1 1 1
2 g § 3 « « « «
88S8i i i i
s i i si l i l
s s S s
SS 8 i i 1
Si § « * * §1 §
I s I i i 1
§§1Si l i l
S88Si l i l
S i ' i l * % « « 1 1 1 1
s s S S % % % %
E
ri
TABLE 5-5. SUMARY OF SAMPLING RESULTS DURING PIPE LAGGING REMOVAL
operations averaged about 350,000 f/m and were an order-of-magnitude greater than exposures observed during preparation, except in Facility 4.Results fron the 15-minute, short-ter« samples are also shown in Tables 5-4 and 5-5. Of the 70 short-term samples reported in Table 5-5, 15 (21%) exceeded1,000,000 f/m . The highest exposure exceeded 9,000,000 f/m . This occurred during the second day at Facility 3 when a 10-foot section of lagging suddenly separated from the pipe and fell into the poly envelope. A worker cut the envelope to reach in and push large pieces of lagging into the glove bag at the end of the envelope. Although this action was quickly curtailed and the envelope was resealed with tape, the personal exposures were undoubtedly elevated by this episode. Exposures would certainly have been even higher had the lagging fallen to the floor and shattered.All of the above fiber concentrations were determined by PCM. In order to provide a comparison with TEH analyses, 16 PBZ samples collected on cellulose ester filters in Facility 1 were analyzed by both PCM and by TEH. These were selected to include two sequential daily samples for each worker and also to provide a variety of high to low concentrations as determined by PCM; the results are compared in Table 5-6. The TEH analyses reported for total asbestos structures indicate levels an order-of-magnitude higher than for the fibers reported when the same samples were analyzed by PCM. The sample collected on 6/18 for fforker B, erroneously reported to be <L0D, was later found to be actually obscured by particulate so that the fibers could not be counted by PCM. Particulate did not obscure asbestos structures for the TEH analysis because of the greater power of resolution.5.3.1.2. Area Samples—As stated previously, the results of area samples analyzed by PCM indicated fiber concentrations of the same magnitude as the PBZ samples collected during removal; this is shown in Tables 5-2 and 5-5.The fiber concentration measured by the area samples taken in the corridors adjacent to the poly-baffled door openings varied greatly in relation to the interior area samples (Appendix A, Tables 3A-1 through 4A-4). The frequency ofentry and exit through the baffles should affect these sampling locations. Inaddition, activities including asbestos removal were taking place in other parts of the building. However, with one exception, all were lower (from 5% to 67%) than concentrations measured within the rooms during asbestos removal operations, indicating that the poly baffles were fairly effective in controlling the escape of airborne fibers released in the survey rooms. Twenty four of twenty eight ambient samples taken outside the buildings were below the L0D (1,000 to 2,000 f/m3).5.3.1.3. Discussion of Work Activity Exposure ResultsData shown in Tables 5-2 through 5-5 indicate that during the preparation (covering) of the pipe lagging workers were exposed to relatively low concentrations of airborne asbestos. In the rooms included in this survey, most of the pipe lagging was In good condition. In other situations, where lagging is deteriorated or damaged, it is quite probable that higherconcentrations of airborne asbestos would be encountered during theseoperations.
3
40
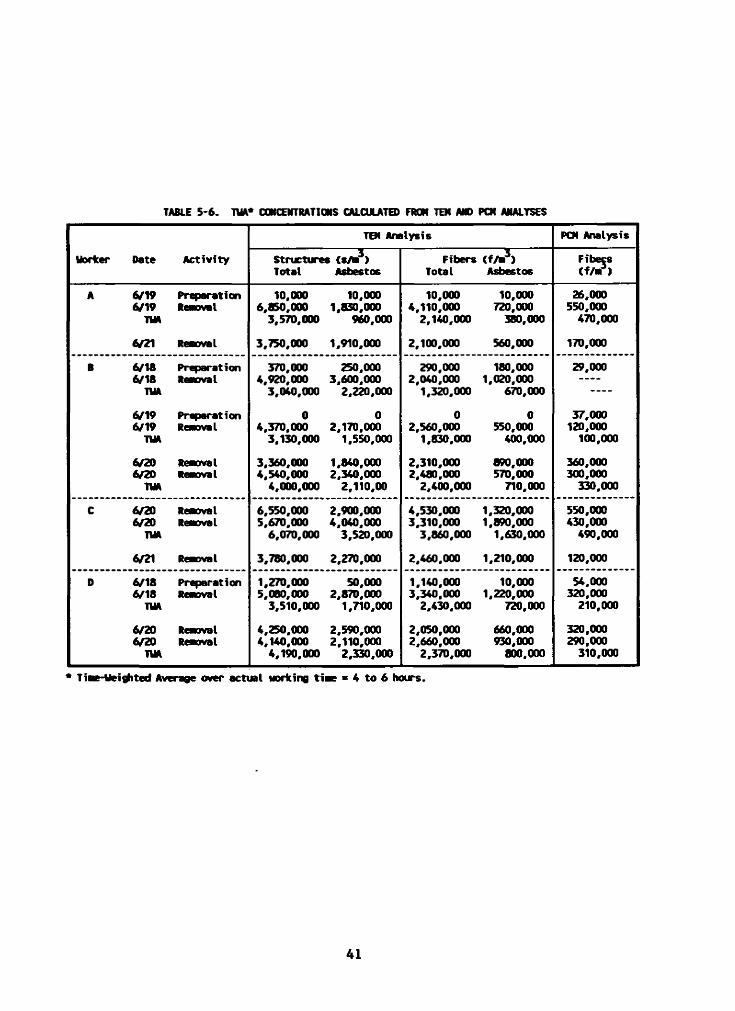
TABLE 5*6. TIM* CONCENTRATIONS CALCULATED FROM TEN AND PCM ANALYSES
TEH Analysis PCM AnalysisWorker Date Activity Structures (s/a3) Total Asbestos Fibers <f/«*) Total Asbestos Fibecs
CfAT)A 6/196/19TIM
PreparationReaoval 10,0006,850,0003,570,00010,0001,830,000960,000
10,0004,110,0002,140,00010,000720,000380,000
26,000550,000470,0006/21 Reaoval 3,750,000 1,910,000 2,100,000 560,000 170,000
B 6/1Ä6/18TUAPreparationReaoval 370.000 4,920,0003.040.000
250.000 3,600,0002.220.000290.000 2,040,0001.320.000
180,0001,020,000670,00029,000
6/196/19TIMPreparationRenoval 04,370,0003,130,000
02,170,0001,550,00002,560,0001,830,000
0550,000400,00037,000120,000100,000
6/206/20TIMReaovalReaoval 3.360.0004.540.000 4,000,000
1.840.0002.340.000 2,110,002.310.0002.480.000 2,400,000
890.000570.000 710,000360.000300.000 330,000
C 6/206/20TIMReaovalReaoval 6.550.0005.670.000 6,070,000
2.900.0004.040.000 3,520,0004.530.0003.310.000 3,860,000
1.320.0001.890.000 1,630,000550.000430.000 490,000
6/21 Reaoval 3,780,000 2,270,000 2,460,000 1,210,000 120,000D 6/186/18TIM
PreparationReaoval 1.270.0005.080.000 3,510,00050,0002,870,0001,710,000
1.140.0003.340.000 2,430,00010,0001,220,000720,000
54,000320,000210,0006/206/20TIM
ReaovalReaoval 4.250.0004.140.000 4,190,0002.590.0002.110.000 2,330,000
2.050.0002.660.000 2,370,000660,000930,000800,000
320.000290.000 310,000* TiaHfeiÿted Average «er actual working tiae * 4 to 6 hours.
41
As described in Section 3.2.2.2., poor work practices were used by the workers at the beginning of the survey. The survey team attenpted to instruct the workers in proper techniques the first week. During the second week, the workers were shown a training video, and proper techniques to be used in removing asbestos pipe lagging in glove bags were demonstrated by an instructor from the National Asbestos Council. The workers were observed to adopt many of the demonstrated techniques at the third facility, but the accident described above quite likely increased exposure levels. The high short-time exposure measured (greater than 9,000,000 f/m) would take some time to dissipate in the sealed room, thereby increasing the TWA exposures. Removal at the last facility was observed to be performed by the application of most of the proper techniques demonstrated by the instructor most of the time.Sampling results shown in Table 5-5 indicate that fiber concentrations were in the same range for Rooms A through F when lagging was being removed. Average personal exposures in Rooms A and F were about 400,000 f/m during these activities; Room G exhibited the highest concentrations (average 850,000 f/m ) which were probably caused by the accidental release. Rooms H, I, and J in Facility 4 were all well below 100,000 f/m . Fiber concentrations in this facility were significantly lower (p — 0.05) than the other facilities.Although factors such as a different type of lagging (e.g., lower asbestos content, less friable), improved cleanliness of the site before removal, etc., could have influenced the results, it was the opinion of the research team that these conditions were about equivalent in all of the facilities. The low exposure concentrations measured in Facility 4 may have occurred as result of changes in work practice that were observed during the removal of the pipe lagging. The present study did not permit a clear association between work practice and exposure level, however, due to the small number of sites that were studied.5.3.2. Environmental SamplingA comparison of pre- and post-removal sampling by both aggressive and nonaggressive procedures was made for two rooms in each of the four facilities. For each comparison, samples were taken using three 25 ma. diameter cellulose ester filters, three 37 ma cellulose ester filters, and three 37 n polycarbonate filters. The cellulose ester filters were analyzed using PCM; approximately 60% at UBTL and 40% in the NIOSH laboratory. About 15% of these samples were split and analyzed by both laboratories. The arithmetic mean of the NIOSH results was about 1.5 times that of the UBTL results, but this difference is not surprising in view of the interlaboratory CV of 0.45.The post-removal samples were collected after the room had been cleaned, but before the visual inspection and final clearance sampling by the contractor.The results shown in Table 5-7 are the arithmetic means for the PCM samples broken down by location, sampling method, filter type, and pre- or post-removal status. A separate tabulation also groups the samples by facility. Much higher fiber concentrations were obtained by aggressive sampling than by nonaggressive sampling. Of 109 nonaggressive samples, 44 (48.6%) were at levels greater than 1,000 f/m . Of the 111 aggressive samples, 97 (87.4%) were greater than 1,000 f/m . The aggressive sampling data indicate that
42
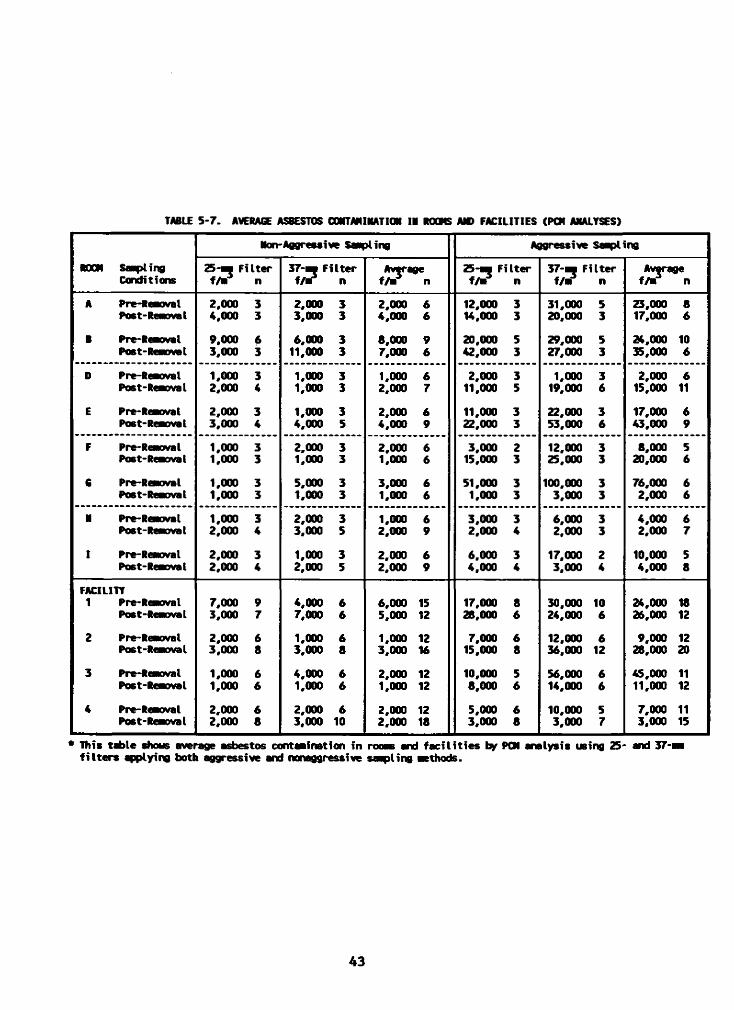
TABLE 5-7. AVERAGE ASBESTOS CONTAMINATION IN ROOMS AID FACILITIES (PGM ANALYSES)
ROOM StaplingConditions
Non-Aggressive Stapling Aggressive Saapling25*h Filter i/m n 37-™ Filter f/a3 n Average
f/m n25-M Filter ifm n 37-aa Filter
i/m n Average f/m n
A Pre-RenovaI 2,000 3 2,000 3 2,000 6 12,000 3 31,000 5 25,000 8Post-RenovaI 4,000 3 3,000 3 4,000 6 14,000 3 20,000 3 17,000 6B Pre-Renoval 9.000 6 6,000 3 8,000 9 20,000 5 29,000 5 24,000 10Post-Reanval 3,000 3 11,000 3 7,000 6 42,000 3 27,000 3 35,000 6D Pre-Renova I 1,000 3 1,000 3 1,000 6 2,000 3 1,000 3 2,000 6Post-RenovaI 2,000 4 1,000 3 2,000 7 11,000 5 19,000 6 15,000 11E Pre-RenovaI 2,000 3 1,000 3 2,000 6 11,000 3 22,000 3 17,000 6Post-RenovaI 3,000 4 4,000 5 4,000 9 22,000 3 53,000 6 43,000 9F Pre-Reaoval 1,000 3 2,000 3 2,000 6 3,000 2 12,000 3 8,000 5Past-Renova I 1,000 3 1,000 3 1,000 6 15,000 3 25,000 3 20,000 6G Pre-Renaval 1,000 3 5,000 3 3,000 6 51,000 3 100,000 3 76,000 6Post-RenovaI 1,000 3 1,000 3 1,000 6 1,000 3 3,000 3 2,000 6N Pre-Reaoval 1,000 3 2,000 3 1,000 6 3,000 3 6,000 3 4,000 6Post-Renova I 2,000 4 3,000 5 2,000 9 2,000 4 2,000 3 2,000 7I Pre-Renoval 2,000 3 1,000 3 2,000 6 6.000 3 17,000 2 10,000 5Post-RenovaI 2,000 4 2,000 5 2,000 9 4,000 4 3,000 4 4,000 8FACILITY1 Pre-Renoval 7,000 9 4,000 6 6,000 15 17.000 8 30,000 10 24,000 18Post-RenovaI 3,000 7 7,000 6 5,000 12 28.000 6 24,000 6 26,000 122 Pre-Renoval 2,000 6 1,000 6 1,000 12 7,000 6 12,000 6 9,000 12Post-Reanval 3,000 8 3,000 8 3,000 16 15,000 8 36,000 12 28,000 203 Pre-Renewal 1,000 6 4,000 6 2,000 12 10,000 5 56,000 6 45,000 11Po6t-Renoval 1,000 6 1,000 6 1,000 12 8,000 6 14,000 6 11,000 124 Pre-Renoval 2,000 6 2,000 6 2,000 12 5,000 6 10,000 5 7,000 11Post-RenovaI 2,000 8 3,000 10 2,000 18 3,000 8 3,000 7 3,000 15
* Hus t4>le shows average asbestos contaaination in rooas and facilities by PCM analysis using 25' and 37-ai filters plying both aggressive and nonaggressive stapling Methods.
43
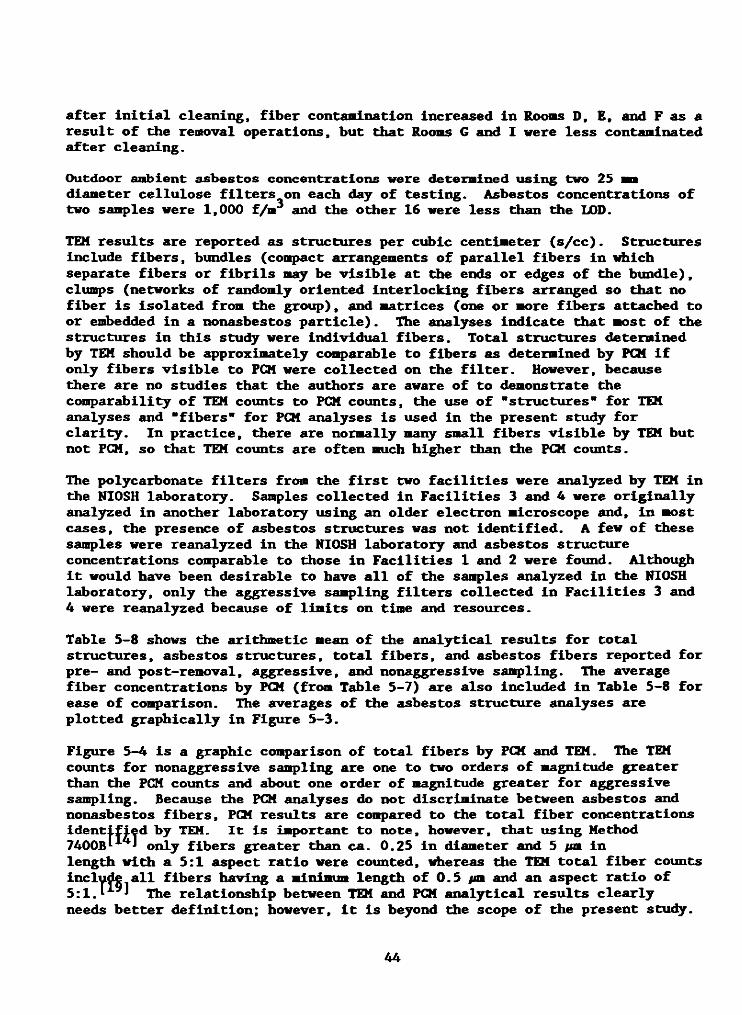
after initial cleaning, fiber contamination increased in Roons D, E, and F as a result of the removal operations, but that Rooms G and 1 were less contaminated after cleaning.Outdoor ambient asbestos concentrations vere determined using two 25 mm diameter cellulose filters on each day of testing. Asbestos concentrations of two samples were 1,000 f/m and the other 16 were less than the LOD.TEM results are reported as structures per cubic centimeter (s/cc). Structures include fibers, bundles (compact arrangements of parallel fibers in which separate fibers or fibrils may be visible at the ends or edges of the bundle), clumps (networks of randomly oriented interlocking fibers arranged so that no fiber is isolated from the group), and matrices (one or more fibers attached to or embedded in a nonasbestos particle). The analyses indicate that most of the structures in this study were individual fibers. Total structures determined by TEM should be approximately comparable to fibers as determined by PCM if only fibers visible to PGM were collected on the filter. However, because there are no studies that the authors are aware of to demonstrate the comparability of TEM counts to PCM counts, the use of "structures" for TEM analyses and "fibers" for PCM analyses is used in the present study for clarity. In practice, there are normally many small fibers visible by TEM but not PCM, so that TEM counts are often much higher than the PCM counts.The polycarbonate filters from the first two facilities were analyzed by TEM in the NIOSH laboratory. Samples collected in Facilities 3 and 4 were originally analyzed in another laboratory using an older electron microscope and, in most cases, the presence of asbestos structures was not identified. A few of these samples were reanalyzed in the NIOSH laboratory and asbestos structure concentrations comparable to those in Facilities 1 and 2 were found. Although it would have been desirable to have all of the samples analyzed in the NIOSH laboratory, only the aggressive sampling filters collected in Facilities 3 and 4 were reanalyzed because of limits on time and resources.Table 5-8 shows the arithmetic mean of the analytical results for total structures, asbestos structures, total fibers, and asbestos fibers reported for pre- and post-removal, aggressive, and nonaggressive sampling. The average fiber concentrations by PCM (from Table 5-7) are also included in Table 5-8 for ease of comparison. The averages of the asbestos structure analyses are plotted graphically in Figure 5-3.Figure 5-4 is a graphic comparison of total fibers by PCM and TEM. The TEM counts for nonaggressive sampling are one to two orders of magnitude greater than the PCM counts and about one order of magnitude greater for aggressive sampling. Because the PGM analyses do not discriminate between asbestos and nonasbestos fibers, PCM results are compared to the total fiber concentrations identified by TEM. It is important to note, however, that using Method 7400B* * only fibers greater than ca. 0.25 in diameter and 5 /u» inlength with a 5:1 aspect ratio were counted, whereas the TEM total fiber counts include all fibers having a minimum length of 0.5 pm and an aspect ratio of 5:1.1 J The relationship between TEM and PCM analytical results clearly needs better definition; however, it is beyond the scope of the present study.
44
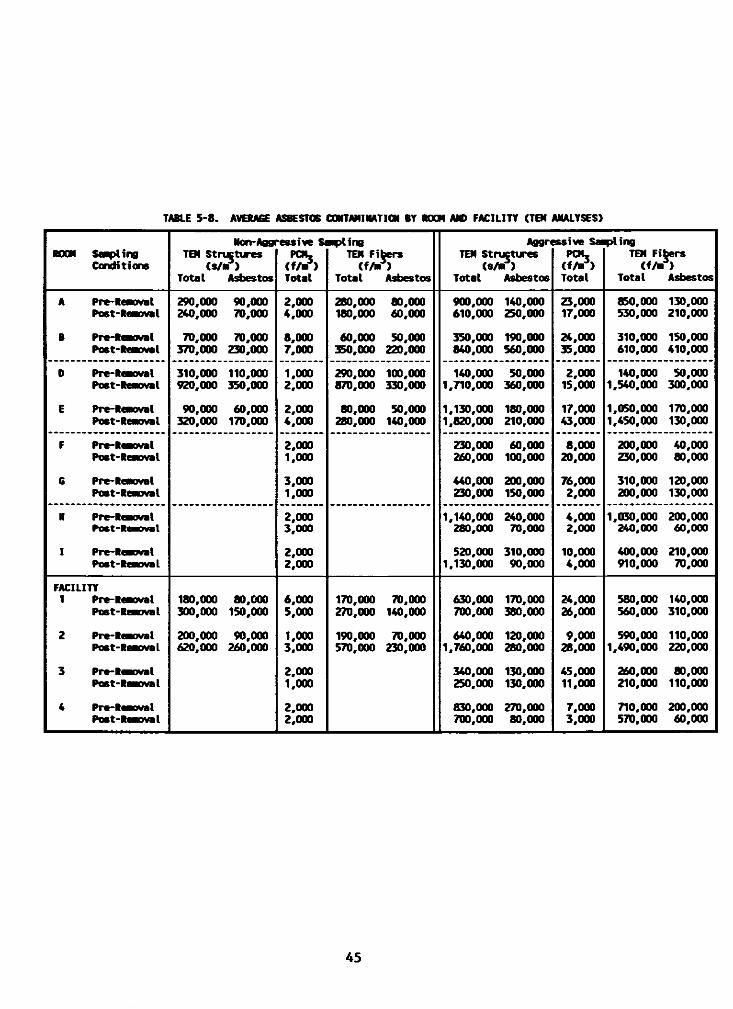
TABLE 5-8 . AVBUGE ASBESTOS CONTAMINATION BY ROOM AID FACILITY (TEN ANALYSES)
ROOM Sapling ConditionsNort-AggTEN Structures
i f t r yTotal Asbestos
'essive Si PCM, (f/a) Total
api ingTEN Fibers Cf/a )Total Asbestos
Aggn TEN Structures (s/a)Total Asbestos
sssive Sai PCNji f / myTotal
4>lingTEN Fibers CfAT)Total AsbestosA Pre-Reaoval Post-ReaovalB Pre-Reaoval Post-Reaoval
290.000 90,000240.000 70,00070,000 70,000370.000 230,000
2,0004.0008.000 7,000
280,000 80,000 180,000 60,00060,000 50,000 350,000 220,000
900.000 140,000610.000 250,000350.000 190,000840.000 560,000
23.00017.00024.00035.000
850.000 130,000530.000 210,000310.000 150,000610.000 410,000
D Pre-Reaoval Post-ReaovalE Pre-Reaoval Post-Renoval
310.000 110,000920.000 350,00090.000 «0,000320.000 170,000
1,0002,0002,0004,000
290.000 100,000870.000 330,00080,000 50,000280.000 140,000
140,000 50,0001.710.000 360,0001.130.000 180,0001.820.000 210,000
2,00015.00017.00043.000
140,000 50,0001.540.000 300,0001.050.000 170,0001.450.000 130,000
F Pre-Reaoval Post-Reaoval6 Pre-Reaoval Post-Reaoval
2,0001,0003.0001.000
230.000 60,000260.000 100,000440.000 200,000230.000 150,000
8,00020,00076,0002,000
200.000 40,000230.000 80,000310.000 120,000200.000 130,000
H Pre-Reaoval POSt-RCMJMUlI Pre-Reaoval Post-Reaoval
2,0003.0002.000 2,000
1.140.000 240,000280.000 70,000520.000 310.0001.130.000 90.000
4.0002.00010,0004,000
1,030,000 200,000240.000 60,000400.000 210,000910.000 70,000
FACILITY1 Pre-Reaoval Post-Reaoval2 Pre-Reanval Post-Reaoval3 Pre-Reaoval Post-Reaoval4 Pre-Reaoval Post-Reaoval
180,000 80,000300.000 150,000200.000 90,000620.000 260,000
6,0005.0001.0003.0002.000 1,0002,0002,000
170.000 70,000270.000 140,000190.000 70,000570.000 230,000
630.000 170,000700.000 380.000640.000 120,000 1,760,000 280,000340.000 130,000250.000 130,000830.000 270,000700.000 80,000
24.00026.0009.000 28,00045.00011.0007.0003.000
580.000 140,000560.000 310,000590.000 110,000 1,490,000 220,000260.000 80,000 210,000 110,000710.000 200,000570.000 60,000
45
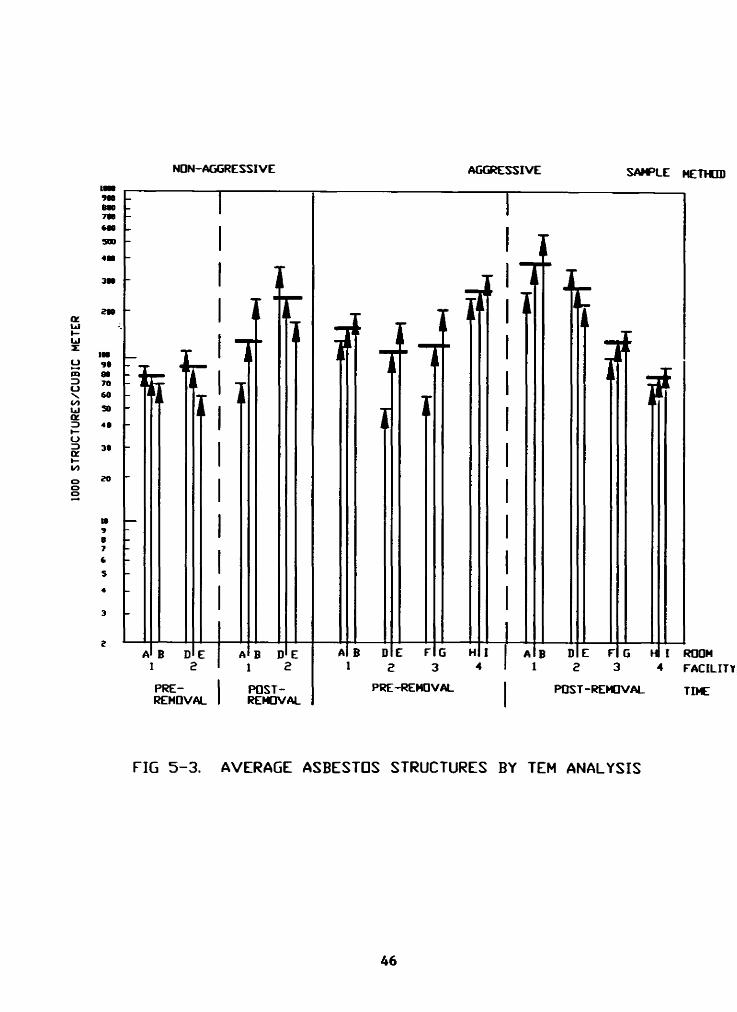
1000
STRU
CTUR
ES/C
UBIC
ME
TER
NON-AGGRESSIVE AGGRESSIVE SAMPLE METHOD
FIG 5 -3 . AVERAGE ASBESTOS STRUCTURES BY TEM ANALYSIS
46
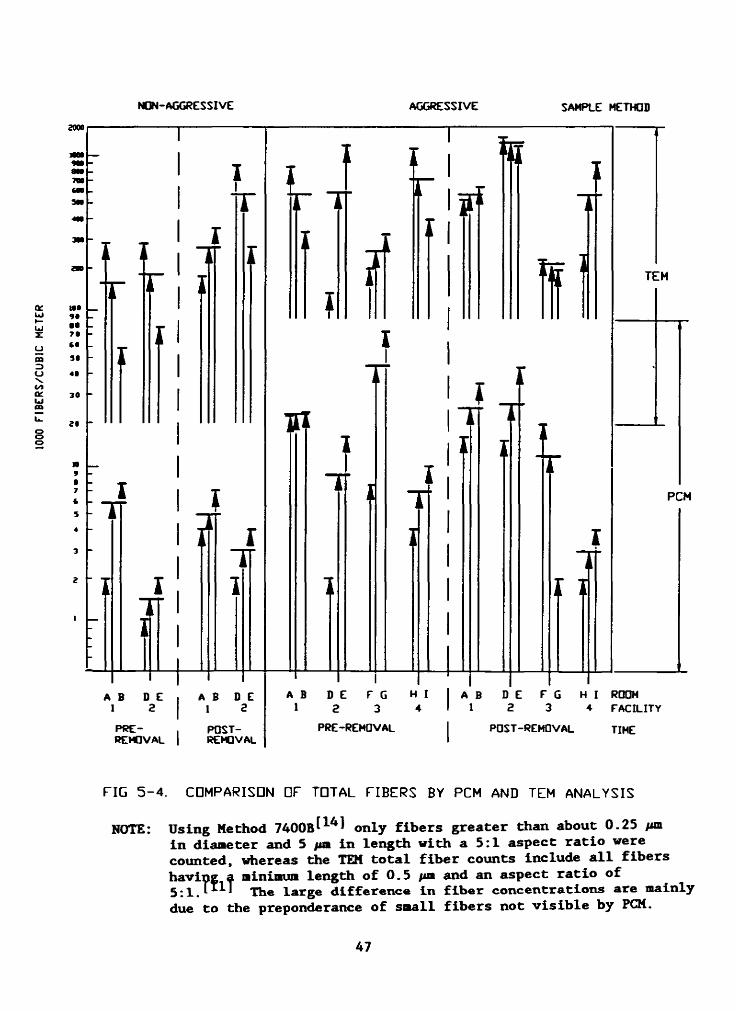
1000 r
iBCRS/CUBIC
METER
NON-AGGRESSIVE AGGRESSIVE SAMPLE METHOD
2000
to*
• •71( •
2 " T I TT
} if TEM
PCM
A B D E1 a
PREREMOVAL
A B D E1 aPOST-removal
A B 1
D E 2
F G 3
H I 4
A B1
D E 2
F G 3
PRE-REMOVAL POST-REMOVAL
H I ROOM 4 FACILITY
TIME
FIG 5 - 4 . COMPARISON DF TOTAL FIBERS BY PCM AND TEM ANALYSIS
NOTE: Using Method 7400B^1 only fibers greater than about 0.25 pmin diameter and 5 pm in length with a 5:1 aspect ratio were counted, whereas the TEM total fiber counts include all fibers having a minimum length of 0.5 pa and an aspect ratio of 5:1.[TIT The large difference in fiber concentrations are mainly due to the preponderance of small fibers not visible by PCM.
47
An analysis of the TEH data was Bade to determine whether the asbestos levels increased as a result of removal operations. The following comparisons were made using analysis of variance (ANOVA) on the log-transformed data:
a.) pre-removal asbestos nonaggressive structure and fiber counts were compared to post-removal counts,
b.) pre-removal asbestos aggressive structure and fiber counts were compared to post-removal counts,
c.) pre-removal aggressive and nonaggressive data were compared, andd.) post-removal aggressive and nonaggressive data were compared.
In addition, two comparisons were made on untransformed data:e.) the fraction of fibers that are asbestos in pre-removal samples were
compared to that of post-removal samples, andf.) the fraction of structures that are asbestos in pre-removal samples
were compared to that of post-removal samples.(The fractions (t) of asbestos structures in the total structures and of asbestos fibers in the total fibers are shown in Table 5-9.)The Summary of this analysis (Appendix D) is as follows:
In summary, a main question here is the effectiveness of glove bags in containing asbestos material during the removal process, the conclusion that the first two facilities show signs of additional asbestos after removal, whereas the fourth facility shows signs of decrease in such material allows the possibility that the removal crew did improve its removal techniques, so that the glove bag methods used in the fourth facility may have been more effective in containing the asbestos material. (Note that the analysis of PCM data in Table 5-7, comparing pre- and post-removal counts, indicated a similar possibility concerning the decrease in asbestos after removal.)
The present study does not provide enough replicates to specify whether particular work practices will reliably allow effective glove bag containment. The study does show that asbestos emissions can occur when glove bags are used during asbestos abatement and it is prudent to assume that emissions will occur, unless it is proven otherwise.As noted previously, analysis by TEH methods specify that the dimensions and speciation of all structures be recorded. Using the post-removal aggressive sampling results, EPA researchers analyzed and prepared a graphical representation of the size distribution of the asbestos fibers. This distribution is shown in Figure 5-4. As seen, the large majority of fibers were less than 5 pm in length.OTHER OBSERVATIONS5.4.1. Magiscan IIA number of samples collected from the first facility surveyed were analyzed using the Hagiscan II® (M-II) system, Version 2.0, and compared with results obtained from the manual use of PCM. For samples obtained during removal operations, the mean concentration was 0.42 f/cc for M-II and 0.46 f/cc for PCM. The correlation coefficient of 43 duplicate samples was 0.91. For fiber concentrations in this range (0.1 to 1.0 f/cc), the M-II could be
48
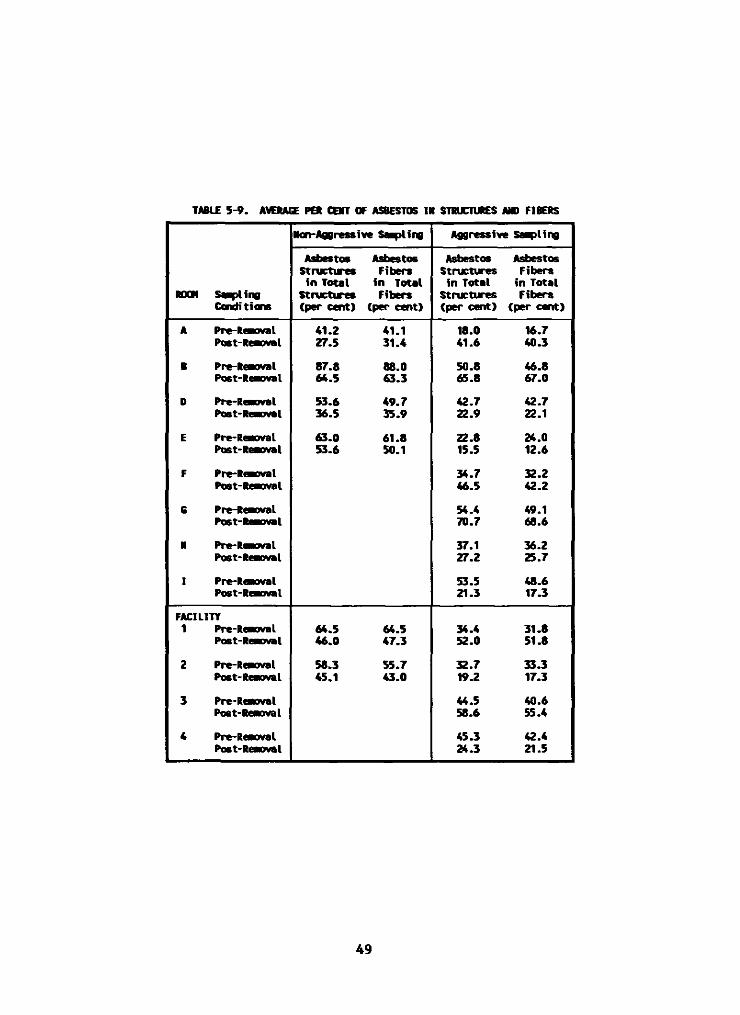
TABLE 5-9. AVERAGE PBt CENT OF AS8EST0S IN STRUCTURES MO FIBERSNon-Aggressive Sailing Aggressive SailingAsbestos Asbestos Asbestos AsbestosStructures Fibers Structures Fibersin Total in Total in Total in TotalROOM Stapling Structures Fibers Structures FibersConditions (per cent) (per cent) (per cent) (per cent)
A Pre-Komi 41.2 41.1 18.0 16.7Post-Reaoval 27.5 31.4 41.6 40.3B Pre-Reaoval 87.8 88.0 50.8 46.8Post-Rowal 64.5 63.3 65.8 67.0D Pre-Reaoval 53.6 49.7 42.7 42.7Post-Reaoval 36.5 35.9 22.9 22.1E Pre-Rowval 63.0 61.8 22.8 24.0Post-Reaoval 53.6 50.1 15.5 12.6F Pre-Raoval 34.7 32.2Post-Reaoval 46.5 42.2G Pre-Reaoval 54.4 49.1Post-Reaoval 70.7 68.6N Pre-Reaoval 37.1 36.2Post-Reaoval 27.2 25.7I Pre-Reaoval 53.5 48.6Post-Reaoval 21.3 17.3FACILITY1 Pre-Reaoval 64.5 64.5 34.4 31.8Post-Reaoval 46.0 47.3 52.0 51.82 Pre-Reaoval 58.3 55.7 32.7 33.3Post-Reaoval 45.1 43.0 19.2 17.33 Pre-Reaoval 44.5 40.6Post-Reaoval 58.6 55.44 Pre-Reaoval 45.3 42.4Post-Reaoval 24.3 21.5
49
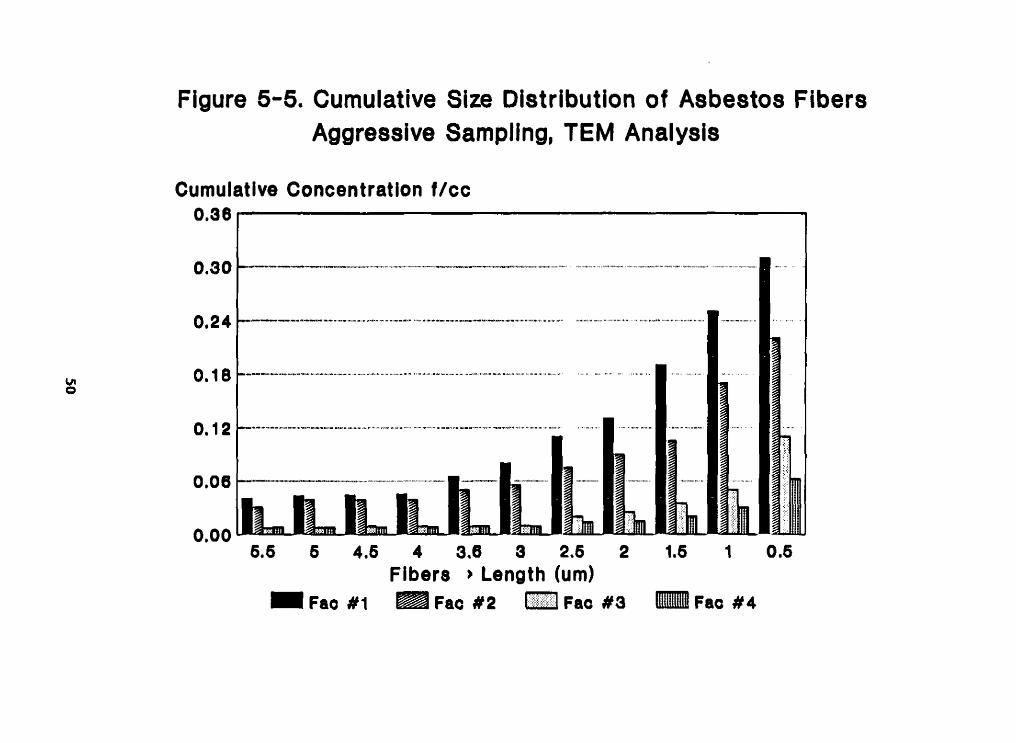
Figure 5-5. Cumulative Size Distribution of Asbestos Fibers Aggressive Sampling, TEM Analysis
C u m u la t iv e C o n c e n t r a t i o n f / c c 0 .36
0 .30
0.24
0.18
0.12
0.06
0 .00
I
6.6 6 4.6 4 3.6 3 2.6 2F i b e r s > L e n g th (um)
H I Fao #1 Ü 1 Fac # 2 i l i i Fac # 3
1 . 6 0 . 6
Fac # 4
considered as an alternate analytical procedure that would provide results comparable to the manual PCM counting method, but in less time and with less operator fatigue.However, it was found that when fiber concentrations were in the range of 0.001 to 0.1 f/ccv as with the asbestos abatement preparation operations and clearance procedures, the duplication of results was very poor. The ratio of of M-II to PCM fiber concentrations of duplicate samples were quite variable, ranging from 2:1 to 30:1. The correlation coefficients between the results obtained by the two methods ranged from 0.11 to 0.25. Therefore, the H-1I system, as used in this study, was not suitable for measuring these low airborne asbestos fiber concentrations. A subsequent Magiscan software release (Version 4.0) reportedly has improved capability to measure low fiber counts.5.4.2. Engineering ControlsDisposalene®, Profo®, and Safe-T-Strip® glove bags were used duringthis study. Although the majority of the work was done with Disposalene bags,the study was not designed to measure differences in the fiber concentrations emitted from the glove bags of the various manufacturers. It should be noted that glove bag design and construction has evolved since the time of this study and many conveniences and refinements are incorporated in many glove bags currently available.5.4.3. Work Practices
The survey team observed and intermittently videotaped the work practices of the removal crew. The distributor for Safe-T—Strip® glove bags, who is also a National Asbestos Council instructor, provided on-site training which was very helpful in reinforcing good work practices and techniques. Thetraining was well received by the workers and they were observed to make use ofthe demonstrated techniques for the duration of the study.A subjective evaluation of work practices was improvised, and these ratings are summarized in Appendix A, Tables A7-1 through A7-4. Although the work practices appeared to improve as the workers received training and gained experience, it was not possible to identify work practices which would clearly explain the improved containment achieved in the final study site.Attempts to analyze FAM measurements and compare observed real-time fiber concentrations with specific work conditions and activities were also unsuccessful. The removal work is composed of many short-duration, repetitive tasks; however, the cycle of repetition is inconsistent. In addition, two or more workers performing different tasks simultaneously at different locations in the same room further confounded the situation by the possibility of increasing the background levels from multiple, unrelated sources.5.4.4. Contractor and School Board MonitoringThe removal contractor's program for monitoring airborne exposure to asbestos during the removal operation consisted of supplying the shift foreman with one personal sampling pump. During the present study, no personal sampling was conducted by the foreman because the survey team monitored each of the workers.
5 1
The school board also hired an independent consultant to Monitor the asbestos abatement activities by observation and by air sampling. However, because abatement work was simultaneously in progress at four diverse sites, the monitoring consultant was unable to provide a level of observation sufficient to ensure full compliance with the work specifications at any one site.5.4.5. Personal ProtectionThe removal workers wore disposable coveralls in the work area during removal activities. In addition, each worker was fit-tested for a half-face cartridge respirator equipped with high efficiency particulate air filters. These respirators were worn during all removal activities.5.4.6. Safety ConsiderationsVork was performed over or around obstructions such as sinks, commodes, light fixtures, and other nonremovable structures. Safety hazards were typical of those associated with insecure footing while working on elevated platforms, ledges, and ladders, i.e., slips, falls, awkward working postures, etc. The use of razor knives and stapling guns also presented hazards to workers.Staples driven through the poly into the asbestos lagging presented a special risk of injury to the hands. Care was required when removing the poly from the lagging to avoid skin punctures and lacerations. The poly gloves in the bags provided no protection against this hazard and were not large enough to allow workers to wear additional hand protection.
52
6 . CONCLUSIONS AND RECOMMENDATIONS
The following conclusions and recommendations are based on the fiber exposure data collected and on the observation of the work practices used in this study.6.1. Efficacy of Glove Bag Containment• As used in this study, glove bags did not completely contain airborne asbestos when pipe lagging was being removed.Glove bags can be a useful engineering control to reduce worker exposure to asbestos during the removal of ACM. In the present investigation, however, workers' exposures to airborne asbestos were consistently below the OSHA PEL in only one of the four facilities surveyed. The study was not designed to demonstrate the effect of training on glove bag containment efficacy and it did not provide a basis to specify conditions under which adequate containment can be assured.Based on these results, it is prudent to assume that glove bags will afford varying degrees of containment, depending on the specific configuration of the structure from which asbestos is to be removed and the manner in which the glove bags are used by the workers.
• Because of the uncertainty in controlling exposures during the use of glove bags, it is essential to provide a backup containment system (e.g., isolation, barriers, negative air) and respiratory protection for workers.Worker training and experience are important components of a reliable system of control measures; however, even work performed by well- experienced crews is subject to accidental releases. Emissions of this sort must be prevented from entering other portions of the building.As discussed in Section 3, the lack of expertise demonstrated by the workers at the first survey is probably typical of other workers who use glove bags infrequently. Plant maintenance personnel, asbestos operations and maintenance personnel, and many asbestos removal contractors who use glove bags only occasionally could very likely encounter asbestos exposures similar to those observed in these surveys, due to incomplete containment.It is also necessary to use personal protective equipment (e.g., disposable coveralls) and respiratory protection during anv glove bag operation, because of the potential for undetected leakage of the glove bag and accidental rupture of the bag or seals. OSHA permits the use of high efficiency, air purifying respirators for work with asbestos; I however, NIOSH recommends that type C positive pressure, supplied air
53
respiratory protection be used when occupational exposure aay occur.Only NIOSH/MSHA-approved respirators should be used. When respirators are used, a written respirator program including a quantitative respirator fit testing program nust also be instituted.
• In this study, exposures to asbestos exceeding the N10SH BET- did not occur «hen the rooms were being prepared for asbestos lagging removal.The maximum exposure observed during the preparation of the rooms and covering of the pipes before actual removal was 54,000 f/m .Preexisting contamination by ACM, i.e., asbestos contamination present in areas to be abated before the abatement operations are started, Is an important factor to consider in evaluating the potential for exposure. Both the amount and the state of the preexisting contamination and the magnitude of the disturbance created by the workers activities can influence the contribution of preexisting contamination to airborne asbestos concentrations.The rooms evaluated in this study were selected because of the good condition of the pipe lagging and the absence of visible debris.The workers used respirators during removal operations, but did not use them during the preparation stage. It is more usual for abatement work to be performed in areas where damaged lagging and debris are present; under such conditions respiratory protection should always be used in preparing the work site.
6.2. Clearance Methodology• For clearance testing, the aggressive sampling technique is more sensitive for detecting asbestos contamination than nonaggressive sampling techniques. Asbestos was found in all of the clearance samples that were collected using aggressive sampling techniques and analysis by THM.Where aggressive sampling and TEM analysis techniques were used, preexisting contamination was found in all of the rooms in which this study was conducted, even though these rooms were selected because of the absence of any visual contamination. Using these same sampling and analytical techniques, asbestos concentrations observed following the abatement activities but prior to final inspection were greater than the preexisting contamination levels in five of the eight rooms.
• PCM analysis is not reliable for clearance testing.The AHERA regulation permits the use of PQ1 only until October 7,1990.1 J The PCM analysis of samples collected using nonaggressive sampling techniques indicated that over 50t of the samples had nonde tec table fiber concentrations. Even when aggressive sampling techniques were used, PCM analysis could not always detect the presence of asbestos, even though fibers were observed on all samples analyzed by TEM. Based on these findings, PCM should not be considered as a reliable method for determining the absence of residual asbestos. Furthermore, the results obtained by PCM are very
54
close to the limit of detection for this method, and therefore, the confidence limits are very broad. This makes comparison with a clearance standard difficult.TEM analysis presents several advantages for the measurement of low concentrations of asbestos fibers. It has the ability to detect short and narrow fibers, identify the type of fiber, and is less affected by overloading of particulates which may obscure fibers when using PCM.The interlaboratory variability observed for the TEM analysis and the fiber contamination found on the polycarbonate filter media indicate that additional standardization and quality assurance are required. Laboratory accreditation is needed to assure that uniform sample preparation techniques and counting methods are used. Inter and intralaboratory quality control tests are needed to determine coefficients of variability and a measure of the accuracy and ability to replicate results. This need was recognized by both the April 1986 EPA peer review ^ and the Asbestos-Containing Materials in Schools regulation (October 1987).I This regulation charged the National Institute of Standards and Technology (NIST) (formerly the National Bureau of Standards) with the responsibility for establishing a laboratory accreditation program. NIST projects that such a program will require 2 to 3 years for implementation to occur. Until such time as TEM laboratory accreditation is accomplished, meaningful quantitative comparisons between laboratories or with EPA standards are possible only with extensive interlaboratory replicate analysis and quality assurance programs. It is recommended that laboratories performing TEH analyses initiate with other laboratories an interim program for quantitative comparisons of samples.
• Magiscan II is suitable for fiber analysis when airborne asbestosconcentrations are compared to occupational standards, i.e., concentrations in the 0.2 f/cc (200,000 f/m ) range.From the limited observations in this study, it appears that the use of PCM with the automatic counting and sizing of particles, e.g.,Magiscan II®, Version 2.0, is useful for the analysis of fibers when the concentration is above the present OSHA PEL of 0.2 f/cc (200,000 f/m ). This system can provide results comparable to manual PCM, but in less time and with less operator fatigue. The Magiscan II (Version 2.0) did not correlate well with the PCM analyses for fiber concentrations in the 0.01 f/cc (10,000 f/m'*) range.Therefore, it is not appropriate for analysis of low fiber concentrations normally associated with ambient background or abatement clearance fiber concentrations. A modification of this system, Magiscan, Version 4.0, may have utility at these lower concentrations, but it was not evaluated in this study.
6.3. Monitoring and Recommended Work Practices for Glove Bag UseMonitoring of airborne asbestos concentrations by the removal contractor andthe building owner is necessary to verify the effective use of glove bags;
55
frequent observation and supervision by an experienced overseer is necessary to assure that proper work practices are being used. Although conventional workplace sampling for airborne concentrations can provide only after-the-fact exposure information, it may indicate the need for better control on future jobs. A direct-reading instrument (FAM) may be useful to indicate large, accidental releases of fibers and help to Minimize contamination by timely corrective actions.In the absence of other reputed studies that quantify the effectiveness of specific work practices, the following recommendations are given based on good industrial hygiene practice:• Pre-mist all lagging with amended water.• Wrap all pipe with poly prior to the start of removal work.• Use a bag properly designed for the task (i.e., specially designed bags for working around large valves or fittings).
• Start with a clean, empty bag where the pipe interfaces with walls or ceiling. Special care must be used to avoid breaking the tape or adhesive seal; an empty or nearly empty bag is easier to manipulate.
• Cut preformed lagging blocks at the joints to minimize fiber generation.• Use hoses on the amended water sprayers of sufficient length to facilitate wetting practices; spray frequently during the removal task to assure that freshly exposed materials are wetted.
• Use a HEPA-filtered vacuum device to contain fibers and to assist in collapsing the glove bag and tying it off prior to removal.
• Remove contaminated tools in an inverted glove for transfer to the next glove bag.
• Require documentation of specific training and experience for workers using glove bags.
• Use enclosures with decontamination showers and negative air on large jobs. On smaller jobs, at least seal off vents and wall or ceiling openings with poly and provide double-hung poly curtains at the doors.
• Clean up accumulated debris prior to removal; this will reduce the potential to disturb and resuspend accumulations of loose fibers.
• Stable elevated platforms and scaffolding must be provided where needed. Improvised platforms utilizing existing structures should be discouraged; worker safety should not be jeopardized by expediency.
• If the lagging is not fully wrapped with poly prior to removal, band the lagging with tape at the places where the glove bag is to be attached. This will provide a clean surface for affixing the tape that seals the glove bag, and prevent damage to the lagging when the sealing tape is removed.
56
• Test the effectiveness of the seals by pressure testing each bag installation (e.g., gently squeeze the bag to assure that the seal is tight).
• Periodically, use a smoke test: to assure that correct installation procedures have been followed. Use a smoke tube inside the bag to fill the bag with smoke, then apply gentle pressure to the bag to observe that the seals are secure. The pressure applied should be consistent with the forces exerted on the bag during the removal of the pipe lagging.
• Care should be taken when metal bands, wires, or metal jacketing are encountered to avoid lacerations to the hands or to the glove bag; whenever possible, the sharp edges should be folded in and these items placed gently in the bottom of the bag.
• The accumulation of debris and water in the glove bag should not exceed the ability of the workers to safely manipulate the bag as needed. Bag loading practices should reflect good judgment and experience; heavily loaded bags create awkward and unsafe conditions. Vhere applicable, the bag may be supported by the use of a platform and/or slings.
• Use a HEPA filter vacuum to contain fibers during all bag opening procedures such as removal or moving.
• Seal the ends of the lagging with "wettable cloth" (plaster-impregnated fiberglass webbing) or equivalent encapsulant, when partial removal creates exposed ends.
• Use a direct-reading aerosol monitor, such as a FAM, to detect failures in control or containment so that on-the-spot corrections can be made.
• Decontaminate the work area thoroughly after the completion of the job.All contamination should be removed, whether it was caused by the removal task or has accumulated over time.
• Place barricades around working areas when outdoor work is performed.Removal of pipe lagging from salvaged or reclaimed pipe should be done in an enclosure or room with suitable controls to prevent the release of asbestos fibers to the environment.
• Crew size should be proper for the task; a minimum of two workers is recommended where heavily loaded bags are anticipated or elevated work is required. Vhere two or more removal operations are conducted in the same area, an auxiliary worker may be utilized to refill and pressurize the amended water sprayers, to assist in moving or adjusting the glove bags, and to perform other miscellaneous tasks.
57
6 .4 . R esea rc h Meeds
There are several research efforts that may help to improve the containment of asbestos while using glove bags: evaluation of work practices for bothreduction of emissions and ergonomic considerations; improvements for wetting the lagging before removal, such as using an injection technique to saturate the lagging; and use of glove bags in conjunction with local exhaust applied to the glove bag (negative pressure).Several removal contractors use high volume HEPA-filtered vacuum systems that are truck-mounted and are connected to the containment area by means of flexible duct work. They are used to produce a negative or reduced pressure and frequent air changes within the sealed area, and/or local exhaust ventilation to the source of asbestos emissions when ACBM are being removed. They are also designed to remove airborne contamination and debris from the removal site or building and provide disposal techniques remote from abatement operation. These systems could offer better containment than conventional removal methods. A study of the efficacy of these systems, as compared to the use of conventional removal techniques, is recommended.A further recommendation is an evaluation of exposures associated with the effects of age, use, and maintenance procedures on the efficiency of HEPA- filtered vacuum devices, because degradation in these devices could result in significant emissions of asbestos fibers.
58
7 . REFERENCES
1. Hollett, B., CapIan, P . , Cooper, T., and Froehlich, P. In-Depth Survey Report: Control Technology for Asbestos Removal, June 4-July 11, 1985.DHHS, NIOSH Report 1987 (ECTB No. 147-19a). NTIS Publ. No. PB-88-163191
2. Hollett, B., Caplan, P., Cooper, T., and Froehlich, P. In-Depth Survey Report: Control Technology for Asbestos Removal, June 4-July 10, 1985.DHHS, NIOSH Report 1987 (ECTB No. 147-19b). NTIS Publ. No. PB-88-162201
3. Hollett, B., Caplan, P., Cooper, T., and Froehlich, P. In-Depth Survey Report: Control Technology for Asbestos Removal, June 4-July 9, 1985.DHHS, NIOSH Report 1987 (ECTB No. 147-19c). NTIS Publ. No. PB-88-189451
4. Hollett, B., Caplan, P., Cooper, T., and Froehlich, P. In-Depth Survey Report: Control Technology for Asbestos Removal, June 4-July 18, 1985.DHHS, NIOSH Report 1987 (ECTB No. 147-19d). NTIS Publ. No. PB-88-162250
5. NIOSH. 1985. Project Protocol for Control Technology Assessment of Asbestos Removal Processes. August 1985. Unpublished.
6. USEPA. 1972. National Emission Standards for Hazardous Air Pollutants. 40CFR61 Subpart A & B. 38FR8826. April 6, 1973.
7. USEPA. 1972. The Clean Air Act. 42 U.S.C. 7412, 7601(a)..8. USEPA. 1982. Friable Asbestos-Containing Material in Schools:
Identification and Notification Rule. 40CFR763. 47FR23360. Kay 27, 1982.9. USEPA. 1983. U.S. Environmental Protection Agency. Guidance for Controlling
Friable Asbestos-Containing Material in Buildings. Washington, DC. Office of Toxic Substances and Office of Pesticides and Toxic Substances, USEPA. EPA-560/5-83-002.
10. USEPA. 1985. U.S. Environmental Protection Agency. Guidance for Controlling Friable Asbestos-Containing Material in Buildings. Washington, DC. Office of Toxic Substances and Office of Pesticides and Toxic Substances, USEPA. EPA-560/5-85-024.
11. Public Law 99-519. Asbestos Hazard Emergency Response Act of 1986, Sec 2 Amendment to Toxic Substance Control Act, Title II-Asbestos Hazard Emergency Response. Signed October 22, 1986.
12. USEPA. 1984. National Emission Standards for Hazardous Air Pollutants (NESHAPS) Asbestos Regulations. 40CFR61, Subpart M. 49FR13661. April 5, 1984.
59
13. USDOL, OSHA. 1986. Occupational Exposure to Asbestos, Tremolite, Anthophyllite, and Actinolite; Final Rules. 29CFR1910.1001 and 29CFR1926.58. 51FR22612 (June 20, 1986).
14. NIOSH. 1984. Method 7400. National Institute for Occupational Safety and Healtli. NIOSH Manual of Analytical Methods. Third Ed., Vol 2. Cincinnati, OH. U.S. Dept, of Health and Human Services. Public Health Service. Centers for Disease Control. National Institute for Occupational Safety and Health. DHHS (NIOSH) Publication No. 84-100. (February 15, 1984).
15. Ibid. Revision #1. (May 15, 1985).16. Ibid. Revision #2. (August 15, 1987).17. Ibid. Revision #3. (May 15, 1989).18. Baron, P. and Deye, G. 1990. Electrostatic Effects in Asbestos Sampling I:
Experimental Measurements. American Industrial Hygiene Association Journal. 51(2):51-62.
19. USEPA. 1977 (Rev. June 1978). U.S. Environmental Protection Agency.Electron Microscope Measurement of Airborne Asbestos Concentrations. Research Triangle Park, NC. Office of Research and Development, USEPA. EPA-600/2-77-178.
20. NIOSH. 1987. Method 7402. National Institute for Occupational Safety and Health. NIOSH Manual of Analytical Methods. Third Ed., Vol 2. March 1987 Revision. Cincinnati, OH. U.S. Dept, of Health and Human Services. Public Health Service. Centers for Disease Control. National Institute for Occupational Safety and Health. DHHS (NIOSH) Publication No. 84-100.
21. Ibid. Revision #2. (August 15, 1989).22. Gandee, David P. 1983. Report of the Asbestos Detection Program for the
Cincinnati Public School District, Cincinnati, OH. Unpublished.23. NIOSH. 1984. NIOSH testimony to the U.S. Department of Labor: statement of
the National Institute for Occupational Safety and Health. Presented at the public hearing on occupational exposure to asbestos, June 21, 1984. NIOSH policy statement. Cincinnati, OH. U.S. Dept, of Health an^Human Services. Public health Service. Centers for Disease Control. National Institute for Occupational Safety and Health on the Occupational Safety and Health.
24. NIOSH. 1990. Testimony of the National Institute for Occupational Safety and Health on the Occupational Safety and Health Administration's Notice of Proposed Rulemaking on Occupational Exposure to Asbestos, Tremolite, Anthrophyllite, and Actinolite, May 9, 1990. NIOSH policy statement. Cincinnati, OH. U.S. Dept, of Health and Human Services. Public Health Service. Centers for Disease Control. National Institute for Occupational Safety and Health.
60
25. NIOSH. 1976. Criteria for a recommended standard: occupational exposure to asbestos. Cincinnati, OH. U.S. Dept, of Health and Human Services. Public health Service. Centers for Disease Control. National Institute for Occupational Safety and Health. DHHS (NIOSH) Publication No. 77-169.
26. NIOSH. 1980. Workplace exposure to asbestos: review and recommendations. NIOSH-OSHA Asbestos Work Group. Cincinnati, OH. U.S. Dept, of Health and Human Services. Public Health Service. Centers for Disease Control.National Institute for Occupational Safety and Health. DHHS (NIOSH) Publication No. 81-103.
27. USDOL, OSHA. 1983. OSHA Safety and Health Standards. 29CFR1910. General Industry, Section 1910.1001 Asbestos. OSHA 2006 Revised March 11,1983.
28. USDOL, OSHA. 1988. Amendment to Occupational Exposure to Asbestos, Tremolite, Anthophyllite, and Actinolite; Final Rules. 29CFR1910.1001. 53FR35610 (September 14, 1988).
29. USEPA. 1987. Asbestos in Schools Rule. Worker protection rule, Subpart G Revised. 40CFR763. 52FR5618. February 25, 1987.
30. NIOSH. 1977. Method P&CAM 239. National Inst, for Occupational Safety and Health. NIOSH Manual of Analytical Methods. Second Ed., Vol 1. Cincinnati, OH. U.S. Dept, of Health Education and Welfare. DHEW (NIOSH) Publication No. 77-157-A.
31. Chat fie Id, E. J. 1983. Measurement of Asbestos Fibre Concentrations in Ambient Atmospheres. Ontario, Canada. Ontario Research Foundation.
32. USEPA. 1987. Asbestos-Containing Materials in Schools Final Rule and Notice. 40CFR763. 52FR210/41826. October 30, 1987.
33. USEPA. 1985. Measuring Airborne Asbestos Following an Abatement Action. Research Triangle Park, NC. Environmental Monitoring Systems Laboratory. Washington, DC. Office of Pesticides and Toxic Substances.EPA-600/4-85-049. November 1985.
34. Wilmoth, Roger C. Memo to Hugh Spitzer, Office of Regulatory Support and Scientific Analysis, EPA. Technical Review of Draft of AHERA Regulations. Water Engineering Research Laboratory, 0RD, EPA. October 9, 1987.
35. Power, Thomas J. 1986. Filter Blank Contamination in Asbestos Abatement Monitoring Procedures: Proceedings of a Peer Review Workshop. USEPA Water Engineering Research Laboratory. Cincinnati, OH. Contract No. 68-03-3264.
36. Steel, Eric B. «and Small, John A. 1985. Accuracy of Transmission Electron Microscopy for the Analysis of Asbestos in Ambient Environments. Analytical Chemistry. 57, 209-213. January 1, 1985.
61
37. Power, Thomas J. and Cain, William. 1987. Results of Air Sampling from Selected Asbestos Abatement Projects. Presented at the Third Annual HAC Fall Technical Conference and Exposition. Oakland, GA. September 22, 1987.
38. The Glove Bag Technique for Asbestos Removal of Pipe Covering using Safe-T-Strip Glove Bags. Instructor Graham Dewar. Asbeguard Equipment Inc.
39. Nash, Kenneth, V. Pres., W. W. Nash & Sons, Inc. Richmond, VA 23220.40. Burdett, Garry J. and Rood, Anthony P. 1983. Membrane-Filter,
Direct-Transfer Technique for the Analysis of Asbestos Fibers or Other Inorganic Particles by Transmission Electron Microscopy. American Chemical Society, Environmental Science and Technology. 17-11:643-649.
41. USEPA/NIOSH. 1986. A Guide to Respiratory Protection for the Asbestos Abatement Industry. Washington, DC. Office of Pesticides and Toxic Substances Asbestos Action Program. USEPA. EPA-56Q-OPTS-86-001. April 1986.
62
APPENDIX A
SUMMARY TABLES FROM REPORTS OF INDIVIDUAL FACILITIES
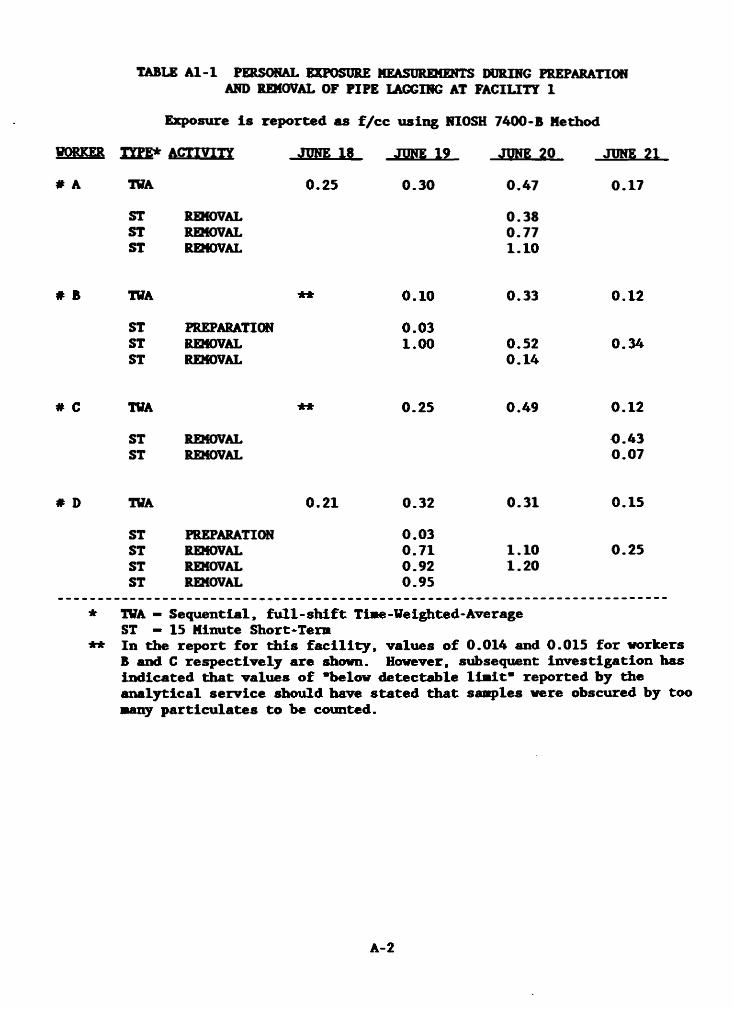
TABLE A l-1 PERSONAL EXPOSURE MEASUREMENTS DURING PREPARATIONAND REMOVAL OF PIPE LAGGING AT FACILITY 1
WORKER # A
# B
# C
# D
*
* *
Exposure is reported as f/cc using NIOSH 7400-B Method1JEE* ACTIVITY TWASTSTST
REMOVALREMOVALREMOVAL
JUNE 180.25
JUNE 190.30
JWE 20
0.470.380.771 . 1 0
JUNE 210.17
TWASTSTST
* *
PREPARATIONREMOVALREMOVAL
0 . 1 0
0.031 . 0 0
0.33
0.520.14
0 . 1 2
0.34
TWASTST
REMOVALREMOVAL
* * 0.25 0.49 0 . 1 2
0.430.07
TWASTSTSTST
0 . 2 1
PREPARATIONREMOVALREMOVALREMOVAL
0.320.030.710.920.95
0.31
1 . 1 0
1 . 2 0
0.15
0.25
TWA — Sequential, full-shift Time-Weighted* Average ST — 15 Minute Short-Ten*In the report for this facility, values of 0.014 and 0.015 for workers B and C respectively are shown. However, subsequent investigation has indicated that values of "below detectable limit" reported by the analytical service should have stated that samples were obscured by too many particulates to be counted.
A - 2
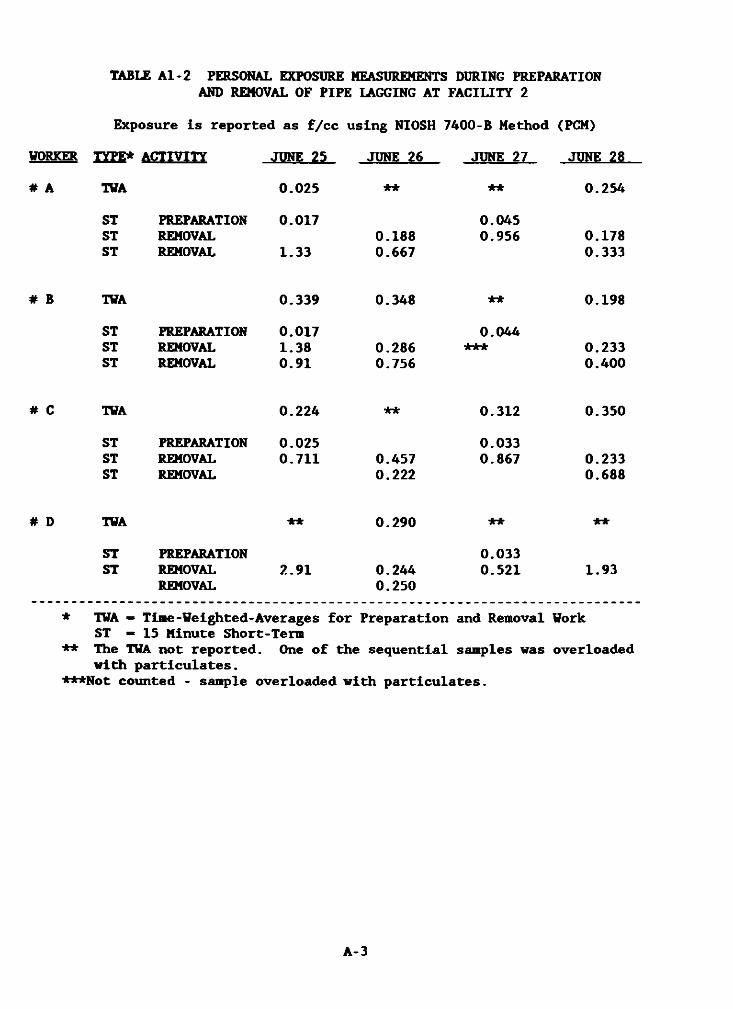
TABLE A l-2 PERSONAL EXPOSURE MEASUREMENTS DURING PREPARATIONAND REMOVAL OF PIPE LAGGING AT FACILITY 2
Exposure is reported as f/cc using NIOSH 7400-B Method (PCM) WORKER TYPE* ACTIVITY JUNE 25 JUNE 26 JUNE 27 JUNE 28# A TWA 0.025 ** ** 0.254
ST PREPARATION 0.017 0.045ST REMOVAL 0.188 0.956 0.178ST REMOVAL 1.33 0.667 0.333
# B TWA 0.339 0.348 ** 0.198ST PREPARATION 0.017 0.044ST REMOVAL 1.38 0.286 *** 0.233ST REMOVAL 0.91 0.756 0.400
# C TWA 0.224 ** 0.312 0.350ST PREPARATION 0.025 0.033ST REMOVAL 0.711 0.457 0.867 0.233ST REMOVAL 0.222 0.688
# D TWA ** 0.290 ** **ST PREPARATION 0.033ST REMOVAL 2.91 0.244 0.521 1.93
REMOVAL 0.250* TWA — Tine-Weighted-Averages for Preparation and Removal Work
ST - 15 Minute Short-Tern** The TWA not reported. One of the sequential samples was overloaded
with particulates.***Not counted - sample overloaded with particulates.
A -3
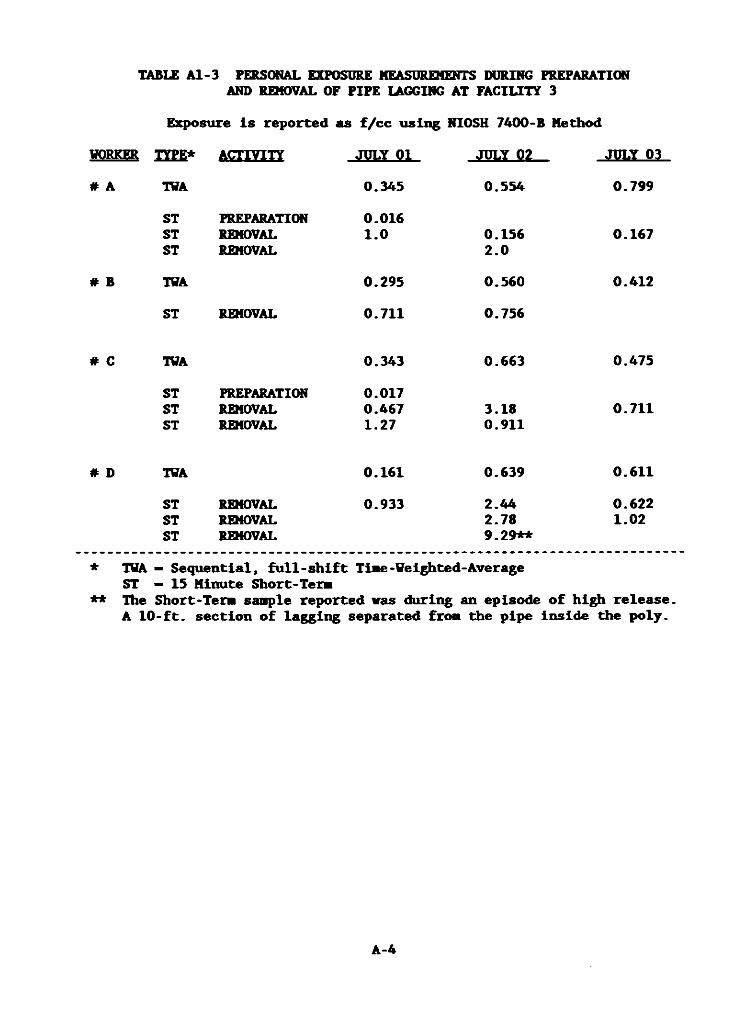
TABLE A l-3 PERSONAL EXPOSURE MEASUREMENTS DURING PREPARATIONAND REMOVAL OF PIPE LAGGING AT FACILITY 3
Exposure is reported as f/cc using NIOSH 7400-B Method
WORKER REE* ACTIVITY# A
# B
TWASTSTSTTWAST
PREPARATIONREMOVALREMOVAL
REMOVAL
JULY 010.3450.0161 . 0
0.2950.711
JULY 02 0.554
0.1562 . 0
0.5600.756
JULY 030.799
0.167
0.412
# C TWA
STSTST
PREPARATIONREMOVALREMOVAL
0.3430.0170.4671.27
0.663
3.180.911
0.475
0.711
# D TWASTSTST
REMOVALREMOVALREMOVAL
0.1610.933
0.6392.442.789.29**
0.6110.6221 . 0 2
* TWA — Sequential, full-shift Ti»e-Weighted-Average ST — 15 Minute Short-Ten
** The Short-Ter* sanple reported was during an episode of high release. A 10-ft. section of lagging separated from the pipe inside the poly.
A-4
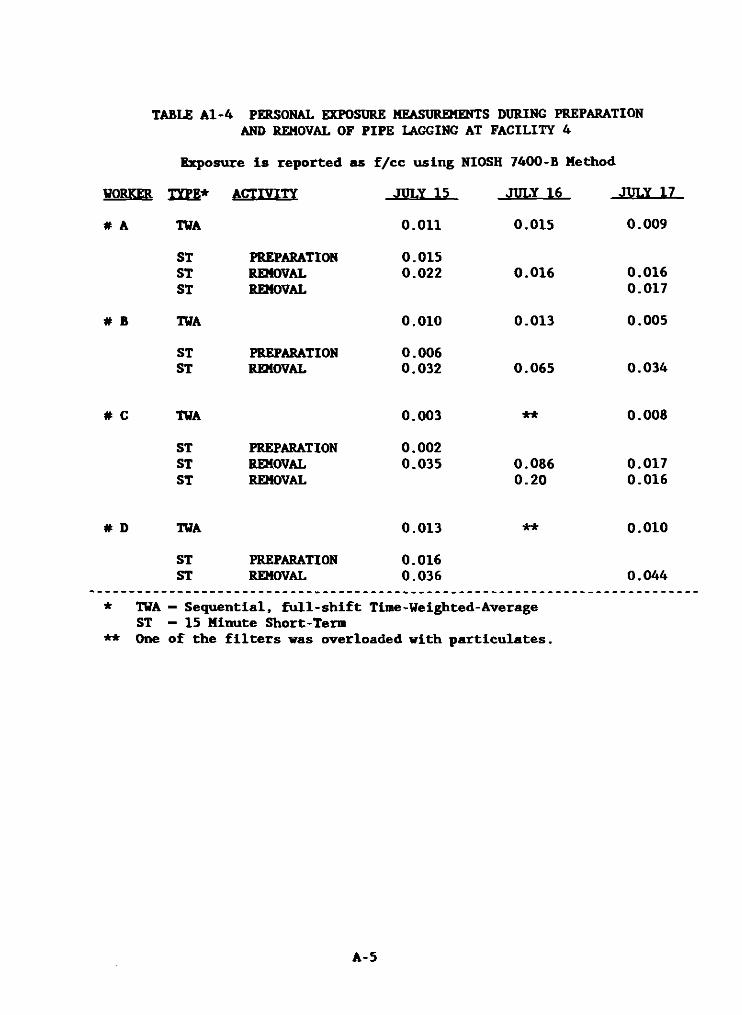
Exposure is reported as f/cc using NIOSH 7400-B MethodWORKER TYPE* ACTIVITY JULY 15 JULY 16 JULY 17# A TWA 0.011 0.015 0.009
ST PREPARATION 0.015ST REMOVAL 0.022 0.016 0.016ST REMOVAL 0.017
# B TWA 0.010 0.013 0.005ST PREPARATION 0.006ST REMOVAL 0.032 0.065 0.034
# C TWA 0.003 ** 0.008ST PREPARATION 0.002ST REMOVAL 0.035 0.086 0.017ST REMOVAL 0.20 0.016
# D TWA 0.013 ** 0.010ST PREPARATION 0.016ST REMOVAL 0.036 0.044
# TWA — Sequential, full-shift Time-Weighted-Average ST — 15 Minute Short-Term
** One of the filters was overloaded with particulates.
TABLE A l-4 PERSONAL EXPOSURE MEASUREMENTS DURING PREPARATIONAND REMOVAL OF PIPE LAGGING AT FACILITY 4
A-5
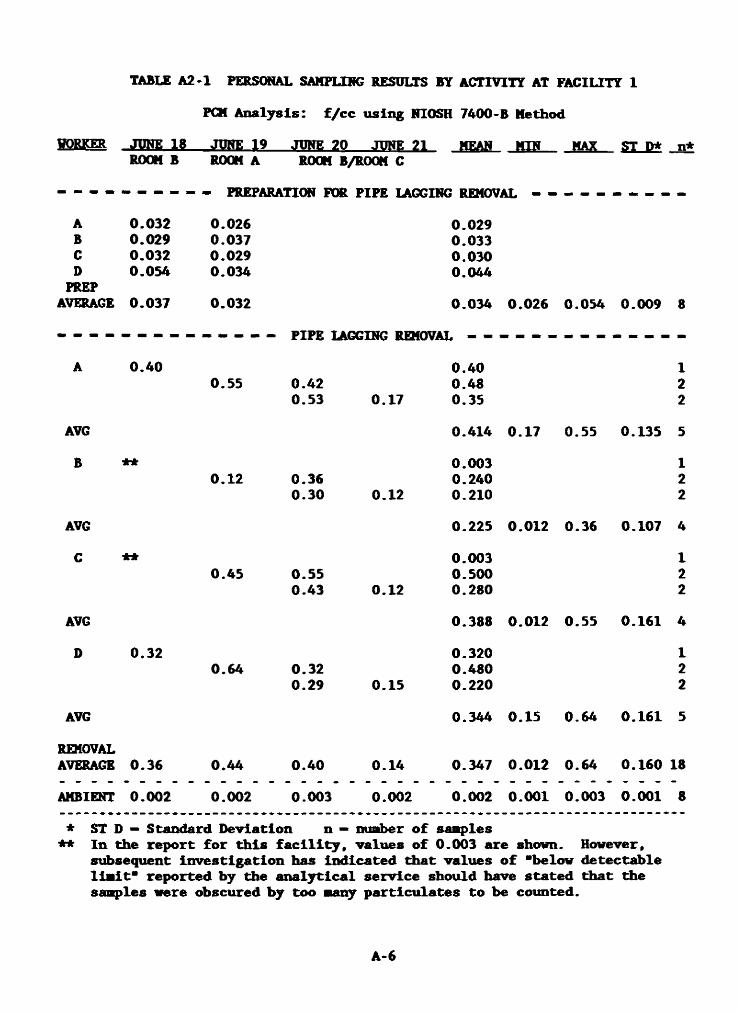
TABLE A2-1 PERSONAL SAMPLING RESULTS BY ACTIVITY AT FACILITY 1
PCM A n a ly s is : f / c c u s in g NIOSH 7400-B M ethod
WORKER JUNE 18ROOM B ROOM A ROOM B/ROOM C
- PREPARATION FOR PIPE LAGGING REMOVAL - -ABCDPREPAVERAGE
0.0320.0290.0320.0540.037
0.0260.0370.0290.0340.032
0.0290.0330.0300.0440.034 0.026 0.054 0.009 8
PIPE LAGGING REMOVAL - -A 0.40
0.55 0.420.53 0.17
0.400.480.35
122
AVG 0.414 0.17 0.55 0.135 5B **
0.12 0.360.30 0.12
0.0030.2400.210
122
AVG 0.225 0.012 0.36 0.107 4C **
0.45 0.550.43 0.12
0.0030.5000.280
122
AVG 0.388 0.012 0.55 0.161 4D 0.32
0.64 0.320.29 0.15
0.3200.4800.220
122
AVG 0.344 0.15 0.64 0.161 5
REMOVALAVERAGE 0.36 0.44 0.40 0.14 0.347 0.012 0.64 0.160 18AMBIENT 0.002 0.002 0.003 0.002 0.002 0.001 0.003 0.001 8* ST D — Standard Deviation n — number of samples** In the report for this facility, values of 0.003 are shown. However,
subsequent investigation has indicated that values of "below detectable limit" reported by the analytical service should have stated that the samples were obscured by too many particulates to be counted.
A-6
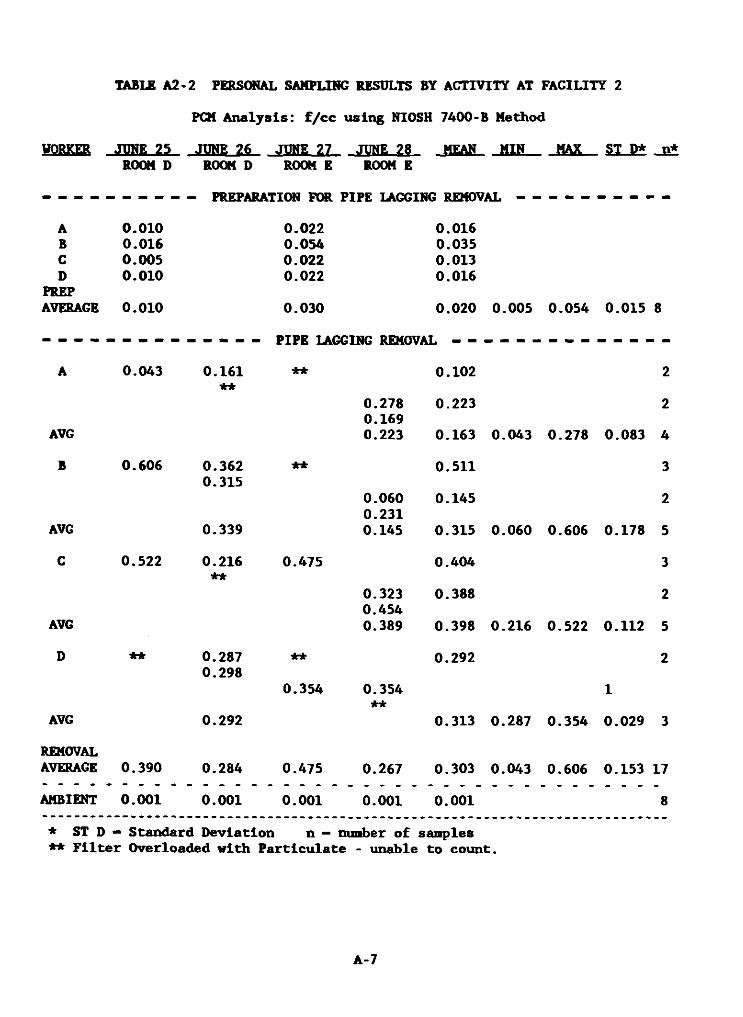
TABLE A2~2 PERSONAL SAMPLING RESULTS BY ACTIVITY AT FACILITY 2
WORKER JUNE 25 ROOM D
PCM Analysis: f/cc using NIOSH 7400-B MethodJUNE 26 JUNE 27 JUNE 28 MEAN MIN___MAE _ SI P*ROOM D ROOM E ROOM EPREPARATION FOR PIPE LAGGING REMOVAL
A 0.010 0.022 0.016B 0.016 0.054 0.035C 0.005 0.022 0.013D 0.010 0.022 0.016
PREPAVERAGE 0.010 0.030 0.020 0.005 0.054 0.015 8
PIPE LAGGING REMOVAL - -A 0.043 0.161 ** 0.102 2
**0.278 0.223 20.169
AVG 0.223 0.163 0.043 0.278 0.083 4B 0.606 0.362 ** 0.511 3
0.3150.060 0.145 20.231
AVG 0.339 0.145 0.315 0.060 0.606 0.178 5C 0.522 0.216 0.475 0.404 3**
0.323 0.388 20.454
AVG 0.389 0.398 0.216 0.522 0.112 5D ** 0.287 ** 0.292 2
0.2980.354 0.354 1**
AVG 0.292 0.313 0.287 0.354 0.029 3REMOVALAVERAGE 0.390 0.284 0.475 0.267 0.303 0.043 0.606 0.153 17AMBIENT 0.001 0.001 0.001 0.001 0.001 8* ST D — Standard Deviation n — number of samples** Filter Overloaded with Particulate - unable to count.
A-7
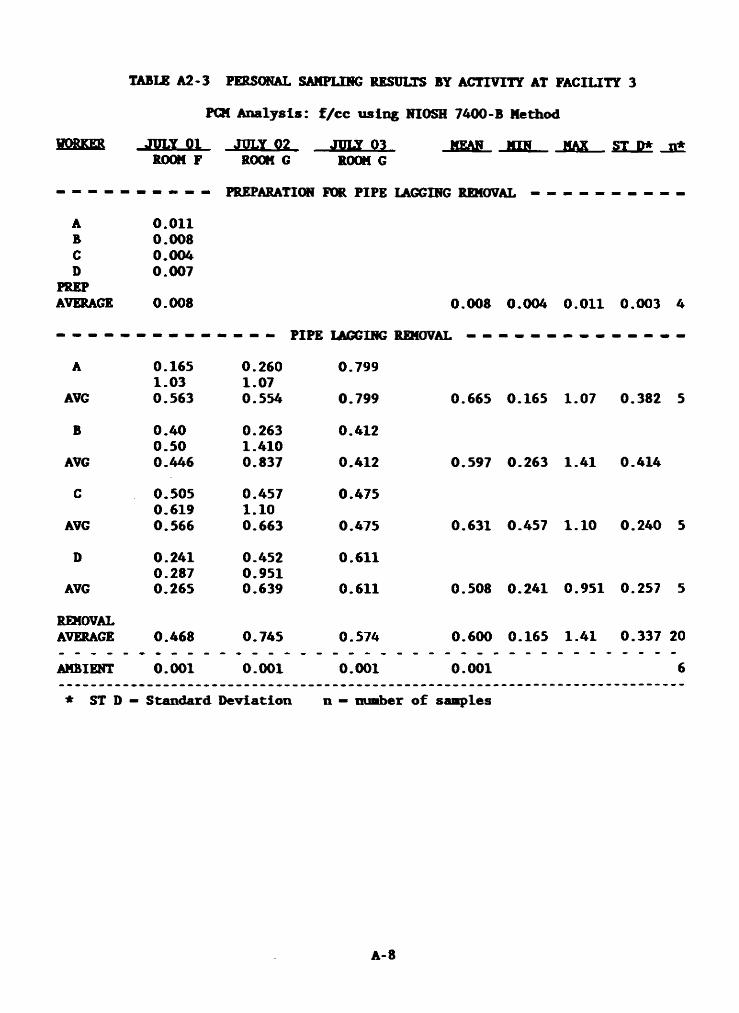
PCM Analysis: f/cc using NIOSH 7400-B MethodHPPEEB -JVLY-gl -JVLY Q2 JULY 03 MEAN MIN MAX ST D* n*
ROOM F ROOM G ROOM G- - - - - - - - - - PREPARATION FOR PIPE LAGGING REMOVAL - - - - - - - - - -
TABLE A2-3 PERSONAL SAMPLING RESULTS BY ACTIVITY AT FACILITY 3
A 0.011B 0.008C 0.004D 0.007
PREPAVERAGE 0.008
PIPE LAGGING REMOVALA 0.165 0.260 0.799
1.03 1.07AVG 0.563 0.554 0.799 0.665 0.165 1.07 0.382 5B 0.40 0.263 0.412
0.50 1.410AVG 0.446 0.837 0.412 0.597 0.263 1.41 0.414C 0.505 0.457 0.475
0.619 1.10AVG 0.566 0.663 0.475 0.631 0.457 1.10 0.240 5D 0.241 0.452 0.611
0.287 0.951AVG 0.265 0.639 0.611 0.508 0.241 0.951 0.257 5REMOVALAVERAGE 0.468 0.745 0.574 0.600 0.165 1.41 0.337 20AMBIENT 0.001 0.001 0.001 0.001 6* ST D — Standard Deviation n — number of samples
A - 8
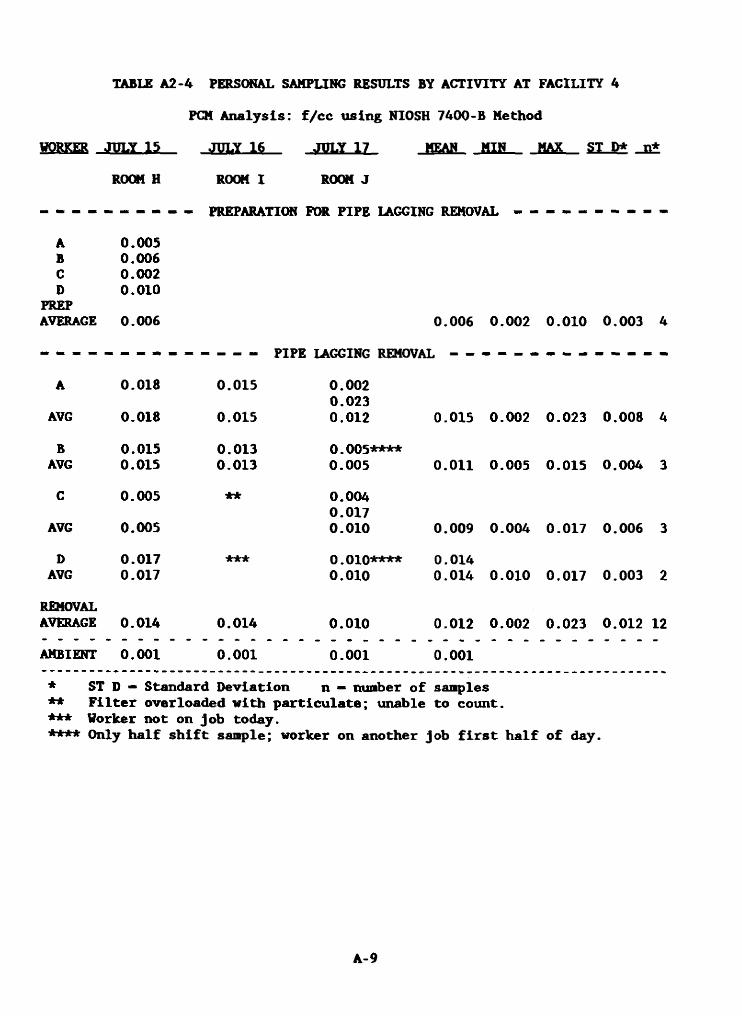
WORKER JULY 15 ROOM H
JULY 16 JULY 17 MEAN MIN MAX ST P* _JB*
TABLE A2-4 PERSONAL SAMPLING RESULTS BY ACTIVITY AT FACILITY 4
PCM A n a ly s is : f / c c u s in g NIOSH 7400-B M ethod
A 0.005B 0.006C 0.002D 0.010
PREPAVERAGE 0.006
REMOVALAVERAGE 0.014
ROOM I ROOM JPREPARATION FOR PIPE LAGGING REMOVAL
0.006 0.002 0.010 0.003 4PIPE LAGGING REMOVAL
A 0.018 0.015 0.0020.023
AVG 0.018 0.015 0.012 0.015 0.002 0.023 0.008B 0.015 0.013 0.005****AVG 0.015 0.013 0.005 0.011 0.005 0.015 0.004C 0.005 ** 0.004
0.017AVG 0.005 0.010 0.009 0.004 0.017 0.006D 0.017 0.010**** 0.014AVG 0.017 0.010 0.014 0.010 0.017 0.003
0.0140 . 0 0 1
0 . 0 1 0
0 . 0 0 1
0.012 0.002 0.023 0.012 120 . 0 0 1AMBIENT
*
0 . 0 0 1
ST D — Standard Deviation n — lumber of samples ** Filter overloaded with particulate; unable to count.*** Worker not on job today.**** Only half shift sample; worker on another job first half of day.
A-9
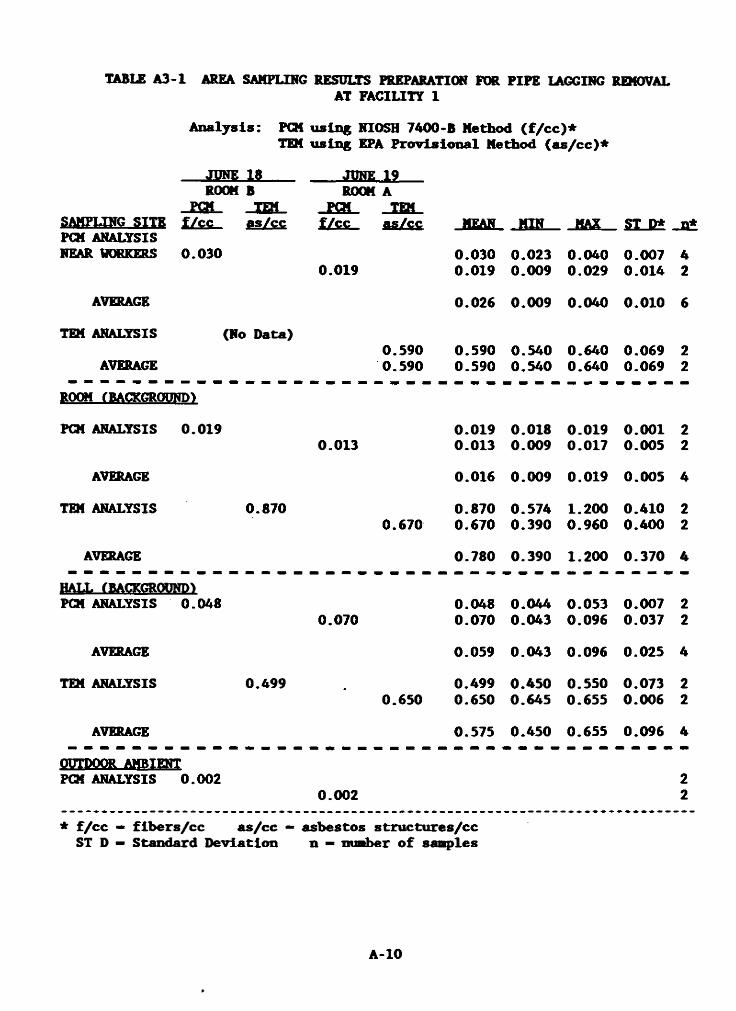
TABLE A3-1 AREA SAMPLING RESULTS PREPARATION FOR PIPE LAGGING REMOVALAT FACILITY 1
Analysis: PCM using NIOSH 7400-B Method (f/cc)*TEM using EPA Provisional Method (as/cc)*
JUNE 18 JUNE 19ROOM
PÇHSAMPLING SITE f/cc
BTEHas/cc
ROOM A-fgi, .TBLf/cc as/cc MEAN
0.0300.019
MIN MAX ST D* JB*42
PCM ANALYSISNEAR WORKERS 0.030
0.0190.0230.009
0.0400.029
0.0070.014
AVERAGE 0.026 0.009 0.040 0.010 6TEM ANALYSIS (No Data)
AVERAGE0.5900.590
0.5900.590
0.5400.540
0.6400.640
0.0690.069
22
ROOM (BACKGROUND)PCM ANALYSIS 0.019
0.0130.0190.013
0.0180.009
0.0190.017
0.0010.005
22
AVERAGE 0.016 0.009 0.019 0.005 4TEM ANALYSIS 0.870
0.6700.8700.670
0.5740.390
1.2000.960
0.4100.400
22
AVERAGE 0.780 0.390 1.200 0.370 4HALL (BACKGROUND)PCM ANALYSIS 0.048
0.0700.0480.070
0.0440.043
0.0530.096
0.0070.037
22
AVERAGE 0.059 0.043 0.096 0.025 4TEM ANALYSIS 0.499 • 0.650
0.4990.650
0.4500.645
0.5500.655
0.0730.006
22
AVERAGE 0.575 0.450 0.655 0.096 4OUTDOOR AMBIENT PCM ANALYSIS 0.002
0.00222
* f/cc — fibers/cc as/cc — asbestos structures/cc ST D — Standard Deviation n — number of samples
A-10
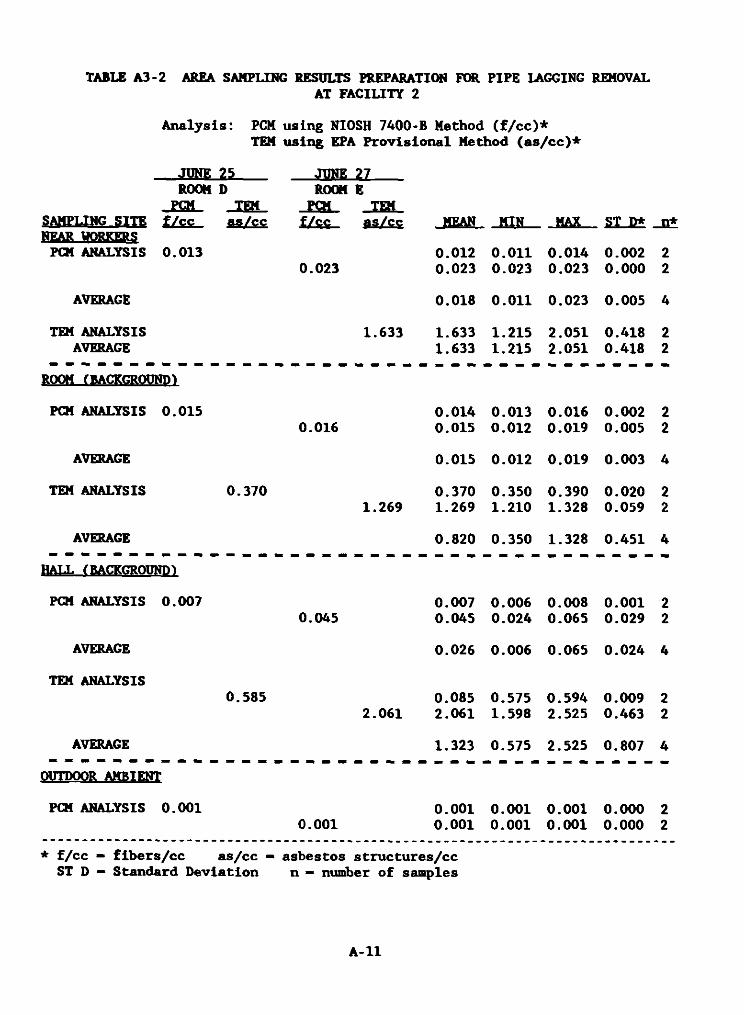
T A B L E A 3 - 2 A R E A S A M P L IN G R E S U L T S P R E P A R A T IO N F O R P I P E L A G G IN G R E M O V A L
A T F A C I L I T Y 2
A n alysis : PCM using NIOSH 7400-B Method ( f /c c ) *TEM using EPA P ro v is io n a l Method (a s /c c )*
JUNE 25 JUNE 27ROOM D ROOM E
PCM TEM PCM TEMSAMPLING SITE f /c c as/cc f/g<?
0.023
as/cc MEAN MIN MAX ST D* n *NEAR WORKERS
PCM ANALYSIS 0 .013 0.0120.023
0.0110.023
0.0140.023
0.0020.000
22
AVERAGE 0.018 0.011 0.023 0.005 4
TEM ANALYSIS AVERAGE
1.633 1.6331.633
1.2151.215
2.0512.051
0.4180.418
22
R00M_f BACKGROUND)
PCM ANALYSIS 0.0150.016
0.0140.015
0.0130.012
0.0160.019
0.0020.005
22
AVERAGE 0.015 0.012 0.019 0.003 4
TEM ANALYSIS 0.3701.269
0.3701.269
0.3501.210
0.3901.328
0.0200.059
22
AVERAGE 0.820 0.350 1.328 0.451 4
HALL (BACKGROUND)
PCM ANALYSIS 0.0070.045
0.0070.045
0 .0060.024
0.0080.065
0.0010.029
22
AVERAGE 0.026 0.006 0.065 0.024 4
TEM ANALYSIS0.585
2.0610.0852.061
0.5751.598
0.5942.525
0.0090.463
22
AVERAGE 1.323 0.575 2.525 0.807 4
OUTDOOR AMBIENT
PCM ANALYSIS 0.0010.001
0.0010.001
0.0010.001
0.0010.001
0.0000.000
22
* f /c c — fib e rs /c c as/cc — asbestos s tru c tu res /cc ST D — Standard D ev ia tio n n — number o f samples
A - 1 1
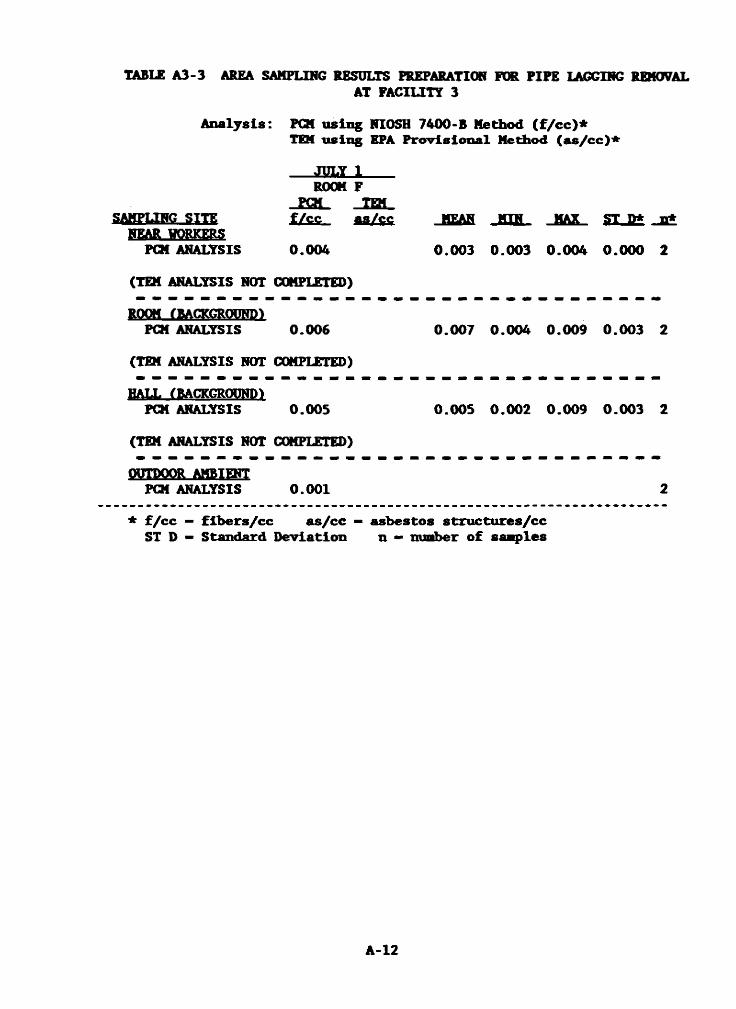
A n alysis : PCM using NIOSH 7400-B Method ( f /c c ) *TEM using EPA P ro v is io n a l Method (a s /c c )*
_______ m i x _________
T A B L E A 3 - 3 A R E A S A M P L IN G R E S U L T S P R E P A R A T IO N F O R P I P E L A G G IN G R E M O V A L
A T F A C I L I T Y 3
ROOM F PCM TEM
SAMPLING SITE f /c c as /cc MEAN MIN MAX S T D * n *NEAR WORKERS
PCM ANALYSIS 0.004 0.003 0.003 0 .004 0 .000
(TEM ANALYSIS NOT COMPLETED)
ROOM (BACKGROUND) PCM ANALYSIS 0.006 0.007 0.004 0.009 0.003
(TEM ANALYSIS NOT COMPLETED)
HALL (BACKGROUND) PCM ANALYSIS 0.005 0.005 0.002 0.009 0.003
(TEM ANALYSIS NOT COMPLETED)
OUTDOOR AMBIENT PCM ANALYSIS 0.001
* f /c c — fib e rs /c c as /cc — asbestos s tru c tu re s /c c ST D — Standard D ev ia tio n n • number o f samples
A - 1 2
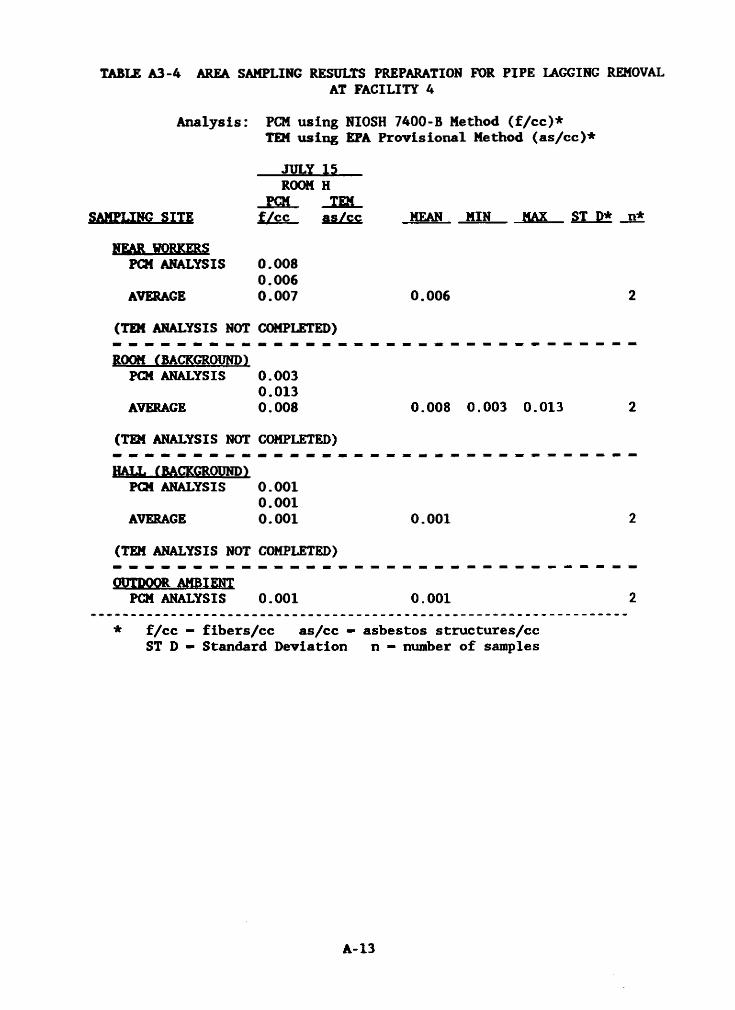
A n alysis : PCM using NIOSH 7400-B Method ( f /c c ) *TEM using EPA P ro v is io n a l Method (a s /c c )*
_______J T O T 1 5 _______
ROOM H PCM TEM
SAMPLING SITE f /p c as/cc JCEAN. _MIN_______ MAX ST B* _n*
PEAR WORKERS
T A B L E A 3 - 4 A R E A S A M P L IN G R E S U L T S P R E P A R A T IO N F O R P I P E L A G G IN G R E M O V A L
A T F A C I L I T Y 4
PCM ANALYSIS
AVERAGE
0.0080.0060.007 0.006 2
(TEM ANALYSIS NOT COMPLETED)
ROOM ( BACKGROUND ) PCM ANALYSIS
AVERAGE
0.0030.0130.008 0.008 0.003 0.013 2
(TEM ANALYSIS NOT COMPLETED)
HALL (BACKGROUND) PCM ANALYSIS
AVERAGE
0.0010.0010.001 0.001 2
(TEM ANALYSIS NOT COMPLETED)
OUTDOOR AMBIENT PCM ANALYSIS 0.001 0.001 2
* f /c c — fib e rs /c c as/cc — asbestos s tru c tu res /cc ST D — Standard D ev ia tio n n - number o f samples
A - 1 3
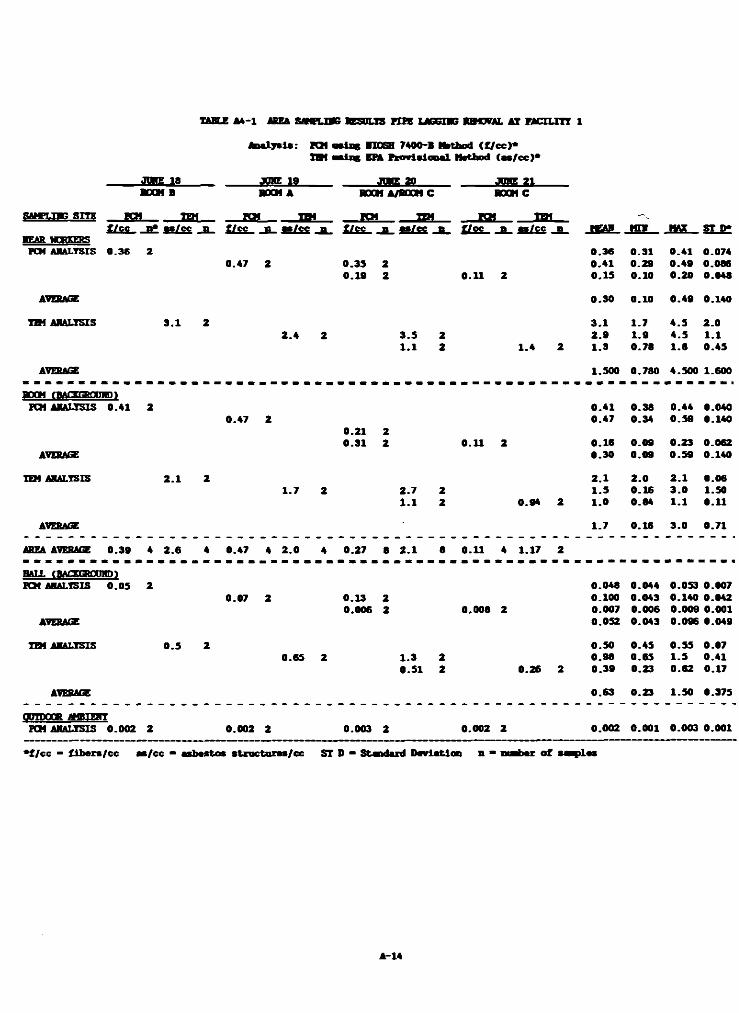
TABLE A4-1 AKEA 8 M U K RESm.TS THE UOSXWG K9OTAL AT FACXLIYY 1
to a ly s i» : PC« m il« BDOSB 7400-1 M»thod (f/cc> *IM M in s EFÄ Ffcovislcn«1 Mvtbod (a s /c c )*
JW E M______________ *WE 19______________ ¿S S -2 S ______________ JW E 21BOOM B BOOM A BOOM A/BOOM C BOOM C
SAWLIBS SITE PCM TEM PCM TM PCM OH PCM 1 »g/99 - B l m*/cc j _ t /c c n a s /c c n f /c c _ ! !■ f /c c a a s /c c n f f n ST P*
REAR MXKERSPCM JUULTSIS 0.3 6 2 0 .3 6 0 .31 0.41 0.074
0.47 2 0 .3 5 2 0 .4 1 0 .29 0 .4 9 0.0860 .1 9 2 0 .1 1 2 0 .1 5 0 .10 0 .20 0.048
AVERAGE 0.3 0 0.10 0 .4 9 0.140
TZM ANALYSIS 3 .1 2 3 .1 1 .7 4 .5 2 .02 .4 2 3 .5 2 2 .9 1 .9 4 .5 1 .1
1 .1 2 1 .4 2 1 .3 0 .78 1 .8 0 .4 5
AVERAGE 1.500 0.780 4.500 1.600
BDCM fBAOEGROCHD)PCM AMAU5IS 0 .41 2 0 .4 1 0 .38 0.44 0.040
0 .47 2 0 .47 0.34 0 .5 9 0.1400 .21 20 .3 1 2 0 .1 1 2 0 .1 6 0 .09 0 .23 0.062
AVERAGE 0.30 0 .09 0 .5 9 0.140
TEH AHALX5IS 2 .1 2 2 .1 2 .0 2 .1 0 .061 .7 2 2 .7 2 1 .5 0 .16 3 .0 1.50
1 .1 2 0 .94 2 1 .0 0.84 1 .1 0.11
AVERAGE 1 .7 0 .16 3 .0 0 .71
AREA AVERAIZ 0 .3 9 4 2 .6 4 0 .47 4 2 .0 4 0 .2 7 8 2 .1 8 0 .11 4 1.17 2
m t J . fU A T T ERO Q H D i
PCM AHAL1SIS 0 .0 5
AVERAGE
20.07 2 0 .13
0.00622 0.008 2
0.0480.1000.0070.052
0.0440.0430.0060.043
0.053 0.007 0.140 0.042 0.009 0.001 0.096 0.049
TEM ABALXSIS 0 .5 20.65 2 1 .3
0 .5122 0 .26 2
0 .500 .9 80 .3 9
0 .450 .650.23
0 .5 5 0 .07 1 .5 0 .41 0 .6 2 0 .17
AVERAGE 0 .6 3 0 .23 1.50 0.375
OUTDOOR AMBmrr PCM ANALYSIS 0 .002 2 0.002 2 0.003 2 0.002 2 0.002 0.001 0.003 0.001
• f /c c “ f ib e r* /c c a a /c c * a sb es to s sfc ro cto ras/cc ST D * S tandard D ev iatio n n * r a b e r o f m ^ I m
A -14
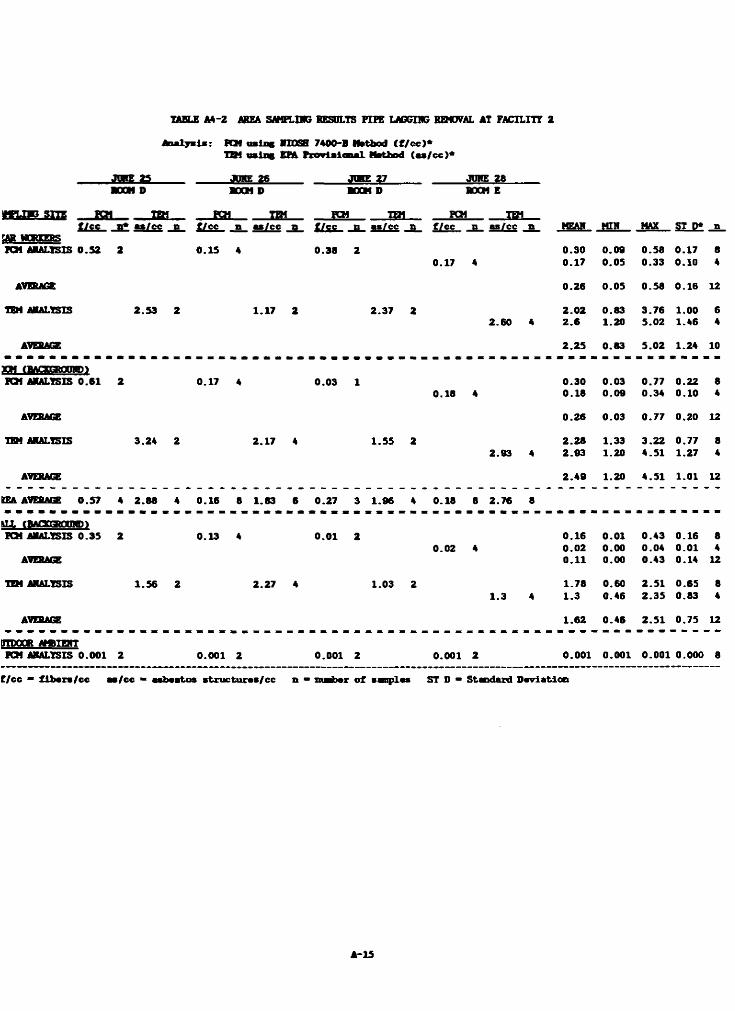
TABLE M -Z AREA SAMFLHI5 RESULTS FIFE LAGGING REMOVAL AT FACILITY 2
A n a ly sis: FQ1 o sin * KWSS 7400-8 Mstbod ( f /c c )*TEM u sin g EFA P ro v is io n a l Method C as/cc)*
JUNE 26 J I R 27 JUNE 28MOM D KXH D ■COM D R0CM E
K fU U SITE FCM TEH _KH_ TIM FCM TEM PCM TEMf/c c «* a s /c c n
!AR HCRXESSTOi ANALYSIS 0 .5 2 2
f /c c a a s /c c a
0 .15 4
f /c c a a a /c c n f /c c
0 .38 20.17
p aa /c c _
4
a keau
0.300.17
MIN
0.090.05
MAX
0.580.33
ST D*
0.170.10
a
84
AVERAGE 0.26 0 .05 0 .58 0 .16 12
TIM ANALYSIS 2 .5 3 2 1 .17 2 2 .37 22 .6 0 4
2 .0 22 .6
0.831.20
3 .765.02
1.001.46
64
AVERAGE 2 .2 5 0.83 5 .02 1.24 10
jcm tm o D a o m o FQf ANALYSIS 0 .61 2 0 .17 4 0.03 1
0.18 40 .300 .18
0.030 .09
0.770.34
0.220.10
84
AVERAGE 0 .2 6 0 .03 0 .7 7 0.20 12
TIM ANALYSIS 3.24 2 2 .1 7 4 1 .55 22.93 4
2 .2 82 .93
1.331.20
3 .224.51
0.771.27
84
AVERAGE 2 .4 9 1.20 4 .51 1.01 12
1£A AVESACC 0 .57 4 2 .8 8 4 0 .16 8 1.83 6 0 .27 3 1 .96 4 0.18 8 2 .76 8
u j. cB A aaaanD k FCM ANALYSIS 0 .35
AVERAGE
2 0.13 4 0 .0 1 20.02 4
0 .160 .020 .1 1
0.010.000.00
0 .430.040 .43
0.160.010.14
84
12
TIM ANALYSIS 1 .56 2 2 .27 4 1.03 21 .3 4
1.781 .3
0.600.46
2 .5 12 .3 5
0.650.83
84
AVEBAGE 1.62 0 .46 2 .5 1 0 .75 12
HTDOCR M IB IT FCM ANALYSIS 0.001 2 0.001 2 0.001 2 0.001 2 0.001 0.001 0.001 0.000 8
f/c c ” f ib e rs /c c a s /c c ■ a sb e s to s s tru c tu re s /c c n * m afcer o f ssn p le s ST D * S tandard D ev ia tio n
A* 15
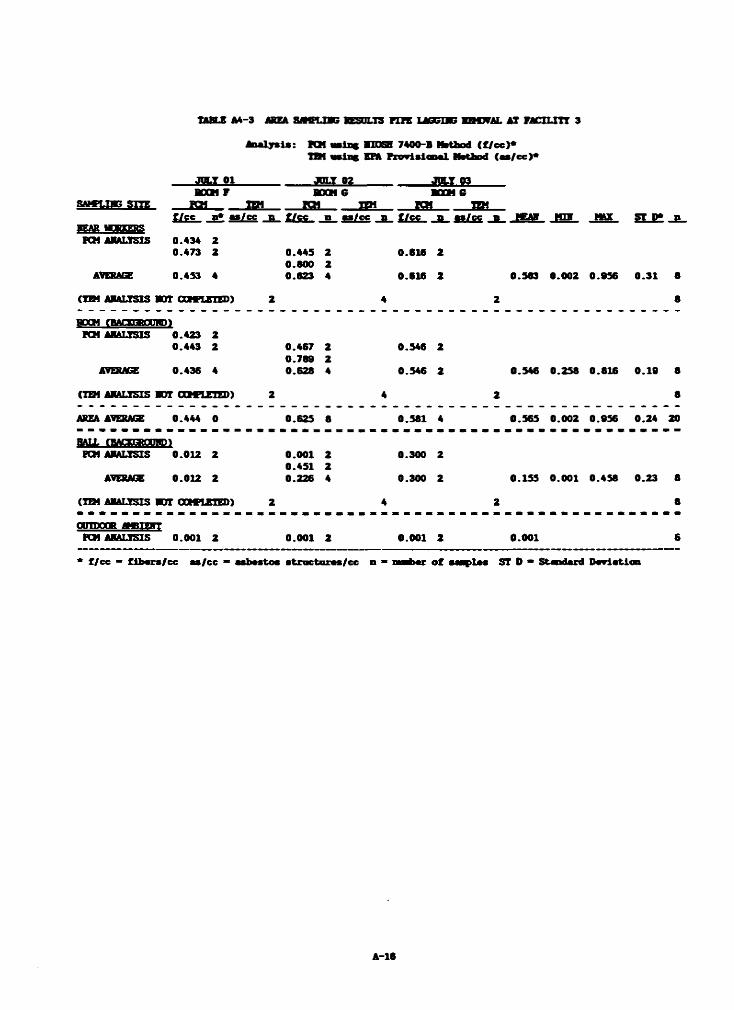
A n aly sis: FCM « six « U D O 7400-B Mathod ( f /c c )*T » w in g D I P ro v is io n a l Hatfwd (a a /c c )*
_______J g J O l _______________________ J g J 0 2 ________________________ J t t i W
BOCM F RDB9 6 KGM 6gTTK- __E3!_______ffi*_______ ic h u m KM nw
f /c c a* a s /c c p f /c c n « a /cc » f /c c a a a /c c a m i H ü HM S I P* n■KAR M m S
PCM AHAL3SXS 0.434 20.473 2 0.445 2 0.616 2
0 . 0 0 0 2
TABLE M - 3 IKEA S4MFLIBG RESOUS F U E U O G D C RZM7VAL AT FACUJTT 9
AVERAGE 0.4S3 4 0.623 4 0.616 2 0.583 0.002 0.956 0 .31 8
(TEM ARALXSIS ROT CMXTTED) 2 4 2 8
ROCH (BAODGSODIID)r a t a ä a l ts is 0.423 2
0.443 2
JOTRAGE 0.436 4
0.4670.7880.628
224
0.546
0.546
2
2 0.546 0.258 0.816 0 .1 9 8
(U H ARALXSIS ROT ODCLETED) 2 4 2 8
AREA AVERAGE 0.444 0 0.625 8 0.581 4 0.565 0.002 0.956 0 .24 20
HALL fBAOCTOMm PCH ARALXSIS 0.012 2
AVERAGE 0.012 2
0.0010.4510.226
224
0.300
0.300
2
2 0.155 0.001 0.458 0 .23 8
(TEH ARALXSIS ROT GOMIEIED) 2 4 2 8
OUTDOOR M U H T PCH ARALXSIS 0.001 2 0.001 2 0.001 2 0.001 6
* f /c c ” f ib a ra /e c a a /c c ” aabaatoa a tro c tu ra a /c c a “ n r i m o f aaaftLss ST 0 * S ta id a rd D v ria tlo n
A -16
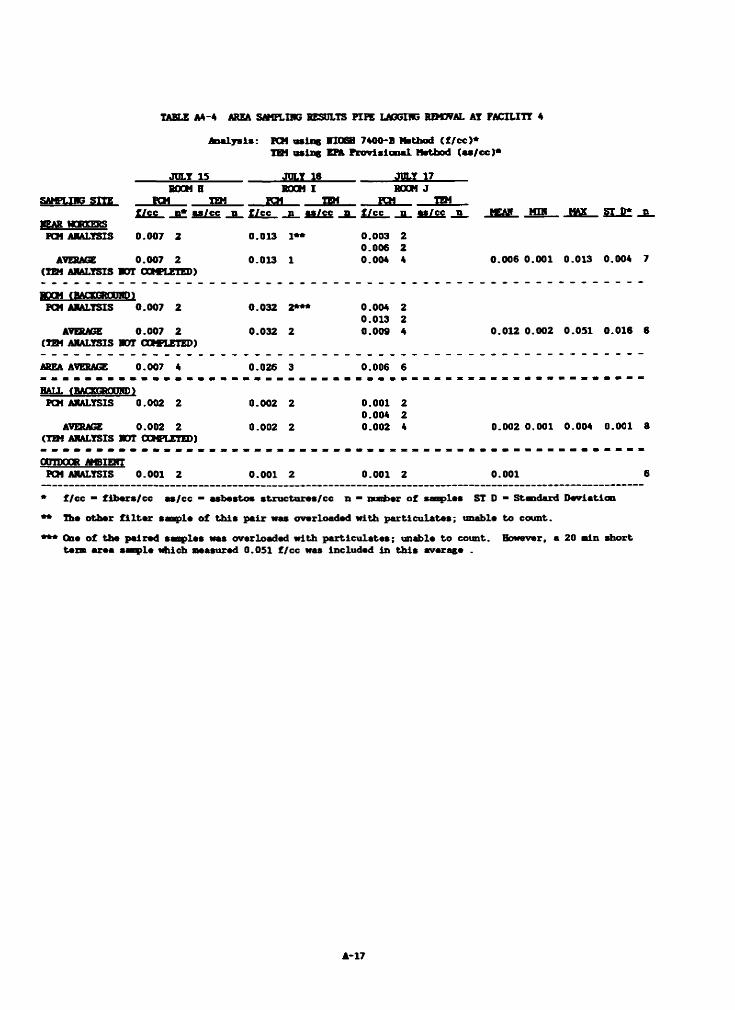
TABU A 4-4 AREA SAKFLIUG RESULTS FIFE LAGGING BEMOVAL AT FACILITY 4
A n aly sis: PCM u s ii« 1X068 7400-B N ttbod (f /c c )*TEH u sin g D& P ro v is io n a l Mstfaod (a s /c c )*
JPLT 15_____________ JOLT 16_____________ JOLT 17_______BOOM B BOGM I ROOM J
sam p lu p s i t e ___k h h m fcm ___tem fc h _______w * ___f /c c a* a a /c c a f /c c a a» /cc a f /c c a a s /c c a FCAH MM MAX ST D* a
tju? yaaratsPOf AKALTSIS 0.007 2 0.013 1** 0.003 2
0.006 2AVERAGE 0.007 2 0.013 1 0.004 4 0.006 0.001 0.013 0.004 7
(TEH AKALTSIS SOT OOWLE1ED)
HOCH fBAOagKHWn PCM AKALTSIS 0.007 2 0.032 2*** 0.004 2
0.013 2AVERAGE 0.007 2 0.032 2 0.009 4 0.012 0.002 0.051 0 .016 6
(TEH AKALTSIS WOT COffLETED)
AREA AVERAGE 0.007 4 0.026 3 0.006 6
ball fR A fxrayrnmPCM AKALTSIS 0.002 2 0.002 2 0.001 2
0.004 2AVHMGE 0.002 2 0.002 2 0.002 4 0.002 0.001 0.004 0.001 8
(TEH AKALTSIS MOT COM’LETED)
OPTOOOR AHBIEHTPCM AKALTSIS 0.001 2 0.001 2 0.001 2 0.001 6
* f /c c ” f ib e rs /c c a s /c c ” a sb es to s s tru c tu re s /c c a ” nuofcer o f san p les ST D “ S tn d a rd D ev ia tio n
** The o th e r f i l t e r sam ple o f th i s p a ir was overloaded w ith p a r tic u la te s ; unable to co u n t.
*** One o f th e p a ire d sam ples was overloaded w ith p a r tic u la te s ; unable to co un t. However, a 20 a in sh o rt t e n a re a saag>le w hich m easured 0.051 f /c c was in c lu d ed in th is average .
A -17
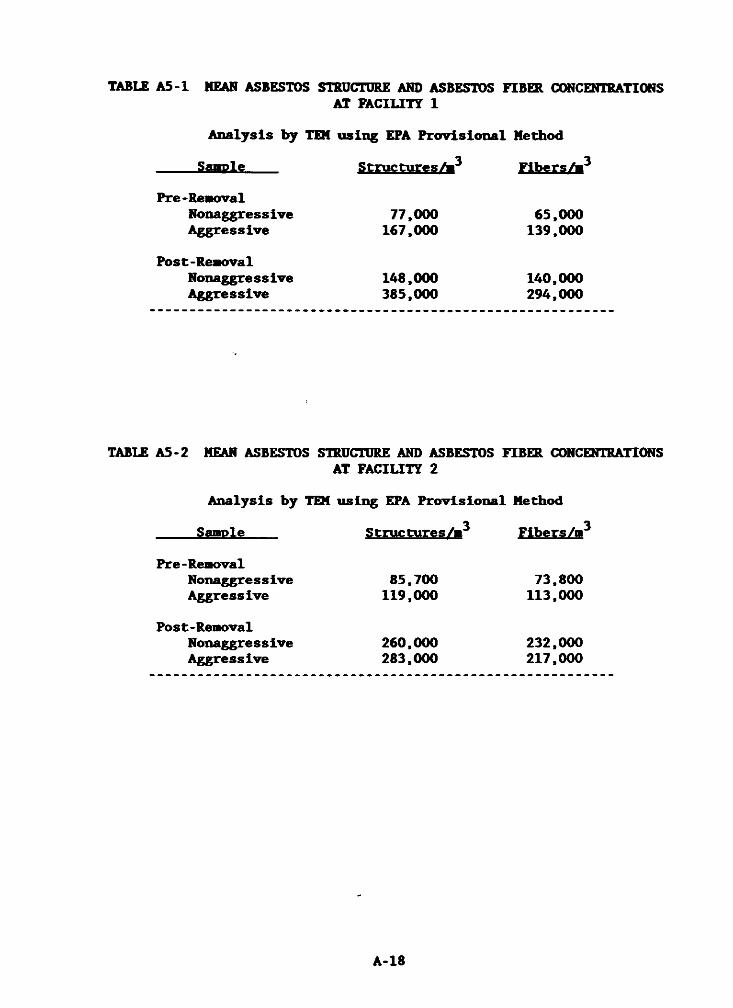
A nalysis by TEM using EFA P ro v is io n a l Method
--------- SfflBple____ S tru c tu re s /» 3 F ib e rs /a 3
Pre-RemovalNonaggressive 77,000 65,000Aggressive 167,000 139,000
Post-RemovalNonaggressive 148,000 140,000Aggressive 385,000 294,000
T A B L E A 5 - 1 M E A N A S B E S T O S S T R U C T U R E A N D A S B E S T O S F I B E R C O N C E N T R A T IO N S
A T F A C I L I T Y 1
TABLE A5-2 MEAN ASBESTOS STRUCTURE AND ASBESTOS FIBER CONCENTRATIONSAT FACILITY 2
A nalysis by TEM using EPA P ro v is io n a l Method
_____ Sample____ S tructures/m 3 Fibers/m 3
Pre-RemovalNonaggressive 85,700 73,800Aggressive 119,000 113,000
Post-RemovalNonaggressive 260,000 232,000Aggressive 283,000 217,000
A - 1 8
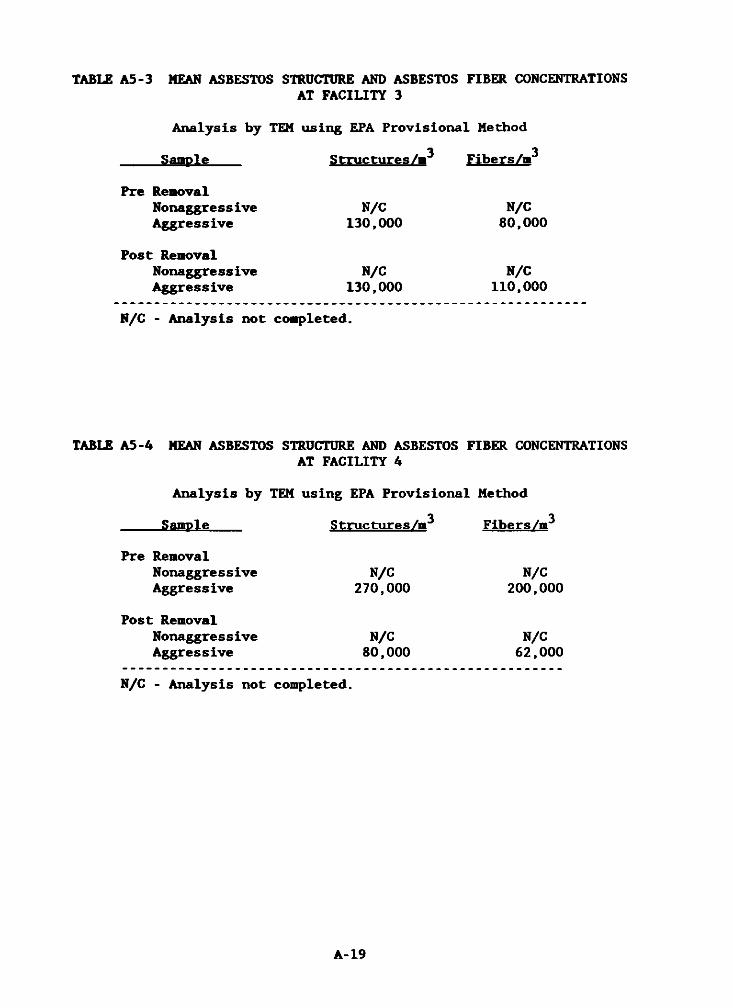
T A B L E A 5 - 3 M E A N A S B E S T O S S T R U C T U R E A N D A S B E S T O S F I B E R C O N C E N T R A T IO N S
A T F A C I L I T Y 3
A nalysis by TEM using EPA P ro v is io n a l Method
3 3Sunpli* S tru c tu re s /» Fibers/m
Pre RenovalNonaggressive N/C N/CAggressive 130,000 80,000
Post RenovalNonaggressive N/C N/CAggressive 130,000 110,000
N/C - A nalysis not completed.
TABLE A5-4 MEAN ASBESTOS STRUCTURE AND ASBESTOS FIBER CONCENTRATIONSAT FACILITY 4
A nalysis by TEM using EPA P ro v is io n a l Method
3 3_____ Sample Structures/m Fibers/m
Pre RemovalNonaggressive N/C N/CAggressive 270,000 200,000
Post RemovalNonaggressive N/C N/CAggressive 80,000 62,000
N/C - A nalysis not completed.
A - 1 9
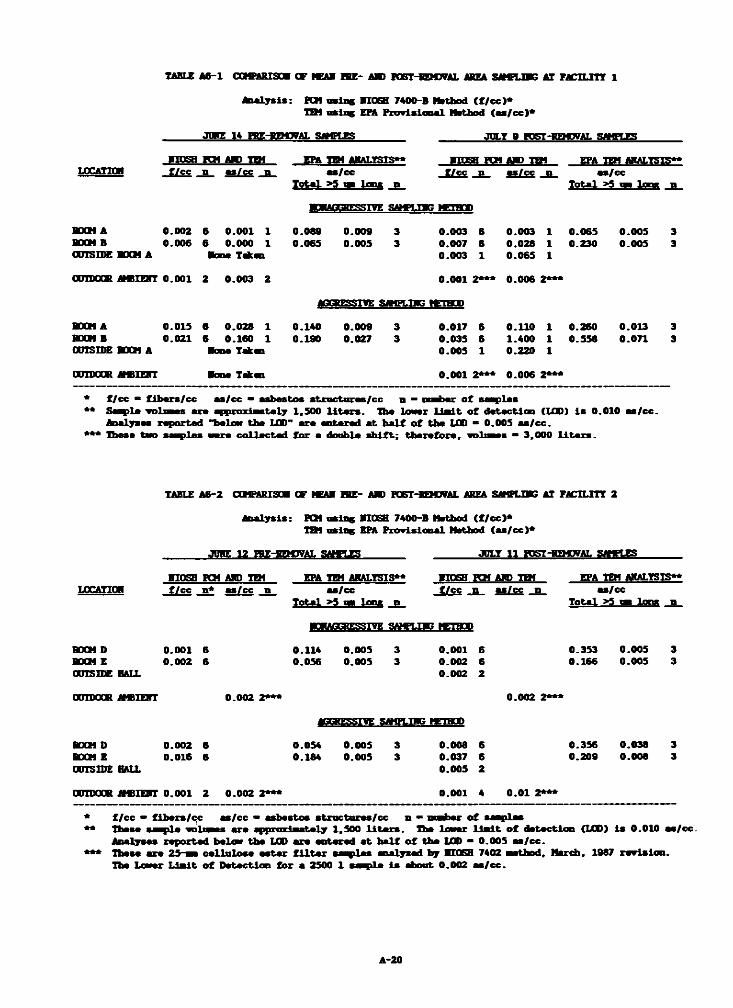
TABLE Aß-1 COffARISG* OF (C M ME* A» FOST-REHWAL AREA S N ffU K AT FAC1L1TT 1
A ia ly s is : PCM w li« BIOGH 7400-B tfcthod ( f /c c )*Tffl u sin g EPA P ro v is io n a l Method (a t/c c )*
_______ JPWE 1» WE-gPtWAL SMffiHS_________ ________ JULY » EOST-BBCTAL gJWPTJS
f jn s a PCM A lp ep a u m a k a lts is * * f io s b p o i a id t o ep a t o i a * a l t s i s ~LOCATItH f /c c n a s /c c n a s /c c f /c c » * * /cc a s /c c
T o ta l >5 t a le n s n T o ta l >5 tm It« * _H_
m a g b if s s it e SAW-TW; m im i
BOOH A 0.002 6 0.001 1 0.089 0.009 3 0.003 6 0.003 1 0.065 0.005 3BOOM B 0.006 6 0.000 1 0 .065 0.005 3 0.007 8 0.028 1 0.230 0.005 3OUTSIDE HOCH A ■one Taken 0.003 1 0.065 1
OUTDOOR jm m iT 0.001 2 0.003 2 0.001 2*** 0.006 2***
AGGRESSIVE S«MFLIHG tGTBGD
BOOM A 0.015 6 0 .028 1 0.140 0.009 3 0.017 6 0.110 1 0.260 0.013 3BOOM B 0.021 S 0.160 1 0.190 0.027 3 0.035 6 1.400 1 0.558 0.071 3OUTSIDE BOCM A ■one Takan 0.005 1 0.220 1
OUTDOOR AtBIZHT le n t Taken 0.001 2*** 0.006 2***
* f /c c • f lb « rs /c c a s /c c » a sb e s to s s tru c tu ra s /c c n — n ri> a r o f M ap las** S a ^ la ve l i n a a ra «pproxl—U ly 1,500 11ta r s . Ib a low er l i a i t o f d « U c ti(n (LCD) i s 0 .010 a s /c c .
Jtaa ljaM re p o rte d "below th a LCD" a ra « n ta rad a t o f tb a LOO “ 0.00S a s /c c .*** T b est tu o s a b le s w r i c o lle c te d fo r a doubla i h l f t ; th e re fo re , i n l i i i “ 3 ,000 l i t a r s .
TABLE Afi-2 CCMPARISE» OF K » R E - AID FOSTHtDOTAL AREA SMHJBG AT FACILITY 2
t- flC A T T «t
A n aly sis: V « MI0SH 7400-B Method (f /c c )*TBI O sins EPA P ro v is io n a l Method (a s /c c )*
JUBE 12 IRE-HEHOTAL SâWLES JULY 11 BOST-RnOVAI «JMPtJS
i o s a PCM AMD TtM fee n* a s /c c n
EPA TM AKALY5IS** a s /c c
T n fc a l > 5 «■ 1 « « _ e _
MIQ6H FOI AMD T »_ £ i S £ a s /c c
EPA TEM AKALTSIS** a s /c c
T o ta l >5 « Lock n
kmaogbessttf saw t.tk ; m a u u
BOOM D ROOM E OUTSIDE HALL
0 . 0 0 1
0 . 0 0 2
0.1140.056
0.0050 . 0 0 5
0 . 0 0 1
0 . 0 0 2
0 . 0 0 2
0.3530.166
0.0050.005
UUTUUJK AMBIECT 0 . 0 0 2 2 * * * 0 . 0 0 2
« â M P L iw g œ n o b
bocm o ROCH E OUTSIDE HALL
0 . 0 0 2
0.0160.0540.184
0.0050 . 0 0 5
0.0080.0370.005
0.3560 . 2 0 0
0.0380.008
OUTDOOR ¿»SIEHT 0.001 2 0.002 2*** 0.001 4 0 . 0 1 2 * * *
f /c c * f ib a rs /c c a s /c c » a sb es to s s tro c to r s s /c c n • r a b e r o f These i ^ i l a iinliw sa a ra sg ip n irle a te ly 1.500 l i t a r s . Tba low er L ia it o f de ta c tio n (LCD) i s 0 .010 a s /c c . A nalysas re p o rte d below th a LCD a ra e n te red a t h a lf o f th a LCD ■ 0.005 a s /c c .These a ra 25 a i c a lla lo se e s te r f i l t e r s a ^ ils i an alysed by n0SH 7402 a i t hod . M arch, 1987 re v is io n .Tha Lower L ia i t o f D etec tio n fo r a 2500 1 s a l i l a i s about 0 .002 a s /c c .
A -20
TAW .g A 5-3 OGMPARJSOR OF (CAN R E - AM) FOST-RBOTAL AREA SA O TJV 5 AT FACILITY 3
f e a ly s is : PCM u s ii« VIOGH 7400-B Msthod (f /c c )*IEH o iio t EPA P ro v isio n a l Method (a s /c c )*
JUNE 13 PRE-REMOVAL SAMPLES_________ _________ JULY 10 POST-REMOVAL SAMPLES
EPA TEM AHALY5IS*IXCATTOW f/c c n* •s /c c n a s /c c f /c c _n a s/c c n a s /c c
T o ta l >5 ■ Ion s n T o ta l >5 tm lone n
■0RAGŒESS1VE SAMPLING METHOD
ROOM F 0.002 6 v /c V/C S/C 3 0.001 6 V/C V/C V/C 3BOdf 6 0.003 6 V/C M/C* V/C 3 0.001 6 V/C V/C V/C 3HALL ROOM F 0.001 2 V/CHALL ROOM 6 0.001 2 V/C
AGGRESSIVE SAMPLING METHOD
ROOM F 0.008 5 V/C 0 .0 6 0.012 3 0.020 6 V/C 0.10 0.006 3ROOM 6 0.075 6 V/C 0.20 0.037 3 0.002 6 V/C 0.15 0.007 3hall room F 0.003 1 V/CHALL ROOM 6 0.000 1 V/C
OUTDOOR AM) IEXT 0.002 2 0.002 2*** 0.000 2 0.002 2***
f /c c ■ fib e r* /c c a s /c c “ a sb esto s s tru c tu r e s /cc n “ m m ber o f sam plesV/C - A n aly sis n o t c a ^ ils ta dA m * s a i s ie « i l i t » a re approxim ately 1.500 l i t e r s . The low er l i a i t o f d e te c tio n (LOD) is 0 .010 a s /c c . A nalyses re p o rte d below th e LCD a re en te red a t h a lf o f th e LOD (0 .005 a s /c c ) .These ■ ■ p le i w ere c o lle c te d cn 2 ^m c e llu lo s e a s te r f i l t e r s « 1 analyzed by HIÜSH Method 7402, March 1967 re v is io n .
TABLE A6-4 C£**>ARIS0* OF KAN PRE- AHD POST-REMOVAL AREA SAMPLIHG AT FACILITY 4
A n aly sis: PCM u sin g VI0SH 7400-B Method ( f /c c )* ;TEM u sin g EPA P ro v is io n a l Method (a s /c c )*
JULY 12 FEE WMTWAI- SAHF1.ES_________ ________ JULY 18 POST REMOVAL SAMPLES
VTCCT FCM ARD TEM EPA TEM AHALYSIS** HIQSH PCH AHD TEM EPA TEM ANALYSIS*4U3CATCT f/c c n* a s /c c n a s /c c f /c c , n a s /c c n a s /c c
T o ta l >5 im la u t n T o ta l >5 ™ ten a n
NCHAGGRESSIVE SAMPLING «THOD
R0GM B 0.001 6 V/C N/C H/C 3 0.001 6 N/C K/C N/C 3ROOM I 0.002 6 H/C* V/C V/C 3 0.001 6 N/C V/C N/C 3HAU- ROOM H 0.001 1 V/C 0.001 1 H/CHALL ROOM I 0.001 1 R/C 0.003 1 N/C
AGGRESSIVE SAMPLING METHOD
BOOM H 0.004 6 V/C 0.24 0.012 3 0.002 6 V/C 0.07 0.007 3ROOM I 0.010 6 V/C 0.30 0.014 3 0.003 6 V/C 0.09 0.021 3HALL BOOM H O.OOl 1 V/C 0.001 1 V/CHALL BOOM I 0.026 1 V/C 0.000 1 V/C
OOTDOGR AtSIQIT 0.001 2 0.001 2*** 0.001 2 0.001 2***
* f /c c * f ib e rs /c c a s /c c ” a sb es to s s tru c to re s /c c n ■ mznber o f sam plesI/C - A n aly sis n o t c o l l a te d fo r th e se sam ples
** These s ta p le w ill— s a re approxim ately 1.500 l i t e r s . The TEM low er lim it o f d e te c tio n (LOD) is0.010 a s /c c . A nalyses re p o rte d below th e LOD a re en te red a t h a lf o f th e LOD (0 .005 a s /c c ) .
*** These « fe ie n t s ^ > le s w ere c o lle c te d on 25h c e llu lo s e e s te r f i l t e r s and analysed by HI0SH method 7402March 1987 re v is io n . The low er l i a i t o f d e te c tio n fo r a 3000 1 sam ple i s about 0 .002 a s /c c . Hone d e te c te d v a lu es a re re p o rte d h e re a t h a lf th e LOD.
A -21
T A B L E A 7 - 1 E V A L U A T IO N O F W O R K P R A C T I C E S A T F A C I L I T Y 1
Date 6 /1 8 /8 5 6 /1 9 /8 5 6 /2 0 /8 5 6 /2 1 /8 5Time AH / PH AM / PM AM / PM AM / PHS ite ROOM B ROOM A < ..........ROOM C..........>
TASK____________ __________ WORK PRACTICE RATING#
Prepare Pipe A / - A / - - / ' - / -In s ta ll Bag P / - P / - - / ‘ A / *Wet Pipe Lagging P / P - / P A / A A / PRemove Lagging (use o f bag) P / P * / P P / A A / AMove Bag - / P * / P P / A G / ARenove Bag - / A - / A A / A G / PClean Pipe - / A - / A A / A A / ADecontaminate Room - / A - / - A / A A / A
Number o f Bags Used ( 5 ) ( 12 ) ( 13 )
# SUBJECTIVE RATING VALDES: P - POOR A - AVERAGE G - GOOD
TABLE A7-2 EVALUATION OF WORK PRACTICES AT FACILITY 2
Date 6 /2 5 /8 5 6 /2 6 /8 5 6 /2 7 /8 5 6 /2 8 /8 5Tine AM / PH AM / PM AH / PH AM / PHS ite < -------- ROOM D-------- > < ..........ROOM E.......... >
TASK WORK PRACTICE RATING#
Prepare Pipe G / - - / - - / A - / -In s ta ll Bag A / - A / - - / G G / -Wet Pipe Lagging - / A A / A A / - A / ARemove Lagging (use o f bag) ' / A A / A A / - A / GMove Bag - / A A / A A / - A / GRemove Bag * / A G / G G / - A / GClean Pipe - / A A / A A / - A / ADecontaminate Room - / G - / G - / ‘ - / G
Number o f Bags Removed 0 / 3 4 / 2 7 / 0 4 / 0
# SUBJECTIVE RATING VALDES: P - POOR A - AVERAGE G - GOOD
A - 2 2
T A B L E A 7 - 3 E V A U J A T I O N O F W O R K P R A C T I C E S A T F A C I L I T Y 3
DateTineS ite
_____________________________ X & S E __________________________
Prepare PipeIn s ta ll BagV et Pipe LaggingRemove Lagging (use o f bag)Move BagRemove BagClean PipeDecontaminate Room
Number o f Bags Removed
7 /1 /8 5 7 /2 /8 5 7 /3 /8 5AM / PM AM / PM AM / PM< ------ ROOM F-----> /< -----ROOM G --->
WORK PRACTICE RATING#/ - - / ’ - / -/ * A / - A / G/ A A / A A / -/ A A / A G / -/ G - / G G / A/ A G / A A / -/ A G / G A / -/ A G / G G / -
/ 3 6 / 3 3 / 0
# SUBJECTIVE RATING VALDES: P - POOR A - AVERAGE G - GOOD
TABLE A7-4 EVALUATION OF WORK PRACTICES AT FACILITY 4
DateTimeS ite
TASK
Prepare PipeIn s ta ll BagWet Pipe LaggingRemove Lagging (use o f bag)Move BagRemove BagClean PipeDecontaminate Room
Number o f Bags Removed
# SUBJECTIVE RATING VALDES: P
7 /1 5 /8 5 7 /1 6 /85 7 /1 7 /8 5A M / P M A M / P M A M / P MROOM H ROOM I ROOM J_
WORK PRACTICE RATING#
A / - - / - - / -G / - - / - - / -A / A A / - G / GG / A A / - A / AG / G A / - G / AG / G G / - A / AG / G A / - G / G- / G A / - - / G
( 6 ) ( 6 ) ( 8
- POOR A - AVERAGE G - GO<
A - 2 3

APPENDIX B
TABULATION OF DATA OBTAINED USING
PHASE CONTRAST MICROSCOPY (PCM)
AND MAGISCAN I I
T A B L E B l - 1
IOC (F a c ility and room lo c a tio n o f s a i le d a c t iv ity )Lxxx F a c ility 1RMA Room ARMB Room BBMC Room CRM9 Room 109TLG Teachers LoungeFB F ie ld B lank no sample taken
SAMPLE CTASS (Sample type and lo c a tio n , a c t iv ity , and ID ) lo c a tio nFB F ie ld BlankIA In te r io r Area (Background in the work root»)OA O utside Area ( in the h a ll)AM Ambient (O utside the b u ild in g )BZ Personal B reathing ZoneCT M obile Sampling C art (proxim ate to the work a c t iv ity )
Ac_t lv j t yPRE Pre-rem oval a c t iv ity - F u ll te rn samplePST Post-rem oval a c t iv ity - F u ll te rn sampleREM Renoval work - F u ll te rn seq u en tia l sampleGOV P rep aration * F u ll te rn seq u en tia lRMS Renoval work - 15 m inute sh o rt te rn PBZ sampleCOS P rep aration - 15 n in u te sho rt te rn PBZSEQ Sample period covers seq u en tia l work a c t iv it ie s
22AGGR Aggressive sampling nodeNAGR Nonaggresslve sampling nodeWK#X Worker #X PBZ samplemm/dd A ctua l date o f b lank source
samptj- Wn Sample media Id e n tif ic a tio n code and numberAAxxx 25-mm C e llu lo se E s ter F i l t e r Sample Number xxx (using a
f o i l wrapped 2 -in ch cowl)Mxxx 37-nm C e llu lo se E ster F i l t e r Sample Number xxxNxxx 37-nm Polycarbonate F i l t e r Sample Number xxx
RATE Sample flo w ra te in l i t e r s per m inute (lpm )VOL Sample volume in l i t e r s (1 )MAGI SCAN I I Kagiscan I I is a com puterized image an a lys is system fo r
PCM; re s u lts are in to ta l fib e rs p er cubic cen tim eter
Phase C ontrast Microscopy using NIOSH Method 7400B counting ru le s UBTL PCM an a lys is perform ed by Utah B io lo g ic a l Testing LabsNIOSH PCM an a lys is perform ed in the NIOSH la b o ra to ryF ibers T o ta l fib e rsf /c c F ibers p er cubic cen tim eter
L E G E N D F O R F A C I L I T Y 1 P C M D A T A
B - 2
TABLE B l - 2
PHASE CCKTRAST MICROSCOPT ANALYTICAL RESULTS NOTE: For saw ples re p o rte d le s s th an d e te c ta b le ,FOR AIRBORNE ASBESTOS ANALYSIS an« h a lf o f th e lim it o f d e te c tio n is used
FACILITY 1 as fo llo w s: LAB 25-mu F i l te r 37-mu F il te rCINCINNATI , CBIO UBTL 750 1750
Jo ie 14, 18 - 21 & Ju ly 9 , 1985 NIG6H 1347 2992
SAMPLE PERIOD TOC BATE VOL. MAGI9CAN I I UBTL HIOSHLOC- SAMPLE CLASS Bo. P ete S ta r t S top (■ in ) ( l ie ) (1 ) F ib e rs f /c c F ib e rs f /c e F ib e rs f/c e
UBC IA-FRE-AGGK AA79 6/14 1611 0211 480 3.25 1560.0 70070 0.045 0.000u s e IA-PRE-AGGR AA80 6/14 1811 0211 480 3.20 1536.0 66990 0.044 23000 0.015is m IA-FRE-AOGS AA90 6/14 1811 0211 480 3 .2 5 1560.0 74690 0.048 26000 0.017 25795 0.017U N IA-PKE-AGGK M3 32 6/14 1811 0211 480 3 .2 5 1560.0 101745 0.065 30000 0.019 88065 0.056IB » IA-PRE-AGGK 1034 6/14 1811 0211 480 3 .2 5 1560.0 71820 0.046 35000 0.022IBM IA-FBE-AGGR M340 6/14 1811 0211 480 3.20 1536.0 112005 0.073 30000 0.020 58995 0.038
IB fi IA-PKE-NAGR AA61 6/14 0938 1738 480 3.25 1560.0 24255 0.016 6000 0.004IBM IA-FRENAGR AA75 6/14 0938 1738 480 3.00 1440.0 41195 0.029 2000 0.001ira « IAPHE-NAGR AA99 6/14 0938 1738 480 3.25 1560.0 54285 0.035 3000 0.002IBM IA-FRE-NAGR M327 6/14 0938 1738 480 3.00 1440.0 30780 0.021 1750 0.0011BW IA-PRE-NAG» 1031 6/14 0938 1738 480 3.25 1560.0 30780 0.020 4000 0.003IBM IA-FRE-NAGR M33S 6/14 0938 1738 480 3.25 1560.0 47025 0.030 4000 0.003
3BMA LA-PRE-AOGR AA63 6/14 1923 0330 487 3.25 1582.8 29645 0.019 21000 0.013 33495 0.021IRMA IA-PRE-AGGR AA72 6/14 1923 0330 487 3.25 1582.8 46200 0.029 35000 0.022 37730 0.024IRMA IA-PRE-ADGR AA87 6/14 1923 0330 487 3.00 1461.0 35420 0.024 30000 0.0211BMA IA-PRE-AGGR M324 6/14 1923 0330 487 3.25 1582.8 73530 0.046 30000 0.019IRMA IA-FSE-AGGR 1025 6/14 1923 0330 487 3.25 1582.8 83790 0.053 44000 0.028 57285 0.036IRMA IA-FKE-AGCX M329 6/14 1923 0330 487 3.00 1461.0 87210 0.060 30000 0.021 56430 0.039
1BMA IA-FREHMGR AA70 6/14 1037 1840 483 3.30 1593.9 34265 0.021 6000 0.004 16170 0.010IRMA IA-FKE-BAGR AA74 6/14 1037 1840 483 3.25 1569.8 81620 0.052 10000 0.006 16555 0.011IRMA IA-FRE-XMS AA98 6/14 1037 1840 483 3.25 1569.8 74690 0.048 10000 0.006 26565 0.017u r n IAPKE-NAGR H321 6/14 1037 1840 483 3.25 1569.8 47025 0.030 9000 0.006IRMA IA-PRE-NAGK M338 6/14 1037 1840 483 3.20 1545.6 34200 0.022 10000 0.006IRMA IA-PKE-NAGR 1039 6/14 1037 1840 483 3.25 1569.8 54720 0.035 10000 0.006
1RM9 AM-HŒ-BAGS AA68 6/14 1026 1830 484 2 .90 1403.6 11165 0.008 750 0.0011RM9 AM-FSEHUGR AA89 6/14 1026 1830 484 3.00 1452.0 8855 0.006 750 0.001
1FB FB-FRE-AOGR AA62 6/14 1347 7501FB FB-FRE-AGGR AA95 6/14 1347 750 13471FB FB-PRE-NAGR AA59 6/14 1347 750 13471FB FB-FRE-NAGR AA60 6/14 1347 750 13471FB FB-PRE-NAGR AA71 6/14 1347 750 13471FB FB-PRE-NAGR AA92 6/14 1347 750 13471FB FB-ÎBE-NAGR K322 6/14 17501FB FB-PRE-NAGR M330 6/14 2992 1750 29921FB FB-FRE-NAGR H337 6/14 2992 1750 2992
B -3
TABLE * 1 - 2 (C o n tin u a d - p a s * 2 )
SAMPLE PERIOD T O C »ATE TOL. HftGISCAB H OBTL 1 C C TLDC- SAfffLE CLASS Wo. D ata S ta r t StOD f i n i *1— 1 m F ib a rs t i CC F ib e rs t í cc F ib er* f/CC
1 M BZ-CDV-MEfl AA148 6/IB 0990 1126 116 3.10 359.6 87010 0.242 11550 0.032UBfi BZ-C30?-W#2 AA111 6/18 0930 1126 116 2.96 343.4 8855 0.026 10010 0.0291 M BZ-OGW-tK#3 AA150 6/18 0990 1126 116 3 .1 2 361.9 17325 0.048 11550 0.032] M BZ-G0V-MK»4 AA31 6/18 0990 1126 116 3.06 355.0 20405 0.057 19250 0.054u r o BZ-BEM-MC#1 M S I 6/18 1235 1515 160 3.16 SOS.6 77365 0.153 302895 0.401IBM BZ~BEM-tiK#2 AA142 6/18 1235 1520 165 2.96 488.4 169015 0.346 1347 0.0031BMB BZ~SQf-VK#3 AA143 6/18 1235 1515 160 3 .1 2 499.2 219065 0.439 1347 0.0031 M BZ-BEM-WH AA138 6/18 1235 1520 165 3 .0 6 504.9 96635 0.191 0.324
UttB CT-CO? AA64 6/18 0932 1126 114 3 .1 6 360.2 12705 0.035 10010 0.028u s e CT-GOT AA139 6/18 0932 1126 114 3 .0 2 344.3 8085 0.023 13860 0.040u s e CT-COT AA140 6/18 0940 1126 106 3.00 318.0 12320 0.039 7315 0.0230 » CT-OW AA141 6/18 0932 1126 114 3 .0 6 348.6 6930 0.020 9625 0.028w e CT-BEM AA22 6/18 1240 1520 160 3.00 480.0 72380 0.151 147070 0.306u s e CT-BEM AA52 6/18 1240 1520 160 3 .1 6 505.6 113190 0.224 207515 0.410
is te IA-OOW AAG6 6/18 0932 1126 114 3.11 354.5 12705 0.036 6545 0.018IfiW IA-CO» AA59 6/18 0932 1126 114 3.14 358.0 9240 0.026 6930 0.019u v e IA-BIM AA24 6/18 1239 1520 161 3.10 499.1 92785 0.186 191730 0.384u s e IA-BEH AASO 6/18 1239 1520 161 3.10 499.1 108185 0.217 219835 0.440
u s e QA~SBQ AA67 6/18 0934 1413 279 3.00 837.0 33495 0.040 44275 0.053u s e QA-SEQ AA137 6/18 0934 1413 279 3.00 637.0 34265 0.041 36575 0.044
1TLG AM-SEQ AA65 6/18 0740 1530 470 3.00 1410.0 31955 0.023 1347 0.0011TLG áM-SEQ AA93 6/18 0740 1530 470 2 .8 0 1316.0 31570 0.024 4235 0.003
1FB FB-COT-6/1* AA55 6/18 1347 13471FB F B ^D t-S /14 M 56 6/18 1347 1347
UMA BZ-OQS-MEf2 M S 6/19 1043 1058 15 3 .0 0 45.0 2695 0.060 1347UMA BZ-OQS-W4 AA48 6/19 1111 1126 15 3 .00 45.0 1347 0.030 1347 0.030UHA BZ~OOV-tK#l AA44 6 /19 0939 1129 UO 3.06 336.6 36190 0.108 8816 0.026UMA BZ~COV-tK#2 AA45 6 /19 1038 1129 51 3 .12 159.1 15015 0.094 5852 0.037UMA BZ-OCW-VK#3 AA43 6 /19 0935 1129 114 2 .9 6 337.4 40040 0.119 9779 0.029IB tt BZ~COV-tK#4 AA42 6 /19 0938 1129 111 3 .09 343.0 39270 0.114 11742 0.034IBMA BZ-BD4-t«#l AA3 6 /19 1249 1448 119 3 .06 364.1 197120 0.541 199045 0.547UMA B Z -ID H V 2 AA47 8 /19 1250 1459 129 3 .1 2 402.5 147070 0.365 50050 0.124IBMA BZ~BEM~WK#3 AA1 6 /19 1247 1459 132 3 .0 9 411.0 189035 0.460 184030 0.4481BMA BZ-BB4-WE#4 AA35 6 /19 1248 1429 101 3 .00 303.0 108185 0.357 193270 0.638IBMA BZ-»6-«K #2 AA126 6 /19 1440 1455 15 3 .00 45.0 46585 1.035 47355 1.0521BMA BZ-fif£~WK#4 AA7 6 /19 1333 1348 15 3 .00 45.0 45045 1.001 31955 0.710UMA BZ-BM5-tK#4 AA127 6/19 1448 1503 15 3.00 45.0 35035 0.779 41195 0.915IBMA BZ-BM5-W£#4 AA128 6/19 1300 1315 15 3 .00 45.0 33880 0.753 42735 0.950
IBMA CT-OW AA40 6/19 0933 1130 117 3 .0 5 356.9 22330 0.063 3187 0.009UMA CT-OD? AA41 6/19 0933 1130 117 3 .1 2 365.0 22330 0.061 10510 0.029IBMA CT-BBI AA25 6/19 1245 1518 153 3 .1 2 477.4 172865 0.362 2117SO 0.444IBMA CT-RIM AAsa 6/19 1245 1518 153 3.00 4S9.0 194425 0.424 225995 0.492
UMA IA-COT AA37 6/19 0933 1130 117 3 .0 6 358.0 17325 0.048 3207 0.009IBMA IA-CCW AA39 6/19 0933 1130 117 3.14 367.4 25025 0.068 6121 0.017UMA IA-SZM AA23 6/19 1245 1518 153 3 .0 6 468.2 176715 0.377 276045 0.590UMA IA-KEM AA28 6/19 1245 1518 153 3.14 480.4 142835 0.297 163240 0.340
UMA QA-FTM AA31 6/19 0933 1406 273 3 .1 6 862.7 48510 0.056 82778 0.096IBMA QA-FTM AA38 6/19 0933 1406 273 3 .00 619.0 58135 0.071 35535 0.043
1TLG AM-SEQ AA21 6/19 0804 1540 456 3 .00 1368.0 19250 0.014 1347 0.0011TLG AM-SEQ AA54 6/19 0804 1540 456 2 .7 0 1231.2 43505 0.035 3888 0.003
1FB FB-OW AA4 6/19 0933 0934 1 3 .00 3 .0 1347 13471FB FB-COV-6/14 AA57 6/19 0933 0934 1 3 .0 0 3 .0 1347 13471PB FB-KIM-6/14 MSS 6/19 1245 1246 1 3 .0 0 3 .0 1347 1347
B -4
TABLE B l- 2 (C o n tin u a d - p a s « 3 )
SAMPLE PERIOD T D C RATE T O , MftGISCAB I I OBTL BIOSHLOC. SAMPLE CLASS Bo. D ata S ta r t S top ( ü n ) m F iber« f /c c F ib e rs f /c c F ib e rs f /c c
1BMC BZ-REM-W#1 AA13 6/20 1242 1447 125 3 .12 390.0 215215 0.528 205975 0.528USC BZ~REM~VK#2 AA26 6/20 1241 1510 149 3.00 447.0 108570 0.243 133595 0.299USC BZ-KEM-W3 AA125 6/20 1240 1510 150 3 .0 2 453.0 100870 0.223 196350 0.4331BMC BZ~BB4-HE#4 *A12 6/20 1240 1510 150 3 .0 6 450.0 109340 0.238 132440 0.2891BMC BZ-BMS-Wfl AA11 6/20 1408 1423 15 2 .50 37.5 18095 0.483 14360 0.383UBC BZ-B»6-«K#2 AA121 6/20 1259 1314 15 2 .5 0 37 .5 12320 0.329 5390 0.144USC BZ-BMS-W#4 AA20 6/20 1330 1345 15 2 .50 37 .5 31570 0.642 41965 1.119
u s e CT-BIM AA6 6/20 1236 1519 163 3.14 511.8 98945 0.193 104335 0.204IR C CT-REM AA9 6/20 1236 1519 163 3.00 489.0 83160 0.170 88935 0.182
USC IA-BEM AA2 6/20 1241 1519 158 3.00 474.0 103950 0.219 108955 0.230USC IA-REM AA32 6/20 1241 1519 158 3.12 493.0 100670 0.205 94710 0.192
ibm : Cfc-SEQ AA33 6/20 1239 1520 161 3 .00 483.0 11165 0.023 2695 0.0061BIC OA-SEQ AA124 6/20 1239 1520 161 3 .16 508.6 6160 0.012 3465 0.007
1BH3 B Z-SD H U 1 AA19 6/20 0751 0957 126 3.1 7 399.4 162470 0.407 165935 0.4151BM3 BZ-KB4-tK#2 AA14 6/20 0752 0957 125 3.00 375.0 109725 0.293 134365 0.3581BM3 BZ-KEM-«#3 AA122 6/20 0752 0957 125 3.02 377.5 119735 0.317 209055 0.554USO BZ-BB4~W#4 AA27 6/20 0754 1008 134 3.06 410.0 99715 0.243 132440 0.3231BM3 BZ-BfC-M ^l AA29 6/20 0812 0827 15 2 .5 0 37 .5 24640 0.657 28875 0.770USO BZ~BM5-tK#l AA123 6/20 1007 1022 15 2 .40 36.0 43120 1.198 39655 1.1021BK3 BZ-BMS-tK#2 AA10 6/20 0947 1002 15 2 .40 36.0 26160 0.727 18865 0.5241BK3 BZRMS-**#4 AA17 6/20 0904 0915 11 2 .50 27 .5 26180 0.952 32725 1.190
USO CT-RIM AA147 6/20 0755 1054 179 3.00 537.0 108185 0.201 155540 0.290USO CI-BEM AA149 6/20 0755 1054 179 3.05 546.0 75075 0.138 224840 0.412
1BM3 IA-BEM AA16 6/20 0755 1053 178 3.00 534.0 128975 0.242 177485 0.3321BM3 IA-REM AA18 6/20 0755 1053 178 3.00 534.0 130130 0.244 155925 0.292
1BM3 QA-SBQ AAB 6/20 0754 1104 190 3.11 590.9 91245 0.154 70840 0.1201BK3 OA-SBQ *A1S 6/20 0754 1104 190 3.00 570.0 72765 0.128 82005 0.144
1TUG AM-FTM AA129 6/20 0720 1540 500 2.70 1350.0 75845 0.056 3465 0.0031TLG AM-FTM AA130 6/20 0720 1540 500 2 .90 1450.0 65835 0.045 3850 0.003
1FB FBRIM -6/14 AA97 6/20 0720 0721 1 3.00 3 .0 1347 13471PB FB-REM-6/1* AA146 6/20 0720 0721 1 3.00 3 .0 1347 1347
USC BZ-8EM-WK#4 AA152 6/21 0834 1203 209 3 .12 652.1 81620 0.125 95865 0.147u s e BZ-MM-*K#2 AA153 6/21 0842 1203 201 3.00 603.0 63140 0.105 70840 0.117USC BZ-BBt-MCfl AA157 6 /21 0836 1203 207 3 .06 633.4 168630 0.266 109340 0.173HOC BZ-BB4~HK#3 AA158 6/21 0835 1203 208 3 .02 628.2 80465 0.128 78155 0.124
u s e CT-RIM AA1S1 6/21 0836 1206 210 3.00 630.0 73920 0.117 62755 0.100u s e CT-BiM AA154 6/21 0836 1206 210 3.14 659.4 88550 0.134 83930 0.127
u s e QA-FTM AA155 6/21 0832 1209 217 3 .00 651.0 48125 0.074 4620 0.007u s e QA-FTM AAX56 6/21 0832 1209 217 3 .1 1 674.9 41195 0.061 5775 0.009
u s e IA-RB4 AA171 6/21 0838 1206 208 3.10 644.8 74305 0.115 58520 0.091u s e IA-BEM AA175 6/21 0838 1206 208 3.00 624.0 85470 0.137 82390 0.132
1BMC BZ-BMS-WE#3 AA176 6/21 0918 0933 15 3 .00 45.0 34650 0.770 29645 0.659u s e BZ~BK>-WK#2 AA177 6/21 0943 0959 16 3 .00 48.0 20790 0.433 16170 0.3371BMC BZ~BI6-WK#3 AA178 6/21 0906 0923 17 3.00 51.0 21945 0.430 21945 0.430u s e BZ-BI£-MC#4 AA170 6/21 1027 1042 15 3 .00 45.0 16555 0.368 11165 0.248
1TLC AM-FTM AA1S9 6/21 0720 1220 300 3 .00 900.0 2356 0.003 1347 0.0011TLG AM-FTM AA160 6/21 0720 1220 300 2 .7 0 810.0 26180 0.032 1347 0.002
B -5
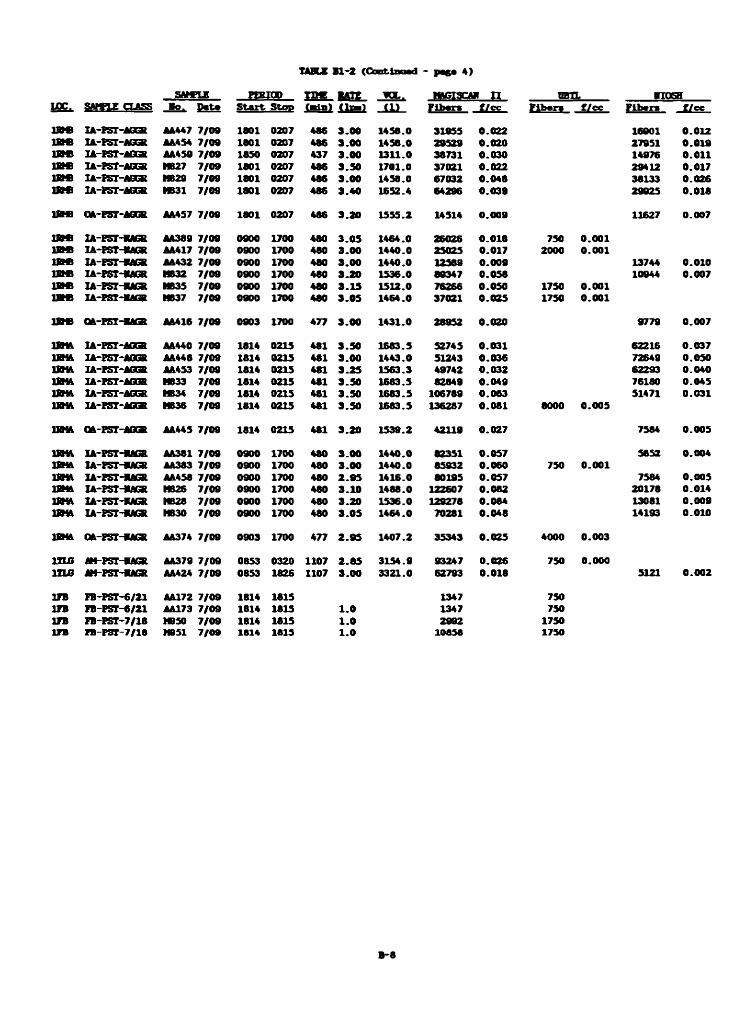
TABLE B l - 2 (C o n tln o a d - p ig > 4)
S M fU PERIOD TOILi££*. s s m z CLASS ■0. P st* S ta r t S too (■ in ) (1 ) F lb r s f/c c F ib er» . f /c c F ib e rs
1B 6 IA-PST-AOX AA447 7/09 1601 0207 486 3.00 1456.0 31955 0.022 169011 H IA-PSI-ASGR AA4S4 7/09 1601 0207 486 3 .0 0 1456.0 29529 0.020 27951i b b IA-P5T-AOS AA459 7/09 1650 0207 437 3 .00 1311.0 36731 0.030 14976U N IA-PST-AGGE MB27 7/09 1601 0207 486 3 .50 1701.0 37021 0.022 29412IB B IA-FST-AOGS MB29 7/09 1601 0207 486 3 .00 1458.0 67032 0.046 361331 M IA-PST-AGGR MB31 7/09 1601 0207 486 3 .40 1652.4 64296 0.039 2992T
u w QA-PST-AGG& AA457 7/09 1601 0207 486 3 .20 1555.2 14514 0.009 11627
1 0 « XA-P5THMGR AA369 7/09 0900 1700 480 3 .0 5 1464.0 26026 0.018 750 0.001a n IA-PSTHMGR AA417 7/09 0900 1700 480 3.00 1440.0 25025 0.017 2000 0.001IB « 1A-PST-UCR AA432 7/09 0900 1700 480 3 .0 0 1440.0 12569 0.009 13744IB B IA-FSTHUGS NB32 7/09 0900 1700 480 3 .2 0 1536.0 69347 0.058 10944IB B IA-PSTHUGR MB35 7/09 0900 1700 480 3 .1 5 1512.0 76266 0.050 1750 0.001IB B IA'PST-flM S MB37 7/09 0900 1700 480 3 .0 5 1464.0 37021 0.025 1750 0.001
IB B OA-FSTHUGR AA416 7/09 0903 1700 477 3 .0 0 1431.0 y o ^ 2 0.020 9779
IBM IA-PST-AQGS AA440 7/09 1614 0215 481 3.50 1663.5 52745 0.031 62216IBM IA-FST~AGGS AA446 7/09 1614 0215 481 3 .00 1443.0 51243 0.036 72649IBM IA-PST-AGGR AA453 7/09 1614 0215 481 3 .2 5 1563.3 49742 0.032 62293IBM IA-PST-AGG& MB33 7/09 1614 0215 481 3 .50 1663.5 62849 0.049 76180IBM IA-P5T-AGGR («34 7/09 1614 0215 481 3 .50 1683.5 106789 0.063 51471IBM IA-PST-AOX MB36 7/09 1614 0215 461 3 .50 1683.5 136287 0.081 8000 0.005
IBM OA-PST-AGGR AA445 7/09 1814 0215 481 3 .20 1539.2 42119 0.027 7564
IBM IA-PSTHUGR AA361 7/09 0900 1700 480 3 .00 1440.0 «2351 0.057 5652IBM IA-PST-UCS AA363 7/09 0900 1700 480 3.00 1440.0 65932 0.060 750 0.001IBM IA-PSTHUGR AA456 7/09 0900 1700 480 2 .9 5 1416.0 80195 0.057 7564IBM IA-PSTHWGR MB26 7/09 0900 1700 480 3.10 1468.0 122607 0.062 20178IBM IA-PSTHUGR HB28 7/09 0900 1700 480 3.20 1536.0 129276 0.064 13081IBM IA-PSTHUGR MB30 7/09 0900 1700 460 3 .0 5 1464.0 70281 0.048 14193
IBM QA-PST-UGR AA374 7/09 0903 1700 477 2 .9 5 1407.2 35343 0.025 4000 0.003
HUG Atf-PST-WGR AA379 7/09 0653 0320 1107 2 .6 5 3154.9 93247 0.026 750 0.0001IU5 AM-PSTHUGR AA424 7/09 0653 1626 1107 3.00 3321.0 62793 0.018 5121
1FB FB-PST-6/21 AA172 7/09 1614 1615 1347 750i n IB -PST-6/21 AA173 7/09 1614 1615 1 .0 1347 7501FB FB-PST-7/16 M950 7/09 1614 1615 1 .0 2992 17501PB ra - p s i- 7 /ie M951 7/09 1814 1815 1 .0 10656 1750
glOSBg / c c
0 . 0 1 2
0.0190 . 0 1 1
0.0170.0260.016
0.007
0 . 0 1 0
0.007
0.007
0.0370.0300.0400.04S0.031
0.005
0.004
0.0050.0140.0090 . 0 1 0
0 . 0 0 2
B -6
T A B L E B 2 - 1
IOC (F a c ility and room lo c a tio n o f sampled a c t iv ity )2xxx F a c ility 2RMD Room DRME Roon EEW Outside the Executive Washroom windowFB F ie ld Blank no sample taken
L E G E N D F D R F A C I L I T Y 2 P C M D A T A
SAMPLE CLASSLocationFBIAOAAMBZCT
A c tiv ityPREPSTREMCOVRMSCOSSEQ
IEAGGRNAGRWK#&nnn/dd
(Sample type and lo c a tio n , a c t iv ity , and ID )
F ie ld BlankIn te r io r Area (Background in the work room ) Outside Area ( in the h a ll)Ambient (O utside the b u ild in g )Personal B reathing ZoneM obile Sampling C art (proxim ate to work a c t iv ity )
Pre-rem oval a c t iv ity - F u ll-te rm samplePost-rem oval a c t iv ity - F u ll-te rm sampleRemoval work - F u ll-te rm seq u en tia l sampleP rep aration - F u ll-te rm seq u en tia lRemoval work - 15-m inute sh o rt-term PBZ sampleP rep aration - 15-m inute sh o rt-term BZSample period covers seq uen tia l work a c t iv it ie s
Aggressive sampling mode Nonaggressive sampling mode Worker #X BZ sample A ctual date o f b lank source
SAMPLE No. AAxxx
| f y ~ir ~ir flAAA
Sample media Id e n tif ic a tio n code and number25-mm C ellu lo se E ster F i lt e r Sample Number xxx (using af o i l wrapped 2 -in c h cowl)37-mm C ellu lo se E ster F i lt e r Sample Number xxx 37-mm Polycarbonate F i l t e r Sample Number xxx
RATEVOLMAGISCAN I I
Sample flo w ra te in l i t e r s per m inute (1pm)Sample volume in l i t e r s (1 )Magiscan I I is a com puterized image an a lys is system fo r PCM; re s u lts are in to ta l fib e rs per cubic centim eter
Phase C ontrast Microscopy using NIOSH Method 7400B counting ru lesUBTLNIOSHFibersf/c cPOL
PCM an a lys is performed by Utah B io lo g ic a l Testing Labs PCM an a lys is performed in the NIOSH Laboratory T o ta l fib e rsF ibers per cubic centim eter P a rtic u la te Overload - Unable to count.
B - 7
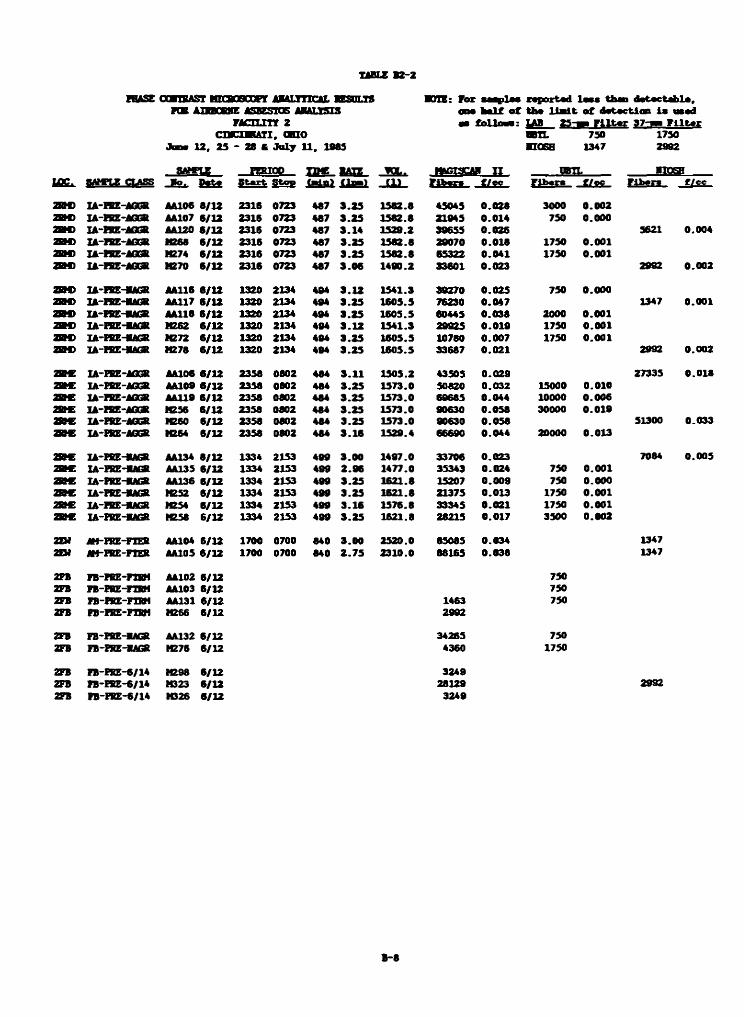
U B U B 2 -2
OGVTBAST w aCECBPI A1ALTTICAL MSm.TS K B AIMJMIE ASBESTOS A ttU S IS
f a c i l i t i 2
D O : V e r ra p o rta d I m i t lu n d a U c U è lt, « f Ih * l i a i t « f d * t* c tlc e i s osad
t o l t a « : LAB 2 5 - 1 F l l t r 37-1» F U U tCUClBtATI, OHIO
Jm m 12, 23 ~ 28 & J a ly 11, 1083
8O TIE PERICO TOC «AH VCL. M arasca* 11
QBTL 750 ■IGSH 1347
0BTL
17502992
n o m1A&. 8W L E CtASS J fe * S ta r t S«ss ¿ I s s i - J J J F tb tr» t /c e r i lx r « t/o c Wihmrm 1
2BM) IA-RE-AGGK AA106 8/12 2316 0723 487 3 .2 3 1382.8 43043 0.026 3000 0.002a w U -R E -iG a AA107 6/12 2316 0723 487 3 .2 3 1382.8 21943 0.014 750 0.000a w IA~FKE'AGG& AAI20 8 /12 2316 0723 487 3.14 1329.2 39633 0.026 5621 (2BM> XA-IKE~AGGK M268 6/12 2316 0723 467 3 .2 3 1382.8 29070 0.018 1750 0.0012BM) IA-RE-AGBK M274 6/12 2316 0723 467 3 .2 3 1382.8 65322 0.041 1730 0.0012BD IA-FSE-AOGK M270 6/12 2316 0723 487 3 .0 6 1490.2 33601 0.023 2992 (
28H> IA-ISEHUGS AA116 8 /12 1320 2134 494 3 .1 2 1341.3 38270 0.023 730 0.000SM ) XA-IKEHUGK AA117 6 /12 1320 2134 494 3 .2 3 1603.3 76230 0.047 1347 12JH) IA-RE-BAGK AA118 6 /12 1320 2134 494 3 .2 3 1605.5 60445 0.038 2000 0.001a » ia - r e h u g k M262 6/12 1320 2134 494 3 .1 2 1341.3 29923 0.019 1750 0.0012BO IA'FBEHUGS IC 72 6/12 1320 2134 494 3 .2 3 1605.5 10780 0.007 1730 0.0012Bf> IA-IBEHUGR » 7 8 6/12 1320 2134 494 3 .2 3 1605.5 33687 0.021 2992 <
s e ia - ik e -agsr AA106 6/12 2336 0802 484 3 .1 1 1305.2 43305 0.029 27335 la » IA-FSE-AOSt AA109 6/12 2336 0802 484 3 .2 3 1573.0 30820 0.032 15000 0.0102B C XA-IKE'AOSK AA119 6/12 2356 0802 484 3 .2 3 1573.0 69683 0.044 10000 0.0062BC U 'R E * 4 0 tS » 5 6 6/12 2338 0802 484 3 .2 3 1573.0 90630 0.058 30000 0.0192BC IA-PEEMJGR 1C60 6/12 2358 0802 484 3.23 1573.0 90630 0.058 51300 1a w lA-ISE-AGOt » 6 4 6/12 2358 0802 484 3 .1 6 1329.4 66690 0.044 20000 0.013
2B C IA-FSEHUUSl AA134 8/12 1334 2133 499 3.00 1497.0 33706 0.023 7084 12BC ZA-FKEHUGR AA133 6 /12 1334 2153 499 2.96 1477.0 35343 0.024 750 0.001a r e ia - r e h u g k AA136 6 /12 1334 2133 499 3.25 1621.8 15207 0.009 730 0.0002BC IA-FKEHUGK N252 6/12 1334 2153 499 3.23 1621.8 21375 0.013 1730 0.0012BC IA -lB E -lU ai M234 6/12 1334 2153 499 3.16 1576.8 33345 0.021 1750 0.0012BC IA-REHUGR » 3 8 6/12 1334 2133 499 3 .2 3 1621.8 26215 0.017 3500 0.002
2ZH jh - fke- fte» AA104 6/12 1700 0700 840 3 .00 2520.0 85085 0.034 13472EH m-IBE-TVER AA105 6/12 1700 0700 840 2 .7 5 2310.0 88163 0.038 1347
2FB FB-FRE-F1SM AA102 6/12 7502FB FB-m-FTKM AA103 6/12 7502FB FB-ISE-F1SM AA131 6/12 1463 7502FB FB-ISE-F1B1 » 6 6 6/12 2992
2FB FB-HEHUC8 AA132 6/12 34265 7502FB FB-F8E-1AG8 » 7 6 6/12 4360 1750
2FB FB-PRE-6/1* » 9 8 6/12 32492FB ÌB-EKE-6/1* K323 6/12 28129 29322TB FB-FKZ-6/1* 1026 6 /12 3249
0.004
0 . 0 0 2
0 . 0 0 1
0 . 0 0 2
0.018
0.033
0 . 0 0 3
f t-8
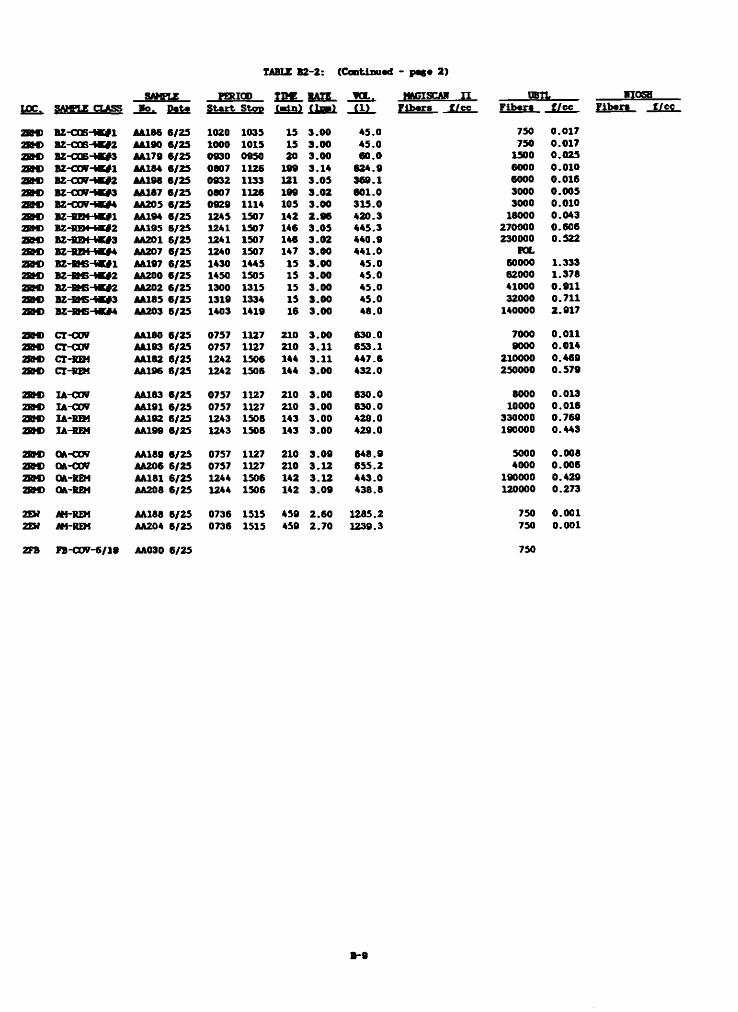
TABLE B 2 -2 : ( C c n t lm e d - p a g * 2 )
SAMPLE FEKIGD TDKIfiC , SAWLE CLASS J tL . E iia
3101 {■In)
a w BZ-C06~tK#l AA186 6/23 1020 1035 152BM> BZ-COS-WZ AA190 6 /23 1000 1015 152RM> BZ-G05~MC#3 AA179 6 /23 0930 0950 202SM) BZ~C0V-tK#l AA184 6 /25 0607 1126 1992BN3 BZ~€Cff-IK#2 AA196 6/25 0932 1133 1212BN> BZ-CCW-MV3 AA187 6 /25 0007 1126 199a w BZ-COT-W#4 AA205 6/25 0929 1114 10528(0 BZ-SIMHW1 M 194 6/25 1245 1507 1423 N ) 12-BBH K #2 AA195 6/25 1241 1507 1462SM> BZ-KEM-«#3 AA201 6/25 1241 1507 1462SM> BZ-KB4-tiK#4 AA207 6/25 1240 1507 1472BM) BZ-8M5-W#1 AA197 6 /25 1430 1445 1528(0 BZ~nC~MK#2 AA200 6/25 1450 1505 1528(0 BZ-8»6-tB»2 AA202 6/25 1300 1315 152BM> BZ-B6-M V3 AAI85 6/25 1319 1334 152HK) BZHBC-MU4 AA203 6/25 1403 1419 16
2SH) c r -c w AA180 6 /25 0757 1127 21028M> CT-CCW AA193 6/25 0757 1127 2102SM> CT-BIM AA162 6/25 1242 1306 14428(0 CT-BEM AAI96 6/25 1242 1506 144
28(0 IA-CCW M 183 6/25 0757 1127 21028(0 IA-COT AA191 6/25 0757 1127 210a w IA-BZM AA.182 6/25 1243 1306 14328M> IAREH AA199 6/25 1243 1506 143
28(0 QA-COT AA189 6/25 0757 1127 2102Btf> QA-C0V AA206 6/25 0757 1127 2102BM) Ok-KEH AA181 6 /25 1244 1306 14228M) OA-REM AA208 6 /25 1244 1306 142
2EH AM-SEH AA188 6/25 0736 1315 4392EH JM-REM AA204 6/25 0736 1315 439
2PB ra -c o v -6/18 AA030 6/25
BATE ¥CL- HAGI3CA1I I I PBTLl i B l (1 ) F lb r s f /c c F ib r » f/c c
3 .00 45.0 750 0.0173.00 45.0 750 0.0173.00 60 .0 1500 0.0253.14 624.9 6000 0.0103 .0 5 369.1 6000 0.0163 .0 2 601.0 3000 0.0053.00 315.0 3000 0.0102 .9 6 420.3 16000 0.0433 .05 445.3 270000 0.6063 .02 440.9 230000 0.5223 .00 441.0 POL3.00 45.0 60000 1.3333 .00 45.0 62000 1.3783 .00 45.0 41000 0.9113 .00 45.0 32000 0.7113.00 48.0 140000 2.917
3 .00 630.0 7000 0.0113 .11 653.1 9000 0.0143.11 447.6 210000 0.4693.00 432.0 250000 0.579
3.00 630.0 6000 0.0133.00 630.0 10000 0.0163 .00 429.0 330000 0.7693.00 429.0 190000 0.443
3 .09 648.9 5000 0.0083.12 653.2 4000 0.0063 .12 443.0 190000 0.4293 .09 438.8 120000 0.273
2 .60 1283.2 750 0.0012 .70 1239.3 750 0.001
750
B -9
i o s a F llx r» f /c c
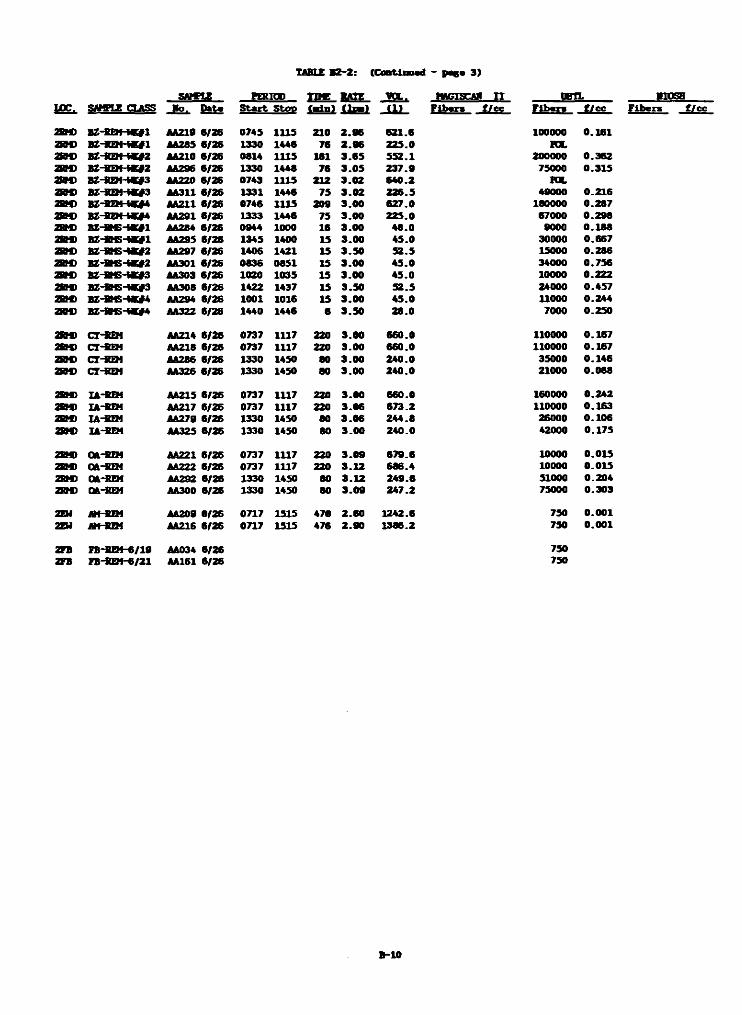
TABU B 2 -2 : (G a n U a m d - 3 )
a m i PERIOD IJW1c c . SAMPLE CLASS J fe * £ s ìs S ta r t Sto© (■ in ) (1m )
2BM) BZ-SOf-WC#! AA219 6/26 0745 1115 210 2 .9 628M) U - iB H O l AA285 6/26 1330 1446 76 2 .9 62SM> BZ-Bat-W »2 AA210 6/26 0614 1115 161 3 .6 5a m B£-SB*-tK#2 AA296 6/26 1330 1446 76 3 .0 5a m K -1 D H V 3 AA220 6/26 0743 1115 212 3 .0 2a m B2-RB4-*C#3 AA31X 6/26 1331 1446 75 3 .0 22Bf> AA211 6/26 0746 1115 209 3.002M> AA291 6/26 1333 1446 75 3.00a m BZ-SMS-MC#1 AA284 6/26 0944 1000 16 3.00a m B2HB6-WV1 AA295 6/26 1345 1400 15 3.00a m BZ-BMS-W#2 AA297 6/26 1406 1421 15 3.50a m AA301 6/26 0636 0651 15 3.00a m BZ~SMS-tC#3 AA303 6/26 1020 1035 15 3.00a m BZHMS-WC#3 AA308 6/26 1422 1437 15 3.50a m BZ-BC-W »4 AA294 6/26 1001 1016 15 3.00a m BZHM5~Wf4 AA322 6/26 1440 1446 6 3 .50
2Bf> CT-BH1 AA214 6/26 0737 1117 220 3.00a m CT-SQf AA218 6/26 0737 1117 220 3.00a m CT-BEH 6A266 6/26 1330 1450 60 3.00a m CT-BS4 AA326 6/26 1330 1450 60 3.00
a m IA-RBf AA215 6/26 0737 1117 220 3.002BO IA-BBf AA217 6/26 0737 1117 220 3.06a m IA~SZM AA279 6/26 1330 1450 60 3 .0 6a m IA-8EM AA325 6 /26 1330 1450 60 3 .0 0
a m Qfc-RM AA221 6 /26 0737 1117 220 3 .0 9a m 0&-BB4 AA222 6/26 0737 1117 220 3 .1 2a m Ofc-REM AA292 6/26 1330 1450 60 3 .1 2a m QA-REM AA300 6/26 1330 1450 60 3 .0 9
2EH «M-REM AA209 6/26 0717 1515 476 2.60a u JH-BEM AA216 6/26 0717 1515 476 2 .90
ZFB FB-SIM -6/19 AA034 6/262FB FB~SEM-6/21 AA161 6/26
* ol. HftGiacAM n m g . » ro sa<1> F ib r » t fc c P ib w i t / c c F ib er» f /c c
621.6 100000 0.161225.0 F X552.1 200000 0.362237 .9 75000 0.315640 .2 m226.5 49000 0.216627.0 160000 0.267225.0 67000 0.296
46.0 9000 0.16645.0 30000 0.66752.5 15000 0.26645 .0 34000 0.75645.0 10000 0.22252 .5 24000 0.45745 .0 11000 0.24426.0 7000 0.250
660.0 110000 0.167660.0 110000 0.167240.0 35000 0.146240.0 21000 0.066
660.0 160000 0.242673.2 110000 0.163244.6 26000 0.106240.0 42000 0.175
679.6 10000 0.015666.4 10000 0.015249 .6 51000 0.204247.2 75000 0.303
1242.6 750 0.0011366.2 750
750750
0.001
B -10
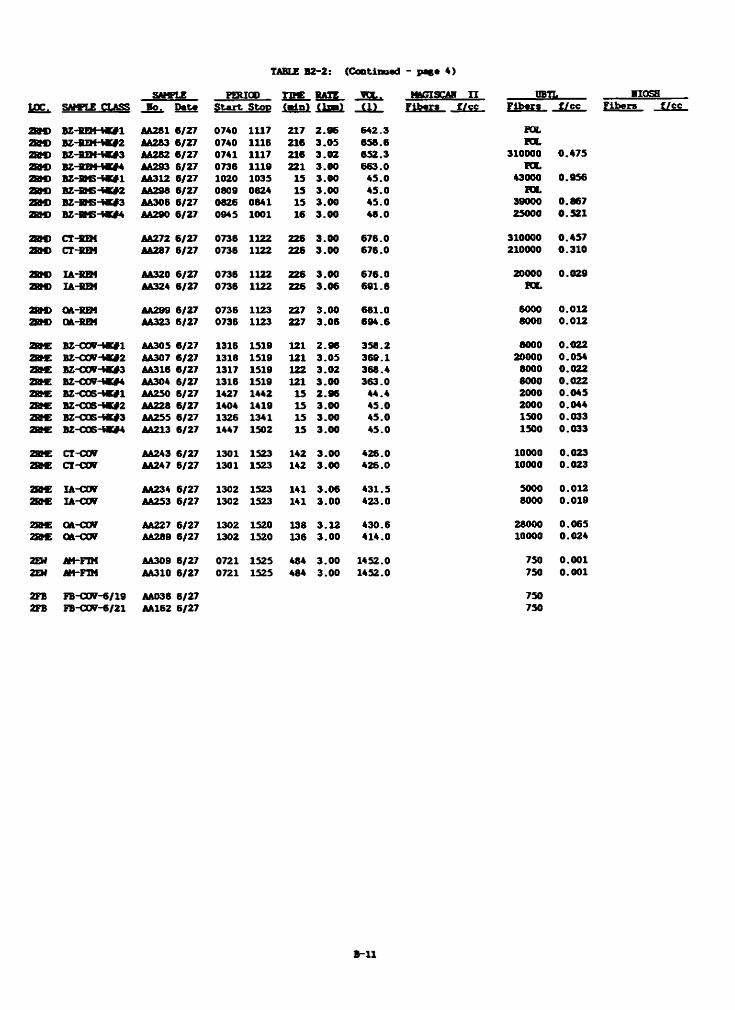
TABLE B 2 -2 : (C o n tin u ad - p a s * 4 )
SAMPLE PERIOD I M M g ¥DL. MAGISCAH I I PBTL
œ * . SAWLE CLASS ■o. P a te S ta r t StOD (■ in i
a w B Z - S H f - M V l A A 2 8 1 6 / 2 7 0 7 4 0 1 1 1 7 2 1 7
28M > A A 2 8 3 6 / 2 7 0 7 4 0 1 1 1 6 2 1 62B f ) B Z - B Q « - M V 3 A A 2 6 2 6 / 2 7 0 7 4 1 1 1 1 7 2 1 62BM> B Z - S E M - W # 4 A A 2 9 3 6 / 2 7 0 7 3 6 1 1 1 9 221a s m B Z ~ B M S ~ W # 1 A A 3 1 2 6 / 2 7 1020 1 0 3 5 1 5
a m K Z - 8 M S - t< # 2 A A 2 9 8 6 / 2 7 0 8 0 9 0 6 2 4 1 52s m B Z - B M 5 - IC # 3 A A 3 0 6 6 / 2 7 0 6 2 6 0 6 4 1 1 5
a m B Z - fiM 5 ~ tK # 4 A A 2 9 0 6 / 2 7 0 9 4 5 1001 1 6
a m CT-SQ4 A A 2 7 2 6 / 2 7 0 7 3 6 1122 2 2 6
2 8 m CT-SBI A A 2 8 7 6 / 2 7 0 7 3 6 1122 2 2 6
2f i m IA ~ fi£M AA320 6/27 0 7 3 6 1122 2 2 62s m IA - flZ M A A 3 2 4 6 / 2 7 0 7 3 6 1122 2 2 6
a m QA-RDt AA299 6/27 0 7 3 6 1123 2 2 7
a m QA-KEM A A 3 2 3 6 / 2 7 0 7 3 6 1 1 2 3 2 2 7
2B W B Z 'C O T - M G t t A A 3 0 5 6 / 2 7 1 3 1 6 1 5 1 9 1212 » E B Z - C C W - W # 2 A A 3 0 7 6 / 2 7 1 3 1 6 1 5 1 9 1212 8 t £ BZ-C0V-t«#3 A A 3 1 6 6 / 2 7 1 3 1 7 1 5 1 9 1222B E B Z - O O V - W 4 A A 3 0 4 6 / 2 7 1 3 1 6 1 5 1 9 1217BK B Z - C O S - M G t l A A 2 5 0 6 / 2 7 1 4 2 7 1 4 4 2 1 5
2 K B Z - C 0 S ~ iK # 2 A A Z 2 8 6 / 2 7 1404 1 4 1 9 1 520C B Z - G Q S - tK # 3 A A 2 5 5 6 / 2 7 1 3 2 6 1 3 4 1 1 52B W B Z - C 0 S - W 4 A A 2 1 3 6 / 2 7 1447 1 5 0 2 1 5
a K CT-CCW A A 2 4 3 6 / 2 7 1301 1 5 2 3 1 4 22B C CI-CW A A 2 4 7 6 / 2 7 1 3 0 1 1523 142
2B £ I A - C W A A 2 3 4 6 / 2 7 1 3 0 2 1523 1412B £ IA - C O T A A 2 5 3 6 / 2 7 1 3 0 2 1523 141
28t£ QA-COV AA227 6/27 1302 1S20 1 3 6
Q A - C W A A 2 8 9 6 / 2 7 1 3 0 2 1 5 2 0 1 3 6
2EH AM-FTM A A 3 0 9 6 / 2 7 0 7 2 1 1 5 2 5 4 6 4
2EW AM-FTM A A 3 1 0 6 / 2 7 0721 1 5 2 5 4 6 4
2 F B F B - C O T - 6 /1 9 A A 0 3 6 6 / 2 7
2FB F B - C W - 6 / 2 1 A A 1 6 2 6 / 2 7
H a l (1 ) F ib e r a f /ç ç f l b f » _ f /c c
2 . 9 6 6 4 2 . 3 PO L
3 . 0 5 6 5 6 . 6 P O L
3 . 0 2 6 5 2 . 3 3 1 0 0 0 0 0 . 4 7 5
3 . 0 0 6 6 3 . 0 P O L
3 . 0 0 4 5 . 0 4 3 0 0 0 0 . 9 5 6
3 . 0 0 4 5 . 0 PO L
3 . 0 0 4 5 . 0 3 9 0 0 0 0 . 6 6 7
3 . 0 0 4 6 . 0 2 5 0 0 0 0.S 2 1
3 . 0 0 6 7 6 . 0 3 1 0 0 0 0 0 . 4 5 7
3 . 0 0 6 7 6 . 0 210000 0 . 3 1 0
3 . 0 0 6 7 6 . 0 20000 0 . 0 2 9
3 . 0 6 6 9 1 . 6 PO L
3 . 0 0 6 6 1 . 0 6 0 0 0 0.0123 . 0 6 6 9 4 . 6 8 0 0 0 0.0122 . 9 6 3 5 6 . 2 6 0 0 0 0.0223 . 0 5 3 6 9 . 1 20000 0 . 0 5 4
3 . 0 2 3 6 6 . 4 6 0 0 0 0.0223 . 0 0 3 6 3 . 0 6 0 0 0 0.0222 . 9 6 4 4 . 4 2000 0 . 0 4 5
3 . 0 0 4 5 . 0 2000 0 . 0 4 4
3 . 0 0 4 5 . 0 1 5 0 0 0 . 0 3 3
3 . 0 0 4 5 . 0 1 5 0 0 0 . 0 3 3
3 . 0 0 4 2 6 . 0 10000 0 . 0 2 3
3 . 0 0 4 2 6 . 0 10000 0 . 0 2 3
3 . 0 6 4 3 1 . 5 5 0 0 0 0.0123 . 0 0 4 2 3 . 0 8 0 0 0 0 . 0 1 9
3 . 1 2 4 3 0 . 6 2 8 0 0 0 0 . 0 6 5
3 . 0 0 4 1 4 . 0 10000 0 . 0 2 4
3 . 0 0 1 4 5 2 .0 7 5 0 0.0013 . 0 0 1 4 5 2 .0 7 5 0
7 5 0
7 5 0
0.001
i o s aF ib e rs f / c c
B - U
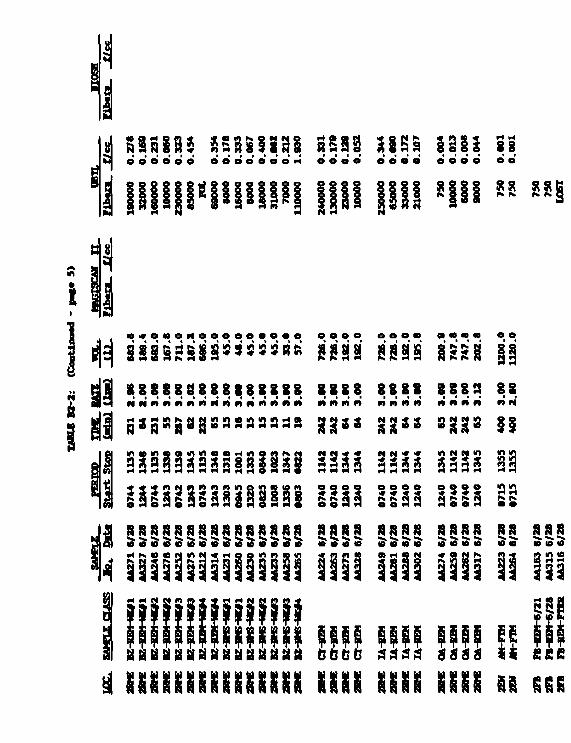
i S1513Í í = S S1S 2 § SSSS 385§ ISIS s iu e o e e e o o o o o o o o m o o o o e c l e e o e e e e e
ë i i i i i i ü m i l i l i s i l i n n
i
* o « o n o o o o o o o o o
gljjj K8SS88888S88888j . S m N N n n n n i i n A n n n n n «
s gj| Sí 3 s a a8 s!)a* n s t n a a m i n M a H
a 5 a ¡ a ? a ¡ ñ 8« « f f l f i n n n n i n
i s i s s s s
s s s a S S S S 8 s s s y
8 8 8 8« » « F*
8 8 8 Sf» » » »
8 8 8 9A A Ü f) 3.
002.
80
2 3 * * 242
242 04 64 8 2 S 2 i l
1142
1142
1344
1344
1142
1142
1344
1344
1345
1142
1142
1345 nH H
5 5 ° 55 Í 3 3 67
4007
4012
4012
40
1240
0740
0740
1240
s s
« s a s « tt tt
8 8 8 8<D ¡0 « »
8 8 8 8 8 8<0 «
8 8 8« «o to
i n n u n i i i i as & * *
TABLE B 2 -2 : (C o n tin u e d - p a g e 6 )
SAMPLE PERIOD T1W MATELOC. n jw s Po. D ate S ta r t StOD (■ in ) (lx a )
2BW IA-PST-ÄC3GR M 39S 7/11 0013 0715 422 3.00a w IA-PST-4GGR AA412 7/11 0013 0715 422 3 .2 5a w IAPST-AGG» M 414 7/11 0013 0715 422 3.002BW IA-PST-ACGR MB60 7/11 0013 0715 422 3 .00a » IA-PST-AGGR MB61 7/11 0013 0715 422 3 .00a w IÀ-FST-AGGS » 6 2 7/11 0013 0715 422 3 .0 0
2BD Oà-PST-AGGR AA413 7/11 0013 0715 422 3 .00
a m IA-pST-MGR AA410 7/11 0627 1630 463 3.00a w IA-PST-WG& M 418 7/11 0827 1630 463 3 .1 5a w IA-pSTHUGR AA419 7/11 0827 1630 463 2 .002BW IA-PST~1UGR MB40 7/11 0827 1630 483 3 .00a w IA-PST-WGR M847 7/11 0627 1630 463 3 .0 5a w IA-PSTHWG» » 5 5 7/11 0627 1630 483 3 .1 5
a w OA-PST-flAGR 66431 7/11 0627 1630 463 2 .9 5
a w lA-PST-àGGR M 392 7/11 2300 0715 495 3 .1 0a w IA-PST-AQGfc AA398 7/11 2300 0715 495 3 .50a w IA-PST-AQG® AA420 7/11 2300 0715 405 3 .502RW IAPST-AGGR NBS6 7/11 2300 0715 495 3 .50a w IA-PST-Ä3GR MB 39 7/11 2300 0715 495 3.00a w IA-PST-AOG» MB68 7 /U 2300 0715 495 3 .50
a w QA-PSt*AQGR AA403 7/11 2300 0715 495 3 .25
a w IA-PST-MGR AA415 7/11 0827 1630 483 3 .05z n c IA-PSTHUCK 6A421 7/11 0827 1630 483 3.002SW IA-PSTHUGR M 450 7 /U 0827 1630 463 3 .1028W IA-PSTHUQt MB36 7/11 0827 1630 483 3.202BW IA-PST-WGR MB39 7 /U 0827 1630 483 3 .152BW IA-PST-WCR NB46 7 /U 0827 1630 463 3 .2 5
2BW 0&-FSTHUGR AA435 7 /U 0627 1630 463 3 .00
ZEN AH-PST-FTER M 434 7/11 0850 1630 460 3 .002ZH AM-PST-PIER M 441 7/11 1024 0707 1243 3.00ZEM AM-PST-FUR AA449 7 /U 0650 1630 460 2.902EM AM-PST-FTER AA40B 7/11 1024 0707 1243 3 .00
2PB FB'PST-6/21 AA174 7 /U2PB FB-PST-7/18 MB S3 7 /U2PB FB~PST-7/18 » 5 4 7 /U
TCL- MAGISCAM I I ÜBTL KIOSHci> f ib e r? U S* F ib er« f /c c F iber» f / c c
1266.0 13396 0.011 7000 0.006 24986 0.0201371.5 189035 0.138 6000 0.0061266.0 164395 0.130 10000 0.008 19366 0.0151266.0 66400 0.054 10000 0.008 33345 0.0261266.0 173565 0.137 20000 0.016 427SO 0.0341266.0 116260 0.092 10000 0.008 26505 0.021
1266.0 198660 0.157 4000 0.003
1449.0 82775 0.057 2000 0.001 5621 0.0041521.5 36865 0.026 2000 0.0011400.7 46125 0.034 2000 0.0011449.0 123120 0.065 3500 0.0021473.2 127315 0.086 1750 0.0011521.5 70965 0.047 1750 0.001
1424.9 43120 0.030 2000 0.001
1534.5 123585 0.081 42000 0.0271732.5 92015 0.053 36000 0.0211732.5 56135 0.034 32000 0.0161732.5 169290 0.096 97000 0.056 78404 0.0451485.0 94905 0.064 93000 0.063 91485 0.0621732.5 106875 0.062 59000 0.034 102600 0.059
1606.8 103565 0.064 9000 0.006
1473.2 52745 0.036 3000 0.0021449.0 51590 0.036 4000 0.0031497.3 77000 0.051 3000 0.002 7700 0.0051545.6 106875 0.069 1750 0.001 13595 0.0091521.5 90630 0.060 1750 0.0011569.6 129960 0.083 5000 0.003 9747 0.006
1449.0 20405 0.014 3000 0.002
1380.0 41580 0.030 750 0.0013729.0 182490 0.049 750 0.000 1347 0.0001334.0 20790 0.016 750 0.0013729.0 162470 0,044 2000 0.001
6314 750 97702992 17502992 1750
B -13
T A B L E B 3 - 1
LEGEND FOR FACILITY 3 PGM DATA
LOC (F a c ility and room lo c a tio n o f sampled a c t iv ity )3xxx F a c ility 3RMF Room FRMG Room GTLG Teachers Lounge outside window
SAMPLE CLASS (Sample type and lo c a tio n , a c t iv ity , and ID )LocationFB F ie ld BlankIA In te r io r Area (Background in the work room )OA Outside Area ( in the h a ll)AM Ambient (O utside the b u ild in g )BZ Personal B reathing ZoneCT M obile Sampling C art (proxim ate to work a c t iv ity )
A c tiv ityFEE Pre-rem oval a c t iv ity - F u ll-te rm samplePST Post-rem oval a c t iv ity - F u ll-te rm sampleREM Removal work - F u ll-te rm seq u en tia l sampleCOV P rep aration - F u ll-te rm seq u en tia lRMS Removal work * 15-m inute sh o rt-term PBZ sampleCOS P rep aration - 15-m inute sh o rt-term BZSEQ Sample p erio d covers seq u en tia l work a c t iv it ie s
I D
AGGR Aggressive sampling modeNAGR Nonaggressive sampling modeVK#g Worker #X BZ samplemm/dd A ctua l date o f b lank source
s a m p t j H n Sample media Id e n tif ic a t io n code and numberAAxxx 25-an C e llu lo se E ster F i l t e r Sample Number xxx (using a
f o i l wrapped 2 - inch cow l)Mxxx 37-mm C e llu lo se E s ter F i l t e r Sample Number xxxNxxx 37-mm Polycarbonate F i l t e r Sample Number xxx
RATE Sample flo w ra te in l i t e r s p er m inute (1pm)VOL Sample volim e in l i t e r s (1 )MAGI SCAN I I Magiscan I I is a com puterized image an a lys is system fo r
PGM; re s u lts are in to ta l fib e rs p er cubic cen tim eter
Phase C ontrast Microscopy using NIOSH Method 7400B counting ru les UBTL PCM an a lys is perform ed by Utah B io lo g ic a l Testing LabsNIOSH PCM an a lys is perform ed in the NIOSH LaboratoryF ibers T o ta l fib e rsf /c c F ibers p er cubic cen tim eter
B - 1 4
TABLE B 3 -2
PHASE CONTRAST MTCSGSOOFY AHALYTICAL RESULTS FOR AIRBORNE ASBESTOS ANALYSIS
FACILITT 3 CDiCIlWAII, OHIO
Jin * 13, Jo ly 1-3 * 10, 19BS
ROTE: For s a p l e i ra p o rta d la s s th an d ttw U b l« , on* h a lf o f th a lim it o f d a ta c tia n i s usad as fo llo w s: LAB 2 5 - » F i l ta r 37-— F l l ta r
UBTL 750 1750nOSH 1347 2992
BAHPIE PERIOD TOC KATE VOL. UBTLSAW1E CLASS S ta r t S top (■ in i *!»■) t i l F ib ara */<?? F ib a rs t/CC F ib ara
38MS IA-PRE-AGGR AA073 6/13 2315 0715 480 3.14 1507.2 57365 0.038 872033M> IA-PKE-AGG» AA094 6/13 2315 0715 400 3 .3 1504.0 83940 0.059 866253 8 » IA-ISE-AGGH AA133 6/13 2315 0715 480 3 .3 1584.0 102410 0.065 62000 0.0393BM5 IA-FSE-AOS M293 6/13 2315 0715 480 3 .1 1488.0 90630 0.061 1342353RMS 1A-FRE-AGGR 1694 6/13 2315 0715 480 3 .3 1584.0 102600 0.065 1598853BMG IA-FKE-AOX H297 6/13 2315 0715 480 3 .2 1536.0 83790 0.055 168435
3HHS U-PBE-UGK AAD84 6/13 1344 2145 481 3 .0 1443.0 130513 0.090 13473BMG IA'PREHUGR AA100 6/13 1344 2145 481 3 .0 1443.0 73535 0.051 13473BM5 IA-FRE-IMX AA101 6/13 1344 2145 481 3 .1 1491.1 96250 0.065 1347399C IA-PREHUGR 1C 96 6/13 1344 2145 481 3 .0 1443.0 152190 0.105 102603RM5 IA-PKEHUGR M299 6/13 1344 2145 481 3 .2 1539.2 135945 0.088 94053RM5 IA-PREHUGR » 0 5 6/13 1344 2145 481 3 .2 1539.2 54976 0.036 2992
SBC IA-PRE-AGGK AA077 6/13 2303 0703 480 3 .3 1584.0 1347 0.001 69303BJC IA-ISE-AGGH **112 6/13 2303 0703 480 3 .1 1488.0 65065 0.044 13473BtC LA-PRE-AGGR AA114 6/13 2303 0703 480 3 .3 1584.0 93940 0.0593»C IA-PSE^AGGft M292 6/13 2303 0703 480 3 .3 1584.0 61560 0.039 230853BC lA-PKE-AGGS 1003 6/13 2303 0703 480 3 .2 1536.0 103455 0.067 2992SBC lA-RE-AGGS » 0 4 6/13 2303 0703 480 3 .2 1536.0 142785 0.093 30000 0.0203SIC IA-RE-AOGR ■320 6/13 2303 0703 480 3 .2 1536.0
38IC lA-PSEHUGR AA081 6/13 1337 2137 480 3 .0 1440.0 36766 0.026 13473IBC IA-PSEHUGR AA113 6/13 1337 2137 480 3 .0 1440.0 24524 0.017 1500 0.0013»C lA-PREHUGH AA115 6/13 1337 2137 480 3 .0 1440.0 51975 0.036 13473BC XA-PREHUG8 » 9 1 6/13 1337 2137 480 3 .1 1488.0 20520 0.014 29923RJC IA-PRE-9UGR » 0 1 6/13 1337 2137 480 3 .0 1440.0 10858 0.008 299238MF U-PBE-MGH » 0 2 6/13 1337 2137 480 3 ,1 1488.0 15219 0.010 4000 0.003
3FB PB-raZ-FTER AA076 6/13 1347 7503FB PB-RE-FTER AA07B 6/13 1347 7503FB IB -R E -P m AA085 6/13 1347 7503FB PB-TCE-FTER AA0B6 6/13 1347 7503FB PB-PRE-FTER AA088 6/13 3426 7503FB PB-PRE-FTER AA096 6/13 962 7503FB PB-PRE-FTER » 9 5 6/13 2992 17503FB PB-PRE-FTER » 0 0 6/13 11371 29923FB PB-PRE-6/14 » 2 8 6/13 7609 29923FB FB-PSE-6/14 » 3 3 6/13 5472 17503FB PB-PRE-6/14 » 3 6 6/13 1111 1750
3LJK? AM-F1ER AA082 6/13 1050 0637 1187 2 .8 3323.6 242550 0.073 13473LMG AM-FTER AA083 6/13 1050 0637 1187 2 .8 3323.6 190960 0.057 1347
0.0580.053
0.0900 . 1 0 1
0 . 1 1 0
0 . 0 0 1
0 . 0 0 1
0 . 0 0 1
0.0070.0060 . 0 0 2
0.0040 . 0 0 1
0.0150 . 0 0 2
0 . 0 0 1
0 . 0 0 1
0 . 0 0 2
0 . 0 0 2
0 . 0 0 0
0 . 0 0 0
B -15
ä
i ï ï s ï I i i S S l S S S a H l c ï s SS I o o o o o o o * o o o o o o « * o o < 4 o
51531* i l u n i i s i s l se e o o e o o e e e o e o o o o e e e
8
i
i
« • H N n n H o e e a e e * o n # « « * 0 9 * « • « N H O N
» » a s g s s s s s s s s s s 6»»«»» s s m s s j s s s s s s s s s a s
f gjl • • • . * • 8 8 * « S S 8 8 8 8 . . . . 0 8908(18 899889 9899898g 3 ! H n n n N n n f î N N f î n n n n f i a n n n n n N ( i ( Í M n n n n n n n n n n n n n n
g a s R s s a s s a a s s s s s * 3 « 3 « m m s s s s s s s s § < s » §
« a
l i i l l S i i l i i i l l i î S i S S I I S S ” Sâ!S
8 8
* * « Sr» r» f » K
a a
§§
o •
r i t i
■M «»V N « «•
*> « 2 2 s a
I l i M ! M H I I N I M M ü üô c c t j G c a a a a a a s s s s s s i e e « «
t i l t i l i t a t i t t t t t t t es 99
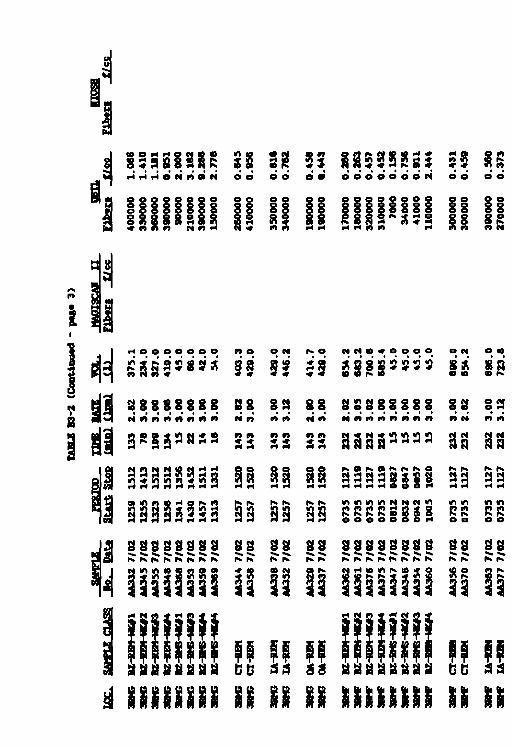
i f i O H H Q N e a
S S a S i S I P :H H H O N n f l N
* 3o o
Me o
SSo o
8 S S 3 5 S S 50 0 0 0 0 0 0 ( 4 0
.43
1
0.4
59
0.5
60
0.3
73
40
00
00
39
00
00
36
00
00
39
00
00
90
00
0
21
00
00
39
00
00
15
00
00 o o
1 1 35
00
00
34
00
00
19
00
00
19
00
00
17
00
00
19
00
00
32
00
00
31
00
00
70
00
34
00
0
41
00
0
11
00
00
30
00
00
30
00
00
39
00
00
27
00
00
8 5 . i l l
1
ï «
37
5.1
23
4.0
32
7.0
41
0.0
45
.0
66
.0
42
.0
54
.0
n o
S 3 « <*
O N
8 3 * *
P> o
¿ g ♦ *
r * N « 0 - * O O O O
2 § g g 5 s s s
69
6.0
65
4.2
69
6.0
72
3.6
3 8 8 8 8 8 8 8
c i n n n n n n n 2.6
2
3.0
0
3.0
0
3.1
2
2.9
0
3.0
0
8 8 8 8 8 8 8 8
r i n n n n n n n
8 8
n n 3.0
0
3.1
2
13
3
76
19
9
13
4
15
22
14
16
14
3
14
3
14
3
14
3
14
3
14
3
23
2
22
4
23
2
22
4
15
15
15
15
23
2
23
2
23
2
23
2
15
12
14
13
15
12
15
12
13
56
14
52
15
11
13
31
15
20
15
20
IS 15
20
15
20
a s a s S s s s* 4 H r 4 H O O O H
r«. r«.
a aH H 1
12
7
11
27
12
59
12
55
13
23
12
56
13
41
14
30
14
57
13
13
12
57
12
57
33 12
57
12
57
07
35
07
35
07
35
07
35
06
12
06
32
09
42
10
05
07
35
07
35
07
35
07
35
8 8 8 8 8 8 8 8 8 8*n.
8 8 8 8*0
8 8 8 8 8 3 8 8 8 8 8 8
^ fSK ^ ^ ^ N N N N
I m W ü Ü ü0 »h> N H i O t ñ M D f O
¡ I n u l l i ! Ä S
nn K
n
m i i M I l M I M I I I I IÜti SS GB S3
SS SS SS s s s s s s s s SS SS
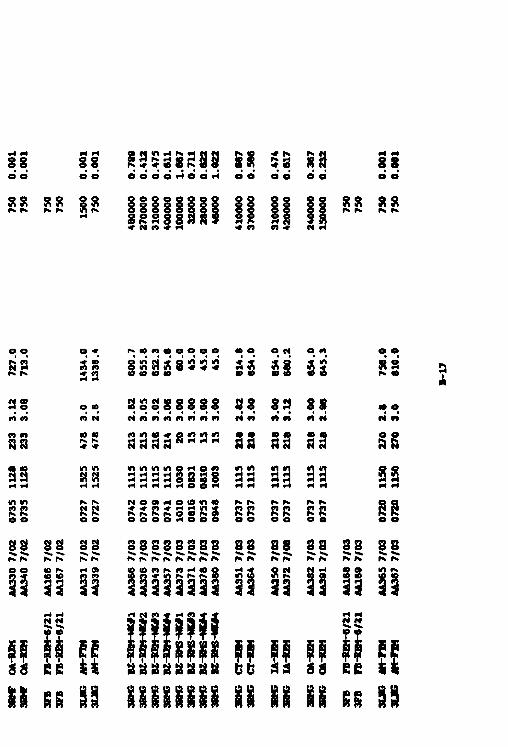
M33
0 7/
02
073S
11
28
233
3.12
727.
0 75
0 0.
001
M34
0 7/0
2 07
35
1126
23
3 3.0
6 71
3.0
750
0.00
1 H H
8 8 o o 0.
780
0.41
20.
475
0.61
11.
667
0.7
U
1500 75
0
4800
0027
0000
3100
0040
0000
1000
0032
000
8 8
S S S S S S S S S S S S 2 2 0 9 9 2 9 9 9 9<1 <1 Q *1 QOOQQQOQ g g g g gg R S« n n •* n S
a * r » e o m « o o o a
EE
•H H H H O O H
to o
10 ID 654.
068
0.2 a a
ID 2
2.82
3.00
3.00
3.12 88
« «
33 218
218
218
218
1115
1115 §1 1115
1115
0737
0737
0737
0737
0737
0737
8 8 *-» ^ jk .
8 8 8 8^ nH 4VI <033
s s
33
» 3r» «
m ©
t j n
a e3 55
2 2p4 H
g g
te<0 m n n v in n 3 9 n u a vS3 11 S S l i l i l i 39 33 33 33 33
m i
! !dd I !p ias i see
EEi t
55 gg gg SS 33
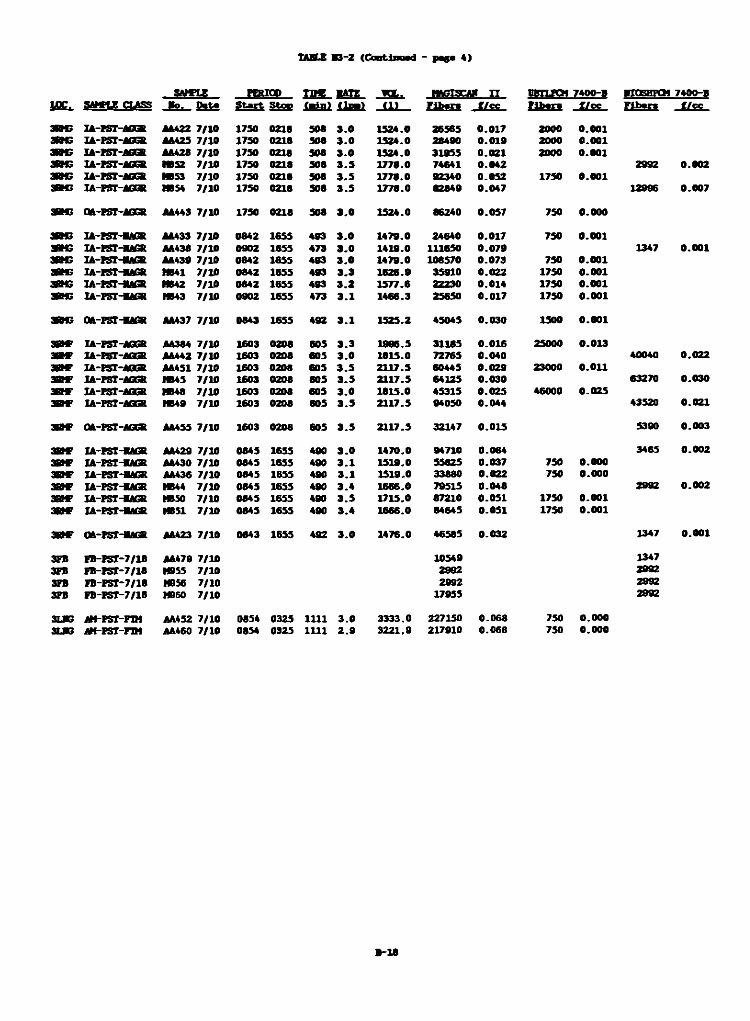
T A M l B 3 -2 ( C n t l n o a d - p a g a 4 )
M * U PBtTDD T P g »ATE fO L NAGISCAX I I DBTLTQf 7400-B KC05HPCM 7400-BUE*. SWFIZ n ^ 5 S S ta r t S top S s á s l l l c s l l& S S . f /c c t t f c I t íía r s %ÍSc
SBC 2A-P8T-40K AU22 7/10 1750 0218 508 3 .0 1524.0 26565 0.017 2000 0.001SBC IÁPSTAGG» M 425 7/10 1750 0218 508 3 .0 1524.0 28490 0.019 2000 0.001SBC i è - i s r - j o a M 428 7/10 1750 0218 508 3 .0 1524.0 31955 0.021 2000 0.001SBC IA-PST-AOG& MB 52 7/10 1750 8218 508 3 .5 1778.0 74641 0.042 2992 0.0023HN5 IA-PST-áGGR MB53 7/10 1750 0216 508 3 .5 1778.0 92340 0.052 1750 0 .001SBC lA-FST-áGGR MB 54 7 /10 1750 0218 508 3 .5 1778.0 82849 0.047 12996 0.007
SBC QA-FST-4GG8 AA443 7 /10 1750 0218 508 3 .0 1524.0 86240 0.057 750 0.000
3B C Ià-FST-UGR AA433 7/10 0842 1655 493 3 .0 1479.0 24640 0.017 750 0.001SBC IA-P8THUGK AA438 7/10 0802 1655 473 3 .0 1419.0 111650 0.079 1347 0.001SBC IA-F5THUGB M 439 7/10 0842 1655 493 3 .0 1479.0 108570 0.073 750 0.001SBC IA-E5THMGR HB41 7/10 0842 1655 493 3 .3 1626.9 35910 0.022 1750 0.001SBC IA-PSTHUCS MB42 7/10 0842 1655 493 3 .2 1577.6 22230 0.014 1750 0.001SBC IA PSTH K K NB43 7/10 0902 1655 473 3 .1 1466.3 25650 0.017 1750 0.001
SBC o á - m - « a M 437 7/10 0843 1655 492 3 .1 1525.2 45045 0.030 1500 0.001
S B * IA-FST-áOGS 8A384 7/10 1603 0208 605 3 .3 1996.5 31185 0.016 25000 0.013SB F XA-PST-JGGR M 442 7 /10 1603 0208 605 3 .0 1815.0 72765 0.040 40040 0.022SBF IA-PST-AGGR M 451 7/10 1603 0208 605 3 .5 2117.5 60445 0.029 23000 0.011SB F IA-PST-áfiGB IM S 7/10 1603 0206 605 3 .5 2117.5 64125 0.030 63270 0.030SBC IA-FST-áGGK MB48 7/10 1603 0208 605 3 .0 1815.0 45315 0.025 46000 0.025SB F IA-FST-áGCS 1049 7/10 1603 0208 605 3 .5 2117.5 94050 0.044 43520 0.021
SB F O á-fST-áG ® M 455 7/10 1603 0208 605 3 .5 2117.5 32147 0 .015 5390 0.003
SBF IA-FSTHUGS M 429 7/10 0845 1655 490 3 .0 1470.0 94710 0.064 3465 0.002SB F IA-FST-láCS M 430 7/10 0845 1655 490 3 .1 1519.0 55625 0.037 750 0.000SB F IA-PSTHMGR M 436 7/10 8845 1655 490 3 .1 1519.0 33880 0.022 750 0.000SBF IA-FSTHUGB HB44 7/10 0845 1655 490 3 .4 1666.0 79515 0.048 2992 0.002SB F IA-PST -UG& MB SO 7/10 0845 1655 490 3 .5 1715.0 87210 0.051 1750 0.001SBF IA-PST-WGR MB51 7/10 0845 1655 490 3 .4 1666.0 84645 0.051 1750 0.001
SB F OA-FSTHUGR M 423 7/10 0843 1655 492 3 .0 1476.0 46585 0.032 1347 0.001
3FB FB-PST-7/1B M 479 7/10 10549 13473FB FB-PST-7/18 M955 7/10 2992 29923FB FB-PST-7/18 M956 7/10 2992 29923FB PB-PST-7/18 M960 7/10 17955 2992
s u e « -P S t-F lM M 452 7/10 0854 0325 1111 3 .0 3333.0 227150 0.068 750 0.000s u e áM-PST-FTM AA460 7/10 0854 0325 1111 2 .9 3221.9 217910 0.068 750 0.000
f t - I B
T A B L E B 4 - 1
L E G E N D F O R F A C I L I T Y 4 P C M D A T A
LOG (F a c ility and room lo c a tio n o f sampled a c t iv ity )4xxx F a c ility 4
RMH Room HRMI Room IRHJ Room JCE Combined Exposure Areas Roon H and Roon IPO P r in c ip le 's O ffic e
SAMPTJt C^ASS (Sample type and lo c a tio n , a c t iv ity , and ID )LocationFB F ie ld BlankIA In te r io r Area (Background in the work room )QA Outside Area ( in the h a ll)AM Ambient (O utside the b u ild in g )BZ Personal B reathing ZoneCT M obile Sampling C art (proxim ate to work a c t iv ity )
A c tiv ityPRE Pre-rem oval a c t iv ity - F u ll term samplePST Post-rem oval a c t iv ity - F u ll term sampleREM Removal work • F u ll term seq u en tia l sampleCOV P rep eration - F u ll term seq uen tia lRMS Removal work - 15 m inute short term PBZ sampleCOS P rep eration - 15 m inute sho rt term BZSEQ Sample p erio d covers seq u en tia l work a c t iv it ie sFTM Ambient Sample - F u ll Term M onitoring; 8 to 16 hours
i nAGGR Aggressive sampling node NAGR Nonaggressive sampling mode WK#X Worker #X BZ sample mm/dd Date o f b lank
SAKPT.F. Wo Sample media Id e n tif ic a tio n code and numberAAxxx 25mm C ellu lo se E ster F i lt e r Sample Number xxx (using a
f o i l wrapped 2-in c h cowl)Hxxx 37mm C e llu lo se E ster F i l t e r Sample Number xxxNxxx 37ma Polycarbonate F i l t e r Sample Number xxx
RATE Sample flo w ra te in l i t e r s per m inute (1pm)VOL Sample volume in l i t e r s (1 )MAGISCAN I I Magiscan I I is a com puterized image an a lys is system fo r
PCM; re s u lts are in to ta l fib e rs per cubic cen tim eter.
Phase Co n tra s t Microscopy u s i n g NIOSH Method 74Q0B counting ru les UBTL PCM an a lys is perform ed by Utah B io lo g ic a l Testing LabsNIOSH PCM an a lys is perform ed in the NIOSH LaboratoryF ibers T o ta l fib e rsf /c c F ib ers /cu b ic centim eter
B - 1 9
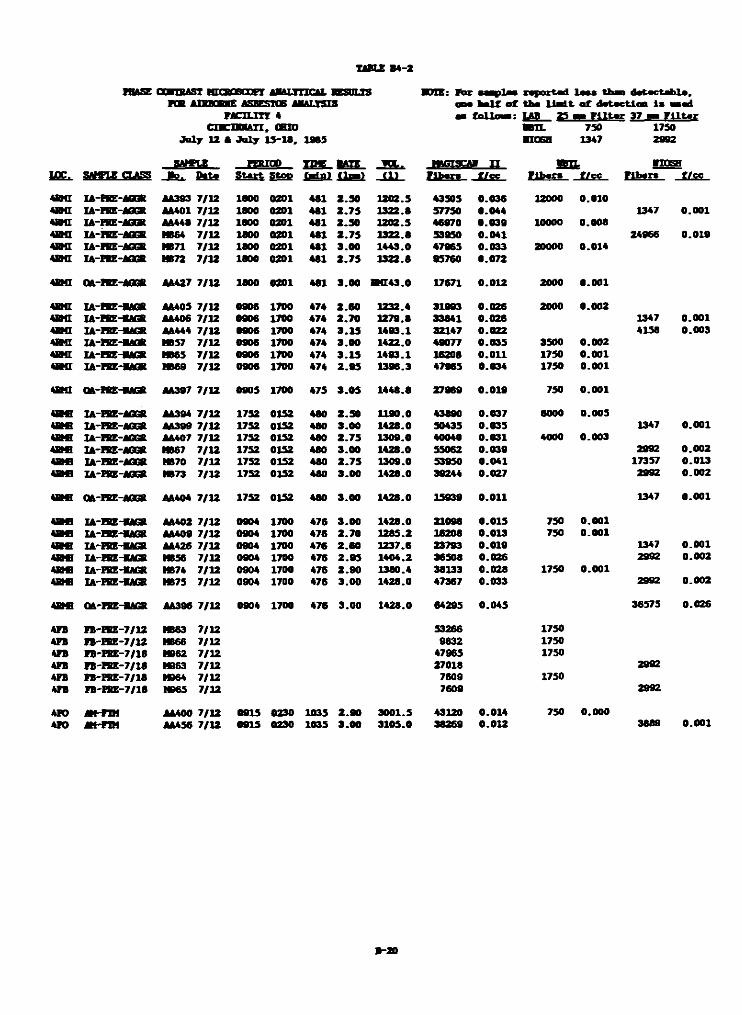
TABU B 4 -2
OCWTRAST KTCSOGGDFT AMALTTICAl. BSDLXS FCB AICTOBHE ASBESTOS ABALT5I3
FACILITT « f . l■ UBATI , OHID
Ju ly 12 i J u ly 15-18. 1989
■OVE: Vox M BplM zv p o rtad I m i t h a d e te c te iile , aom h a l l o f th a lia d .t a t d a ta c tio i i s naad — t o l t a - : L A B 2 5 mm F l l t r 3 7 i F l l t r
7 3 0
1 3 4 7
1730
SAMU FBUOO X 2S _ ! £ £ _ J X - 3BQ. n o m]£ £ . SAWLE CLASS J b u S ta r t S top f» tn l f i — l F ib r a t / c e F lb rm f /c c B bfT » f/c c
4BH IA-ESE-AGGS AA393 7 /12 1800 0201 481 2 .5 0 1202.5 43305 0.036 12000 0.010«M I IA-FKE-AOOl AA401 7 /12 1800 0201 481 2 .7 5 1322.8 57730 0.044 1347 0.0014SMI IA-FSE-AOX M 448 7 /12 1800 0201 481 2 .5 0 1202.5 46970 0.039 10000 0.008« m IA-FKE-AOGS K 64 7/12 1800 0201 481 2 .7 5 1322.8 53950 0.041 24966 0.0194 M IA-FBE-AOGS MB71 7/12 1800 0201 481 3.00 1443.0 47965 0.033 20000 0.0144B fI ia - fke-aggr MB 72 7 /12 1800 0201 481 2 .7 5 1322.8 93760 0.072
« H I QA-ntE-AGGft M 427 7 /12 1800 0201 481 3.00 M 4 3 .0 17671 0 .012 2000 0.001
«M I IAFKE*AGK M 405 7/12 0906 1700 474 2 .6 0 1232.4 31993 0.026 2000 0.0024BH IA-ISEHUGR JM 06 7/12 0906 1700 474 2 .7 0 1279.8 33841 0.026 1347 0.001«M I IA-FSEHUCS M 444 7 /12 8906 1700 474 3 .1 5 1493.1 32147 0.022 4158 0.003am i Z&-ISEHUGS MB 57 7/12 0906 1700 474 3 .0 0 1422.0 49077 0.035 3300 0.0024BMI IA-EBE-SACX HB65 7 /12 0906 1700 474 3 .1 5 1493.1 16208 0 .011 1750 0.001«M I IA-IBEHUGR MftftO 7/12 0906 1700 474 2 .9 5 1398.3 47963 0.034 1730 0.001
«M I QA-ISE-BAGS M 397 7 /12 0905 1700 475 3 .0 5 1448.8 27989 0.019 730 0.001
4 M ia - ekz- aggk AA394 7 /12 1732 0132 480 2 .5 0 1190.0 43890 0.037 6000 0.0054 »B IA'EKE-AGGR M 399 7 /12 1732 0152 480 3 .00 1428.0 30435 0.035 1347 0.0014 M U-RE-JOGK AA407 7 /12 1732 0152 480 2 .7 5 1309.0 40040 0.031 4000 0.0034 M IA'FKE-AGGR MB67 7/12 1732 0152 480 3 .00 1428.0 55062 0.039 2992 0.0024 M ia - r e -aggr MB70 7/12 1732 0152 480 2 .7 5 1309.0 33930 0.041 17357 0.0134 M ZA'FKE-AOGX » 7 3 7/12 1752 0152 480 3 .0 0 1428.0 39244 0.027 2992 0.002
4 M QA-RE-AOX M 404 7 /12 1752 0152 480 3 .00 1428.0 15939 0.011 1347 0.001
4 M IA-1SE-BAGK AM02 7/12 0904 1700 476 3 .00 1428.0 21098 0.015 750 0.0014 M là'R EH U G R AA409 7/12 0904 1700 476 2 .70 1285.2 16208 0.013 750 0.0014 M IA~IKE-SAGK AA426 7/12 0904 1700 476 2 .6 0 1237.6 23793 0.019 1347 0.0014 M IA-ISEHUG8 MB 56 7/12 0904 1700 476 2 .9 5 1404.2 36308 0.026 2992 0.0024 M ft'ISZH U G R MB74 7/12 0904 1700 476 2 .9 0 1380.4 38133 0.028 1750 0.0014 M IA'REHUGR MB73 7/12 0904 1700 476 3 .00 1428.0 47367 0.033 2992 0.002
4 M QA'ISEHUGK AA396 7/12 0904 1700 476 3.00 1428.0 64295 0.045 36375 0.026
4FB IB 'R E -7 /1 2 MB63 7/12 53266 17504FB FB'FRE-7/12 MB66 7/12 9832 17304FB FB 'ÌK E-7/18 MB62 7/12 47965 17504FB IB 'R E -7 /1 0 M963 7/12 27018 29924FB FB'PRE-7/18 lauti 7/12 7609 1750«FB FB'PKE-7/18 M965 7/12 7609 2992
4FO AM-F1M AA400 7/12 0913 0230 1035 2 .9 0 3001.5 43120 0.014 750 0.0004F0 JM-F1M IM H 7/12 0915 0230 1035 3 .0 0 3105.0 0 .012 3889 0.001
» -2 0
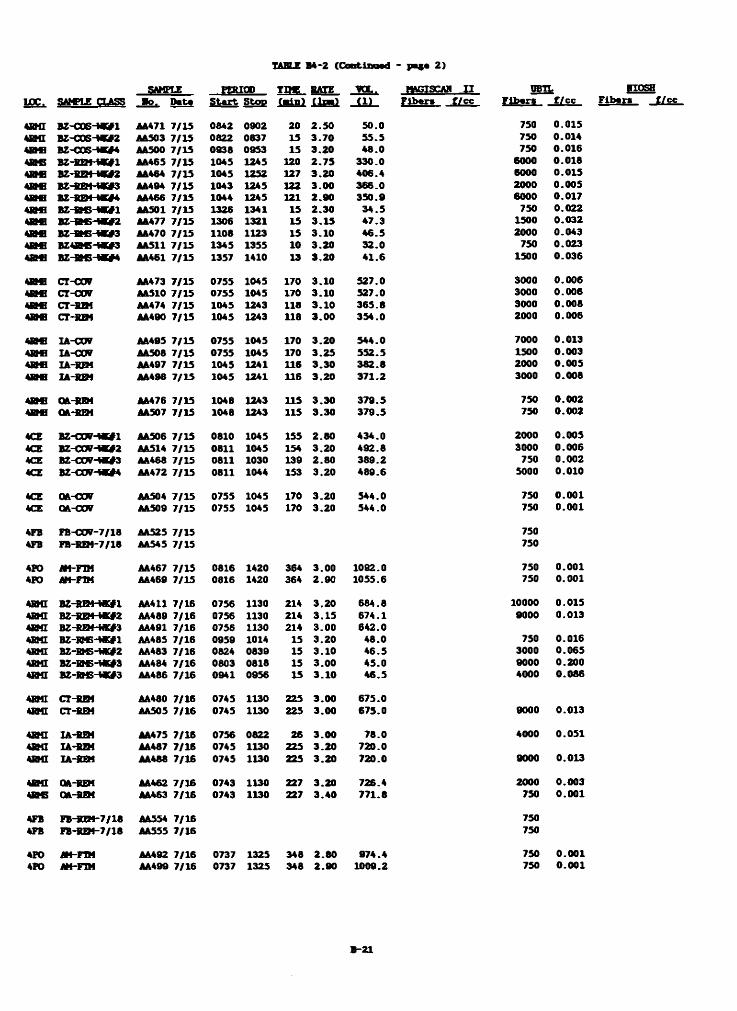
TAW-F B 4-2 ( C o n t ln w d - p a« * 2 )
SAMPLE FEKÏGD TOE RATE VOL. HAGISCA* I I PBTLUPC. SAWLE CUSS go . P » f S ta r t S top (■ ln ) C 1») (1 ) F ib«r* f /c c F ib e rs f / c c
4BNT BZ-C06-MC#1 AA471 7 /15 0842 0902 20 2 .50 50.0 750 0.015«M I U-COS-MEK AA503 7/13 0822 0837 15 3 .70 55.5 750 0.014« f l BZ-C05~ME#4 AA500 7/15 0938 0953 15 3 .20 48.0 750 0.0164 M B Z-8SM «»1 AA465 7/15 1045 1245 120 2 .7 5 330.0 6000 0.0184 M AA464 7/15 1045 1252 127 3.20 406.4 6000 0.0154 M BZ-BEM-ÌW3 M 494 7 /15 1043 1245 122 3 .00 366.0 2000 0.0054 M BZ-SZM-«#4 M 466 7/15 1044 1245 121 2 .9 0 350.9 6000 0.0174 M B Z -B 6 -W 1 M 501 7/15 1326 1341 15 2 .30 34 .5 750 0.0224 M B - K - W 2 AA477 7/15 1306 1321 15 3 .15 47.3 1500 0.0324 M B Z-M -M V 3 4A470 7/15 1108 1123 15 3.10 46 .5 2000 0.0434 M B Z -M -W 3 AA511 7/15 1345 1355 10 3.20 32.0 750 0.0234 M BZ-M-MC#4 M 461 7/15 1357 1410 13 3 .20 41 .6 1500 0.036
4 M CI-CCW AA473 7/15 0755 1045 170 3.10 527.0 3000 0.0064 M c r-o w AA510 7/15 0755 1045 170 3.10 527.0 3000 0.0064 M CT-HIM M 474 7/15 1045 1243 118 3 .10 365.8 3000 0.0084 M CT-SEM AA490 7/15 1045 1243 118 3 .00 354.0 2000 0.006
4 M IA-COT AA495 7 /15 0755 1045 170 3.20 544.0 7000 0.0134 M IA-OCW AA508 7 /15 0755 1045 170 3.25 552.5 1500 0.0034 M IA-EEM AA497 7/15 1045 1241 U S 3.30 382.8 2000 0.0054 M IA-SQ1 AA498 7 /15 1045 1241 116 3.20 371.2 3000 0.008
4 M GA-BB4 AA476 7/15 104B 1243 115 3.30 379.5 750 0.0024 M OftHtDf AA507 7/15 1048 1243 115 3.30 379.5 750 0.002
4CE BZ-OGV-WE#! AA506 7 /15 0810 1045 155 2.80 434.0 2000 0.0054CE BZ-OCW-W#2 AA514 7 /15 0811 1045 154 3.20 492.8 3000 0.0064CE BZ-COV-MC#3 AA468 7/15 0811 1030 139 2.80 389.2 750 0.0024CZ BZ-C0V-W»4 AA472 7/15 0811 1044 153 3.20 489.6 5000 0.010
4CE CÄ-OOW M 504 7/15 0755 1045 170 3.20 544.0 750 0.0014CE OA-OOV AA509 7/15 0755 1045 170 3.20 544.0 750 0.001
4FB FB-COT-7/18 AA525 7/15 7504FB FB-SIH -7/18 AA545 7/15 750
4F0 JH-FTM AA467 7/15 0816 1420 364 3.00 1082.0 750 0.0014F0 m - r m ¿A469 7/15 0816 1420 364 2.90 1055.6 750 0.001
4HMI B2-RIM-WK#1 AA411 7/16 0756 1130 214 3.20 684.8 10000 0.0154BMI B2-REH-HK#2 AA489 7/16 0756 1130 214 3.15 674.1 9000 0.0134 0 0 B Z -S B H W AA491 7/16 0756 1130 214 3.00 642.04BMZ B Z -M H K fl AA485 7/16 0959 1014 15 3.20 48.0 750 0.0164bmi BZ-RM5-MB#2 AA483 7/16 0824 0839 15 3.10 46.5 3000 0.0654SMI B Z -M -W #3 AA484 7/16 0803 0818 15 3.00 45.0 9000 0.2004BHI B£-fiM5-VK#3 AA486 7/16 0941 0956 15 3 .10 46.5 4000 0.086
4BMt CT-HQÎ AA480 7/16 0745 1130 225 3.00 675.04BHZ CT-MH AA505 7 /16 0745 1130 225 3.00 675.0 9000 0.013
4BMI IA-SBf M 475 7/16 0756 0822 26 3 .00 78.0 4000 0.0514 M IAHUM A4487 7/16 0745 1130 225 3.20 720.04SMI IA -SÄ AA468 7/16 0745 1130 225 3.20 720.0 9000 0.013
4 M Qà-SEM AA462 7 /16 0743 1130 227 3.20 726.4 2000 0.0034 M Qft-BQt M 463 7 /16 0743 1130 227 3.40 771.8 750 0.001
4FB FB-SZM-7/18 M 554 7/16 7504FB FB-BEM-7/18 AA555 7/16 750
4F0 JM-FM AA492 7/16 0737 1325 348 2.80 974.4 750 0.0014F0 AH-PTM AA499 7/16 0737 1325 348 2.90 1009.2 750 0.001
io saF ib«r» t i cc
B -21
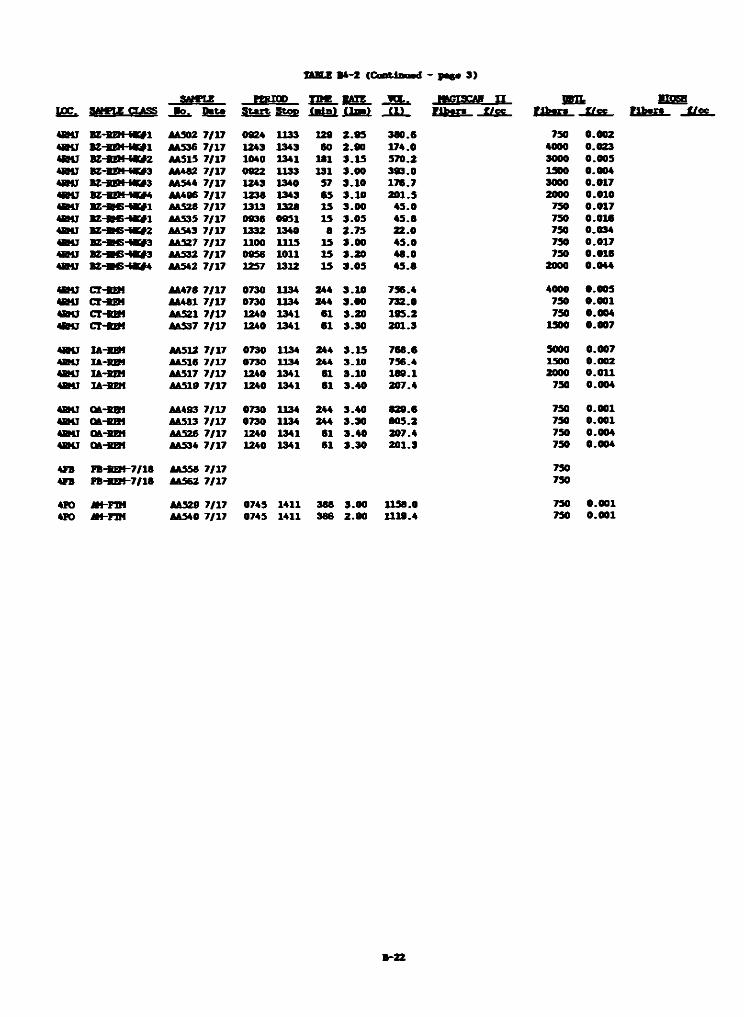
T U « « * - 2 C C e e tln w d - I » e * 3 )
a » « * u r ic o n * w . . m o s c a aSMfLZ CLASS Po. D«U S ta r t S top C lin i f 1™} i l ) F lb r » f /c c F ib r e f /c c
4HMJ B Z -sat-M V l M 302 7/17 0924 1133 129 2 .9 5 380.6 750 0.00248HJ BZ-KEM-«K»1 U S36 7/17 12*3 1343 80 2.90 174.0 4000 0.0234BKJ B Z-am -iK »2 A&513 7/17 IMO 1341 181 3 .1 5 570.2 3000 0.0054BMJ BZ-BXM-MGfS AA482 7/17 0922 1133 131 3 .00 399.0 1300 0.00448HJ B Z-SEH W 3 M 544 7/17 1243 1340 57 3 .10 176.7 3000 0.0174BHJ BZ-9EM-MV4 AA4B6 7/17 1236 1343 65 3 .10 201 .5 2000 0.0104BK7 B Z-0C -W #! AA528 7/17 1313 132« 15 3 .00 45 .0 750 0.0174BMJ BZ-»6-M C»l U S3S 7/17 0936 0951 15 3 .0 5 45 .8 750 0.0164BMJ K-M 5-M Gf2 AA543 7/17 1332 1340 8 2 .7 5 22 .0 750 0.034«BftJ BZ-BC-MV3 AA527 7/17 1100 1115 15 3 .00 45 .0 750 0.0174BMJ K H K W M 532 7/17 0956 1011 15 3 .20 48.0 750 0.0164BKJ KHM S-tK#4 AA542 7/17 1257 1312 15 9 .0 5 45 .8 2000 0.044
4SHJ cr-U M AA478 7/17 0730 1134 244 3 .1 0 756.4 4000 0.005« H I CT-SBH U U 1 7/17 0730 1X34 244 9 .80 732.0 750 0.001«M I CI-REM A&321 7/17 1240 1341 61 3.20 195.2 750 0.0044BU CTHQM M 537 7/17 1240 1341 61 3.30 201.3 1500 0.007
« K J IA-SEH U 5 U 7/17 0730 1134 244 3 .1 5 768.6 5000 0.0074SK7 lA r tm IA316 7 /17 0730 1134 244 3.10 756.4 1500 0.0024BMJ IA-SD4 AA517 7/17 1240 1341 61 9.10 189.1 2000 0.011«M J IA-SZH AA519 7 /17 1240 1341 61 9.40 207.4 750 0.004
«M I GA~BEM AA493 7/17 0730 1134 244 3.40 829 .6 750 0.001«M J Qft-BZM AA513 7/17 0730 1134 244 3.90 805.2 750 0.001«M I QA-KEH AA526 7/17 1240 1341 61 9 .40 207.4 750 0.004«M J QA-8EM M 534 7 /17 1240 1341 61 3.30 201.3 750 0.004
4FB n-B B 9~ 7/lS ÈAS5S 7 /17 7504FB FB-M M -7/18 AA562 7 /17 750
4P0 AAS29 7/17 074S 1411 386 3.00 1158.0 750 0.001«PO itt-F W AA540 7/17 074S 1411 386 2 .9 0 1119.4 750 0.001
B B S
T ibm n t i cc
B -22
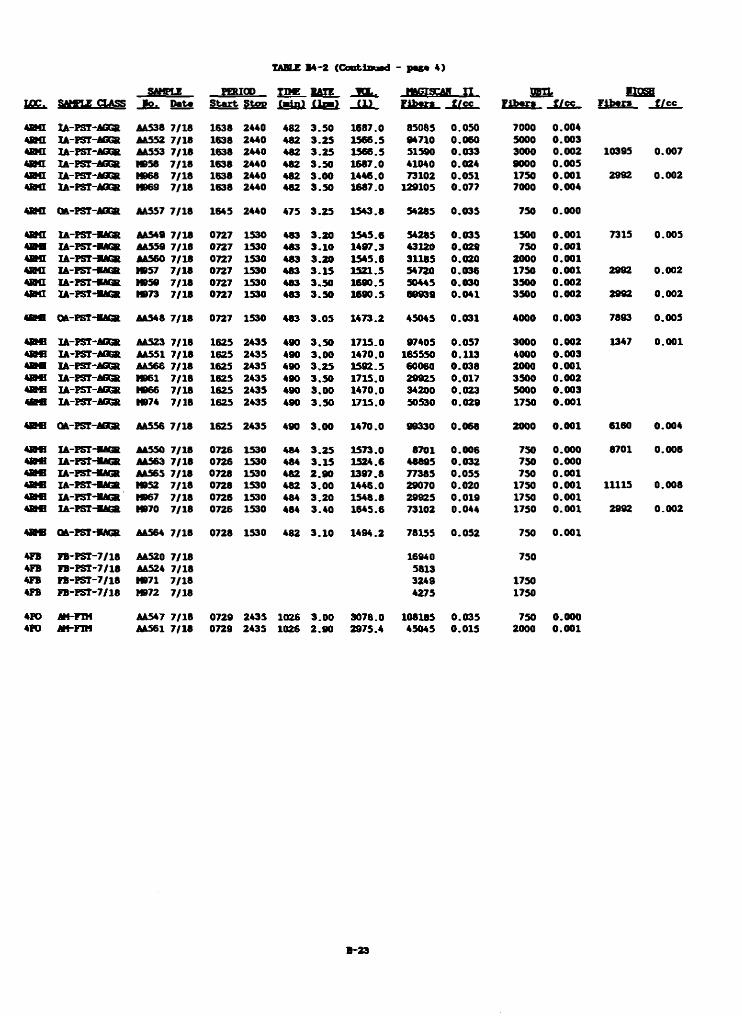
TABU BA-2 (C o n tin u e d - p a g a A)
SAMPLE PERICO T JC BATE]£C^ StfffLE CLASS D ata S ta r t S top l a i a l tu » )
4 M IA-PST-AOGR AA538 7/18 1638 2440 482 3 .504 M 1A-PST-AGG» A&5S2 7/18 1638 2440 482 3 .2 54 M lA-PST-AOGfc AA353 7/18 1638 2440 482 3 .2 54RMI 1A-PST-AGGR » 5 8 7/18 1638 2440 482 3.504 M IA-PST-AGG* M068 7/18 1638 2440 482 3 .004 M IA-PST-AO* M969 7/18 1638 2440 482 3 .50
4 M Q&-PST-AGGR AA557 7/18 1645 2440 475 3 .25
48MI U-FST-MGR AA549 7/18 0727 1530 483 3 .20A M IA-PST-WKX AA559 7/18 0727 1530 483 3.104 M IA-FSTHMGS AAS60 7/18 0727 1530 483 3.204 M IAPST-MGK MB 57 7/18 0727 1530 483 3 .1 54 M lA 'PST-W ffi » 5 9 7/18 0727 1530 483 3.504 M IA-FSI-MGR » 7 3 7/18 0727 1530 483 3.50
4 M QA-P5THUG8. AA548 7/18 0727 1530 483 3 .0 5
4 M 1A-PST-A0G» AA523 7/18 1625 2435 490 3.504 M lA-PST-AflGR AA5S1 7/18 1625 2435 490 3.004 M lA-PST-AGGK AA566 7/18 1625 2435 490 3.254 M IA-FST-4GGR » 6 1 7/18 1625 2435 490 3.504 M IA-PST-AGGR IW M ) 7/18 1625 2435 490 3.004 M IA-PST-AGGR » 7 4 7/18 1625 2435 490 3.50
4 M QA-PST-ACGR AA556 7/18 1625 2435 490 3 .00
4 M IA-FST-UGS AA550 7/18 0726 1530 484 3 .2 54 M IA-PSTHMGK AAS63 7/18 0726 1530 484 3.154 M IA-FST-MGS AA565 7/18 0728 1530 482 2 .9 04 M IA-PST-WG& » 5 2 7/18 0728 1530 482 3 .004 M IA-PSTHMGR MB67 7/18 0726 1530 484 3 .204 M 1A-PST-WG» » 7 0 7/18 0726 1530 484 3.40
4 M QA-PSTHUfGR AA56A 7/18 0728 1530 482 3 .10
4FB FB PST-7/18 AA520 7/184FB FB-PST-7/18 AA524 7/184FB IB -PST-7/18 » 7 1 7/184FB FB-PST-7/18 » 7 2 7/18
4F0 JH-F1M AA547 7/18 0729 243S 1026 3.004P0 AM-FTM M 561 7/18 0729 243S 1026 2.90
- S U H6GISCM n SESc i o s aI l i f i* « « _£/££_ Fil>ar* f / K „ t t f e t s . . t/CC
1687.0 85085 0.050 7000 0.0041566.5 94710 0.060 5000 0.0031566.5 51500 0.033 3000 0.002 10395 0.0071687.0 41040 0.024 9000 0.0051446.0 73102 0.051 1750 0.001 2992 0.0021687.0 129105 0.077 7000 0.004
1543.8 54285 0.035 750 0.000
1545.6 54285 0.035 1500 0.001 7315 0.0051497.3 43120 0.029 750 0.0011545.6 31185 0.020 2000 0.0011521.5 SA 720 0.036 1750 0.001 2992 0.0021690.5 50445 0.030 3500 0.0021690.5 69939 0.041 3500 0.002 2992 0.002
1473.2 4S045 0.031 4000 0.003 7893 0.003
1715.0 97405 0.057 3000 0.002 1347 0.0011470.0 165550 0.113 4000 0.0031592.5 60060 0.038 2000 0 .0011715.0 29925 0.017 3500 0.0021470.0 34200 0.023 5000 0.0031715.0 50530 0.029 1750 0.001
1470.0 99330 0.068 2000 0.001 6160 0.004
1573.0 8701 0.006 730 0.000 8701 0.0061524.6 48895 0.032 750 0.0001397.8 77385 0.055 730 0.0011446.0 29070 0.020 1750 0.001 11115 0.0081548.8 29925 0.019 1750 0.0011643.6 73102 0.044 1750 0.001 2992 0.002
1494.2 78155 0.052 750 0.001
16940 73058133249 17504275 1750
3078.0 108185 0.035 750 0.0002975.4 45045 0.015 2000 0.001
B -23

APPENDIX C
TABULATION OF DATA OBTAINED USING
TRANSMISSION ELECTRON MICROSCOPY (TEM)
TABLE C - l . FádX T T T 1 V K - M D RST-SDCW AL 8 N U K — A M U SE S BT T B t
S » ç l* S tru c tn re s /c c Ai b»«to« « tw e ta m /c c F ih > r« fecW w r T o ta l I c n ttb w tw A sbesto» C h ry so til» áw ahlbole W itr ii d a s t e r B andle T o te i A sbesto« C h rrs o tile h ü i t b o lt
B E - n o U L - R a o a n n s s lT i
♦»-373 0.200 0.104 0.096 0.066 0.006 - - 0 .016 0.164 0.060 0.072 0.006+»-375 0.095 0.043 0.052 0.026 0.026 - - - 0 .067 0.052 0.026 0.026+»-376 0.576 0.456 0.120 0.056 0.064 - 0 .006 - 0.560 0.112 0.046 0.064*»-363 0.046 0.006 0.040 0.032 0.006 - - 0.016 0.032 0.024 0.016 0.006•»-367 0.095 0.006 0.067 0.060 0.006 - 0 .006 0.016 0.072 0.064 0.056 0.006•»-371 0.076 0.009 0.069 0.034 0.034 - - 0.009 0.060 0.060 0 .026 0.034
Anrg 0.162 0.105 0.077 0.053 0.025 0.166 0.065 0.041 0.025
RE-KBOTAL - A n rw s iv e
+»-360 0.936 0.760 0 .156 0.076 0.076 0.009 - 0.009 0.667 0.139 0.061 0.076+»-360 0.440 0 .326 0 .112 0.066 0.024 - 0 .006 0.016 0.406 0.066 0.064 0.024+»-374 1.333 1.174 0.160 0.120 0.040 - - - 1.280 0.160 0.120 0.040**-316 0.526 0.237 0.292 0.229 0.063 0.032 - 0.016 0.457 0.229 0.166 0.063*»-359 0.366 0.156 0.229 0.173 0.055 0.024 - - 0 .315 0.166 0.110 0.055•»-372 0.146 0.092 0.055 0.027 0.027 - - - 0.146 0.055 0.027 0.027
Avg 0.626 0.461 0.167 0.119 0.046 0.579 0.139 0.091 0.046
P05T-KEH37AL - B a o ^ g re ss lv e
+»-664 0.141 0 . 1 1 1 0.030 0.007 0 .022 0.007 - 0 .119 0.022 0.007 0 .015+»-685 0.312 0.286 0.026 0.017 0.009 - - 0 .225 0.026 0.017 0.009+»-686 0.264 0.124 0.140 0.107 0.033 0.008 - 0 .206 0.132 0 .099 0.033*»-682 0.199 0.087 0.113 0 .095 0.017 0.008 0.017 0.173 0.087 0 .069 0.017*»-687 0.545 0.294 0.252 0.168 0.064 - - 0.512 0.252 0.168 0.064*»-668 0.364 0.035 0.329 0.234 0.095 - 0.009 0.355 0.321 0 .225 0.095
A»g 0.304 0.156 0.148 0.105 0.043 0.265 0.140 0.098 0.042
K ST BO O M . - A ggressive
+»-667 0.514 0.283 0.231 0.214 0.017 - 0 .009 0.017 0.445 0.205 0.166 0.017+■-672 0.521 0.308 0.213 0.205 0.007 - 0.007 0.044 0.396 0.161 0.154 0.007+■-673 0.753 0.402 0.342 0.248 0.094 0.043 0.017 0.009 0.651 0.274 0.180 0.094+»-673R 0.659 0.419 0.231 0.197 0.034 0.026 - - 0 .608 0.197 0.163 0.034*»-668 0.927 0.287 0.639 0.639 0 .0 0 0 0.139 0.019 0.009 0.695 0.463 0.463 0 . 0 0 0
*»-674 0.824 0.140 0.676 0.659 0.016 0.181 - 0.008 0.560 0 .478 0.461 0.016*»-683 0.711 0.351 0.3S9 0.319 0.040 0.056 - 0.016 0.567 0.279 0.240 0.040
Avg 0.701 0.313 0.365 0.355 0.029 0.560 0.294 0.264 0.030
♦ ” I n a A * ■ Bdcb B R » B ecom t -using o r ig in a l g r id p re p a ra tio n
C -2
TABLE C -2 . FACILITY 2 R E - AKD FC3ST-ÄEMOTAL SMffLIBG ~ ANALYZED BY TEH
P—jil* S tru c tu re « /c c ____________________ A sbestos s tru c tn re s /c c _____________ F ib e r» /cc______________h a b e r T o ta l Bon asb esto s A sbesto» C h rrs o tile ¿P th lb o l» H i t r l i C los t e r Bundle T o ta l A sbestos C h rv so tile Amphibole
ISE-SBDVAL - lo n a g g re itiv a
+*-267 0.070 0.016 O.OS4 0.054 0.000 - 0.016 0.054 0.039 0.039 0.000+»-277 0.636 0.462 0.155 0.062 0.093 - 0.019 0.622 0.140 0.047 0.093+»-279 0.226 0.092 0.134 0.100 0.033 - 0.025 0.201 0.109 0.075 0.033**-257 0.100 0.036 0.062 0.054 0.006 - - 0.100 0.062 0.054 0.006•»-263 0.0S7 0.032 0.024 0.016 0.006 - - 0.057 0.024 0.016 0.008•»-273 0.100 0.013 0.065 0.046 0.038 0.015 0.085 0.069 0.031 0.038
Avg 0.196 0.113 0.066 0.056 0.030 - - 0.186 0.074 0.044 0.030
RE-8BOTAL - A ggressive
+*-253 0.1S2 0.093 0.059 0.017 0.042 - - 0.152 0.059 0.017 0.042+»-261 0.067 0.032 0.055 0.032 0.024 - - 0.087 0.055 0.032 0.024+»-275 0.161 0.134 0.047 0.016 0.032 - - 0.181 0.047 0.016 0.032•»-265 0.361 0.333 0.046 0.024 0.024 - - 0.341 0.046 0.024 0.024*»-269 0.321 0.186 0.135 0.066 0.066 - - 0.267 0.127 0.068 0.059•»-271 2.698 2.326 0.370 0.132 0.236 0.026 - 2.513 0.344 0.106 0.238
Avg 0.637 0.S19 0.119 0.046 0.071 - - 0.594 0.113 0.044 0.070
FOSTHŒMOVAL - B onaggrm siv*
+»-792 1.511 0.676 0.635 0.272 0.363 - 0.030 0.015 1.421 0.589 0.227 0.363+»-793 0.627 0.517 0.110 0.093 0.017 - - 0.008 0.565 0.102 0.085 0.017+»-675 0.634 0.317 0.317 0.163 0.133 0.006 - 0.017 0.600 0.292 0.167 0.125*»-676 0.347 0.226 0.121 0.057 0.065 - 0.008 0.016 0.315 0.097 0.032 0.065*»-660 0.331 0.121 0.210 0.186 0.024 - - 0.024 0.291 0.170 0.153 0.016*»-789 0.267 1 .0 0 0 0.167 0.106 0.058 0.008 - 0.008 0.233 0.142 0.083 0.058
Avg 0.619 0.360 0.260 0.150 0.110 - - 0.015 0.574 0.232 0.125 0.107
POST-REMOVAL - A ggressive
+*-671 0.986 0.826 0.158 0.099 0.059 - 0.010 0.897 0.148 0.089 0.059+»-795 0.646 0.562 0.286 0.276 0.010 0.039 - 0.700 0.227 0.227 0 .0 0 0
+*-799 3.286 2.862 0.624 0.526 0.099 0.033 - 3.024 0.526 0.427 0.099*»-796 2.402 2.113 0.264 0.216 0.046 0.048 - 1.705 0.168 0.120 0.048*»-797 2.426 2.233 0.192 0.096 0.096 0.024 - 2.113 0.120 0.072 0.048*»-800 0.627 0.454 0.173 0.173 0 .0 0 0 0.050 - 0.519 0.115 0.115 0 .0 0 0
Avg 1.762 1.475 0.2S3 0.231 0.052 - - 1.493 0.217 0.175 0.042
♦ - Boo« D * - Boom E
C -3
TABLE C -3 . F A d L IT T 3 H E - AID FOST-RMWAL SM ELISG — ABALXSED BV T »
________________S tr e tn r e s /c c ____________________ Ttrw c tg re s /c c H t r o / c c» « b « r iS1 T * I1*"!* M atrix C lu s te r B andi» l a t r i A sbestos C h m o tile A w iiltioly
+*-307R 0.350 0.234 0.096 0.076
RE-BHTM L - Aggr— iw
0.021 0 .048 0.296 0.048 0.027 0.021+ * -3 1 « 0.064 0.028 0.035 0.021 0.014 - - 0.037 0.033 0.021 0.014+*-320R 0.282 0.220 0.062 0.041 0.021 1.014 - 0.234 0.048 0.027 0.021•* -3 0 « 0.673 0.309 0.364 0.350 0.014 0.137 0.027 0.399 0.199 0.192 0.007* * -3 0 » 0.30« 0.383 0.203 0.181 0.022 0.087 0.007 0.486 0.109 0.004 0.013• • - 3 1 » 0.033 0.014 0.041 0.041 0.000 - - 0 .033 0.041 0.041 0.000
Avg 0.333 0.202 0.133 0.118 0.013 - - 0 .238 0.000 0.067 0.013
+V -66S 0.213 0.072 0.143 0.131
FOST-BEMOTAL - A ggressiva
0.012 - - 0 .006 0.209 0.137 0.123 0.012+ * -6 6 « 0 .080 0.044 0.044 0.033 O.OU 0.011 - 0.077 0.033 0.022 O.OU+ * -7 9 « 0.477 0.364 0.113 0.087 0.024 0.036 0.006 0.393 0.072 0.048 0.0Z4
0.483 0.173 0.312 0.201 0.111 0.021 0.021 0.416 0.270 0.173 0.097•*-678* 0.071 0.010 0.032 0 .026 0.026 - 0.006 0 .063 0 .043 0 .019 0.026* * -7 8 « 0.130 0.032 0.097 0.091 0.006 - 0.013 0.117 0.084 0.078 0.006
Awg 0.243 0.117 0.127 0.098 0 .03 - - 0 .212 0.107 0.078 0.029
+> - B ot» F * — B o « G R “ B eco tn t w in g o r ig in a l g r id p re p a ra tio n .
S n p la
TABLE C -4. FAdLITT 4 R E - AID FOST-flBOTAL SáMPUBG —
Stru c ta re s /c c A sbestos s tru c tu re s /e c
AAALYSIS BT TM
F ib e rs /c c■—»»»*» T o ta l *o nasbesto s A sbestos C h rrs o tile B sÈ â* C lu s te r B rodle T o ta l A sbesto« C b rrs o til* A n tib o le
RE-REH7VAL - A ggressive
+*-807D 1.331 1.102 0.228 0.108 0.121 _ - 0.027 1.277 0.202 0.081 0.121+*-80 BD 0.444 0.032 0.392 0.318 0.074 - - 0.059 0.377 0.333 0.259 0.074+*-8080 1.645 1.348 0.097 0.081 0.016 - - 0.032 1.433 0.063 0.048 0.016**-801R 0.388 0.149 0.237 0.193 0.044 0.044 - 0.018 0.323 0.176 0.141 0.035**-802R 0.363 0.257 0.106 0.083 0.023 0.015 - 0.008 0.302 0.083 0.060 0.023**-8060 0.817 0.246 0.517 0.518 0.033 0.132 - 0.079 0.362 0.360 0.307 0.033
Avg 0.831 0.509 0.272 0.217 0.055 - - 0.037 0.711 0.203 0.140 0.034
POST-REMOVAL - A ggressive
+V-944R 0.201 0.108 0.093 0.036 0.037 0.014 - 0.007 0.172 0.072 0.014 0.037+*-847R 0.239 0.206 0.033 0.020 0.013 0.007 - - 0.206 0.027 0.013 0.013+ * -9 4 » 0.398 0.312 0.086 0.060 0.027 - - 0.013 0.332 0.073 0.046 0.027•V-917R 0.130 0.069 0.081 0.069 0.013 0.023 - 0.006 0.110 0.030 0.038 0.013**-937D 2.107 1.940 0.167 0.167 0.900 0.021 - 0.021 1.710 0.123 0.123 0.000**-9400 1.123 1.101 0.022 0.011 O.OU - - - 0.887 0.022 O.OU O.OU
Avg 0.703 0.622 0.000 0.061 0.020 - - - 0.571 0.062 0.041 0.020
♦ * Booa H * ■ Boob I 1 ■ ftacocnt M in s o rig in a l g r id p re p a ra tio n .D - Dnpl l c iU co ta it tram g r id p rep arad tr a u tiw m i f i l t e r ; o r ig in a l g r id p re p a ra tio n n o t « d t d »I< fo r n c o n t i n s .
C -4
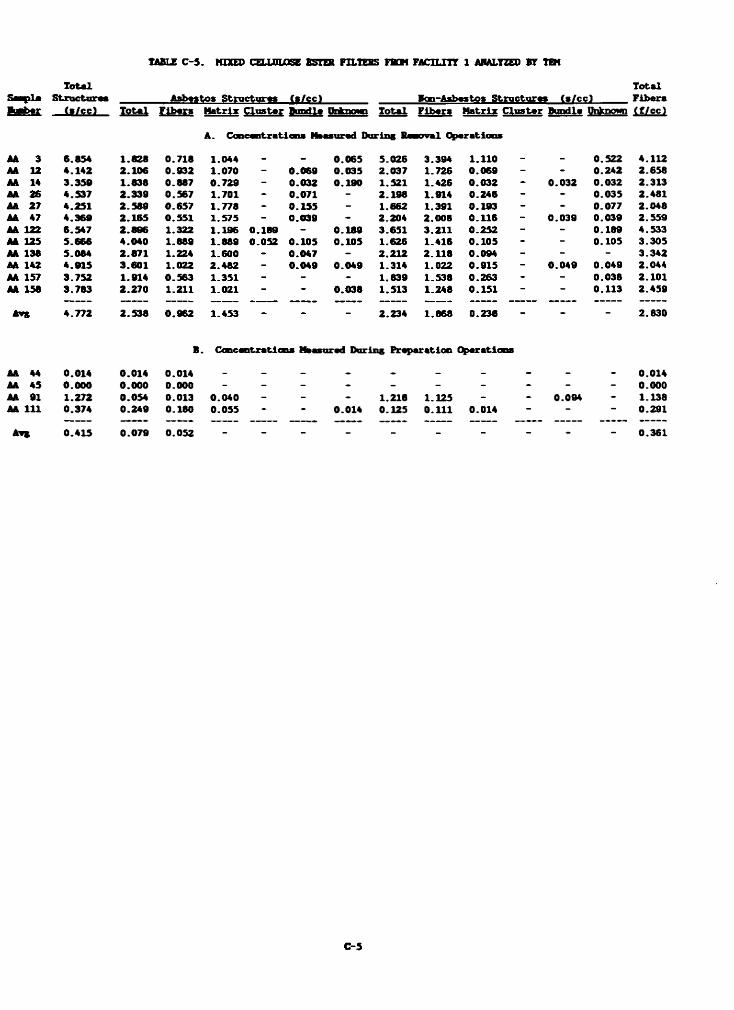
TABLE C -5 . MIXED QgJJIXlSE ESTES FH.TEBS FflCM FáCILITY 1 ANALYZED BY TDf
T o ta l T o ta lS a p l t S tru c tu ra s to b w tc « S tru c tu ra» f s / c c ï ________ _______ Bcn-A sbesto« S tru c tu re « ( i /c c i______ F ib e rs
( s / c c ) T o ta l F ib er« M atrix C lu s te r Bundle Dntaowi T o ta l F iber» M atrix C lu s te r Bundle Unknown (ff/cci
A. C oncentre t i ons M easured D aring P— w il O perati«
AA 3 6.854 1.828 0.718 1.044 - - 0.065 5.026 3.394 1.110 - - 0.522 4.112AA 12 4.142 2.106 0.932 1.070 - 0 .069 0.035 2.037 1.726 0.069 - - 0.242 2.658AA 14 3.359 1.838 0.887 0.729 - 0.032 0.190 1.521 1.426 0.032 - 0.032 0.032 2.313AA 26 4.537 2.339 0.567 1.701 - 0.071 - 2.198 1.914 0.246 - - 0.035 2.481AA 27 4.251 2.589 0.657 1.778 - 0.155 - 1.662 1.391 0.193 - - 0.077 2.048AA 47 4.369 2.165 0.551 1.575 - 0.039 - 2.204 2.008 0.116 - 0.039 0.039 2.559AA 122 6.547 2.886 1.322 1.196 0.189 - 0.189 3.651 3.211 0.252 - - 0.189 4.533AA 125 5.666 4.040 1.689 1.889 0.052 0.105 0.105 1.626 1.416 0.105 - - 0.105 3.305AA 138 5.084 2.871 1.224 1.600 ~ 0.047 - 2.212 2.118 0.094 - - - 3.342AA 142 4.915 3.601 1.022 2.482 - 0.049 0.049 1.314 1.022 0.915 - 0 .049 0.049 2.044AA 157 3.752 1.914 0.563 1.351 - - - 1.839 1.538 0.263 - - 0.038 2.101AA 158 3.783 2.270 1.211 1.021 - - 0.038 1.513 1.248 0.151 - - 0.113 2.459
Avg 4.772 2.538 0.962 1.453 - - - 2.234 1.868 0.236 - - - 2.830
AA 44 0.014 0.014 0.014AA 45 0.000 0.000 0.000AA 91 1.272 0.054 0.013AA 111 0.374 0.249 0.180
A** 0.415 0.079 0.052
C o n cen tra tio n s M eesured D uring P rep a ra tio n O perations
- - - - - - - - - 0 . 0 1 *
- - - - - - - - - o.OOO0.040 - - - 1.216 1.125 - - 0.094 - 1.1380.055 * - 0.014 0.125 0.111 0.014 - - - 0.291
- - - - - - - - - 0 . 3 6 1
C -5

APPENDIX D
STATISTICAL ANALYSIS

A P P E N D I X D
STATISTICAL ANALYSIS
Goals o f A nalysis
Do asbestos le v e ls increase because o f the removal operations? We study th is question by making a v a r ie ty o f comparisons:
a .) comparison o f the p re - and post-rem oval nonaggressive s tru c tu re and f ib e r counts.
b . ) comparison o f the p re - and post-rem oval aggressive s tru c tu re and f ib e r counts.
These f i r s t two sets o f comparisons are meant to answer the question d ire c t ly— is th e re more asbestos in the given room a fte r removal than th ere was before removal?
Other comparisons th a t answer re la te d questions are the fo llo w in g :c . ) comparison o f the fra c tio n o f fib e rs th a t are asbestos f p re - v s .
post-rem oval.d .) comparison o f the fa c tio n o f s tru ctu res th a t are asbestos, p re - vs .
post-rem oval.The two above comparisons, which could each be made fo r the aggressive and nonaggressive data sep ara te ly , could g ive in fo rm ation on the nature o f the removal process.
Other comparisons are as fo llo w s:e .) comparison o f the pre-aggressive and pre-nonaggressive data .f . ) comparison o f the post-aggressive and post-nonaggressive data .
The above comparisons provide in fo rm ation on the value o f the aggressive and nonaggressive data .
Remarks on S ta t is t ic a l A nalysis
The comparisons ( a ) , ( b ) , ( e ) , and ( f ) were c a rrie d out on the (n a tu ra l) log sca le , where the res id u a ls seem to behave n ic e ly . There is l i t t l e in d ic a tio n o f o u tlie rs . Since severa l samples were taken sim ultaneously, the re s id u a l mean square from each an a lys is o f variance re fle c ts the sampling and counting v a r ia b ili t y associated w ith the TEM method. The estim ated re la t iv e standard d e v ia tio n associated w ith th is v a r ia b ili t y was no b igger than 80%, and as low as 60%. (The comparisons fo r (c ) and (d ) were c a rrie d out on the untransform ed s c a le .)
Aggressive Sampling — Changes in F ib er Counts Due to Removal
We begin by discussing comparisons (a ) and (b ) . For the aggressive measurements, the d iffe re n c e s among rooms w ith in a f a c i l i t y are not s ig n ific a n t a t the 5% le v e l. Ve must consider the asbestos measurements sep ara te ly fo r the to ta l ( f ib e r and s tru c tu re ) measurements. See the ta b le below fo r the ra tio s
D -l
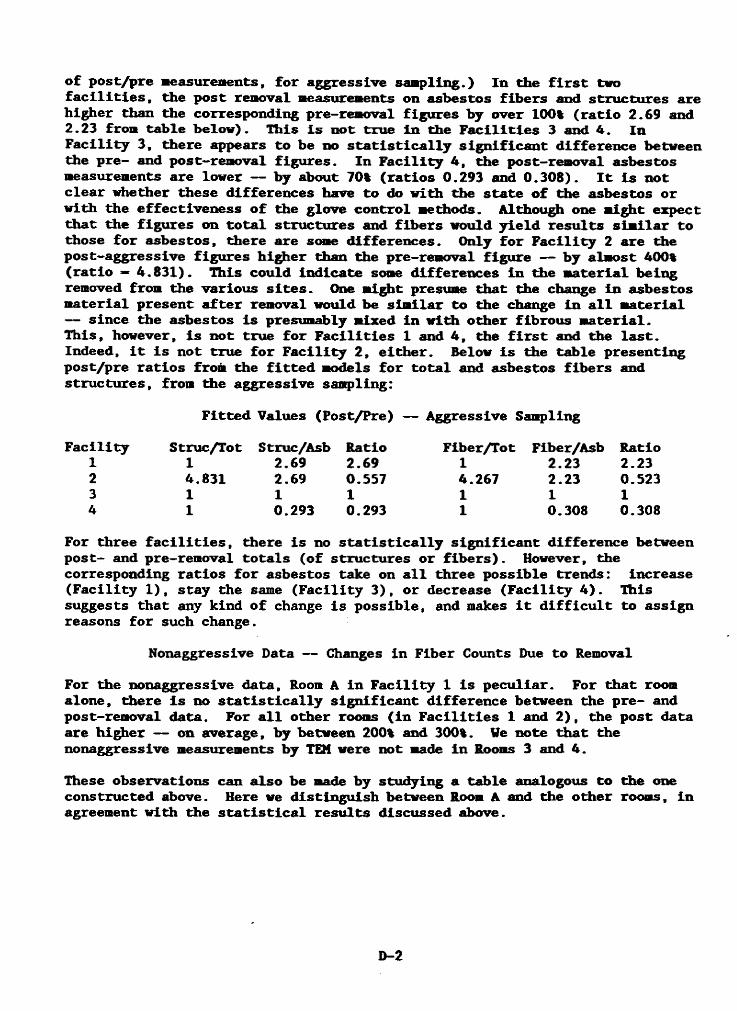
o f p o s t/p re measurements, fo r aggressive sam pling .) In the f i r s t two f a c i l i t ie s , the post removal measurements on asbestos fib e rs and s tru c tu res are h igher than the corresponding pre-rem oval fig u re s by over 100% ( r a t io 2 .69 and 2.23 from ta b le be lo w ). Th is is no t tru e in the F a c ilit ie s 3 and 4 . In F a c ility 3 , th ere appears to be no s ta t is t ic a lly s ig n ific a n t d iffe re n c e between the p re - and post-rem oval fig u re s . In F a c ility 4 f the post-rem oval asbestos measurements are low er — by about 70% (ra tio s 0 .293 and 0 .3 0 8 ). I t is not c le a r whether these d iffe ren c es have to do w ith d ie s ta te o f the asbestos or w ith the e ffe c tive n ess o f the glove c o n tro l methods. Although one m ight expect th a t the fig u re s on to ta l s tru c tu res and fib e rs would y ie ld re s u lts s im ila r to those fo r asbestos, th ere are some d iffe re n c e s . Only fo r F a c ility 2 are the post-aggressive fig u re s h ig h er than the pre-rem oval fig u re — by alm ost 400% ( r a t io — 4 .8 3 1 ). Th is could in d ic a te some d iffe re n c e s in the m a te ria l being removed from the various s ite s . One m ight presume th a t the change in asbestos m a te ria l p resent a f te r removal would be s im ila r to the change in a l l m a te ria l— since the asbestos is presumably mixed in w ith o th er fib ro u s m a te r ia l.T h is , however, is no t tru e fo r F a c ilit ie s 1 and 4 , the f i r s t and the la s t . Indeed, i t is not tru e fo r F a c ility 2 , e ith e r . Below is the ta b le p resenting p o s t/p re ra tio s from the f i t t e d models fo r to ta l and asbestos fib e rs and s tru c tu re s , from the aggressive sam pling:
F itte d Values (P o s t/P re ) — Aggressive Sampling
F a c ility S tru c /T o t Struc/Asb R atio F ib e r/T o t F iber/A sb R atio1 1 2 .69 2 .69 1 2 .23 2 .232 4.831 2 .69 0 .557 4.267 2 .23 0.5233 1 1 1 1 1 14 1 0.293 0.293 1 0.308 0.308
For th ree f a c i l i t ie s , th ere is no s ta t is t ic a lly s ig n ific a n t d iffe re n c e between p o s t- and pre-rem oval to ta ls (o f s tru ctu res o r f ib e r s ) . However, the corresponding ra tio s fo r asbestos take on a l l th ree possib le trends: increase(F a c ility 1 ) , s tay the same (F a c ility 3 ) , o r decrease (F a c ility 4 ) . This suggests th a t any kind o f change is p o ss ib le , and makes i t d i f f ic u l t to assign reasons fo r such change.
Nonaggressive Data — Changes in F ib er Counts Due to Removal
For the nonaggressive d a ta . Room A in F a c ility 1 is p e c u lia r . For th a t room alone, th ere is no s ta t is t ic a lly s ig n ific a n t d iffe re n c e between the p re - and post-rem oval d a ta . For a l l o ther rooms ( in F a c ilit ie s 1 and 2 ), the post data are h igher — on average, by between 200% and 300%. We note th a t the nonaggressive measurements by TEM were not made In Rooms 3 and 4 .
These observations can a lso be made by studying a ta b le analogous to the one constructed above. Here we d is tin g u is h between Room A and the o th er rooms, in agreement w ith the s ta t is t ic a l re s u lts discussed above.
D - 2
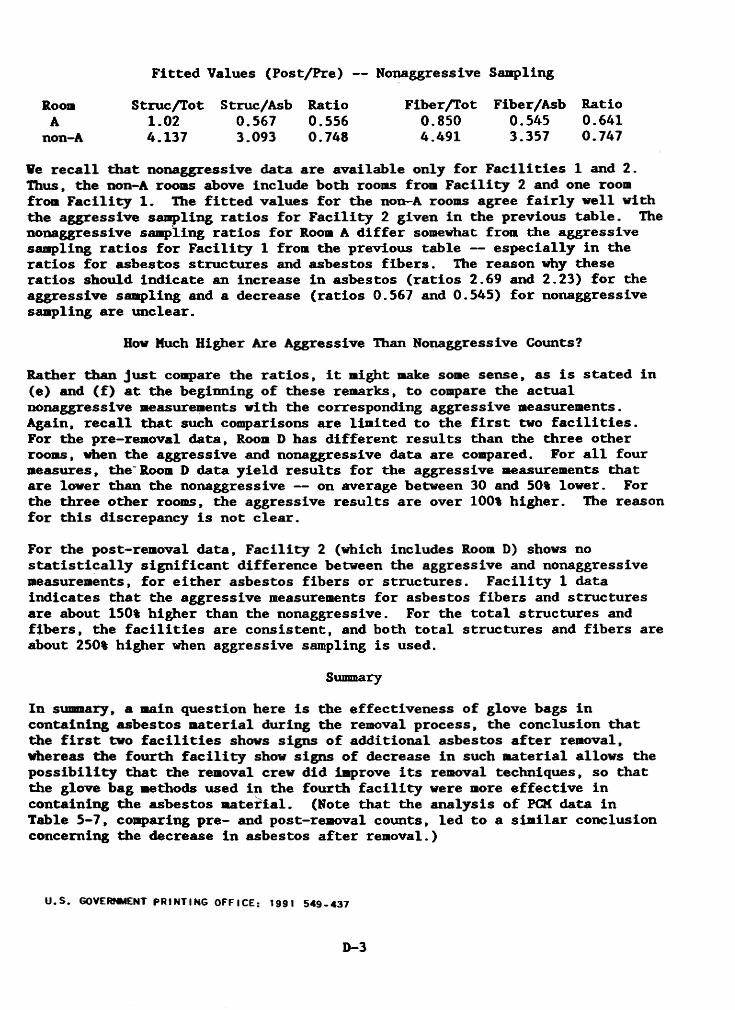
F itte d Values (P o st/P re ) — Nonaggressive Sampling
Room S tru c /T o t Struc/Asb R atio F ib e r/T o t F iber/A sb R atioA 1 .02 0 .567 0.556 0 .850 0 .545 0.641
non-A 4 .137 3.093 0 .748 4 .491 3 .357 0 .747
Ve r e c a ll th a t nonaggres s ive data are a v a ila b le only fo r F a c ilit ie s 1 and 2. Thus, the non-A rooms above include both rooms from F a c ility 2 and one room from F a c ility 1 . The f i t t e d values fo r the non-A rooms agree f a ir ly w e ll w ith tiie aggressive sampling ra tio s fo r F a c ility 2 given in the previous ta b le . The nonaggressive sampling ra tio s fo r Room A d if f e r somewhat from the aggressive sampling ra tio s fo r F a c ility 1 from the previous ta b le — e s p e c ia lly in the ra tio s fo r asbestos s tru ctu res and asbestos f ib e rs . The reason why these ra tio s should in d ic a te an increase in asbestos (ra tio s 2 .69 and 2 .2 3 ) fo r the aggressive sampling and a decrease (ra tio s 0 .567 and 0 .5 4 5 ) fo r nonaggressive sampling are u n c lea r.
How Much H igher Are Aggressive Than Nonaggr ess ive Counts?
Rather than ju s t compare the ra tio s , i t m ight make some sense, as is s ta te d in (e ) and ( f ) a t the beginning o f these rem arks, to compare the ac tu a l nonaggressive measurements w ith the corresponding aggressive measurements. Again, r e c a ll th a t such comparisons are lim ite d to the f i r s t two f a c i l i t ie s .For the pre-rem oval d a ta , Room D has d iffe re n t re s u lts than the th ree o ther rooms, when the aggressive and nonaggressive data are compared. For a l l fou r measures, the'Room D data y ie ld re s u lts fo r the aggressive measurements th a t are low er than the nonaggressive — on average between 30 and 50% low er. For the th ree o th er rooms, the aggressive re s u lts are over 100% h ig h e r. The reason fo r th is discrepancy is not c le a r .
For the post-rem oval d a ta , F a c ility 2 (which includes Room D) shows nos ta t is t ic a lly s ig n ific a n t d iffe re n c e between the aggressive and nonaggressive measurements, fo r e ith e r asbestos fib e rs or s tru c tu re s . F a c ility 1 data in d ic a tes th a t the aggressive measurements fo r asbestos fib e rs and s tru ctu res are about 150% h igher than the nonaggressive. For the to ta l s tru c tu res and f ib e rs , the f a c i l i t ie s are co n s is ten t, and both to ta l s tru ctu res and fib e rs are about 250% h igher when aggressive sampling is used.
Summary
In summary, a main question here is the e ffe c tive n ess o f glove bags incon ta in ing asbestos m a te ria l during the removal process, the conclusion th a tthe f i r s t two f a c i l i t ie s shows signs o f a d d itio n a l asbestos a f te r rem oval, whereas the fo u rth f a c i l i t y show signs o f decrease in such m a te ria l allow s the p o s s ib ility th a t the removal crew d id improve its removal techniques, so th a t the glove bag methods used in the fo u rth f a c i l i t y were more e ffe c tiv e in contain ing the asbestos m a te ria l. (Note th a t the an a lys is o f PCM data in Table 5 -7 , comparing p re - and post-rem oval counts, le d to a s im ila r conclusion concerning the decrease in asbestos a f te r rem oval.)
U . S . GOVERfMENT PRINTING OFFICE; 1991 5 4 9 .4 3 7
D-3


![Cyborg Glove ExcerptNick and Tesla’s Super Cyborg Gadget Glove [Excerpt]](https://img.pdfslide.net/doc/110x75/577cc47a1a28aba711996e65/cyborg-glove-excerptnick-and-teslas-super-cyborg-gadget-glove-excerpt.jpg)