Embed Size (px)
Citation preview
An Evaluation of Pediatric-Modified Diagnosis-Related Groups
Susan MC Payne PhD and Rachel M Schwartz MPH
Pediatric-modified diagnosis-related groups (PM-DRGs) were designed to deshyscribe more accurately than DRGs differshyences in severity of illness and charges across pediatric patients We report on an evaluation of PM-DRGs for use in proshyspective payment systems (PPSs) Data on pediatric discharges (ie patients 17 yeers ofage or under) from 5 States and a national sample of 43 hospitals were used PM-DRGs explained substantially more variation in resource use at the disshycharge level and hospitaleve PM-DRGs improved classification of neonatal disshycharges byconcentrating them into fewer categories and measuring birth weight more precisely
INTRODUCTION
PM-DRGs were developed to describe variations in resource use and severity of Illness across pediatric patients and the hospitals treating them more accurately than DRGs The development of PM-
Support for the research presented in this article was provided by the Health care Anancing Administration (HCFA) under Coshyopera1ive Agreement Number 17-C-9909311-lt12 with suppleshymentary funding from the Assistant Secretary for Planning and Evaluation (ASPE) Department of Health and Human Sefvlces Susan MC Payne is with the Boston University School of Medicine and Rachel M Schwartz Is with the National Perimiddot natal Information Center The statements contained In this artimiddot cle are solely those of the authors and do not necessarily reshyflect the views or policy positions of HCFA ASPE Boston University School of Medicine or the National Perinatallnformiddot mation Center 1Funcling for the development of PMmiddotDRGs was provided by HCFA the National Association of Childrens Hospitals and Related Institutions (NACHRI) and the Pew Charitable Trust The Health care Research Foundation Albany New York Polmiddot Icy Analysis Inc Brookline Massachusetts and Health Sysshytems International New Haven Connecticut participated in develOping the system
DRGs was motivated by two concerns about DRGs First while the Health Care Financing Administration (HCFA) had evaluated DRGs for use as the case-mix system In the Medicare PPS DRGs had not been tested for pediatric applications There was evidence that the DRG system might not reflect unique clinical aspects of illness in children particularly among severely Ill newborns (National Associashytion of Childrens Hospitals and Related Institutlons 1984) Because neonates comprise 39 percent of hospital disshycharges among patients 14 years of age or under (excluding normal newborns) (National Center for Health Statistics 1992) and their hospital costs are often very high (Rosenbaum 1987 Schwartz 1989) the sensitivity of a system to differshyences in resource use among neonates is critical to its performance in classifying pediatric patients Second few tertiaryshylevel pediatric cases were included in the data bases used to develop DRGs (Fetter et al 1977 1980 1982) or to construct payment weights for low-volume DRGs (Langenbrunner et al 1989) Because of this the higher costs of treating patients In these facilities may not have been adeshyquately reflected in the DRG case-mix system or the PPS payment weights Therefore the DRG payment weights used In the PPS may financially penalize hospitals treating large numbers of pedishyatric patients (National Association of Childrens Hospitals and Related Institushytions 1984 Long Dreaschlin and Fisher 1986 Payne and Restuccia 1987)
HEALTH CARE FINANCING REVIEWWinter 1993Vohmlamp1~Numtgter2 51
The complete PM-DRG system conshysists of the pediatric categories develshyoped by NACH Rl and the original DRG categories for non-pediatric patients Conceptuallylt offers several advantages over DRGs PM-DRGs subdivide various DRG categories and utilize several new classification variables most notably venshytilation time Neonatal discharges are classified together instead of being disshypersed into non-neonatal categories as occurs with DRGs PM-DRGs are potenshytially more sensitive to differences in birth weight using five birth weight categories instead of the three categories used In DRGs
PM-DRGs raise potential Implementashytion issues however The PM-DRG sysshytem has 600 categories for patients of all ages 26 percent more categories than the DRGs contemporaneous Version 50 The increased number of categories could afshyfect the manageability of the system (Hornbrook 1982a 1982b) and the stabilshyity of payment weights The introduction of new classification variables in the PMshyDRG system could increase data collecshytion costs In addition the proposed use of ventilation time has raised concern among policymakers that at the margin It might provide an economic incentive to hospitals to Increase ventilation time or record more ventilation services than were received
There are three key components to PPSs the case-mix system used to classhysify discharges the method of detenminshying a hospitals base or unadjusted payshyment and adjustments to the base payment The first two components use patient-level and discharge-level infonmashytlon while the third component uses hospital-level information Payment adshyjustments are made partially to account
for factors influencing costs that are not directly related to patient-care practice patterns (eg indirect teaching expenses and area wage differentials) and partially to compensate for insensitivity in the case-mix system to patient-level differshyences in severity of Illness
Case-mix systems which more preshycisely group discharges based on patientshylevel characteristics offer several advanshytages over less precise systems Under prospective payment more precise caseshymix classification reduces the need to use hospital-level adjustments to capture patient-level differences in severity of illshyness and to create exceptions to the payshyment system such as the exclusion of childrens hospitals from the PPS By enshyabling tertiary referral hospitals to classhysify high-risk high-cost patients more acshycurately instead of averaging their costs with other discharges such systems reshyduce the chance that referral hospitals will experience certain DRGs as financial losers (Schwartz et al 1989)1n competshyitive markets more accurate case-mix classification allows referral hospitals to describe their charges per DRG more preshycisely This is advantageous for hospitals which compete for blocks of patients through efficiency-based contracts for payers which need to identify the most efficient providers and for States Intershyested In monitoring health care expendishytures
Prospective payment for childrens hospitalization is primarily a State-level issue Case-mix adjusted PPSs similar to
2Whlle the Medicare population does include children primarshyily eligible under the Medicare end stage renal disease (ESRD) program the number of pediatric Medicare eligibles is quite small (approximately 3500 persons) and the expenditures atshytributed to them are only about 04 percent of the Medicare budget (RAND Corporation tabulations using HCFA unpubshylished data for calendar year 1984)
HEALTH CARE FINANCING REVIEWWinter 1993Volume 15 Number2 52
the Medicare PPS have been adopted by 19 State Medicaid programs (Gurny Baugh and Reilly 1993 Kozma 1994)and many health maintenance organizations and Blue Cross plans as well as the Civilshyian Health and Medical Program of the Uniformed Services (CHAM PUS) In some States case-mix systems are used to monitor hospital utilization and expendishytures but not for reimbursement Five States (Massachusetts Maine New Jershysey New York and Washington) have adopted the All-Patient DRG (AP-DRG) system which incorporates PM-DRG modifications for use in reimbursement or monitoring However many States continue to use the Medicare DRG caseshymix classification system for prospective payment (Zimmerman and Paul 1989) Several have followed Medicares lead and have either excluded neonates or childrens hospitals from prospective payshyment or given them special treatment
we report here on the results of an evalshyuation of PM-DRGs that addressed the following classification and reimburseshyment issues bull How do the PM-DRG and DRG systems
compare in explaining variations in reshysource use at the discharge level
bull How much does the addition of meshychanical ventilation time improve the performance of PM-DRGs in explaining variations in resource use
bull Compared with DRGs does the larger number of categories in PM-DRGs lead to a higher proportion of categories with small numbers of discharges which could decrease the stability of the payment weights
bull How do DRGs and PM-DRGs compare in explaining variations in resource use at the hospital level
DEVELOPMENT AND STRUCTURE OF PM-DRGs
Data from three sources were used to develop and refine PM-DRGs (1) the Comshymission on Professional and Hospital Acshytivities (CPHA) on 750000 pediatric and adult hospitalizations (2) a random stratishyfled sample of discharges from 12 chilshydrens hospitals and (3) routinely colshylected discharge data from Connecticut and Maryland
PM-DRGs were formed by modifying several existing DRG categories based on clinical judgment and empirical analysis Fifty-one DRGs were split or regrouped and 52 other DRGs were redefined with a pediatric emphasis There are 600 categoshyries in the full PM-DRG system with ventishylation time and 587 categories in the PMshyDRG system without ventilation time compared with 475 categories in the DRGs contemporaneous Version 50
DRGs and PM-DRGs are similar 1n sevshyeral respects The goal of each is to group together discharges that are similar in clinical treatment and length of stay or charges The classification variables in each system include age principal di~gshynosis complications and comorb1d1t1es Ondicated by secondary diagnoses) opershyating room procedure gender and pashytient disposition (ie transferred died_or othel) A discharge is assigned to a maor diagnostic category (MDC) in the DRG system or to a pediatric-modified MDC (PM-MDC) in the PM-DRG system toreshyflect the organ system andor clinical speshycialty related to the principal diagnosis The discharge is then classified into one of several hundred mutually exclusive DRG or PM-DRG categories
PM-DRGs differ from DRGs in three ways several new classification variables
HEALTH CARE FINANCING REVIEWWinter1993volume15Number2 53
Table 1 Overview of the Diagnosis-Related Groups (DRGs) and Pediatric-Modified DRGs (PMmiddotDRGs)
Classification Variables DRGs PMmiddotORGs
Adult and Pediatric Discharges Age Age Gender Gender Principal diagnosis Principal diagnosis
Procedures Procedures
Complications andor comorbidities1 (yesno)
Complications andor comorbidities1 (yesno)
Discharge status (Death) Discharge status (Death)
Neonatal Discharges Problems divided Into 3 levels Problems divided into 5 levels based on diagnosis major based on diagnosis multiple major problems other problems no problems major problem minor problem problem other problem no
problem
Discharge status (death transfer) Discharge status (early death early transfer)
Birth weight and gestation Birth weight based on weight categories based on ICDmiddot9-CM recorded in grams (5 levels) codes (3 levels)
Respiratory distress syndrome Respirator time (4 levels) (yesno)
Hospital of birth (yeslno)
Back referral (yeSno)
First Split Medical or surgical diagnosis Age (Neonate or not)
Number of Categories Total 475 600 or 5873
Neonates 379 46 or 333
Definitions Early Death lt 1 day of age Early Transfer lt 4 days of stay
Respirator Use Must be abstracted from the medical record or bitting file
ioeflned as a diagnosis ttlat a panel ol physicians deems would increase tile length of stay by at least 1 day lor75 percent or more of ttle pattenls 2seven neonatal DRGs plus any of the ottler pediatric ORGs depending on the principal diagnosis 3Firstmiddotllsted number refers to the PMmiddotDRG system Including ventilation time ttle second-listed number refers to ttlat system wlttlout tile split on venUiatlon time
NOTE IC0-9-CM Is International Classification of Disfltlses 9th Revision Clinical Modification
SOURCES (Hornbrook 1982b Llctltlg et al 1989)
are used age (neonate [Infants aged 28 days or less] versus non-neonate) reshyplaces principal diagnosis as the firstshyused classification variable and cystic fishybrosis discharges are classified into a sinshy
gle category regardless of the principal diagnosis (Table 1)3 There are 46 neonatal PM-DRGs when ventilation time is inshycluded as a classification variable and 33
3A Technical Note atthe end of this article summarizes the key differences between DRGs and PM-DRGs
HEALTH CARE FINANCING REVIEWWinter 1993Volume 15 Number2 54
when it is not In contrast In the DRG system neonatal discharges are grouped either Into seven neonatal-specific cateshygories or up to 372 other categories deshypending on the principal diagnosis for a total of 379 categories
EMPIRICAL ANALYSIS
Data Sources
When the study began 16 States colshylected and made available computerized hospital discharge abstract data From those we selected Maryland New York and Connecticut because their data bases include birth weight In grams There was one childrens hospital in New York one in Connecticut and none in Maryland Because a second objective of this study was to explore options for payshying childrens hospitals (Payne and Schwartz 1991) we added Califomia and Illinois (with 6 and 2 childrens hospitals respectively) to increase the number of childrens hospitals included to 10
Data on all discharges from general medical and surgical and childrens acute care hospitals were obtained from Maryshyland California and Illinois for calendar year (CY) 1966 from Connecticut for fiscal year 1986 and from New York for CY 1987
We also utilized national-level data from the National Perinatal Information Center (NPIC) data base For a previous grant 50 hospitals had been randomly seshylected from the universe of urban US hospitals Referral hospitals offering high-risk perinatal care in neonatal intenshysive care units (NICUs) were matched on bed size and teaching intensity to hospishytals without NICUs Two childrens hospishytals were added to the original data base for a total of five childrens hospitals For
this study the sample hospitals which provided data only for neonatal patients were excluded leaving 26 hospitals with NICUsand 17without
One hospital was Included in both the State and the national data bases so the total number of childrens hospitals in this study was 14
Hospital discharge abstract data for 1985 were obtained from each participashyting hospital NPIC supplemented roushytinely available data by collecting inforshymation on birth weight and ventilation time from the hospitals Of the 43 hospishytals in the N PIC data base 35 offer ventilashytion services of those 20 provided data on ventilation time to NPIC
Hospital-specific information on the rashytio of interns and residents to beds area wage differentials and Medicaid disproshyportionate share status was obtained from the American Hospital Association (AHA) 1966 Annual Survey of Hospitals and the HCFA 1985 Medicare Provider Specific file for use In standardizing hosshypital charges
Variables Used
Age gender race ZIP Code hospital payer diagnoses procedures length of stay (LOS) and charges were available in each data base In addition birth weight in grams for infants born in-hospital (eg non-transfers) was available for Maryland Connecticut New York and the NPIC database
In the national data base we compared the DRG PM-DRG bull and PM-DRGV sysshytems (PM-DRGV refers here to the full PM-DRG system including ventilation time PM-DRGbull refers to the system withshyout ventilation time and PM-DRG is used when the distinction between the two ver-
HEALTH CARE FINANCING REVIEWWinter 19931Volume15Number2 55
slons Is not pertinent) Because the State data bases did not include ventilation time we could not group State disshycharges Into the PM-DRGV system In the three States with birth weight data (Conshynecticut Maryland and New York) DRGs were compared with PM-DRGs In the two States without birth weight data (Calishyfornia and Illinois) DRGs were compared with a hybrid PM-DRG system in which neonates were classified into DRGs and all other discharges were classified Into PM-DRGs
Data Preparation
We merged information by hospital from the discharge data bases the Medishycare Provider Specific file and the AHA data base Eight California hospitals in the discharge data base were excluded because they could not be Identified on the AHA file probably due to name changes or mergers The remaining hosshypitals were classified into four types chilshydrens defined as those excluded from the PPS as of 1987 or a physically sepashyrate childrens facility that is part of a hosshypital corporation major teaching having an interns-and-residents-to-bed (IRB) ratio of 025 or greater minor teaching having an IRB ratio greater than 0 but less than 025 and community having no interns or residents
Nationally 1 percent of hospitals are childrens hospitals (Table 2) The pershycentage of childrens hospitals in the States studied is also 1 percent (10956) in the national data base it is considerably higher due to oversampllng (543 or 12 percent)
Teaching hospitals were also oversarnshypled for the national data base As a reshysult 30 percent of the hospitals in the nashy
tlonal data base are involved in teaching activity compared with 23 percent nationshyally The national sample hospitals tend to have higher IRB ratios than those in the country as a whole and the proportion with NICUs and pediatric intensive care units (PICUs) is higher than the national average
Because the NPIC hospitals were seshylected using multistage stratified samshypling we weighted the observations by the sampling fractions of the hospitals in the analyses related to the dischargeshylevel explanatory power of the case-mix systems and the percent of discharges In low-volume categories (We did not weight the State data in these analyses because all discharges In all relevant hosmiddot pitals were used) In the hospital-level comparison of explanatory power the unit of observation was the hospital with each hospital in the State and NPIC data bases weighted by the number of disshycharges
We excluded discharges of patients 18 years of age or over normal newborns and obstetrics patients (teenaged mothshyers) from the analysis
In Connecticut 14 percent of the neoshynatal discharges had missing birth weight data and for an additional 13 percent data on neonatal diagnosis and birth weight were inconsistent Comparable figures for Maryland were 10 percent and 6 percent (In contrast In New York birth weight Information was missing for only 3 percent of the neonatal discharges) Neoshynates with missing birth weight data are classified by the software into PM-DRG 470 (ungroupable) Including discharges with missing birth weight data in our analshyysis would have resulted in a large proporshytion of the discharges being classified
HEALTH CARE FINANCING REVIEWWinter 19931volume15 Number2 56
Table 2 ~
il
m zz l
z
s m
ii-~ G
~
bull3
bullz3
~ N
Descriptive Information on US Hospitals State Data Bases and the National Hospital Sample
Hospital Characteristics
Total United States Connecticut Maryland
States
New York California Illinois
National Hospital Sample
Number (Penent of Hospitals)
Total Childrens1
Major Teachlng2
Minor Teaching3
7064
61
266
1330
(100)
(1)
(4)
(19)
33
1
2
17
(100)
(3)
(6)
(52)
49
0
4
16
(100)
(0)
(8)
(33)
237
1
38
71
(100) (0)
(16)
(30)
427
6
19
64
(100)
(1)
(4)
(15)
210
2
12
44
(100)
(1)
(6)
(21)
43
5
13
12
(100)
(12)
(30)
(28)
Community 5412 (76) 13 (39) 29 (59) 127 (54) 338 (79) 152 (72) 13 (30)
Average Number of Beds per Hospital (Percent of Beds)
Total
Childrens
174 163
(100)
(1)
280 (100)
(1)
273
-(100)
NA 264
313
(100)
(0) 166
155
(100)
(1)
211
166
(100)
(1) 472
212
(100)
(5)
Major Teaching
Minor Teaching
466 333
(10)
(38) 635 345
(14)
(64) 641
328
(19)
(39) 709
342
(38)
(35)
449
262
(12)
(24)
582
352
(16)
(35)
677
423
(43)
(25)
Community 120 (53) 155 (22) 191 (42) 143 (26) 132 (63) 142 (49) 413 (27)
Average Number of Pediatric Discharges per Hospital In the Study Data Set (Percent of Discharges from the Hospital Type) Total 5046 (100) 1140 (100) 1211 (100) 755 (100) 2011 (100) 772 (100) 3181 (100)
Childrens 5910 (1) 1803 (5) - NA 6318 (4) 2189 (10) 5983 (7) 10173 (37)
Major Teaching 17032 (13) 3070 (16) 3623 (24) 2209 (47) 2711 (20) 1936 (14) 3050 (29)
Minor Teaching 9638 (36) 1292 (58) 1396 (38) 738 (29) 1995 (22) 1099 (30) 1919 (17)
Community 3320 (50) 593 (21) 777 (38) 285 (20) 1971 (48) 518 (49) 1787 (17)
Average Ratio of FTE Interns and Residents to Beds
Total 03 09 07 09 04 04 15
Childrens 16 12 NA 36 16 16 18
Major Teaching 43 42 41 39 53 44 34
Minor Teaching 07 12 12 10 07 08 11
Community 00 00 00 00 00 00 00 See footnotes at end of table
~ ~
1 Table 2-Continued Descriptive Information on US Hospitals State Data Bases and the National Hospital Sample
Hospital Characteristics
Total United States
States National Hospital Sample Connecticut Maryland New York California Illinois
Percent of Hospitals wtth NICUs
Total 10 21 16 17 18 12 60 Childrens 64 0 NA 100 83 50 100 Major Teaching 58 50 100 63 82 75 75 Minor Teaching 22 35 21 18 32 24 64
Community 3 0 0 1 10 3 31
Percent of Hospitals with PICUs Total 5 12 9 8 8 9 36 Childrens 71 0 NA 100 83 50 100 Major Teaching 38 50 50 37 76 58 42 Minor Teaching 9 16 7 6 12 19 36 Community 1 0 4 0 1 1 8
Percent of Patient Days Attributed to Medicaid Patients Hospltalwlde
Total 15 8 10 16 15 13 17Childrens 29 26 NA 36 47 25 31 Major Teaching 20 10 22 28 28 24 24Minor Teaching 19 8 10 15 14 12 10 Community 13 7 9 14 14 12 11
1
~ ~ m l li ~ ~
f-middot fN
1Defined as hospitals that were excluded from the Medicare prospective payment system as childrens hospitals in 1987or physically separate childrens facilities that are part of a hosshy~ltal corporationDefined as general acute-care hospitals with a ratio of Interns and residents to beds of gt 025
3oeflned as general acute-care hospitals with a ratio of interns and residents to beds of between oo and 025 bulloefined as geoeral acute-care hospitals with a ratio of Interns aod resldeots to beds of 00
NOTES NA Is not applicable FTE Is fullmiddot time equivalent NICU is neonatal inteosive care uoit PICU is pediatric ioteoslve care uolt
SOURCES Payoe SMC Boston University School of Medicine and Schwartz AM National Perinatal Information Center 1993 American Hospital Association 1987-88
shy
into PM-DRG 470 distorting our assessshyment of the potential performance of the new system especially in Maryland and Connecticut We therefore deleted from study the neonatal discharges that lacked birth weight data
The deleted discharges most likely had higher charges and longer stays than the average non-neonatal dischargebull so the deletions were probably not random and most likely reduced the variability left to be explained In the Connecticut data base
Charges in the State data bases for 1986 (eg all States except New York) were inflated to 1987 levels using a hospital-industry-specific factor obtained from the AHA(1987-88)
The total charge for each discharge was standardized to adjust for factors not directly related to patient care practice patterns such as indirect medical educashytion costs and area wage differentials PPS definitions and policies for standardshyizing charges in effect in 1986 and 1987 were Identified and followed with minor exceptions (Federal Register 1983 1987 May 27 1986 and September 1 1986) We used standardized charges to compare charges across hospitals calculate stanmiddot dardized base payments and calculate case-mix Indexes (described later)bull
METHODS
Data from the State and NPIC samples were always analyzed separately Each
4As evidenced by the relative charge weights for many of the nonflormal neonatal DRGs (data available upon request from the authors) 5tn the national data base charges were also converted using cost-to-charge ratios In order to estimate costs (Cotterill Bomiddot bula and Connerton 1986) Results using ratio of costs to charges (RCC)-adjusted charges were the same as those using LOS and charges and so are not presented here
analysis was conducted separately for each State with one exception In the hospital-level regression we merged data from Connecticut Maryland and New York to increase the number of hospitals analyzed
We conducted the analyses under two conditions (1) excluding statistical outlishyers (defined as discharges with charges above or below 30 standard deviations of the geometric mean charge for each DRG [Federal Register 1985D and (2) including statistical outliers (ie using all disshycharges) The PM-DRG system was deshysigned to classify outliers more sensishytively so deleting them from the analysis removes the cases that PM-DRGs are exshypected to explain especially well In order to demonstrate the power of the PM-DRG system to explain resource use for all cases we present here the results Includshying statistical outliers
Explanatory Power Discharge-Level Analysis
Ordinary least squares regression (the General Linear Models Procedure In Stashytistical Analysis System [SASD was used to assess the explanatory power of the case-mix systems as measured by the Rshysquare One regression was run for each dependent variable LOS the natural log value of LOS (LN LOS) total charge (TOTCH) standardized charge (STCH) and the log value of the standardized charge (LNSTCH) The independent varishyables were the DRG the PM-DRG bull and the PM-DRGV (national data set only) The national data were weighted as previously described Adjusted R-squares were calshyculated to account for any increase in exshyplanatory power due to the larger number of categories in PM-DRGs and PMshy
HEALTH CARE FINANCING REVIEWWinter 1993Jvolume15NumbampT2
59
DRGVs compared with DRGs (Feldman 1992 Johnson and Wichern 1982)
We calculated the relative or percent difference in adjusted R-squares between the PM-DRG bull system and the DRG sysshytem as follows
(R-square using PM-DRGsbull) shy(R-square using DRGs)
R-square using DRGs
Contribution of Ventilation Time
In this analysis we used a subset of the NPIC data base the 28 hospitals which eishyther (1) provided ventilation services and provided ventilation time data to NPIC or (2) did not provide such services The weighting and the analysis were similar to the discharge-level analysis previously described
Low-Volume Categories
For each State and for the national data base we calculated the number and pershycent of discharges in each DRG and in each PM-DRGbull We then calculated (1) the proportion of low-volume categories (ie those with small numbers of disshycharges) in each case-mix system and (2) the percentage of discharges in those categories We used 3 definitions of low volume (1) 100 discharges or fewer (2) 50 discharges or fewer the minimum numshyber used by HCFA to set payment weights using standard methods and (3) 30 disshycharges or fewer the minimum number we felt could be used to establish stable payment weights because assumptions about normality become more problemshyatic when the number of cases is much less than 30 In this analysis the national data were weighted as previously deshyscribed
Explanatory Power Hospital-Level Analysis
We compared the performance of the systems in explaining variations in the average wage-adjusted charge per hospishytal measured by R-squares The indepenshydent variables were the natural log of the case-mix index (CMI) under each system for each hospital (abbreviated as In CMIPMDRGbull and In CMIDRG)
The CMI is a discharge-weighted meashysure of the relative costliness of the pashytients treated in a hospital We calculated the case-mix index for each hospital as follows First for each data base we calshyculated the average standardized charge for each DRG by dividing the total standshyardized charges for the DRG by the numshyber of discharges in that DRG The relashytive charge weight (RCW) for each DRG (designated by DRGi) was then computed as follows
RCW for DRGI = Average standardized chargeforDRGi Average standardized charge forall DRGs
The process was then repeated using PMshyDRGsbull and PM-DRGVs (national data base only)
The case-mix index for each hospital was calculated by (1) assigning the calcushylated RCW to each discharge based on the DRG into which the discharge was classified (2) summing the relative charge weights for all discharges treated in the hospital and (3) dividing by the number of discharges treated in the hosshypital As per HCFA procedures disshycharges classified as statistical outliers were excluded in calculating relative cost
HEALTH CARE FINANCING REVIEWWinter 1993volume 1~ Number2 60
weights to avoid distortion of the weights by extreme values they were included In calculating the hospitals case-mix Index For each hospital we calculated separate case-mix indexes using DRGs and PMmiddot DRGsbull
Ordinary least squares regression was used Two separate analyses were conmiddot dueled the first using pooled data from the three States (Connecticut Maryland and New York) that include birth weight and the second using the national data base In each analysis the unit of obsershyvation was the hospital weighted by the numberof discharges from each hospital There were 319 hospitals in the State data base and 431n the NPICdatabase
FINDINGS
Explanatory Power Discharge-Level Analysis
The amount of variability explained usshying DRGs was relatively low across the data bases (Table 3) For example for LOS the highest Rmiddotsquare was 3125 and for standardized charges (STCH) the highest R-square was 2700 (both in Connecticut)
Marked improvements in the R-square values using PM-DRGsbull were apparent for each data set The greatest improveshyments occurred in Maryland and the NPIC data sets where the R-squares for LOS inmiddot creased by 62 percent and 70 percent reshyspectively when PM-DRGsbull were used Improvements were even higher for STCH (75 percent in Maryland and 98 percent in the NPIC data set) Improvements in New York were somewhat lower but still appreshyciable (46 percent for LOS and 41 percent for STCH) Improvements in Connecticut (25 percent for LOS and 49 percent for STCH) were lower than in Maryland and
the NPIC data base This may be due to the problems previously discussed with birth weight data in Connecticut As noted previously the deleted discharges most likely had higher average charges than non-neonatal discharges so delemiddot ling them reduced the variability left to be explained by the PM-DRGbull system In California and Illinois the improvements were much smaller probably because DRGs were used for newborns due to lack of birth weight data
The improvement from using PM-DRGsbull was not as dramatic for log-transformed as for untransforrned variables This was expected because log transformation reshyduces the impact of extreme values In the PMmiddotDRGbull system extremely long LOSs or high charges are handled by the grouper specifically and as a result there is much less impact from using a log transformed value
Contribution of Ventilation Time
In the 28 hospitals from the NPIC data set for which we had information on memiddot chanica ventilation time only 8 percent of the discharges studied (806697604) were in PM-DRGs involving ventilation time Of those only 1 percent (999) of the discharges were classified into a differmiddot ent category when the full PM-DRGV sysshytem (ie with ventilation time) was used instead of PM-DRGsbull Discharges involvmiddot lng mechanical ventilation had signifimiddot cantly longer average LOS and cost (plt0001) than discharges not involving ventilation However adding ventilation time as a classification variable to PM-DRGs resulted in only marginal immiddot provements in R-squares across all the discharges from 3602 to 3738 for LOS (a 4-percent increase) and from 3170 to
HEALTH CARE FINANCING REVIEWIWinter 19931volurne15Number2 61
~ Table 3 Comparison of Diagnosis-Related Groups (DRGs) and PediatricmiddotModified DRGs (PMmiddotDRGs) in Explaining Variations In
Discharge-Level Length of Stay (LOS) and Charges State and National Data
LOS and Charges Connecticut
States National Data Maryland New York California Illinois
Number of Discharges 37891 59901 179997 335706 163125 136780
LOS Adjusted R-square
DRG 3125 2861 2432 1886 2426 2162 PM-DRGbull 3894 4amp43 3545 2008 2585 3682 Percent Difference2 25 62 46 6 7 70
Standardized Charge DRG 2700 2411 2600 1379 1830 1793 PM-ORGbull 4035 4226 3672 1579 2079 3553 Percent Difference 49 75 41 15 14 98
Log of LOS
DRG 4385 4606 3691 3516 3447 4235 PMmiddotDRG 4807 5173 4283 3681 3615 4955 Percent Difference 10 12 16 5 5 17
Log of Standardized Charge DRG 4084 4738 3000 3212 3254 4041 PM-ORG 4550 5394 3778 3385 3426 4836 Percent Difference 11 14 23 5 5 20
~ ~
~ m ~ ~ z
11-j z l
Not Including ventilation time 1The weighted data set was used Discharges from 43 hospitals were Included 2Percent difference calculated asUR-square using PM-DRGs] - [R-square using DRGs))J(R-square using DRGs)
SOURCE Payne SMC Boston University School of Medicine and Schwartz AM National Perinatal Information Center 1993
3505 for STCH (an 11-percent Increase) (fable 4) As before when the log values were used PM-DRGs did not offer as great an improvement in R-squares as when untransformed values were used
Low-Volume Categories
The percent of discharges in lowshyvolume categories changed very little when PM-DRGs were used (fable 5) In the State databases using PM-DRGsbull inshystead of DRGs would result in an increase of 4 percentage points or less in the promiddot portion of discharges In low-volume cateshygories In some data bases depending on
Table 4 Comparison of DRGs PMmiddotDRGsbull and PMmiddotDRGVs in Explaining Variatioris In Discharge-Level Length of Stay fLOS)
and Charges National Data Adjusted Percent
Length of Stay and Charges RSquare Difference
LOS In Days DRG 2310 PMmiddotDRG 3602 56 PM-OAGV 3738 4
Standardized Charge DRG 1822 PMmiddotDRG PMmiddotDRGV
3170
3505 74
RCCAdjusted Charge DRG 1938 PM-DRG 3266 68 PM-DRGV 3564 9
Natural Log Value of LOS DRG 4391 PM-DRG PM-ORGY
5028
5055 15 f)
1The weighted dataset was used Hospitals that provided ventishylation seJVIces but did not submit ventilation time data were exshyeluded There were 97604dlseharges from 28 hospitals 2The percentage difference in explanatory power Indicated by the R-square of PM-ORGscompared with ORGs 3-rhe percentage difference In explanalol power Indicated by the Rmiddotsquare of PM-ORGVs compared with PM-ORGs 4LeSs thao 1 percent
NOTES ORG Is diagnosis-related group PM-DRG is pediatric modified diagnosis-related group PM-DRG does not Include ventilation time PM-DRGV does include ventilation time RCC is ratio of costs to charges
SOURCE Payne SMC Boston University School of Medicine and Schwartz RM National Perinatal Information Center 1993
the definition of low volume PM-DRGs actually reduced the percent of low-volshyume categories
Neonates were grouped into 45 PMshyDRGVs (national data) and 30 to 32 PMshyDRGsbull (State and NPIC data) (fable 6) In contrast DRGs dispersed neonates over a much larger number of categories (a mean of 67 categories in the study data bases with a range of 24 to 147)
Explanatory Power Hospital-Level Analysis
R-squares Increased from 5028 using DRGs to 5936 using PM-DRGsbull in the State data bases Comparable figures for the NPIC data base were 5552 and 7395 Thus use of PMmiddotDRGs Increased the Ashysquares by 18 percent and 33 percent in the State and NPIC data bases respecshytively
The performance of PM-DRGsbull in the NPIC data vis a vis the State data Is probamiddot bly influenced by the analytical method used As previously discussed the unit of observation in this analysis is the hospimiddot tal not weighted by the sampling fracshytion teaching hospitals and hospitals with NICUs were over-sampled for the NPIC data base To the extent that such hospitals had more non-normal neonatal discharges than other hospitals and that PM-DRGsbull classify such discharges more accurately than DRGs the relative performance of PM-DRGsbull will be greater in the national data base than in the States
DISCUSSION
Summary
We used discharge data for pediatric patients from 5 States and a national sam-
HEALTH CARE FINANCING REVIEWWinter 19931Volu15Numberz 63
Table 5 Percent of low-Volume Categories (With Small Number of Discharges) and Percent of Discharges in Low-Volume
Categories Connecticut Maryland New York and National Data
Location Number of Discharges Number of Categories
Percent of Low-Volume Categories
Percent of Discharges in Low-Volume Categories
lt30 lt50 lt100 lt30 lt50 lt100
Connecticut n 37891
DRG 322 59 68 78 5 8 14 PM-ORG 387 60 69 81 6 10 18
Maryland
n 59901
DRG 351 56 68 78 4 6 10 PM-ORG 419 55 66 79 4 7 13
New York
n 179997
DRG 359 33 44 57 1 2 4 PM-DRG 437 32 41 57 1 2 5
Natlonal1
n 136780
DRG 371 31 43 57 1 2 4PM-ORG 429 27 39 53 1 2 5PM-ORGV 442 28 39 54 1 2 5
~ ~ m
I
z
i~
f ~
ibull
1The weighted dataset was used
NOTES DRG Is diagnosis-related group PM-DRG Is pediatric-modified DRG PM-ORG does not Include ventilation time PM-DRGV does include ventilation time
SOURCEPayne SMC Boston University School of Medicine and Schwartz RM National Perlnatallnfonnation Center 1993
Table 6 Number of Total Categories Pediatric Categories and Neonatal Categories Into Which
Discharges Were Classified Connecticut Maryland New York and National Data
case-Mix System
ORGs
All categories
475
Minimum
322
Pediatric Categories1
Maximum
370
Mean
350
Minimum
24
Neonatal Categories2
Maximum
147
Meon
67 PM-DRGsbull 587 387 437 429 30 32 31 PM-DRGVs 600 442 45 1categorles that are specific to children (eg age lt29days or ageo-17 years) or for which no age is specified 2categorles for patients aged 0-28 days
NOTES DRG Is diagnosis-related group PM-DRG Is pediatric-modified DRG PM-DRG does not include ventilation time PM-DRGV does Include ventilation time
SOURCE Payne SM C Boston University School of Medicine and Schwartz RM National Perinatal information Center 1993
pie of 43 hospitals to compare the performiddot mance of PMmiddotDRGs and DRGs We found that in data bases with birth weight inforshymation PMmiddotDRGs without ventilation time (PM-DRGsbull) explained 25 percent to 70 percent more of the discharge-level variation In LOS than DRGs and 41 pershycent to 98 percent more of the variation in standardized charges Ventilation time inmiddot creased the observed R-squares for avershyage LOS and charges by 4 percent and 11 percent respectively in a subanalysis of 28 hospitals At the hospital level we found that the case-mix Index calculated using PM-DRGsbull explained 18 percent to 33 percent more of the variation in avershyage wage-adjusted charge than the index using DRGs a less dramatic improveshyment than we observed at the discharge level Contrary to expectations neonatal discharges were classified into fewer PMmiddot DRGsbull than DRGs and the larger number of PM-DRG bull categories did not Increase the proportion of discharges in low-volmiddot ume categories
The R-squares we observed are somemiddot what higher than those in an earlier NAmiddot CH Rl comparison of DRGs and PM-DRGs (then called Childrens DRGs [CDRGsD aimiddot though the relative differences between the two systems observed by NACHRI
are comparable to our results NACHRI calculated R-squares for both systems using data from 84000 pediatric dismiddot charges in 12 childrens hospitals (Nashytional Association of Childrens Hospitals and Related Institutions 1986) R-squares for LOS were 19 and 24 using DRGs and CDRGs respectively a 26-percent differshyence for charges they were 16 and 22 a 38-percent difference (based on unmiddot trimmed data ie including outliers)
The fact that PM-DRGs bull performed substantially better than DRGs in the study data bases with birth weight data compared with those without such data (California and Illinois) suggests that much of the improvement in explanatory power of PMmiddotDRGsbull we observed is due to the reclassification of neonatal dismiddot charges Two other studies of neonatal discharges support this conclusion In the 1986 NACHRI study of neonatal pamiddot tients CDRGs resulted In a 75-percent inmiddot crease in R-square for LOS (from 16to 28) and a 150-percent increase for charges A study done by one of the aumiddot thors (Schwartz 1991) which examined non-nonnal newborn discharges from termiddot tlary perinatal facilities and non-tertiary facilities (those without a neonatal intenshysive care unit) showed that PMmiddotDRGsbull inmiddot creased explanatory power substantially
HEALTH CARE FINANCING REVIEWWinter 1993VolumetSNumber2 65
For example using LOS as the measure the model R-square increased from 25 to 50 (100 percent) In tertiary facilities and from 10 to 45 (350 percent) in the non-tertiary facilities
Limitations of the Study
Several caveats are in order First the States were not selected randomly which may limit the generalizability of the findmiddot ings Due to the availability of birth weight data Connecticut and Maryland were used both to develop PM-DRGs and in this evaluation Second we did not have data on actual hospital costs and lacked RCC-adjusted charges for the State data bases so we could not estimate the imshypact of PMmiddotDRGs on costs There Is evimiddot dence however that RCC-adjusted costs are highly correlated with charges (Cottemiddot rill Bobula and Connerton 1986) almiddot though recent charge data may not be as highly correlated with costs (Price 1969) The correlation between unadjusted and RCC-adjusted charges in the 12 childrens hospitals in the NACH Rl classification system project was 985 (National Associshyation of Childrens Hospitals and Related Institutions 1986) Third Maryland and New York had all-payer hospital reimshybursement systems in place during the study years The direction and magnitude of any bias thus introduced is not clear however and these two States are not consistently similar to each other nor disshytinct from the others in terms of findings related to charges Fourth the facilityshyspeclfic data obtained from the AHA is not corroborated or audited and the inforshymation on the IRB ratio may be inaccushyrate We have assumed that any errors in the IRB ratio are random Finally as menmiddot tioned previously discharges with missshy
ing birth weight were excluded In Conshynecticut and Maryland the quality of birth weight data was a substantial problem If birth weight data had been more comshyplete and consistent in those States the performance of the PMmiddotDRG bull system would probably have been better than obshyserved because PM-DRGs were develshyoped to classify more accurately highmiddot cost discharges
It is important to note here that by studying only pediatric patients and exshycluding normal newborns the impact of PM-DRGs was exaggerated especially for hospitals that treat adult as well as peshydiatric patients Pediatric patients includshying normal newborns constitute only 19 percent of the general acute-care caseshyload (National Center for Health Statisshytics 1992) Normal newborns are a large proportion of pediatric discharges (35 pershycent of the discharges of all patients 14 years of age or under in 1987) They are relatively homogeneous by definition and are treated similarly in the two case-mix systems The difference in performance between the two systems will be less for hospitals treating a large proportion of adults andor normal newborns than obmiddot served In our study data bases
Implementation Issues
The differences between the PM-DRG and DRG systems have several ramificashytions Because of the classification of all neonatal discharges Into a single neonamiddot tal PM-MDC the creation of additional neonatal-specific PM-DRGs and the use of five instead of three birth weight cateshygories PM-DRGs can more accurately demiddot scribe resource use among high-risk high-cost newborns This would be exshypected to increase the accuracy of the re-
HEALTH CARE FINANCING REVIEWWinter 1993volume 15 Numtgter2 66
lmbursement for those non-normal newshyborn stays with higher than average charges that do not qualify as cost or LOS outliers and for neonatal discharges classhysified as outliers for which the outlier payshyment is insufficient to cover actual costs
Depending on the purpose different components of the new system could be adopted Payers could adopt only the neoshynatal PM-DRGs bull as the CHAM PUS proshygram did This would maximize sensitivity to resource use but avoid increasing the number of categories in the system and any potential incentive to increase the use of or reporting of ventilation time Hospitals researchers and evaluators could use all the PM-DRGbull or PM-DRGV categories for managing services or anashylyzing case mix
Two modifications of DRGs are availshyable that incorporate selected PM-DRG categories AP-DRGs incorporate all the PM-DRG neonatal categories and some of the non-neonatal categories Birth weight is defined using either Internashytional Classification of Diseases 9th Reshyvision Clinical Modification (ICD-9-CM) codes or birth weight in grams Use of mechanical ventilation is included as a classification variable but there Is no difshyferentiation by length of ventilation AllshyPatient-Refined DRGs (APR-DRGs) inshyclude a more detailed severity measure than is used for DRGs or AP-DRGs All the PM-DRG categories are incorporated and the PM-DRG categories for mechanishycal ventilation are used (including the length of ventilation) Both the AP-DRG and APR-DRG systems group neonates into a single MDC based on age
Birth weight is an extremely powerful predictor of neonatal charges and LOS However birth weight in grams is not in-
eluded in most routinely collected hospishytal discharge data sets at this timebull Our findings and those of Brunskill (1990) sugshygest that hospitals have not consistently or completely entered birth weight Inforshymation on discharge abstracts This sugshygests that case-mix based reimburseshyment is best Introduced with advance notice to allow the hospitals to Improve their data collection and recording efshyforts so that high-risk neonatal cases can be classified appropriately in calculating relative payment weights and determinshying reimbursement and birth weight for transferred patients can be captured
The relatively small marginal improveshyment resulting from adding ventilation time to the classification system in conshyjunction with the additional data collecshytion required and payer resistance to the use of procedures as a reimbursement variable argue against adding ventilation time to the classification system for reimshybursement although It may be useful for research and internal management
Case-mix systems such as DRGs and PM-DRGs first gained prominence in the health policy arena because of their use in PPSs Refinements In case-mix classifishycation will continue to be important in prospective reimbursement In the future case-mix systems that describe utilizashytion and costs with greater precision will also play an important role in managed care settings and markets in which prices are established competitively The Imshyproved performance of the PM-DRG sysshytem in explaining resource use suggests that it is preferable to DRGs for use by
6Recent refinement of the ICD-9-CM codes for prematurity and low birth weight which have many more weight categories have been Introduced but the accuracy and completeness with which they are used has not been evaluated
HEALTH CARE FINANCING REVIEWIWinter1993volume15Number2 67
both payers and hospitals In describing monitoring and reimbursing pediatric hospitalization
ACKNOWLEDGMENTS
We wish to thank Patricia Willis Jack Langenbrunner Mark Wynn and John Peshytrie from HCFA Wilhelmine Miller and Nancy De Lew from ASPE and Arlene Ash Kim Dukes David Gagnon Lisa lezshyzonl Mark Moskowitz Joseph Restuccia Diane Schaumburg Michael Schwartz and the anonymous reviewers for their asshysistance
We are grateful to the following institushytions for providing us with data used in this research the Newington Childrens Hospital the Connecticut Hospital Assoshyciation the Illinois Cost Containment Council the Health Services Cost Review Commission of Maryland the Statewide Planning and Research Cooperative Sysshytem of New York and the California Health Facilities Commission
TECHNICAL NOTE
Summary of Key Differences Between DRGs and PM-DRGs7
New Classification Variables
PM-DRGs incorporate several classifishycation variables not used In DRGs age at death age at transfer hospital of birth back referral or down transfer (ie transshyfers from tertiary to non-tertiary hospishytals) and duration of mechanical ventilashytion Birth weight which is strongly related to neonatal costs and LOS (McshyCarthy et al 1979 Phibbs Williams and Phibbs 1981 Boyle et al 1983 Schwanz
1fhls section draws heavily on Lichtig et al 1989
1989 National Center for Health Statisshytics 1992) Is handled differently in the two systems DRGs use ICD-9-CM diagshynostic codes to create three birth weight categories and PM-DRGs use birth weight recorded In grams to make five weight categories
Age the Pre-Eminent Classification Variable
In the DRG system discharges are first classified into an MDC based on the prinshycipal diagnosis and then into a DRG based on the principal diagnosis operatshying room procedure complications and comorbldlties age and disposition A neonatal discharge Is assigned to 1 of the 7 DRGs comprising MDC 15 (Normal Newborns and Other Neonates with Conshyditions Originating in the Perinatal Period) if the principal diagnosis is specific to neshyonates However it will be assigned to any one of a number of other MDCs if the principal diagnosis Is condition- or procedure-specific In contrast in the PMshyDRG system age Is the first classification variable applied All discharges of neoshynates (patients 28 days or of age or younger at admission) are classified into the single neonatal PM-MDC Other disshycharges are then assigned to one of the remaining non-neonatal PM-MDCs For example an infant with a principal diagshynosis related to a cardiac problem will be assigned to MDC 5 Disease and Disorshyders of the Circulatory System and an inshyfant with a principal diagnosis specific to newborns such as perinatal jaundice will be assigned to MDC 15 In the PM-DRG system the discharges previously deshyscribed would both be assigned to PM-MDC 15 Newborns and Neonates based on their age
HEALTH CARE FINANCING REVIEWIWinter 1993ivolume15 Number2
Cystic Fibrosis Discharges Grouped Together
Discharges of children with cystic fimiddot brosls are assigned to any one of a numshyber of DRGs based on their principal diagshynosis which may or may not relate to cystic fibrosis In the PM-DRG system discharges with any diagnosis (principal or subordinate) of cystic fibrosis are grouped together into PM-DRG 2981 Cystic fibrosis as any diagnosis age lt 18
REFERENCES
American Hospital Association Annual Survey of Hospitals UnpublishedChicago 1986 American Hospital Association AHA Hospital Marketbasket Economic Trends Chicago Spring 1987middot811 Boyle M Torrance G Sinclair J et al Ecoshynomic Evaluation of Neonatal Intensive Care of Very-Low-Birth Weight Infants New England Jourmiddot nalo1Medlcine3081330-13371983 Brunskill AJ Some Sources of Error in the Codmiddot ing of Birth Weight American Journal of Public Health 80(1) 72middot73 January 1990
Cotterill P Bobula J and Connerton R Comshyparison of Alternative Relative Weights for Diagnosis-Related Groups Health Gare Financing Revlew7(3)37-51 Sp~ng 1986
Federal Register Medicare Program Changes to the Inpatient Hospital Prospective Payment Sysshytem and Fiscal Year 1986 Rates Final Rule Office of the Federal Register National Archives and Records Administration Washington US Govshyernment Printing Office September 3 1985 Pp35046 (September 1 1983 September 1987 Pp 065 May 27 1988 Pp19513 September 1 1988 Pp33047) Feldman A Commentary Are We Splitting Hairs Over Splitting DRGs Health Services Research 27(5)612-617 December 1992 Fetter AB Mills RE Reidel DC and Thompshyson JD The Application of Diagnostic-Specific Cost Profiles to Cost and Reimbursement Control In Hospitals Journal of Medical System 1(2)137shy149 1977
Fetter AB Shin Y Freeman JL et al CaseshyMix Definition by Diagnosis-Related Groups MedshyIcal Csre Supplement 18(2)1-53 February 1980
Fetter AB Thompson JD Averill A and Freeshyman A The New ICD-9-CM Diagnosis-Related Groups Classification Scheme Final Report New Haven CT Yale University School of Organization and Management Health Systems Management Group 1982 Gumy P Baugh OK and Reilly TW Payment Administration and Financing of the Medicaid Program Health Care Financing Review 1992 Anshynual Supplement Medicare and Medicaid Statistimiddot cal Supplement Pp 285-302 October 1993
Health Care Financing Administration Data From the 1985 Medicare Provider File Bureau of Data Management and Strategy Baltimore MD 1985
Hornbrook MC Hospital Case Mix Its Definishytion Measurement and Use The Conceptual Framework (Part 1) Medical Care Review 39(1) 1shy4219828
Hornbrook MC Hospital Case Mix Its Defini shytion Measurement and Use Review of Alternashytive Measures (Part 2) Medical Care Review 39(2) 73-123 1982b Johnson AA and Wichern DW Applied Multishyvariate Statistical Analysis New Jersey Prentice Hai11982
Kozma 0 Personal Communication 3M Health Information Systems 1994
Langenbrunner J Willis P Jencks S et al Deshyveloping Payment Refinements and Reforms Unshyder Medicare for Excluded Hospitals Health Care Financing Review 10(3) 91-107 Spring 1989
Uchtig LK Knauf AA Parrott R and Muldoon J Refining DRGs The Example of Childrens Diagnosis-Related Groups Medical Care 27(5) 491-506 May 1989
Long MJ Dreaschlln JL and Fisher J Should Childrens Hospitals Have Special Consideration in Reimbursement Policy Health Care Financing Review8(1) 55-64 Fall1986 McCarthy J Koops B Honeyfleld P et al Who Pays the Bill for Neonatal Intensive Care Journal of Pedlatrlcs95755-761 1979 National Association of Childrens Hospitals and Related Institutions Childrens Hospitals CaseshyMix Classification System Project Alexandria 1984
HEALTH CARE FINANCING REVIEWWinter 1993volume15Number2 69
National Association of Childrens Hospitals and Related Institutions Childrens Hospitals CaseshyMix Classification System Project Phase Ill Reshyport Alexandria September 1986
National Center for Health Statistics National Hospital Discharge Survey Annual Summary 1989 Vital and Health Statistics Series 13 No 109 DHEW Pub No (PHS) 92-1770 National Censhyter for Health Statistics Public Health Service Washington US Government Printing Office March 1992
Payne SMC and Restuccia JD Polley Issues Related to Prospective Payment for Pediatric Hosshypitalization Health Care Financing Review 9(1) 71middot 82 Fall1987
Payne SMC and Schwartz R Developing and Evaluating Options for Pediatric Prospective Payshyment Systems Final Report Cooperative Agreeshyment Number 17-C-99093102 Prepared for the Health Care Financing Administration Boston Boston University School of Medicine February 251991
Phibbs CS Williams RL and Phibbs RH Newborn Risk Factors and Costs of Neonatal Inmiddot tensive Care Pediatrics 6amp313-321 1981
Price Kurt F Pricing Medicares DiagnosisshyRelated Groups Changes Versus Estimated Costs Health Care Financing Review 11(1) 79-88 Fall1989
Rosenbaum S Prenatal Neglect Increases Matershynity Child Health Care Costs Business and Health 4(3)22-23 January 1987
Schwartz AM What Price Prematurity Family Planning Perspectives 21(4)171)174 JulyAugust 1989
Schwartz AM Explaining Resource Consumpshytion Among Non-Normal Neonates Health Care Financing Review 13(2)19-27 Winter 1991
Schwartz AM Gagnon D Murl J and Michelshyman T DRGs and Their Impact on Perinatal Reshyglonalizatlon Final Report Grant No MCJ440525shy03 to the National Perinatal Information Center Providence Rl Prepared tor the Maternal and Child Health Research Program Bureau of Matershynal and Child Health Rockville MD August 1989
Zimmerman DL and Paul J Current Developshyments in State Medicaid DRGs Washington Intershygovernmental Health Policy Project George Washington University May 1989
Reprint requests Susan MC Payne PhD Boston University School of Medicine Suite 600 720 Harrison Avenue Boston Massachussetts 021 18
HEALTH CARE FINANCING REVIEWIWinter 1993Volume 15 Number2 70
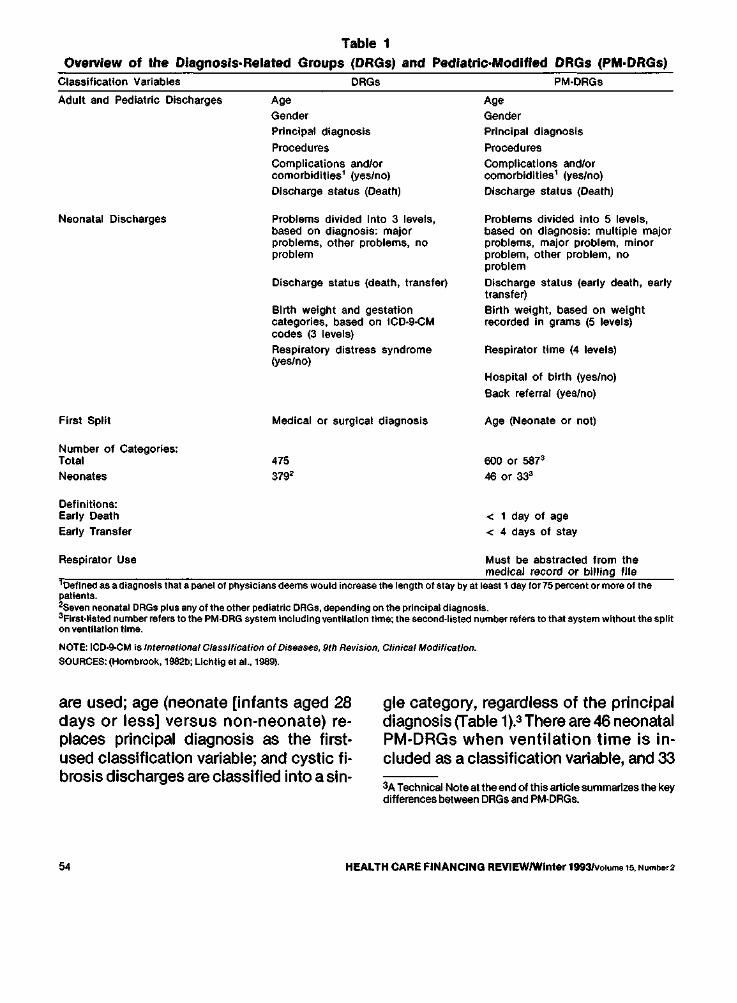
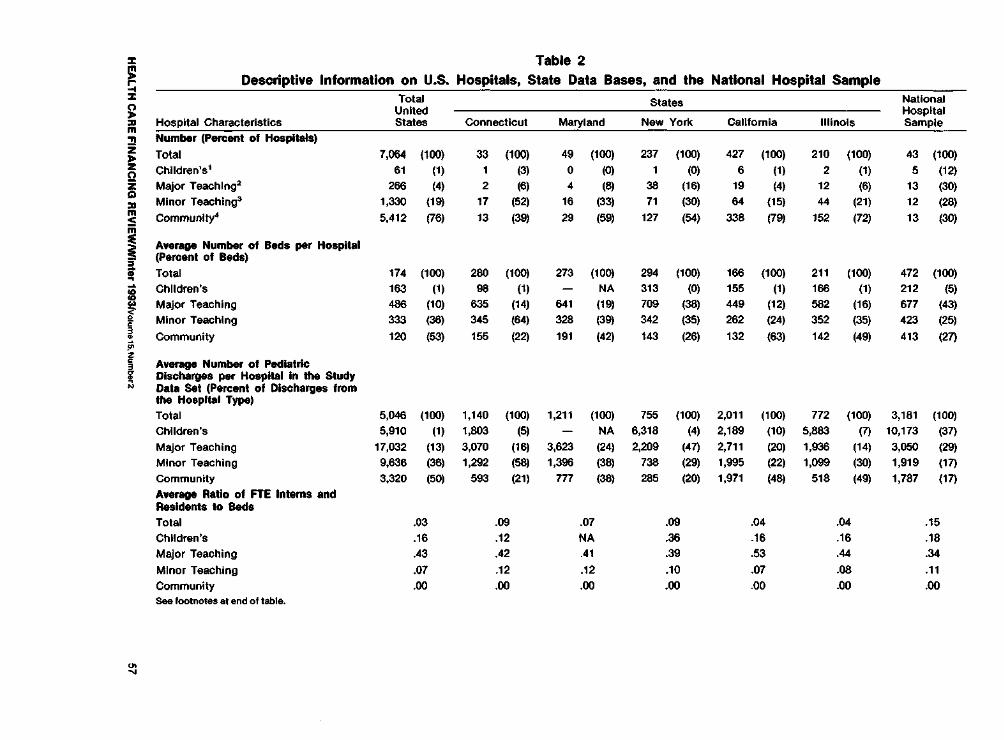
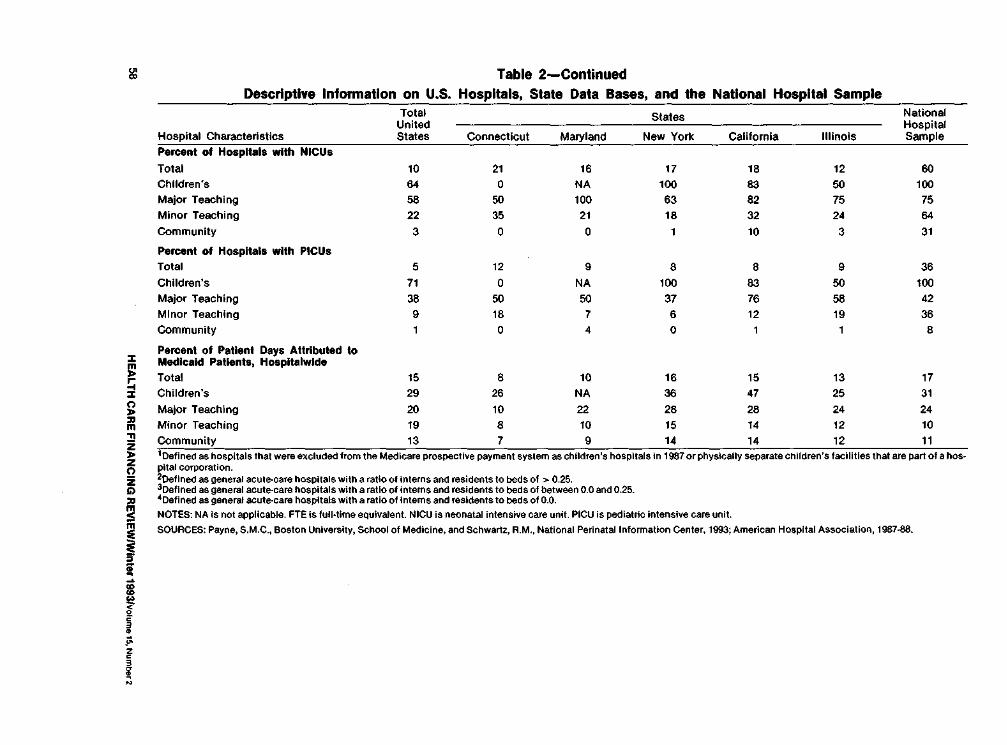
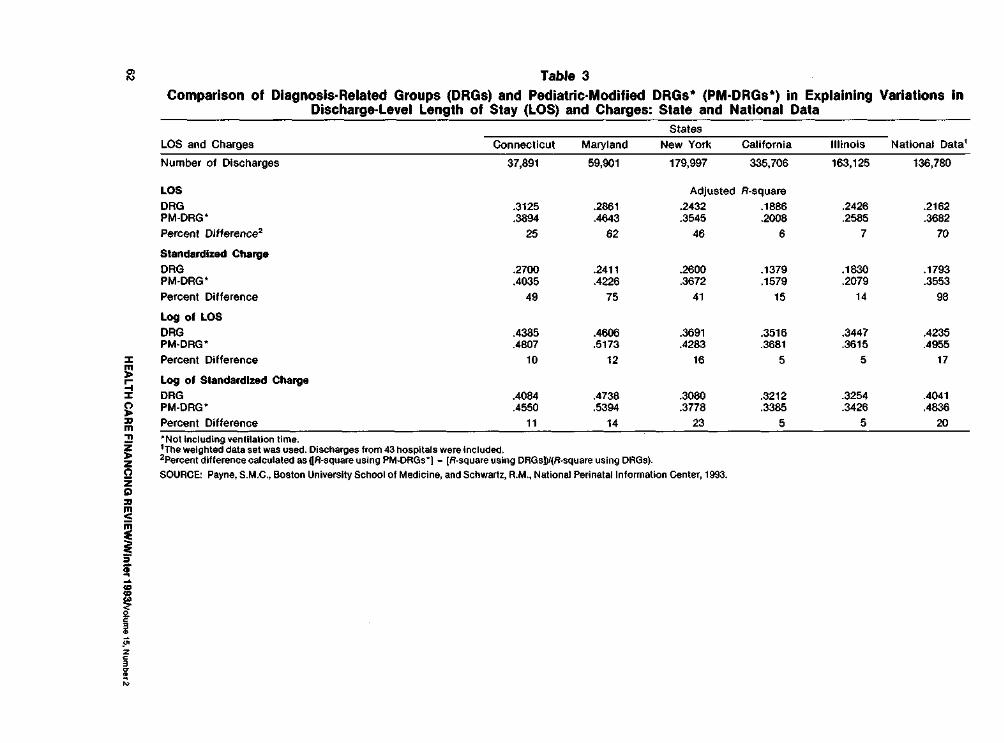
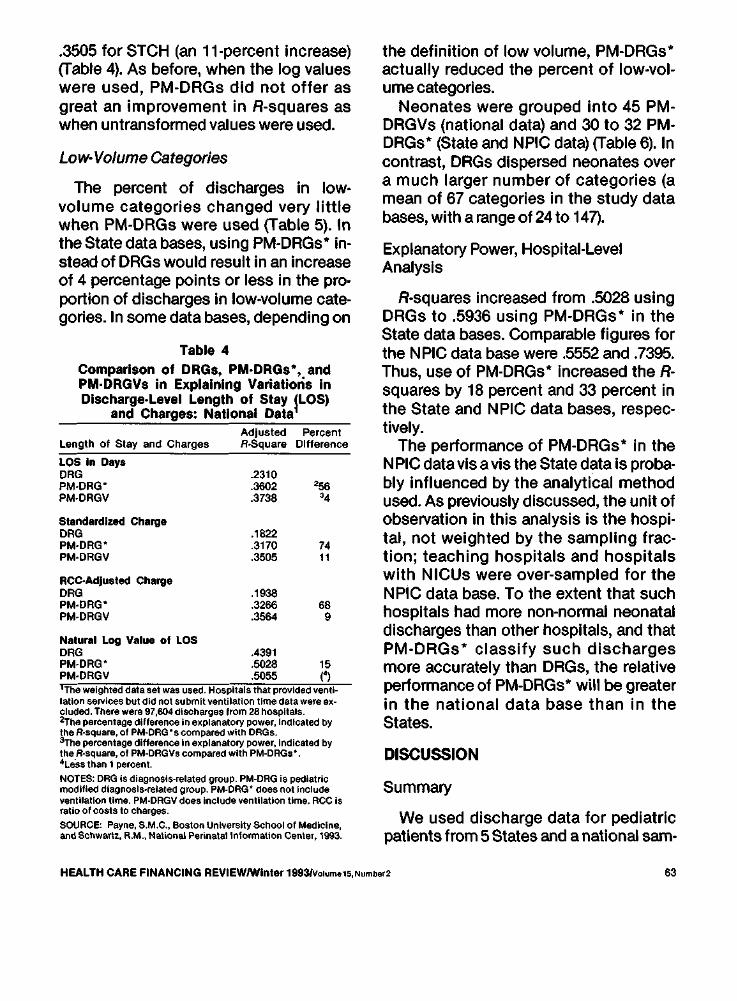
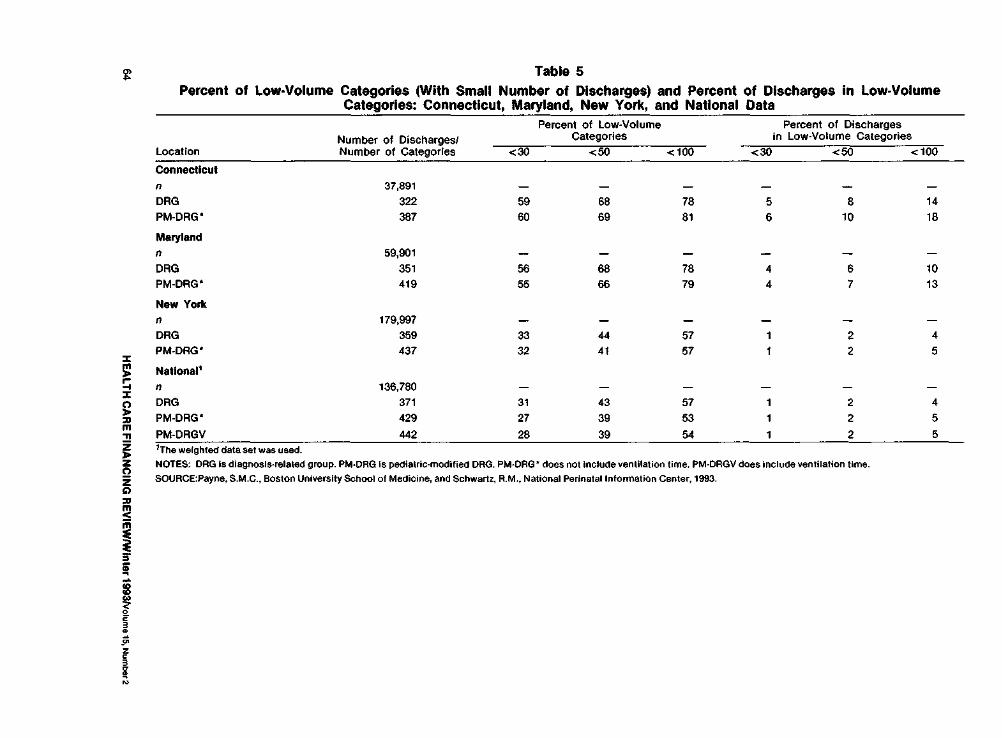
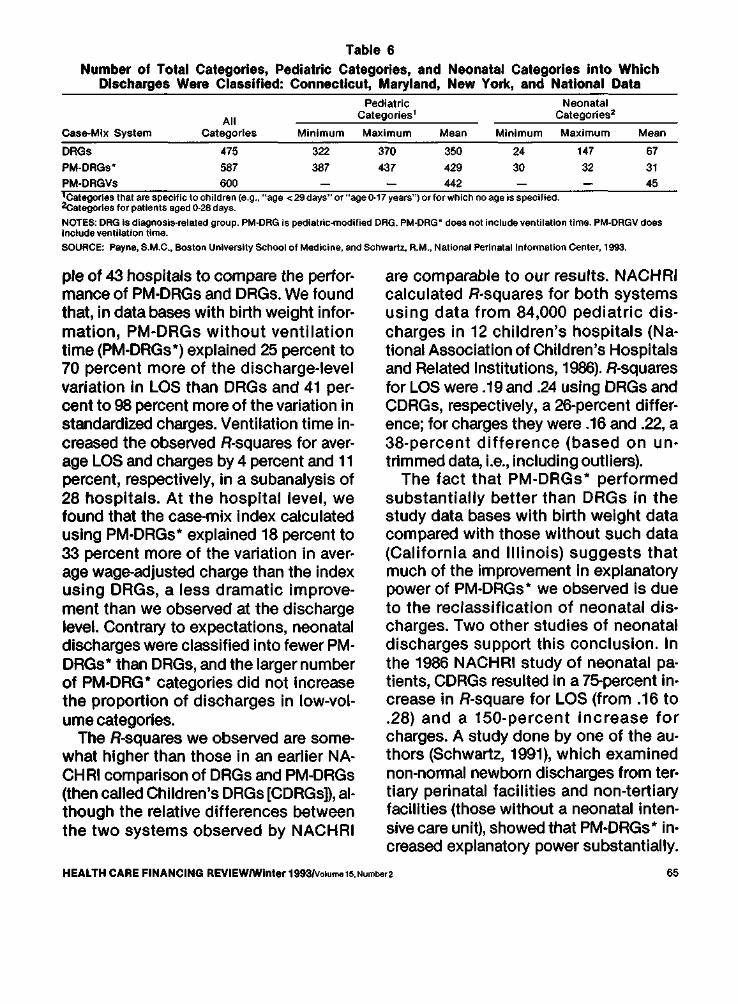