Embed Size (px)
Citation preview

ISRM EUROCK’2002, Portugal, Madeira, Funchal, 25-28 November 2002 page 1 of 32
Keynote Lecture. Proc. ISRM EUROCK’2002, Portugal, Madeira, Funchal, 25-28 November 2002. Editors: C. Dinis da Gama & L. Ribeira e Sousa, Publ. Sociedade Portuguesa de Geotecnia, Av. do Brasil, 101, 1700-066 Lisboa, Portugal. pp. 3 – 32.
AN EVALUATION OF SLOPE STABILITY CLASSIFICATION HACK, ROBERT Section Engineering Geology, Centre for Technical Geosciences, International Institute for Geo-information Science and Earth Observation (ITC), Delft, THE NETHERLANDS, [email protected] ABSTRACT An overview is given of a series of classification systems used for rock slope stability analyses. Calculation methods and parameters used seem not always appropriate for slopes stability and could be improved. Based on this evaluation some new ideas developed of how a system for slope stability assessment could be designed without inherited legacies as parameters related to underground excavations. In the past classification system calculations should be simple as these were supposed to be done on site in the field. With the general availability of palmtop computers this restriction is not necessary anymore and more sophisticated systems with more complicated calculations can be designed which may result in better slope stability predictions. 1. INTRODUCTION
In the last decades the study of discontinuous rock mechanics has developed tremendously. For constructions, such as slopes, foundations and shallow tunnels it has been recognized that discontinuities have a major influence on the mechanical properties of a rock mass. This perception has major consequences for the assessment of the engineering behaviour of a rock mass. Descriptions and characterizations, engineering geological maps and calculations for engineering structures in or on a rock mass have to include discontinuity properties. Variations in properties, however, can be considerable along the same discontinuity plane. As there may be hundreds of discontinuities in a rock mass, each with its own variable properties, these, taken together with inhomogeneities in the rock material, require that in order to describe or calculate the mechanical behaviour of the rock mass accurately, a large amount of data is required. Laboratory and field tests are available to obtain discontinuity properties. Testing in large quantities is, however, time consuming and troublesome.
Continuum calculations for engineering structures in or on a rock mass, whether analytical or numerical, cannot be appropriate, as the simplifications needed to present the rock mass as a continuum are so substantial that it is nearly always highly questionable to what extent the final calculation model still represents reality. Discontinuous 'distinct block' numerical calculations can model the discontinuities and calculate the behaviour of a rock mass in all detail, provided that property data are available. Apart from the need to have powerful computers to do the large number of calculations required by the vast quantity of discontinuities, the test data needed for a detailed numerical discontinuous calculation are never available. An often applied practice to avoid these problems is to simplify the discontinuity model, and estimate or guess the properties or to use literature values. To what extent the result is still representative for the real situation is a question that often remains unanswered.

ISRM EUROCK’2002, Portugal, Madeira, Funchal, 25-28 November 2002 page 2 of 32
Keynote Lecture. Proc. ISRM EUROCK’2002, Portugal, Madeira, Funchal, 25-28 November 2002. Editors: C. Dinis da Gama & L. Ribeira e Sousa, Publ. Sociedade Portuguesa de Geotecnia, Av. do Brasil, 101, 1700-066 Lisboa, Portugal. pp. 3 – 32.
2. ROCK MASS CLASSIFICATION SYSTEMS
Rock masses have been described from the earliest geological maps onwards. The descriptions of the rocks were initially in lithological and in other geological terms. With increasing knowledge of geology, geological features and the influence of geology on engineering the amount of information to be included in a description for geotechnical purposes increased, leading to sets of rules for the description or characterization of a rock mass geotechnically. Parallel with this development, a movement took place in mining and engineering geology to combine the characterization of a rock mass with direct recommendations for tunnel support. This resulted in rock mass classification systems. The systems were developed primarily empirically by establishing the parameters of importance, giving each parameter a numerical value and a weighting. This led, via empirical formulae, to a final rating for a rock mass. The final rating was related to the stability of the underground excavation. In systems that are more elaborate, the rating was also related to the support installed in the excavation and to stand-up times. The success of classification systems in underground excavations caused that classification systems were also used for slopes. Classifications systems have been designed following many different calculation methods and also the used parameters and their influence on the final result differ widely from system to system. This obviously sets some question marks to the validity of classification systems. The correlation between the results of some systems is often quoted to prove that the systems do work, but also this on detailed investigation seems not to be so convincing.
2.1 Calculation methods
The calculation methods used in systems differ widely and use addition, subtraction, multiplication, and division of logarithmic, linear, or non-linear parameters. These are used either solely or in combination and no clear benefit from using a particular type of numeric representation or calculation method seems to exist. Some slope classification systems that use a method of calculation based on combining different parameters to give one single rating number, can give results difficult to perceive (for example: Robertson’s RMR 1988, and Romana’s SMR, 1985, 1991, 1995). In these classification systems parameters have an influence on the stability rating for a slope which instability may be caused by a physical mechanism that is independent from those parameters. For example, intact rock strength is used to calculate the stability rating while a slope is unstable because of sliding on a discontinuity with a thick clay infill and hence intact rock strength is of no importance for the stability or instability of the slope. 2.2 Correlations between different classification systems
Various relationships have been established between the different existing classification systems (Bieniawski, 1976, 1989, Cording & Deere, 1972, Rudledge & Preston, 1978, Yufu, 1995). The example for underground excavations in Fig. 1 shows that the quality classes do not perfectly correlate (continuous lines) and the scatter allows for one to two classes difference between the two systems (dashed lines). This may be due to the definition of the classes. A more correct comparison between the two systems should be based on the recommended support for underground excavations. The recommended types of support are, however, different for the two systems and a comparison cannot be easily made. The two systems (Bieniawski and Barton) were developed in different parts of the world, in different types of mines, in different

ISRM EUROCK’2002, Portugal, Madeira, Funchal, 25-28 November 2002 page 3 of 32
Keynote Lecture. Proc. ISRM EUROCK’2002, Portugal, Madeira, Funchal, 25-28 November 2002. Editors: C. Dinis da Gama & L. Ribeira e Sousa, Publ. Sociedade Portuguesa de Geotecnia, Av. do Brasil, 101, 1700-066 Lisboa, Portugal. pp. 3 – 32.
rock types and, above all, the systems use partly different parameters, and have defined differently the parameters included in both systems. That two so very different systems do correlate is rather strange. Tentative reasons for this correlation might be: 1) Correlation between parameters; e.g. a rock mass with a low intact rock strength has often
also a small discontinuity spacing or a low shear strength along discontinuities or both. Hence, a correlation between different classification systems is always obtained for the majority of possible rock masses.
2) Biased users: The parameter difference is compensated by adjusting parameter(s) to values which the experienced user considers to be appropriate for the rock mass. Thus, if the user knows from experience or by other means that the rock mass is poor, he (unconsciously) creates also a poor rock mass rating by taking lower values for the individual parameters of the system he uses.
very
goo
d
extremely poor very poor poor fair good
very good
ext. good
exc. good
fair
poor
very
poo
r
exceptionally poor
100
80
60
40
20
0 0.001 0.01 0.1 1 10 100 1000
Bie
niaw
ski (
RM
R)
Barton (Q-value)
RMR = 9 ln Q + 44
good
Fig. 1. Correlation between Bieniawski (RMR) and Barton (Q). Data from case histories with RMR and Q-system (after Bieniawski, 1989). (Continuous lines indicate correlating classes of rock mass quality.)
3. CLASSIFICATION APPLIED TO SLOPES
At first classification systems made for underground excavations were applied to slope stability problems. Soon was noted that this generally did not result in satisfying results and systems developed for underground excavations were recalibrated and adjusted to slope stability problems. Generally, these systems inherited the main features of the underlying classification system for underground excavations. This caused that some systems have strange components or parameters that are not applicable in slope stability or are missing parameters that are important in slope stability problems. Following is a review of some of the parameters applied in the most often used classification systems for slope stability. In this review are not included failure criteria such as the modified Hoek-Brown criterion (Hoek et al., 1992) that can be used for a slope stability analyses and also design methodologies such as the Rock Engineering System of Hudson (1992) and its slope stability application (Nathanail et al., 1992, Mazzoccola

ISRM EUROCK’2002, Portugal, Madeira, Funchal, 25-28 November 2002 page 4 of 32
Keynote Lecture. Proc. ISRM EUROCK’2002, Portugal, Madeira, Funchal, 25-28 November 2002. Editors: C. Dinis da Gama & L. Ribeira e Sousa, Publ. Sociedade Portuguesa de Geotecnia, Av. do Brasil, 101, 1700-066 Lisboa, Portugal. pp. 3 – 32.
& Hudson, 1996) are not included because these are rather methodologies to develop design criteria for slopes than classification systems.
3.1 Influence of parameters in classification systems
An inventory of the most important rock mass parameters of interest for engineering structures in or on a rock mass is presented in Table 1, which is based on the experience and intuition of the author and on the literature:
Table 1. Rock mass parameters of interest for engineering structures in or on rock.
intact rock strength
orientation (with respect to engineering structure) amount of sets spacing per set rock block size and
form persistence per set material friction roughness (dilatancy) strength
surface characteristics of discontinuity wall
deformation
discontinuities shear strength along discontinuity (condition of discontinuity)
infill material susceptibility to weathering
rock mass
deformation parameters of intact rock/rock mass engineering
structure geometry of engineering structure (size and orientation of a tunnel, height and orientation of a slope, etc.) water pressure/flow, snow and ice, stress relief, external stress, etc. external
influences type of excavation Table 2 (Hack, 1998) presents the parameters used in various systems and gives a crude indication of the maximum influence of each parameter on the final rating. Because many slope stability systems are based on the systems designed for underground excavation by Bieniawski (1989) and Laubscher (1990) these have also been included for comparison to the slope systems. The Barton Q-system (1974, 1976, 1988) is included to show the parameters used in this system. The percentages should, however, not be compared to the percentages of the other systems as the Barton system uses a logarithmic scale. It is impossible for all systems to indicate the influence per parameter exactly because in some systems, parameters are dependent or parameters are not linear. Noteworthy differences in the influence of parameters (Table 2) are: 1) The absence of the intact rock strength (except for a low intact rock strength/environment
stress ratio), in the Barton system. 2) The absence of discontinuity spacing in the Barton system. 3) The strong reduction in influence of the water parameter in the Laubscher and Haines
systems as compared to the systems of Bieniawski and Barton. 4) The absence of a water/water pressure parameter in the Robertson modification for slopes
of the Bieniawski system and in the slope stability system of Vecchia. 5) The strong influence of the susceptibility to weathering in the Laubscher system. 6) The strong increase in influence of orientation of discontinuities in relation to the
orientation of the walls and roof of underground excavations in the Laubscher system compared to the Bieniawski system.

ISRM EUROCK’2002, Portugal, Madeira, Funchal, 25-28 November 2002 page 5 of 32
Keynote Lecture. Proc. ISRM EUROCK’2002, Portugal, Madeira, Funchal, 25-28 November 2002. Editors: C. Dinis da Gama & L. Ribeira e Sousa, Publ. Sociedade Portuguesa de Geotecnia, Av. do Brasil, 101, 1700-066 Lisboa, Portugal. pp. 3 – 32.
Table 2. Parameters and their influence in classification systems.
MAXIMUM NEGATIVE INFLUENCE OF PARAMETERS (in percentage from final maximum rating)(1)
discontinuities pressure or load excavation
roughness (scale)
classification system
rating range
intact rock
strength RQD num-
ber of sets
per-sistence
spacing aper-ture large small
infill altera-
tion walls
future weathe-ring rock water dimen-
sion orienta-
tion method
systems for underground excavations Bieniawski
(RMR) 0 - 100 15 20 6 20 6 6 6 6 15 100(3) 12
Barton (Q) 0.00006 - 2666
rock load
parame-ter(2)
90 97 90 99 97 95 100(3)
Laubscher 0 - 120 17 13(4) 21(4)(5) 5 9 15 5 70 40 3(6) 100(3) 37 20 systems for slopes
Selby 0 - 100 20 7 30 7 *(7) 10(8) 6 20 Bieniawski
(RMR) 0 - 100 15 20 6 20 6 6 6 6 15 60
Vecchia 0 - 100 88 12 Robertson (RMR)(9) 0 - 100 30 20 6 20 6 6 6 6 (100)
(9)
Romana (SMR) 0 - 115 13 17 5 17 5 5 6 6 13 52 13
Haines 0 - 100 17 13(4) 21(4)(5) 5 9 15 5 70 40 3(6) (note 10) 20 Notes to: Influence percentages are only an approximate indication. Influence percentage = (maximum final rating - rating with the parameter minimum and all other parameters maximum) / maximum final rating x 100 %. If a parameter is linked to another parameter then the other parameter is also changed as required (for example, the link between Jr and Ja in the Barton system; the lowest value for Ja is 20 but this cannot be combined with the maximum value (5) for Jr but only with Jr=1). 2) Intact rock strength is only of influence if low compared to stress environment. 3) Graphical (approximately logarithmic) relations between roof span or hydraulic radius, final rating and stand-up time. 4) Laubscher’s system. Parameters for RQD and discontinuity spacing can be replaced by discontinuity frequency. 5) Amount of discontinuity sets, spacing, and persistence combined in logarithmic relation. 6) Water influence combined with discontinuity ratings. 7) Infill combined with persistence. 8) Selby rates present degree of weathering (thus not future weathering) for the whole rock mass following BS 5930 (1981). 9) Robertson: If RMR < 40 points slope stability governed by the RMR rating; if RMR > 40 points the stability is fully governed by the orientation and strength of the discontinuities. 10) Haines: Final result from graph relating slope height, dip, safety factor, and (MRMR) rating. Adjustment parameter for slope orientation in relation with orientation of discontinuities with maximum of 100%. Systems after: Barton et al., 1974, 1976, 1988, Bieniawski, 1989, Haines & Terbrugge, 1991, Laubscher, 1990, Robertson, 1988, Romana, 1985, 1991, 1995, Selby, 1980, 1982, Vecchia, 1978

ISRM EUROCK’2002, Portugal, Madeira, Funchal, 25-28 November 2002 page 6 of 32
Keynote Lecture. Proc. ISRM EUROCK’2002, Portugal, Madeira, Funchal, 25-28 November 2002. Editors: C. Dinis da Gama & L. Ribeira e Sousa, Publ. Sociedade Portuguesa de Geotecnia, Av. do Brasil, 101, 1700-066 Lisboa, Portugal. pp. 3 – 32.
7) The systems (except for Haines) for surface applications do not include the height of the slope whereas the height of the slope likely has an influence on the stability.
Since the systems are based on back calculation (regression analysis) of case histories that are mostly unpublished, an exact determination of the origin of the differences cannot be given. In this respect, it should also be mentioned that empirical systems are never ‘final’. In the last decades the systems have continuously developed. Experience with the systems and subsequent changes in or fine-tuning of weighting factors and parameters cause some of the differences between the systems. It is also likely that the added experience with classification systems makes the latest systems the most reliable. In this respect the decrease of the influence of water in some of the newer systems and, in particular, in systems focused on slope stability should be noted.
3.2 Problems with parameters in rock mass classification systems
In the previous chapter it is shown that not all systems use the same parameters, that not all systems include all parameters thought to be important for geotechnical purposes and that the influence of a parameter on the final classification result is not the same for all systems. Apart from these differences, the implementation of some parameters can also be questioned. A further discussion of the parameters thought to be important for a classification system for slope stability is therefore necessary.
3.2.1 Intact rock strength
Intact rock strength is defined, in most classification systems, as the strength of the rock material between the discontinuities. Strength values used are often from laboratory unconfined compressive strength (UCS) tests. Problems caused by the definition of intact rock strength and using strength values based on UCS laboratory tests are: 1) The UCS test sample is most often about 10 cm long and if the discontinuity spacing is
less than 10 cm the core may include discontinuities. 2) Samples tested in the laboratory tend to be of better quality than the average rock because
poor rock is often disregarded when drill cores or samples break and cannot be tested. 3) The intact rock strength measured depends on the sample orientation if the intact rock
exhibits anisotropy. 4) UCS is not a valid parameter because, in reality, most rock will be stressed under
circumstances resembling conditions of triaxial tests rather than UCS test conditions. 5) Some classification systems use the Point Load Test. The same problems applying to using
the UCS test also apply to the PLS test. The inclusion of discontinuities in the rock will cause a PLS value tested parallel to this discontinuity to be considerably lower than if tested perpendicular. This effect is stronger for the PLS test than for a UCS test, as the PLS test is basically a splitting test.
6) The disadvantage of using a Schmidt hammer for estimation of intact rock strength is the influence of discontinuities behind the tested surface. Schmidt hammer values may be influenced by a large and un-quantifiable loss of rebound if a discontinuity is present inside the rock behind the tested surface.
3.2.2 Rock Quality Designation (RQD)
The RQD (originally defined by Deere et al., 1967, 1988, 1989) is measured on the borehole core. Normally the RQD is determined for every meter length of borehole core per

ISRM EUROCK’2002, Portugal, Madeira, Funchal, 25-28 November 2002 page 7 of 32
Keynote Lecture. Proc. ISRM EUROCK’2002, Portugal, Madeira, Funchal, 25-28 November 2002. Editors: C. Dinis da Gama & L. Ribeira e Sousa, Publ. Sociedade Portuguesa de Geotecnia, Av. do Brasil, 101, 1700-066 Lisboa, Portugal. pp. 3 – 32.
lithostratigraphic unit. The length of unbroken pieces of sound core that are of more than 10 cm (4 inches) length along the centre line of the core (ISRM, 1978, 1981), are added and the ratio, as percentage, to the length drilled is the RQD. Recommended is a drilled length of 1 or 1.5 m. In principle, the RQD is a very simple test and used worldwide. However, the definition of the RQD and the day-to-day practice of determining the RQD introduce several severe disadvantages those cause the RQD often to be inaccurate or to result in totally misleading values. Many authors have commented on the disadvantages of RQD measurements (R.D. Terzaghi, 1965). Some major problems with RQD measurements are: 1) The value of 10 cm (4 inches) unbroken rock is arbitrary. 2) The value of 10 cm for unbroken pieces of rock core is an abrupt boundary. A rock mass
with discontinuity spacing of 9 cm perpendicular to the borehole axis will result in an RQD value of 0 % while a discontinuity spacing of 11 cm will result in an RQD of 100 %. Although a (small) quality difference might result from the difference in spacings, this is certainly not such a large difference that it should result in a difference between minimum and maximum of the quality assignment. Obviously in a real rock mass the spacings between discontinuities are not all the same and therefore the 10 cm boundary effect is more or less abrupt depending on the distribution of the spacings.
spacing discontinuities 0.09 m
vertical borehole RQD = 0 %
horizontal borehole A RQD = 100 %
horizontal borehole B RQD = 0 %
Fig. 2. Bias of RQD due to orientation of borehole.
3) The RQD is biased through orientation with respect to discontinuity orientation (Fig. 2). If a discontinuity is in the borehole core parallel to the borehole (borehole B) then ISRM (1978b, 1981a) recommends measuring the length of the core offset from the centre line if sound pieces of > 10 cm length are present in that stretch of the core. Depending on the infill thickness of the discontinuity, this might solve the problem of borehole B (RQD = 0 %) in Fig. 2.
4) Weak rock pieces (weathered pieces of rock or infill material) that are not sound should not be considered for determining the RQD (Deere et al., 1967, 1988). To exclude infill material will usually not be too difficult; however, excluding pieces of weathered, not sound rock is fairly arbitrary.
5) The RQD value is influenced by drilling equipment, drilling operators and core handling. Especially RQD values of weak rocks can be considerably reduced due to inexperienced operators or poor drilling equipment.
6) The equipment and especially the core barrels used for geotechnical rock drilling are not standard. It is obvious that the number of breaks caused by the drilling process will be strongly dependent on whether single-, double-, or triple-tube core barrels are used. ISRM recommends measuring RQD on cores drilled with a double-tube core barrel only. The borehole, however, is normally not only made to determine the RQD. Often triple-tube

ISRM EUROCK’2002, Portugal, Madeira, Funchal, 25-28 November 2002 page 8 of 32
Keynote Lecture. Proc. ISRM EUROCK’2002, Portugal, Madeira, Funchal, 25-28 November 2002. Editors: C. Dinis da Gama & L. Ribeira e Sousa, Publ. Sociedade Portuguesa de Geotecnia, Av. do Brasil, 101, 1700-066 Lisboa, Portugal. pp. 3 – 32.
core barrels are used for weaker rock or fractured rock masses to obtain a decent core for test samples. The RQD measured on this core is overrated but the amount of overrating is not known. Alternatively, two boreholes should be drilled; one for the RQD with a double-tube core barrel and one for the samples with a triple-tube core barrel. The author does not know of any site where this has been the case. On the contrary the author has noticed many sites were the RQD was determined and compared from borehole to borehole irrespective of the core barrels used.
7) The diameter of the borehole core is not standard in geotechnical drilling. A core diameter of not less than 70 mm (H size) is recommended for geotechnical drilling. In massive rocks, however, a reduction is allowed to 55 mm (N size) and in very weak or fractured rock, the diameter should be increased between 100 and 150 mm (BS 5930, 1981). The author has noticed that in practice very often N or NQ sized boreholes (approximately 47 to 55 mm core diameter) are used independent of the quality of the rock. Bieniawski (1989) allows borehole diameters from BQ to PQ (36.5 to 85 mm) for RQD determination. A larger diameter will result in: 1) fewer breaks during drilling and core handling after drilling, 2) a larger chance that a parallel discontinuity is intersected and 3) a larger chance that pieces of sound rock will be present in the core if a (near-) parallel discontinuity is intersected. In general, smaller core diameters lead to lower values for the RQD and larger diameters to higher values for the RQD.
8) Pieces of rock that are clearly broken through drilling or transport are supposed to be fitted together and the length should be measured as unbroken (ISRM, 1978, 1981). If this is done properly it partly solves the problems mentioned in points 5, 6 and 7, however it is not always easy to distinguish between natural discontinuities and breaks from drilling or core handling. In particular, in a fresh rock mass this distinction is often almost impossible and a less experienced engineer or drilling master might make considerable errors.
9) Although the RQD should be established per lithology, many establish the RQD irrespective of the lithology. Partly because of inexperience, partly because lithological boundaries are often uncertain. This problem is emphasized if core loss occurs in interbedded lithologies where the weaker lithology is not present in the borehole core.
The above leads to the conclusion that the RQD is not very strictly defined, that the definition is not very logical, that the result may not express the rock mass quality and that comparison of RQD values might be deceptive. Thus, the incorporation of the RQD in rock mass classification systems can be questioned. In many classification systems, the RQD is incorporated as a parameter while the classification system also contains a parameter for discontinuity spacing. This seems not very logical. It effectively doubles the influence of the spacing of discontinuities on the final rating.
Various methods have been proposed to determine the RQD value for situations where no borehole core is available (Barton, 1976, Bieniawski, 1989, Eissa & Sen, 1991, Palmstrøm, 1975, Sen, 1992). Most methods are vulnerable to criticism because 1) the relations are only approximate, 2) an exposure might show more discontinuities than a borehole in the same rock mass (certainly when the exposure has been created by blasting), 3) weak rock pieces (highly weathered pieces of rock or infill material) that should be excluded in the determination of RQD cannot be excluded in these theoretical models, and 4) influences of drilling and core handling are completely excluded, whereas the RQD measured in a borehole is always influenced by the drilling and core handling. A more fundamental error might be caused by the orientation of the measurement. A borehole is nearly always vertical and a scan line nearly always horizontal. As classification systems are empirical, the orientation of the measurement

ISRM EUROCK’2002, Portugal, Madeira, Funchal, 25-28 November 2002 page 9 of 32
Keynote Lecture. Proc. ISRM EUROCK’2002, Portugal, Madeira, Funchal, 25-28 November 2002. Editors: C. Dinis da Gama & L. Ribeira e Sousa, Publ. Sociedade Portuguesa de Geotecnia, Av. do Brasil, 101, 1700-066 Lisboa, Portugal. pp. 3 – 32.
might well have an influence although this is not quantified (or known) in the existing classification systems that use RQD.
3.2.3 Spacing of discontinuity sets
In many classification systems, the spacing of discontinuities is used as a parameter. However, often the spacing of only one discontinuity set can be incorporated. This is no problem if only one discontinuity set is present in the rock mass or if one discontinuity set has a considerably smaller spacing than the other discontinuity sets. The mechanical behaviour of the rock mass with respect to discontinuity spacing is, in such rock masses, mainly governed by one discontinuity set. However, these classification systems do not describe what should be done if the mechanical behaviour of the rock mass is governed by more than one discontinuity set, for example, if more sets with a similar discontinuity spacing are present.
3.2.4 Persistence of discontinuities
Non-persistent discontinuity sets do not have the same influence on the stability of a rock mass as persistent discontinuities have. How to deal with persistence is described in detail in the Q-system (Barton et al., 1974, 1976, 1988) and the geomorphic rock mass strength classification of Selby (1980, 1982). These systems combine persistence with the description of the shear friction parameters of the discontinuity. In the RMR and Laubscher systems and modifications discontinuities are only considered if: 1) the discontinuity is larger than visible; thus the discontinuity can be followed for a distance equal to or larger than, for example, the dimensions of a tunnel or exposure, or 2) the discontinuity abuts against another discontinuity. Discontinuities that do not comply with 1 or 2 are not considered as discontinuities in these classification systems.
3.2.5 Condition of discontinuities
The condition of the discontinuities (material friction, roughness, discontinuity wall strength and infill material) determines the shear and tensile strength characteristics of the discontinuities. Most systems separate the condition of discontinuities in different parameters (for example: Barton, Bieniawski, Laubscher and modifications) that are independently rated in the classification system. The Laubscher system uses four parameters (large and small scale roughness, alteration of discontinuity walls and infill), to establish the quality of the discontinuity. The Barton system uses only two parameters (discontinuity roughness number and discontinuity alteration number), but the number of options for these parameters is so large that most discontinuity conditions can be described.
A major problem with many systems is that these use an expression for the condition of the discontinuities for one discontinuity set only. Obviously there is no problem if all discontinuity sets have the same characteristic condition but for a rock mass with discontinuity sets with different characteristics it is often difficult to decide which discontinuity set should be considered in the determination of the rock mass quality. Some authors (Bieniawski, 1989, Barton, 1976, Laubscher, 1990 and modifications) indicate that: 1) the condition of the discontinuity set with the poorest condition should be included or 2) the condition of the discontinuity set that has the most adverse influence on the rock mass quality or engineering application should be included. Romana (1985, 1991, 1995) recommends that the rating should be calculated for each discontinuity set and the lowest resulting rating be used to determine the slope stability. In Bieniawski’s RMR and modifications the problem is more pronounced

ISRM EUROCK’2002, Portugal, Madeira, Funchal, 25-28 November 2002 page 10 of 32
Keynote Lecture. Proc. ISRM EUROCK’2002, Portugal, Madeira, Funchal, 25-28 November 2002. Editors: C. Dinis da Gama & L. Ribeira e Sousa, Publ. Sociedade Portuguesa de Geotecnia, Av. do Brasil, 101, 1700-066 Lisboa, Portugal. pp. 3 – 32.
because also the spacing parameter is defined for one discontinuity set only. According to Bieniawski the discontinuity set with the most adverse influence on the stability should be taken into account. A discontinuity set with a large spacing but with a bad condition, however, could have a worse influence on stability than a discontinuity set with a small spacing, but with a good condition. It is not clear how the worst discontinuity set should be selected in such a situation. The problem is illustrated in Fig. 3.
discontinuity set with good condition discontinuity set with very poor condition
Fig. 3. Influence of discontinuity condition. It is not clear which discontinuity set has the worst influence on the stability of the tunnel.
3.2.6 Anisotropic discontinuity roughness
The roughness of a discontinuity can be anisotropic, e.g. ripple marks, striations, etc.. The shear strength resulting from anisotropic discontinuity roughness will also be anisotropic. Thus roughness should be assessed in relation with the orientation of the discontinuity and the roughness used in a classification system should be the roughness in the direction that is most important for the stability of a slope. Most classification systems do not incorporate anisotropic roughness. Robertson (1988) recommends assessing the roughness in the direction where possible sliding can occur. Systems that do not include the influence of discontinuity and excavation orientation can obviously also not include anisotropic roughness.
3.2.7 Discontinuity karst features
Karst features have been found to be of importance in slope stability. The open holes weaken the rock mass. Karst features are nearly always found to originate from solution along discontinuities. Solution leaves cavities supported by points of contact across opened discontinuities. A diminished contact area reduces the shear strength if (apparent) cohesion is present, and points of contact may break due to overstressing. The presence of karst holes during excavation has also an adverse effect on the slope stability. During blasting the blasting gasses will force their way out of the rock mass via the karstic discontinuities rather than by breaking intact rock or by following discontinuities in the direction of the next borehole.
3.2.8 Susceptibility to weathering
Susceptibility to weathering is only considered, to a certain extent, in the classification system by Laubscher (1990) and in the modifications of this classification system. Susceptibility to
ISRM EUROCK’2002, Portugal, Madeira, Funchal, 25-28 November 2002 page 11 of 32
Keynote Lecture. Proc. ISRM EUROCK’2002, Portugal, Madeira, Funchal, 25-28 November 2002. Editors: C. Dinis da Gama & L. Ribeira e Sousa, Publ. Sociedade Portuguesa de Geotecnia, Av. do Brasil, 101, 1700-066 Lisboa, Portugal. pp. 3 – 32.
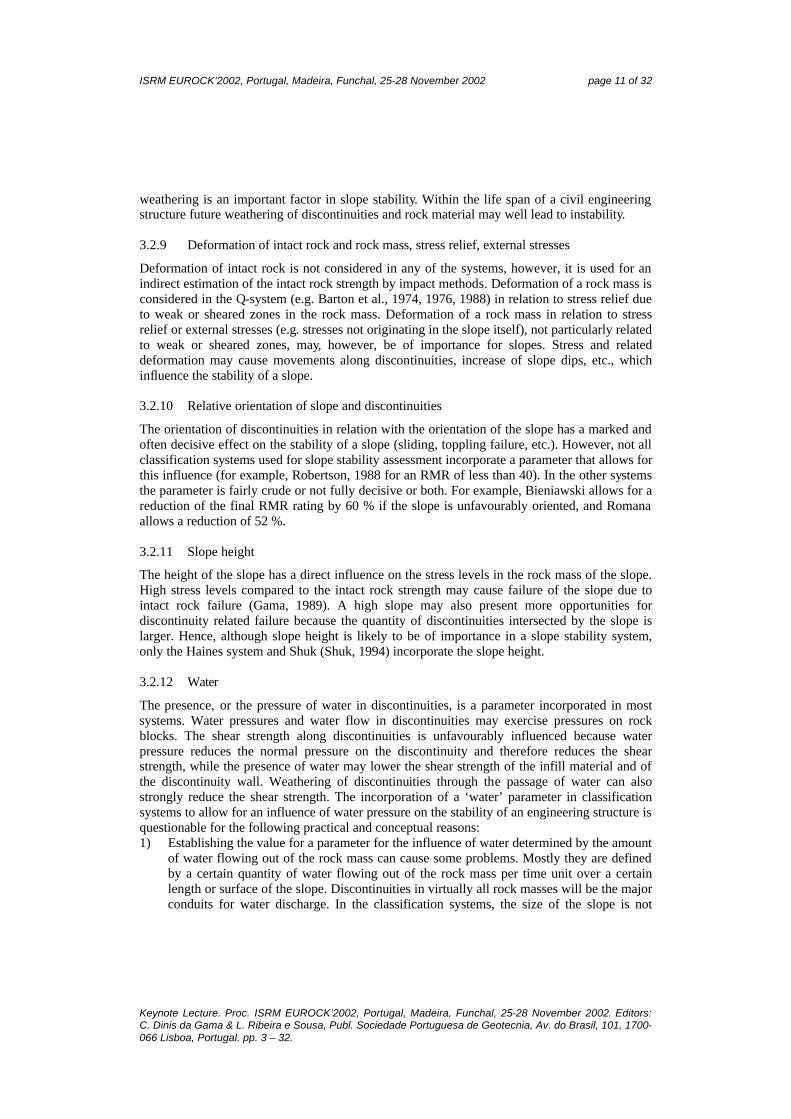
weathering is an important factor in slope stability. Within the life span of a civil engineering structure future weathering of discontinuities and rock material may well lead to instability.
3.2.9 Deformation of intact rock and rock mass, stress relief, external stresses
Deformation of intact rock is not considered in any of the systems, however, it is used for an indirect estimation of the intact rock strength by impact methods. Deformation of a rock mass is considered in the Q-system (e.g. Barton et al., 1974, 1976, 1988) in relation to stress relief due to weak or sheared zones in the rock mass. Deformation of a rock mass in relation to stress relief or external stresses (e.g. stresses not originating in the slope itself), not particularly related to weak or sheared zones, may, however, be of importance for slopes. Stress and related deformation may cause movements along discontinuities, increase of slope dips, etc., which influence the stability of a slope.
3.2.10 Relative orientation of slope and discontinuities
The orientation of discontinuities in relation with the orientation of the slope has a marked and often decisive effect on the stability of a slope (sliding, toppling failure, etc.). However, not all classification systems used for slope stability assessment incorporate a parameter that allows for this influence (for example, Robertson, 1988 for an RMR of less than 40). In the other systems the parameter is fairly crude or not fully decisive or both. For example, Bieniawski allows for a reduction of the final RMR rating by 60 % if the slope is unfavourably oriented, and Romana allows a reduction of 52 %.
3.2.11 Slope height
The height of the slope has a direct influence on the stress levels in the rock mass of the slope. High stress levels compared to the intact rock strength may cause failure of the slope due to intact rock failure (Gama, 1989). A high slope may also present more opportunities for discontinuity related failure because the quantity of discontinuities intersected by the slope is larger. Hence, although slope height is likely to be of importance in a slope stability system, only the Haines system and Shuk (Shuk, 1994) incorporate the slope height.
3.2.12 Water
The presence, or the pressure of water in discontinuities, is a parameter incorporated in most systems. Water pressures and water flow in discontinuities may exercise pressures on rock blocks. The shear strength along discontinuities is unfavourably influenced because water pressure reduces the normal pressure on the discontinuity and therefore reduces the shear strength, while the presence of water may lower the shear strength of the infill material and of the discontinuity wall. Weathering of discontinuities through the passage of water can also strongly reduce the shear strength. The incorporation of a ‘water’ parameter in classification systems to allow for an influence of water pressure on the stability of an engineering structure is questionable for the following practical and conceptual reasons: 1) Establishing the value for a parameter for the influence of water determined by the amount
of water flowing out of the rock mass can cause some problems. Mostly they are defined by a certain quantity of water flowing out of the rock mass per time unit over a certain length or surface of the slope. Discontinuities in virtually all rock masses will be the major conduits for water discharge. In the classification systems, the size of the slope is not

ISRM EUROCK’2002, Portugal, Madeira, Funchal, 25-28 November 2002 page 12 of 32
Keynote Lecture. Proc. ISRM EUROCK’2002, Portugal, Madeira, Funchal, 25-28 November 2002. Editors: C. Dinis da Gama & L. Ribeira e Sousa, Publ. Sociedade Portuguesa de Geotecnia, Av. do Brasil, 101, 1700-066 Lisboa, Portugal. pp. 3 – 32.
considered in relation with the parameter for water, whereas it can easily be seen that the number of water discharging discontinuities and thus the quantity of water discharged is dependent on the size of the slope.
2) An important shortcoming in the existing water class determination is that the quantity of water is not necessarily related to the pressure of the water in the discontinuities. A small quantity of water discharged by a low permeability rock mass might be related to a higher water pressure in the discontinuities than a large quantity of water discharged by a (free draining) rock mass with high permeability.
3) The discharge of water is often not constant over the slope height. In the rock mass of the lower part of the slope the water pressure and consequently water discharge will be higher than in the higher part of a slope. Whether an average of the water discharged should be used in a single classification or whether this should lead to two or more different classifications applicable to different levels of the slope is not described in the existing slope stability classification systems.
4) In underground excavations, the stress configuration around the opening will generally result in a higher compressive stress on discontinuities perpendicular to the wall of the opening and near to the underground opening than the compressive stress on discontinuities further away from the opening. Higher compressive stress causes a closing of the discontinuities in the direction of the underground opening. Water pressures are therefore present in the discontinuities adjacent to the opening. In slopes stress relief causes the discontinuities nearest to the slope face to open and the storage capacity increases in the direction of the slope face, resulting in a decrease of water pressures. The pressure decrease in the direction of a slope face can be large; in most slopes the discontinuities at the slope surface are free draining. This difference in water pressures between underground openings and slopes is likely to cause that water should be treated in a different way in slope than in underground excavation classification systems. The above reasoning applies to flowing - dynamic - water; the water pressures of static water are independent of the storage capacity. The slope face and often also the walls, roof and floor in an underground excavation, are, however, always free draining, except if the rock mass is covered by an impermeable material, such as shotcrete, without draining facilities, and therefore there is a flow of water in the direction of the slope face or underground opening.
5) It has been shown that the water flow through discontinuities is often restricted to channels in the discontinuity (Abelin et al., 1990, Bear et al., 1993, Genske & Maravic., 1995, Hakami, 1995, Neretnieks et al., 1982, 1985, Rasmussen & Evans, 1987). Probably this can be extended to water pressures. Water pressure acting on a plane only at the location of a channel would result in a total water pressure on the plane considerably smaller than if the water pressure would act over the full discontinuity plane. Water flow may be restricted to channels while the whole discontinuity is filled by static, not flowing, water, then the water pressure still acts over the whole surface of the discontinuity. In underground excavations has, however, been found that in some rock masses the majority of the discontinuities is not water bearing while the rock mass is water bearing (Neretnieks et al., 1985).
6) Water run-off over the slope can lead to instability, but such run-off is not related to water seepage.
7) Water presence in slopes is not a continuous feature in time. During and shortly after rain high water pressures may build up in a slope or, alternatively, there may be no water at all after a dry period.

ISRM EUROCK’2002, Portugal, Madeira, Funchal, 25-28 November 2002 page 13 of 32
Keynote Lecture. Proc. ISRM EUROCK’2002, Portugal, Madeira, Funchal, 25-28 November 2002. Editors: C. Dinis da Gama & L. Ribeira e Sousa, Publ. Sociedade Portuguesa de Geotecnia, Av. do Brasil, 101, 1700-066 Lisboa, Portugal. pp. 3 – 32.
8) During rain it will be virtually impossible to distinguish between water discharged by discontinuities in the rock mass of the slope and surface run-off water over the slope.
9) Drains will normally be present in a wet tunnel, in which the quantity of water flowing in and out a section can be simply measured with, for example, a weir. The difference between the quantities of water flowing in and out of the section is the amount of water discharged by the rock mass surrounding the tunnel. Slopes, however, will usually not have a drain at the toe and measuring the quantity of water will be a practical problem.
10) In the existing classification systems for underground excavations the water parameter is normally expressed in classes such as: ‘dry’, ‘moist’, ‘dripping’, ‘wet’ or in classes that are directly related to an amount of water flowing out of the rock mass into the excavation. Classes such as ‘dry’ and ‘moist’ are not very difficult to establish but classes such as ‘dripping’ or ‘wet’ are subjective.
The above leads to the conclusion that the methodology used in the existing classification systems that incorporate the influence of water pressures on the mechanical behaviour of a rock mass, should be reconsidered.
3.2.13 Ice and snow influence
Ice and snow can have a severe influence on the stability of a slope. Freezing of water leads to an expansion in volume. Water frozen in a discontinuity will exert a very high pressure on the discontinuity walls. In underground applications, this virtually will never be a problem as temperatures underground are normally not below zero. In surface applications and certainly in slope stability applications freezing of water in discontinuities can, however, be a major factor for the stability of a slope. Freezing of water may lead to opening and widening of discontinuities, displacements of rock blocks out of the slope face, but also to closure of discontinuities, blocking the discharge of seepage water that may lead to water pressure build-up in the slope. Snow may cause a problem for slope stability because of the additional weight of snow on the slope face. The influence of ice and snow is also dependent on the orientation of the slope with respect to the direction of the sun as daily temperature changes, especially a regular variation between freezing and thawing, has a negative influence on the quality of the rock mass.
3.2.14 Dynamic loading - earthquakes
Dynamic loading of a slope, for example, by an earthquake, may cause a slope to fail. Various classification systems exist that relate slope geometry and mass properties to stability and the type of earthquake, mainly based on regional studies with limited ground data input, however, the predicting capabilities of these systems are rather limited (Hack et al., 2002b). A differentiation should be made between natural and man-made slopes. An earthquake is often the trigger that causes a natural slope to fail, however, not the cause, as can be assumed that a natural slope has always suffered from a similar earthquake before without failing. Degradation of the rock mass since the last similar earthquake, at which time the natural slope did not fail, causes the slope rock mass to be so weakened that it fails under influence of the trigger of the new earthquake loading. In man-made slopes the earthquake may be the actual cause of failure. A classification system that includes the influence of earthquake loading has to be developed in an earthquake prone area, on man-made slope case histories that include the influence of earthquakes during the existence of the man-made slopes, or alternatively on natural slopes. The number of cases to develop a system on is obviously more limited than available for systems

ISRM EUROCK’2002, Portugal, Madeira, Funchal, 25-28 November 2002 page 14 of 32
Keynote Lecture. Proc. ISRM EUROCK’2002, Portugal, Madeira, Funchal, 25-28 November 2002. Editors: C. Dinis da Gama & L. Ribeira e Sousa, Publ. Sociedade Portuguesa de Geotecnia, Av. do Brasil, 101, 1700-066 Lisboa, Portugal. pp. 3 – 32.
without earthquake influence and the reliability of the systems can be expected to be accordingly less.
3.2.15 Method of excavation
The way the exposure has been established has a considerable influence on the parameters measured or observed in the exposure. For example, an exposure in a riverbed created by slow scouring of the river over probably hundreds to thousands of years creates an exposure with a relatively small amount of visible discontinuities. Stress concentrations have not occurred or were minimal during the creation of the exposure due to the slow process. The tendency for discontinuities to open is minimal and therefore a larger part of the discontinuities is not clearly visible. Contrariwise a blasted excavation shows considerably more discontinuities because partly intact rock has been cracked due to the blasting but also, and often more important, existing internal planes of incipient weakness, which before blasting were not visible, have opened or widened due to the pressure of the blasting gasses and the shock wave, and therefore become visible and thus will be measured as mechanical discontinuities. Some existing classification systems consider this effect (Haines, Laubscher, Romana). These systems reduce the rock mass rating with a parameter to compensate for the damage that will be caused by the method of excavation.
3.2.16 Uncertainty
No measurement is exact and a certain uncertainty is present in each measurement and, hence, in any slope stability assessment with a classification system (Gama, 1994). Uncertainty is, however, mostly not included (.
3.2.17 Homogeneity of geotechnical units
Related to uncertainty is the definition of the geotechnical units. Each stability analyses is to be done within a geotechnical unit of which properties are assumed to be homogene (Hoek et al., 2000). However, no unit will have the same properties throughout, a certain variations is always present depending on how the boundaries of the unit are taken in relation to the complexity of the rock mass. More units mean also higher costs as sampling of data and analyses will be more time consuming. The definition of geotechnical units is not standardized and is left to the engineering guess of the design engineer.
3.2.18 Operator experience and familiarity with a classification
Assigning values to some of the parameters in the systems discussed is often subjective and depends upon the operator’s experience and the familiarity of the operator with the system. Examples for which this is of major importance are: ‘the discontinuity set with the most adverse influence on the rock mass or for the engineering application’ and classes such as ‘wet’, ‘dripping’ for water influence. The merits of a system are clearly reduced if a system depends on the operator’s experience or familiarity with the system.
3.2.19 Support recommendations
Some classification systems for slope stability relate the classification result to an indication of the stabilisation measures that may be required to stabilise a slope (Romana, 1985, 1991, 1995), similar to support recommendation for underground excavations. Such recommendations are,

ISRM EUROCK’2002, Portugal, Madeira, Funchal, 25-28 November 2002 page 15 of 32
Keynote Lecture. Proc. ISRM EUROCK’2002, Portugal, Madeira, Funchal, 25-28 November 2002. Editors: C. Dinis da Gama & L. Ribeira e Sousa, Publ. Sociedade Portuguesa de Geotecnia, Av. do Brasil, 101, 1700-066 Lisboa, Portugal. pp. 3 – 32.
however, in the opinion of the author, far more difficult to establish and generalise for a slope stability classification system than the support recommendations for underground excavations and the reliability of such recommendation may be less accordingly. A major difference between systems for underground excavations and slopes is that underground excavations in mining are often supported, which is not the case in slope stability in open pit mining, where support is nearly always avoided by reducing slope or bench height or dip. This reduces drastically the number of case histories on which to develop a classification system. Support is normally also minimised for slopes made in civil engineering projects and preference is given to reducing slope height or slope dip to stabilise a slope because maintenance of support measures over long periods of time is complicated and expensive.
4. NEW APPROACHE TO DEVELOP A CLASSIFICATION SYSTEM FOR SLOPES
Based on the evaluation in the forgoing chapters an attempt was made to develop some new methodologies for slope stability classification systems. Restrictions that existed when the first classification systems were developed such as simple calculations to obtain the classification result could be discarded because palmtop computers can be used to calculate the result in the field. Properties to be measured had to be simple and applicable to slope stability and not just inherited from older classification systems. Further could the optimisation routines to find the correct correlations between parameters and slope stability be far more sophisticated because computer power was available for the development of a new system. This resulted in a new classification system for slope stability assessment (Hack et al., 1998, 2002a) with as main characteristics: 1) a differentiation between the rock mass in the exposures used for the classification and the rock mass in which the final slope is to be made, 2) the assessment of stability by the probability of occurrence of different failure mechanisms instead of a single point rating value, and 3) unambiguous and simple procedures for collection of data in the field. The system was named Slope Stability Probability Classification (SSPC).
4.1 Three-step classification system
The SSPC system considers three rock masses: 1) the rock mass in the exposure, the 'exposure rock mass' (ERM), 2) the rock mass in an imaginary unweathered and undisturbed condition prior to excavation, the 'reference rock mass' (RRM), and 3) the rock mass in which the existing or new slope is to be situated; the 'slope rock mass' (SRM) (Fig. 4). Rock mass parameters of importance are described and characterized in an exposure resulting in the 'exposure rock mass'. Local influences on the parameters measured in the exposure such as weathering and the disturbance due to the excavation method used to make the exposure are then compensated. This converts the parameters for the 'exposure rock mass' to that of the theoretical rock mass that exists below the influence zones of weathering (thus fresh) and other disturbances: the 'reference rock mass' (RRM) (Fig. 4). This compensation is done with the aid of correction parameters: the exposure specific parameters. The resulting rock mass parameters are those of the 'reference rock mass'. By this technique, parameters that, in the same geotechnical unit, show different degrees of weathering and different degrees of excavation disturbance are brought back to parameters reflecting their original basic geotechnical properties. The actual stability assessment is made in the 'slope rock mass' (SRM). This is derived from the 'reference rock mass' (RRM) by correction of the parameters of the 'reference rock mass' with the slope specific parameters. Slope specific parameters are correction parameters for the influence of future weathering within the engineering lifetime of the slope and for the influence of the

ISRM EUROCK’2002, Portugal, Madeira, Funchal, 25-28 November 2002 page 16 of 32
Keynote Lecture. Proc. ISRM EUROCK’2002, Portugal, Madeira, Funchal, 25-28 November 2002. Editors: C. Dinis da Gama & L. Ribeira e Sousa, Publ. Sociedade Portuguesa de Geotecnia, Av. do Brasil, 101, 1700-066 Lisboa, Portugal. pp. 3 – 32.
method of excavation to be used. The 'exposure rock mass' and 'slope rock mass' are the same if an existing slope is examined and future weathering is not considered.
river old road
proposed new road cut slightly
weathered
moderately weathered
1
2
3
Reference Rock Mass
fresh
1: natural exposure made by scouring of river, moderately weathered; 2: old road, made by excavator, slightly weathered; 3: new to develop road cut, made by blasting, moderately weathered to fresh.
Fig. 4. Sketch of exposures in rock masses with various degrees of weathering, different types of excavation, and showing the concept of the ‘reference rock mass’.
4.2 Failure mechanisms
Slope failure mechanisms such as shear displacement and the resulting different failure modes (plane sliding, wedge failure, partial toppling and buckling) are discontinuity related and are dependent on the orientations of slope and discontinuity. Failure mechanisms that are not related to the orientations of the slope and the discontinuities can also cause failure of a slope. Examples of these are the breaking of intact rock under influence of the stresses in the slope and the removal of slope surface material due to surface (rain-) water and seepage of water out of the rock mass. Traditional rock slope stability analyses are based on recognition of the failure mode in the field followed by a (back) calculation. Although the failure modes causing slope instability are theoretically well defined, it is often difficult to recognize the operating failure mode in the field. In many unstable slopes multiple modes are at work at the same moment or successively. Not all of these may be easily recognizable or visible. Moreover, not only the proper failure modes have to be identified, but for slopes with multiple modes at work, also the contribution of each mode to the overall (in-) stability should be quantified. In case of successive modes, the moment the slope is examined may determine the failure mode recognized. For these reasons stable and unstable slopes have been analysed without regard to the cause of instability to avoid the problem of exactly identifying failure modes in the field.
4.3 Determination of rock mass parameters
The determination of discontinuous rock mass properties can be done with relatively simple means in the field. In the SSPC system, the rock mass properties of intact rock strength, and discontinuity orientation, spacing, and condition are determined.
Intact rock strength is established in the field by 'simple means' such as hammer blows and finger pressure (Hack & Huisman, 2002). The method has been tested extensively and compared to strength determination by laboratory unconfined compressive strength. The 'simple means' tests may be thought to be subjective, however, only a short training on rock pieces with known intact rock strength is enough to reduce subjectivity to an acceptable level. Large

ISRM EUROCK’2002, Portugal, Madeira, Funchal, 25-28 November 2002 page 17 of 32
Keynote Lecture. Proc. ISRM EUROCK’2002, Portugal, Madeira, Funchal, 25-28 November 2002. Editors: C. Dinis da Gama & L. Ribeira e Sousa, Publ. Sociedade Portuguesa de Geotecnia, Av. do Brasil, 101, 1700-066 Lisboa, Portugal. pp. 3 – 32.
numbers of 'simple means' tests can be done in a short time span and are not dependent on obtaining a sample large enough for laboratory testing. The large number of tests gives also a better characterization of the variation of the intact rock strength throughout the rock mass than a limited number of UCS tests values.
The orientation of discontinuities in combination with the shear strength along discontinuities determines the possibility of movement along discontinuities and thus has a major influence on the mechanical behaviour of a rock mass. It should first be established whether discontinuities belong to a 'set' or should be treated as a 'single' feature. Determining the parameters for a 'set' of discontinuities requires a form of averaging of the parameters of individual discontinuities. The average orientation of a discontinuity set can be found mathematically or by stereo-projection methods. The characteristic properties of each discontinuity set are the average of the properties of each measured discontinuity belonging to that set. Disadvantages of these methods are that it may be difficult to distinguish between the different discontinuity sets. Furthermore, an important discontinuity set may be missed or underrated in importance because the discontinuity spacing is large. This and other errors that may affect the results of stereographic projection methods to determine discontinuity sets and orientations are discussed in extenso by R.D. Terzaghi (1965). Alternatively a studied assessment can be done. In a studied assessment, the discontinuities that are representative for a set are visually selected. After this selection, the properties of the selected discontinuities are measured in detail in pre-selected locations. In the opinion of the author this method gives a result equal to or better than the results of large numbers of measurements of discontinuities for a statistical analysis. Large amounts of measurements are usually done on a part of the exposure that is (easily) accessible whether representative for the rock mass or not. The condition (e.g. the shear strength) of a discontinuity is determined by a visual and tactile (roughness established by touch), infill, and karst characterization of a discontinuity. Non-fitting of discontinuities and persistence are taken into account.
4.4 Stability analysis
The stability is determined in two analyses. The first analysis is the determination of the stability of the slope related to the discontinuities in the rock mass. This analysis is related to the orientation of the discontinuities and the slope. The second analysis determines the stability of the slope in relation to the strength of the rock mass in which the slope is made. This second analyses is independent of the orientation of the discontinuities and of the slope.
4.4.1 Orientation dependent stability
Failures in a rock slope often depend on the orientation of the slope and the discontinuities in the rock mass. The main parameters governing this type of failure is the shear strength of the discontinuity. Two criteria were developed in the SSPC system to predict the ‘orientation dependent stability’ of a slope: the sliding and the toppling criteria (Fig. 5, Fig. 6).

ISRM EUROCK’2002, Portugal, Madeira, Funchal, 25-28 November 2002 page 18 of 32
Keynote Lecture. Proc. ISRM EUROCK’2002, Portugal, Madeira, Funchal, 25-28 November 2002. Editors: C. Dinis da Gama & L. Ribeira e Sousa, Publ. Sociedade Portuguesa de Geotecnia, Av. do Brasil, 101, 1700-066 Lisboa, Portugal. pp. 3 – 32.
AP (deg)
TC (c
ondi
tion
of d
isco
ntin
uity
) (-)
1.00 0.80 0.60 0.40 0.20 0.00 0
10
20
30
40
50
60
70
80
90
5 %
30 %
discontinuity stable with respect to sliding
discontinuity unstable with respect to sliding
70 % 50 %
95 %
Fig. 5. Sliding criterion.
- 90 - AP + slope dip (deg)
TC (c
ondi
tion
of d
isco
ntin
uity
) (-)
0 10 20 30 40 50 60 70 80 90
1.00
0.80
0.60
0.40
0.20
0.00
70 %
5 %
95 % discontinuity stable
with respect to toppling
discontinuity unstable with respect to toppling
50 % 30 %
Fig. 6. Toppling criterion
4.4.2 Orientation independent stability
A large number of the slopes were found not to be unstable following the sliding and toppling criteria, although these were assessed visually in the field as unstable. For these slopes, a mathematical model could be formulated to predict the 'orientation independent stability'. Most of the failures in these slopes were approximately linear, although not following one and the same existing discontinuity plane. Often fracturing of intact rock over small distances (small compared to the size of the slope) causes about linear failure planes to be developed partly though intact rock and partly following existing discontinuity planes. This effect was more prominent in rock masses in which the block size was smaller. Intact rock strength, block size and shear strength along discontinuities are thus having an influence on the development of these failure planes, e.g. failure planes not related to a single existing discontinuity. The orientation independent stability of such a slope was modelled by a linear shear plane model following the Mohr-Coulomb failure criterion. The parameters friction and cohesion in the Mohr-Coulomb failure criterion are then the apparent friction and cohesion for the rock mass. The rock mass friction and cohesion are dependent on intact rock strength, block size (e.g. discontinuity spacing), and the shear strength (e.g. the condition of discontinuities) along all discontinuities in the rock mass. Back analysis allowed for relations to implement the intact

ISRM EUROCK’2002, Portugal, Madeira, Funchal, 25-28 November 2002 page 19 of 32
Keynote Lecture. Proc. ISRM EUROCK’2002, Portugal, Madeira, Funchal, 25-28 November 2002. Editors: C. Dinis da Gama & L. Ribeira e Sousa, Publ. Sociedade Portuguesa de Geotecnia, Av. do Brasil, 101, 1700-066 Lisboa, Portugal. pp. 3 – 32.
rock strength, the block size, and the condition of three sets of discontinuities. A probability analyses resulted in the graph of Fig. 7 that determines the orientation independent stability.
1
0.1
10
0.0 0.2 0.4 0.6 0.8 1.0
5 % 10 % 30 % 50 %
95 % 90 %
70 %
probability to be stable > 95 %
probability to be stable < 5 %
ϕ’mass / slope dip
Hm
ax /
Hsl
ope
Dashed pr obability lines indicate that the number of slopes used for the development of the SSPC system for these sections of the graph is limited and the probability lines may not be as certain as the pr obability lines drawn with a continuous line.
Fig. 7. Probability of orientation independent stability.
4.4.3 Influence of water
Water pressures in discontinuities are traditionally believed to be of major importance in rock slope stability. However, a more thorough examination indicates that, in general, this must be regarded as doubtful. Most rock masses at or near the surface contain many discontinuities, and these will generally allow water to freely flow out of the rock mass in a slope cut. A cover of topsoil present above a slope is generally less permeable than the rock mass and reduces the rate of water inflow. This inhibits any build up of water pressures. Another reason for smaller or non-existence of water pressures is that near the slope face stresses will be smaller than more deeper in the rock mass. Smaller stresses will cause the discontinuities to open and, hence, reduce water pressures in discontinuities with water flowing in the direction of the slope cut. The only situation for which water pressures will be of major influence is if a new slope is intersecting a groundwater table. However, it should be considered bad engineering if drainage measures would not be taken to lower the groundwater table behind a slope cut.
4.4.4 Local influences: weathering and method of excavation
The three-step approach allows for correction of local influences such as weathering and the damage due to the method of excavation. The 'exposure' rock mass is first divided into geotechnical units. Then for each geotechnical unit the rock mass parameters are determined and converted into parameters for the 'reference' rock mass by correction for local weathering in the exposure characterized and for the damage due to the method of excavation used to make the exposure. The parameters that characterize the 'slope' rock mass are obtained by correction of the parameters that characterize the 'reference' rock mass for the damage due to the method of excavation to be used for the new slope, and taking into account present and future weathering. Future weathering has to be predicted by examining the same geotechnical unit in exposures with a known time of existence. It should be noted that weathering may well depend

ISRM EUROCK’2002, Portugal, Madeira, Funchal, 25-28 November 2002 page 20 of 32
Keynote Lecture. Proc. ISRM EUROCK’2002, Portugal, Madeira, Funchal, 25-28 November 2002. Editors: C. Dinis da Gama & L. Ribeira e Sousa, Publ. Sociedade Portuguesa de Geotecnia, Av. do Brasil, 101, 1700-066 Lisboa, Portugal. pp. 3 – 32.
on very local influences, such as orientation of the exposure, position in the landscape (wind), use of fertilizer by farmers which may via the groundwater, influence the mineral stability, etc. Although this may sometimes be difficult, experience suggests that enough information can be found to estimate the most likely degree of weathering of the geotechnical unit at the end of the engineering lifetime.
5. RESULTS AND EXAMPLES
Slope stability assessed following SSPC is presented for a series of examples.
5.1 Northeastern Spain
Fig. 8 shows the results of slope stability assessments following Haines, SMR, and SSPC systems with the visual estimated stability for 184 slopes in North-eastern Spain (Hack, 1998). The probability rating of the stability of a slope with the SSPC system gives a more distinctive differentiation between stable and unstable than with the Haines and SMR systems, and the correlation between the visually estimated slope stabilities and the predictions of stability of the SSPC system is better than the correlation with the other classification systems. The slopes assessed are in the same area as where the SSPC system has been developed and obviously, a good result may be expected for the SSPC system. Following are given three examples from these `184 slopes in North-eastern Spain.
Example I Fig. 9 shows a newly blasted slope in limestone and dolomite in 1988 originally with a dip of about 80°. In 1996 the dip of the slope is between 60° and 70°. The units in the slope consist of interlayered thin bedded (visible in Fig. 9 just above the sitting person) and medium to thick-bedded units. The same thin-bedded units are found exposed in nearby (less than 50 m away) road cuts more than 40 years old. Old road cuts made in the thin bedded units with dips of 60 to 70° and heights of about 5 m, are still (in 1995) stable and no or very little degradation of the rock mass is observed in these old road cuts. The rock mass in these old road cuts is still only slightly weathered. The method of excavation used for the old slopes was by a hand shovel or a small mechanical shovel. The dip directions of the slopes in the old and new road cuts are approximately equal and the general position of the old road cuts in the topography is fully comparable to the position of the new road cut. Both the old and new road cuts are cut into a hill that flattens above the road cuts. Any surface flow of heavy rainfall is likely to be the same for both old and new cuts. In addition, with respect to geology (faults, etc.) no major differences have been noted between the old and the new road cuts. The new road cut is clearly unstable, large parts show rill erosion and erosion of the thin-bedded units causes undercutting of the thicker bedded parts, making these unstable.

ISRM EUROCK’2002, Portugal, Madeira, Funchal, 25-28 November 2002 page 21 of 32
Keynote Lecture. Proc. ISRM EUROCK’2002, Portugal, Madeira, Funchal, 25-28 November 2002. Editors: C. Dinis da Gama & L. Ribeira e Sousa, Publ. Sociedade Portuguesa de Geotecnia, Av. do Brasil, 101, 1700-066 Lisboa, Portugal. pp. 3 – 32.
SSPC stability probability (%)
num
ber o
f slo
pes
(%)
< 5 7.5 15 25 35 45 55 65 75 85 92.5 > 95 0
20
40
60
80 visually estimated stability
stable (class 1) unstable (class 2) unstable (class 3)
Romana's SMR (points)
num
ber o
f slo
pes
(%)
5 15 25 35 45 55 65 75 85 95 0
20
40
60
80 visually estimated stability
stable (class 1) unstable (class 2) unstable (class 3)
Haines' slope dip - existing slope dip (deg)
num
ber o
f slo
pes
(%)
-45 -35 -25 -10 -5 5 15 25 35 45 0
20
40
60
80 visually estimated stability
stable (class 1) unstable (class 2) unstable (class 3)
Percentages are from total number of slopes per visually estimated stability class.
visually estimated stability: class 1 : stable; no signs of present or future slope failures (number of slopes: 109) class 2 : small problems; the slope presently shows signs of active small failures and has the potential for future small failures (number of slopes: 20) class 3 : large problems; The slope presently shows signs of active large failures and has the potential for future large failures (number of slopes: 55)
unstable stable stable unstable
a: SSPC b: Haines
c: SMR
Haines safety factor: 1.2
completely unstable completely
stablepartially stable unstable stable
'tentative' describtion of SMR classes:
Fig. 8. Comparison of slope stability assessment by different classification systems.
The general impression of the slope is extremely poor. On close examination, those parts of the slope that appear to be ‘soil’ are in fact the thin bedded units which are partly covered by top soil transported from higher parts of the slope. For another part the soil is derived from weathering of the thin bedded units. In some places these have been weathered to a moderate or high degree of rock mass weathering for at least 0.5 to 1 m into the rock mass after excavation. The structure and coherence of the rock mass and in particular the structure and coherence of the thin-bedded units are disturbed by the method of excavation. Discontinuities have opened, blocks are displaced, and at many locations the intact rock is fractured and occasionally also crushed due to the blasting for the excavation. This disturbed the structure of the rock mass so severely that water could flow through the near-surface parts of the rock slope and caused weathering of the thin-bedded units. The slope is not unstable due to sliding or toppling along discontinuities.
The SSPC system results in a probability to be stable of > 95 % for the old road cuts with a slope dip of 70° and a height of 5 m. The same rock mass characteristics are used for the new slope. Hence, both slopes are assumed to have been made in the same 'reference' rock mass as far as the thin-bedded units are considered. The stability of the new road cut with a height of 13.8 m, with a degree of rock mass weathering of 'moderately' and 'dislodged blocks' due to blasting, results in a stability assessment of about 8 % for a slope dip of 70° in 1996. This is in agreement with the visual observed stability at that time. The rock mass is clearly not able to support a slope with a dip of 70°. According to the SSPC system, stability will be achieved if the slope dip is decreased to about 45°. In 2002 the slope dip had been reduced to about 55° and visually assessed the slope is still unstable.
ISRM EUROCK’2002, Portugal, Madeira, Funchal, 25-28 November 2002 page 22 of 32
Keynote Lecture. Proc. ISRM EUROCK’2002, Portugal, Madeira, Funchal, 25-28 November 2002. Editors: C. Dinis da Gama & L. Ribeira e Sousa, Publ. Sociedade Portuguesa de Geotecnia, Av. do Brasil, 101, 1700-066 Lisboa, Portugal. pp. 3 – 32.
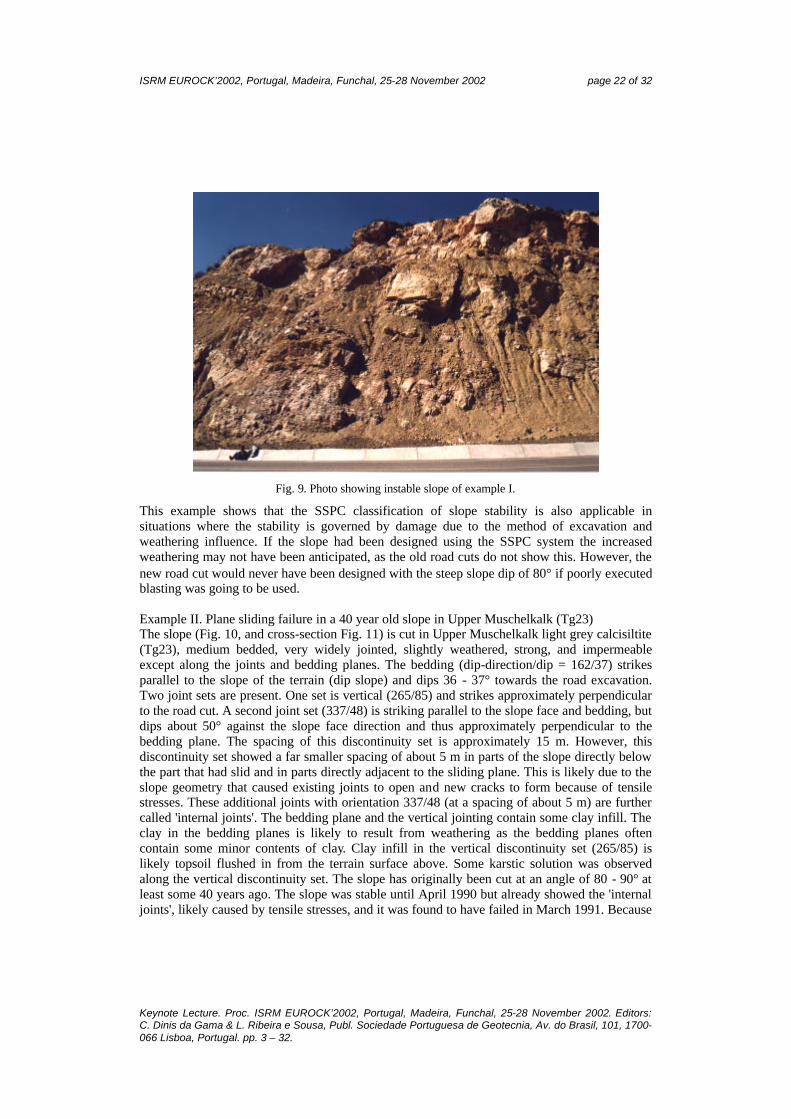
Fig. 9. Photo showing instable slope of example I.
This example shows that the SSPC classification of slope stability is also applicable in situations where the stability is governed by damage due to the method of excavation and weathering influence. If the slope had been designed using the SSPC system the increased weathering may not have been anticipated, as the old road cuts do not show this. However, the new road cut would never have been designed with the steep slope dip of 80° if poorly executed blasting was going to be used.
Example II. Plane sliding failure in a 40 year old slope in Upper Muschelkalk (Tg23) The slope (Fig. 10, and cross-section Fig. 11) is cut in Upper Muschelkalk light grey calcisiltite (Tg23), medium bedded, very widely jointed, slightly weathered, strong, and impermeable except along the joints and bedding planes. The bedding (dip-direction/dip = 162/37) strikes parallel to the slope of the terrain (dip slope) and dips 36 - 37° towards the road excavation. Two joint sets are present. One set is vertical (265/85) and strikes approximately perpendicular to the road cut. A second joint set (337/48) is striking parallel to the slope face and bedding, but dips about 50° against the slope face direction and thus approximately perpendicular to the bedding plane. The spacing of this discontinuity set is approximately 15 m. However, this discontinuity set showed a far smaller spacing of about 5 m in parts of the slope directly below the part that had slid and in parts directly adjacent to the sliding plane. This is likely due to the slope geometry that caused existing joints to open and new cracks to form because of tensile stresses. These additional joints with orientation 337/48 (at a spacing of about 5 m) are further called 'internal joints'. The bedding plane and the vertical jointing contain some clay infill. The clay in the bedding planes is likely to result from weathering as the bedding planes often contain some minor contents of clay. Clay infill in the vertical discontinuity set (265/85) is likely topsoil flushed in from the terrain surface above. Some karstic solution was observed along the vertical discontinuity set. The slope has originally been cut at an angle of 80 - 90° at least some 40 years ago. The slope was stable until April 1990 but already showed the 'internal joints', likely caused by tensile stresses, and it was found to have failed in March 1991. Because

ISRM EUROCK’2002, Portugal, Madeira, Funchal, 25-28 November 2002 page 23 of 32
Keynote Lecture. Proc. ISRM EUROCK’2002, Portugal, Madeira, Funchal, 25-28 November 2002. Editors: C. Dinis da Gama & L. Ribeira e Sousa, Publ. Sociedade Portuguesa de Geotecnia, Av. do Brasil, 101, 1700-066 Lisboa, Portugal. pp. 3 – 32.
the slope is such a good example of plane sliding, the slope has been investigated in more detail. Samples for UCS and shearbox testing have been sawn out of the rock and a detailed survey of the topography of the slope has been executed. The slope has also been subject to analytical and numerical modelling.
Fig. 10. Plane sliding in a limestone slope of example II
15 m
9 m
direction 162°
road
bedding planes
37°
slit
Fig. 11. Example II. Geometrical cross section of the slope (in the direction of the dip of the bedding and slope, 162°).
The slope has been classified in 1990 before the sliding happened, which resulted in a SSPC stability probability for sliding along the bedding plane of 55 % for a slope cut of 90°. This indicates that the slope stability against sliding was almost unity, and for example, a very slight decrease of the condition of the bedding plane due to weathering was sufficient to cause failure. The fact that tension cracks developed during the lifetime of the slope also indicates that the slid block above the bedding plane was not fully supported by shear strength along the lower parts of the bedding plane. The clay infill in the vertical joint set (265/85) has not been included in the calculations of the reference rock mass and in the slope stability probability, as the infill was expected to be flushed into the discontinuities from the terrain surface and not to be present
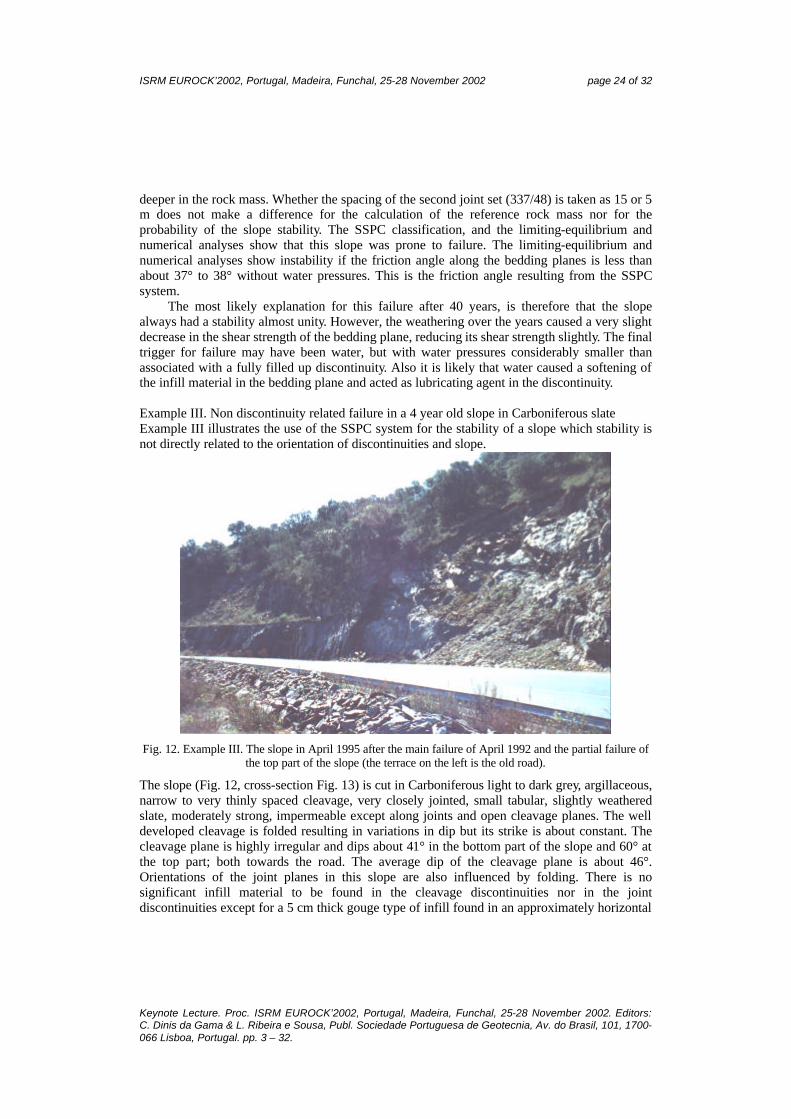
ISRM EUROCK’2002, Portugal, Madeira, Funchal, 25-28 November 2002 page 24 of 32
Keynote Lecture. Proc. ISRM EUROCK’2002, Portugal, Madeira, Funchal, 25-28 November 2002. Editors: C. Dinis da Gama & L. Ribeira e Sousa, Publ. Sociedade Portuguesa de Geotecnia, Av. do Brasil, 101, 1700-066 Lisboa, Portugal. pp. 3 – 32.
deeper in the rock mass. Whether the spacing of the second joint set (337/48) is taken as 15 or 5 m does not make a difference for the calculation of the reference rock mass nor for the probability of the slope stability. The SSPC classification, and the limiting-equilibrium and numerical analyses show that this slope was prone to failure. The limiting-equilibrium and numerical analyses show instability if the friction angle along the bedding planes is less than about 37° to 38° without water pressures. This is the friction angle resulting from the SSPC system.
The most likely explanation for this failure after 40 years, is therefore that the slope always had a stability almost unity. However, the weathering over the years caused a very slight decrease in the shear strength of the bedding plane, reducing its shear strength slightly. The final trigger for failure may have been water, but with water pressures considerably smaller than associated with a fully filled up discontinuity. Also it is likely that water caused a softening of the infill material in the bedding plane and acted as lubricating agent in the discontinuity.
Example III. Non discontinuity related failure in a 4 year old slope in Carboniferous slate Example III illustrates the use of the SSPC system for the stability of a slope which stability is not directly related to the orientation of discontinuities and slope.
Fig. 12. Example III. The slope in April 1995 after the main failure of April 1992 and the partial failure of the top part of the slope (the terrace on the left is the old road).
The slope (Fig. 12, cross-section Fig. 13) is cut in Carboniferous light to dark grey, argillaceous, narrow to very thinly spaced cleavage, very closely jointed, small tabular, slightly weathered slate, moderately strong, impermeable except along joints and open cleavage planes. The well developed cleavage is folded resulting in variations in dip but its strike is about constant. The cleavage plane is highly irregular and dips about 41° in the bottom part of the slope and 60° at the top part; both towards the road. The average dip of the cleavage plane is about 46°. Orientations of the joint planes in this slope are also influenced by folding. There is no significant infill material to be found in the cleavage discontinuities nor in the joint discontinuities except for a 5 cm thick gouge type of infill found in an approximately horizontal

ISRM EUROCK’2002, Portugal, Madeira, Funchal, 25-28 November 2002 page 25 of 32
Keynote Lecture. Proc. ISRM EUROCK’2002, Portugal, Madeira, Funchal, 25-28 November 2002. Editors: C. Dinis da Gama & L. Ribeira e Sousa, Publ. Sociedade Portuguesa de Geotecnia, Av. do Brasil, 101, 1700-066 Lisboa, Portugal. pp. 3 – 32.
joint discontinuity set with a spacing of about 1 m. The bedding is about parallel to the cleavage at locations where visible, however, the bedding is almost completely overprinted by the cleavage and of no importance for the stability of the slope. Some cleavage and joint surfaces are very slightly weathered and locally stained.
slid
road
Fig. 13. Example III. Geometrical cross section of the slope. Situation in april 1992 after the main failure occurred.
The slope was excavated in 1989 during the construction of the new road alignment and the slope has been cut at about 70° (comparable to the situation on the left in Fig. 12). In April 1992 the slope failed. The slope face after failure has a highly irregular surface. The overall dip of the slope became about 53° with a slope dip of 41° in the lower part of the slope, 46° in the middle part and 57° towards the top of the slope. The upper part of the slope became undercut and in 1995 also the undercut top part of the slope partially failed reducing the overall slope dip to about 45°. Visually assessed the slope is now expected to be stable, although some minor blocks which are undercut and not fully supported, or which have already moved during the forgoing slides are expected to fall in the near future. The night before the main failure occurred (April 1992) it had been raining and a very small amount of snow had fallen. The actual temperature had probably not been below zero at ground level.
This slope has been analysed by a limiting-equilibrium method and numerically in two dimensions with some simplifications. Samples for UCS and shearbox testing have been sawn out of the rock and a detailed survey of the topography of the slope has been carried out. The SSPC classification, limiting-equilibrium and numerical calculations come to the same result: the original slope dip of approximately 70° was unstable. According to the SSPC system the slope was too high for a slope dip of 70° while none of the discontinuities was the cause for sliding or toppling instability. This is in contradiction to the limiting-equilibrium and numerical analyses which both show that sliding instability can occur. However, the sliding is only possible if the friction angle along the discontinuity planes is lower than the friction angles determined from testing and considerably lower than friction angles determined with the ‘sliding criterion’ of the SSPC system, or if is assumed that high water pressures existed in the slope at the time of failure. Although water pressures are not the sole reason for the failure, the presence of water will have had a negative influence on the stability. Water will have caused a softening of the infill material in the joint with the gouge infill, will have lubricated all discontinuities, and will have created some, however, very limited, pressures in the discontinuities. Additionally the little bit of snow in April 1992 will have caused a (very) little additional weight on the slope. The reason for failure of the slope is likely that the rock mass as a whole has not been able to sustain the stresses in the rock mass caused by excavation the slope with a dip of 70°. After the excavation of the slope the new stress situation in the rock mass

ISRM EUROCK’2002, Portugal, Madeira, Funchal, 25-28 November 2002 page 26 of 32
Keynote Lecture. Proc. ISRM EUROCK’2002, Portugal, Madeira, Funchal, 25-28 November 2002. Editors: C. Dinis da Gama & L. Ribeira e Sousa, Publ. Sociedade Portuguesa de Geotecnia, Av. do Brasil, 101, 1700-066 Lisboa, Portugal. pp. 3 – 32.
caused a progressive weakening by breaking pieces of intact rock, small movements along existing discontinuities, opening of cleavage planes and existing joints and possibly forming of tension joints. This progressive weakening of the rock mass continued until in April 1992 the water and snow triggered the already weakened rock mass to fail. 5.2 Saba
A geomechanical analysis of a landslide (Fig. 15) in pyroclastic deposits in the harbour of Fort Bay, Saba, Dutch Antilles, was carried out to calculate the risk of new landslides and in order to advise local authorities on practical measures to improve safety (Rijkers & Hack, 2000). Calculations with the SSPC system and laboratory testing were done on the slopes along the harbour. The calculated SSPC rock mass cohesion of 39kPa coincides with the measured laboratory value of 40kPa. The natural angle of internal rock mass friction is comparable with the SSPC weathered rock mass friction. The stability probability is calculated with reconstructed slope heights before the landslide and stability decreases from 95 % at 10 m to 25 % at 15 m. The stability is clearly dependant on the height of the slope and is in perfect agreement with field observations as the maximum possible height calculated with the SSPC system comes to 13 m for a 50 % probability, while the failure occurred in a slope of about 12.5 m.
Fig. 14. Landslide in the harbour of Fort Bay of February 1997
5.3 Philippines
In the city of Manila, Philippines, slopes are failing that are the foundation for houses on top (Fig. 15). The slopes are neither high, about 5 m, nor spectacular, however, for the house owners failure of the support of the foundations is obviously very inconvenient. The slopes are near vertical in tuff layers separated by weathering horizons. Two steeply dipping approximately vertical to each other, sets of discontinuities are present. The height of the slopes

ISRM EUROCK’2002, Portugal, Madeira, Funchal, 25-28 November 2002 page 27 of 32
Keynote Lecture. Proc. ISRM EUROCK’2002, Portugal, Madeira, Funchal, 25-28 November 2002. Editors: C. Dinis da Gama & L. Ribeira e Sousa, Publ. Sociedade Portuguesa de Geotecnia, Av. do Brasil, 101, 1700-066 Lisboa, Portugal. pp. 3 – 32.
is about 5 m. Analyses of the slopes with the SSPC system resulted in a 50 % probability of stability for a slope height of about 7 m. No failure following SSPC was anticipated along the steeply dipping discontinuity sets as these were either not day-lighting or are forming the slope face. The photo clearly shows that the slope at the corner is failing and that if no remedial measures are taken it will be a matter of time before the slope and foundation will collapse. The 7 m height from the SSPC system is remarkable in agreement with reality as is taken into account that at the corner the stress configuration is more unfavourable than in a straight slope face.
Fig. 15. Failing slope in Manila
6. DISCUSSION & FUTURE
The SSPC system does certainly not solve all problems inherent to classification systems for slope stability, however, it solves a series of the problems with parameters and parameter influence. Remaining problems are, for example, slopes in rock masses with a deformable intact rock material, the stability of slopes in rock masses that are subject to external stresses, such as tectonic stresses or stresses induced by a (large) hill or mountain behind the investigated slope, and slopes that are unstable due to buckling. Other problems are the definition of the geotechnical units and the future degradation of rock masses.
Much work has been done on trying to define the homogeneity or inhomogeneity of a soil or rock mass. The homogeneity definition is of imminent importance for the definition of the geotechnical units and as described before any form of slope stability analyses has to be done per geotechnical unit. The definition of the unit is left, however, to the engineering expertise of the design engineer. An objective method to establish homogeneity and subsequently geotechnical units would clearly be a large advantage. By hand, for example, with a scan line or by interpretation of stereo terrestrial photos, it is possible to quantify in detail the number and orientation of discontinuities, however, it is very tedious work. Digital scanning of exposures by Lidar as is presented in this conference by Slob et al. (2002), show that it is possible to determine the homogeneity of a rock mass by Lidar in a far more automated way. Fig. 16 shows

ISRM EUROCK’2002, Portugal, Madeira, Funchal, 25-28 November 2002 page 28 of 32
Keynote Lecture. Proc. ISRM EUROCK’2002, Portugal, Madeira, Funchal, 25-28 November 2002. Editors: C. Dinis da Gama & L. Ribeira e Sousa, Publ. Sociedade Portuguesa de Geotecnia, Av. do Brasil, 101, 1700-066 Lisboa, Portugal. pp. 3 – 32.
an example of a digitally scanned rock exposure with Lidar. The digital scanning can be used directly to quantify number and orientation of discontinuities, and probably also the shear friction properties.
unit 1
unit 2
unit 3
Fig. 16. Rendered image of an exposure scanned with Lidar (modified after Slob et al, 2002, acknowledged are Roger Moore of 3D Scan - A Cyrax Service Provider, and Jerry Higgins, Colorado
School of Mines, USA, for providing the image)
No reliable expressions exist to forecast quantitatively the geotechnical behaviour of a soil or rock mass in the future during the engineering lifetime of a slope, say 50 to 100 years. Temporal relations have been defined for the strength and weathering of intact rock as building and grave stones, and for the weathering and erosion of a soil or rock mass over geological times, more than a couple of 1000s of years, but not for 50 to 100 years. The obviously very important parameter is therefore left to the engineering guess of the designing engineer. Research to try to quantify future degradation of a mass in time is presented in this conference (Huisman & Hack, 2002). Fig. 17 shows a (small) slope in Keuper marls with thin beds of limestone, Fig. 18 shows the profile of the decrease in dip of the slope in time due to weathering, erosion, and ravelling of the slope material.
7. CONCLUSIONS
Rock mass classification has established itself as a useful tool for the slope design engineer besides other tools as numerical and analytical calculations. However, the legacy inherited from systems developed decades ago and for other purposes than slope stability may not be the most suitable systems for the present. A major point in systems developed before computers became easily available was the required simplicity of the calculations as these should preferably be possible on site in the field without too much effort. Nowadays this is no concern anymore as everybody can calculate complicated calculations on a laptop or palmtop computer on site in the field. More sophisticated calculations allow for uncertainty approaches as shown in this article, but also for more elaborate calculations of parameters. Another legacy is inherited properties and parameters that are often more suited for underground excavations than for surface

ISRM EUROCK’2002, Portugal, Madeira, Funchal, 25-28 November 2002 page 29 of 32
Keynote Lecture. Proc. ISRM EUROCK’2002, Portugal, Madeira, Funchal, 25-28 November 2002. Editors: C. Dinis da Gama & L. Ribeira e Sousa, Publ. Sociedade Portuguesa de Geotecnia, Av. do Brasil, 101, 1700-066 Lisboa, Portugal. pp. 3 – 32.
applications such as slopes. The repeatability and reliability of the classifications may also be a problem because parameters are difficult or impossible to determine. An often-asked question is what is the best system? Each developer will have the tendency to answer that his or her system is the best. However, we, as designers, should probably be claiming less and recognise that newer systems are generally better because these are designed based on the experiences achieved with the older systems.
Fig. 17. Slope in Keuper marls
1.0
1.5
2.0
2.5
3.0
3.5
7.0 7.5 8.0 8.5 9.0 9.5
y [m]
z [m
]
Excavated 1999 May 2001 May 2002
Fig. 18. Reduction in slope angle due to weathering, erosion and ravelling of the slope of Fig. 17

ISRM EUROCK’2002, Portugal, Madeira, Funchal, 25-28 November 2002 page 30 of 32
Keynote Lecture. Proc. ISRM EUROCK’2002, Portugal, Madeira, Funchal, 25-28 November 2002. Editors: C. Dinis da Gama & L. Ribeira e Sousa, Publ. Sociedade Portuguesa de Geotecnia, Av. do Brasil, 101, 1700-066 Lisboa, Portugal. pp. 3 – 32.
REFERENCES Abelin H., Birgersson L., Ågren T, Neretnieks I. & Moreno L. (1990). Results of a channelling experiment
in Stripa. GEOVAL, Symp. on Validation of Geosphere Flow and Transport models. OECD Nuclear Energy Agency. pp. 14 - 17.
Barton N.R., Lien R. & Lunde J. (1974). Engineering classification of rock masses for the design of tunnel support. Rock Mechanics. 6 publ. Springer Verlag. pp. 189-236.
Barton N.R. (1976). Recent experiences with the Qsystem of tunnel support design. Pro. Symp. on Exploration for Rock Engineering. Johannesburg. ed. Bieniawski. publ. Balkema, Rotterdam. pp. 107-117.
Barton N.R. (1988). Rock Mass Classification and Tunnel Reinforcement Selection using the Q-system. Proc. Symp. Rock Classification Systems for Engineering Purposes, ASTM Special Technical Publication 984. ed. Louis Kirkaldie. publ. American Society for Testing and Materials, Philadelphia. pp. 59-88.
Bear J., Chin-Fu Tsang & Marsily G. de. (eds) (1993). Flow and Contaminant Transport in Fractured Rock. publ. Academic Press, Inc., San Diego. 560 pp.
Bieniawski Z.T. (1976). Rock mass classifications in rock engineering. Proc. Symp. on Exploration for Rock Engineering. Johannesburg. ed. Bieniawski. publ. Balkema, Rotterdam. pp. 97 - 106.
Bieniawski Z.T. (1989). Engineering Rock Mass Classifications. publ. Wiley, New York. 251 pp. Cording E.J. & Deere D.U. (1972). Rock tunnel supports and field measurements. Proc. Rapid Excavation
Tunnelling Conf. Chicago. AIME, New York. pp. 601 - 622. Deere D.U., Hendron A.J., Patton F.D. & Cording E.J. (1967). Design of surface and near surface
constructions in rock. Proc. 8th U.S. Symp. Rock Mechanics. ed. Fairhurst. publ. AIME, New York. pp. 237 - 302.
Deere D.U.& Deere D.W. (1988). The RQD index in practice. Proc. Symp. Rock Class. Engineering Purposes, ASTM Special Technical Publications 984, Philadelphia. pp. 91 - 101.
Deere D.U. (1989). Rock quality designation (RQD) after twenty years. U.S. Army Corps of Engineers Contract Report GL-89-1. Waterways Experiment Station, Vicksburg, MS, 67.
Eissa E.A. & Sen Z. (1991). Fracture simulation and multi-directional rock quality designation. Bull. Assoc. Engineering Geologists. 28 (2). pp. 193 - 201.
Gama C. Dinis da (1989). Analysis of marble fractures induced by stress concentrations at quarries. Proc. Int. Cong. on Geoengineering, Torino. 2. pp. 805 - 810.
Gama C. Dinis da (1994). Variability and uncertainty evaluations for rock slope design. Proc. 1st North American Rock Mechanics Symp, Austin, Texas. publ. Balkema, Rotterdam. pp. 547 - 555.
Genske D.D. & Maravic H. von (1995). Contaminant transport through fractured rocks: The state of play. Proc. 8th Cong. on Rock Mechanics. ISRM. Tokyo, Japan. publ. Balkema, Rotterdam. pp. 799 - 801.
Hack H.R.G.K. (1998). Slope stability probability classification, SSPC. 2nd edition. publ. ITC, Enschede, The Netherlands. ISBN 90 6164 154 3. 258 pp.
Hack R., Price, D. & Rengers N. (2002a). A new approach to rock slope stability - a probability classification (SSPC). Bulletin of Engineering Geology and the Environment. Springer Verlag. article: DOI 10.1007/s10064-002-0155-4 & erratum: DOI 10.1007/s10064-002-0171-4 (printed-on-line, paper in print)
Hack R., Alkema D., Kruse G., Leenders N., & Luzi L. (2002b) Influence of earthquakes on the stability of slopes. Journal of Engineering Geology. special issue. (submitted for publication)
Hack R. & Huisman M. (2002). Estimating the intact rock strength of a rock mass by simple means. Proc. 9th Congress of the International Association of Engineering Geology and the Environment, Durban, Republic of South Africa.
Haines A. & Terbrugge P.J. (1991). Preliminary estimation of rock slope stability using rock mass classification systems. Proc. 7th Cong. on Rock Mechanics. ISRM. Aachen, Germany. 2, ed. Wittke W. publ. Balkema, Rotterdam. pp. 887-892.
Hakami E. (1995). Aperture distribution of rock fractures. Doctoral Thesis. Division of Engineering Geology, Dept. of Civil and Environmental Engineering, Royal Inst. of Technology. Stockholm, Sweden. 106 pp.

ISRM EUROCK’2002, Portugal, Madeira, Funchal, 25-28 November 2002 page 31 of 32
Keynote Lecture. Proc. ISRM EUROCK’2002, Portugal, Madeira, Funchal, 25-28 November 2002. Editors: C. Dinis da Gama & L. Ribeira e Sousa, Publ. Sociedade Portuguesa de Geotecnia, Av. do Brasil, 101, 1700-066 Lisboa, Portugal. pp. 3 – 32.
Hoek E., Wood D. & Shab S. (1992). A modified Hoek-Brown criterion for jointed rock masses. Proc. EUROCK'92. ed. J.A. Hudson. publ. Thomas Telford. pp. 209 - 214.
Hoek E., Read J., Karzulovic A. & Chen Z.Y. (2000) Rock slopes in civil and mining engineering. Proc. GeoEng2000, Melbourne. cd-rom.
Hudson J.A. (1992). Rock Engineering Systems. publ. Ellis Horwood Ltd., England. 185 pp. Huisman, M. & Hack H.R.G.K. (2002) Quantifying slope stability decrease in engineering lifetimes using
a bootstrap percentile approach. Proc Eurock 2002 - I.S.R.M. International Symposium on Rock Engineering for Mountainous Regions, Madeira, Portugal.
ISRM (1978). Suggested methods for the quantitative description of discontinuities in rock masses. Int. Journal Rock Mechanics, Mining Sciences & Geomechanical Abstr. 15, pp. 319 - 368.
ISRM (1981). Rock Characterization, Testing and Monitoring, ISRM suggested methods. ed. E.T. Brown. publ. Pergamon Press, Oxford. 211 pp.
Laubscher D.H. (1990). A geomechanics classification system for rating of rock mass in mine design. Journal South African Inst. of Mining and Metallurgy. 90, No. 10, pp. 257-273.
Mazzoccola D.F. & Hudson J.A. (1996). A comprehensive method of rock mass characterization for indicating natural slope instability. Quarterly Journal of Engineering Geology. 29. pp. 37 - 56.
Nathanail C.P., Earle D.A. & Hudson J.A. (1992). A stability hazard indicator system for slope failures in heterogeneous strata. Proc. Symp. ISRM EUROCK'92. Chester, UK. ed. Hudson J.A. publ. British Geotechnical Society, London.
Neretnieks I., Eriksen T. & Tähtinen P. (1982). Tracer movement in a single fracture in granitic rock: some experimental results and their interpretation. Water Resources Research. 18. pp. 849 - 858.
Neretnieks I., Abelin H., Birgersson L., Moreno L., Rasmussen A. & Skagius K. (1985). Chemical transport in fractured rock. Proc. Advances in Transport Phenomena in Porous Media. Nato Advanced Study Institute, Newmark, Delaware. pp. 474 - 549.
Palmstrøm A. (1975). Characterization of degree of jointing and rock mass quality. Internal Report. Ing.A.B. Berdal A/S, Oslo, pp. 1 - 26.
Rasmussen T.C. & Evans D.D. (1987). Meso-scale estimates of unsaturated fractured rock fluid flow parameters. Proc. 28th US Symp. on Rock Mechanics. Tuscon. eds Farmer I.W., Daemen J.J.K. & Desai C.S. publ. Balkema, Rotterdam. pp. 525 - 532.
Rijkers R. & Hack R. (2000) Geomechanical analysis of volcanic rock on the island of Saba (Netherlands Antilles). Proc. GeoEng2000, Melbourne. cd-rom.
Robertson A.M. (1988). Estimating weak rock strength. AIME - SME Annual meeting. Phoenix, AZ. Romana M. (1985). New adjustment rating for application of the Bieniawski classification to slopes. Proc.
Int. Symp. Rock Mechanics Mining Civ. Works. ISRM, Zacatecas, Mexico. pp 59-63. Romana M. (1991). SMR classification. Proc. 7th Cong. on Rock Mechanics. ISRM. Aachen, Germany. 2.
ed. Wittke W. publ. Balkema, Rotterdam. pp. 955-960. Romana, M. (1995). "The geomechanical classification SMR for slope correction. Proc. 8th Int. Congress
Rock Mechanics, ISRM, Tokyo, Vol. 3, pp. 1085-1092 Rudledge J.C. & Preston R.L. (1978). Experience with engineering classifications of rock. Proc. Int.
Tunnelling Symp. Tokyo. pp. A3:1 - 7. Selby M.J. (1980). A rock mass strength classification for geomorphic purposes: with tests from
Antarctica and New Zealand. Zeitschrift für Geomorphologie. 23. pp. 31-51. Selby M.J. (1982). Hillslope materials and processes. publ. Oxford University Press, Oxford. 264 pp. Sen Z. (1992). Rock quality charts based on cumulative intact lengths. Bull. Assoc. Engineering
Geologists. 29 (2). pp. 175 - 185. Slob S., Hack H.R.G.K., & Turner A.K. (2002) An approach to automate discontinuity measurements of
rock faces using laser scanning techniques. Proc. Eurock 2002 – Madeira. Shuk, T. (1994). Key elements and applications of the natural slope methodology (NSM) with some
emphasis on slope stability aspects. Proc. 4th South American Congr. on Rock Mechanics. Santiago de Chile. pp. 255-266.
Terzaghi R.D. (1965). Sources of error in joint surveys. Geotechnique. (15). publ. The Institution of Civil Engineers, London. pp. 287-304.

ISRM EUROCK’2002, Portugal, Madeira, Funchal, 25-28 November 2002 page 32 of 32
Keynote Lecture. Proc. ISRM EUROCK’2002, Portugal, Madeira, Funchal, 25-28 November 2002. Editors: C. Dinis da Gama & L. Ribeira e Sousa, Publ. Sociedade Portuguesa de Geotecnia, Av. do Brasil, 101, 1700-066 Lisboa, Portugal. pp. 3 – 32.
Vecchia O. (1978). A simple terrain index for the stability of hillsides or scarps. Large Ground Movements and Structures. ed. J.D. Geddes. publ. Pentech Press Ltd. pp. 449 - 461.
Yufu Z. (1995). Principal conversion methods for rock mass classification systems used at home and abroad. Bull. Int. Assoc. Engineering Geologists. 51. pp. 81 - 88.