Embed Size (px)
Citation preview
J a n u a r y 2 0 1 8
_______________________________________________________________________
THIS PAPER IS ONLINE AT
https://www.brookings.edu/research/an-evaluation-of-
the-cpi-indexes-for-prescription-drugs/
An Evaluation of the CPI Indexes for Prescription Drugs
Barry Bosworth
The Brookings Institution
John Bieler
Bureau of Labor Statistics
Michael Kleinrock
IQVIA Institute for Human Data Science
Eric Koepcke
The Brookings Institution
Ernst R. Berndt
Massachusetts Institute of Technology
January 22, 2018

_________________________________________________________________________________________________________
A n E val uat io n o f t he CPI In dexes fo r Presc riptio n Drug s 2
E C O NO MI C STU D I E S A T B ROO KI NG S
Contents
Abstract ............................................................................................................................................................ 3
Statement of Independence ............................................................................................................................. 3
Introduction ..................................................................................................................................................... 4
CPI for Prescription Drugs .............................................................................................................................. 5
PPI for Prescription Drugs .............................................................................................................................. 7
IQVIA Data ....................................................................................................................................................... 8
Data Analysis ................................................................................................................................................... 9
Aggregate Indexes .................................................................................................................................. 10
Disaggregated Price Indexes ................................................................................................................... 12
Conclusion ....................................................................................................................................................... 12
References ....................................................................................................................................................... 14
Tables and Figures .......................................................................................................................................... 15

_________________________________________________________________________________________________________
A n E val uat io n o f t he CPI In dexes fo r Presc riptio n Drug s 3
E C O NO MI C STU D I E S A T B ROO KI NG S
ABSTRACT
We compare the prescription drug data of the Consumer Price Index with a large alternative data set from the IQVIA Institute for
Human Data Science. We analyze the overall consistency if the data from the two sources, and examine the influence of the shift
from brand to generic drug sales and the increased reliance on third party insurance plans that are excluded from the CPI sampling
frame.
STATEMENT OF INDEPENDENCE
This research was supported by the National Institute of Aging of the National Institutes of Health under grant number R01
AG043560 to the National Bureau of Economic Research. The analysis was conducted with restricted access to Bureau of Labor
Statistics (BLS) data, but the views expressed do not necessarily reflect those of the BLS. Any opinions expressed herein are those
of the authors and do not necessarily represent the views of the National Institutes of Health, the Bureau of Labor Statistics, IQVIA
Institute for Human Data Science, the National Bureau of Economic Research, or the Brookings Institution. All results have been
reviewed to ensure that no confidential information is disclosed.

_________________________________________________________________________________________________________
A n E val uat io n o f t he CPI In dexes fo r Presc riptio n Drug s 4
E C O NO MI C STU D I E S A T B ROO KI NG S
INTRODUCTION
The prescription drug components of the Consumer Price Index (CPI) and the Producer Price Index (PPI)
measure recent and historical drug price inflation, and provide the basis for projecting future price trends
and health care expenditures. They also serve as important inputs in the construction of the National
Health Accounts. However, there are concerns about the adequacy of these price indexes in light of recent
changes in the structure of the market for prescription drugs. To begin with, there has been a large
growth in the reliance on generics as Medicare Part D and private insurance have increased the financial
incentives to adopt generics. In 2016, it was estimated that unbranded generics accounted for 85 percent
of drug prescriptions, compared with 50 percent in 2005.1 With an unprecedented number of major drugs
coming off patent in recent years, mismeasurement in the timing and the extent of the transition to
generics could have large consequences.
Furthermore, the BLS’s ability to obtain price quotes for the CPI program has been affected by the
shift to prescription drug insurance coverage by public and private third-party payers (TPPs). These
electronic transactions require information on the identity of the TPP, the beneficiary’s identification
number, and specific provisions of the benefit plan, such the copayment rate, information that the
pharmacy cannot provide to BLS field staff. As a result, BLS must rely disproportionately on cash
transactions that comprise only about seven percent of the retail market, raising concerns about the
extent to which they are representative of the overall drug market.2
This paper describes an exercise in which we compare the measures of prescription drug prices
reported in the CPI and PPI programs with indexes computed from an alternative set of price data
compiled by the IQVIA Institute for Human Data Science (IQVIA). There are some fundamental
differences in that the CPI aims to measure only the out-of-pocket costs to consumers and the BLS does
not have full access to retail transactions that are embedded in prescription drug plans. The analysis is
thereby limited to a comparison with the cash transactions of the IQVIA data. The PPI is restricted to
drugs produced within the United States, excluding imports from both other countries and Puerto Rico, a
distinction that is not identified in the IQVIA data. Thus, the analysis is largely limited to a comparison of
the CPI data with that of IQVIA.
This paper begins with a description of the basic methodology that is used by the BLS in the
construction of the CPI and PPI price indexes. It is followed by an explanation of the prescription drug
data from IQVIA. The focus of our exercise is on a comparison of the monthly data from the files of the
CPI with corresponding data from IQVIA covering a 5-year period of 2009 to 2013. We construct parallel
price indexes from the BLS and IQVIA data for the aggregate of all prescription drugs and for a set of
. . .
1. https://www.statista.com/statistics/205042/proportion-of-brand-to-generic-prescriptions-dispensed/
2. A recent overview of the major issues involved in the construction of price indexes for pharmaceuticals is provided by Aizcorbe
and Nestoriak (2012). See also Berndt and others (2000). A discussion of the evolution of the drug market in response to
passage of the 1984 Waxman-Hatch Act is available in Berndt and Aitkin (2011).

_________________________________________________________________________________________________________
A n E val uat io n o f t he CPI In dexes fo r Presc riptio n Drug s 5
E C O NO MI C STU D I E S A T B ROO KI NG S
subcomponents. In the aggregate, we find the increase in the IQVIA index substantially exceeds that of
the CPI, and the difference remains when the comparison is restricted to a matched set of prescription
drugs. In the analysis of the component indexes, we find that the discrepancy between the IQVIA and CPI
is heavily concentrated in two therapeutic categories of cardiovascular-renal and skin/mucous
membranes. The differences are surprising because the two data sets appear to contain a similar
distribution of drug sales.
CPI for Prescription Drugs
Prescription drugs accounted for 10 percent of U.S. national health expenditures in 2015. However, the
portion of those costs that are paid directly and recorded as direct out-of-pocket costs to consumers has
fallen dramatically, from 82 percent in 1970 and 28 percent in 2000 to 14 percent in 2015.3 Health
insurance now accounts for about 85 percent of the payments, and since the introduction of the Medicare
Part D in 2006, the private insurance share has fallen to about 40 percent. All the same, the relative
importance of prescription drugs has continued to rise in the CPI, from 0.86 percent in December of 2000
to 1.38 percent in December of 2015.
In most respects, the calculation of the price index for prescription drugs follows a standard
procedure used for all goods and services in the Consumer Price Index (CPI). This paper begins with a
very brief outline of the most relevant portions of the process used in the construction of the CPI before
reporting on the specifics of the analysis of drug prices.4
Overall CPI Methodology. The CPI is calculated in two stages. The first stage involves the
computation of 8,018 basic indexes for 38 individual urban or metropolitan areas of the United States and
211 product categories. The weights for the first stage are derived from the construction of local outlet-
based sampling frames by item and area. The weights for the second stage are derived from biennial
updates of the Consumer Expenditure Survey. Prescription Drugs is one of the 211 product categories
(item strata) and is the lowest level at which a published index is computed; i.e., therapeutic class-specific
CPIs are not computed or published by the BLS.
Price information is gathered within a larger number of 87 geographical areas called primary
sampling units (PSUs). In addition, the 211 product categories are expanded to 305 entry-level items
(ELIs) which are the ultimate sampling units. BLS conducts household point-of-purchase (POPS)
telephone surveys in the PSUs to develop a sample list of outlets within which specific ELIs will be priced
for inclusion in the CPI. The selection of specific items within an outlet-ELI combination is based on a
probability-proportionate-to-sales sampling procedure using sales of the items within the outlet. Once
selected, individual items are repriced on a monthly or bimonthly basis. Approximately a quarter of the
. . .
3. National Health Accounts, 2016, table 16; available at: https://www.cms.gov/research-statistics-data-and-systems/statistics-
trends-and-reports/nationalhealthexpenddata/nationalhealthaccountsprojected.html.
4. A more detailed discussion is available at: http://www.bls.gov/opub/hom/pdf/homch17.pdf.
_________________________________________________________________________________________________________
A n E val uat io n o f t he CPI In dexes fo r Presc riptio n Drug s 6
E C O NO MI C STU D I E S A T B ROO KI NG S
items and outlets within each sample PSU are rotated out each year. BLS field representatives visit about
26,400 outlets each month and collect prices on 85,000 items. Items whose prices are most volatile, such
as food at home, energy, and telephone services, are collected on a monthly basis. In addition, all survey
items in New York, Chicago and Los Angeles are priced monthly. All other items in other PSUs are priced
bimonthly, spread equally across even and odd-numbered months.
The processing of the monthly price data involves the calculation of a price relative for each of the
basic indexes. Prior to 1999, the construction of the price relatives utilized a Laspeyres index formula
(that is a ratio of a weighted arithmetic mean of prices in the current period to the same average of prices
in the prior period, using fixed quantity weights). In 1999, the calculation of the price relatives for most
basic indexes was converted to a geometric mean formula using fixed expenditure shares as weights,
implying that consumers will alter their purchases to offset a portion of the price increase, albeit only
within a narrow item-area category.
Prescription Drugs. The prescription drug index is a first-stage basic index within the CPI, and its
calculation follows the standard process of first conducting a telephone POP survey within each PSU to
construct a panel of retail pharmacies and their share of consumer prescription purchases. The sampling
frame of potential outlets includes stand-alone pharmacies, those associated with grocery stores and other
retail establishments, and internet-based pharmacies.5 Individual outlets rotate out of the sample on a
four-year replacement cycle. Second, a sampling frame is constructed within each outlet, based on the
revenue obtained from the last 20 prescriptions dispensed at the outlet. The probability of a specific
drug’s selection is thus proportionate to its share of total revenues generated by the last 20 prescriptions
reflecting both its relative frequency of being prescribed and its cost per prescription. Typically, 4-6
prescriptions are selected for sampling within each outlet.
The calculation of the prescription drug price index is similar to that of other components of the CPI
in using geometric weights derived from the initial area surveys. The weight of prescription drugs in the
overall CPI is based on the Consumer Expenditures Survey of households, and the survey plays a small
role in the construction of the basic prescription drug index through the aggregation across areas. New
drugs are introduced into the index as part of the regular rotation of outlets and the selection of the item-
sampling frame for the outlet. No effort is made to measure the quality-adjusted price of the new drug;
thus, its price change in the introductory month is implicitly equivalent to the average change for other
prescription drugs within the PSU. Effectively, the difference in the price of new and incumbent goods is
assumed to be a measure of the market’s valuation of the quality differences in the goods, and it is linked
out of the index.
Generics. The CPI, however, does incorporate a special adjustment at the time that a brand name
drug loses it exclusivity and faces new competition with the introduction of new generic drugs that are
frequently offered with deep discounts.6 A generic drug is a pharmaceutical drug that is equivalent to a
. . .
5. The CPI includes vaccines and biologics, but it excludes the costs of administering a vaccine. Prescription drugs that are
administered in a hospital setting and billed by the hospital as a component part of a larger service are not included in the
prescription drug index, but are included as part of the price index for hospital services.
6. Exclusivity is distinct from a patent as they are granted under different authorities and may not run concurrently.

_________________________________________________________________________________________________________
A n E val uat io n o f t he CPI In dexes fo r Presc riptio n Drug s 7
E C O NO MI C STU D I E S A T B ROO KI NG S
brand-name product in dosage, strength, route of administration, quality, performance, and intended use.
Most commonly, a generic is judged to be comparable to the branded version if both are based on the
same molecule, strength and formulation.
The introduction of generics drugs creates a significant problem for the CPI because the first
appearance of a generic would normally be treated as a new good, and under the standard practice there
would be no price change in the introductory month (Griliches and Cockburn, 1994).7 Yet, nearly all of
the change in the price of a molecule occurs with the first appearance of the generic. The price of the
brand often stays the same or actually increases after it loses its exclusivity--the producer of the branded
drug frequently introduces its own generic rather than reduce the price of the branded version with strong
consumer recognition. Hence, were the standard procedure of the CPI to be applied, nearly all of the price
change involved in the transition to the generic would be linked out in the computation of the index. In
addition, there is a rapid rise in the generic’s penetration of the market that is not captured after its
introduction into the sample.
Within the prescription drug series of the CPI, the introduction of a new generic quote is handled by
linking the new generic to the old brand with a special code that declares the two series to be comparable.
Hence, in the introductory month, the new generic has a price change equal to the difference between the
prior value of the branded and the new generic.
The Washington BLS office keeps track of drugs going off patent and sends a message, roughly six
months after patent expiration, to the field agents outlining the procedure to check for the introduction of
a generic. The agents ascertain if a generic has been introduced at the outlet; and, if so, the shares of
generic and branded prescriptions in the prior three months are used to compute relative weights. The
six-month delay is designed to give the newer generics an opportunity to build market share. The relative
weights are used in a proportionate random draw to give the generic versions a one-time chance for
inclusion in future months. The choice between the new generic and the branded version is done once and
remains the same for the remainder of the life of the quote.
PPI for Prescription Drugs
The PPI measures the change over time in the prices received by domestic producers of goods and
services.8 The PPI derives its weighting mostly from the value of shipments as reported in the Census
. . .
7. See Cleeton, Goepfrich, and Weisbrod (1992) and Aizcorbe and Nestoriak (2012) for their discussions of the complexity of
issues associated with the introduction of a new drug.
8. Importantly, the PPI excludes pharmaceuticals produced in Puerto Rico from its definition of domestic production despite the
island’s role as a primary production location of U.S. drug companies. The value added of pharmaceuticals in Puerto Rico is
equal to about 17 percent of the domestic production. Unfortunately, Puerto Rico is also excluded from the Import Indexes
where it is treated as part of the United States. Pharmaceuticals manufactured and exported from Puerto Rico are included in
the International Price Program (IPP) index for exports.

_________________________________________________________________________________________________________
A n E val uat io n o f t he CPI In dexes fo r Presc riptio n Drug s 8
E C O NO MI C STU D I E S A T B ROO KI NG S
Bureau’s 5-year economic census.9 The PPI includes sales to wholesalers, or directly to retailers, long-
term care facilities, hospitals, and other outlets. This contrasts with the pharmaceutical component of CPI
that measures price change from the perspective of consumers. Pharmaceutical preparations have their
own commodity class (0638), and are disaggregated further into eight therapeutic classes, providing more
published detail than the CPI.
Following Census classification, the PPI has the manufacturing of active pharmaceutical ingredients
fall under NAICS 325411 Medicinal and Botanical Manufacturing, while the manufacturing of the final
dosage form of small molecules (discussed above) falls under NAICS 325412 Pharmaceutical Preparations
Manufacturing. Large molecule biologics such as vaccines, toxoids, and culture media of plant of animal
origin are classified in NAICS 325414 Biological Product (except Diagnostic) Manufacturing. To the
extent that injectable vaccines and biologics are administered in outpatient clinics and physicians’ offices,
but are not dispensed at retail, the set of transactions captured by the various BLS PPIs and the IQVIA
data (discussed in further detail below) do not fully overlap, making comparisons between the BLS PPIs
and IQVIA data problematic. Hence, in this research we focus most of our attention on comparison of the
CPI with the IQVIA data.
Within the PPI, surveyed products are selected with a probability-based sampling frame of firms that
participate in the Unemployment Insurance system. Surveyed firms are asked to report actual transaction
prices largely on a monthly basis by internet or mail. The price indexes are computed with a Laspeyres
formula. Individual reporting firms’ revenues are used to weight the indexes at the lowest level. At the
aggregate level, the indexes are combined using the product-line data of the economic censuses.
The procedures for pharmaceuticals deviate from this standard procedure by incorporating an annual
update of the commodity sample based on information in the Food and Drug Agency’s (FDA) Orange
Book. For those new drugs that are judged to be therapeutically equivalent to an existing drug, the weight
of preexisting drug is split between the old and new version based on relative sales revenue. The new
generic is linked into the price index in a fashion that includes any price difference between a branded
drug and its generic equivalent.10 Hence, the PPI incorporates the price change between a branded drug
and the first generic in a procedure with a similar outcome to that of the CPI.
IQVIA Data
The IQVIA National Prescription Audit data base tracks prescriptions dispensed at a nationally
representative sample of retail, mail order and long-term care pharmacies and is projected to an estimate
of total national prescriptions dispensed through these pharmacies on a monthly basis. We limit our
analysis to prescriptions dispensed at retail pharmacies, and focus on the 250 most prescribed molecules
(measured by number of prescriptions dispensed during May 2013). Individual records represent
. . .
9. The latest available economic census data is for 2012.
10. The methodology is discussed in Bureau of Labor Statistics (2011), and Kelly (1997).

_________________________________________________________________________________________________________
A n E val uat io n o f t he CPI In dexes fo r Presc riptio n Drug s 9
E C O NO MI C STU D I E S A T B ROO KI NG S
national totals and distinguish the month, the national drug code (NDC), age group of the patient, and
payment type. The distribution by payment type differentiates among Medicaid, Medicare, commercial or
other third party payer, and cash. Age refers to the age of the patient to whom the prescription was
dispensed, and only identifies those patients as over or under age 65 for about 80 percent of the sample.
The data cover the period from March of 2009 to October 2013. . In subsequent analysis, we refer to the
data file as IQVIA data. It includes about 7.5 million records and provides a more complete coverage of
retail drug transactions than the CPI file. The prescription price is computed as revenue divided by the
quantity for each record.
These IQVIA data reflect the perspective of the retail pharmacy, and prices measured at this point in
the distribution chain correspond closely to the retail prices that the U.S. Bureau of Labor Statistics
attempts to measure in constructing its monthly CPI Index for Prescription Drugs. The total revenue
received by the dispensing pharmacies is the sum of the customer’s copayment or coinsurance
contribution and the amount (if any) reimbursed to the dispensing pharmacy by the third party payers –
Medicare Part D insurer, Medicaid, or commercial or other third party payer. This pharmacy price
therefore includes reimbursement for the final dosage form of the active pharmaceutical ingredient, a
dispensing fee, and any customer copayment or coinsurance contribution. If the customer presents the
pharmacy with a coupon, the value of that coupon is attributed to the patient copayment or coinsurance
contribution; how well the IQVIA is able to capture coupon transactions is not publicly known. For our
purposes, however, it is important to note that this pharmacy price already includes margins realized by
wholesalers, pharmacies and any other distributors, and is therefore generally larger than the price (net of
rebates and discounts) received by the brand and generic manufacturers. These rebates and discounts
can be substantial, in some cases larger than the amount that consumers actually pay.
Data Analysis
The BLS maintains a data archive of the individual monthly quotes of the CPI. We have extracted data for
all of the prescription drug quotes of the CPI covering the months of 2009:3-2013:10, a period that aligns
with that of the data file provided by IQVIA. The CPI file is quite large, averaging about 952 price quotes
per month, and it includes a monthly average of 245 distinct molecules (overall, there are about 420
molecules, but less in a specific month). In some earlier work, BLS researchers found a match of about
85% of the CPI file with the top 250 molecules by total prescriptions (TRX) as supplied by IQVIA. We also
have a considerable number of characteristics for each price quote, but for our current purposes we can
focus on a few. The BLS staff did some work to clean up the recorded NDCs in a match to the official codes
of the FDA, but the NDC is not integral to the CPI index work. Instead, three key measures of the outlet
code id, quote number, and the version number, are sufficient to identify each of our quote series in a
given month. Changes in any of these three characteristics normally reflects termination of the old quote
series and introduction of a new series. Quotes are collected on either a monthly or a bimonthly basis. The
file appears to be quite clean with respect to the price quote and the key identifiers in the sense that

_________________________________________________________________________________________________________
A n E val uat io n o f t he CPI In dexes fo r Presc riptio n Drug s 10
E C O NO MI C STU D I E S A T B ROO KI NG S
recorded values seem very consistent from month to month. Other characteristics are recorded in a more
variable fashion that would require some editing to make them reliable.
The CPI data file also contains information from the National Drug Code Directory on the 2-digit code
used to group drugs into 20 major therapeutic classes. We use those categories to provide some
disaggregation of the data, computing separate price indexes for each class. The class names and the
distribution of IQVIA revenues and CPI quotes by class are shown in Table 1. A total of more than 250
molecules is reported because different NDC’s with the same molecule designation may be assigned to
different classes if they may have different primary treatment applications. The distribution of the IQVIA
data across the CDC classes by reported cash revenue is shown in column 5 and the distribution of CPI
price quotes is shown in column 6. The distribution across the therapeutic classes is very similar between
the CPI and IQVIA files, suggesting a high degree of similarity in the structures of the two data sets. The
correlation coefficient between the two distributions is 0.93. Column 7 displays the distribution of CPI
quotes when the sample is restricted to those NDCs that appear in both the CPI and IQVIA files.
A differing dimension of the CPI and IQVIA files is highlighted by noting that the IQVIA file contains
43,493 unique NDCs. Many of these codes represent the same basic product, but differ due to variation in
strength and size of the prescription. The CPI file in contrast contains only 2,434 unique NDCs, and we
are able to match 1,582 (65%) of those entries with NDCs in the IQVIA file. It is possible that some of the
CPI products are not present in the IQVIA because the latter is limited to the top 250 molecules, but we
expect a significant portion fail to match because the entry of the NDC in the CPI file is incorrect.11
Aggregate Indexes
As an initial point of comparison, the published CPI, PPI, and constructed measures from the IQVIA data
file are shown in Figure 1 for the period of 2009:3 to 2013:10. All the CPI indexes are computed with a
BLS program, the research database calculator, which duplicates the methodology of the official indexes,
but with different sample inputs. The IQVIA indexes are computed as monthly chain-linked Laspeyres
indexes. The price measures of the IQVIA data are computed values based on the ratio of national sales
for each data record divided by the number of prescriptions. With access to monthly sales data, the IQVIA
indexes incorporate a more current weighting structure that that of the CPI indexes for which the
estimated weights change with the rotation of the sample.
Several alternative indexes are constructed from the IQVIA data file: (1) using all of the available data
series, (2) an index restricted to those NDCs that are present in the CPI file, and (3) an index that further
restricts the IQVIA data to NDCs that are present in the CPI and to cash transactions. We expect the third
version of the IQVIA price index to be closest to the matched version of the CPI.
We also adjusted the IQVIA data for the introduction of generics in a fashion similar to that used in
the CPI. IQVIA supplied us with a data file that identified branded and generic prescription drugs by their
. . .
11. The NDC is recorded in the CPI file as a text value and some values contain alphabetic characters, which are not part of the
NDC system. We tried to correct for those obvious errors in the recorded NDC codes.
_________________________________________________________________________________________________________
A n E val uat io n o f t he CPI In dexes fo r Presc riptio n Drug s 11
E C O NO MI C STU D I E S A T B ROO KI NG S
NDCs, and their date of introduction. In addition, the file provided a unique code for the combined
molecule of each drug and an indication of whether an original brand drug had been used as the reference
listed drug (RLD) for a generic in the FDA Orange Book. Thus, by grouping drugs with common combined
molecules, we could identify a probable parent RLD for each generic. We identified the introduction of 44
generics in the five years covered by the IQVIA file when the potential NDCs were limited to drugs that
were part of the CPI file, and we replaced the price of the generic in its first month with the price of the
corresponding branded drug. Thus, the implied price change associated with the shift from the brand to
the generic was measured by the price change between the first and second month of the generic’s
introduction.
The top panel of Figure 1 displays the published indexes of the CPI, PPI, and the third definition of the
index from the IQVIA. In addition, we report a matched CPI-based index that is restricted to those NDCs
that are in both the CPI and IQVIA data files. The CPI shows the slowest rate of increase (an annual
average of 3.1%), the PPI rises at an intermediate rate (5.1% per year), and the IQVIA measure increases
the fastest (7.1 % per year).
The alternative indexes constructed from the IQVIA data set are shown in the lower panel. The use of
all the data in the file actually produces the lowest rate of change, with a pronounced large decline (4.5%)
in October of 2012, but that can be traced to one drug that has a large weight and is not included in the
CPI.12 However, the two indexes that are restricted to NDCs in the CPI, but differ in the additional
limitation to cash transactions, have very similar rates of change (annual average increases of 7.6% and
7.1%). This latter result is surprising in light of the concern that the coverage of the CPI is declining over
time as a growing portion of prescription drugs are paid through payment plans. In the IQVIA data file
two-thirds of the series by revenue are present in the CPI but cash transactions account for only 4.6% of
the revenue in the broad measure and a slightly lower 4.2 share for data set that is restricted to NDCs that
are included in the CPI file. However, both series show parallel patterns of decline in the cash share
(Figure 2). In addition, the share of transactions that are paid in cash has a pronounced spike in the
IQVIA data at the beginning of each year that is probably due to a growing reliance on high-deductible
insurance plans, whereby consumers pay a cash price until they reach a deductible threshold and third
party insurance kicks in.
We constructed a final alternative price index for the IQVIA file that incorporated a Törnqvist
weighting scheme using an average of the expenditure shares of the current and prior month. The index
incorporates substitution effects that occur within the monthly interval. It was applied to the version of
the IQVIA data limited to cash transactions. Because the Laspeyres index is already computed on a
monthly basis with weights from the prior month, the Törnqvist weighting may not have an effect, but it is
a more up-to-date representation of the weights. Surprisingly, the Törnqvist index rose slightly more
rapidly than the Laspeyres version.
. . .
12. We can trace that sharp change to a fall in the price of Asmanex Ttwisthaler, a single drug, but with seven NDCs. It is not
surveyed in the CPI. We do not know the reason for the change, but it does not appear to have had a change in patent status.

_________________________________________________________________________________________________________
A n E val uat io n o f t he CPI In dexes fo r Presc riptio n Drug s 12
E C O NO MI C STU D I E S A T B ROO KI NG S
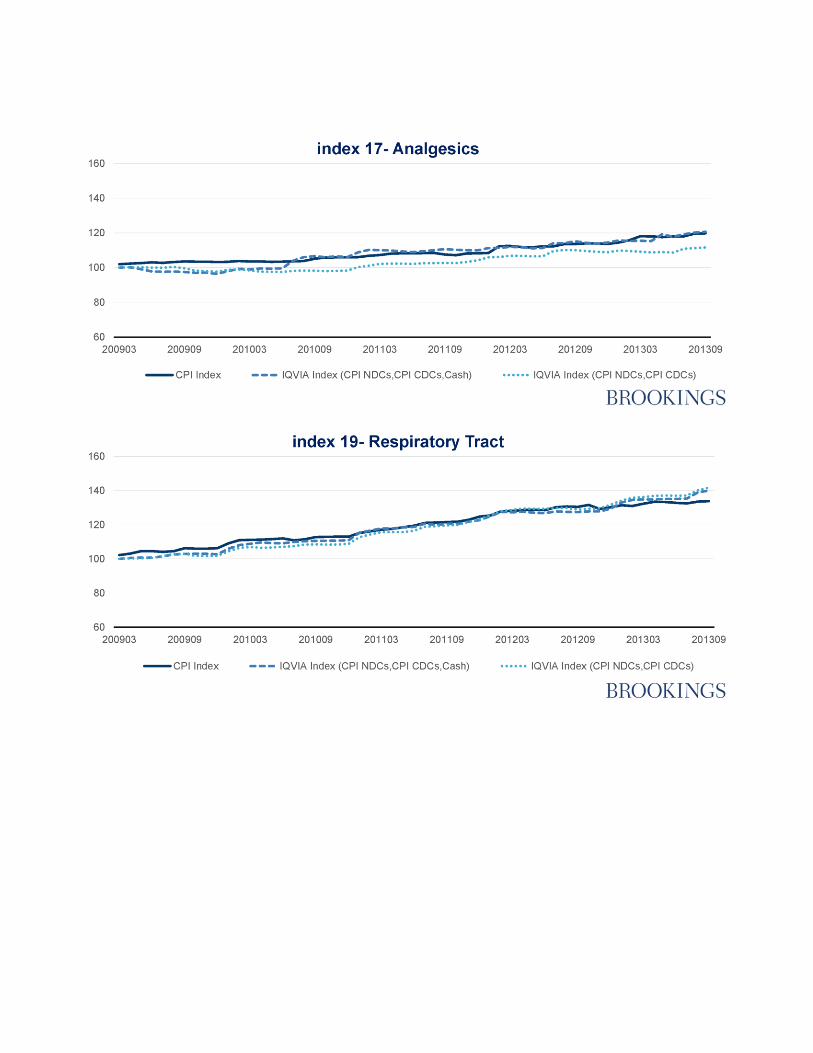
Disaggregated Price Indexes
We can explore the differences between the IQVIA and CPI datasets in greater detail by constructing
indexes for each of the CDC drug classes shown in Table 1. Some of the drug classes have very few entries.
Hence, we introduced an additional requirement that the sub-class of the CPI sample include a minimum
of one percent of the quotes in the total CPI. That yields 12 sub-classes for which we constructed various
alternative price indexes. The 12 categories are identified with an asterisk in column 1 of Table 1. The
various panels of Figure 3 display those comparisons. The solid line represents the index from the CPI file
that is restricted to those NDCs that are common to the CPI and the IQVIA samples. Two alternatives are
drawn from the IQVIA and correspond first to NDCs that matched with those in the CPI ( CPI NDCs, CPI
CDCs), and a second set of indexes based on further limiting the index to cash sales ( CPI NDCs, CPI
CDCs, Cash).
Over the full five-year period, the discrepancy between the CPI-based indexes and the cash-based
series of the IQVIA cumulates to an average of 10 percent in the last month (October, 2013) of the sample,
but the differences are very large for 05-Cardiovascular-renal (59%) and 12-Skin/Mucous Membranes
(37%). If those two classes are excluded, the average discrepancy falls to 3 percent. The cardiovascular-
renal class was among the largest at 17 percent of total revenue, whereas skin/mucous membranes was
the smallest.
Second, as with the aggregate index, the disaggregated categories tend to have a larger degree of price
increase in the IQVIA data file than in that of the CPI. The increase in the IQVIA indexes exceeds that of
the CPI in eight of the 12 categories where we judged the sample to be of sufficient size to yield reliable
results.
The third striking feature of the data is the close correspondence between the IQVIA price index for
all drug transactions in the class and those that are limited to cash. While that pattern was evident in the
aggregate indexes, it continues to hold to a surprising extent in the disaggregated indexes. As a result, the
restriction to cash sales has less influence on the indexes that we anticipated.
Conclusion
In this paper, we have used a large alternative data set from IQVIA to construct a benchmark comparison
of the Bureau of Labor Statistics’ CPI for prescription drugs. We use a methodology close to that of the
CPI over a 5-year period and compare the indexes from the two sources. We find that the IQVIA data
indicate a more rapid rate of price increase than reported in the CPI for the aggregate of all prescription
drugs. In an effort to identify the sources of the difference, we disaggregated the data into 20 therapeutic
classes and found that the CPI and IQVIA data sets contain very similar distributions of drugs as
measured by the volume of price quotes (CPI) and revenues (IQVIA). We computed price indexes for 12
drug classes for which the samples appeared to be large enough to yield meaningful results. Two of those
classes, cardiovascular-renal and skin/mucous membranes were the dominant sources of the

_________________________________________________________________________________________________________
A n E val uat io n o f t he CPI In dexes fo r Presc riptio n Drug s 13
E C O NO MI C STU D I E S A T B ROO KI NG S
discrepancies, but we could detect no obvious reason for the differences. Furthermore, the increases in the
IQVIA indexes exceeded those of the CPI in eight of the twelve classes.
We constructed several additional price indexes to explore further the influence of alternative
selection criteria. Inclusion of all payment transactions in the IQVIA file, and not just the cash
transactions available to the CPI, had a relatively minor effect. Finally, we experimented with a Törnqvist
version of the monthly-chained index for the IQVIA data sample. The result tended to widen the gap
between the IQVIA and CPI data sets.
We are left with some puzzlement about explanations for the differences between the indexes
constructed from IQVIA and CPI data sets because the IQVIA-based indexes show a general pattern of
larger price increases. In some respects, the methodologies used to construct the two data files are quite
different. The weighting of specific drugs in the CPI is the result of a series of probabilities that a specific
retail outlet within a region will be included in the sample together with a probability-based selection
among its most commonly dispensed drugs. In contrast, the IQVIA measures reflect a more direct
construction of the price indexes from the basic national sample of prescription drug transactions.
However, it is not evident that the differences in the construction of the two data ets would explain the
observed differences in price index trends.

_________________________________________________________________________________________________________
A n E val uat io n o f t he CPI In dexes fo r Presc riptio n Drug s 14
E C O NO MI C STU D I E S A T B ROO KI NG S
REFERENCES
Aizcorbe, Ana, and Nicole Nestoriak. 2012. “Price Indexes for Drugs: A Review of the Issues,” in Patricia
Danzon and Sean Nicholson(editors) The Oxford Handbook of the Economics of the Biopharmaceutical
Industry. Available
at: https://www.bea.gov/papers/pdf/price_indexes_for_drugs_a_review_of_the_issues_aizcorbe.pdf.
Berndt, E. R., and M. L. Aitken. 2011. “Brand Loyalty, Generic Entry and Price Competition in the Quarter
Century after the Waxman-Hatch Legislation”, International Journal of the Economics of Business
18(2):177-201, July.
Berndt, E.R., Cutler, D.M., Frank, R.G., Griliches, Z., Newhouse, J.P. and Triplett, J.E. (2000) “Medical
care price and output” in Culyer, A.J. and Newhouse, J.P. (Eds.) Handbook in Health Economics vol. 1a.,
Elsevier.
Bureau of Labor Statistics. 2011. “The Pharmaceutical Industry: an Overview of CPI, PPI, and IPP
Methodology.” Available at https://www.bls.gov/ppi/pharmpricescomparison.pdf.
Cleeton, David, Valy Goepfrich, and Burton Weisbrod. 1992. “What does the Consumer Price Index for
prescription drugs really measure?” Health Care Financing Review, 13 (3):45-51.
Griliches, Zvi, and lain Cockburn. 1994. "Generics and New Goods in Pharmaceutical Price Indexes,"
American Economic Review, Vol. 84, No. 5 (December): 1213-32.
Kelly, G. G. 1997, “Improving the PPI Samples for Prescription Pharmaceuticals”, Monthly Labor Review
120(10):10-17.
Moulton, Brent. 1996. “Bias in the Consumer Price Index. What is the Evidence?” Journal of Economic
Perspectives, Vol. 10, No. 4 (Autumn):159-77.

_________________________________________________________________________________________________________
A n E val uat io n o f t he CPI In dexes fo r Presc riptio n Drug s 15
E C O NO MI C STU D I E S A T B ROO KI NG S
TABLES AND FIGURES
Table 1. Number of Molecules and Drugs/products by
Therapeutic Class
250 most common IQVIA prescriptions limited to NDCs included in the CPI sample with
payment in cash
Note: The IQVIA extract is based upon the Top 250 combined molecules and the products within these molecules. The monthly
data extends from March 2009 to October 2013. The above classification aggregates to more than 250 molecules because drugs
with the same molecule structure may be used within more than one CDC class in the CPI classification. The IQVIA data are
limited to cash payments (excluding all payment plans). Column (8) reports the coefficient of variation for the number of quotes
in the matched CPI across the 56 months of data.


Figure 3. Price Indexes by CDC Class, 2009-2013


_________________________________________________________________________________________________________
A n E val uat io n o f t he CPI In dexes fo r Presc riptio n Drug s 22
E C O NO MI C STU D I E S A T B ROO KI NG S
The Brookings Economic Studies program analyzes current and emerging economic issues facing the United States and the world, focusing on ideas to achieve broad-based economic growth, a strong labor market, sound fiscal and monetary policy, and economic opportunity and social mobility. The research aims to increase understanding of how the economy works and what can be done to make it work better.
Questions about the research? Email [email protected]. Be sure to include the title of this paper in your inquiry.
© 2018 The Brookings Institution | 1775 Massachusetts Ave., NW, Washington, DC 20036 | 202.797.6000