Embed Size (px)
Citation preview
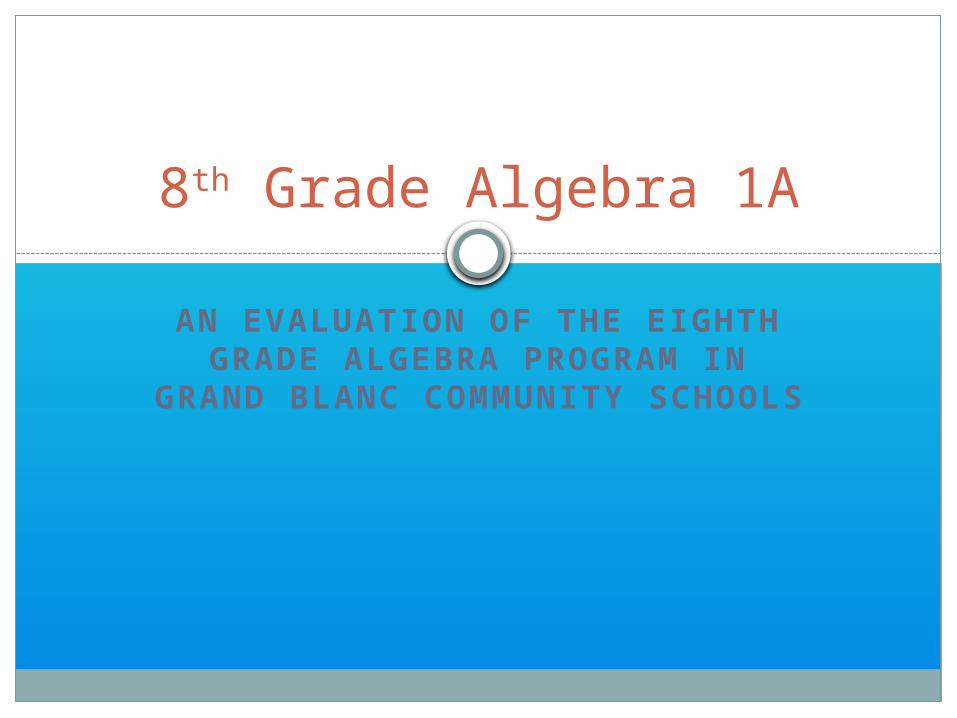
AN EVALUATION OF THE EIGHTH GRADE ALGEBRA
PROGRAM IN GRAND BLANC COMMUNITY SCHOOLS
8th Grade Algebra 1A
2
INTRODUCTION
Chapter 1
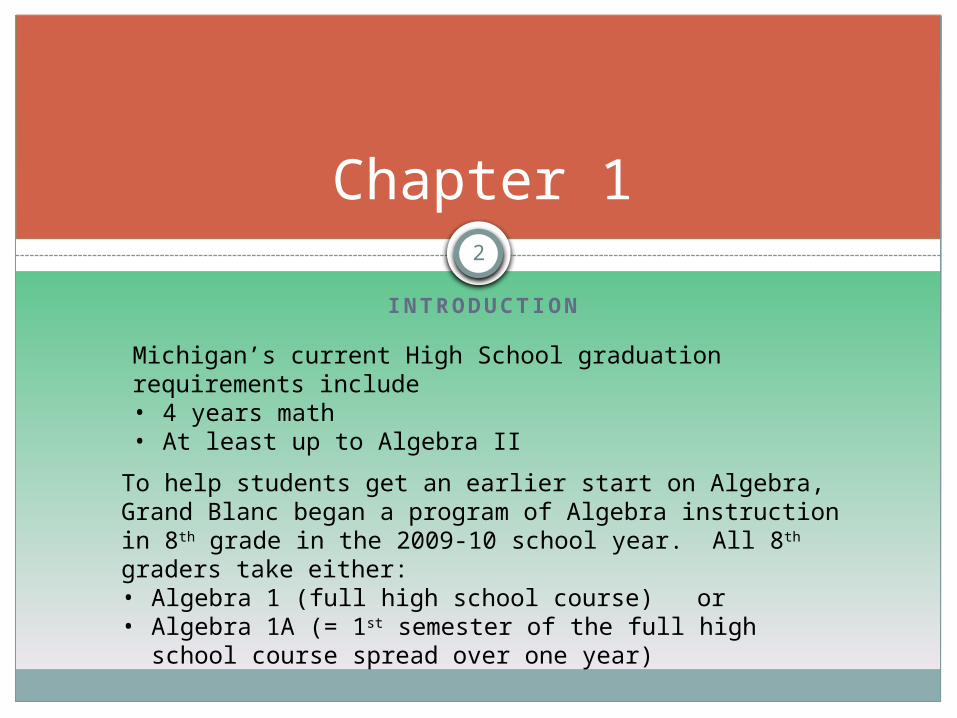
Michigan’s current High School graduation requirements include • 4 years math• At least up to Algebra II
To help students get an earlier start on Algebra, Grand Blanc began a program of Algebra instruction in 8th grade in the 2009-10 school year. All 8th graders take either:• Algebra 1 (full high school course) or• Algebra 1A (= 1st semester of the full high school course
spread over one year)
3
INTRODUCTION
Chapter 1
This action research project will evaluate the effectiveness of the Algebra 1A portion of this
program.
4
ASSUMPTIONS AND LIMITATIONS
Chapter 1
1. “Success” is indicated by a passing grade of C- or better.2. Grading practices are assumed to be consistent among all teachers teaching Algebra 1 and 1A.
3. Common teacher-developed assessments have high reliability and validity.
4. All Algebra teachers are equally effective.5. Student demographics remain approximately constant.
5
RESEARCH QUESTIONS
Chapter 1
1. Is our 8th grade Algebra program more effective in enabling students to advance in high school mathematics than our previous program? 2. What influence does computational fluency have on student success in Algebra? 3. What factors influence retention of Algebra skills over time?
6
LITERATURE REVIEW
Chapter 2
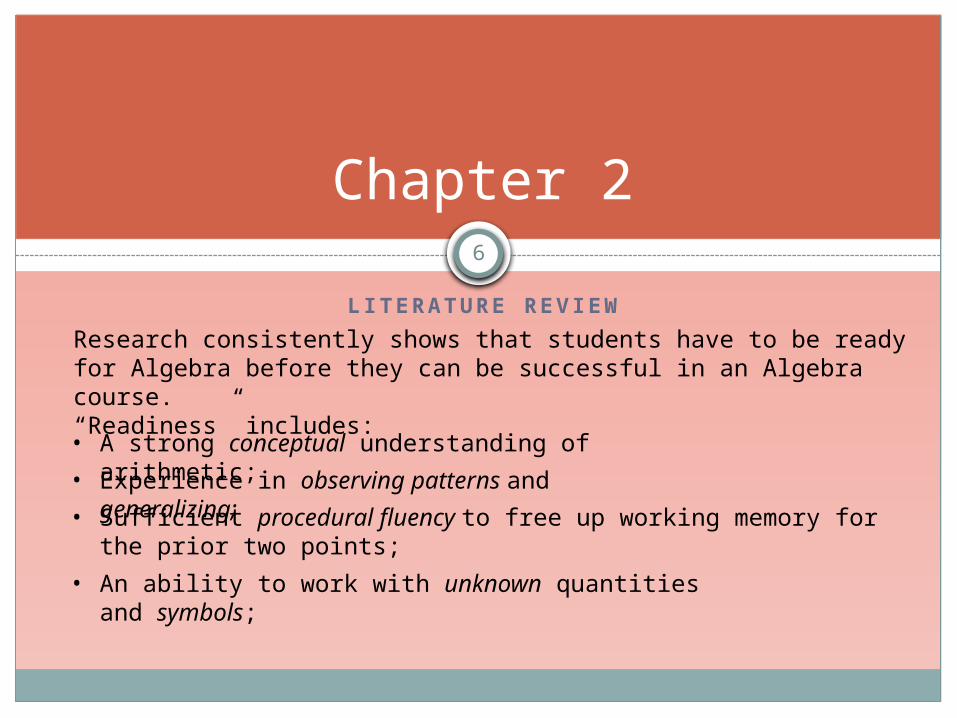
Research consistently shows that students have to be ready for Algebra before they can be successful in an Algebra course.“Readiness” includes:
• A strong conceptual understanding of arithmetic;• Experience in observing patterns and generalizing;• Sufficient procedural fluency to free up working memory for the prior two points;
• An ability to work with unknown quantities and symbols;
7
METHOD OF THE STUDY
Chapter 3
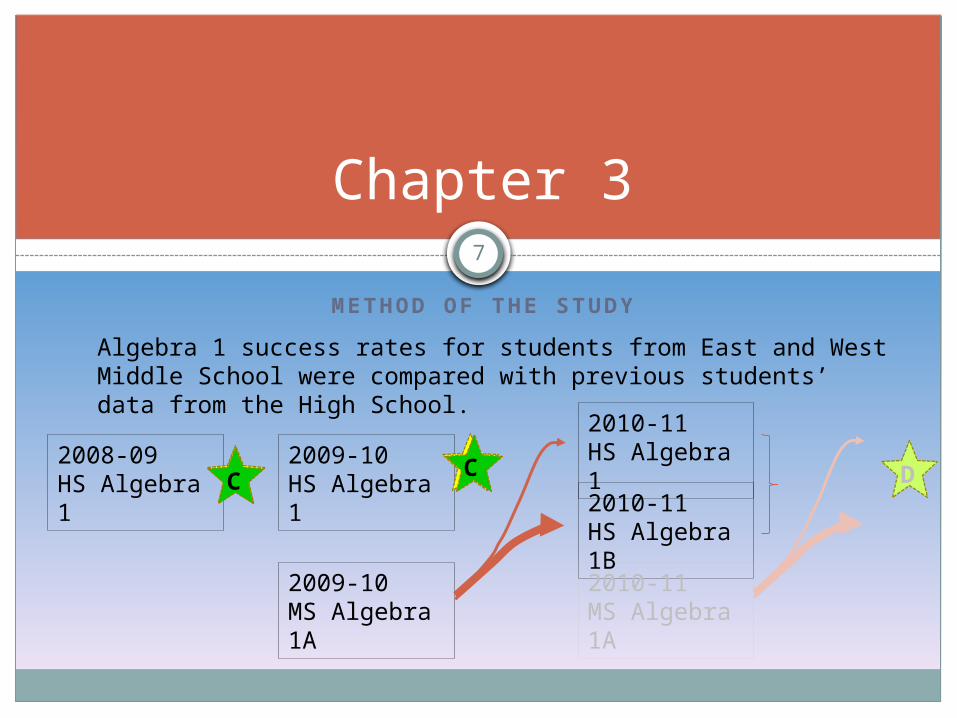
Algebra 1 success rates for students from East and West Middle School were compared with previous students’ data from the High School.
2008-09HS Algebra 1
2009-10HS Algebra 1
2009-10MS Algebra 1A
2010-11HS Algebra 1B2010-11MS Algebra 1A
2010-11HS Algebra 1
BA DC C
8
METHOD OF THE STUDY
Chapter 3
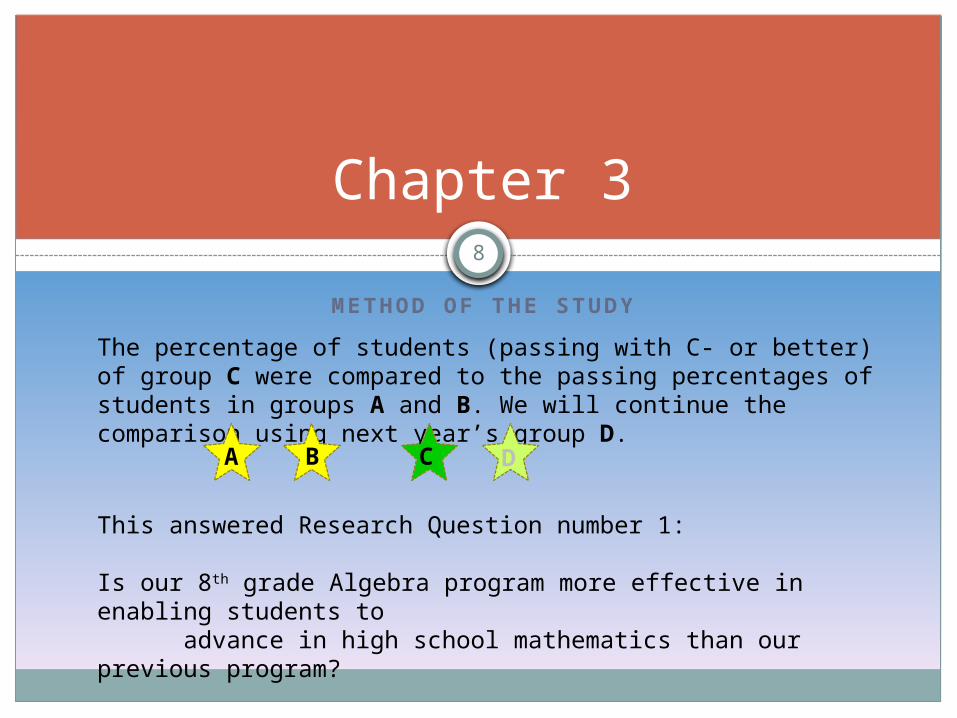
The percentage of students (passing with C- or better) of group C were compared to the passing percentages of students in groups A and B. We will continue the comparison using next year’s group D.
BA C D
This answered Research Question number 1:
Is our 8th grade Algebra program more effective in enabling students to advance in high school mathematics than our previous program?
9
METHOD OF THE STUDY
Chapter 3
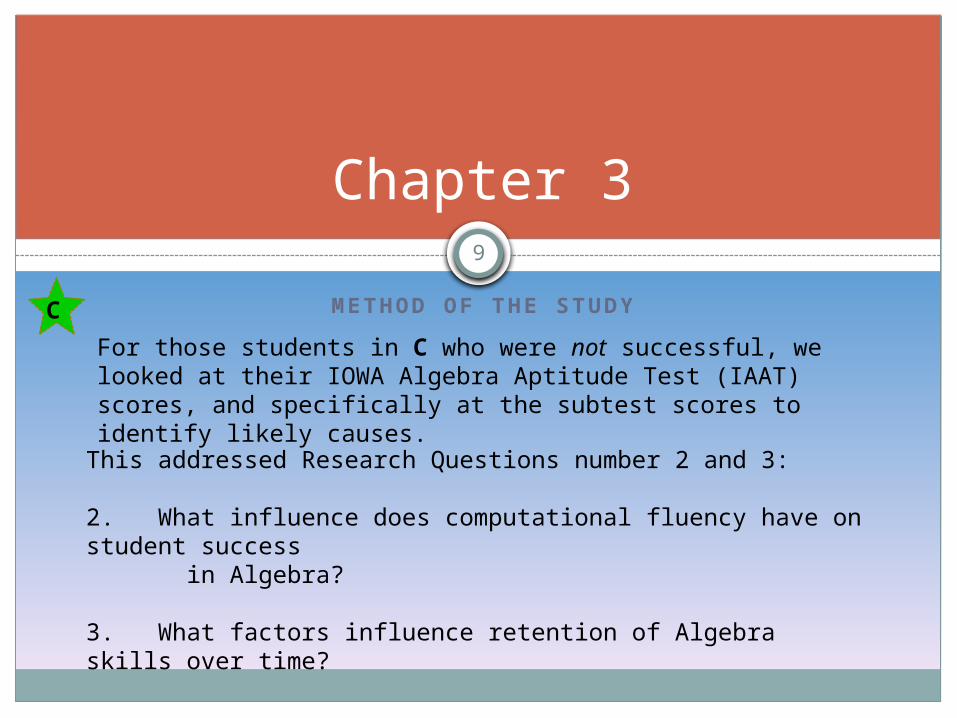
For those students in C who were not successful, we looked at their IOWA Algebra Aptitude Test (IAAT) scores, and specifically at the subtest scores to identify likely causes.
C
This addressed Research Questions number 2 and 3:
2. What influence does computational fluency have on student success in Algebra?
3. What factors influence retention of Algebra skills over time?
10
METHOD OF THE STUDY
Chapter 3
IOWA Algebra Aptitude Test (IAAT) results, which were used to place students into all the Algebra courses in this study, contain four subsections:
1. Computational skills and understandings
2. Interpreting mathematical information in graphs and tables
3. Identifying the relationship between two sets of numbers
4. Utilizing symbols
11
IAAT score in %
Gra
de i
n %
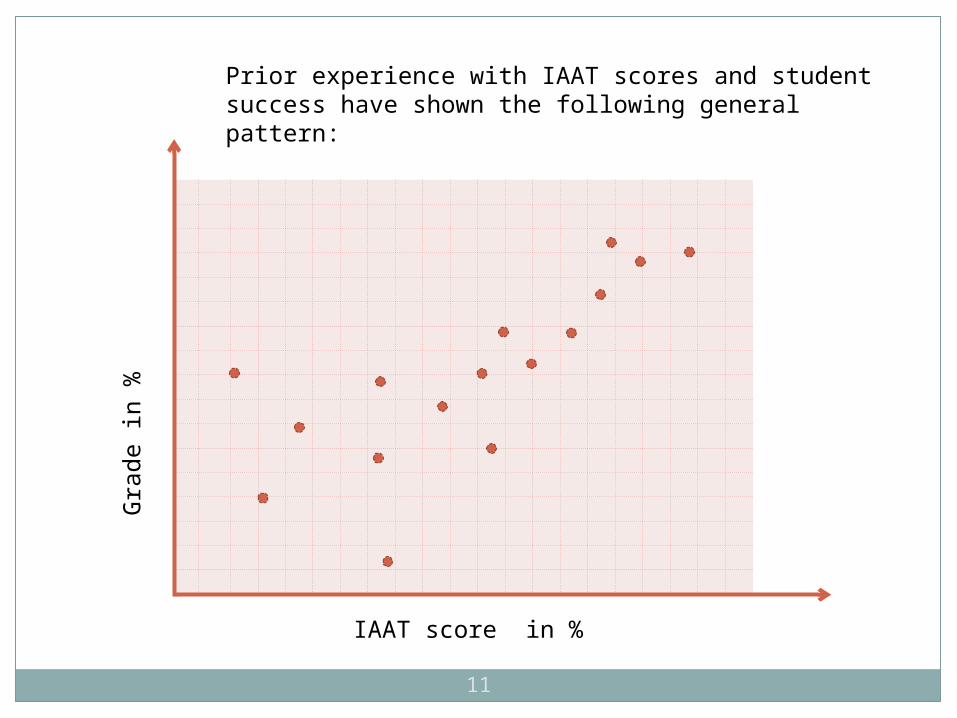
Prior experience with IAAT scores and student success have shown the following general pattern:
12
METHOD OF THE STUDY
Chapter 3
Based on the assumption that students who were not successful were lacking in prerequisite skills, we disaggregated their IAAT scores and looked at each of the subsections.
1. Computational skills and understandings2. Interpreting mathematical information3. Identifying relationships between two sets of
numbers4. Utilizing symbols
Score averages for the entire group of failing students were calculated for each subsection.
13
METHOD OF THE STUDY
Chapter 3
In addition to looking at pre-algebra skills, we also surveyed students, probing for their motivational levels, support options, and perceived arithmetic skill levels.
Teachers at both the middle school and high school were surveyed to identify their beliefs about why students struggle in Algebra, what student motivational levels and skills seem to be, and significant characteristics of their instructional practices.
14
RESULTS AND DISCUSSION
Chapter 4
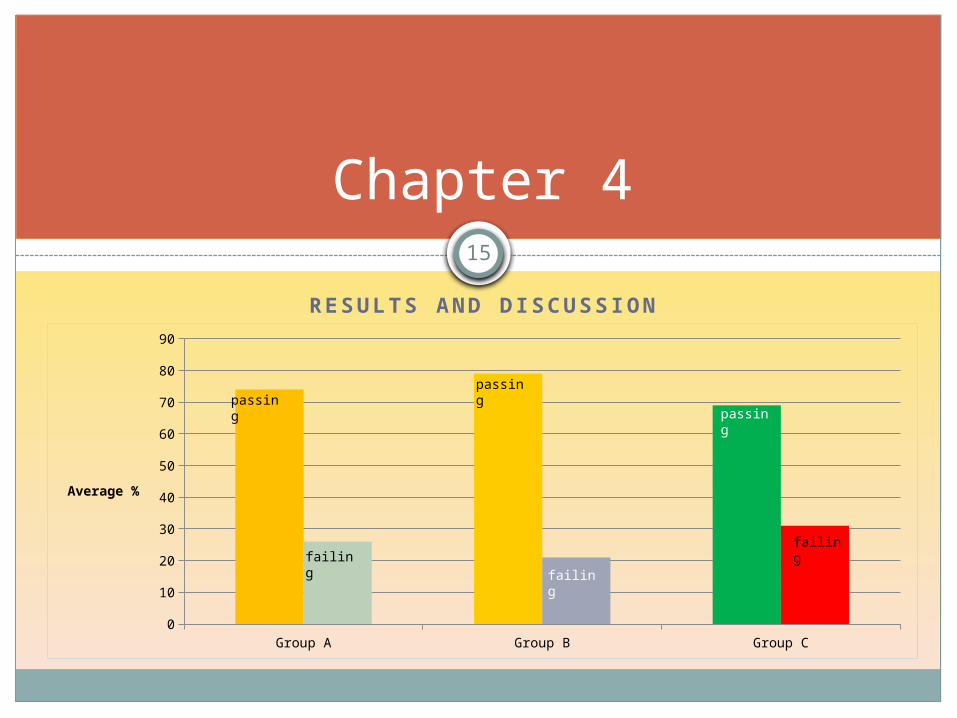
Overall, group C had a slightly lower success rate than either group A or B. The difference was not statistically significant and can be attributed to several factors, including:
An implementation dip which can be expected, since this was a “new” program for the middle schools.
Teaching staff at the middle school has had much less experience in teaching Algebra than the high school.
15
RESULTS AND DISCUSSION
Chapter 4
Group A Group B Group C0
10
20
30
40
50
60
70
80
90
Average %
passingpassin
g passing
failingfailing
failing
16
Chapter 4
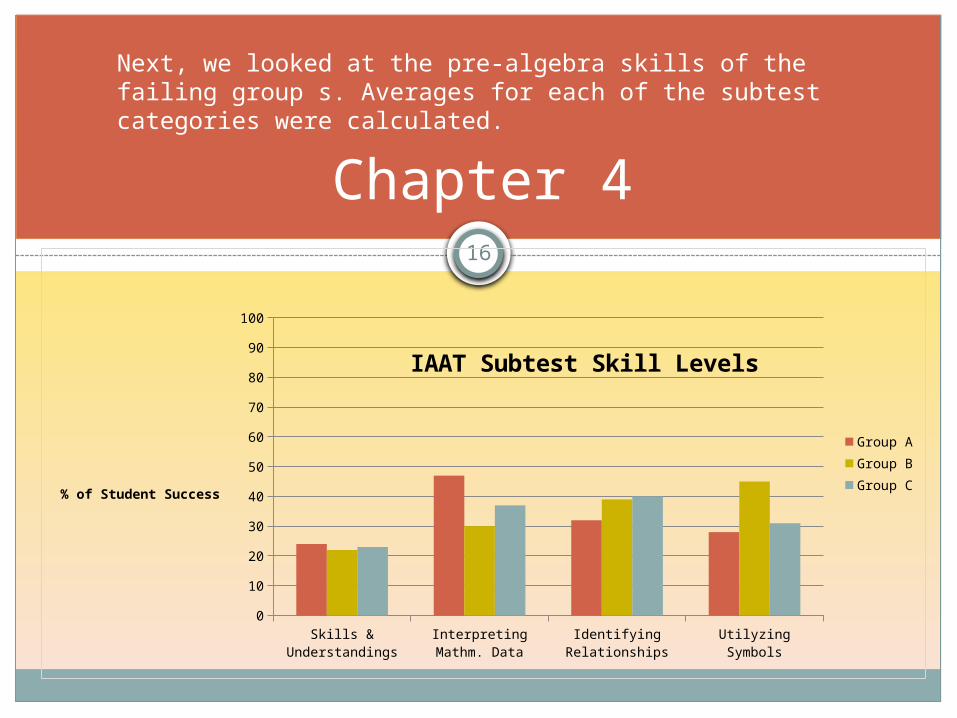
Next, we looked at the pre-algebra skills of the failing group s. Averages for each of the subtest categories were calculated.
Skills
& U
nder
stan
ding
s
Inte
rpre
ting
Mat
hm. D
ata
Iden
tifying
Rel
atio
nshi
ps
Utilyz
ing
Symbo
ls0
10
20
30
40
50
60
70
80
90
100
IAAT Subtest Skill Levels
Group AGroup BGroup C
% of Student Success
17
RESULTS AND DISCUSSION
Chapter 4
Based on these results, it looks like we should focus most on the first sub-skill identified in the IAAT:
computational skills and understandings.
The challenge will be in determining if the skills are low because of lack of conceptual understanding or because of other factors such as insufficient practice opportunities.
18
RESULTS AND DISCUSSION
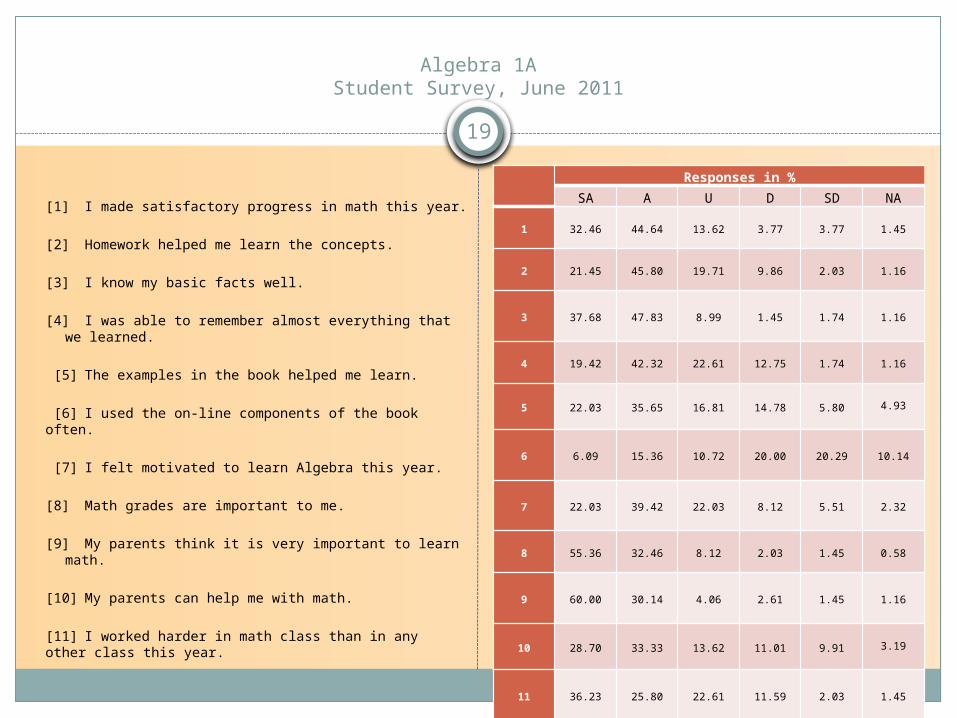
Chapter 4
Student survey results were as follows:
19
Algebra 1AStudent Survey, June 2011
[1] I made satisfactory progress in math this year. [2] Homework helped me learn the concepts. [3] I know my basic facts well. [4] I was able to remember almost everything that we learned. [5] The examples in the book helped me learn. [6] I used the on-line components of the book often. [7] I felt motivated to learn Algebra this year. [8] Math grades are important to me. [9] My parents think it is very important to learn math. [10] My parents can help me with math. [11] I worked harder in math class than in any other class this year.
Responses in %SA A U D SD NA
1 32.46 44.64 13.62 3.77 3.77
1.45
2 21.45 45.80 19.71 9.86 2.03
1.16
3 37.68 47.83 8.99 1.45 1.74
1.16
4 19.42 42.32 22.61 12.75 1.74
1.16
5 22.03 35.65 16.81 14.78 5.80
4.93
6 6.09 15.36 10.72 20.00 20.29
10.14
7 22.03 39.42 22.03 8.12 5.51
2.32
8 55.36 32.46 8.12 2.03 1.45
0.58
9 60.00 30.14 4.06 2.61 1.45
1.16
10 28.70 33.33 13.62 11.01 9.91
3.19
11 36.23 25.80 22.61 11.59 2.03
1.45
20
It is interesting to note that student perceptions are a bit different than what one expects.Most students indicated a strong belief in their parents’ ability to help them, and the majority felt that their basic skills were sufficiently strong.Homework, though not popular, was considered important by the students.
Based on some of the student responses however, this survey will need to be adjusted. It is apparent that some items were answered the way students thought their teachers wanted them answered, rather than their own opinion. This was most apparent while reading the written comments some students provided.Demographic data on the survey allows us to disaggregate the data according to gender and number of years in the Grand Blanc school system. Analysis has not shown any significant gender differences except for attitudes about homework.Number of years that a student has been in Grand Blanc Schools does not produce any significantly different responses.
21
CONCLUSIONS, RECOMMENDATIONS, IMPLICATIONS
Chapter 5
Regardless of how well our students are doing, we should always be seeking to improve. Major areas to explore are:
• Instructional practices, such as problem-centered learning
• Real-life applications, concrete representations
• Identifying genuine assessments of understanding
22
CONCLUSIONS, RECOMMENDATIONS, IMPLICATIONS
Chapter 5
Some of these are difficult for teachers to address, but have great potential for improving students’ life-long learning.