Embed Size (px)
Citation preview

Northeast Historical Archaeology
Volume 45 Article 3
2016
An Evaluation of Tobacco Pipe Stem DatingFormulasLauren K. McMillan
Follow this and additional works at: https://orb.binghamton.edu/nehaPart of the Archaeological Anthropology Commons
This Article is brought to you for free and open access by The Open Repository @ Binghamton (The ORB). It has been accepted for inclusion inNortheast Historical Archaeology by an authorized editor of The Open Repository @ Binghamton (The ORB). For more information, please [email protected].
Recommended CitationMcMillan, Lauren K. (2016) "An Evaluation of Tobacco Pipe Stem Dating Formulas," Northeast Historical Archaeology: Vol. 45 45,Article 3.Available at: https://orb.binghamton.edu/neha/vol45/iss1/3

Northeast Historical Archaeology/Vol. 45, 2016 67
Introduction During the second half of the 20th century, historical archaeologists grew increasingly interested in dating categories or types of artifacts. This interest resulted in many new dating methods and formulas, including the mean ceramic dating formula (South 1977), ceramic intersections (South 1977), several window-glass dating methods (Chance and Chance 1976; Ball 1983; Moir 1987), and tobacco pipe-stem formulas (Harrington 1954; Binford 1962; Hanson 1971; Heighton and Deagan 1972). Pipes are ideal artifacts for dating colonial sites because they were immensely popular and modified constantly throughout the period. Pipe styles changed rapidly, and there are historical documents related to the pipe industry and the pipe makers, allowing for accurate dating of marked and decorated pipes. Additionally, clay tobacco pipes are extremely fragile and, thus, are well represented in the archaeological record of the 17th and 18th centuries (Harrington 1951). The first and most popular pipe-stem dating technique was J. C. Harrington’s (1954) use of time-period histograms; other dating methods, using white ball clay pipe stems, available to archaeologists studying 17th- and 18th-century sites include Lewis Binford’s (1962) linear-regression formula, Lee Hanson’s
(1971) ten linear formulas, and Robert Heighton and Kathleen Deagan’s (1972) curvilinear formula. While Harrington’s time periods are generally accepted as useful, and Binford’s formula is applied to most sites, Hanson’s and Heighton and Deagan’s methods have been used infrequently, and, consequently, many archaeologists may be unfamiliar with them. Although the majority of the research on pipe-stem dating was written in the 1960s and 1970s, archaeologists have been studying, refining, and validating these methods over the past 50 years (Omwake 1956; Walker 1965, 1967, 1978; Whitehouse 1966; Belcher and Jarrett 1971; Pfeiffer 1978; Alexander 1979; Hole 1980; Deetz 1987; Shea 1991; Fox 1998; Monroe and Mallios 2004; White 2004; Beaman 2005; Mallios 2005). Most recently, scholars (Shott 2012; Wesler 2014) have argued for the use of standard deviation with formula results to estimate not just a median occupation, but also occupation spans; suggestions that Binford (1972) and Hanson (1971) made in their original works. Until the completion of the project described here, however, the accuracy and reliability of these methods had not been compared systematically over a wide geographic region and time period (McMillan 2010). This article will show that current, conventional use of Binford’s formula to the
An Evaluation of Tobacco Pipe Stem Dating Formulas
Lauren K. McMillan There are currently three formula dating techniques available to archaeologists studying 17th- and 18th-century colonial sites with imported white, ball-clay, tobacco-pipe stems. The formulas are based on Harrington’s 1954 histogram of time periods: Binford’s linear formula, Hanson’s ten linear formulas, and the Heighton and Deagan curvilinear formula. Data on pipe stem-bore diameters were collected from 28 sites in Maryland, Virginia, North Carolina, and South Carolina to test the accuracy and utility of the three formula dating methods. The results of this project indicate that current conventional use of Binford’s formula, to the exclusion of the other methods, may be problematic, and that the Heighton and Deagan formula is the most accurate of the three options.
Il existe actuellement trois techniques de datation des tuyaux de pipes en terre cuite fine blanche argileuse disponibles pour les archéologues qui étudient les sites coloniaux des XVIIe et XVIIIe siècles. Toutes trois sont basées sur l’histogramme de périodes de temps de Harrington (1954) : la formule linéaire de Binford, les dix formules linéaires de Hanson, et la formule curviligne de Heighton et Deagan. Des données sur les diamètres des trous de tuyaux de pipes ont été recueillies sur 28 sites au Maryland, en Virginie, en Caroline du Nord et en Caroline du Sud, afin de vérifier l’exactitude et l’utilité de ces trois méthodes de datation. Les résultats de ce projet indiquent que l’utilisation conventionnelle actuelle de la formule de Binford avec l’exclusion des autres méthodes peut être problématique, et que la formule de Heighton et Deagan est la plus précise des trois options.
68 McMillan/Tobacco Pipe Stem Dating Formulas
exclusion of the other methods may be problematic. After an overview of the four dating methods, the results of this current research, which suggest that the most useful and accurate formula is the one developed by Heighton and Deagan, will be presented.
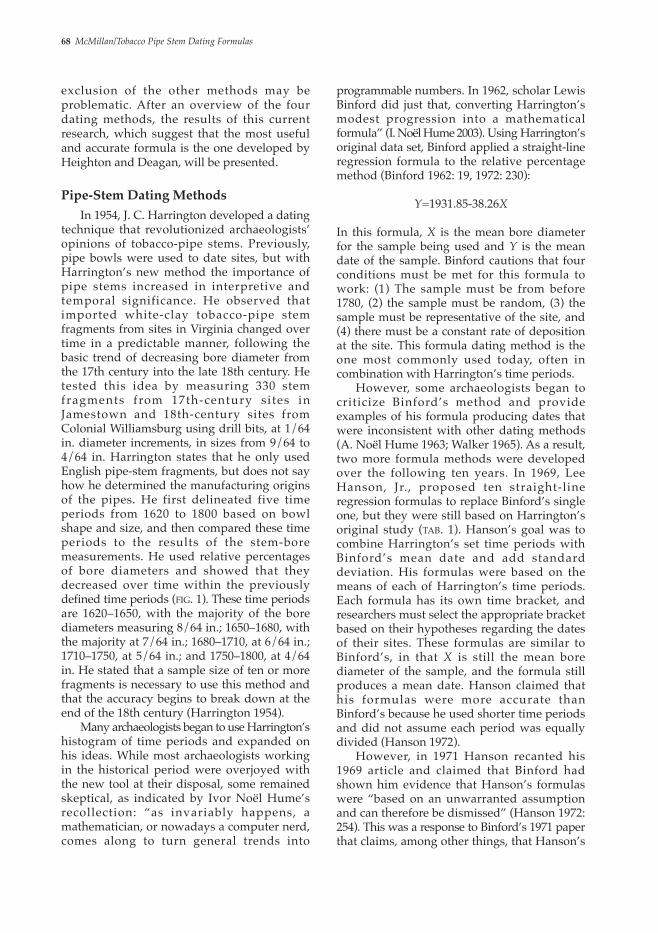
Pipe-Stem Dating Methods In 1954, J. C. Harrington developed a dating technique that revolutionized archaeologists’ opinions of tobacco-pipe stems. Previously, pipe bowls were used to date sites, but with Harrington’s new method the importance of pipe stems increased in interpretive and temporal significance. He observed that imported white-clay tobacco-pipe stem fragments from sites in Virginia changed over time in a predictable manner, following the basic trend of decreasing bore diameter from the 17th century into the late 18th century. He tested this idea by measuring 330 stem fragments from 17th-century sites in Jamestown and 18th-century sites from Colonial Williamsburg using drill bits, at 1/64 in. diameter increments, in sizes from 9/64 to 4/64 in. Harrington states that he only used English pipe-stem fragments, but does not say how he determined the manufacturing origins of the pipes. He first delineated five time periods from 1620 to 1800 based on bowl shape and size, and then compared these time periods to the results of the stem-bore measurements. He used relative percentages of bore diameters and showed that they decreased over time within the previously defined time periods (fig. 1). These time periods are 1620–1650, with the majority of the bore diameters measuring 8/64 in.; 1650–1680, with the majority at 7/64 in.; 1680–1710, at 6/64 in.; 1710–1750, at 5/64 in.; and 1750–1800, at 4/64 in. He stated that a sample size of ten or more fragments is necessary to use this method and that the accuracy begins to break down at the end of the 18th century (Harrington 1954). Many archaeologists began to use Harrington’s histogram of time periods and expanded on his ideas. While most archaeologists working in the historical period were overjoyed with the new tool at their disposal, some remained skeptical, as indicated by Ivor Noël Hume’s recollection: “as invariably happens, a mathematician, or nowadays a computer nerd, comes along to turn general trends into
programmable numbers. In 1962, scholar Lewis Binford did just that, converting Harrington’s modest progression into a mathematical formula” (I. Noël Hume 2003). Using Harrington’s original data set, Binford applied a straight-line regression formula to the relative percentage method (Binford 1962: 19, 1972: 230):
Y=1931.85-38.26X
In this formula, X is the mean bore diameter for the sample being used and Y is the mean date of the sample. Binford cautions that four conditions must be met for this formula to work: (1) The sample must be from before 1780, (2) the sample must be random, (3) the sample must be representative of the site, and (4) there must be a constant rate of deposition at the site. This formula dating method is the one most commonly used today, often in combination with Harrington’s time periods. However, some archaeologists began to criticize Binford’s method and provide examples of his formula producing dates that were inconsistent with other dating methods (A. Noël Hume 1963; Walker 1965). As a result, two more formula methods were developed over the following ten years. In 1969, Lee Hanson, Jr., proposed ten straight-line regression formulas to replace Binford’s single one, but they were still based on Harrington’s original study (tab. 1). Hanson’s goal was to combine Harrington’s set time periods with Binford’s mean date and add standard deviation. His formulas were based on the means of each of Harrington’s time periods. Each formula has its own time bracket, and researchers must select the appropriate bracket based on their hypotheses regarding the dates of their sites. These formulas are similar to Binford’s, in that X is still the mean bore diameter of the sample, and the formula still produces a mean date. Hanson claimed that his formulas were more accurate than Binford’s because he used shorter time periods and did not assume each period was equally divided (Hanson 1972). However, in 1971 Hanson recanted his 1969 article and claimed that Binford had shown him evidence that Hanson’s formulas were “based on an unwarranted assumption and can therefore be dismissed” (Hanson 1972: 254). This was a response to Binford’s 1971 paper that claims, among other things, that Hanson’s
Northeast Historical Archaeology/Vol. 45, 2016 69
work was based on a misunderstanding of statistics and that decreasing bore diameter is patterned and, thus, observable in his linear formula. Because of these two 1971 papers and the complicated nature of the ten formulas, Hanson’s method is rarely, if ever, used. Results of this current study show, however, that Hanson prematurely retracted his formulas based on criticism from a leading archaeologist of the day. In the same year that Binford and Hanson were debating their methods, Robert Heighton and Kathleen Deagan introduced another formula. They agreed with Hanson’s argument that pipe-stem bore diameters do not follow Binford’s single-line regression. To address this problem, they measured stems from 26 samples from 14 sites dating from 1635 to 1775. They computed a mean date for each individual stem, and then produced a formula based on the results (Heighton and Deagan 1972). The authors suggested that bore diameters should be applied to a curvilinear line and
proposed a two-part equation, a logarithmic formula and a point of origin formula:
X=(-logY+1.04435)/0.05324),
date=1600+22X
To solve for this curve and obtain a mean date, one must follow a three-step process. First determine Y, the mean bore diameter; this is similar to the X that is solved for in both the Binford and Hanson formulas. The Y value (mean bore diameter) is then converted to its logarithmic form. Secondly, solve the first equation using the logarithmic form of Y that was determined in the first step. The last step is to use X, which is determined by the first equation, to solve the second equation. In this formula, 1600 is the point of origin or the theoretical start of stem-bore size, and 22 is the estimated number of years between each decrease in bore diameter. Similar to Hanson’s formulas, this method is rarely used, most likely due to its complexity.
Figure 1. Harrington’s histogram of pipe-stem measurements grouped by time period. (Graph by author, 2016.)

70 McMillan/Tobacco Pipe Stem Dating Formulas
British colonial archaeology and, given the controversy and examples of inconsistent dates, an extensive investigation is needed. There have been three other studies of pipe-stem dating methods similar to this project (Fox 1998; Beaman 2005; Mallios 2005). Georgia Fox, in her 1998 dissertation on pipes from Port Royal, Jamaica, compared the Binford and the Heighton and Deagan formulas using the known beginning-occupation date of 1655 and the end date of 1692 provided by the earthquake that destroyed the harbor city. There was evidence of 18th-century occupation on the site; however, Fox only used the 18,537 pipes that were sealed in the mid- to late 17th-century contexts. Of those 18,537 pipes, all but 9 were likely manufactured in Bristol, England; this was determined by decoration and makers’ marks. One was made in Broseley, England, two were from London, and six were from the Netherlands; she excluded the Dutch pipes from her study (Fox 1998: 23–24). Fox concluded that the Binford formula was more accurate than that of Heighton and Deagan, which she found to be off by 20 years consistently, while the Binford formula results were often only different from the given dates by less than 10 years. Fox’s results differ from the findings of this investigation. These differences are likely because she was using one fairly early site, compared to the multiple sites from a 200-year time period used in this study of pipe-stem dating. Thomas Beaman’s 2005 study of pipe-stem dating in North Carolina supports the findings
The accuracy of the Hanson and the Heighton and Deagan methods has not been ascertained because they are used infrequently, and there are few examples of their use in the archaeological literature. Most archaeologists are willing to accept Harrington’s five time periods; because they are simple, basic trends with wide phases, most sites will fall into the correct time frame. Binford’s formula is simple and easy to understand, so it is almost universally applied to most pre-1800 British colonial and federal period sites, despite criticism by many authors based on numerous examples of the formula producing inconsistent dates (A. Noël Hume 1963, 1979; Walker 1965; Oswald 1975: 126; Alexander 1979; I. Noël Hume 2003). This article reevaluates Binford’s formula and tests the Hanson and Heighton and Deagan formulas for their accuracy.
Previous Studies In the same article that Hanson (1972) withdrew his own formulas, he called for a study of all pipe-stem dating methods. He was specifically targeting Binford’s method and argued that “a review of the literature since 1962 will show how often the Binford formula has been misused and how interpretations based on it have been slanted to conform to preconceived ideas” (Hanson 1972: 256). This problem has only increased over time. The Binford formula is one of the most relied upon and frequently used dating techniques in
Table 1. Hanson’s ten straight-line regression formulas.
Time range Formula1 1620–1680 Y= 1891.64 - 32.09X ± (2SD) (15.00)
2 1620–1710 Y= 1880.92 - 30.70X ± (2SD) (15.00)
3 1650–1710 Y= 1869.31 - 28.88X ± (2SD) (15.00)
4 1620–1750 Y= 1887.99 - 31.66X ± (2SD) (16.25)
5 1650–1750 Y= 1888.06 - 31.67X ± (2SD) (16.67)
6 1680–1750 Y= 1894.88 - 32.98X ± (2SD) (17.50)
7 1620–1800 Y= 1919.10 - 36.06X ± (2SD) (18.00)
8 1650–1800 Y= 1930.24 - 38.23X ± (2SD) (18.75)
9 1680–1800 Y= 1959.66 - 44.32X ± (2SD) (20.00)
10 1710–1800 Y= 2026.12 - 58.97X ± (2SD) (22.50)

Northeast Historical Archaeology/Vol. 45, 2016 71
similar, the data sets were much larger and spanned a longer time period than any of the earlier investigations.
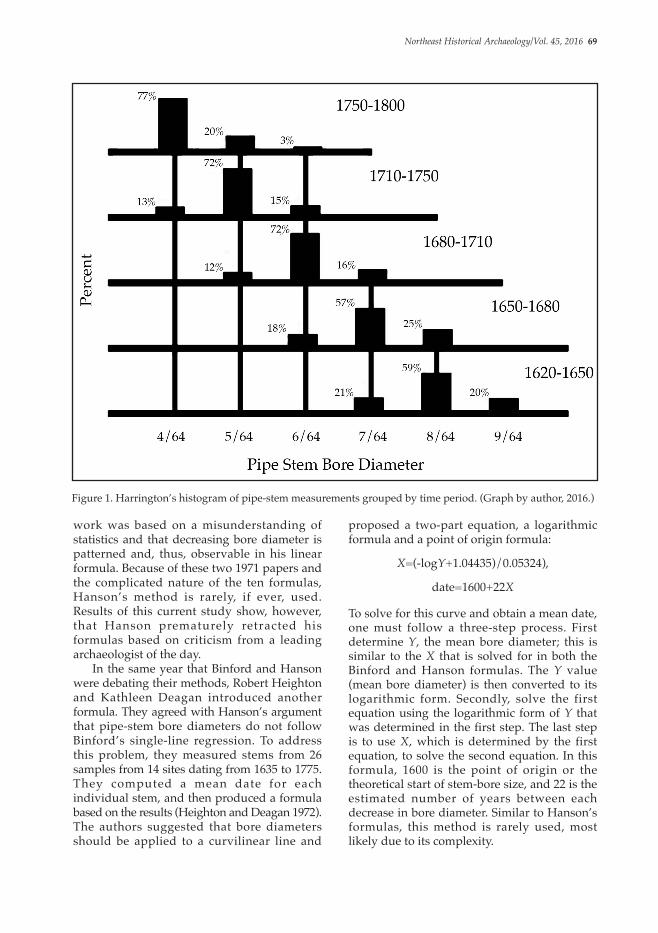
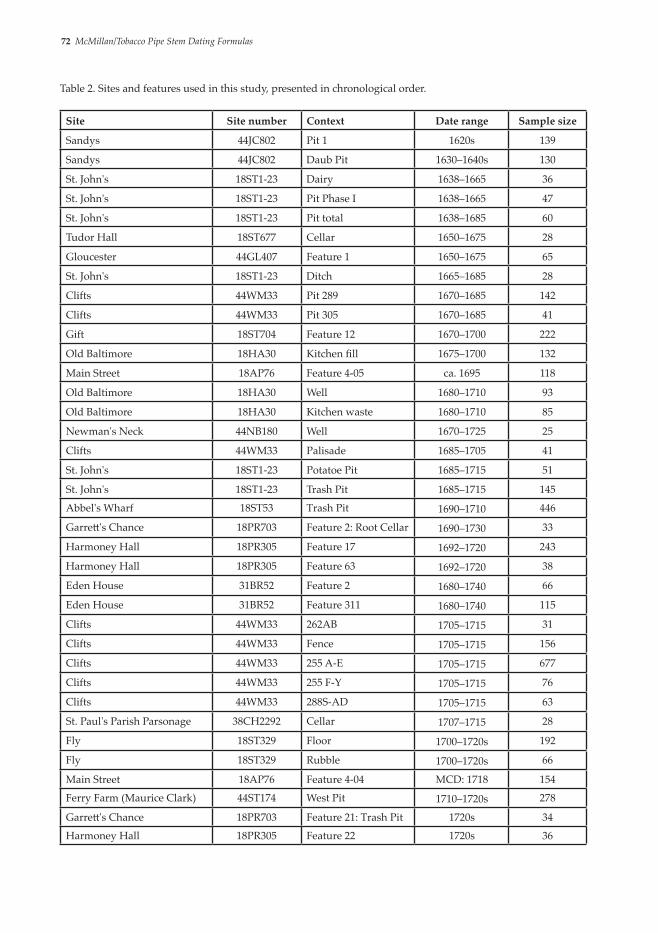
Methods To test the accuracy of the three formula dating methods, data were collected from site reports and artifact catalogs, recording pipe stem-bore diameter counts from 69 individual features from 26 sites in Maryland, Virginia, North Carolina, and South Carolina (tab. 2). Of the 69 features used, 23 were from Maryland, 22 from Virginia, 12 from North Carolina, and 12 from South Carolina. Only raw counts of bore-diameter size were used; when only percentages or Binford mean dates were given, the data were not used. A total of 19,404 pipe fragments were used in the present study. In order to manage the data and main-tain similarity among sites from a wide geo-graphic range, each of the sites used had to fit certain critera before it was included in the analysis. It is beyond the scope of this article to detail the entirety of the sample used; however, the data are published in McMillan (2010). First, data were drawn from sites dating from 1620 to 1800. While some authors have argued that the Binford formula only works on sites dating from 1680 to 1760 (Binford 1962; I. Noël Hume 1969: 300; Higgins 1999), the cut-off dates were chosen based on Harrington’s original time periods to acquire a better under-standing of all three methods. Only data from European settler sites were collected; no African American or Native American sites were used. The majority of the European sites used were British colonial sites and not repre-sentative of other European ethnicities. These cultural differences could potentially have affected access to trade, choice, use, and depo-sition––questions that are beyond the scope of this article to address, as this is a purely meth-odological study. However, researchers studying questions of differential access and choice may easily draw upon this analysis for comparative samples. The features selected for this study had to have been sealed, undisturbed, and tightly dated. Features used for less than 30 years were preferred; however, this time restriction was not always possible to meet, and 5 of the 69 features were in use for longer than 30 years. The sites used had to be dated through
of the current study, i.e., that Heighton and Deagan is the most reliable of the three formulas. Beaman used pipe-stem data from eight house sites in Brunswick Town, North Carolina; he recounted and re-measured all the pipe stems used in his project. He found that the Heighton and Deagan results fall closest to the hypothesized means, followed by the Binford formula, and then the Hanson method. His analysis also supported the generally accepted rule that formula dating tends to decrease in accuracy at the end of the 18th century. The biggest difference between Beaman’s study and the current one is that he used entire house-site assemblages, rather than just isolated features. While the current study does include some of the same sites used by Beaman, the pipe-stem counts are not the same for two reasons: individual features were isolated for tighter temporal control, and counts for this study were obtained from the original artifact catalog, not from Beaman’s reanalysis. The loss of artifacts during storage and exhibition likely accounts for some of the differences. Seth Mallios conducted a study on pipe dating in 2005. The purpose of his analysis was to compare his newly created pipe-bowl formula to the three pipe-stem formula dating methods and known feature mean dates to determine which of the four methods was the most useful. The features used, near Jamestown, Virginia, dated from 1607 to 1660. Mallios’s formula is similar to South’s mean ceramic date formula, which is based on Binford’s pipe-stem formula. Mallios found the Hanson formula to produce the smallest difference, at 7 years on average, between the known, mean date and the formula date, and the result fell within the established date range 87.5% of the time. This was followed by the Binford formula at 12 years on average and 37.5%, and Heighton and Deagan at 21 years and 12.5%. Mallios’s use of features from only one site, all deposited within 30 years of one another, obviously restricts the utility of the study for archaeologists working outside his immediate area. Each of the three studies resulted in different conclusions, despite using similar methods in comparing the formula dates to known site dates at one location from one time period. As will be discussed next, while the methods used in the current study were
72 McMillan/Tobacco Pipe Stem Dating Formulas
Site Site number Context Date range Sample size
Sandys 44JC802 Pit 1 1620s 139
Sandys 44JC802 Daub Pit 1630–1640s 130
St. John's 18ST1-23 Dairy 1638–1665 36
St. John's 18ST1-23 Pit Phase I 1638–1665 47
St. John's 18ST1-23 Pit total 1638–1685 60
Tudor Hall 18ST677 Cellar 1650–1675 28
Gloucester 44GL407 Feature 1 1650–1675 65
St. John's 18ST1-23 Ditch 1665–1685 28
Clifts 44WM33 Pit 289 1670–1685 142
Clifts 44WM33 Pit 305 1670–1685 41
Gift 18ST704 Feature 12 1670–1700 222
Old Baltimore 18HA30 Kitchen fill 1675–1700 132
Main Street 18AP76 Feature 4-05 ca. 1695 118
Old Baltimore 18HA30 Well 1680–1710 93
Old Baltimore 18HA30 Kitchen waste 1680–1710 85
Newman's Neck 44NB180 Well 1670–1725 25
Clifts 44WM33 Palisade 1685–1705 41
St. John's 18ST1-23 Potatoe Pit 1685–1715 51
St. John's 18ST1-23 Trash Pit 1685–1715 145Abbel's Wharf 18ST53 Trash Pit 1690–1710 446
Garrett's Chance 18PR703 Feature 2: Root Cellar 1690–1730 33
Harmoney Hall 18PR305 Feature 17 1692–1720 243
Harmoney Hall 18PR305 Feature 63 1692–1720 38
Eden House 31BR52 Feature 2 1680–1740 66
Eden House 31BR52 Feature 311 1680–1740 115
Clifts 44WM33 262AB 1705–1715 31
Clifts 44WM33 Fence 1705–1715 156
Clifts 44WM33 255 A-E 1705–1715 677
Clifts 44WM33 255 F-Y 1705–1715 76
Clifts 44WM33 288S-AD 1705–1715 63
St. Paul's Parish Parsonage 38CH2292 Cellar 1707–1715 28
Fly 18ST329 Floor 1700–1720s 192
Fly 18ST329 Rubble 1700–1720s 66
Main Street 18AP76 Feature 4-04 MCD: 1718 154
Ferry Farm (Maurice Clark) 44ST174 West Pit 1710–1720s 278
Garrett's Chance 18PR703 Feature 21: Trash Pit 1720s 34
Harmoney Hall 18PR305 Feature 22 1720s 36
Table 2. Sites and features used in this study, presented in chronological order.

Northeast Historical Archaeology/Vol. 45, 2016 73
size was arbitrary and much lower than the 900-stem sample size suggested by Audrey Noël Hume (1963: 22), it is larger than the size originally proposed by Harrington (1978: 64). Lastly, no locally made pipes were sampled; only imported white, ball-clay pipes were used.
the historical record or with temporally diagnostic artifacts other than pipes, such as ceramics. If the feature’s date was derived through pipe-stem dating, it was not used. Each feature had to have at least 25 measurable pipe stems to be included. While this sample
Site Site number Context Date range Sample size
Ferry Farm (Maurice Clark) 44ST174 Original Root Cellar 1720s 53
Ferry Farm (Maurice Clark) 44ST174 Replacement Cellar 1720s 26
Clifts 44WM33 269A–F 1720–1730 121
Clifts 44WM33 277A–C 1720–1730 27
Clifts 44WM33 280 1720–1730 135
Clifts 44WM33 Privy 1720–1730 34
Clifts 44WM33 S16 Cellar 1720–1730 250
Clifts 44WM33 S3 Cellar 1720–1730 1322
Leach-Jobson 31BW376-30-1 Builder's Trench 1726–1728 234
Eden House 31BR52 Feature 3 1720–1740 62
South Adgers Wharf 38CH2291 Zone 10 1710–1750 144
Heyward-Washington 38CH108 Feature 65 1730s 318
Heyward-Washington 38CH108 Feature 166 1730s 721
Oxon Hill 18ST175 Well 1720–1750 932
Newman's Neck 44NB180 Cellar 1725–1740s 72
Robert's 18CV350 Feature 40 1720's–1750s 46
Coutanche 31BF85 Cellar 1730–1750 36
Heyward-Washington 38CH108 F178 1740–1750 53
Heyward-Washington 38CH108 Zone 5 1740–1750 96Beef Market 38CH1604 Zone 8 1739–1760 312
Beef Market 38CH1604 Zone 9 1739–1760 347
Leach-Jobson 31BW376-30-1 House Foundation 1728–1776 4751
Espy 31BW376-31-2 House Interior 1731–1776 3296
Dock St. Theater Privy 1750s 32
United Carolina Bank 31CV183 Feature 102 B 1750–1769 83
Russellborough 31BW556-1 House Foundation 1751–1776 50
Cornell House 31CV310 Feature 105 1769 29
South Adgers Wharf 38CH2291 Feature 10 1784 117
South Adgers Wharf 38CH2291 Zone 9 1780s 695
South Adgers Wharf 38CH2291 Zone 3 1790s 489
United Carolina Bank 31CV183 Feature 102A 1769–1820 91
Cornell House 31CV310 Midden 1782–1814 70
Table 2. Sites and features used in this study, presented in chronological order. (continued)

74 McMillan/Tobacco Pipe Stem Dating Formulas
hypothetical example: Feature 1 is assigned a hypothetical mean date of 1750 and Feature 2 is assigned a date of 1700. If the Binford results for Feature 1 are 1755 and for Feature 2 are 1695, then the raw average from Test 1 would be five years, whereas the actual mean differ-ence from Test 2 would be zero years. Next, for Test 3, the results from the first test were used to determine how often each formula produced the date closest to the hypothesized mean. For example, the formula results of 1687 (Binford), 1682 (Hanson), and 1698 (Heighton and Deagan) from the Old Baltimore site’s well feature show that the Heighton and Deagan formula produced the date closest to the hypothesized mean of 1695. A simple percentage was calculated to determine which formula technique is most likely to produce the most accurate mean date. Lastly, for Test 4, simple percentages were calculated to determine how often the formula date fell within the date range assigned by the excavator. For example, the Old Baltimore well’s assigned date range is 1680–1710, so the formula dates of 1687 (Binford), 1682 (Hanson), and 1698 (Heighton and Deagan) all fall within that time period. The data were compared in five different ways. First, all of the data was combined for an overall comparison. Then, all of the data was split based on date ranges, using Harrington’s original five time periods. In the third approach the data were compared by splitting the data set into four groups based on sample size: 25–99 stems, 100–299 stems, 300-999 stems, and 1,000–5,000 stems. Next, outliers with results diverging more than 30 years from the hypothesized mean were excluded; these results may indicate errors due to the vagaries of sampling or some other unknown factor. Using these criteria, 24 features were removed, leaving 45 features remaining. Using the smaller data set, features were again divided based on date ranges and by sample size. Lastly, the results were split into the four states for a more detailed regional analysis. In almost every case, the Heighton and Deagan method produced the best mean date in all four tests, showing it to be the most accurate and most reliable of the three formula dating techniques.
In order to determine which of the three methods worked best, four tests were conducted. First, the formula means were calculated and then compared to the means assigned by the excavator in the site report (the “hypothesized means”) to determine the absolute mean difference, or, the average number of years the formula dates diverged from the hypothesized mean. These hypothesized means were the dates assigned for each individual feature and not overall site occupations. For example, the well from the Old Baltimore site (18HA30) in Maryland dated from 1680 to 1710 (Davis et al. 1999); thus, the hypothesized mean is 1695. This date of 1695 was then compared to the Binford (1687), Hanson (1682), and Heighton and Deagan (1698) formula results. For this first test, the Binford date was 8 years away from the hypothesized mean, the Hanson result is 13 years away, and the Heighton and Deagan formula date is 3 years away from the hypothesized mean of 1695. Thus, in this example, the Heighton and Deagan formula is shown to be the most accurate of the three formula methods. Using the same variables as Test 1, a repeated measures ANOVA was used to compare the hypothesized mean to the three formula means. This analysis of means determines whether there are statistically significant differences at the .05 level among the four mean dates tested (hypothesized, Binford, Hanson, and Heighton and Deagan). A p value above .05 would indicate that there is no meaningful difference between the hypothesized date and the formula date, whereas a p value below .05 would indicate that there is a meaningful difference between the hypothesized mean and the formula date. A small p value would signify that the formula did not produce an accurate result, whereas a large p value would signify that the formula did produce a statistically accurate result. A post hoc pairwise comparison, using a Bonferroni correction, was calculated in SPSS to determine the actual mean difference between the hypothesized mean and the three formula means. This comparison of means takes into account whether the formula date is earlier or later than the hypothesized date, whereas the comparisons of dates from the first test only use raw averages. Here is a
Northeast Historical Archaeology/Vol. 45, 2016 75
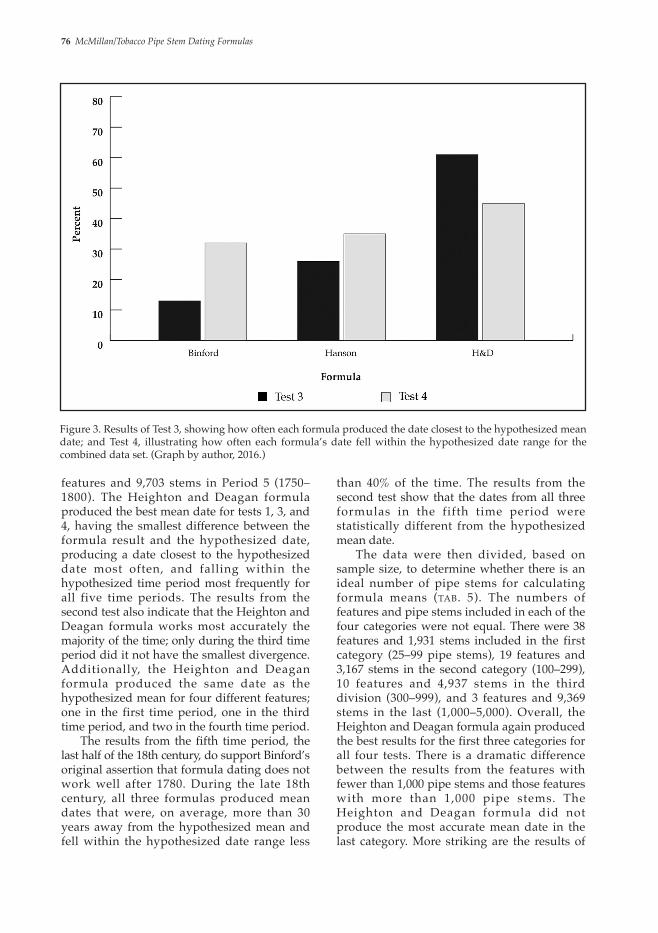
level, indicating that the two linear formulas did not produce accurate dates. The third test’s results from the combined data again show the Heighton and Deagan formula to be the most reliable. The Heighton and Deagan–formula means were closest to the hypothesized mean date, and, thus, most likely to produce the most accurate date 61% of the time, followed by Hanson at 26%, and Binford’s formula, producing the best date only 13% of the time (fig. 3). The fourth test from the combined data also indicates that the Heighton and Deagan formula is the most accurate, with mean dates falling into the assigned date range 45% of the time. The other two methods fall within the range only 35% (Hanson) and 32% (Binford) of the time (fig. 3). To determine whether a certain formula was most accurate during a specific time period, the features were divided based on Harrington’s five time periods (tab. 4). Unfortunately, each time period did not have an equal number of features and pipe stems. There were 4 features and 352 stems in Period 1 (1620–1650), 6 features and 364 stems in Period 2 (1650–1680), 21 features and 2,884 stems in Period 3 (1680–1710), 27 features and 6,101 stems in Period 4 (1710–1750), and 11
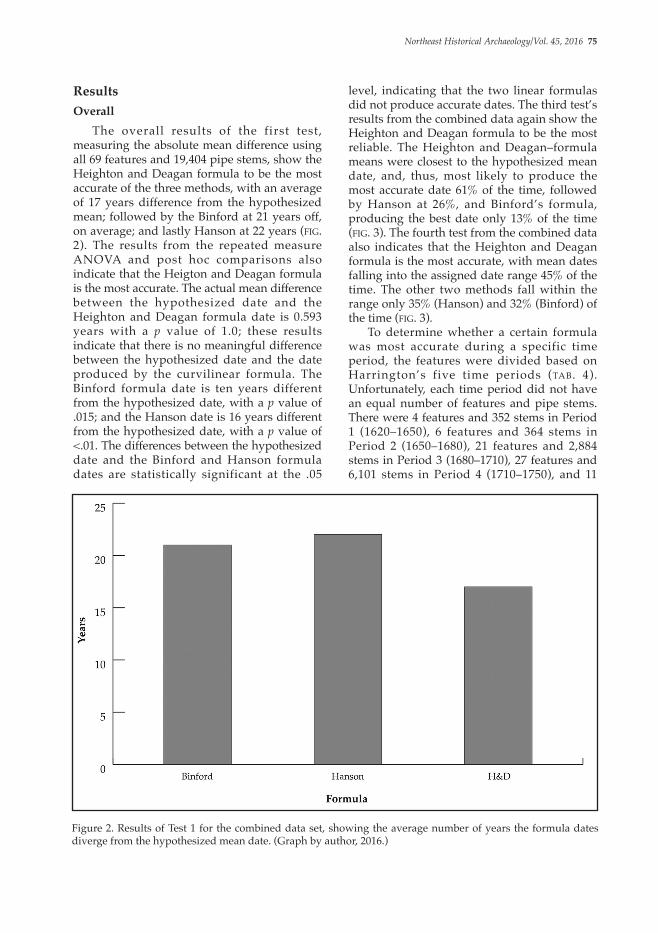
ResultsOverall The overall results of the first test, measuring the absolute mean difference using all 69 features and 19,404 pipe stems, show the Heighton and Deagan formula to be the most accurate of the three methods, with an average of 17 years difference from the hypothesized mean; followed by the Binford at 21 years off, on average; and lastly Hanson at 22 years (fig. 2). The results from the repeated measure ANOVA and post hoc comparisons also indicate that the Heigton and Deagan formula is the most accurate. The actual mean difference between the hypothesized date and the Heighton and Deagan formula date is 0.593 years with a p value of 1.0; these results indicate that there is no meaningful difference between the hypothesized date and the date produced by the curvilinear formula. The Binford formula date is ten years different from the hypothesized date, with a p value of .015; and the Hanson date is 16 years different from the hypothesized date, with a p value of <.01. The differences between the hypothesized date and the Binford and Hanson formula dates are statistically significant at the .05
Figure 2. Results of Test 1 for the combined data set, showing the average number of years the formula dates diverge from the hypothesized mean date. (Graph by author, 2016.)
76 McMillan/Tobacco Pipe Stem Dating Formulas
than 40% of the time. The results from the second test show that the dates from all three formulas in the fifth time period were statistically different from the hypothesized mean date. The data were then divided, based on sample size, to determine whether there is an ideal number of pipe stems for calculating formula means (tab. 5). The numbers of features and pipe stems included in each of the four categories were not equal. There were 38 features and 1,931 stems included in the first category (25–99 pipe stems), 19 features and 3,167 stems in the second category (100–299), 10 features and 4,937 stems in the third division (300–999), and 3 features and 9,369 stems in the last (1,000–5,000). Overall, the Heighton and Deagan formula again produced the best results for the first three categories for all four tests. There is a dramatic difference between the results from the features with fewer than 1,000 pipe stems and those features with more than 1,000 pipe stems. The Heighton and Deagan formula did not produce the most accurate mean date in the last category. More striking are the results of
features and 9,703 stems in Period 5 (1750–1800). The Heighton and Deagan formula produced the best mean date for tests 1, 3, and 4, having the smallest difference between the formula result and the hypothesized date, producing a date closest to the hypothesized date most often, and falling within the hypothesized time period most frequently for all five time periods. The results from the second test also indicate that the Heighton and Deagan formula works most accurately the majority of the time; only during the third time period did it not have the smallest divergence. Additionally, the Heighton and Deagan formula produced the same date as the hypothesized mean for four different features; one in the first time period, one in the third time period, and two in the fourth time period. The results from the fifth time period, the last half of the 18th century, do support Binford’s original assertion that formula dating does not work well after 1780. During the late 18th century, all three formulas produced mean dates that were, on average, more than 30 years away from the hypothesized mean and fell within the hypothesized date range less
Figure 3. Results of Test 3, showing how often each formula produced the date closest to the hypothesized mean date; and Test 4, illustrating how often each formula’s date fell within the hypothesized date range for the combined data set. (Graph by author, 2016.)

Northeast Historical Archaeology/Vol. 45, 2016 77
Combined date by time period
Formula Test 1 Test 2 p-value Test 3 Test 4
1620–1650(n=4 features)(n=352 stems)
Binford 23 21 1.000 50% 50%
Hanson 19 11 1.000 0% 50%
H & D 16 -13 1.000 50% 50%
1650–1680(n=6 features)(n=364 stems)
Binford 26 23 .256 17% 17%
Hanson 20 17 .400 0% 33%
H & D 9 -.831 1.000 83% 83%
1680–1710(n=21 features)(n=2,884 stems)
Binford 23 3 1.000 0% 29%
Hanson 20 7 .817 33% 43%
H & D 15 -7 .848 67% 48%
1710–1750(n=27 features)(n=6,101 stems)
Binford 15 2 1.000 19% 37%
Hanson 16 11 .027* 37% 37%
H & D 14 -2 1.000 44% 37%
1750–1800(n=11 features)(n=9,703 stems)
Binford 32 30 .017* 9% 27%
Hanson 44 44 .003* 9% 18%
H & D 30 28 .025* 82% 36%
Table 3. Results from the combined data set split by time period. * p<.05.
Table 4. Results from the combined data set split by sample size. * p<.05.
Combined date by sample size
Formula Test 1 Test 2 p-value Test 3 Test 4
25–99(n=38 features)(n=1,931 stems)
Binford 22 12 .058 13% 37%
Hanson 22 17 .001* 21% 34%
H & D 16 1 1.000 66% 50%
100–129(n=19 features)(n=3,167 stems)
Binford 20 4 1.000 16% 26%
Hanson 20 9 .842 32% 32%
H & D 18 -6 1.000 53% 42%
300–999(n=10 features)(n=4,937 stems)
Binford 25 18 .356 0% 11%
Hanson 33 27 .057 22% 22%
H & D 22 13 .802 78% 22%
1000–5000(n=3 features)
(n=9,369 stems)
Binford 4 -4 .463 33% 67%
Hanson 2 2 .710 67% 100%
H & D 7 -7 .309 0% 67%
Tests 1 and 2 between the first three categories and the fourth category. The formula means averaged 22 years off the hypothesized means for features with fewer than 1,000 pipe stems compared to an average of 6 years for features with more than 1,000 pipe stems. Although there
were only 3 features in the fourth category compared to the remaining 66 features in the first three categories, these results do support Audrey Noël Hume’s (1963: 22) recommendation that at least 900 pipe stems are needed for accurate calculation of mean pipe-stem dates.

78 McMillan/Tobacco Pipe Stem Dating Formulas
different result, however. Test 2 indicates that once the outliers are removed, the Binford formula is the most centered on the hypothesized mean with results of 2 years off and a p value of .272. Both the other two formulas produced means that were significantly different from the hypothesized mean. The Hanson date was 8 years off, with a p value <.001, and the Heighton and Deagan result was -5 with a p value of .021. This indicates that the Heighton and Deagan formula is more likely to produce dates in a wide range, both much earlier and later than the hypothesized mean date, especially compared to the Binford formula. Again, Test 2 takes into account whether the formula date is earlier or later than the hypothesized date, whereas Test 1 is a comparison of the raw averages. The results of the adjusted data set, in which outliners with formula mean dates more than 30 years away from the hypothesized means were removed, indicate that all three formulas improved in accuracy. While this is an obvious statement, it does show that formula dating is susceptible to vagaries of sampling. It is noteworthy that the gaps between the Heighton and Deagan results and those of the other two formulas shrank for
Adjusted Data set Next, outliers with results more than 30 years from the hypothesized mean were removed, leaving an adjusted sample size of 45 features with 15,745 pipe stems. Again, the Heighton and Deagan formula produced the best mean date for the first, third, and fourth tests, and was shown to be the most accurate of the three methods, with an average of 9 years off the hypothesized mean; followed by the Binford at 11 years off, on average; and lastly, Hanson, at 12 years (fig. 4). The third test’s results from the adjusted data set again show the Heighton and Deagan formula to be the most reliable. The Heighton and Deagan–formula means were closest to the hypothesized mean date, thus, most likely to produce the most accurate date 53% of the time, followed by Hanson with 29%, and Binford’s formula at only 18% (fig. 5). The fourth test, from the combined, adjusted data set, also indicates that the Heighton and Deagan formula is the most accurate, with mean dates falling into the assigned date range 58% of the time. The other two methods fall within the range only 44% (Hanson) and 49% (Binford) of the time (fig. 5). Test 2, the post hoc pairwise comparison, using a Bonferroni correction, produced a
Table 5. Results from the adjusted data split by time period. * p<.05.
Adjusted data by time period
Formula Test 1 Test 2 p-value Test 3 Test 4
1620–1650(n=1 features)(n=130 stems)
Binford 3 –– –– 100% 100%
Hanson 4 –– –– 100% 0%
H & D 25 –– –– 0% 0%
1650–1680(n=4 features)(n=276 stems)
Binford 16 12 .995 25% 25%
Hanson 13 8 1.000 0% 50%
H & D 8 -7 1.000 75% 75%
1680–1710(n=14 features)(n=2,221 stems)
Binford 14 7 .514 0% 50%
Hanson 13 10 .020* 21% 43%
H & D 7 -3 1.000 79% 64%
1710–1750(n=22 features)(n=4,934 stems)
Binford 10 -3 1.000 23% 45%
Hanson 10 7 .067 41% 45%
H & D 11 6 .136 36% 45%
1750–1800(n=4 features)
(n=8,180 stems)
Binford 7 3 1.000 25% 75%
Hanson 15 15 .311 25% 50%
H & D 7 1 1.000 50% 100%

Northeast Historical Archaeology/Vol. 45, 2016 79
Figure 5. Results of Test 3, showing how often each formula produced the date closest to the hypothesized mean date; and Test 4, illustrating how often each formula’s date fell within the hypothesized date range for the adjusted data set. (Graph by author, 2016.)
Figure 4. Results of Test 1 for the adjusted data set, showing the average number of years the formula dates diverge from the hypothesized mean date. (Graph by author, 2016.)

80 McMillan/Tobacco Pipe Stem Dating Formulas
and 4,934 stems in Period 4 (1710–1750), and 4 features and 8,180 stems in Period 5 (1750–1800). The results from this data set were not nearly as straightforward as with those of the previous assessments (tab. 6). First, there were not enough features in the first period to make any meaningful comments. Secondly, the Heighton and Deagan formula produced the best mean dates for Periods 2 and 3, whereas for Periods 4 and 5 there was no clear best method. This does support the suggestion that once major outliers are removed the two linear formulas and the one curvilinear formula perform equally well, which, in turn, suggests that the Heighton and Deagan formula adjusts to and works best for data sets that may have sampling errors. Similar to the previous comparisons, the results from the adjusted data grouped based on sample size were not as clear in showing which formula was the most accurate (tab. 7). For these tests, there were 25 features with 1,306 stems included in the first category (25–99 pipe stems), 12 features and 1,976 stems in the second category (100–299), 5 features and 3,094 stems in the third division (300–999), and 3 features with 9,369 stems in the last (1,000–5,000). The Heighton and Deagan formula produced the best results for Tests 1, 3, and 4 for the first three categories. However, Binford produced the best results for Test 2 for all four categories. There was no clear best method for
three of the tests. For example, Test 1 from the combined data shows that the Heighton and Deagan formula produces a mean date four years closer on average to the hypothesized mean than the Binford formula, whereas the same test on the adjusted data shows that the Heighton and Deagan formula means are, on average, only two years closer to the hypothesized mean than the Binford formula. From the combined data, there is a 48-point difference between the percentages of the Heighton and Deagan and the Binford results for Test 3, compared to a 35-point difference from the adjusted data set. Similarly, the point difference in percentages between the Heigton and Deagan and the Binford formulas for Test 4 of the combined data is 13, compared to a 9-point difference in percentages for the adjusted data set. These results suggest that, because the Heighton and Deagan method works better with outliers than the other two formulas, the curvilinear formula adjusts for and takes into account sampling errors more efficiently than do the Binford and Hanson linear formulas. The adjusted data set was broken into groups based on Harrington’s five time periods. Unfortunately, each time period did not have an equal number of features and pipe stems. There was only 1 feature with 130 stems in Period 1 (1620–1650), 4 features and 276 stems in Period 2 (1650–1680), 14 features and 2,221 stems in Period 3 (1680–1710), 22 features
Table 6. Results from the adjusted data split by sample size. * p<.05.
Adjusted data by sample size
Formula Test 1 Test 2 p-value Test 3 Test 4
25–99(n=25 features)(n=1,306 stems)
Binford 11 2 .545 20% 56%
Hanson 12 8 .001* 24% 52%
H & D 9 6 .019* 56% 56%
100–299(n=12 features)(n=1,976 stems)
Binford 11 5 1.000 17% 42%
Hanson 11 8 .590 25% 25%
H & D 8 -5 .800 58% 67%
300–999(n=5 features)
(n=3,094 stems)
Binford 17 3 1.000 0% 20%
Hanson 16 10 1.000 40% 20%
H & D 13 -2 1.000 60% 40%
1000–5000(n=3 features)
(n=9,369 stems)
Binford 4 -4 .463 33% 67%
Hanson 6 6 .710 67% 100%
H & D 7 -7 .309 0% 67%

Northeast Historical Archaeology/Vol. 45, 2016 81
Table 7. Results from each state. * p<.05.
State Formula Test 1 Test 2 p-value Test 3 Test 4
Virginia(n=22 features)(n=3,904 stems)
Binford 17 5 1.000 32% 23%
Hanson 15 8 .414 27% 32%
H & D 16 6 1.000 41% 45%
Maryland(n=23 features)(n=3,265 stems)
Binford 22 12 .074 4% 39%
Hanson 19 15 .003* 17% 43%
H & D 9 -1 1.000 78% 65%
North Carolina(n=12 features)(n=8,883 stems)
Binford 25 3 1.000 17% 33%
Hanson 24 16 1.000 42% 42%
H & D 26 -.077 1.000 42% 33%
South Carolina(n=12 features)(n=3,352 stems)
Binford 26 19 .163 0% 8%
Hanson 36 31 .010* 17% 8%
H & D 24 16 .308 83% 25%
Table 8. Comparison of results by region. * p<.05.
Region Formula Test 1 Test 2 p-value Test 3 Test 4
Chesapeake(n=45 features)(n=7,179 stems)
Binford 19 9 .100 13% 36%
Hanson 17 12 .001* 24% 36%
H & D 12 -3 1.000 62% 53%
Carolinas(n=24 features)
(n=12,235 stems)
Binford 25 11 .510 8% 21%
Hanson 32 24 .007* 29% 67%
H & D 25 8 1.000 63% 29%
the last category; this is likely due to the fact that there were only three features included in that sample. Again, the results from Test 2 suggest that when Heighton and Deagan is wrong it varies widely, as compared to Binford, which tends to be more centered on the hypothesized mean.
Regional Variation Once the data were grouped based on the locations of the sites, there was more variation present in the results (tab. 8). There appears to be some regional variation within the overall trends; sites from the Chesapeake, i.e., Virginia and Maryland, produce much better results than sites in the Carolinas. Sites from Virginia and Maryland have much smaller differences between the formula mean and the hypothesized mean for Test 1 and are more likely to fall within the estimated time period
for Test 4. The results of Test 2 will be discussed further below, in a comparison of each state. For Maryland, the Heighton and Deagan formula produced the most accurate results in all four tests; the formula means were, on average , 9 years d i fferent f rom the hypothesized mean for Test 1, and had the smallest difference for Test 2, with -1 years. This formula was most likely to produce the mean closest to the hypothesized mean, 78% of the time for Test 3, and fell within the given time period 65% of the time for Test 4. There was little difference between the Hanson and Binford formula results; the differences between the formula means from the two linear methods and the hypothesized means were at least ten years greater than those of Heighton and Deagan for both Tests 1 and 2, and the results from Tests 2 and 3 produced much smaller percentages than the curvilinear formula.

82 McMillan/Tobacco Pipe Stem Dating Formulas
In comparing the utility of formula dating between the Chesapeake and the Carolinas, Tests 1, 2, and 4 were used (tab. 9). Overall, for both regions, the Heighton and Deagan again produced the best results, followed by the Binford and then the Hanson methods; however, it should be noted that these results are not nearly as clear for the Carolinas as they are in the Chesapeake. For both regions, the differences between the Hanson date and the hypothesized date calculated for Test 2 were statistically significant. The differences between the two regions are striking, with sites in the Chesapeake producing much better results than in the Carolinas. In the Chesapeake, the results for Test 1 were all in the teens, whereas, for the Carolinas, the dates were on average between 25 and 32 years from the hypothesized mean. The results for Test 2 were also much smaller in the Chesapeake. The results from Test 4 were a little more ambiguous, but, for the most part, also showed that formula dating works better in the Chesapeake than in the Carolinas. There are several avenues to explore to determine the reason these differences exist. Perhaps the most obvious is that there are dif-ferences between the two regions in the dates of the sites. In this sample, there are no sites that date after the 1750s in the Chesapeake and no site earlier than 1680 in the Carolinas. When only sites with occupations between 1680 and the 1750s were included, the differ-ences between the two regions are reduced, but the Chesapeake still produced slightly better results for Tests 1 and 2 (tab. 10). Secondly, it was hypothesized that sites in the Chesapeake had tighter dates (i.e., shorter date ranges assigned by the excavators) than sites in the Carolinas, which would, in turn, reduce the likelihood of errors in the hypothesized
In Virginia, all three formulas produced similar results for all of the tests with no clear “best” formula. The results from the first two tests had average dates that were all within two to three years of one another. The percentages from Tests 3 and 4 were also too close to make a judgment on which formula works best. The results from North Carolina are quite interesting and highlight the major difference between Tests 1 and 2. The average variation between the formula means and hypothesized means are large, between 24 and 26 years, for Test 1. However, Test 2 produced some of the smallest average differences. This is because the formula results are widely varied in North Carolina, from as much as 82 years earlier and up to 51 years later than the hypothesized mean. With this much variation above and below the mean date, the post hoc pairwise comparison, using a Bonferroni correction, produced falsely close results. These results provide one example of why archaeologists need to evaluate the data they are using and not simply rely on statistics to provide answers. Like the Virginia results, all three formulas produced similar means for the first two tests and similar percentages for the second two. Again, there is no clear “best” method for North Carolina South Carolina, like Maryland, follows the trend, with the Heighton and Deagan formula producing the most reliable results. “Best” is quite relative in this case, however. Heighton and Deagan had the smallest difference between hypothesized means and formula means, at 26 years for Test 1 and 16 years for Test 2, but the Binford method produced very similar mean dates, with 26 years and 19 years, respectively. Only the Hanson technique had a statistically significant difference between the formula mean and the hypothesized mean for Test 2.
Table 9. Results by region with only sites that date between 1680 and 1750. * p<.05.
Region (1680–1750s) Formula Test 1 Test 2 p-value Test 3 Test 4
Chesapeake(n=40 features)(n=6,652 stems)
Binford 20 9 .100 33% 10%
Hanson 18 13 .001* 35% 28%
H & D 12 -2 1.000 55% 65%
Carolinas(n=21 features)
(n=10,934 stems)
Binford 21 5 1.000 10% 24%
Hanson 27 18 .061 33% 76%
H & D 21 2 1.000 57% 33%

Northeast Historical Archaeology/Vol. 45, 2016 83
it would be nearly impossible for authors of the site reports to tell Dutch and English pipes apart. These formula dating methods were developed to be used on English pipes only, not Dutch; however, Harrington never stated how he determined the country of origin for each of the 330 pipes from which he developed his original technique, and his sample may have included unmarked, unidentified Dutch pipes (Harrington 1954). There was a much larger Dutch presence in the Chesapeake, even into the early 18th century, compared to the Carolinas, and this may account for some of the differences (Pagan 1982; Wilcoxen 1987; Edgar 1998; Hatfield 2004; Pecoraro and Givens 2006; McMillan 2015, 2016). Based on the results of this project, the formulas work better in the Chesapeake; these methods origi-nated in Virginia and may be based on sam-ples that included unmarked, unidentified Dutch pipes. When pipe-stem dating does not work, the presence of Dutch pipes is often cited as the reason because it is assumed that Dutch pipes have smaller bore diameters and would thus produce dates later than a site’s actual occupation (Walker 1965; Oswald 1975). Timothy Riordan discussed these issues at the Smith’s Townland site in St. Mary’s City, Maryland (Riordan 1991). There were two sub-sites located on the property: the Big Pit complex, which dated to 1650–1670, and the Smith’s Ordinary, which was occupied from 1666–1678. There were a significant number of Dutch pipes on both sites, 84% and 74%, respectively. Measuring 102 Dutch pipes and 23 English pipes, he
date. However, South Carolina actually had the smallest average occupation span, 13 years; followed by Maryland, 15 years; Virginia, 27 years; and North Carolina, 32 years. The fact that both Virginia and North Carolina had fairly long average occupation spans may explain why there was no clear “best” method for either of those states. Perhaps, the linear methods do not work as well with very tightly dated sites or, conversely, perhaps the curvilinear method does not work well on sites with long occupation spans. The long average occupation spans from North Carolina may also explain the issues with the Hanson results. The Hanson-method results produced means that were far away from the hypothesized date for Tests 1 and 2, but were most likely to fall within the given time period (Test 4). These results indicate that, while Hanson produced the date closest to the hypothesized date more often, when it was wrong it was very wrong. This is likely because there are ten formulas in the Hanson method, and one must pick the formula based on a hypothesized date range; many of the Hanson date ranges did not encompass all the occupation spans assigned by the excavator.
The Dutch Question Differences in trade patterns may also account for the variation between the two regions. While the goal was to use sites with only English ball-clay pipes, the likelihood is high of Dutch pipes being present at the Chesapeake sites, and without a maker’s mark
Table 10. Results comparing Dutch and English pipes, 1650–1680.
Origin(1650–1680)
Formula Date Test 1
Dutch(n=64 stems)
Binford 1663 2
Hanson 1666 1
H & D 1682 17
English(n=70 stems)
Binford 1664 1
Hanson 1667 2
H & D 1682 17
Total(n=134 stems)
Binford 1664 1
Hanson 1667 2
H & D 1682 17

84 McMillan/Tobacco Pipe Stem Dating Formulas
10/64 to 5/64 in., whereas the English pipes produced an almost perfect bell curve, as Harrington predicted. However, when the three formula dating methods are compared, the Dutch and English pipes produced nearly identical dates (tab. 11). The histogram from the combined Dutch and English pipes, while not perfect, does conform to what would be expected for this time period (fig. 7). The results from the third period are very different. There were a total of 101 measurable pipes (30 Dutch and 71 English) for the 1680–1710 time period (fig. 8). The variation in the bore diameters decreased for the Dutch pipes, but increased for the English pipes. The Dutch pipes were heavily skewed toward the larger bores, whereas the graph for the English pipes is dipped in the middle. The graph for the combined data is also unexpectedly skewed, given that all of these marked pipes date to the turn of the 18th century (fig. 9). The formula results are even more surprising. The Dutch pipes are actually much larger and, thus, produce dates much earlier than expected. This is in direct opposition to what was expected, based on earlier studies (Walker 1965; Oswald 1975;
found that Dutch pipe bores were more varied in diameter, ranging from 5/64 to 9/64 in., while the English pipes from the same time period tended to skew larger, from 6/64 to 9/64 in. Paul Huey (1988: 587) performed a similar analysis on Dutch and English pipes with analogous results. For a separate project, the author has cataloged over 1,500 marked Dutch and English pipes from the Chesapeake, dating from 1630 to 1730 (McMillan 2015, 2016). Using a sample from two sites in Maryland and two sites in Virginia, a test similar to Riordan’s was conducted. The pipes were divided into Harrington’s five time periods based on makers’ marks with known dates of manufacture. There were not enough marked pipes with measurable bore diameters from the first time period (1620–1650), and data were not collected for pipes made after 1730, thus, these comparisons could only be made for Harrington’s second and third time periods. There were a total of 134 measurable pipes (64 Dutch and 70 English) for the 1650–1680 time period (fig. 6). The histogram shows that the Dutch pipes vary immensely in size, from
Figure 6. A comparison of Dutch and English pipe stem-bore diameters for the second time period (1650–1680). (Graph by author, 2016.)

Northeast Historical Archaeology/Vol. 45, 2016 85
of change as English pipes. However, this does not necessarily mean that pipes from the Netherlands are always the culprits when poor formula results are attained, especially given the high probability of Dutch pipes in Chesapeake assemblages, where formula dating works much better compared to the Carolinas, a place less likely to have Dutch pipes. Variation within the sample of English
Gibb 1996). The formula results from the English pipes are very accurate, but this accuracy decreases for the combined data set. The comparisons of the Dutch and English pipes suggest that a truly random sample is needed for these formula dating methods to work. These results also suggest that bore diameters of Dutch pipes have much more variation and do not follow the same patterns
Figure 7. Histogram of the combined Dutch and English pipe stem-bore diameters for the second time period (1650–1680). (Graph by author, 2016.)
Table 11. Results comparing Dutch and English pipes, 1680–1710.
Origin(1680–1710)
Formula Date Test 1
Dutch(n=30 stems)
Binford 1632 63
Hanson 1643 52
H & D 1662 33
English(n=71 stems)
Binford 1680 15
Hanson 1679 16
H & D 1693 2
Total(n=101 stems)
Binford 1666 29
Hanson 1668 27
H & D 1683 12

86 McMillan/Tobacco Pipe Stem Dating Formulas
Figure 8. A comparison of Dutch and English pipe stem-bore diameters for the third time period (1680–1710). (Graph by author, 2016.)
Figure 9. Histogram of the combined Dutch and English pipe stem-bore diameters for the third time period (1680–1710). (Graph by author, 2016.)

Northeast Historical Archaeology/Vol. 45, 2016 87
that were occupied after 1750 should be critically examined. Ivor Noël Hume (1969: 303) has suggested that pipe-stem formula dating should not be used on sites dating prior to 1680. The results of this study are inconclusive; for the combined data, the dates were off by more than 15 years on sites that date between 1620 and 1680 (except for the Heighton and Deagan test in the second time period), although the results improved considerably for the adjusted data set. However, recent research on 17th-century sites on the Northern Neck of Virginia have found that pipe-stem formulas produced dates that are nearly identical to hypothesized means from historical records and mean ceramic dates, suggesting that these methods are useful dating tools on earlier sites (Hatch, McMillan, and Heath 2013; McMillan and Hatch 2013; McMillan and Heath 2013; Hatch, Heath, and McMillan 2014; McMillan, Hatch, and Heath 2014). Some scholars have suggested that at least 900 pipe stems are needed for formula dating to work (A. Noël Hume 1963; I. Noël Hume 1969). The outcome of this study supports the assertion that the larger the sample size, the better the formula results. There is a striking difference between the results of samples with less than 1,000 stems and those with more than 1,000 pipe stems, where the mean dates produced are much more accurate using the larger sample sizes. However, this result should not be taken to mean that formula dating never works on small sample sizes. These methods still should be used, but critically, recognizing the potential for error. A comparison of the combined data set with the adjusted data set indicates that once outliers are removed, there is not much of a difference between the three formula dating methods. While the Heighton and Deagan method continued to produce the most accurate date, it was not by much. These results suggest that the curvilinear formula adjusts to and accounts for the vagaries of sampling and other issues with the data set, whereas the two linear regression formulas do not work well with data sets that have sampling errors. The three formula dating methods do work best in the Chesapeake (Virginia and Maryland), compared to North and South Carolina. The variation seen in these results may be due to sample biases. The Chesapeake
pipes may also account for these differences. The English assemblage from the 1650–1680 time period was mainly comprised of pipes from Bristol, whereas the 1680–1710 assemblage had pipes from Bristol and London. Perhaps sites in the Carolinas had pipes from a variety of English ports, which could explain these differences. Again, given that these methods were developed based on pipe assemblages in Virginia, it is quite likely that pipe origins could have an effect on the accuracy of the formulas.
Discussion Although there was some variation in the results depending on how the sample was arranged overall, determining the average number of years the formula means diverge from the hypothesized means, how often each formula produces the closest date, and how often the formula means fall within the time period assigned to the data set indicate that, of the three formula dating techniques, the Heighton and Deagan method produced the most accurate and reliable results. The outcomes of all four tests on the combined data set clearly demonstrate this result, especially given that, for Test 2, both the Binford and Hanson dates were statistically different than the hypothesized date. Test 1, on the time periods for both the complete data set and for the adjusted data set, indicates that the Heighton and Deagan formula is overwhelmingly the best method for 17th-century sites (i.e., sites that fall within the first three of Harrington’s time periods), whereas there does not appear to be much of a difference between the formula results in the 18th century. For example, the Binford date is at least two times farther away from the hypothesized mean than the Heighton and Deagan date for the second period of the overall data, and the second and third periods of the adjusted data set. The difference between the same two formula results in the 18th century is not more than two years apart for both data sets. The tests also indicate that formula dating does not work well after 1750. This supports Binford’s original assertion that formula dating should not be used on sites that date after 1780 (Binford 1962). These results also suggest that pipe-stem formula dates on sites
88 McMillan/Tobacco Pipe Stem Dating Formulas
am often worried by the ever-increasing tendency to let statistics substitute for logic” (Alexander 1979: 85). He was right to worry, and archaeologists need to evaluate what these dates are used for and how they arrive at the results. The complete reliance on one method, the Binford formula, is, in and of itself, biased when there have been two other methods waiting for 40 years to be utilized. Although the results of this study found the Heighton and Deagan formula to be the most accurate, all methods available––the Binford, the Hanson, the Heighton and Deagan, and even the Harrington––should be used in conjunction with one another and other dating techniques to help determine site dates, uses, and anomalies.
Acknowledgments I would like to thank my master’s thesis committee at East Carolina University (ECU), including Charles Ewen, Patricia Samford, Benjamin Saidel, and Shahna Arps, for all of their help and support throughout the process of researching and writing the original study on which this work is based. Charlie deserves special thanks for his continued support and encouragement after I graduated and left ECU, as does Tricia for offering helpful comments and suggestions to improve my work. Thank you also to those who helped me collect the data for this study, especially David Muraca of the George Washington Foundation; Sara Rivers-Cofield and Rebecca Morehouse of the Maryland Archaeological Conservation Laboratory; Silas Hurry of Historic St. Mary’s City; Martha Zierden of the Charleston Museum; Thomas Beaman of Wake Technical Community College; and Kimberly Pyszka of the Department of Sociology, Anthropology, and Geography at Auburn University of Montgomery. Barbara Heath of the Department of Anthropology at the University of Tennessee and Brad Hatch of Dovetail Cultural Resource Group have read and reread many versions of this study and have provided invaluable comments and suggestions. Lastly, David Mercer of the Department of Statistics, Operations, and Management Science in the College of Business Administration at the University of Tennessee helped with the statistics for this paper. While all of this help has been essential to my research, I acknowledge that any errors in fact or interpretation are entirely my own.
data set has twice as many sites as the Carolina assemblage, and, with a larger sample size, the differences between the two regions may become clearer. The regional variation may also be due to differences in trade patterns between the two areas. Specifically, the presence in the Chesapeake of pipes from the Netherlands and lack of a significant Dutch influence in the Carolinas may account for the variation.
Conclusions Many archaeologists (Walker 1965; Oswald 1975; Alexander 1979; A. Noël Hume 1979; Hole 1980) have expressed concern over the reliance on a dating method that consistently produces incorrect mean dates. Particularly, Adrian Oswald (1975: 126) and Audrey Noël Hume (1979: 6) have stated that a formula date off by more than 15 years is less than adequate. By this measure, all three formula methods fail; and while 15 years in historical archaeology is enough of a difference to be interpretively significant, other factors must be taken into account when judging usefulness. One should not expect a formula to produce a perfect date every time. Formula mean dates can be useful in understanding the general time frame of a site’s occupation and be used as a relative dating method. Formula dating, as with all dating methods, should not stand alone in the interpretation of a site. It should be used in conjunction with other methods and can even be used to point out previously missed factors. An anomalous pipe-stem date that does not match the results of other artifacts and historical records should be noted as a red flag. Its occurrence could point to any number of issues that may have previously been overlooked, including factors that could impact interpretation, such as unknown trade relations, a longer occupation period than previously interpreted, or an earlier undocumented deposition. Binford also pointed out that the formula date may represent the mean date between two separate occupations (Binford 1962: 67). Formula dating has been widely used by historical archaeologists since the 1960s, and while there is comfort in the simplicity of a date produced by a seemingly unbiased mathematical equation, archaeologists need to step back and reconsider. Ivor Noël Hume once said of formula dating: “I must admit I

Northeast Historical Archaeology/Vol. 45, 2016 89
Fox, Georgia Lynne 1998 The Study and Analysis of the Kaolin Clay
Tobacco Pipe Collection from the Seventeenth-Century Archaeological Site of Port Royal, Jamaica . Ph.D. diss., Department of Anthropology, Texas A&M University, College Station, TX. University Microfilms International, Ann Arbor, MI.
Gibb, James G. 1996 The Archaeology of Wealth: Consumer
Behavior in English America. Plenum Press, New York.
Hanson, Lee, Jr. 1971 Kaolin Pipestems—Boring in on a Fallacy.
Conference on Historic Site Archaeology Papers 1969 4(1): 2–15.
1972 A Few Cents More. Conference on Historic Site Archaeology Papers 1971 6: 254–257.
Harrington, J. C. 1951 Tobacco Pipes from Jamestown. Quarterly
Bulletin of the Archeological Society of Virginia 5(4): 2–8.
1954 Dating Stem Fragments of Seventeenth and Eighteenth Century Clay Tobacco Pipes. Quarterly Bulletin of the Archeological Society of Virginia 9(1): 10–14.
Hatch, D. Brad, Lauren K. McMillan, and Barbara J. Heath
2013 Archaeological Reassessment of the Hallowes Site (44WM6). Report to Department of Historic Resources, Richmond, VA, from Department of Anthropology, University of Tennessee, Knoxville.
Hatch, D. Brad, Barbara J. Heath, and Lauren K. McMillan
2014 Reassessing the Hallowes Site: Conflict and Settlement in the Seventeenth-Century Potomac Valley. Historical Archaeology 48(4): 46–75.
Hatfield, April L. 2004 Atlantic Virginia: Intercolonial Relations in
the Seventeenth Century, University of Pennsylvania Press, Philadelphia.
Heighton, Robert F., and Kathleen A. Deagan 1972 A New Formula for Dating Kaolin Clay
Pipestems. Conference on Historic Site Archaeology Papers 1971 6: 220–229.
Higgins, David 1999 Little Tubes of Mighty Power: A Review of
British Clay Tobacco Pipes Studies. In Old and New Worlds, ed. by Geoff Egan and R. L. Michael, 310–321. Oxbow, Oxford, UK.
ReferencesAlexander, Lynford T. 1979 More Light on the Theory of Dating Clay
Pipes by Measuring Stem Hole Diameters. Quarterly Bulletin of the Archeological Society of Virginia 33(3): 81–86.
Ball, Donald B. 1983 Approaches toward the Dating of 19th
Century Ohio Valley Flat Glass. In Proceedings of the Symposium on Ohio Valley Urban and Historic Archaeology 1, ed. by Donald B. Ball and Philip J. DiBlasi, 127–136. University of Louisville, Louisville, KY.
Beaman, Thomas E., Jr. 2005 Het Regent Pijpestelen at Brunswick Town:
A Quantitative Analysis of White Clay Tobacco Pipes and Smoking Behaviors in Colonial North Carolina. North Carolina Archaeology 51: 49–99.
Belcher, Jill, and Michael G. Jarrett 1971 Stem-Bore Diameters of English Pipes:
Some Northern Evidence. Post-Medieval Archaeology 5: 191–193.
Binford, Lewis R. 1962 A New Method of Calculating Dates from
Kaolin Pipe Stem Samples. Southeastern Archaeological Conference Newsletter 9(1): 19–21.
1972 The “Binford” Pipe Stem Formula: A Return from the Grave. Conference on Historic Site Archaeology Papers 1971 6: 230–253.
Chance, David H., and Jennifer V. Chance 1976 Kanaka Village/Vancouver Barracks, 1974.
University of Washington, Reports in Highway Archaeology, No. 3. Seattle.
Davis, Thomas W., Martha R. Williams, William Lowthert IV, and Andrew Madsen
1999 Archaeological Investigations at the Site of Old Baltimore, Aberdeen Proving Ground, Harford County, Maryland. Report to Maryland Archaeological Conservation Laboratory, St . Leonard, f rom R. Christopher Goodwin & Associates, Inc., Frederick, MD.
Deetz, James 1987 Harrington Histograms versus Binford
Mean Dates as a Technique for Establishing the Occupational Sequence of Sites at Flowerdew Hundred, Virginia. American Archaeology 6(1): 62–68.
Edgar, Walter 1998 South Carolina: A History. University of
South Carolina Press, Columbia.
90 McMillan/Tobacco Pipe Stem Dating Formulas
McMillan, Lauren K., and Barbara J. Heath 2013 Preliminary Interpretations from Recent
Investigations of the Coan Hall (44NB11) Archaeological Site. Paper presented at the 43rd annual Middle Atlantic Archaeology Conference, Virginia Beach, VA.
Miller, Henry 1991 Tobacco Pipes from Pope’s Fort, St. Mary’s
City, Maryland: An English Civil War Site on the American Frontier. In The Archaeology of the Clay Tobacco Pipe XII, Chesapeake Bay, ed. by Peter Davey and D e n n i s J . P o g u e , 7 3 – 8 8 . B r i t i s h Archaeological Reports, International Series 56. BAR Publishing, Oxford, UK.
Moir, Randall W. 1987 Socioeconomic and Chronometr ic
Patterning of Window Glass. In Historic Buildings, Material Culture, and People of the Prairie Margin, ed. by David H. Jurney and Randall W. Moir, 73–81. Southern Methodist University, Richland Creek Technical Series Vol. 5. Dallas.
Monroe, J. Cameron, and Seth Mallios 2004 A Seventeenth-Century Colonial Cottage
Industry: New Evidence and a Dating Formula for Colono Tobacco Pipes in the Chesapeake. Historical Archaeology 38(2): 68–82
Noël Hume, Audrey 1963 Clay Tobacco Pipe Dating in the Light of
Recent Excavations. Quarterly Bulletin of the Archeological Society of Virginia 18(2): 22–25.
1979 Clay Tobacco Pipes Excavated at Martin’s Hundred, Virginia, 1976–1978. In The Archaeology of the Clay Tobacco Pipe, ed. by Peter Davey, 3–36. British Archaeological Reports, International Series 60. BAR Publishing, Oxford, UK.
Noël Hume, Ivor 1969 A Guide to Artifacts of Colonial America.
University of Pennsylvania Press, Philadelphia.
2003 Hunting for a Little Ladle: Tobacco Pipes. Colonial Williamsburg Journal 12(1). Colonial Williamsburg Foundations, Publications <https://www.history.org/Foundation/journal/Winter03-04/pipes.cfm>. Accessed 15 October 2014.
Omwake, H. Geigre 1956 Date-Bore Diameter Correlation in English
White Kaolin Pipe Stems, Yes or No? Quarterly Bulletin of the Archeological Society of Virginia 11(1): n.p.
Hole, Bonnie Laird 1980 Sampling in Archaeology: A Critique.
Annual Review of Anthropology 9: 217–234.
Huey, Paul R. 1988 Aspects of Continuity and Change in Colonial
Dutch Material Culture at Fort Orange, 1624–1664. Ph.D. diss., Department of American Civilization, University of Pennsylvania, Philadelphia. University Microfilms International, Ann Arbor, MI.
Hurry, Silas D., and Robert W. Keeler 1991 A Descriptive Analysis of the White Clay
Tobacco Pipes from the St. John’s Site in St. Mary’s City, Maryland. In The Archaeology of the Clay Tobacco Pipe XII, Chesapeake Bay, ed. by Peter Davey and Dennis J. Pogue, 37–71. British Archaeological Reports, International Series 566. Publisher, Oxford, UK.
Mallios, Seth 2005 Back to the Bowl: Using English Tobacco
Pipebowls to Calculate Mean Site-Occupation Dates. Historical Archaeology 39(2): 89–104.
McMillan, Lauren K. 2010 Put This in Your Pipe and Smoke It: An
Evaluation of Tobacco Pipe Stem Dating Methods. Master’s thesis, Department of Anthropology, East Carolina University, Greenville, NC.
2015 C o m m u n i t y F o r m a t i o n a n d t h e Development of a British-Atlantic Identity in the Chesapeake: An Archaeological and Historical Study of the Tobacco Pipe Trade in the Potomac River Valley ca. 1630–1730. Ph.D. diss., Department of Anthropology, University of Tennessee, Knoxville.
2017 “The Blood and Life of a Commonwealth”: Illicit Trade, Identity Formation, and Imported Clay Tobacco Pipes in the 17th-century Potomac River Valley. In Material Worlds: Archaeology, Consumption, and the Road to Modernity, ed. by Barbara J. Heath, Eleanor E. Breen, and Lori A. Lee, 35-55. Routledge Press, London.
McMillan, Lauren K., and D. Brad Hatch 2013 Reanalysis of Nomini Plantation (44WM12):
Preliminary Results. Paper presented at the 73rd annual meeting of the Archeology Society of Virginia, Virginia Beach, VA.
McMillan, Lauren K., D. Brad Hatch, and Barbara J. Heath
2014 Dating Methods and Techniques at the Hallowes Site (44WM6): A 17th-Century Example. Northeast Historical Archaeology 43: 18–36.
Northeast Historical Archaeology/Vol. 45, 2016 91
Walker, Iain C. 1965 Some Thoughts on the Harrington and
Binford Systems for Statistically Dating Clay Pipes. Quarterly Bulletin of the Archeological Society of Virginia 20(2): 60–64.
1967 Statistical Methods for Dating Clay Pipes. Post-Medieval Archaeology 1: 90–101.
1978 Binford, Science, and History: The Probabilistic Variability of Explicated Epistemology and Nomothetic Paradigms in Historical Archaeology. In Historical Archaeology: A Guide to Substantive and Theoretical Contributions, ed. by Robert Schuyler, 223–239. Baywood, Farmingdale, NY.
Wesler, Kit W. 2014 Assessing Precision in Formula Dating.
Historical Archaeology 48(2): 173–181.
White, Susan D. 2004 The Dynamics of Regionalisation and Trade:
Yorkshire Clay Tobacco Pipes c1600–1800. British Archaeological Reports, British Series 374. Oxbow, Oxford, UK.
Whitehouse, D. B. 1966 The Bore Diameter of Clay Tobacco Pipes
Made at Bristol Between 1620 and 1850. Transactions of the Bristol and Gloucestershire Archaeological Society 85: 202–206.
Wilcoxen, Charlotte 1987 Dutch Trade and Ceramics in America in the
Seventeenth Century. Albany Institute of History and Art, Albany, NY.
Author InformationLauren K. McMillan is an Associate Project Archaeologist in the Department of Anthropology at St. Mary’s College of Maryland. She holds a Ph.D. in Anthropology from the University of Tennessee, Knoxville and an M.A. in Anthropology from East Carolina University.
Lauren K. McMillanSt. Mary’s College of MarylandDepartment of AnthropologyAnne Arundel Hall W114St. Mary’s City, MD 20686
Oswald, Adrian 1975 Clay Pipes for the Archaeologist. British
Archaeological Reports, British Series 14. BAR Publishing, Oxford, UK.
Pagan, John R. 1982 Dutch Maritime and Commercial Activity
in Mid-Seventeenth-Century Virginia. Virginia Magazine of History and Biography 90(4): 485–501.
Pecoraro, Luke J., and David M. Givens 2006 “Like to Perish from Want of Succor or
Reliefe”: The Provisioning of 17th-Century Virginia during Times of Change. Post-Medieval Archaeology 40(1): 62–79.
Pfeiffer, Michael A. 1978 Utility of Clay Tobacco Pipes and Stems as
a Time Marker in the Pacific Northwest. Paper presented at the 31st annual Northwest Anthropological Conference, Pullman, WA.
Riordan, Timothy B. 1991 Seventeenth-Century Clay Tobacco Pipes
from Smith’s Townland, St. Mary’s City, Maryland. In The Archaeology of the Clay Tobacco Pipe XII, Chesapeake Bay, ed. by Peter Davey and Dennis J. Pogue, 89–98. B r i t i s h A r c h a e o l o g i c a l R e p o r t s , International Series 566. BAR Publishing, Oxford, UK.
Shea, Daniel 1991 Pipes Revisited: The Median is the
Message. Wisconsin Archaeologist 72(1&2): 97–117.
Shott, Michael J. 2012 Toward Settlement Occupation Span from
Dispersion of Tobacco-Pipe Stem-Bore Diameter Values. Historical Archaeology 46(2): 16–38.
South, Stanley 1977 Method and Theory in Historical Archaeology.
Academic Press, New York.