Embed Size (px)
Citation preview
Walden University Walden University
ScholarWorks ScholarWorks
Walden Dissertations and Doctoral Studies Walden Dissertations and Doctoral Studies Collection
2020
An Examination of Corporate Financial Performance Within An Examination of Corporate Financial Performance Within
Corporate Socially Responsible Standard & Poor 500 Companies Corporate Socially Responsible Standard & Poor 500 Companies
Kevin J. Utzig Walden University
Follow this and additional works at: https://scholarworks.waldenu.edu/dissertations
Part of the Finance and Financial Management Commons
This Dissertation is brought to you for free and open access by the Walden Dissertations and Doctoral Studies Collection at ScholarWorks. It has been accepted for inclusion in Walden Dissertations and Doctoral Studies by an authorized administrator of ScholarWorks. For more information, please contact [email protected].
Walden University
College of Management and Technology
This is to certify that the doctoral dissertation by
Kevin J. Utzig
has been found to be complete and satisfactory in all respects,
and that any and all revisions required by
the review committee have been made.
Review Committee
Dr. Jean Gordon, Committee Chairperson, Management Faculty
Dr. Raghu Korrapati, Committee Member, Management Faculty
Dr. Anton Camarota, University Reviewer, Management Faculty
Chief Academic Officer and Provost
Sue Subocz, Ph.D.
Walden University
2020
ii
Abstract
An Examination of Corporate Financial Performance Within Corporate Socially Responsible
Standard & Poor 500 Companies
by
Kevin J. Utzig
MBA, St. Bonaventure University, 2009
BS, State University of New York, Empire State College, 2005
Dissertation Submitted in Partial Fulfillment
of the Requirements for the Degree of
Doctor of Philosophy
Management
Walden University
May 2020
iii
Abstract
Many managers are failing to predict and respond to the evolutionary changes within their firm’s
business environment. Some experts believe that any company not utilizing a corporate social
responsibility (CSR) strategy will lose customers, which will have a direct impact on the firm’s
financial performance. Managers lack a clear understanding of the impacts of CSR strategies on
corporate financial performance. The purpose of this quantitative multiple regression-based
study was to examine what relationship existed between an organization’s CSR strategy and its
financial performance. The conceptual frameworks for this research were stakeholder and triple
bottom line theories. These frameworks were selected because of their emphasis on CSR
implementation. The completed multiple regression analyses focused on S&P 500 companies’
relationship of debt to equity, return on assets, and net profit margins with CSR scores to
determine if any association existed. Four CSR categories were utilized as independent variables
based on CSRHub’s reporting: (a) community, (b) employee, (c) environment, and (d)
governance. Results from this study found a nonsignificant relationship between CSR and the
dependent variables of return on assets and net profit margin. Debt to equity provided a mixed
significance level with the independent variables of employees and governance proving
insignificant, while community and environment represented a significant relationship. This
research has forwarded the understanding of both stakeholder and triple bottom line theory by
focusing new CSR research into the direction of the positive relationships and away from those
that show no significance. Organizations that focus their CSR policies towards community
engagement will benefit from a reduction in debt to equity and will promote social change
through increased community improvement.
iv
An Examination of Corporate Financial Performance Within Corporate Socially Responsible
Standard & Poor 500 Companies
by
Kevin J. Utzig
MBA, St. Bonaventure University, 2009
BS, State University of New York, Empire State College, 2005
Dissertation Submitted in Partial Fulfillment
of the Requirements for the Degree of
Doctor of Philosophy
Management
Walden University
May 2020
v
Acknowledgments
I want to thank my wife, Sarah, children, Benjamin, Abigail, Eloise, mother Rose Ann,
and father Kevin, for all your continued love, support, encouragement, and understanding during
this journy. Without your support, this accomplishment would not be possible. Thank you, Dr.
Jean Gordon, and Dr. Robert DeYoung, for all your patience and assistance during this
dissertation process. Your guidance was appreciated more than I can express. I would also like to
thank the Lord Jesus Christ for providing me with the resolve, resources, and ability to complete
this research. I am truly blessed.
i
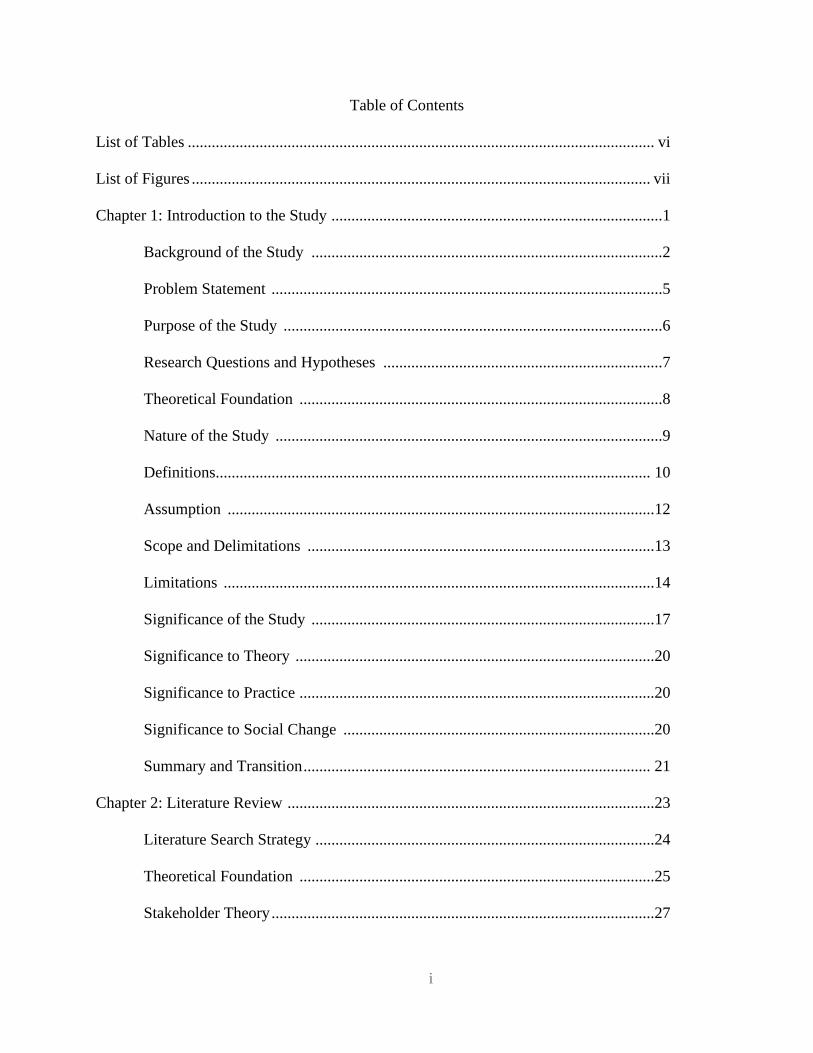
Table of Contents
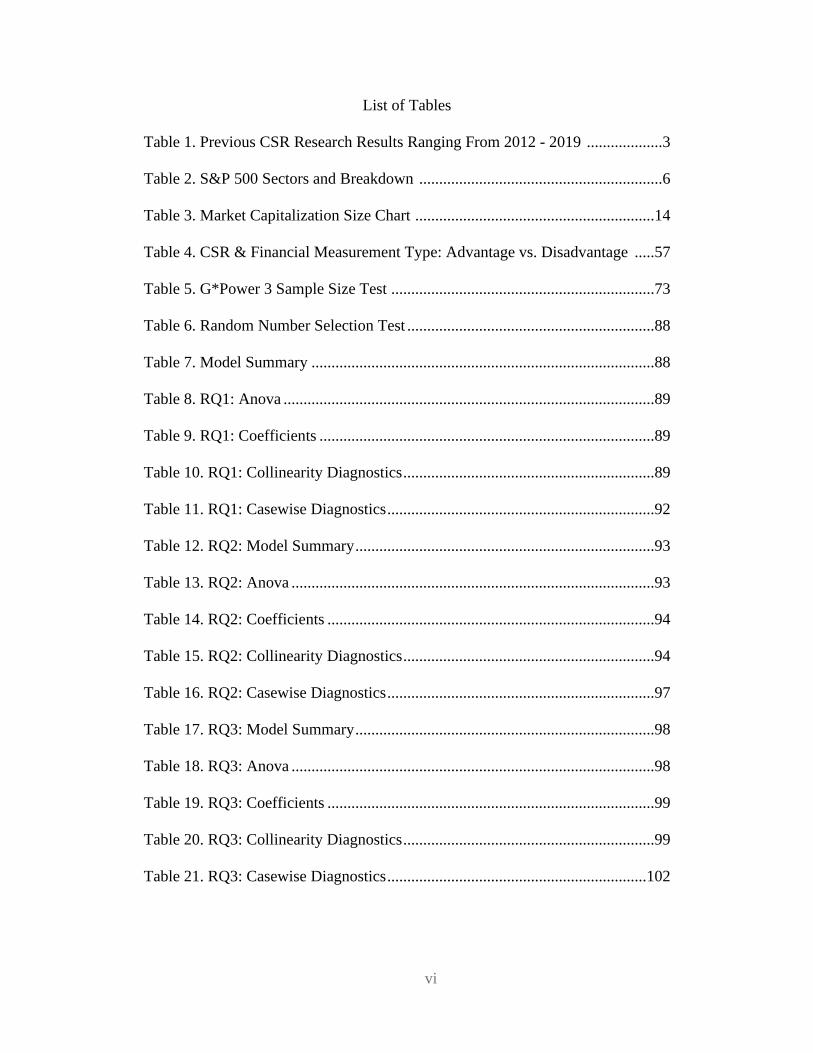
List of Tables ..................................................................................................................... vi
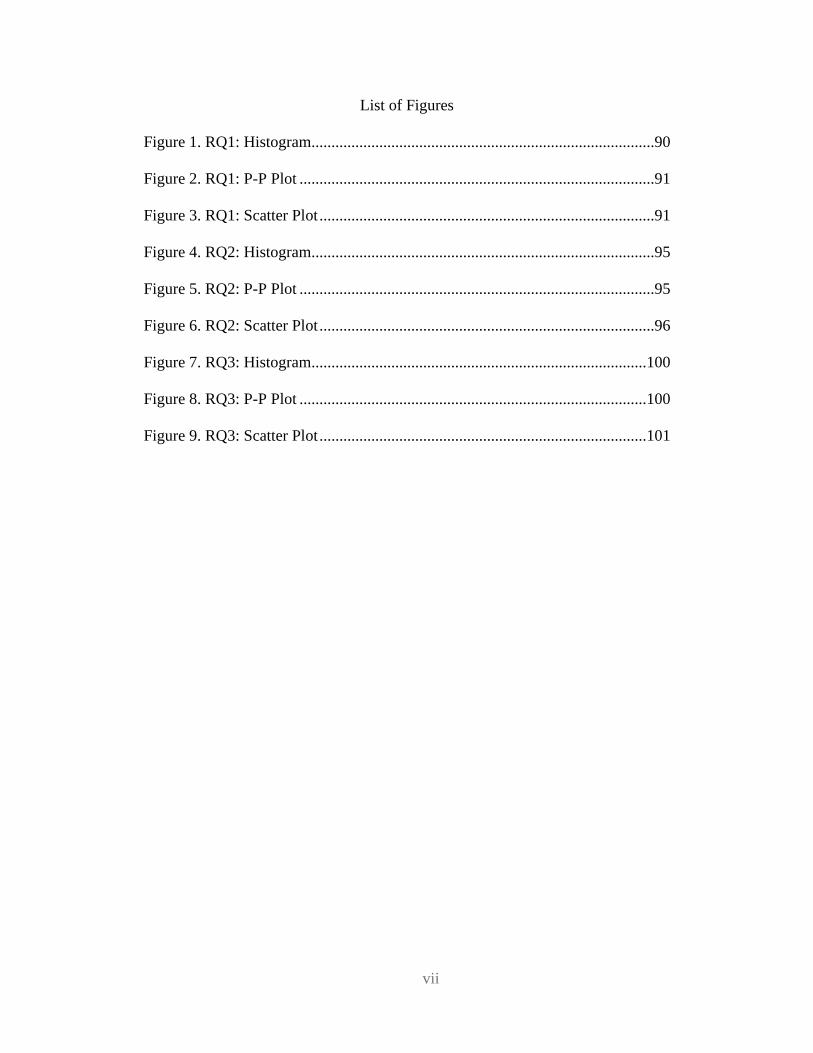
List of Figures ................................................................................................................... vii
Chapter 1: Introduction to the Study ...................................................................................1
Background of the Study ........................................................................................2
Problem Statement ..................................................................................................5
Purpose of the Study ...............................................................................................6
Research Questions and Hypotheses ......................................................................7
Theoretical Foundation ...........................................................................................8
Nature of the Study .................................................................................................9
Definitions............................................................................................................. 10
Assumption ...........................................................................................................12
Scope and Delimitations .......................................................................................13
Limitations ............................................................................................................14
Significance of the Study ......................................................................................17
Significance to Theory ..........................................................................................20
Significance to Practice .........................................................................................20
Significance to Social Change ..............................................................................20
Summary and Transition ....................................................................................... 21
Chapter 2: Literature Review ............................................................................................23
Literature Search Strategy .....................................................................................24
Theoretical Foundation .........................................................................................25
Stakeholder Theory ................................................................................................27
ii
Triple Bottom Line ................................................................................................37
Stakeholder Theory Advancements .......................................................................44
Triple Bottom Line Advancements ........................................................................45
Current Contributions to Stakeholder and Triple Bottom Line Theory .................46
Corporate Social Responsibility ............................................................................47
Corporate Profit Measurement Types ....................................................................56
Corporate Financial Performance ..........................................................................58
Measurement Conclusion.......................................................................................61
Conclusion ............................................................................................................63
Chapter 3: Research Method ............................................................................................. 65
Research Design and Rationale ............................................................................65
Methodology .........................................................................................................68
Population .............................................................................................................73
Procedures for Recruitment, Participation, and Data Collection (Primary Data) ..74
Instrumentation and Operation of Constructs ........................................................75
Data Analysis Plan ................................................................................................77
Threats to Validity ................................................................................................79
External Validity ...................................................................................................79
Internal Validity ....................................................................................................79
Construct Validity .................................................................................................80
Ethical Procedures ................................................................................................81
Summary ................................................................................................................81
Chapter 4: Results ..............................................................................................................83
iii
Data Collection ......................................................................................................84
Study Results .........................................................................................................87
Research Questions and Hypotheses .....................................................................87
Research Questions 1 .............................................................................................87
Linear Relationship ................................................................................................88
Multicollinearity ....................................................................................................89
Normality ...............................................................................................................90
Homoscedasticity ...................................................................................................91
Research Questions 2 .............................................................................................93
Linear Relationship ................................................................................................93
Multicollinearity ....................................................................................................94
Normality ...............................................................................................................95
Homoscedasticity ..................................................................................................96
Research Questions 3 .............................................................................................98
Linear Relationship ................................................................................................98
Multicollinearity ....................................................................................................99
Normality .............................................................................................................100
Homoscedasticity .................................................................................................101
Chapter 5: Discussion, Conclusions, and Recommendations ..........................................103
Interpretations of Findings ...................................................................................103
Research Questions 1 Results ..............................................................................103
Linearity ...............................................................................................................104
Multicollinearity ..................................................................................................104
iv
Normality .............................................................................................................104
Homoscedasticity .................................................................................................105
Conclusion ...........................................................................................................105
Research Questions 2 Results ..............................................................................105
Linearity ...............................................................................................................106
Multicollinearity ..................................................................................................106
Normality .............................................................................................................107
Homoscedasticity .................................................................................................107
Conclusion ...........................................................................................................107
Research Questions 3 Results ..............................................................................108
Linearity ...............................................................................................................108
Multicollinearity ..................................................................................................109
Normality .............................................................................................................109
Homoscedasticity .................................................................................................105
Conclusion ...........................................................................................................110
Overall Findings...................................................................................................110
Limitations of the Study.......................................................................................111
Internal Validity ...................................................................................................112
External Validity ..................................................................................................112
Reliability .............................................................................................................113
Objectivity............................................................................................................114
Recommendations ................................................................................................115
Implications .........................................................................................................116
v
Conclusions ..........................................................................................................117
References .......................................................................................................................118
Appendix A: Random Company and Data Selection Tables ...........................................143
Table A1. Community Service ...........................................................................143
Table A2. Consumer Discretionary ....................................................................144
Table A3. Consumer Staples ...............................................................................146
Table A4. Energy .................................................................................................147
Table A5. Financials ............................................................................................148
Table A6. Health Care .........................................................................................150
Table A7. Industrials ............................................................................................152
Table A8. Information Technology .....................................................................154
Table A9. Materials .............................................................................................156
Table A10. Real Estate ........................................................................................157
Table A11. Utilities ..............................................................................................158
Table A12. Industry Sector by Mean and Median ...............................................159
Table A13. Overall Rating Key .......................................................................... 160
Table A14. Random Company and Data Selection Table ...................................161
vi
List of Tables
Table 1. Previous CSR Research Results Ranging From 2012 - 2019 ...................3
Table 2. S&P 500 Sectors and Breakdown .............................................................6
Table 3. Market Capitalization Size Chart ............................................................14
Table 4. CSR & Financial Measurement Type: Advantage vs. Disadvantage .....57
Table 5. G*Power 3 Sample Size Test ..................................................................73
Table 6. Random Number Selection Test ..............................................................88
Table 7. Model Summary ......................................................................................88
Table 8. RQ1: Anova .............................................................................................89
Table 9. RQ1: Coefficients ....................................................................................89
Table 10. RQ1: Collinearity Diagnostics ...............................................................89
Table 11. RQ1: Casewise Diagnostics ...................................................................92
Table 12. RQ2: Model Summary ...........................................................................93
Table 13. RQ2: Anova ...........................................................................................93
Table 14. RQ2: Coefficients ..................................................................................94
Table 15. RQ2: Collinearity Diagnostics ...............................................................94
Table 16. RQ2: Casewise Diagnostics ...................................................................97
Table 17. RQ3: Model Summary ...........................................................................98
Table 18. RQ3: Anova ...........................................................................................98
Table 19. RQ3: Coefficients ..................................................................................99
Table 20. RQ3: Collinearity Diagnostics ...............................................................99
Table 21. RQ3: Casewise Diagnostics .................................................................102
vii
List of Figures
Figure 1. RQ1: Histogram......................................................................................90
Figure 2. RQ1: P-P Plot .........................................................................................91
Figure 3. RQ1: Scatter Plot ....................................................................................91
Figure 4. RQ2: Histogram......................................................................................95
Figure 5. RQ2: P-P Plot .........................................................................................95
Figure 6. RQ2: Scatter Plot ....................................................................................96
Figure 7. RQ3: Histogram....................................................................................100
Figure 8. RQ3: P-P Plot .......................................................................................100
Figure 9. RQ3: Scatter Plot ..................................................................................101
1
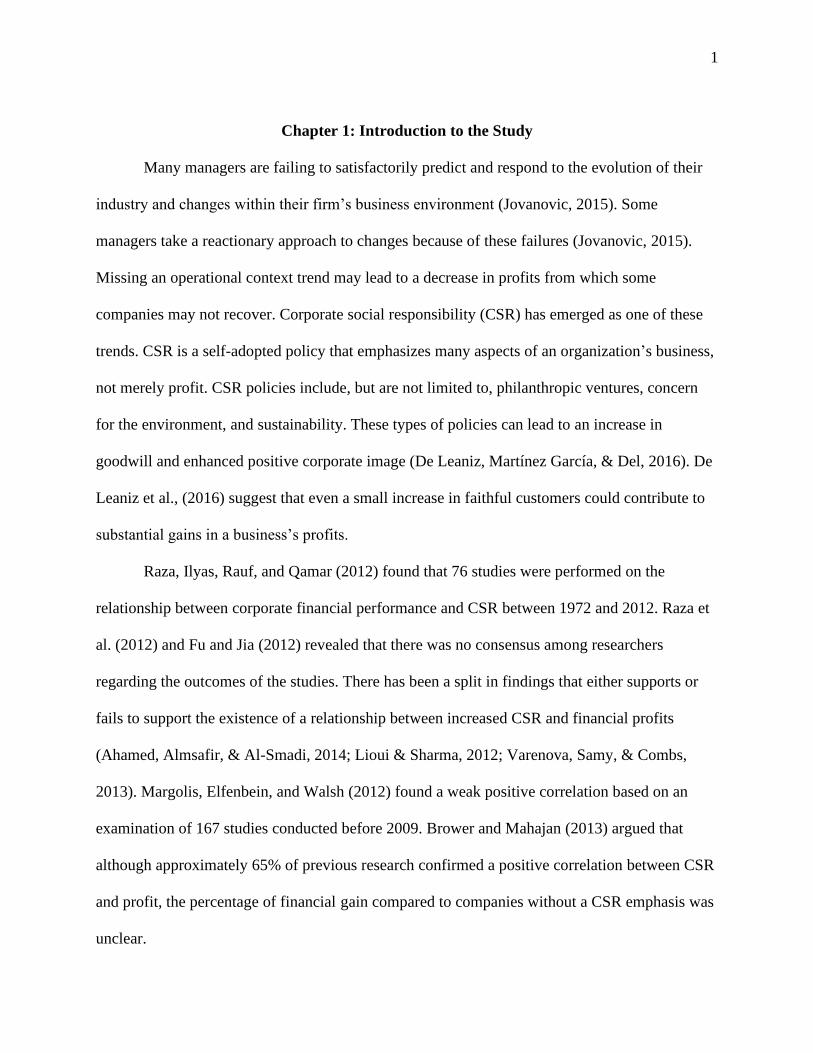
Chapter 1: Introduction to the Study
Many managers are failing to satisfactorily predict and respond to the evolution of their
industry and changes within their firm’s business environment (Jovanovic, 2015). Some
managers take a reactionary approach to changes because of these failures (Jovanovic, 2015).
Missing an operational context trend may lead to a decrease in profits from which some
companies may not recover. Corporate social responsibility (CSR) has emerged as one of these
trends. CSR is a self-adopted policy that emphasizes many aspects of an organization’s business,
not merely profit. CSR policies include, but are not limited to, philanthropic ventures, concern
for the environment, and sustainability. These types of policies can lead to an increase in
goodwill and enhanced positive corporate image (De Leaniz, Martínez García, & Del, 2016). De
Leaniz et al., (2016) suggest that even a small increase in faithful customers could contribute to
substantial gains in a business’s profits.
Raza, Ilyas, Rauf, and Qamar (2012) found that 76 studies were performed on the
relationship between corporate financial performance and CSR between 1972 and 2012. Raza et
al. (2012) and Fu and Jia (2012) revealed that there was no consensus among researchers
regarding the outcomes of the studies. There has been a split in findings that either supports or
fails to support the existence of a relationship between increased CSR and financial profits
(Ahamed, Almsafir, & Al-Smadi, 2014; Lioui & Sharma, 2012; Varenova, Samy, & Combs,
2013). Margolis, Elfenbein, and Walsh (2012) found a weak positive correlation based on an
examination of 167 studies conducted before 2009. Brower and Mahajan (2013) argued that
although approximately 65% of previous research confirmed a positive correlation between CSR
and profit, the percentage of financial gain compared to companies without a CSR emphasis was
unclear.
2
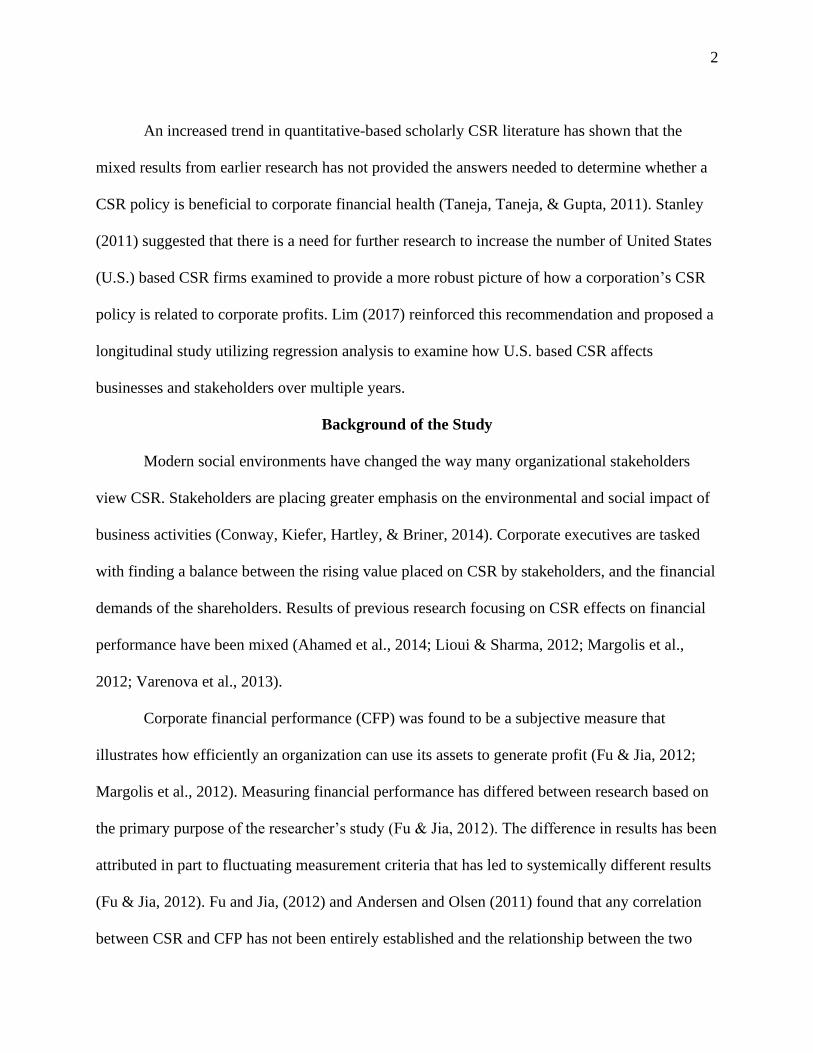
An increased trend in quantitative-based scholarly CSR literature has shown that the
mixed results from earlier research has not provided the answers needed to determine whether a
CSR policy is beneficial to corporate financial health (Taneja, Taneja, & Gupta, 2011). Stanley
(2011) suggested that there is a need for further research to increase the number of United States
(U.S.) based CSR firms examined to provide a more robust picture of how a corporation’s CSR
policy is related to corporate profits. Lim (2017) reinforced this recommendation and proposed a
longitudinal study utilizing regression analysis to examine how U.S. based CSR affects
businesses and stakeholders over multiple years.
Background of the Study
Modern social environments have changed the way many organizational stakeholders
view CSR. Stakeholders are placing greater emphasis on the environmental and social impact of
business activities (Conway, Kiefer, Hartley, & Briner, 2014). Corporate executives are tasked
with finding a balance between the rising value placed on CSR by stakeholders, and the financial
demands of the shareholders. Results of previous research focusing on CSR effects on financial
performance have been mixed (Ahamed et al., 2014; Lioui & Sharma, 2012; Margolis et al.,
2012; Varenova et al., 2013).
Corporate financial performance (CFP) was found to be a subjective measure that
illustrates how efficiently an organization can use its assets to generate profit (Fu & Jia, 2012;
Margolis et al., 2012). Measuring financial performance has differed between research based on
the primary purpose of the researcher’s study (Fu & Jia, 2012). The difference in results has been
attributed in part to fluctuating measurement criteria that has led to systemically different results
(Fu & Jia, 2012). Fu and Jia, (2012) and Andersen and Olsen (2011) found that any correlation
between CSR and CFP has not been entirely established and the relationship between the two
3
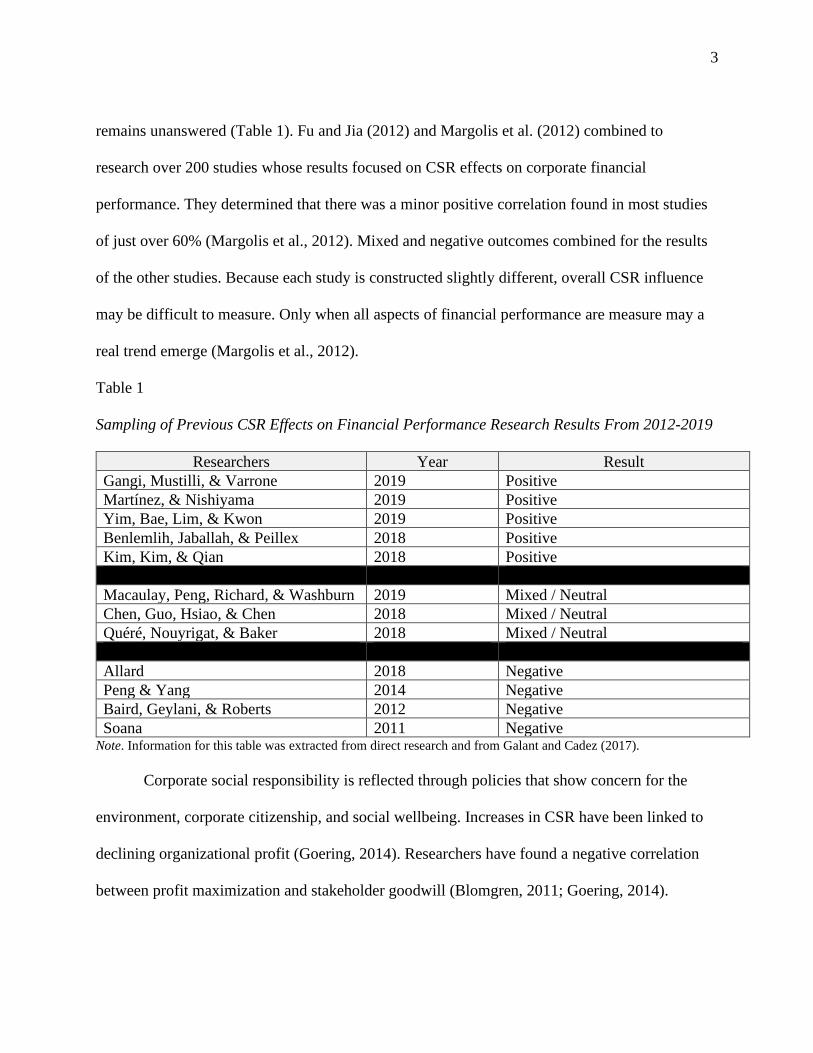
remains unanswered (Table 1). Fu and Jia (2012) and Margolis et al. (2012) combined to
research over 200 studies whose results focused on CSR effects on corporate financial
performance. They determined that there was a minor positive correlation found in most studies
of just over 60% (Margolis et al., 2012). Mixed and negative outcomes combined for the results
of the other studies. Because each study is constructed slightly different, overall CSR influence
may be difficult to measure. Only when all aspects of financial performance are measure may a
real trend emerge (Margolis et al., 2012).
Table 1
Sampling of Previous CSR Effects on Financial Performance Research Results From 2012-2019
Researchers Year Result
Gangi, Mustilli, & Varrone 2019 Positive
Martínez, & Nishiyama 2019 Positive
Yim, Bae, Lim, & Kwon 2019 Positive
Benlemlih, Jaballah, & Peillex 2018 Positive
Kim, Kim, & Qian 2018 Positive
Macaulay, Peng, Richard, & Washburn 2019 Mixed / Neutral
Chen, Guo, Hsiao, & Chen 2018 Mixed / Neutral
Quéré, Nouyrigat, & Baker 2018 Mixed / Neutral
Allard 2018 Negative
Peng & Yang 2014 Negative
Baird, Geylani, & Roberts 2012 Negative
Soana 2011 Negative Note. Information for this table was extracted from direct research and from Galant and Cadez (2017).
Corporate social responsibility is reflected through policies that show concern for the
environment, corporate citizenship, and social wellbeing. Increases in CSR have been linked to
declining organizational profit (Goering, 2014). Researchers have found a negative correlation
between profit maximization and stakeholder goodwill (Blomgren, 2011; Goering, 2014).
4
Offsetting the call for increased CSR policies, corporate stockholders continue to demand
increased profits and reduced expenses to maximize profits.
Stakeholders’ views of a company’s CSR differ from those of its shareholders. Conway
et al. (2014) discovered that the number of businesses conforming to a profit maximization
policy dramatically increased during the late twentieth and early twenty-first centuries. Some
consider corporate social responsibility to be a way of balancing profit with stakeholders’
wellbeing (Grant, 2011; Lagoarde-Segot, 2011). Lugovoy, Mazelis, and Solodukhin (2012)
examined the levels of CSR needed to affect the relationship between business and stakeholders.
Lugovoy et al. (2012) found that the less perceived value stakeholders received, the more likely
they were to abandon the relationship.
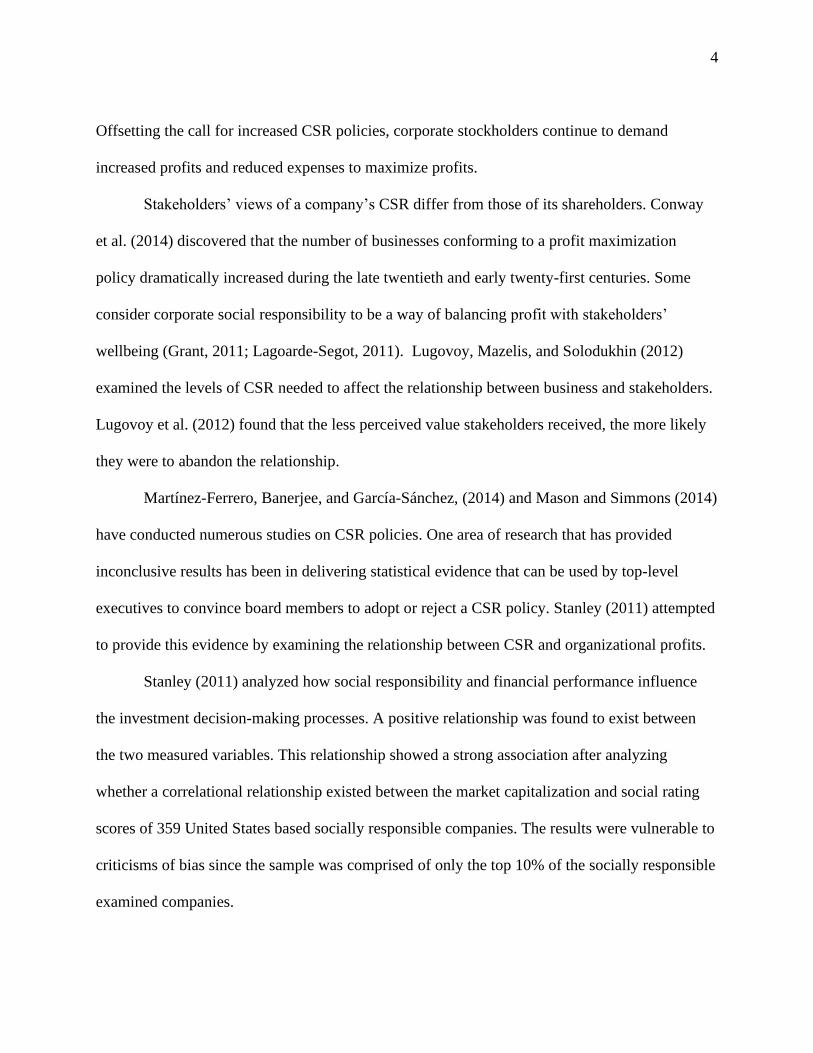
Martínez-Ferrero, Banerjee, and García-Sánchez, (2014) and Mason and Simmons (2014)
have conducted numerous studies on CSR policies. One area of research that has provided
inconclusive results has been in delivering statistical evidence that can be used by top-level
executives to convince board members to adopt or reject a CSR policy. Stanley (2011) attempted
to provide this evidence by examining the relationship between CSR and organizational profits.
Stanley (2011) analyzed how social responsibility and financial performance influence
the investment decision-making processes. A positive relationship was found to exist between
the two measured variables. This relationship showed a strong association after analyzing
whether a correlational relationship existed between the market capitalization and social rating
scores of 359 United States based socially responsible companies. The results were vulnerable to
criticisms of bias since the sample was comprised of only the top 10% of the socially responsible
examined companies.
5
Since results have been mixed (Martínez-Ferrero et al., 2014; Mason & Simmons 2014),
it is essential to provide a more in-depth and expanded analysis of the effects of CSR on
organizational profits. A study expanded to include all the S&P 500 companies, stratified by
index category, could help better understand any correlation between CSR, industry, and
organizational profit. Unlike Stanley’s (2011) study, an ESG index will not be limited to the top
10% of socially responsible companies but will instead focus on any level of corporate social
responsiveness related to the top 500 companies from the S&P 500. This modification from
Stanley’s (2011) original study could provide additional depth and expansion of the issue.
Problem Statement
Companies not utilizing a corporate social responsibility (CRS) strategy are losing
customers (Oladimeji, Adebayo, & Ogunshola, 2017) and this loss of customers can have a
direct impact on a firm’s financial performance (Jerónimo, Vázquez-Brust, Plaza-Úbeda, &
Dijkshoorn, 2013). Doorn, Onrust, Verhoef, and Bügel, (2017) found that stakeholder saturation
may occur within an organizations CSR based policy lessoning its efficiency. There is a general
problem of management not having complete knowledge of what the financial consequences are
between a fully engaged CSR practicing company and those who have limited CSR policy
operating in the same industry (Crifo & Forget, 2015). There is a gap in the literature explaining
how debt to equity (D/E), net profit margin (NPM), and return on assets (ROA) affects the
financial performance of U.S. corporations that utilize a CSR policy compared to those that do
not have a specific CSR mission. The specific problem is a lack of understanding of how these
financial performance measures differ between CSR and non-CSR focused companies listed
throughout all sectors of the U. S. S&P 500 index. If any variations were found, the results may
lend themselves to addressing the question of whether, and to what degree, failure to adopt CSR

6
initiatives adversely or positively affects shareholders, stakeholders, and the public these
organizations serve (Kim et al., 2018).
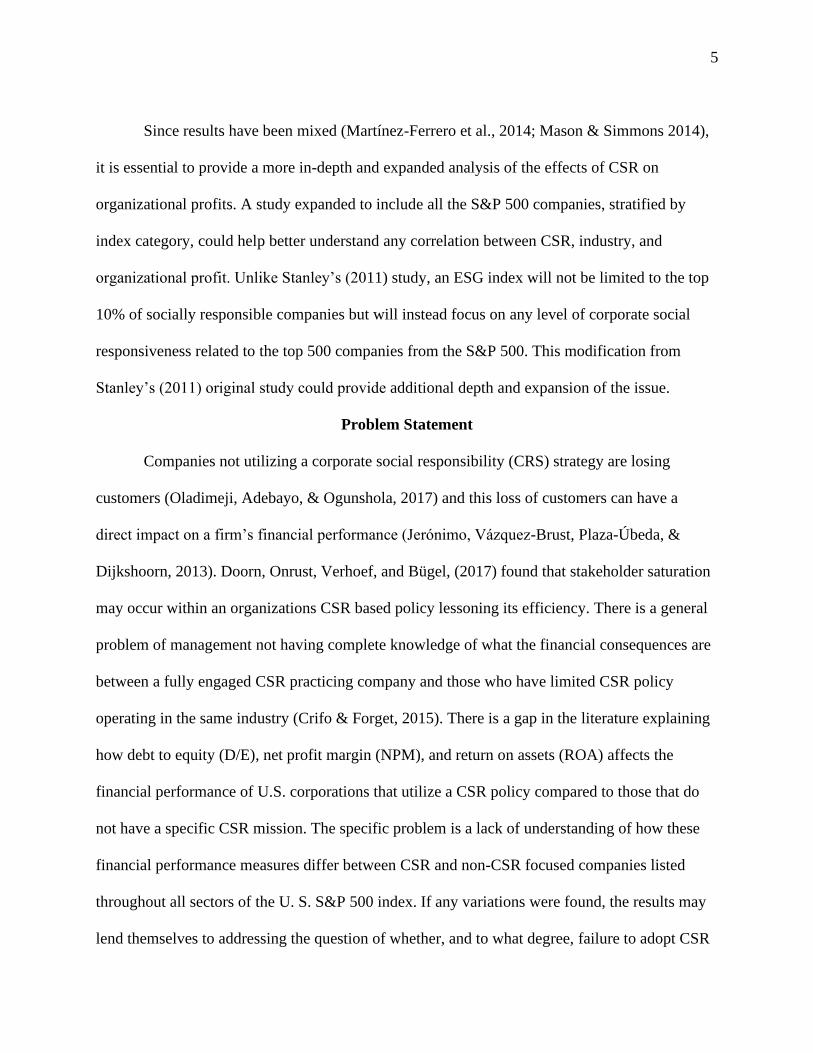
Purpose of the Study
The purpose of this quantitative multiple regression-based study was to examine what
relationship existed between organizations corporate social responsibility policies (CSR) and
their financial performance. The independent variable of corporate social responsibility was
defined using the European Commission’s (2001) guidelines stating how companies assimilate
environmental and social policies into their business processes and how they share those plans
with stakeholders as measured using CSRHub’s ESG rating system. Each company was then
placed into a contingency table (Tables A1-A13) using the S&P 500 index’s eleven sectors:
energy, materials, industrials, consumer discretionary, consumer staples, healthcare, financials,
information technology, communication services, utilities, and real estate (Table 2), for
comparison. A visual inspection of the resulting contingency tables helped determine whether
any S&P 500 industry classification displays a greater relationship between S&P 500 category
and CSR performance. There were multiple dependent variables for this study represented by
D/E, ROA NPM. A firm’s financial performance was defined using financial data contained in
the S&P 500 and consisted of three major areas: debt to equity, short-term profit and long-term
profit.
Table 2
S&P 500 Sectors and Breakdown
S&P Industry Sector Number of Stocks per Sector Weighted Sector
Breakdown
1. Energy 28 5.5%
2. Materials 27 5.3%
3. Industrials 69 13.7%
7
4. Consumer discretionary 63 12.5%
5. Consumer staples 33 6.5%
6. Healthcare 61 12.1%
7 Financials 67 13.3%
8. Information technology 70 13.9%
9 Communication services 27 5.3%
10. Utilities 28 5.5%
11. Real estate 32 6.3%
TOTAL 505* 99.9% Note. Alphabet, Discovery, Fox Corp., News Corp., and Under Armour each have 2 classes of stock listed. This
raised the total number of stocks listed on the S&P 500 from 500 to 505 (S&P Dow Jones, 2019).
Note. All information retrieved from S&P Dow Jones, (2019).
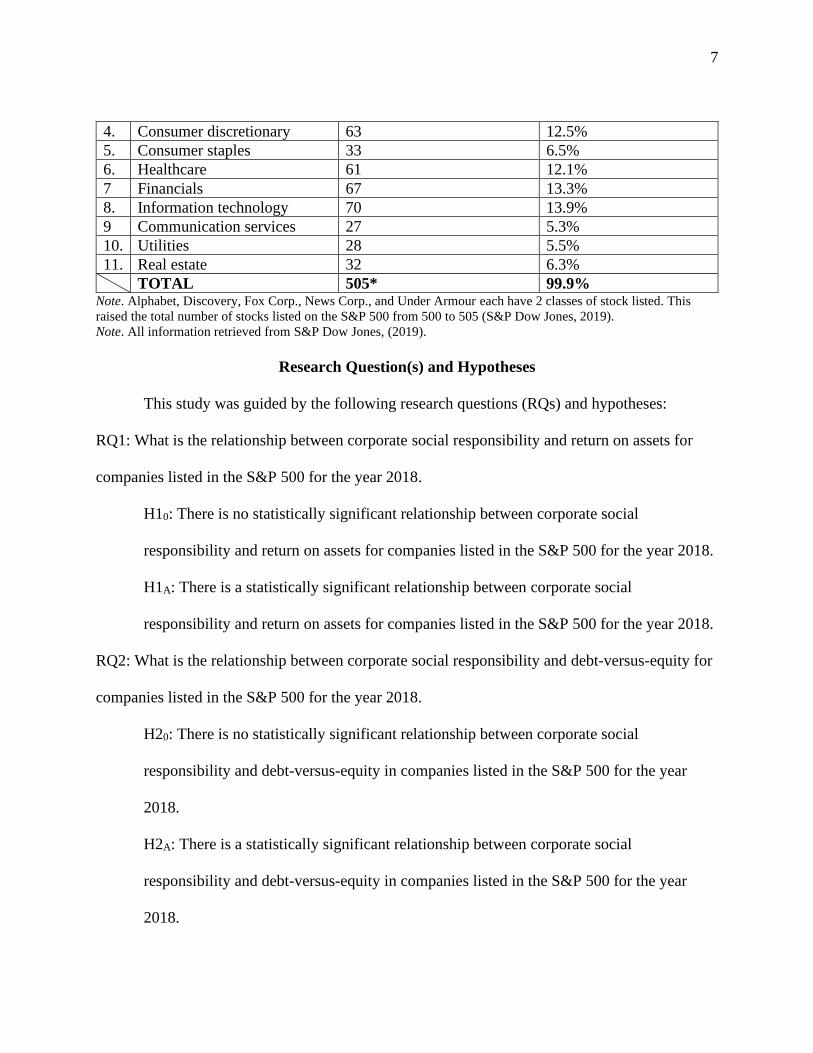
Research Question(s) and Hypotheses
This study was guided by the following research questions (RQs) and hypotheses:
RQ1: What is the relationship between corporate social responsibility and return on assets for
companies listed in the S&P 500 for the year 2018.
H10: There is no statistically significant relationship between corporate social
responsibility and return on assets for companies listed in the S&P 500 for the year 2018.
H1A: There is a statistically significant relationship between corporate social
responsibility and return on assets for companies listed in the S&P 500 for the year 2018.
RQ2: What is the relationship between corporate social responsibility and debt-versus-equity for
companies listed in the S&P 500 for the year 2018.
H20: There is no statistically significant relationship between corporate social
responsibility and debt-versus-equity in companies listed in the S&P 500 for the year
2018.
H2A: There is a statistically significant relationship between corporate social
responsibility and debt-versus-equity in companies listed in the S&P 500 for the year
2018.
8
RQ3: What is the relationship between corporate social responsibility and net profit margin in
companies listed in the S&P 500 for the year 2018.
H30: There is no statistically significant relationship between corporate social
responsibility and net profit margin in companies listed in the S&P 500 for the year 2018.
H3A: There is a statistically significant relationship between corporate social
responsibility and net profit margin in companies listed in the S&P 500 for the year 2018.
Theoretical Foundation
The purpose of this descriptive quantitative regression-based study was to examine the
strength of the relationship between an organization’s corporate social responsibility policy
(CSR) and financial performance using regression analysis. The theoretical base for this study
was Freeman’s (1984) stakeholder and Elkington’s (1999) triple bottom line theories. Elkington
(1999) developed the triple bottom line (TBL) framework as an extension on ST. Stakeholder
theory (Freeman, 1984) was described by Van Der Linden and Freeman (2017) as a way appease
both shareholders and stockholders through delivering products and services, increasing
employment, protecting the environment, respecting human rights, and respecting governmental
policies. Not all the pre-mentioned values are present within each company and complications
can arise that can divide corporate decision makers. There is debate on which method to
administer and deliver stakeholder driven policies is most effective (Van Der Linden & Freeman,
2017).
Multiple recent examinations of corporate governance and sustainability within a triple
bottom line framework (Elkington, 1999) have been conducted (Coskun-Arslan, & Kisacik,
2017; Hussain, Rigoni, & Orij, 2018) and have attempted to build on Elkington’s (1999) original
study. As CSR has risen to importance, triple bottom line has evolved to provide equal weight to
9
economic, environmental, and social dimensions (Hussain et al., 2018). Although TBL
(Elkington, 1999) is a voluntary measure, firms are increasing its usage to assist in measuring
corporate governance (Hussain et al., 2018; Wood, 2010). For this study, TBL (Elkington, 1999)
built on ST (Freeman, 1984) and helped to address the decisions stakeholders make when
choosing an investment. Economic risk versus reward, along with how social and environmental
values contribute to managerial decisions were examined within this framework. This approach
was expanded on by reviewing how corporate social responsibility influenced investors and by
how much. Additional research and application of Freeman’s (1984) and Elkington’s (1999)
theories within this study helped to develop more profound insight into the influences affecting
management and stakeholders’ decision-making processes.
Freeman hypothesized that as stakeholders increase their requests on organizations to
become more socially conscious, the pressure will lead to an evolution of ST (Freeman, 1984)
and TBL (Elkington, 1999) theories. The consumer's amplified emphasis on socially responsible
actions, such as increased environmental concern, sustainability, and community involvement,
influenced patronage rates for those companies engaged in CSR policy. Stakeholder theory was
examined to determine if the values put forth by Freeman (1984) and Elkington’s (1999) triple
bottom line framework extension still hold true in the ever-changing business environment. This
theory was reviewed and examined in detail in Chapter 2.
Nature of the Study
The nature of this research was a quantitative descriptive regression-based study.
Quantitative research is consistent with understanding and measuring the level of correlation
between an organization’s CSR and its financial performance. Freeman’s (1984) stakeholder
theory, along with Elkington’s (1999) triple bottom line framework, provided the basis for and
10
guided this new research. This study focused on recommendations made by Stanley (2011) that
suggested a need for a more encompassing CSR selection of funds to provide a more accurate
assessment of the strength of a CSR policy and corporate profit relationship. A stratified
sampling of all CSR participating S&P 500 companies listed on CSRHub index and S&P 500
Index was examined along with their 10k reports. This information was used to expound on the
relationship between organizational CSR and financial performance measured using D/E, NPM,
and ROA. The descriptive data were examined between CSR rating and financial performance
by S&P 500 industry sector.
Both correlation and regression analysis were used to better understand the relationship
between CSR and organizational profits. Profitability is one measure used by major rating
agencies, such as A.M. Best and Standard and Poor, to help determine financial performance and
credit rating (Ames, Hines, & Sankara, 2018; Wiemken, 2019; Wong-Fupuy, & McGuigan,
2018). Multiple regression was used when analyzing multiple variables such as CSR ranking,
D/E, NPM, and ROA. This analysis allowed for multiple independent variables to be evaluated
against multiple dependent variables separately (“Introduction”, 2013). Each company was
placed into a contingency table for review once regression analysis was completed on all
variables (Tables A1 – A13). This type of quantitative analysis helped determine the financial
implications of a CSR policy that provide a reliable resource for senior management to use in
their decision-making process.
Definitions
Corporate social responsibility (CSR): How companies assimilate environmental and
social policies into their business processes and how those policies relate financially to both
stockholders and stakeholders (European Commission, 2001) and represent the independent
11
variable of this study. CSR consists of CSRHub’s ESG index rating system. This system breaks
CSR down into four primary categories: (a) community, (b) employee, (c) environment, (d) and
governance (ESG, 2019).
Debt: Represents the dependent variable of this study and will consists of three parts:
Debt and Debt financing represented by debt to equity ratio (D/E) and focused on a firm’s
leverage and its ability to maintain its current level of product and corporate policies; Short-term
profit represented by net profit margin (NPM) showed how much profit is made off all revenue
for a given year, or one year or less; Long-term profit represented by return on assists (ROA)
was defined as a measure that may affect profits over one year.
Debt to equity ratio (D/E): (Debt/Equity Ratio = Total Liabilities / Shareholders' Equity).
Measures financial leverage. It examines an organization's total liability in relation to its
stockholder equity. D/E helped determine a company’s debt and debt financing (Gallo, 2015).
Financial performance: Represents a corporation’s ability to succeed and was measured
using debt to equity (D/E), net profit margin (NPM), and return on assets (ROA). Information
was retrieved using an organizations 10k reports for a given year.
Market capitalization (MC): (Market Capitalization = Outstanding shares / Current
Market Share Price). Represents the total dollar value of an organization's outstanding stock.
Beneficial in determining company size. (Gallo, 2017).
CSRHub ESG Index: Leader of in-depth ESG research, ratings, assimilation and analysis
of the environmental, social, and governance related business practices. Used to provide CSR
rankings using four primary and 12 secondary groupings. Four primary categories: (a)
community, (b) employee, (c) environment, (d) and governance. Twelve secondary categories:
(a) community development and philanthropy, (b) product, (c) human rights and supply chain,
12
(d) compensation and benefits (e) diversity and labor rights, (f) training, health, and safety, (g)
energy and climate change (h) environmental policy and reporting, (i) resource management, (j)
board, (k) leadership ethics, (l) transparency and reporting (ESG, 2019).
Net profit margins (NPM): (Net Profit Margin = Net profit / Total Revenues). Helped to
determine how much profit a business makes for each dollar of sales. When used in conjunction
with the ROA, the NPM helps determine a company’s profit level (Gallo, 2017).
Return on assets (ROA): (ROA = Net Income / Total Assets). A financial indicator that
measures a company’s profitability compared to its total assets (Breece, 2017).
Stakeholder: Any entity that has an interest in the success or failure of an organization
such as employees, suppliers, customers, and local community (Hoskisson, Gambeta, Green, &
Li, 2018).
Assumptions
Several assumptions were made based on the design of this study. The first assumption
was that all data displayed on all organizational 10k reports, CSRHub, socially responsible
companies index and the S&P 500 environmental and socially responsible index is reported
truthfully and is accurate. Because this information is provided by each company, it is assumed
that all financial information presented to the Security and Exchange Commission (SEC) is
honest and accurate at the reporting time. The second assumption was that an examination of the
S&P 500 will offer an illustration of the United States business environment. Third, a business’
social performance can be assessed using CSRHub ESG index framework which is composed of
four primary groupings (a) community, (b) employee, (c) environment, (d) and governance,
(ESG, 2019). Lastly, return on assets, debt-to-equity ratio, and net profit margins, can be used as
an indicator of a corporation’s financial profitability. Each ratio represents a distinction of

13
corporate value. Combined, each financial measurement could contribute to and help determine
levels of profitability.
Scope and Delimitations
This study was conducted using a sampling of all 500 United States-based companies of
the 2018 S&P 500 index. All eleven sectors (Energy, Materials, Industrials, Consumer
Discretionary, Consumer Staples, Health Care, Financials, Information Technology,
Telecommunication Services, Utilities, and Real Estate) were examined to describe the
relationship between CSR and financial performance. Previous studies (Lim, 2017; Stanley,
2011) used market capitalization to position and conduct their research. Market sizes for all S&P
500 firms fall under mega-cap with market value over 200 billion, and large-cap with values
between 1.10 and 199 billion (Table 3). Other S&P indexes such as S&P 400 focus on mid-cap
companies with values between 2 and 10 billion, while the S&P 600 focus on small-cap with
values between 50 million and 2 billion (Collver, 2014).
The S&P 500 is made up of the companies with the largest market capitalization in the
United States. Market capitalization measures the market value of outstanding shares of stock
(Arnott, Beck, & Kalesnik, 2016). Although market capitalization allowed for the value of a
company to be measured, it may not be effective at separating CSR based profits from traditional
profits. Not all companies have the same level of outstanding stock (Root, Rozycki, & Suh,
2014). Differences in the number of outstanding shares could influence stock price amongst S&P
500 companies (Root et al., 2014). Due to the differences in outstanding shares and the affect
they can have on price, market capitalization may not be an effective way to measure the results
of a CSR policy on organizational profits (Root et al., 2014). Return on assets will instead be
used as a measurable dependent variable.

14
Table 3
Market Capitalization Size Chart
Market Capitalization Market Value Range
Mega-cap Over 200 billion
Large-cap 10-199 billion
Mid-cap $2-$10 billion
Small-cap $250 million - $2 billion
Micro-cap $50-$250 million
Nano-cap Less than $50 million Note. Information retrieved from Collver, (2014) Ratings criteria, (2018) and S&P Dow Jones Indices (2019).
There have been many studies (Lim, 2017; Stanley, 2011) that have examined some
mixture of small, mid, and large-cap S&P 500 companies. This study will include all sizes of
market capitalization companies listed on the S&P 500 companies with both higher (mega-cap)
lower (large-cap) market capitalization and will expand on an under-analyzed portion of the
market. Utilizing a sampling of all 500 companies listed on the S&P 500 allowed for more
encompassing research and moved this area of study towards generalizability. Previous
researchers (Stanley, 2011) have only utilized a portion of companies listed on the S&P 500
index. Analysis of a sampling of all 500 companies provided a more in-depth study. This
allowed for the CSR and financial comparison results to be divided into S&P 500 index sectors
to determine the effect on each. The information gained allowed for a more complete picture of
the impact that CSR has on corporate finances within each S&P 500 sector.
Limitations
Data provided a limitation to this study. CSRHub ESG index provided the CSR ratings.
CSRHub is a leader in environment, social, and governance (ESG) reporting. CSRHub utilizes a
plethora of qualified ratings organizations to assimilate data into one cohesive measure. Rating
organizations such as, Dow Jones Sustainability Indexes, Ideal Ratings, ISS, MSCI, TRUCost,

15
and Vegio Eiris data are aggregated to form a mean CSR/ESG score for each rating category
(ESG, 2019). Data is only as accurate as the company that had it produced. CSRHub was chosen
because of its reputation for quality data reporting. CSRHub helped in mitigating this limitation.
The U.S. S&P 500 offered a list of companies located throughout 11 sectors. Information
displayed in this Index was provided by each company through its annual 10K report. Secondary
data has a disadvantage of not always being current. The most recent year of available data were
2018 and was used to form the basis of this study. Further limitations that faced this study was
the lack of longitudinal data. Utilizing only one year’s worth of data cannot provide a complete
picture. The results represent only a moment in time.
It is essential to understand both the advantages and disadvantages of a longitudinal
study, and whys it was not chosen for this new study. Longitudinal studies allow for the
identification of trends with a high level of validity. Because CSR measurements are taken over a
selected period, trends may be easier identified. These trends may provide a clearer
understanding of the study’s purpose as it relates to the independent variables. Discovering a
pattern within the CSR data can lead to a higher level of validity when estimating future results
(Gaille, 2020).
A longitudinal study does have its disadvantages. The most prevalent issue is that of
unpredictability over an extended period. This issue proved most problematic as numerous
corporations have moved in and out of the S&P 500 throughout its inception. Being able to
measure the same organizations over a selected period could prove difficult, given the S&P
500’s steady turnover rate. From January 1st, 2014, there December 31st, 2018, there have been
124 company changes or approximately a 25 percent turnover within the S&P 500 index (S&P
Dow Jones Indices, 2019). Though organizations that leave the S&P 500 are replaced with
16
businesses within the same category, the level of organizational CSR initiatives may vary
considerably between the organization leaving and the one joining the index. One other major
issue facing a longitudinal study can be reliability. Any piece of a distorted or inaccurate datum
can undermine the results of the research (Gaille, 2020). Data corruption can originate from
multiple places during a study. One inaccurate set of data can reduce the validity of a study’s
results. Longitudinal data gathering over many years significantly increases the chance of data
corruption and an inaccurate study result (Gaille, 2020). A nonlongitudinal study was selected
for this study based on these concerns.
Focusing on the year 2018 limited the ability to identify any long-term trends that may
occur. CSR initiatives varied based on type of business and industry sector. Results of these
policies were different depending on complexity and scope. This study focused on the fiscal year
2018 and could not include the result of all CSR policies. Additional long-range research will
need to be completed to reinforce the results of this study.
When researching for this study, it was essential to overcome any research bias or
expectations for a negative or positive correlation that supported earlier findings. This current
study built on previous studies conducted by Stanley (2011) and Lim (2017). The sample size for
this new research increased sample size which altered the results found in the previous studies. It
was important to interpret the data and report the analysis with integrity and objectivity.
Specific steps were implemented to address any limitation concerns. The first step was to
independently review each of the CSRHub ESG index ratings against the S&P 500 socially
responsible index. Doing this ensured that any discrepancy between rankings could be examined
and determined if a business should be removed from the study. Financial results found on a
company’s 10k report were compared against the information provided on the S&P 500 list.

17
Financial ratios such as return on assets, debt-to-equity ratio, and net profit margins were used to
help measure profitability. Another challenging limitation that must be overcome was
preconceived research bias. To protect the integrity of the data, individual funds were provided a
random number for the analysis, rendering each company’s information anonymous. This step
prevented any preconceived bias from distorting the analysis.
Significance of the Study
This research study contributed to closing a gap in understanding by determining what
correlation existed between corporate CSR policies and companies’ financial results. The
information gained can be used by corporate leaders to determine how expansive of a CSR
strategy to utilize for their firm. The significance of this descriptive quantitative regression-based
study was to expand on Stanley’s (2011) study that examined the strength of the correlation
between corporate social rating and market capitalization scores using CSRHub for the social
rating tool.
Stanley’s (2011) study utilized only the top 10% of the ESG socially responsible index
funds, representing only 400 out of 4000 firms. The new research increased the sample size
through a random selection of companies across all numerical ratings of the index, not just the
top ten percent. Adding a random sampling of the CSR indexed companies increased the range
and accuracy of the regression analysis. Once the extended information was collected, it was
then analyzed, and the results were measured against a number of companies found on the
CSRHub index in the same industry sectors and market capitalization group. Providing an
increased range of index companies and then comparing them to similar companies in the same
industry sectors built on Stanley’s (2011) research. Doing this expanding the range of CSR
indexed funds while differentiating it by examining other companies from the same industry.

18
The S&P 500 was used as a guide when conducting regression analysis. Each S&P 500
company had its financials matched to the results of CSRHub index rankings. After the analysis,
each company was broken down into one of the S&P 500’s eleven categories. Each category was
then ranked and analyzed in a contingency table to determine the strength of the relationship to a
CSR policy.
Corporate social responsibility was determined using CSRHub’s ESG index framework.
The framework consists of four primary categories: (a) governance, (b) community, (c)
employee, (d) and environment (ESG, 2019). The first is corporate governance. Corporate
governance was defined as management achieving best practices (Subramanian, Barton, &
Wiseman, 2015). These practices are open to interpretation and are often compared with others
operating in the same industry (Aguilera, Judge, & Terjesen, 2018). Second is community.
Community represents the amount of activity and dedication given to the area where a business
has operations or sell products (ESG, 2019). The third category is employee. This focuses on
creation and implementation of a safe work environment and a commitment to a balanced work-
life relationship. It also examines diversity and consists of an organization effort of inclusion.
The employee category includes human rights and discuss how they have increased in meaning
amongst global investors. Human rights are defined by the treatment of employees and
surrounding organizational stakeholders (ESG, 2019). Environment makes up the fourth criteria.
A company’s concern and care for the world around them is currently one of the most publicized
and cared about component of a corporate CSR policy (Hao, 2016).
Multiple regression analysis was utilized to expand on Stanley’s (2011) study and
determine the strength of any present relationship. An expanded sample size from CSRHub ESG
index provided four factors that formed a corporation’s socially responsible rating that was

19
included in this study. All CSRHub rating criterion were analyzed independently against each
dependent variable. Each company’s results were then stratified into their respective S&P 500
sector for comparison. This type of analysis helped to predict where potential increases in
benefits can occur according to sector.
To measure corporate performance, an analysis of an organization’s return on assets,
leverage and, profitability was conducted. Measurements of these indicators were taken from
each company’s annual 10k filings as reported on EDGAR (Filings & Forms, 2017). Return on
assets, debt-to-equity ratio, net profit margins, were examined and ranked per each financial
category. These ranking provided an overall picture of the financial health of an organization.
Regression analysis was then used to determine how CSR policies related to the financial health
of each company.
Three multiple regression analyses were used to examine the relationship between the
predictor variables and dependent variables (Ford, 2017). Three main data sets were used as the
dependent variable: debt and debt financing (D/E), short-term profit (NPM) and long-term profit
(ROA). Debt to equity illustrated how much a company has in profit versus debt while
maintaining a CSR policy to a described level. Higher percentages of debt assisted in
determining the amount of leverage a company can use to continue expanding their products or
CSR policies. Short-term profit provided insight into the amount of current revenue generated by
an organization against its liabilities while long-term profit provided a look on how assets
provide value over a given period. The results from the comparison of revenues to debt was then
used to assess the firm’s financial health in relation to its company size. These three dependent
variables were then matched against an independent variables of CSR ranking. Each companies’
20
results were then stratified into one of the eleven S&P 500 sectors to determine how each is
affected.
Advancement of knowledge in connection with this research could lead to more resources
dedicated to social reforms. Businesses utilizing CSR could make their impact on the
environment, community, and workforce through financial investments, volunteerism, and
additional forms of philanthropic ventures. Benefits and positive social change could be
experienced by all stakeholders and beyond.
Significance to Theory
Stakeholder theory (ST) (Freeman, 1984) was investigated to determine its relevance and
reliability as a model for business. The results of the analysis determined if organizations should
adopt ST (Freeman, 1984) as a practice to increase both CSR and financial outcomes. The
significance of the results will shape ST (Freeman, 1984) moving forward. A positive correlation
can provide the evidence needed for managers to adopt CSR. A negative correlation would
suggest that CSR could have a less desirable effect on organizational profits.
Significance to Practice
The results of this study will provide management with the information they need to
determine whether a CSR policy is in their organization’s best interest. With a strong conclusive
relationship, corporate leaders can point to this study as evidence to influence senior
management whether to adopt CSR policy. Adoption of a CSR policy would then be a way to
better position corporate policies.
Significance to Social Change
Corporate social responsibility is a necessity for businesses to gain legitimacy in today’s
global business environment (Schembera, 2016). Businesses in the United States and around the

21
world must weigh the effects of improved corporate citizenship as it relates to profits. Critical
decisions on pollution, working conditions, and community outreach could have ramifications
that can offset financial gains and losses. If a strong correlation is revealed, then corporate
managers could have the necessary data to support the implementation or exclusion of a CSR
policy.
A CSR study that is nonlongitudinal presented an inherent weakness of not having the
ability to determine long term trends (Gaille, 2020). Without long term research that focuses on
many years’ worth of data, a direct CSR link could not be definitively established. A
nonlongitudinal study was not undertaken because of the nature of the S&P 500 index. The S&P
500 index had an approximately 25 percent turnover rate between the years 2014 – 2018 (S&P
Dow Jones Indices, 2019). Not being able to examine the same businesses year over year made a
longitudinal study problematic. This issue also produced difficulty when determining CSR’s
effect on social change. With only one year of data analyzed, social change could only be
estimated based on the significance level of each research sample. If a strong positive correlation
can be determined based on the findings of this study, it could influence the direction corporate
managers take when developing policies that affect social change.
Stakeholders would also benefit from a positive relationship as they could use the data to
influence government lawmakers and community businesses leaders to adopt such a policy. If a
strong positive correlation can be determined based on the findings of this study, it could
influence change and lead to positive social change throughout the world.
Summary and Transition
The idea of CSR is not new, early mentions of this concept can be traced to Freeman’s
stakeholder theory (1984). The idea of increasing the amount of attention given to non-direct
22
sources of profit was debated and followed an ebb and flow path. Freeman & Liedtka (1991)
later wrote a paper discussing the continued relevance of CSR (Freeman & Liedtka, 1991).
Recent research by Stanley (2011) and Lim (2017) renews the optimism of the importance of a
CSR policy. Stakeholder theory (Freeman, 1984) will be used when examining the strength of a
CSR policy and a business’s financial results.
This research expanded on existing studies produced by Stanley (2011) and Lim (2017)
by increasing the number of companies analyzed using regression analysis. The research also
differentiated itself by comparing the finances of an organization employing a CSR policy with
those organizations not fully engaged with that type of policy. Increasing the number of S&P 500
companies examined, and then comparing their level of CSR to profits, allowed for a greater
understanding of the affects a CSR policy has on corporate performance. The results were
compared by each sector of the S&P 500 to determine if any S&P classification were less or
more prone to CSR sensitivity. The expansion on the Stanley (2011) and Lim (2017) studies
allowed for a more in-depth analysis that can be utilized to verify the strength of correlational
findings. The following chapter will provide an in-depth look at the literary research that
provides additional evidence explaining and supporting the theoretical foundation and conceptual
framework.
Chapter 2: Literature Review
There have been many studies that have focused on CSR policies and their implications
on selected industries. Studies (Ahamed et al., 2014; Lim, 2017; Lioui & Sharma, 2012;
Varenova et al.,2013) have proven inconclusive with a small majority (approximately 60%)
reporting a direct correlation between an organization’s CSR policy and its financial results. Few
have examined the effects by industry, and there is little research on different industry wholly.
23
The objective of this research was to examine any variations in financial performance between
CSR participating and non-CSR participating companies listed throughout all sectors of the S&P
500 index.
This study was framed by stakeholder theory (ST) (Freeman, 1984). ST (Freeman, 1984)
was used to better comprehend how CSR affects organizational bottom lines. Stakeholder theory
(Freeman, 1984) was developed to examine the responsibilities of a business, and how those
moral, ethical, environmental, and social responsibilities can contribute to increased consumer
goodwill and sales. Developed by Freeman (1984), ST has evolved as more researchers have
studied its effects. The effects of this evolution are no more evident than in Elkington’s (1999)
triple bottom line (TBL) framework. Triple bottom line scrutinizes social, financial, and
environmental components that affect a corporation’s financial profitability. Each section is
provided equal merit and is designed to position an organization to succeed long term.
This quantitative multivariate study will be used to examine what relationship exists
between an organization’s corporate social responsibility policy (CSR) and financial
performance and whether industry classification influences these results. The results of this new
research will draw upon previous information gleaned from both ST (Freeman, 1984) and TB
and assist in bridging gaps in CSR policies and its impact on business.
Literature Search Strategy
When researching the literature, sources included for the review include: 110 articles
from Business Market Research Collection, Business Source Complete, EBSCO, Federal
Agency Participation, Mergent Online, National Bureau of Economic Research, and ProQuest
Central databases. The following search terms were used independently or in conjunction:
corporate financial performance, corporate social responsibility (CSR), corporation, Elkington,
24
financial performance, Freeman, profit maximization, social responsibility, stakeholder theory
(ST), triple bottom line theory (TBL). Boolean tools were utilized to narrow and enhance the
search constraints. Peer-reviewed journals and articles published since and including 2014 were
selected for the majority of selection. Freeman’s (1984) work on stakeholder theory and
Elkington’s (1999) triple bottom line theory required that the date restriction be lifted to secure
the most prudent results. Several relevant and influential articles and books also required the
2014 date requirement be relaxed.
Primary works by Freeman (1984) Strategic management: A stakeholder approach and
Elkington (1999) Cannibals with forks: The triple bottom line of 21st century business were used
as a starting point. Both ST (Freeman, 1984) and TBL (Elkington, 1999) were then extensively
research to determine the extent of their evolution through subsequent exploration.
Contemporary research conducted by Arko-Achemfuor, and Dzansi (2015); Cantor, Morrow,
and Blackhurst (2015); Çetinkaya, Ağca, and Özutku, (2016); El Akremi, Gond, Swaen, De
Roeck, and Igalens, (2018); Hussain et al., (2018); Lim (2017); Olsen (2017; and Stanfield and
Tumarkin (2018) has proven paramount in advancing both ST (Freeman, 1984) and TBL
(Elkington, 1999). The theory behind, and progression of ST (Freeman, 1984) and TBL
(Elkington, 1999), will be laid out and linked to its importance in advancing the CSR
relationship to organizational profits and progression.
Theoretical Foundation
The foundations of this study consisted of Stakeholder theory (Freeman, 1984) and triple
bottom line (Elkington, 1999). Stakeholder theory (Freeman, 1984) and the accompanying triple
bottom line framework (Elkington, 1999) were selected because of their importance and
relationship to CSR. This theoretical foundation section focused on literature that has previously
25
delineated how each theory relates to CSR. Theoretical origins will be explained in greater detail
in the following literature review sections.
Stakeholder theory was conceived by Freeman (1984) in his book Strategic management:
A stakeholder approach. Stakeholder theory (Freeman, 1984) examines how business decisions
influence the implementation of both moral and ethical policies. Freeman’s views have been
extensively published since his 1984 book. His research continues to evolve ST (Freeman, 1984)
and allows for research to continue expanding on this important topic. Scholarly research by El
Akremi et al., (2018); Hussain, et al., (2018); Lim (2017); Olsen (2017); and Stanfield and
Tumarkin (2018) provided information needed to advance ST theory (Freeman, 1984).
El Akremi et al. (2018) examined a common question facing CSR when framed within
ST (Freeman, 1984): What is the most accurate measurement approach? Previous definitions
have included many different measurement variables (Aguinis, 2011; El Akremi et al., 2018;
Morgeson, Aguinis, Waldman, & Siegel, 2013). Issues facing measurement standards include a
lack of clear scale. Research preformed using multiple scales can complicate ongoing studies by
not streamlining data. Data that are described and reported in different ways can lead to
confusion and slows down future research (El Akremi et al., 2018). To overcome this issue, the
research for this study will utilize the same scale and list of criteria as its most closely related
studies conducted by Lim (2017) and Stanley (2011).
Including the same criteria for measurement was important as it allows for a true
examination of the progression amongst research. Previous research conducted by Anderson,
2019; Barny, 2018; Kruse, 2019; Lim (2017) and Stanley (2011) utilized information found in
CSRHub’s CSR measurement ratings. Four groupings derived and measured by CSRHub was
used as a standard for this new research. The four groupings are (a) community, (b) employee,
26
(c) environment, (d) and governance, (ESG, 2019). One area not apparent in this measuring
system is government. The importance of government cannot be overstated. Each category
presented by CSRHub incorporates and is influenced by governmental policy. Laws and policies
are intertwined within community, diversity, environment, and human rights.
Governmental involvement and influence as a stakeholder (Arumemi, 2016; Igan &
Mishra, 2014; Olsen, 2017; Stanfield & Tumarkin, 2018) were examined for influence in relation
to CSR framed by both ST and TBL. Of all stakeholders, government can exert additional
influence over a business through the use or threat of legislation. Researchers have examined the
effects governments can have on a ST (Freeman, 1984) and CSR and found a trend in taking
advantage of governmental credits for hiring convicts (Arumemi, 2016; Igan & Mishra, 2014;
Olsen, 2017; Stanfield & Tumarkin, 2018). Businesses taking advantage of these types of
programs can assist in the rehabilitation of an individual in a community, as well as improving
the conditions of a given communal area.
Olsen’s (2017) research advanced information available to business regarding financing
and availability to low-income stakeholders. Inclusive policies represent a key criterion for a
CSR policy. By engaging all income level stakeholders, a business can attract more customers
while improving the communities in which they conduct business (Al-Thaqeb, 2016; Olsen,
2017). Providing resources to low level earners opens opportunities with government officials
for financing, variances, and contracts (Igan & Mishra, 2014; Stanfield & Tumarkin, 2018).
Topics, such as government as a stakeholder and its influence over business decision-making
processes, may help add depth to ST (Freeman, 1984) and provide additional information
improve the theory for future researchers.

27
Lim (2017) and Stanley (2011) both produced studies that were paramount for this
investigation. Each utilized ST (Freeman, 1984) and examined whether CSR influenced
corporate finance. The information gleaned from their studies provided the foundation for this
current research. Both the number of companies explored, and the investigation into the
relationship with the S&P 500 index groups, expanded the knowledge contained within ST
(Freeman, 1984) and the topic. Probing which S&P 500 category was most influenced by CSR
helped advance the knowledge of the effectiveness of ST (Freeman, 1984) and TBL theory
(Elkington, 1999).
Stakeholder Theory
Stakeholder theory (ST) (Freeman, 1984), as well as the triple bottom line framework
(Elkington, 1999), provided the theoretical foundation for this study. Stakeholder theory has
been identified as an all-encompassing term for the approach used by businesses and their
stakeholders to recognize their responsibility and relationship to all stakeholders (Jones,
Harrison, & Felps, 2018). Management literature from the Stanford Research Institute was
created with the first publication of the term stakeholder in 1963 (Freeman, Harrison, Wicks,
Parmar, & Colle, 2010; Lim, 2017). Freeman (1984) is credited with mainstreaming the theory
with his book titled; Strategic Management: A Stakeholder Approach. Stakeholder theory
examines a business’s relationship with its communities, customers, employees, investors, and
suppliers when operating in a market-based economy (Freeman, 2018).
When stakeholder theory (Freeman, 1984) was initially conceived, the organizational
approach that many businesses were utilizing consisted of purchasing raw stock from a supplier,
converting it into a product, and then selling it to customers (Freeman, 2010). U.S. business
started to grow from more traditional farm-based operations that employed mostly family
28
members to large urbanized technological based businesses that hired mainly non-family
members because of the increasing need for additional labor. As business increased in size and
scope, managers needed to satisfy more than just the shareholders. Both shareholders and
stakeholders started to demand more from the management of their companies. The emphasis of
profit maximization was no longer the sole focus of companies (Meyer, 2015; Vashchenko,
2017). Individuals and groups of stockholders started to pool their influence to vote out senior
managers who did not operate according to their views (Freeman, 2010). Global competition
now provided stakeholders with a choice of products and broke the stranglehold domestic
corporation had on the American public. Globalization, along with a decrease in American
productivity, forced business to concentrate more on the needs and situations facing employees
(Freeman, 2010).
To provide a more precise review of the recent evolution of stakeholder theory (Freeman,
1984), four key stakeholders were selected; communities and environments; customers,
employees, and government. These stakeholders were classified using Rodriquez, Ricart, and
Sanchez (2002) and Oladimeji et al. (2017) classifications. The classifications represent
contractual and contextual stakeholders and were assigned based on relevance and importance to
an organization. Stakeholders are vital for an organization to survive. Employees and
shareholders were examined in this section. Contractual stakeholders gain relevance because of
their business dealings with a firm. Customers were considered most important and were
reviewed for this study. Contextual stakeholders represent the social aspect of a business and
include government and the local community. These stakeholders are critical as they provide
business with credibility (Oladimeji et al., 2017; Rodriquez et al., 2002). Each stakeholder was
selected based on importance to the company and the progression in stakeholder theory
29
(Freeman, 1984). Each topic described below will examine new research within its selected
stakeholder classification and provide evidence of how those advancements relate to the progress
of stakeholder theory within an organization’s CSR policy.
Stakeholder theory: Government. Stakeholders are the lifeblood of every business.
Without stakeholders, there would be no customers, employees, or communities (Olsen, 2017).
After reviewing the literature on ST (Freeman, 1984), a significant question was raised. Are all
stakeholders created equal? Olsen (2017) researched how to prioritize stakeholders when
government stakeholders have the power to affect the ability of that organization to conduct
business. Because of these types of issues, there have been discussions on not only which
stakeholder to prioritize but also what constitutes a stakeholder. These questions were examined
by Hill and Jones (1992), Mitchell, Agle, and Wood (1997), and Starik, (1994). These
researchers performed analyses hoping to address managerial concerns. Government, more than
any other stakeholder, has the power to influence business using resource allocation, regulation,
taxation, as well as monitoring and enforcement (Olsen, 2017). Olsen’s research built on the
studies conducted by Hill and Jones (1992); Mitchell et al. (1997); and Starik (1994) and provide
evidence of the influence government has as a stakeholder. The research focused on government
regulation and produced four contributions to the advancement of ST (Freeman, 1984).
The first advancement comprised of the role in constraining or enabling a managerial
decision. The advancement was accomplished by stressing how governmental agencies decide on
the merit of stakeholder legitimacy by limiting or expanding administrative decisions (Olsen,
2017). The second advancement connected the legitimacy of the stakeholders, managerial
constraints, and government to ethics resulting from their corresponding industry (Olsen, 2017).

30
Microfinancing is linked to the third advancement. Microfinancing was developed to help
the disadvantaged receive loans to start small businesses and help improve their financial
position (FINCA, 2018). The third examined the microfinancing institutions and the assistance
given to the vulnerable. Research found that microfinancing institutions were not forthcoming
with their support to the poor and had not met their intended obligations (Olsen, 2017). Results
of this conclusion draw a more precise picture of how government involvement in CSR related
programs can affect stakeholders in vulnerable positions and by extension the programs that they
fund (Al-Thaqeb, 2016; Olsen, 2017). Information (Igan & Mishra, 2014; Stanfield & Tumarkin,
2018) pointed to influences that political connection can have over a business’s leadership when
it is time to invest in agencies requested by a politician. With increased political power,
organizations are in a better position to influence government officials to include favorable
legislation in their bills (Heidelberg, 2017; Igan & Mishra, 2014). Igan and Mishra, (2014) cited
support from previous research supporting the position between a firm’s equity and its political
connections. Results of Stanfield and Tumarkin’s (2018) study found that there is a connection
between government and a firm’s CSR policy.
Influencers, such as union membership, can impact the relationship between business and
government (Stanfield & Tumarkin, 2018). The state of the government finances was also
questioned (Phillips & Strickland, 2016). A correlation was found to exist between government
debt load and its wiliness to engage in isolation or in collaboration with others in environmental
conservation programs (Phillips & Strickland, 2016). Research (Igan & Mishra, 2014; Olsen,
2017; Phillips & Strickland, 2016; Stanfield & Tumarkin, 2018) suggests that there is a
correlation between political influence and their increased effect on organizational CSR policies.

31
The fourth advancement was the linking of market agents and the government through
agonism (Olsen, 2017). Agonism recognizes that political conflict can interfere with business
objectives. Political conflict viewed through agonism can help prepare managers for internal
strife and assists them in finding moral legitimacy through the confrontation (Mouffe, 2009;
Olsen, 2017). Parker and Parker (2017) proposed critical performativity to find common ground
between antagonism and accommodation. Critical performativity does this by concentrating on
engagement strategies utilized by managers. Parker and Parker (2017) determined that in the
political arena there is no room for any compromise when either the organization or government
participates in corrupt practices.
Stakeholder theory: Employees. The second primary stakeholder to be examined was
the employee. Employees are the lifeblood of any corporation and are both directly and
indirectly responsible for the products and services each organization produces. It was important
to find out how CSR policies utilized within the employee’s organizations conformed and
evolved based on stakeholder theory. As a primary stakeholder, employees should receive the
same considerations afforded to communities, government, and stockholders (El Akremi et al.,
2018).
Recent research by El Akremi et al. (2018) examined the link between CSR, triple bottom
line, and employee involvement within a firm’s policies. Consideration was placed on how
employees observe and respond to their employers use or lack of CSR. Previous research found
that employees perceived perception of their employer’s CSR policy contributed more to their
performance than the company’s actual policy (Glavas & Godwin, 2013; Rupp, Shao, Thornton,
& Skarlicki, 2013). More recent studies by El Akremi et al. (2018) and Walden (2018) made
advancements to both the original and later concepts of stakeholder theory (Freeman, 1984;
32
Glavas & Godwin, 2013; Rupp et al., 2013). One advancement arose by finding a more accurate
way to measures employee perceptions of an organization’s stakeholder theory within its CSR
policy (El Akremi et al., 2018). El Akremi et al.’s (2018) scale was developed out of necessity as
previous psychometric measurements were found to lack orderly multidimensional
measurements. The newly formed range has proven to increase creditability and can be used to
measure the success of stakeholder theory-based CSR policies (Akermi et al., 2018). This new
measurement can be utilized by managers to determine the best response to their strategies for all
stakeholders.
Employees are affected in many ways by the decisions of their employers. These
decisions can affect an individual inside and outside of work. Recent studies by Ramaswamy and
Ozcan (2016) and Walden (2018) examined how social media is contributing to the values
discussed within stakeholder theory. Many companies encourage their employees to participate
in social media and share their views of the organization (Rokka, Karlsson, & Tienari, 2014).
The question of how much and when to engage employees on social media is a paradoxical issue
found within stakeholder theory (Freeman, 1984). Businesses must balance communications,
company engagement, and employee privacy (Walden, 2018). Firms have demonstrated their
willingness to engage employees on social media because of the employees’ aptitude to
influence nonemployees’ views both positively and negatively (Walden, 2018). With the goal of
positively influencing public opinion through employees’ social media, organizations must
respect employees’ boundaries during nonworking hours. Firms should practice casual
observance and avoid surveillance of personal employee accounts. Full monitoring, as well as
organizational pressure to post positive company-related messages, may force the employee to
become disenfranchised and reduce productivity while on the job (Walden, 2018). This newly
33
conducted research on social media has evolved stakeholder theory (Freeman, 1984) and has
incorporated it as a new platform.
Employee importance within the context of stakeholder theory (Freeman, 1984) extends
beyond the scope of social media. Its influence is seen as essential to a firm’s success (Coco,
2018). Employees are considered one of the vital stakeholders that can provide a competitive
advantage to an organization (Coco, 2018). Organizations’ ability to increase emphasis on
employee engagement can lead to increased output and labor participation rates (Coco, 2018).
Employees that have become invested within organizations’ beliefs are more likely to learn and
demonstrate procedures that can increase service. An increase in customer service can lead to
increased customer approval and repeat sales, increasing the chances of improved organizational
goodwill and sales (Coco, 2018).
Zou (2015) found that employees, operating as a stakeholder, often influence their firms
to be accountable for their action regarding other stakeholders. Employee loyalty is also affected
by stakeholder-based policies. A worker that feels valued is more likely to subscribe to
organizational objectives and remain productive throughout employment (Coco, 2018; Dhanesh,
2017). Engagement contributes a role in increasing the probability of workers assisting their
firms in establishing policies that are environmentally friendly. Personnel engaging in
environmental based policies usually are influenced by two motivators: Governmental
compliance and/or a firm’s policy (Cantor et al., 2015).
Stakeholder theory: Communities and environment. The environment and
communities a business operates in represent another area of review and advancements within
stakeholder theory (Freeman, 1984). Concern for environment and community allow an
organization the opportunity to increase goodwill and attract new customers. A firm must
34
encourage change to the mindset of its employees to ensure a successful policy. The worker
mindset regarding these topics must change from a mandated to a voluntary view (Cantor et al.,
2015). When a team member accepts and embraces responsible environmental behaviors, that
individual is more likely to be willing to track and participate in activities that benefit the
company both inside and outside of the working environment. Although the reward may not be
tangible or extrinsic in nature, the employee may experience feelings of accomplishment and
preservation (Cantor et al., 2015). The evolution of stakeholder theory regarding the environment
and communities have grown exponentially.
Environmental issues facing both domestic and global business are well documented and
discussed throughout the news and media outlets. Problems such as the reduction of natural
resources, climate change, and pollution have given rise to increasing pressure for organizations
to develop and implement CSR policies that focus on environmental responsibility (Çetinkaya et
al., 2016). The firm’s location can provide a starting point for an environmental laden CSR
policy. Other stakeholders, such as employees, can become vital cogs in the implementation of
the policy as it affects the place they and their families live (Çetinkaya et al., 2016; Welford,
Chan, & Man, 2007). Çetinkaya et al. (2016) cited Spiller’s (2000) research on environmental
and community-based business’ responsibility as a starting point for future research. Ideas
identified for the advancement of community involvement were financial donations, education,
and job training, volunteer programs, environmental performance reviews, and employee
philanthropic ideas. Ideas identified for the advancement of the environment were: improved
recycling, reuse, and reduction policies that improve waste management, public engagement and
involvement, and supplier environmental responsibility requirements (Spiller, 2000).
35
Another area of community concern focused on potential employment opportunities.
Taking advantage of ex-inmates was found to prove a profitable venture for business (Arumemi,
2016). The use of this type of labor provided both the community and industry with ways to
better handle the stigma of how to best take care of those who have paid their debt to society. By
employing the ex-inmates, a business could qualify for tax savings and acquires a worker who
will be relatively low cost (Arumemi, 2016). The community gains by having a productive
citizen who is contributing to rather than drawing from the tax base. Besides ex-inmates, the
resident populations benefit by keeping most of salary income spent on local goods and services.
Doing this causes a domino effect allowing other local businesses to prosper and hire others in
the community and expand government initiatives (Al-Thaqeb, 2016).
Stakeholder theory: Customers. The goal of any organization is to secure revenue. A
business cannot survive with losses greater than profits. For many years business operated under
a classical operational view that emphasized profit and net income as their sole purpose (Branco
& Rodrigues, 2007; Lantos, 2001). During this time producers made products with disregard to
any adverse effects they might have on the environment and community (Branco & Rodrigues,
2007). Consumer preferences focused on availability and affordability (Lin, 2016). It was not
until late 20th century that consumers’ views started to change sufficiently that organizations
began to listen. Clients started to demand more than just product reliability and price from
organizations. Those clients also started to look for products and companies that were less
damaging to the earth and community and mirrored their moral values (DeLong, 2016). Many
businesses soon adapted to these changing demands realizing that in order to keep and improve
their sales, they needed to bring their practices in line with consumer preferences (Branco &
Rodrigues, 2007).
36
Businesses were tasked with identifying what CSR activities best fit within their
organizational framework, production capabilities, and customer desires (DeLong, 2016; Smith
& Langford, 2009). Building on previous work (Carroll & Shabana, 2010; DeLong, 2016),
Peloza and Shang (2011) linked select organizational CSR activates to an increase in stakeholder
satisfaction and retention. It was found that these CSR initiatives increased the probability of
customer loyalty and reduced employee turnover by increasing stakeholder value. Finding the
correct balance between CSR as a notion and how a CSR policy would best fit with business
remains fluid. It was suggested by Alexander (2005) and DeLong (2016) that a triple bottom line
approach, that brings together social, financial, and environmental reporting, provides the best
guide to which methods are being used most effectively. CSR in this context provides the
language and direction of corporate policy. Once implemented, a triple bottom line framework
can provide transparency and act as a controlling guide for each company to follow (Alexander,
2005).
Customers and business have in the past decade started to shift their focus from primarily
environmental concerns to general sustainability concerns. These concerns focus on human
capital, social influence, and community (DeLong, 2016). With an increase in stakeholder
pressure, some businesses are having difficulty incorporating sustainable actions and reposting
within their organization. Limited support and instruction can hinder those businesses unfamiliar
with CSR. Assimilation of a weakly defined CSR policy can cause a problem with execution,
operational planning, and review of the chosen strategy (Maas & Reiners, 2015).
Triple Bottom Line
The concept behind the triple bottom line framework was introduced by Elkington
(1999). By 1999 Elkington expanded the concept in his book, Cannibals with forks: The triple
37
bottom line of 21st-century business (John Elkington, 2014a). Elkington has dedicated his life in
the pursuit of sustainability, conservation, and the general improvement of the environment. His
research has helped the advancement of the theory of sustainability (John Elkington, 2014a).
Sustainability is a significant component of, provides an evolution of, and has a direct correlation
with the concepts put forth in Freeman’s stakeholder theory.
Elkington’s (1999) work has resulted in many honors lending credence within his
research and theories. Among the many recognitions that were received included being called “a
dean of the corporate responsibility movement for three decades” by BusinessWeek; ‘1000 Most
Influential People’ by The Evening standard; Fourth on the top 100 CSR leaders by a CSR
international survey; 2010: American Society for Quality Spencer Hutchens, Jr. Medal for
champions of quality and social responsibility; And ‘100 Global Sustain Ability Leaders for
2011’ by ABC Carbon and the Sustain Ability Showcase Asia (John Elkington, 2014b).
Though Elkington has dedicated his life to the advancement of all levels of sustainability,
conservation, and the environment, his recent research focused on his work with the triple
bottom line approach. The first mentions of the concepts behind the triple bottom line framework
were put forth by Spreckley (1981) in his book Social Audit: A Management Tool for Co-
operative Working. Spreckley discussed the lack of alternate measurements needed to gauge
business success. A requirement for environmental and social cost was determined to be
desirable. These measures would help determine the effect on organizational stakeholders such
as employees and the environment. Leaving out these criteria was labeled as portraying an
incomplete picture of a corporation’s health.
Building on Spreckley’s (1981) ideas, Elkington wanted to design an approach that could
be used to quantify the nonfinancial aspects of a business. The method chosen provided three
38
categories which would be equally valued. Along with the traditional economic approach utilized
by organizations, environment, and social dimension were added to the equation. The initial
theory suggested that TBL (Elkington, 1999) would benefit firms by increasing their competitive
advantage (Hussain et al., 2018; Tate & Bals, 2018). The three were proposed to be interrelated,
interdependent, and partly in conflict (Elkington, 1999). Seven dimensions were provided to help
harmonize each of the three categories of TBL (Elkington, 1999). Markets, values, transparency,
life-cycle technology, partnerships, time-perspective and corporate governance were all
suggested to improve organizations and expand business thinking into a more progressive
approach (Elkington, 1999). Capitalism as an economic system was initially questioned about
whether it was compatible with the idea of TBL (Tate & Bals, 2018). Ultimately, Elkington
found that stakeholders will act as a counterbalance to pure capitalism, and if customers demand
social responsibility organizations will have no option but to honor their request (Elkington,
1999).
Seven dimensions were initially proposed by Elkington (1999) as a way for business to
incorporate TBL. First was that market mechanisms should be the focus of business opposed to
traditional command-and-control measures. Through use of technological invention, this action
should assist in improving sustainability goals. Being a leader in this area was described as
critical to take advantage of changing stakeholder requirements (Jeurissen, 2000; Tate & Bals,
2018). The next focused on a business’s ability to create ethical and social value. Most
companies focus is on economic value creation (Elkington, 1999). Elkington (1999) predicted
that as societies progress, the organizations that have focused on ethical and social value will be
in a better position to succeed. Transparency represents the third dimension and concentrates on
an organization’s ability to meet all three TBL (Elkington, 1999) directives. Comparisons with
39
competing businesses, along with increased government regulation would help drive an
organization to better position themselves in all three categories. Long-term sustainability and
performance are the focus of the fourth dimension. Business should work with stakeholders to
advance the viability and efficiency of the product lifecycle (Elkington, 1999). The subsequent
dimension suggests that a longer-term approach to sustainability is needed to ensure that each
product, process, or service meets the businesses goals and TBL (Elkington, 1999) expectations.
One of the most complex changes recommended is dimension seven. This dimension debates the
traditional definition of ownership and assets rights within an organization. Corporate
governance was looked at as the one dimension that would be most difficult to modify over the
short-term requirements (Jeurissen, 2000).
Elkington (1999) found three critical societal changes needed to be made to achieve the
seven recommended dimensions: favorable laws and enforcement; increased strength in financial
institutions; and progressive governments that encourage increased conservation and
environmental stewardship. Increasing environmental laws, along with the corresponding
increased enforcement, could provide a greater incentive for business to adopt a TBL (Elkington,
1999) policy. Increased laws could also make explaining the increased cost of sustainability and
environmental conservation easier for less understanding stockholders (Jeurissen, 2000).
Stronger financial institutions can be in a stronger position to provide businesses seeking an
investment with the funds necessary to pursue longer-term projects that become profitable later
in their lifecycle (Jeurissen, 2000). Governments that see the value in policies that can help shape
communities and preserve the environment for future enterprises, generations, and investment
(Elkington, 1999).
40
Triple bottom line: Concept. Triple bottom line (TBL) (Elkington, 1999) builds of the
concepts put forth in stakeholder theory and will be utilized to frame this study. TBL (Elkington,
1999) framework is made up of three sections that focus on alternate components of traditional
businesses overall responsibility. Economic, social, and environmental elements need to be
equally applied to a business’s bottom line (Elkington, 1999). Each section of the framework is
interrelated with each other and helps influence long-term prosperity (Tate & Bals, 2018; Żak,
2015). In the past centuries, businesses’ primary concern has been for profit (Elkington, 1999;
Spreckley, 1981). Organizations utilizing TBL should prosper and be in an optimal position to
succeed in the 21st century and beyond (Elkington, 1999). Economic, social, and environmental
components of TBL (Elkington, 1999) all influence the ideas behind CSR. As such, it is
imperative to understand the evolution of each and how, when combined, they form the
foundation of a CSR policy.
Triple bottom line: Economic. Of the three sections of TBL (Elkington, 1999), profit is
the universal dimension for all organizations. The idea of an exchange for gain has been around
since humans realized the importance of specializing in trade to receive the goods and services,
they could not produce themselves (Das, 2016). Profit is required for an organization to grow
(Das, 2016). Until recent decades, businesses have focused on profit maximization without the
encumbrance of alternative societal activities. Child labor and disregard for the environment
were considered prudent business choices to ensure maximum profitability (Arko-Achemfuor &
Dzansi, 2015). Eren and Eker (2012) discovered that non-CSR conforming firms that only focus
on profits are increasingly suffering from a disillusioned society and it is resulting in lower
success rates. The way business has viewed profitability has evolved. Additional influencers to
strict profit and profitability polices are now measured. Business examines how an image can
41
affect current and future market profitability. Attention is being given to stakeholder concerns
and how they affect an organization’s bottom line. Social factors such as employee working
conditions, environmental conservation, and social presence are weighed for long-term customer
retention and profitability (Arko-Achemfuor & Dzansi, 2015).
Triple bottom line: Social. Social and environmental components make up the final two
sections of the TBL theory (Elkington, 1999). These sections are closely related but distinctly
different. The social component focuses more on the stakeholders and their overall wants and
needs. While the environmental component emphasizes short- and long-term responsibility to the
earth and the stakeholder's environment. Because the affect business can have on the
environment, and the amount of planning and resources needed to compile an effective plan, the
environmental component is separated out from the social to provide it with sufficient emphasis.
The social component of TBL (Elkington, 1999) represents an organization’s ability to
ensure that it is a good corporate citizen and responsible to all stakeholders who depend upon it.
There are many ways that the social component can be affected. One of the most prominent is
that of downsizing to ensure that profit margins are met. Disputed measures of laying off
employees can often lead to quality staff being terminated while less effective staff remains
(Alexandra & Ion, 2014). Taking this action creates a two-stage problem for business. First, it
reduces company morale which can reduce future output. Second, it can result in creative
destruction where former employees are free to work with the competition to develop more
advanced products and services that can reduce the original company’s sales/profits (Jung,
2015). In a social framework, measures can be taken to ensure quality employees do not leave
the organization. Promotion among those who have outgrown their current position because of

42
their continual increasing skills can be retained, thereby improving the organizational ability and
reputation (Alexandra & Ion, 2014).
Amongst many other areas that fall into the social component, communication is
increasingly becoming key in organizational success (Alexandra & Ion, 2014). Organizational
theories such as Theory Y and Z put forth by McGregor and Cutcher-Gershenfeld (2008), and
Ouchi (1993) respectively, showcased the effect employee empowerment can have on
production. As previously described in detail, theory Y’s contention that employees view work
as part of their everyday life and prefer limited direction, helps to reinforce the idea for increased
social governance in the workplace (McGregor & Cutcher-Gershenfeld, 2008). Increased
attention to workplace conditions, employee scheduling, and benefits are starting to change the
social environment within the workplace (Acquay, 2017). Outside of the workplace, corporate
citizenship has evolved to include activities such as community outreach, sponsorships, and
involvement (Coskun-Arslan, & Kisacik, 2017).
Triple bottom line: Environmental. The third component of TBL (Elkington, 1999) is
represented by an environmental component or sustainability. Over the past two decades, society
has increasingly demanded that organizations utilize a sustainable approach while conducting
business (Arko-Achemfuor & Dzansi, 2015; Hourneaux Jr, da Silva Gabriel, & Gallardo-
Vázquez, 2018). Sustainability is represented by many factors, not just concern for the
environment. Corporate governance, shareholder value, community involvement, and corporate
legacy (goodwill) are all viewed as drivers of a corporation’s financial health (Arko-Achemfuor
& Dzansi, 2015). Justifiable use of natural resources such as water, minerals, and land help
develop a pattern of responsibility and lead to sustainable development. This type of growth

43
provides a balance between growth/development and financial profits (Dzansi, 2011; Hourneaux
Jr. et al., 2018).
According to Maslow’s (1943) Hierarchy of Needs, individuals will seek out
physiological needs such as food, safety, and shelter before moving on to more advanced needs
and wants. Moving up Maslow’s (1943) pyramid, safety and belongingness layers begin to
unfold. Within these layers, humans find the need for security, family, employment, friendship,
and intimacy. These levels of needs have been found to correlate to the wants of sustainability
and quality of life within one’s surroundings (Alexandra & Ion, 2014). Businesses that are
offering more sustainability are in better position to secure current and future revenue based on
their long-term outcomes and regard for the environment.
Outside of the philosophic consumer views, other stakeholders such as employees can
also benefit from environmental conservatism. Utilizing materials that are less harmful to the
environment are also generally less toxic for workers (Alexandra & Ion, 2014; Yudhoyono,
2015). Increased exposure to chemicals can be linked to an increase in allergies and certain types
of illness. Those who suffer do not agonize alone. Family members also must go through the
daily regimen of medications and precautions to ensure their loved one is receiving the treatment
they need to get better (Yudhoyono, 2015). Having employees or customers that are becoming ill
will have negative long-term repercussions on a corporation’s goodwill and can affect its bottom
line. Many organizations have responded to concern from their stakeholders about their
environmental impact by strengthening their CSR initiatives (Alexandra & Ion, 2014). The way
businesses handle their ecological implications has evolved from a short-term, immediate impact
philanthropic approach, to a method that blends short and long-term projects that address
stakeholders environmental concern (Alexandra & Ion, 2014; Morgeson et al., 2013).
44
Stakeholder Theory Advancements
There has been extensive research that has expanded on both ST (Freeman, 1984;
Freeman, & Dmytriyev, 2017) and TBL (Elkington, 1999). Recent studies by El Akremi et al.
(2018); Hussain et al. (2018); Stanfield and Tumarkin, (2018); Lim (2017); and Olsen (2017)
have advanced the principles of ST. Freeman’s (1984) original idea of a business’s relationship
with its communities, customers, employees, investors, and suppliers when operating in a
market-based economy has expanded in detail and practice. Rodriquez et al. (2002) and
Oladimeji et al. (2017) classified four main categories for studying ST, communities and
environments, customers, employees, and government.
Each category has had advancements reinforcing the premise behind ST (Freeman,
1984). Olsen’s (2017) work advanced upon the evidence of the influence government has as on a
stakeholder. Employee engagement within an organization was progressed by El Akremi et al.
(2018) who discovered that there was a lack of constancy with how employees’ perceptions were
measured and the importance of a consistent, uniform measurement standard. Environment and
communities have been heavily explored (Çetinkaya et al., 2016; Welford et al., 2007).
Developments in these areas foster community involvement with financial donations, education,
and job training, volunteer programs, environmental performance reviews, and employee
philanthropic ideas. Taking advantage of community-based initiatives such as retraining and
employing those previously incarcerated for nonviolent crimes would improve the community
(Arumemi, 2016). Consumer preferences have evolved from primarily being environmentally
focused on more general sustainability concerns. Concerns centered on human capital, social
influence, and community, have shown how a corporate policy that addresses these concerns
assists in retaining and attracting a client base (DeLong, 2016).

45
Triple Bottom Line Advancements
As with ST, TBL (Elkington, 1999) has evolved based on the numerous research studies
conducted since its inception (Arko-Achemfuor & Dzansi, 2015; Hourneaux Jr. et al., 2018;
Hussain et al., 2018; Tate & Bals, 2018; Żak, 2015). Evolution of TBL originated with Elkington
(1999) himself. Elkington (1999) suggested that the three TBL categories; social, environmental,
and economic, which were intended to benefit firms by increasing their competitive advantage,
were to be interrelated, interdependent, and partly in conflict. Seven dimensions were offered to
help better align each category. Elkington (1999) found that markets, values, transparency, life-
cycle technology, partnerships, time-perspective, and corporate governance improved
organizations and expanded business thinking towards a more progressive approach.
As with ST (Freeman, 1984), the three main sections of TBL (Elkington, 1999) were
examined for advancements and their evolution. The economic component proved to be heavily
studied. Arko-Achemfuor and Dzansi (2015) and Eren and Eker (2012) discovered that
organizations focusing solely on profits were losing customers who have become more aware of
the concept of corporate citizenship. This resulted in lower success rates amongst those types of
organizations. Unlike the economic component, the social element of TBL (Elkington, 1999)
focuses more on general stakeholders than stockholders. Corporate citizenship, such as
community outreach, sponsorships, and involvement (Coskun-Arslan, & Kisacik, 2017), has
been found to increase levels of consumer goodwill. This, along with the increased consideration
to workplace conditions, employee scheduling, and benefits, are allowing for an improved
environment within the workplace (Acquay, 2017). The environmental aspect of TBL
(Elkington, 1999) has led to an increase in the responsible use of natural resources such as water,
minerals, and land (Dzansi, 2011; Hourneaux Jr. et al., 2018). Promoting an environmentally

46
responsible company has led to better conditions in communities and increased goodwill
(Hourneaux Jr. et al., 2018).
Current Contributions to Stakeholder and Triple Bottom Line Theory
Advancements in ST (Freeman, 1984) and TBL (Elkington, 1999) have been numerous
as previously mentioned. This study will help forward the relevance of each by examining the
relationship of organizational financial results against their use, or lack of use, of a CSR policy.
To ensure consistency with previous studies (Anderson, 2019; Barney, 2018; Kruse, 2019; Lim,
2017; Stanley, 2011) CSRHub’s ESG framework will be utilized. CSRHub’s ESG index rating
system consists of four primary categories: (a) community, (b) employee, (c) environment, (d)
and governance (ESG, 2019). Each primary category is made up of three secondary categories
for a total of twelve secondary categories. The secondary categories include: (a) community
development and philanthropy, (b) product, (c) human rights and supply chain, (d) compensation
and benefits (e) diversity and labor rights, (f) training, health, and safety, (g) energy and climate
change (h) environmental policy and reporting, (i) resource management, (j) board, (k)
leadership ethics, (l) transparency and reporting (ESG, 2019).
CSRHub’s ESG index rating system consists of four primary categories: (a) community,
(b) employee, (c) environment, (d) and governance, will act as the measurement tool in
determining CSR rating (ESG, 2019). Keeping the measurement criteria consistent will help
build on Lim (2017) and Stanley’s (2011) previous work. Once each of the S&P 500 companies
is examined and sorted into one of the eleven sectors, an analysis can be conducted to determine
if a CSR policy affects financial performance in the same way. This research advanced the
knowledge of ST (Freeman, 1984) and TBL (Elkington, 1999) by forwarding the understanding
of how a CSR policy affects organizational profits.
47
Corporate Social Responsibility
Interpretation of corporate social responsibility (CSR) has historically involved an
examination of the combined effects of policies, practices, and strategies designed to enhance the
satisfaction of stakeholders. Typically, this is in relation to the simultaneous environmental and
social benefits of a business (Mosca, Casalegno, & Civera, 2016). The concept of stakeholder
theory (ST) (Freeman, 1984) continues to evolve and be debated (Hou, 2018; Jones et al., 2018;
Mosca et al., 2016; Oladimeji et al., 2017). Researchers have found that a firm will be more
successful when it improves its relationship with stakeholders (Barnett & Salomon, 2012;
Oladimeji et al., 2017; Rodriquez et al., 2002). Initial blending of CSR and ST was discussed
within the context of achievable CSR policies that contributed to direct profit (Freeman, 1984).
This definition started to evolve following a study that supported the idea that CSR should
expand economic, legal, and technical requirements of a company (Davis, 1973). This expansion
to the theory suggested that even if a company does not experience immediate, measurable
profitable gains, the goodwill created by these policies will ultimately contribute to long term
profits. Davis’ (1973) suggestions placed the concept behind CSR in opposite directions.
Freeman’s (1984) view emphasized the commitment to shareholders as well as social
responsibility to boost immediate profits. Davis (1973) argued that shareholders were one of
many stakeholders that needed to be considered when implementing a CSR policy. CSR has
continued to evolve over the past decades. Integrated within CSR are many different trends and
theories. Ethics, sustainable development and growth, and values combine with stakeholder
theory (Freeman, 1984) to form a firm’s cohesive CSR policy (Mosca et al., 2016). Changes in
globalization and stakeholders’ views towards social responsibility have motivated organizations
to develop and implement more robust CSR based policies (Brondoni, 2014; Mosca et al., 2016).
48
As with stakeholder theory (Freeman, 1984), corporate social responsibility (CSR)
continues to be debated (Galant & Cadez, 2017). An accord on a true definition of CSR remains
elusive (Dahlsrud, 2008; Mosca et al., 2016; Visser, 2012). Differing interpretations of many
aspects of CSR, including its constructs, dimensions, and principles, exist (Crane, McWilliams,
Matten, Moon, & Siegel, 2008; Galant & Cadez, 2017). The current body of literature refers to
over 37 different definitions for CSR (Dahlsrud, 2008; Galant & Cadez, 2017; Roszkowska-
Menkes, 2016. These CSR definitions varied in dimensions, but five prominent concepts
emerged: (a) Economic, (b) Environmental, (c) Social, (d) Stakeholders, and (e) Voluntariness
(Roszkowska-Menkes, 2016). Based on Roszkowska-Menkes (2016) findings, the economic
dimension focused on describing CSR with a focus on the socio-economic aspects of the
business operations. The social dimension examines the association between business and the
community. The environmental dimension focused on any issue facing the natural environment,
while the voluntariness dimension examined acts taken by a business and its associates that are
not required by law. The stakeholders dimension focused on the responsibility each firm has to
any group affected by that business.
There have been many interpretations of CSR with no definitive definition emerging.
Roszkowska-Menkes (2016) found that CSR distracts from a firm’s primary focus of profits.
Researchers (Hur, Kim, & Woo, 2014; Mosca et al., 2016; Singh, 2016), found some businesses
view CSR as an extension of their goal of increasing profits. Any CSR initiative must be
purposeful and have a direct impact on a business’s competitive advantage as well as its short-
and long-term finances. This idea of CSR supports Freeman’s (2010) original definition of ST.
de Colle, Henriques, and Sarasvathy (2014) criticized this type of CSR planning as being
achievement based and lacking innovation. Other researchers (Jamali & Mirshak, 2007; Mosca et
49
al., 2016; Rudolph, 2005) suggested that some businesses’ CSR policies focused on pushing
social change and development while improving the world. This type of CSR policy would
represent the opposite end of the CSR ideal spectrum. Firms would concentrate on enhancing
society with less regard to overall profit output. Ideally, a CSR balance would include businesses
becoming economic and social partners with stakeholders while adapting these core
competencies into their everyday business model (Crane, Palazzo, Spence, & Matten, 2014;
Freeman et al., 2010; Visser, 2012). Freeman et al. (2010) described this as an integration of
environmental, ethical, and social criteria infused into corporate strategy.
Corporate social responsibility: Adaptive vs. integrated. At its core, CSR is a
multidimensional concept that continues to be evolutionary (Krunic, 2017). Corporate social
responsibility suffers from residual logic as its approach to the combination of profit and
stakeholder responsibility seems at odds (Freeman, 2010). Visser (2012) criticized this approach
to CSR as not fulfilling its described purpose. Modern marginal CSR, titled CSR 1.0, compared
systemic corporate sustainability and responsibility titled CSR 2.0 (Visser, 2012). CSR 1.0 was
defined as being on the fringe of a firm’s primary policy. This type of CSR policy is
implemented incrementally based on quality but lacks the urgency of both environmental and
social issues. Financial measurement is difficult to measure in the short term, and there is little
conclusive evidence that the market would reward these efforts (Visser, 2012). CSR 1.0 (Visser,
2012) tied social responsibility to a residual effect for both company and stakeholders. This form
of CSR had a cause and effect relationship.
To adapt to the shortcoming present in CSR 1.0, Visser (2012) suggested an alternative
approach to CSR 1.0, which was titled CSR 2.0. CSR 2.0 focused on using a complete business
policy that had CSR initiatives intertwined throughout. CSR 2.0 allowed for a business model
50
that would better promote positive societal changes through the integration of policies (Visser,
2012). The collaboration between stakeholders and business would foster success and result in
increased performance and gains by market incentive systems (Visser, 2012). Intertwining CSR
with other business-related policies from inception could help companies of all sizes reap the
rewards of increased stakeholders’ patronage and participation. All businesses regardless of their
size, policies, and responsibilities, must place stakeholder relationships in the forefront and allow
for greater collaboration (Crane et al., 2014; Freeman & Velamuri, 2006). Evolution of CSR has
continued and has led to new observed evidence (Casalegno & Civera, 2016; Mosca, et al., 2016;
Mosca et al., 2016). Three main dimensions have been suggested as a result of both residual and
integrated evidence (a) integrated output; (b) standards, norms, and labels; and (c) strategic
philanthropy (Mosca et al., 2016).
The first dimension of integrated output has shown the most proliferation in CSR over the
past decades. Businesses have progressed in integrating many social and ethical morals into their
mission and vision statements (Mosca et al., 2016). This incorporation into mission and vision
statements have set the stage for additional inclusion into many policies and processes. Examples
of these integrations include increases in zero-waste recycling, increased collaboration to
improve supply chain value, and stakeholder engagement. Integrating output has assisted in
bringing increased meaning and value to both the company and its stakeholders (Mosca et al.,
2016).
The second dimension of standards, norms, and labels are associated with the economic,
environmental, and social aspect of CSR. Firm based certifications such as ASME (public safety
and quality), ISO (environmental and quality), AASCB (education), and NEBB (building and
systems) focus improved stakeholder service and quality of service. Most certifications are not
51
mandatory but assist in differentiating a company’s offerings from the competition. Stakeholders
have come to expect these types of qualifications as certifications and standard throughout each
industry. These policies will continue to be a residual tool rather than a reposition of a CSR
business model when standards, norms, and labels are adopted as a stand-alone approach and not
integrated wholly into a business’s policy (Mosca et al., 2016).
The last dimension is a departure from the traditional CRE 1.0 (Visser, 2012) concept.
Philanthropic giving traditionally has taken a strategic approach and has been a way to increase
goodwill while taking advantage of benefits such as favorable taxation (Barney, 2018; et al.,
2016). Philanthropic support can take many forms. Company branding, sponsorships, and
employee giving represent common ways businesses back charitable giving. Focusing these
efforts around the core competencies of an organization helps in developing a more integrated
and strategic form of giving (Mosca et al., 2016). Organizations focusing on areas of need or
concern within their industry may elevate the level of stakeholder goodwill (Mosca et al., 2016).
Integration of a CSR policy opposed to the residual adaptation can pose a challenge to
business (Brondoni, 2014; Mosca et al., 2016). Building partnerships using a multi-stakeholder
approach requires much collaboration and a forward thinking. This type of policy may be
effective for companies of all sizes. Younger businesses adopting these ideals can better position
themselves in terms of CSR relevancy and integration as they grow. Mosca et al., (2016)
suggested that CSR is no longer just a management initiative. It now requires a transparent
approach that is supported by all levels of employees to be successful. Discussion with all
shareholder will help in creating a balanced CSR policy that can support each group fairly
(Visser, 2012). Increased stakeholder consumerism may lead to increased sales and a more
favorable view of the overall business.

52
Corporate social responsibility: Future advancement. Corporate social responsibility
continues to evolve. Research (Ağan, Kuzey, Acar, & Açıkgöz, 2016; Dahlsrud, 2008; Krunic,
2017; Mosca et al., 2016; Visser, 2012); has advanced the understanding of how a successful
CSR policy should look. Stakeholder theory (ST) (Freeman, 1984) has been recognized as the
most common theory framing CSR (Roszkowska-Menkes, 2016). ST can be used to identify
precise stakeholder groups can positively benefit an organization (Roszkowska-Menkes, 2016).
Continues engagement and dialog will allow firms to continue to comprehend and incorporate
feedback within an ever-evolving CSR policy. The information gleaned from these conversations
can be used to further evolve CSR integration by strengthening all relevant operational areas
(Greenwood, 2007).
Standardization has remained elusive despite several attempts to define CSR effectively.
One positive development has been the introduction of the International Organizations of
Standardization’s (ISO) 26000 initiative (ISO 26000, 2017). ISO developed this initiative in
2010 after five of discussion between various stakeholder located throughout the globe (ISO
26000, 2017). An international consensus was achieved by working with consumer groups,
governments, labor unions, and non-profit organizations (ISO 26000, 2017). Over 500
multifaceted professionals assisted in developing ISO 26000. A communications protocol
standardized CSR wording to help increase the transfer of information between firm and
stakeholder. Though created in 2010, ISO 26000 guidelines are linked to the UN Agenda 2030,
which lays out sustainable development goals (ISO 26000, 2017). Unlike many other ISO
certifications, ISO 26000 offers guidelines other than requirements. Because of this distinction,
ISO 26000’s purpose is to guide and clarify CSR to all organizations and their stakeholders (ISO
26000, 2017). Adoption of the ISO 26000 has steadily increased and is recognized as the most
53
adaptive definition by many CSR users (Roszkowska-Menkes, 2016). Though ISO definition has
become increasingly popular, inconsistencies remain regarding institutional approaches
(Roszkowska-Menkes, 2016).
Corporate social responsibility: Relationships and measure of study. The topic of
CSR influence on financial performance is not new. There have been several recent studies that
have examined the effect of CSR on corporate financial performance (Ağan et al., 2016; Galant
& Cadez, 2017; Hourneaux et al., 2018; Kim et al., 2018; Krunic, 2017; Lim, 2017; Martínez-
Ferrero et al., 2014). Though other exploration exists on the topic of CSR, the research chosen
for this literature review is more specialized and better related to the effects of debts on profits
within CSR. Results from the studies have been mixed. Galant and Cadez (2017) found no
correlation between CSR and corporate profits, while Lim (2017) identified a positive
relationship. Other studies by Kim et al. (2018) produced mixed results. These conclusions
reinforce earlier findings that suggested that business profit may or may not be affected by
corporate social responsibility.
Examination of the research criteria and methods are needed to better understand why
results from many different analyses have been mixed. Many different categories of
measurement have been studied concerning CSR and a firm’s finances. To better understand the
measures in each category, CSR and firms’ financial performance will be inspected separately.
The primary source of CSR information is the indexes (Galant & Cadez, 2017). Index-based
analysis has both advantages and disadvantages. One advantage of using indexes is the
availability and comparability of standardized information and measures. Data retrieved from
indexes such as CSRHub ESG and Dow Jones Sustainability Index series (DJSI) provide vast
data that allows for easy comparison amongst funds (ESG, 2019; Galant & Cadez, 2017). This

54
type of commonly used information comes with its deficiencies. Most pressing are the indexes’
inability to cover all market size and industry firms. These shortcomings make researching small
to mid-size firms difficult using this method.
Most indexes fail to utilize a scientific basis when rating their securities. One popular
method of the rating agencies is to place the securities in an order or grouping. The DJSI uses a
compiling of three categories that include environmental, governance, and social (S&P ESG,
2019). A total of 21 industry-specific scores are weighted to help reduce the research bias of the
companies who self-report using the DJSI’s Corporate Sustainability Assessment (CSA) versus
being graded on publicly available information (S&P ESG, 2019). Graafland, Eijffinger, and
SmidJohan (2004) found that many CSR rating firms are private businesses that follow their own
agenda and may not utilize in-depth scientific research.
An alternate research measurement used to quantify CSR is content analysis (Galant &
Cadez, 2017). Concepts about organizational information are determined based on the relevancy
of a study and then placed into quantitative scales and used for statistical examination. The
primary method used for coding was binary coding (Aras, Aybars, & Kutlu, 2010; Galant &
Cadez, 2017). This method of quantitative coding relies on a score of 0 and 1 to account for
various primary conditions. When more complex situations occur where multiple or a more
multifaceted coding is required, a binary rating can be allocated to variable and then interspersed
for a collective analysis (Aras et al., 2010; Galant & Cadez, 2017; Park, 2018). Likert scales
have also been used when assessing multiple dimension based measurables. Use of a binary-
based scale can be traced back to Abbott and Monsen (1979). Abbott and Monsen (1979) utilized
over 20 indicators for CSR over six groups. Though not as common as indices-based coding,
binary constructed studies focusing on CSR are present. Recent studies using binary-based
55
coding included: Chen, Feldmann, and Tang (2015); George, (2016); Karagiorgos (2010); Park,
(2018); Yang, Lin, and Chang (2009). Many advantages for binary coding exist. Primary data
collection allows for less error when measuring and reporting results. A fundamental weakness
for binary coding results from the researcher subjectivity (Galant & Cadez, 2017). The selection
of what measures the researcher reports can be skewed in favor of that researchers’ biases.
A sampling-based approach represents another alternative for CSR research. Sampling is
typically completed using questionnaire-based surveys and done when no other form of data
rating is available (Galant & Cadez, 2017). Sampling-based CSR research that focused on
financial performance has been conducted as early as the late 1970s (Galant & Cadez, 2017).
Examinations by Carroll (1979) and Aupperle, Carroll, and Hatfield (1985) represent some of the
earliest qualitative survey-based CSR studies. These studies utilized scales that allowed
respondents to quantify their answers using a sliding scale such as 0 – 5. With 0 being lowest and
5 being highest. Using qualitative based scales allows the researcher greater flexibility when
stipulating areas of interest and gathering useful data (Galant & Cadez, 2017). As with binary
coding, surveys present a limitation in terms of research bias. Cadez and Czerny (2016) found
that both selection bias occurs because of the voluntary nature of respondents. Socially
responsive respondent companies are more likely to reply to a survey than those firms who do
not (Cadez & Czerny, 2016). Collecting responses from stakeholders was suggested by Epstein
and Rejc-Buhovac (2014) to mitigate this type of bias.
The last common measure of study for examining the effects on profit from a CSR policy
is narrow constructed research. One-dimensional concepts explore one area of CSR. Researchers
using this measure focus solely on one aspect of CSR such as: pollution control (Cadez &
Czerny, 2016; Mokhtar, Jusoh, & Zulkifli, 2016; Naranjo-Gil, 2016); public based activities
56
(Naranjo-Gil, Sánchez-Expósito, & Gómez-Ruiz, 2016); environmental management (Mokhtar
et al., 2016). Those utilizing one-dimensional measurement have an easier time with both
collecting and associating data (Galant & Cadez, 2017). Single dimension research has proven
challenging because CSR by nature is multidimensional. By reporting just one area of CSR, a
company may look as if they are fully complying with a total CSR program (Galant & Cadez,
2017). However, other CSR aspects may be lacking or neglected. A complete examination of the
whole CSR policy may help in eliminating businesses with singular CSR objectives that could
provide a misrepresentation of the data.
Corporate Profit Measurement Types
Researchers (Austin, 1994; Daniel, 2018; Galant & Cadez, 2017) have commonly utilized
two primary types of financial indicators when examining organizational profits. Both
accounting and market-based indicators have been used to determine the effects CSR has
contributed to firm profits. As with most measures, both accounting and market-based indicators
have traits that can be negative and positive (Table 4).
Accounting based measures include return on assets (ROA), return on equity (ROE),
return on capital (ROC), return on capital employed (ROCE), return on sales (ROS), net
operating income (NOI), and net income. Each indicator has been used to measure value within a
business (Galant & Cadez, 2017). Accounting based measures are readily available for all
incorporated businesses and are available on their EDGAR filed 10k reports (EDGAR, 2019).
Because each American company is required to register a 10k report each year, all information is
available and readily comparable (EDGAR, 2019). A disadvantage facing accounting-based
research focuses on the timeliness of the information. 10k reports are compiled using the
previous year’s data causing a lag in real-time data. On its own, each accounting-based indicator
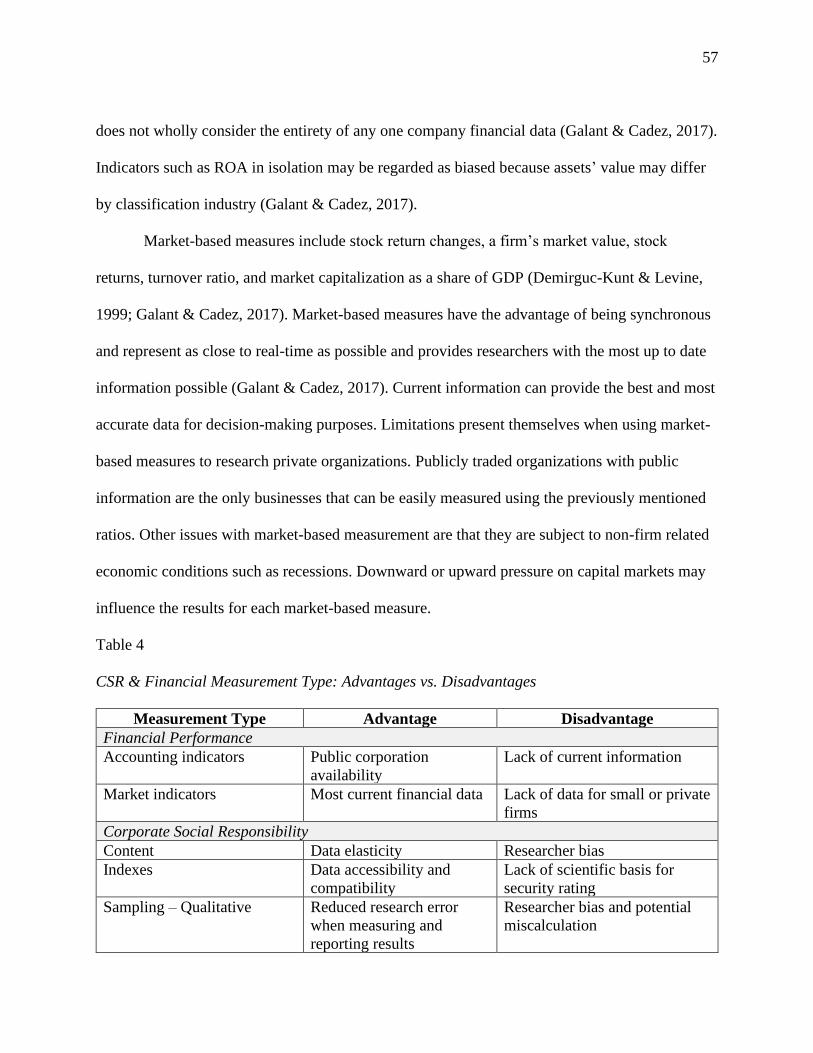
57
does not wholly consider the entirety of any one company financial data (Galant & Cadez, 2017).
Indicators such as ROA in isolation may be regarded as biased because assets’ value may differ
by classification industry (Galant & Cadez, 2017).
Market-based measures include stock return changes, a firm’s market value, stock
returns, turnover ratio, and market capitalization as a share of GDP (Demirguc-Kunt & Levine,
1999; Galant & Cadez, 2017). Market-based measures have the advantage of being synchronous
and represent as close to real-time as possible and provides researchers with the most up to date
information possible (Galant & Cadez, 2017). Current information can provide the best and most
accurate data for decision-making purposes. Limitations present themselves when using market-
based measures to research private organizations. Publicly traded organizations with public
information are the only businesses that can be easily measured using the previously mentioned
ratios. Other issues with market-based measurement are that they are subject to non-firm related
economic conditions such as recessions. Downward or upward pressure on capital markets may
influence the results for each market-based measure.
Table 4
CSR & Financial Measurement Type: Advantages vs. Disadvantages
Measurement Type Advantage Disadvantage
Financial Performance
Accounting indicators Public corporation
availability
Lack of current information
Market indicators Most current financial data Lack of data for small or private
firms
Corporate Social Responsibility
Content Data elasticity Researcher bias
Indexes Data accessibility and
compatibility
Lack of scientific basis for
security rating
Sampling – Qualitative Reduced research error
when measuring and
reporting results
Researcher bias and potential
miscalculation

58
Single dimension analysis Collecting and associating
data
Narrow scope of data
Note. Summary of information found within Chapter 2: Literature Review: Corporate Social Responsibility –
Adaptive vs. Integrated and Corporate Social Responsibility – Future Advancement
To overcome the issue of accounting versus market-based measurement, recent
investigations (Cadez & Czerny, 2016; Daniel, 2018; Rodgers, Choy, & Guiral, 2013), have
utilized more than one measure to observe the effect of firm financial performance related to
CSR (Galant & Cadez, 2017). Combined attempts at measurement by researcher like Daniel,
(2018); Garcia-Castro, Ariño, and Canela, (2010); and Rodgers et al. (2013), have led to
indicators such as Tobin’s Q or the market value-added approach. More common have been
efforts to combine both accounting and market-based measurement to form a comprehensive
plan. Many studies, such as those by Peng and Yang (2014) and Rodgers et al. (2013), have
merged these indicators to understand the results of CSR on firm performance better.
Corporate Financial Performance
Short- and long-term profit in conjunction with debt to equity were found to be one of the
under-examined aspects of research concerning CSRs effects on organizational profit. How debt
levels influence both short and longer-term profit also contains a deficiency of information.
Though recent studies by Benlemlih (2017); Branzei, Frooman, McKnight, and Zietsma (2018);
Chalmers and van den Broek (2019); Harjoto (2017); Hsu and Liu (2017); La Rosa, Liberatore,
Mazzi, and Terzani (2018); Limkriangkrai, Koh, and Durand (2017); and Villarón-Peramato,
García-Sánchez, and Martínez-Ferrero (2018), all examined the concept of debt, none have
observed the effects of short term, long term, and current profit levels in relation to debt to
equity. Previous research that examined debt focused on areas such as leverage and financing
59
(Harjoto, 2017; La Rosa et al., 2018), bond rating and economic volatility (Branzei et al., 2018;
Chalmers & van den Broek, (2019), debt maturity (Benlemlih, 2017).
The economic environment consists of economic forces outside of any business’s
control (United States, 2019). Occurrences such as recession, natural disasters, and fluctuating
currency values can cause business debt and profits to shift and become unstable (United States,
2019). Chalmers and van den Broek (2019) examined the effect on the economy in the wake of
the 2007–2009 global recession. The research focused on the public’s perception of different
industries, primarily financial. It was found that firms that had greater public exposure received
the most scrutiny as it related to their CSR policies (Chalmers & van den Broek, 2019).
Externalities were cited as not only impacting a company’s profits but also increasing a
business’s public image. Increasing a firm’s negative public image caused a cumulative effect on
profits (Chalmers & van den Broek, 2019). The result of Chalmers and van den Broek, (2019)
research supported the hypothesis that the public’s perception of a firm that reports a
comprehensive CSR policy receives more financial volatility and scrutiny during times of
economic-based events.
In addition to Chalmers and van den Broek’s (2019) work that focused on the external
environment, Hsu and Liu (2017) also examined a phenomenon outside of business controls:
quantitative easing. Quantitative easing is described as when the United States Federal Reserve
reduces the cost of servicing corporate debt, allowing companies to increase borrowing (Hsu &
Liu, 2017). Chalmers and van den Broek’s (2019) research examined the U.S. quantitative easing
policy following the 2007 recession. Indices from KLD (MSCI) and Moddy’s were used to
calculate default risks. The analysis found that during times of quantitative easing, organizational
default risk was under calculated. This result was attributed to the reduction of long-term bond
60
yields lower bond risk and values (Hsu & Liu, 2017). Hsu and Liu (2017) found that businesses
with higher CSR policies had lower default risk.
Other works (Harjoto, 2017; Limkriangkrai et al., 2017) have also focused on the effects
of debt on leverage. Limkriangkrai et al. (2017) utilized an indices approach with an examination
of CSR based on an environmental, social, government (ESG) platform. This examination
utilized Australian based companies. Each company was assigned a Likert scale number based
on the level of ESG. Results from Limkriangkrai et al.’s (2017) study found that there was no
risk-adjusted cost when utilizing an ESG policy with higher-rated ESG rated firm hold an
increased amount of debt. Harjoto (2017) took a different approach and examined the degree of
operating leverage (DOL) and financial leverage (DFL). An indices approach was taken using an
ESG database to gather organizational ratings. Earnings before interest and taxes (EBIT),
earnings after interest, and taxes (EAIT) were used to measure debt against the ESG ratings
(Harjoto, 2017). Results of the study also found that a CSR policy increased operating cost and
operational leverage.
Research by Villarón-Peramato et al. (2018) represents one of the more recent studies
that focused on debt as it relates to profit within a CSR policy. Villarón-Peramato et al. (2018)
built on earlier research claiming that leverage was influenced by country and industry type. The
market leverage ratio was used in Villarón-Peramato et al.’s (2018) study to examine long term
debt and capture leverage within an organization. They captured equity by combining the market
value of common stock and book value of preferred shared (Villarón-Peramato et al., 2018).
Other factors controlled within their study included size, growth, return on assets (ROA) and the
use of 1916 businesses from 22 European countries between 2002 and 2010 (“Debt, strategy and
CSR”, 2018; Villarón-Peramato et al., 2018). Finding from Villarón-Peramato et al. (2018) study
61
resulted in a positive benefit for firms when used ethically. A reduction in risk and a lower cost
of capital was also observed (“Debt, strategy and CSR”, 2018).
Measurement Conclusion
Measurement type focusing on CSR effects on corporate profit have proved decisive.
CSR effects on profit have been studied in various ways (Ağan et al., 2016; Daniel, 2018;
George, 2016; Hourneaux et al., 2018; Kim et al., 2018; Krunic, 2017; Lim, 2017; Martínez-
Ferrero et al., 2014; Park, 2018). Content, indexes, sampling, and singular dimension analysis
have proven to be the most common approach used when determining a firm’s CSR. These
measures are commonly based on their availability, elasticity, and compatibility. Previous
researchers have selected the CSR measure based on which fits the principle goal of their study.
This conventional approach has led to the discrepancy in findings (Villarón-Peramato et al.,
2018). It does, however, leave open the possibility for future studies (Lim, 2017). An area that
was discovered to be limited in research content was the relationship between CSR influence on
corporate financials as they related to the U.S. S&P 500 sectors when measured using debt to
equity (D/E), net profit margin (NPM), and return on assets (ROA). Debt level, short-term profit
and long-term profit will be represented by three accounting – index-based indicators; debt to
equity (D/E), net profit margin (NPM), and return on assets (ROA).
Earlier researchers (Chang, Kim, & Li, 2014; Lim, 2017) emphasized ROA for their
primary measure. The current study will utilize ROA, D/E, and NPM for a complete analysis of
the effect debt has on a firm’s profit when sustaining a CSR policy. Debt to equity ratio allows
for longer-term debt (1 year or longer) to be studied in relation to ROA. Debt to equity ratio
helps to determine whether the business is financing spending using debt or other financial
measures. The level of debt will directly influence ROA. Return on assets have been used in
62
many studies (Lim, 2017; Nega, 2017). Return on assets reports how effective an organization
has been profiting from its assets. The current study will incorporate ROA to connect debt
throughout a firm’s analysis. The final measure will be NPM. Net profit margin allows the
researcher to determine how much profit is made on average from all sources of sales. Because
the profit determined from this ratio is based on current sales, a short-term profit/debt analysis
can be determined. Together D/E, ROA, and NPM may provide a total picture of the effects of
debt on a company’s finances and, as an extension, the financial implications of its CSR policy.
Each of the three variables, D/E, ROA, and NPM, represent accounting indicators that are
found and can be calculated using a corporate 10k report. These accounting-based measures were
chosen over the other types because of their reliability in reporting and ease of access. Each
publicly traded company must file an end of year financial report to the Securities and Exchange
Commission. All information must be accurate, or a firm may face penalties such as fines and
those certifying the accuracy of the report, prison (d, 2019). Compiling a picture of company
shot and long-term profit and debt and examining them against the four ESG categories found in
CSRHub’s ESG index may provide a more advanced understanding of CSR influence on a firm’s
financial performance. Reputation indices were determined to be the best fit for measuring CSR
in this study. CSRHub has a premium reputation as a leading investment rating agency. CSRHub
provides data gathered from over 605 sources across 134 industries. They utilize many CSR
indexes, including Dow Jones Sustainability Indexes, Ideal Ratings, ISS, MSCI, TRUCost, and
Vegio Eiris to compile an aggerate index ratings. Both industry experts and academics utilize
CSRHub (ESG, 2019).
63
Conclusion
Review of current literature that focused on both stakeholder theory (Freeman, 1984) and
triple bottom line framework (Elkington, 1999) as it relates to corporate social responsibility led
to the discovery that CSR effects on finical performance as it relates to each S&P 500 sector has
been sparsely explored. The evolution of ST (Freeman, 1984) has led to the development of
many critical additions to the theory such as the importance of each type of stakeholder (Olsen,
2017); the inclusion of social media (Coco, 2018); and the affect environmental policies have on
organizational goodwill (Çetinkaya et al., 2016; Spiller, 2000). Triple bottom line has also
evolved since its inception. Concepts in TBL (Elkington, 1999) such as increased competitive
advantage (Hussain et al., 2018; Tate & Bals, 2018); reduction of pollution and the reduction of
child labor increasing organizational goodwill (Arko-Achemfuor, & Dzansi, 2015); and societies
increasing demand that organizations utilize sustainable practices (Arko-Achemfuor & Dzansi,
2015; Hourneaux Jr. et al., 2018) have all advanced this framework. Other areas such as
government influence as a stakeholder and the effect that a corporate CSR policy has on
profitability as it relates to each sector of the S&P 500 remain lightly examined.
This study built on previous studies produced by Lim (2017); Stanley (2011) and
Villarón-Peramato et al. (2018). The research focused on explaining how corporations that
emphasize a CSR policy compare financially to those who do not have a specific CSR mission
when accounting for debt. The specific problem is a lack of understanding of the financial impact
of debt on a CSR participating and non-CSR participating U.S. based companies listed
throughout all sectors of the S&P 500 index. This study provided additional financial
performance information to managers on the effects of their CSR polices within each industry

64
sector. Information gleaned from this study helped to advance and expand the knowledge that
forms CSR, ST (Freeman, 1984) and TBL (Elkington, 1999).
65
Chapter 3: Research Method
This study utilized a quantitative multiple regression-based approach to examine what
relationship existed between an organization’s corporate social responsibility policy (CSR) and
its financial performance. The research assessed the strength of any correlation linking the
concepts of ST (Freeman, 1984) with a corporation’s financial performance. The idea of CSR
has gained traction throughout the past decades (Blomgren, 2011; Goering, 2014). Businesses
investing in a CSR policy have better positioned themselves to take advantage of stakeholders’
increasing demands for those initiatives (Blomgren, 2011; Goering, 2014).
To examine this concept, this study built on previous works by Lim (2017) and Stanley
(2011). An updated and expanded firm selection criteria was used to further those previous
studies. The relationship between CSR and multiple dependent variables was examined. Each
criterion was selected as it provided a view into the financial health of a company both long and
short term. Previous studies (Lim, 2017; Stanley, 2011) made assumptions that return on assets
(ROA) would be sufficient in determining a company’s financial performance. Adding debt to
equity (D/E) and net profit margin (NPM) provided an increased breadth of financial data.
Comparison of each S&P sector expanded the study and helped to determine the relationship
between a CSR policy and the financial impact on any of the eleven S&P 500 sectors. This
chapter was used to discuss the research methodology and how it is incorporated into the design
of this study.
Research Design and Rationale
This study examined CSR and a firm’s financial performance based on the 2018 calendar
year. Data were collected from a sampling of all 500 firms found in the 2018 S&P 500 database.
Based on the research question proposed in this study, a postpositivist methodological

66
quantitative approach was utilized. Several multiple regression analyses were used to examine
the relationship between the independent and dependent variables. Four categories were used and
made up the independent variables (a) community, (b) employee, (c) environment, (d) and
governance. Each category was examined and used to determine companies’ CSR score based on
CSRHub’s ESG ratings. Three dependent variables were represented: Short- and long-term profit
and debt to equity. The three categories that made up these terms were: Debt to equity ratio
(D/E) which focused on debt and debt financing; Net profit margin (NPM) which examined
profit and profit on sales or short-term profit; Return on assets (ROA) which examined gross
margin and will be utilized to determine an organization's finical effectiveness or long-term
profit (Bramble, 2016).
Measurement of companies’ CSR initiatives were made by calculating each independent
variable category (a) community, (b) employee, (c) environment, (d) and governance. Debt to
equity, NPM, and ROA formed the dependent variables. Each dependent variable was analyzed
in conjunction with the aggregated independent variables to determine the extent of any
relationship. All results were then clustered into each of the eleven S&P 500 sectors (a) energy,
(b) materials, (c) industrials, (d) consumer discretionary, (e) consumer staples, (f) healthcare, (g)
financials, (h) information technology, (i) telecommunication services, (j) utilities, and (k) real
estate for overall comparison using descriptive statistics (Table A1 – A11). Control for this study
focused on the common variables recognized in earlier research (a) debts, (b) firm size, and (c)
industry (Chang, Kim, & Li, 2014; Lim, 2017). Controlling for these common variables
reinforced the association between CSR, an organization's financial performance, and
strengthens the internal validity of the study.
67
Unlike previous studies which reduced industry effects by listing industry categories, this
research provided a more comprehensive analysis by increasing the number of dependent
variables to include P/E, NPM, and ROA and placing these results within contingency tables
(Table A1 – A11). By taking these actions, a more concise analysis was provided. Displaying
industry in a contingency table allowed for each section to be viewed independently to determine
if any sector had a greater impact on the analysis results. Lash, Fox, Cooney, Lu, and Forshee
(2016) found that regular research bias can arise and cause errors when not correctly measured.
Lash et al. (2016) conferred how it is critical for a researcher to develop a consistent analytic
method to precisely quantify all measurements.
Firm size was based on all 500 firms found on the S&P 500 index. This number was
reduced to 262 firms after completing sampling using the G* Power tool developed by Faul,
Erdfelder, Buchner, and Lang (2009) and published by the Heinrich Heine University of
Düsseldorf (Table 5). Firm selection was controlled by utilizing methods adopted in previous
studies (Chang et al., 2014; Lim, 2017). Starting with 500 organizations listed in the S&P 500
allowed for examination of comparative size firms and allowed for a more extensive sampling
then those previous studies. All firms examined were considered mega cap with a market value
over 200 billion dollars, or large-cap stocks with a market value between 10 to 199 billion
dollars (Collver, 2014). Having a large sample size will alleviate firm effect and eliminates the
need to control for this variable.
To control for financial performance, three dependent variables were applied. D/E, NPM,
and ROA assisted in measuring any relationship between CSR and the debt and profitability of a
company. By utilizing all three of these measures (D/E, NPM, and ROA), the research provided
increased measurable information that can now be used by businesses to make a more informed

68
decision on whether to implement a CSR policy. This type of control differs from previous
research (Chang et al., 2014; Lim, 2017) as others have focused solely on ROA. Adding both
D/E and NPM helped separate return on assets at multiple levels. This study has adopted
multiple regression analysis to expand on previous research (Lim, 2017; Stanley, 2011) focusing
on the relationship between CSR and a firm’s financial performance.
Methodology
Many aspects of CSR have been extensively studied (Galant & Cadez, 2017). Results of
these studies have proven non-conclusive (Galant & Cadez, 2017). Organizational short- and
long-term profit in conjunction with debt to equity has represented one area of a CSR based
policy that has been under-researched. Debt to equity levels and its relation to organizational
profits in both the current, long, and short-term was found to only represent a fraction of the CSR
based studies. Of these studies, some (La Rosa et al., 2018; Limkriangkrai et al., 2017) have
focused on regions outside of the United States. Only a relatively few (Branzei et al., 2018; Hsu
& Liu, 2017; Moussu & Ohana, 2016) have focused on U.S. based companies. The emphasis of
these studies primarily focused on quantitative easing, interest, and bond rate changes. An
additional study of debt to equity, and its effect on short- and long-term organizational profits
within a CSR based policy, could provide more data and help clarify the inconclusive results of
CSR relationship to corporate profits.
One recommendation that has been suggested by previous researchers is the need for
consistency and standardization within measurement standards. (Greenwood, 2007). Many
previous studies (Lim, 2017; Limkriangkrai et al., 2017; Stanley, 2011) employed indexes to
measure CSR implementation within an organization. Indexes provide the researcher with the
availability and comparability of standardized information. Indexes will help in supporting the

69
idea of utilizing a standardization of measurement when rating organizational CSR. To overcome
one the most common deficiency for indexes, market size, the U.S. S&P 500 index was used.
CSRHub was chosen for CSR ratings because of their history and reputation to finical data
excellence (ESG, 2019).
CSRHub represents one of the most extensive rating organizations, with data on over
17,000 companies from 143 countries. Their mission focus is to grow, catalog, and make
assessable data that focuses on CSR and sustainability (About CSRHub, 2019). The data used by
CSRHub to generate their ratings come from 618 data sources that focus on socially responsible
investing research. These sources include well-known publications, indexes, non-government
organizations, and government agencies (About CSRHub, 2019). CSRHub has amassed and
standardized the information from these sources. These efforts have resulted in a comprehensive
standardized rating system that allows the user to search the data and trace the information back
to its source (About CSRHub, 2019).
As a certified B corporation (B Corp.), CSRHub has a goal of sustainability and
transparency of organizational and CSR based information. CSRHub utilizes its resources to
explain both social and environmental issues (About CSRHub, 2019). To obtain and maintain a
B Corp. designation, an organization must continually display social and environmental
standards through transparent performance and consideration for all stakeholders’ interests
(About CSRHub, 2019). CSRHub management team found that as a company focusing on CSR,
it was in their best interest to be as transparent as possible. B Corp. requires a discloser of all
information related to an organization’s social, financial, and environmental information.
Providing this data allows for data sharing and continual improvement of organizations reporting
and goals (About CSRHub, 2019). CSRHub’s dedication to social change through practice and
70
examination of CSR activity throughout organizations worldwide acts as a mechanism to ensure
firms are performing CSR activities on the same level they are reporting. CSRHub is recognized
by Global Reporting Initiative, Carbon Discloser Project, The Alliance of Trustworthy Business
Experts, Global Initiative for Sustainable Ratings, and International Integrated Reporting
Committee as a leader within CSR based reporting (About CSRHub, 2019).
Social responsibility reporting has risen to the forefront, with approximately 70 percent
of Fortune 1000 companies discussing their programs on their website (About CSRHub, 2019).
Of the 70 percent of Fortune 1000 businesses that report their CSR policies, approximately 27
percent quantify their data. A review of both small and mid-cap stocks has shown lower
participation rates (CSRHub, 2019). Many groups are looking to quantify this organizational
data. Environment, social and governance (ESG), socially responsible investment (SRI) firms,
government agencies, and activist groups, amongst others, all try to quantitate data for their
purposes. The information provided by these groups can be expensive, difficult to access, and
limited in nature. Evaluating information from each of these separate entities can prove difficult
with a shared framework (About CSRHub, 2019). CSRHub was selected for this study based on
their proprietary system of assimilating and standardizing 186 million data sets from over 618
data sources (About CSRHub, 2019). Included within the CSRHub’s rates are leading SRI and
ESG organizations such as Institutional Shareholder Services, MSCI, Trucost, and Vigeo EIRIS
(About CSRHub, 2019).
CSRHub had to overcome many barriers to better position itself to provide a reliable
rating methodology. The first barrier to forming a consistent rating scale was to standardize
different rating agencies reporting measures. The second barrier to overcome is that each rating
organization may use a different rating scale. The third obstacle was that each rating organization
71
focused on a different group, index, or sector of ESG businesses. Four was that many rating
agencies only provided rating updates once a year, causing data to be delayed and often outdated.
The last barrier was the discrepancy as to which part of a business to rate. Some rating agencies
reported on subsidiaries or products, while others focused on the parent company (About
CSRHub, 2019).
CSRHub has developed its proprietary ratings methodology to ensure consistency with
CSR ratings and overcome the rating barriers. The rating methodology used helped to reduce
rating inconsistencies and bias. CSR was split into four primary categories and twelve
subcategories. Each rating category form outside rating agencies is funneled into one of these
categories to maintain consistency. A defined numeric scale from 0 to 100 was used for the
rating conversions. By examining each rating companies’ variations within their ratings, a
pattern of biases can be developed. Once a pattern can be established, the rating is converted into
CSRHub’s 0 to 100 scale. Rating agencies’ results allow for the data to become normalized by
repeating this process. Each data set is weighted based on the value and credibility of the
information. This information is then aggregated into CSRHub’s rating system. Businesses that
do not provide enough information are dropped form CSRHub’s ratings. This action is to ensure
the integrity and validity of all graded data. Each rated company is segregated based on industry
and loosely matched the NAICS system (About CSRHub, 2019).
A quantitative approach was adopted utilizing multiple regression analysis. Three
multiple regression models were used as there was more than one dependent variable. Having
three dependent variables along with the multiple independent variables allowed the researcher
to examine the effect of each together to determine a result (“Introduction”, 2013; Wang,
Zhongtian, Bo, & Chengbo, 2018). Financial performance was defined and analyzed using three
72
measures: debt and debt financing, short-term profit and long-term profit. The end of year data
for 2018 was utilized for analysis. The data consisted of accounting-based measures and was
gathered using both the S&P 500 and organizational 10k reports. Debt and debt financing
focused on a firm’s leverage and its ability to maintain its current level of product and corporate
policies. Debt to equity ratio (D/E) is a measure of how much debt has been used to finance a
business’s operations and was used to measure a company’s leverage. Both short-term and long-
term profits were examined. Short-term profit was defined as how much profit is made off all
revenue for a given year, or one year or less. Net profit margin (NPM) was used to calculate how
much profit is made within a specific year. Long term profit is defined as a measure that may
affect profits over one year in time and was measured by return on assets (ROA). ROA examines
at how efficient a company is at applying organizational assets to generate future earnings.
The independent variable consisted of the social responsibility rating provided by
CSRHub ESG rating system. This system utilizes three pillars that focus on environment, social,
and governance. Each pillar is further broken down into themes and critical issues (ESG, 2019).
Four primary variables were derived from ESG’s three pillars. CSRHub’s ESG index rating
system consists of four primary categories (a) community, (b) employee, (c) environment, (d)
and governance (ESG, 2019). These key criteria are a combination of propriety data and an
aggregate rating score complied by CSRHub utilizing the top ESG rating agencies. The
independent variables were obtained from CSRHub ESG index. CSRHub provides data gathered
from over 605 sources across 134 industries. CSRHub is a leader in environment, social, and
governance (ESG) reporting. CSRHub utilizes a plethora of qualified ratings organizations to
assimilate data into one cohesive measure. Rating organizations such as the Dow Jones
Sustainability Indexes, Ideal Ratings, ISS, MSCI, TRUCost, and Vegio Eiris data is aggregated
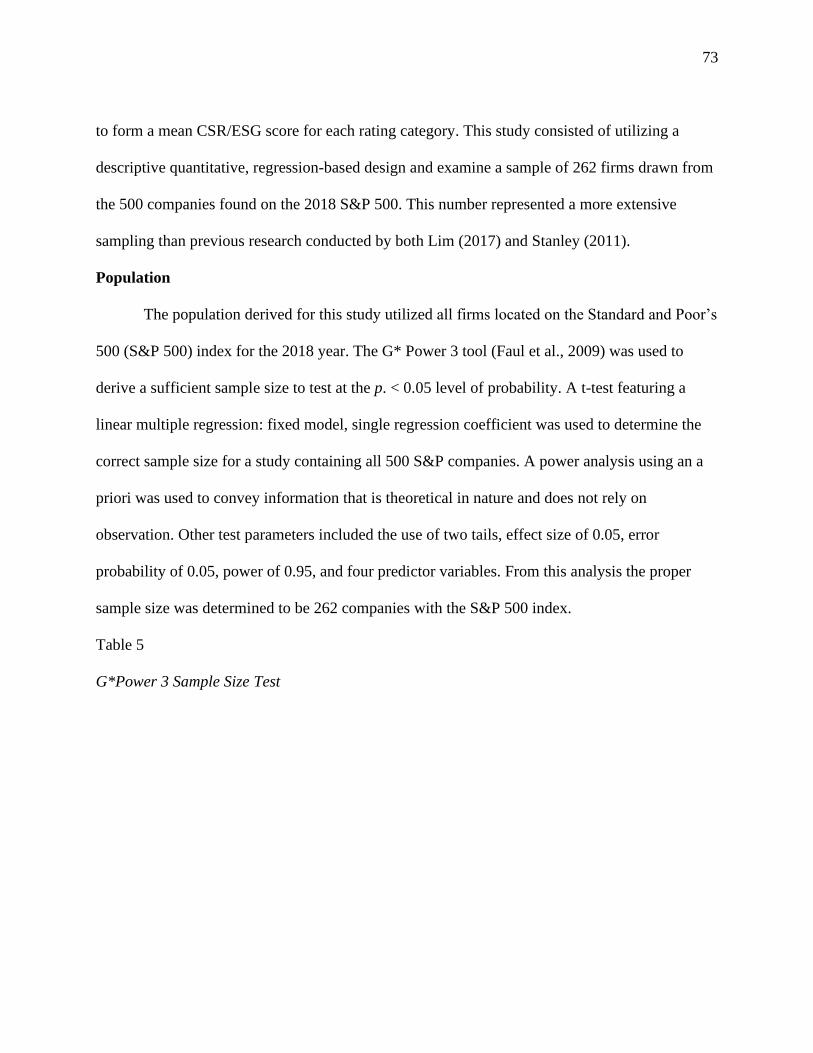
73
to form a mean CSR/ESG score for each rating category. This study consisted of utilizing a
descriptive quantitative, regression-based design and examine a sample of 262 firms drawn from
the 500 companies found on the 2018 S&P 500. This number represented a more extensive
sampling than previous research conducted by both Lim (2017) and Stanley (2011).
Population
The population derived for this study utilized all firms located on the Standard and Poor’s
500 (S&P 500) index for the 2018 year. The G* Power 3 tool (Faul et al., 2009) was used to
derive a sufficient sample size to test at the p. < 0.05 level of probability. A t-test featuring a
linear multiple regression: fixed model, single regression coefficient was used to determine the
correct sample size for a study containing all 500 S&P companies. A power analysis using an a
priori was used to convey information that is theoretical in nature and does not rely on
observation. Other test parameters included the use of two tails, effect size of 0.05, error
probability of 0.05, power of 0.95, and four predictor variables. From this analysis the proper
sample size was determined to be 262 companies with the S&P 500 index.
Table 5
G*Power 3 Sample Size Test
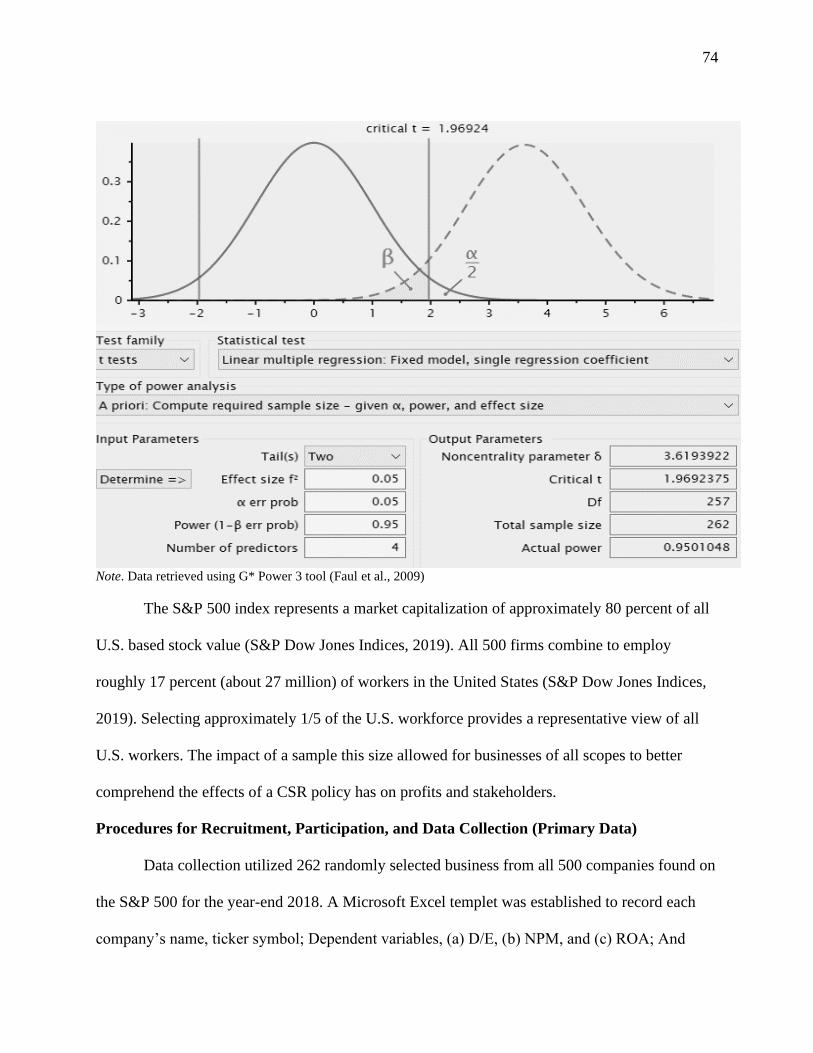
74
Note. Data retrieved using G* Power 3 tool (Faul et al., 2009)
The S&P 500 index represents a market capitalization of approximately 80 percent of all
U.S. based stock value (S&P Dow Jones Indices, 2019). All 500 firms combine to employ
roughly 17 percent (about 27 million) of workers in the United States (S&P Dow Jones Indices,
2019). Selecting approximately 1/5 of the U.S. workforce provides a representative view of all
U.S. workers. The impact of a sample this size allowed for businesses of all scopes to better
comprehend the effects of a CSR policy has on profits and stakeholders.
Procedures for Recruitment, Participation, and Data Collection (Primary Data)
Data collection utilized 262 randomly selected business from all 500 companies found on
the S&P 500 for the year-end 2018. A Microsoft Excel templet was established to record each
company’s name, ticker symbol; Dependent variables, (a) D/E, (b) NPM, and (c) ROA; And
75
independent variables, (a) community, (b) employee, (c) environment, (d) and governance, to
gain the financial information needed to produce the dependent variables. The United States
Securities and Exchange Commission’s EDGAR database was utilized to provide each
company’s 2018 10k financial report (EDGAR, 2019). Independent variables were retrieved
using the CSRHub ESG index for the 2018 year. CSRHub’s index information was recorded
directly from the company. The index information is proprietary and requires a fee for access.
CSRHub’s ESG index is available to both financial profession and college students for research
purposes. Data collection commenced after Walden University’s institutional review board
approval was obtained.
Instrumentation and Operationalization of Constructs
Developers and year of publication. CSRHub provides research-based indexes that
are used by investment managers and researchers to better position clients and examine
organizational risk and performance (ESG, 2019). CSRHub ESG index was used to analyze CSR
within each of the 2018 S&P 500 companies. Four categories (a) community, (b) employee, (c)
environment, (d) and governance, were gleaned based on the index ratings. CSRHub’s ESG
index information is available for researchers and was provided for a fee. CSRHub is a private
company that produces independent proprietary research, along with aggregate industry CSR
ratings.
S&P 500 companies financials for the 2018 year-end 10k reports was found using the
U.S. Securities and Exchange Commission’s EDGAR database. This information is mandatory
for all publicly traded companies and produced by each firm. The information is then housed on
the EDGAR database and is open for public review (EDGAR, 2019).
76
Appropriateness to the current study. A quantitative approach was chosen as an
appropriate method for this study as it asks a “what” question. The quantitative method looks at
the what of a study, while qualitative approach asks why (Barnham, 2015). Because this study
focused on the, what is the relationship, versus, why the relationship exists, a quantitative
method was considered more appropriate. The quantitative approach was framed by stakeholder
theory (Freeman, 1984). Stakeholder theory (Freeman, 1984) suggested that firms focus on more
than profits to increase long term organizational results (Freeman, 1984; Jones et al., 2018).
Concentrating on social and environmental concerns may increase stakeholder goodwill and
long-term performance (Freeman, 1984; Jones et al., 2018).
Bias for development: Plan to provide evidence for reliability and validity. Many
factors contributed to the development of this study. One main factor was based on El Akremi et
al.’s (2018) assertion that certain stakeholder perceptions were not adequately developed because
of the lack of uniformed CSR measurement standards. Taking this declaration into account, this
study has chosen to follow the CSR measurement standard put forth by CSRHub and used in
previous CSR based studies (Anderson, 2019; Kruse, 2019; Barney, 2018; Lim, 2017; Stanley,
2011). CSRHub provides data gathered from over 605 sources across 134 industries (ESG,
2019). These indicators are used by CSRHub to construct the four categories used in this study
as independent variables (a) community, (b) employee, (c) environment, (d) and governance
These four categories incorporate the same rating information type used in Lim
(2017) and Stanley (2011) and provide a consistent measure throughout the evolution of this
topic. An emphasis on the S&P 500 index sectors also played a critical role in this study. The
S&P 500 is made up of eleven categories consumer discretionary, (b) consumer staples, (c)
energy, (d) financials, (e) healthcare, (f) industrials, (g) information technology, (h) materials, (i)
77
telecommunications services, (j) utilities and (k) real estate. Each sector was analyzed to
determine if there was any strength between sector and a firms CSR inspired financial
performance. Examining the independent variables against the three dependent variables of (a)
D/E, (b) NPM, and (c) ROA helped eliminate any assumption of all debt being included ROA.
Adding D/E and NPM expanded the analysis and reinforce all results.
Data Analysis Plan
The data gathered in this study was analyzed using utilize Statistical Package for the
Social Science (SPSS) software. The SPSS program is a standard calculation tool used for
quantitative analysis in both institutional and commercial settings. SPSS is designed to assist the
investigator in analyzing large data sets with multiple data points. A review of 262 randomly
selected samples from all firms found on the S&P 500 allowed for proper screening and
reduction of any research bias caused by preexisting assumptions.
This new research utilized a descriptive type of data analysis that allowed for large
amounts of data to be examined together while providing an interpretation to a multivariate
analysis. SPSS software allowed for a data driven multiple regression analysis of each dependent
and independent variable. SPSS uses the imputed data to compute the best relationship between
IP and DP variables (Gallo, Davenport, & Kim, 2017). Regression analysis permits the filtering
of data and helped to determine at which level the variables affect the topic of study while
determining the probability of an event. Regression analysis provided the data needed to
understand the impact of multiple independent variables. The more variables that are included in
a study will help in reducing the margin of error for that study (Gallo et al., 2017).
To ensure all relevant data were recorded, this study developed a Microsoft Excel sheet
that labeled each company along with each dependent and independent variable. This allowed for
78
creation of a searchable database of information that was imported into a data codebook for use
within the SPSS software. The data codebook included names of all criteria found within both
the dependent and independent variables. Creating a codebook ensured the proper tracking of all
variable modification as well as monitoring of all data cleansing. This study was guided by the
following research questions (RQs) and hypotheses:
RQ1: What is the relationship between corporate social responsibility and return on assets for
companies listed in the S&P 500 for the year 2018.
H10: There is no statistically significant relationship between corporate social
responsibility and return on assets for companies listed in the S&P 500 for the year 2018.
H1A: There is a statistically significant relationship between corporate social
responsibility and return on assets for companies listed in the S&P 500 for the year 2018.
RQ2: What is the relationship between corporate social responsibility and debt-versus-equity for
companies listed in the S&P 500 for the year 2018.
H20: There is no statistically significant relationship between corporate social
responsibility and debt-versus-equity in companies listed in the S&P 500 for the year
2018.
H2A: There is a statistically significant relationship between corporate social
responsibility and debt-versus-equity in companies listed in the S&P 500 for the year
2018.
RQ3: What is the relationship between corporate social responsibility and net profit margin in
companies listed in the S&P 500 for the year 2018.
H30: There is no statistically significant relationship between corporate social
responsibility and net profit margin in companies listed in the S&P 500 for the year 2018.
79
H3A: There is a statistically significant relationship between corporate social
responsibility and net profit margin in companies listed in the S&P 500 for the year 2018.
Threats to Validity
External Validity
Research that was conducted for this study utilized a large dataset that is representative of
approximately 80% of all U.S. economic market capitalization (S&P Dow Jones Indices, 2019;
United States, 2019). With nearly 80% of U.S. market capitalization accounted for, the results of
this study could be interpreted for the whole of the U.S. firms. An emphasis on ST (Freeman,
1984) and CSR holds large organizations accountable beyond financial performance while
balancing benefits for every stakeholder (Freeman, 1984; Harness, Ranaweera, Karjaluoto, &
Jayawardhena, 2018). This contributes to the creditability of this study.
Internal Validity
CSRHub has taken detailed steps to ensure reliability, its data inputs are aggregated from
other rating agencies. The only way to ensure complete reliability would be to develop a
proprietary rating scale and examine each organization’s CSR initiatives individually before
providing classification and rating. With the production of a proprietary rating system time
prohibiting, CSRHub’s selection provided the best alternative for the most reliable information.
CSRHub data was gathered from over 605 sources across 134 industries. Their
information has been utilized by many recent CSR researchers such as Anderson, (2019); Barny,
(2018); Kruse, (2019); etc. Because CSRHub’s data set is utilized by both current and past
researchers, changing to this data set maintained continuity within research measurement for
further compatibility. CSRHub is a leader in environment, social, and governance (ESG)
reporting. CSRHub utilizes a plethora of qualified ratings organizations to assimilate data into
80
one cohesive measure. Rating organizations such as, Dow Jones Sustainability Indexes, Ideal
Ratings, ISS, MSCI, TRUCost, and Vegio Eiris data is aggregated to form a mean CSR/ESG
score for each rating category. CSRHub’s strong reputation and credible data throughout the
finance industry reduced the threat to internal validity in this study.
Construct Validity
Construction validity was improved by the collection and investigating of any data
related to each of the four independent variables: of four primary categories: (a) community, (b)
employee, (c) environment, (d) and governance, calculated by CSRHub ESG index. CSRHub’s
indexes have been analyzed for credibility by previous researchers (Anderson, 2019; Kruse,
2019; Barny, 2018) and found reliable for use in measuring CSR. CSRHub was selected for this
study based on their proprietary system of assimilating and standardizing 186 million data sets
from over 618 data sources (About CSRHub, 2019). Included within the CSRHub’s ratings are
leading SRI and ESG organizations such as Institutional Shareholder Services, MSCI, Trucost,
and Vigeo EIRIS (About CSRHub, 2019). CSRHub positioned itself to provide a reliable rating
methodology. A five-step approach was utilized to ensure validity: (a) Developed proprietary
rating scale; (b) Standardized ratings scale from multiple rating agencies so they would be
compatible with CSRHub proprietary scale; (c) Standardized ESG rating by creating four
primary categories and twelve subcategories; (d) Provides continually updated data; (e)
Incorporated all subsidiaries into their parent companies when rating (About CSRHub, 2019).
Unlike previous researchers (Lim, 2017; Stanley, 2011), ROA was not the only measure
used to measure a firm’s financial performance. ROA is a proven metric that allows for an
examination of a firm’s long-term profitability. Additional financial measures were used to
examine short term profitability. Net profit margin allowed for an investigation of short-term
81
profits, while D/E assisted in determining if there was an increased debt load that may be
associated with a CSR policy. Together, ROA, NPM, and D/E provided an increased glimpse
into debt load, short-term and long-term profitability that was associated with a CSR policy. This
multi-dimensional approach focused on the relationship between a firm’s CSR policy and
financial resulted in forwarding the theoretical framework of ST (Freeman, 1984) and TBL
(Elkington, 1999).
Ethical Procedures
Ethical issues related to this study were limited to non-existent. All data that were used
for research purposes is available institutional data found from both publicly available and
proprietary databases. Both the SEC EDGAR database (10k reports), and CSRHub (CSR rating
information) are sustained by public government enterprise and a sound research firm
respectively. No human subjects were needed for this study, reducing any ethical issues that arise
from human research subjects.
Summary
The focus of this chapter was to review and adapt the research approach and
methodology. A quantitative multiple regression-based approach was chosen based on the type
and number of both dependent and independent variables. The purpose of this study was to
conduct an expanded study on whether any correlation existed between and CSR and an
organization’s financial performance. For this study, D/E, NPM, and ROA data from all 2018
S&P 500 firms was collected and used to populate the dependent variables. CSRHub ESG index
from the year ending 2018 formed the basis of the independent variables. Four primary
categories were examined to determine CSR rating: (a) community, (b) employee, (c)
environment, (d) and governance. SPSS software was utilized to investigate the average total

82
CSR score for each S&P 500 firm. Each hypothesis was evaluated using multiple regression to
determine the strength of any correlation and whether any S&P 500 sector is affected greater
than another. Data gathering and analysis took place in chapter 4 and commenced once IBR
approval was given.
83
Chapter 4: Results
The purpose of this quantitative multiple regression-based study was to examine what
relationship existed between an organization’s corporate social responsibility policy (CSR) and
its financial performance. Financial performance was measured using, debt to equity ratio (D/E),
net profit margin (NPM), and return on assets (ROA). These three measures were selected to
provide a more encompassing perspective on an organization’s finances. D/E, NPM, and ROA
provide firm’s debt and debt financing levels, short-term, and long-term profitability (Breece,
2017; Gallo, 2017c; Gallo, 2015b). CSR was measured using four primary categories, a)
community, (b) employee, (c) environment, (d) and governance. These four measures cover each
of the three ESG categories of (E) environmental and employee related issues, (S) social
concerns, and (G) corporate governance (ESG, 2019).
Three research questions were proposed with accompanying hypotheses.
RQ1: What is the relationship between corporate social responsibility and return on assets for
companies listed in the S&P 500 for the year 2018.
RQ2: What is the relationship between corporate social responsibility and debt-versus-equity for
companies listed in the S&P 500 for the year 2018.
RQ3: What is the relationship between corporate social responsibility and net profit margin in
companies listed in the S&P 500 for the year 2018.
For each research question, a separate set of hypotheses and null hypothesis were presented
based on the dependent variables.
H0: There is no statistically significant relationship between corporate social
responsibility and the dependent variable (d/e, npm, roa) in companies listed in the S&P
500 for the year 2018.
84
HA: There is a statistically significant relationship between corporate social responsibility
and the dependent variable (d/e, npm, roa) in companies listed in the S&P 500 for the
year 2018.
Data Collection
Data collection for this study utilized Standard and Poor’s 500 company index for fiscal
year-end 2018. The dependent variables of debt to equity, return on assets, and net profit margin
were all calculated using each companies’ year-end 10k report. These reports were collected
using the Securities and Exchange Commission’s EDGAR database. Each company’s year-end
financial numbers were used to ensure measurement constancy. Dates for all S&P 500
companies’ fiscal year-end are listed within Table A14. DataHub was used as a secondary source
to confirm the accuracy of all independently gathered and calculated financial data. DataHub was
selected for data confirmation because of its reputation and reliability of data analytics.
DataHub’s CKAN platform powers primary data-focused government websites such as data.gov
and data.gov.uk (Kariv & Pollock, 2018). DataHub’s selected dates the represented each S&P
500 companies year end reporting date when providing their analysis. Each date is listed within
Table A14.
Debt to equity was used to determine and measure debt and debt-financing levels. The
formula used to determine each company’s debt to equity ratio (D/E): Debt / equity ratio = total
liabilities / shareholders’ equity. Net profit margin was utilized to calculate how much profit a
business made from each dollar of sales. Profit margin may provide insight into short term
profitability for a given year. The formula used to determine each company’s net profit margin
(NPM): Net profit margin = net profit / total revenues. Return on assets measures a business’s
profitability compared to its total assets. This measure allows for a longer-term view regarding
85
profits. The formula used to determine each company’s return on assets (ROA): ROA = net
income / total assets.
CSRHub’s ESG database provided the independent CSR variables. This study utilized the
four primary CSRHub groupings of (a) community, (b) employee, (c) environment, (d) and
governance. Each business was provided a score within the four categories based on CSRHub
composite rating scale. Each primary category was comprised of twelve secondary categories:
(a) community development and philanthropy, (b) product, (c) human rights and supply chain,
(d) compensation and benefits (e) diversity and labor rights, (f) training, health, and safety, (g)
energy and climate change (h) environmental policy and reporting, (i) resource management, (j)
board, (k) leadership ethics, (l) transparency and reporting (ESG, 2019). The primary category of
community is made up of the secondary categories, community development and philanthropy,
product, and human rights and supply chain; Employees consists of compensation and benefits,
diversity and labor rights, and training, health, and safety; Environment is represented by energy
and climate change, environmental policy and reporting, and resource management; Governance
consists of secondary categories, board, leadership ethics, and transparency and reporting (ESG,
2019).
From all 505 S&P 500 listed securities, 262 companies were selected for the study. This
sample size was determined using the G* Power tool (Faul et al., 2009). A t-test featuring a
multiple linear regression: fixed model, single regression coefficient was used to determine the
correct sample size for a study containing all 500 S&P companies. Results and a graph showing
this test are found in chapter 3, table 5.
Research Randomizer was selected to produce a random sampling of 262 companies
from the 500 companies (505 stocks) within the 2018 S&P 500 index (Urbaniak, & Plous, 2013).
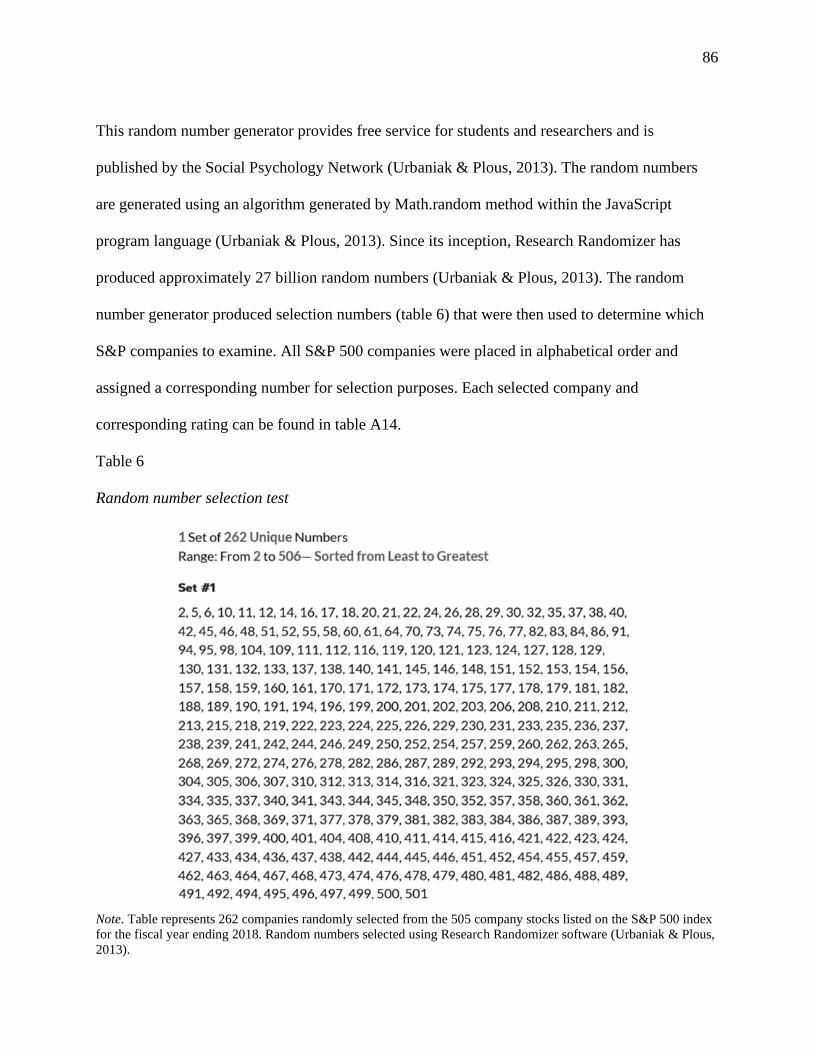
86
This random number generator provides free service for students and researchers and is
published by the Social Psychology Network (Urbaniak & Plous, 2013). The random numbers
are generated using an algorithm generated by Math.random method within the JavaScript
program language (Urbaniak & Plous, 2013). Since its inception, Research Randomizer has
produced approximately 27 billion random numbers (Urbaniak & Plous, 2013). The random
number generator produced selection numbers (table 6) that were then used to determine which
S&P companies to examine. All S&P 500 companies were placed in alphabetical order and
assigned a corresponding number for selection purposes. Each selected company and
corresponding rating can be found in table A14.
Table 6
Random number selection test
Note. Table represents 262 companies randomly selected from the 505 company stocks listed on the S&P 500 index
for the fiscal year ending 2018. Random numbers selected using Research Randomizer software (Urbaniak & Plous,
2013).
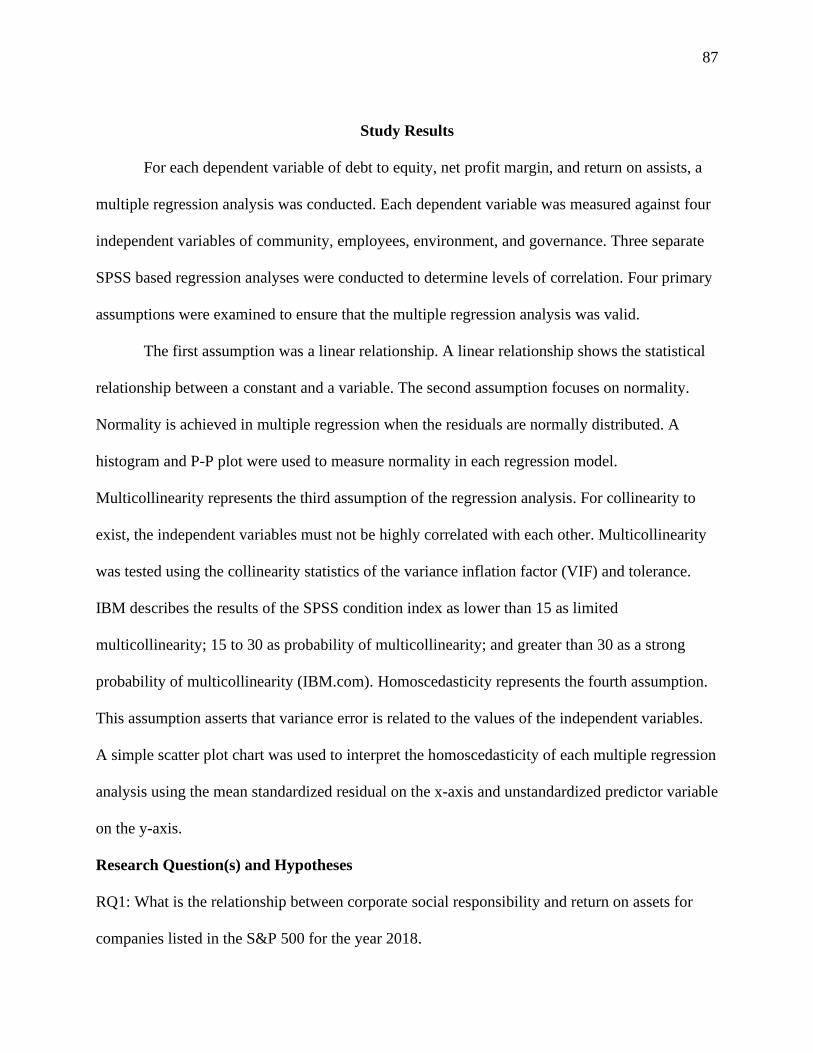
87
Study Results
For each dependent variable of debt to equity, net profit margin, and return on assists, a
multiple regression analysis was conducted. Each dependent variable was measured against four
independent variables of community, employees, environment, and governance. Three separate
SPSS based regression analyses were conducted to determine levels of correlation. Four primary
assumptions were examined to ensure that the multiple regression analysis was valid.
The first assumption was a linear relationship. A linear relationship shows the statistical
relationship between a constant and a variable. The second assumption focuses on normality.
Normality is achieved in multiple regression when the residuals are normally distributed. A
histogram and P-P plot were used to measure normality in each regression model.
Multicollinearity represents the third assumption of the regression analysis. For collinearity to
exist, the independent variables must not be highly correlated with each other. Multicollinearity
was tested using the collinearity statistics of the variance inflation factor (VIF) and tolerance.
IBM describes the results of the SPSS condition index as lower than 15 as limited
multicollinearity; 15 to 30 as probability of multicollinearity; and greater than 30 as a strong
probability of multicollinearity (IBM.com). Homoscedasticity represents the fourth assumption.
This assumption asserts that variance error is related to the values of the independent variables.
A simple scatter plot chart was used to interpret the homoscedasticity of each multiple regression
analysis using the mean standardized residual on the x-axis and unstandardized predictor variable
on the y-axis.
Research Question(s) and Hypotheses
RQ1: What is the relationship between corporate social responsibility and return on assets for
companies listed in the S&P 500 for the year 2018.
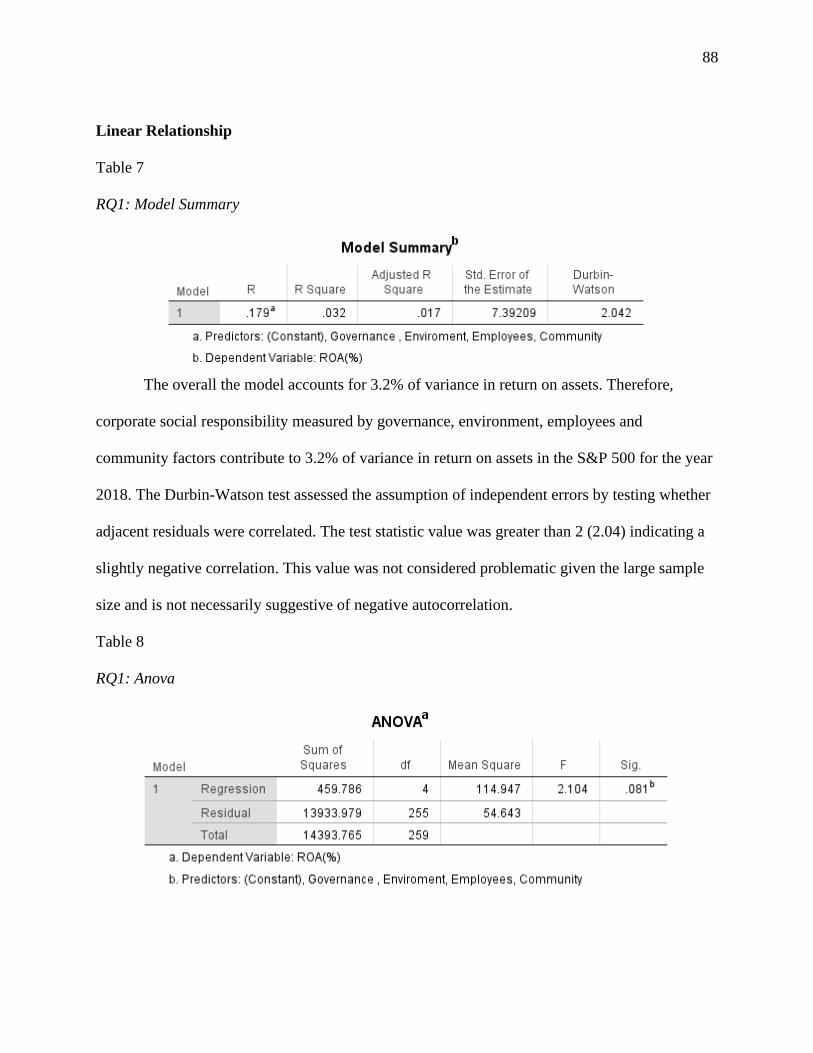
88
Linear Relationship
Table 7
RQ1: Model Summary
The overall the model accounts for 3.2% of variance in return on assets. Therefore,
corporate social responsibility measured by governance, environment, employees and
community factors contribute to 3.2% of variance in return on assets in the S&P 500 for the year
2018. The Durbin-Watson test assessed the assumption of independent errors by testing whether
adjacent residuals were correlated. The test statistic value was greater than 2 (2.04) indicating a
slightly negative correlation. This value was not considered problematic given the large sample
size and is not necessarily suggestive of negative autocorrelation.
Table 8
RQ1: Anova
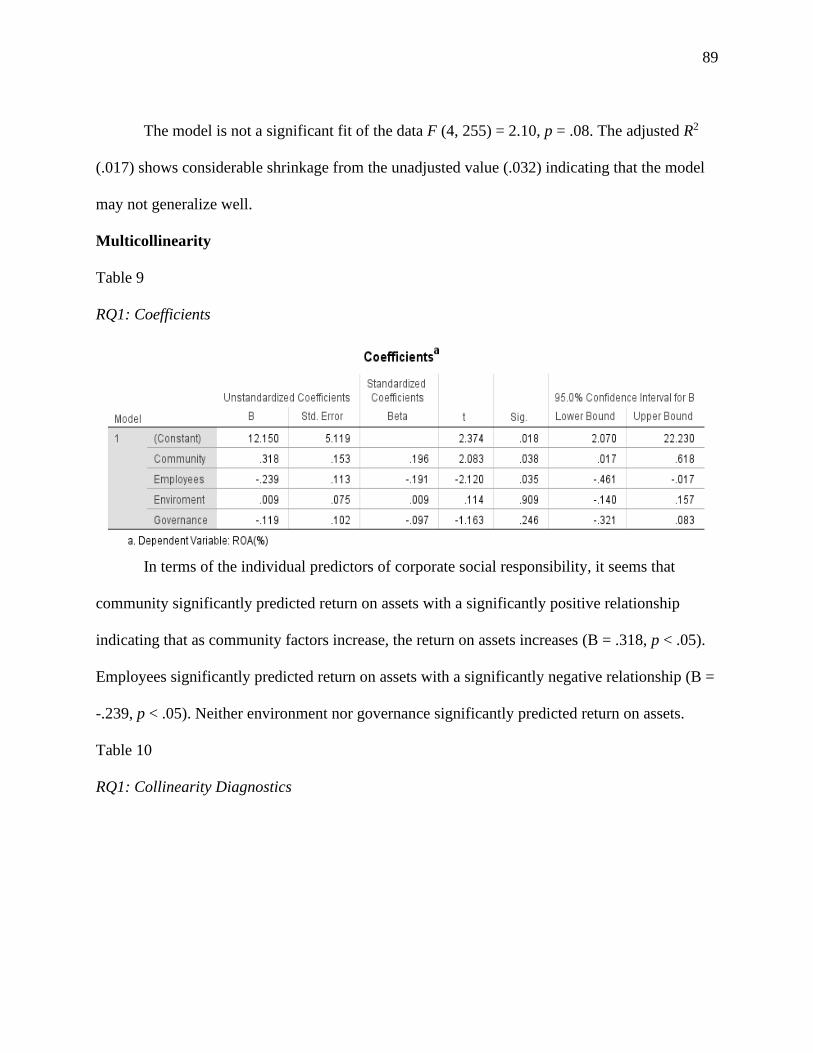
89
The model is not a significant fit of the data F (4, 255) = 2.10, p = .08. The adjusted R2
(.017) shows considerable shrinkage from the unadjusted value (.032) indicating that the model
may not generalize well.
Multicollinearity
Table 9
RQ1: Coefficients
In terms of the individual predictors of corporate social responsibility, it seems that
community significantly predicted return on assets with a significantly positive relationship
indicating that as community factors increase, the return on assets increases (B = .318, p < .05).
Employees significantly predicted return on assets with a significantly negative relationship (B =
-.239, p < .05). Neither environment nor governance significantly predicted return on assets.
Table 10
RQ1: Collinearity Diagnostics
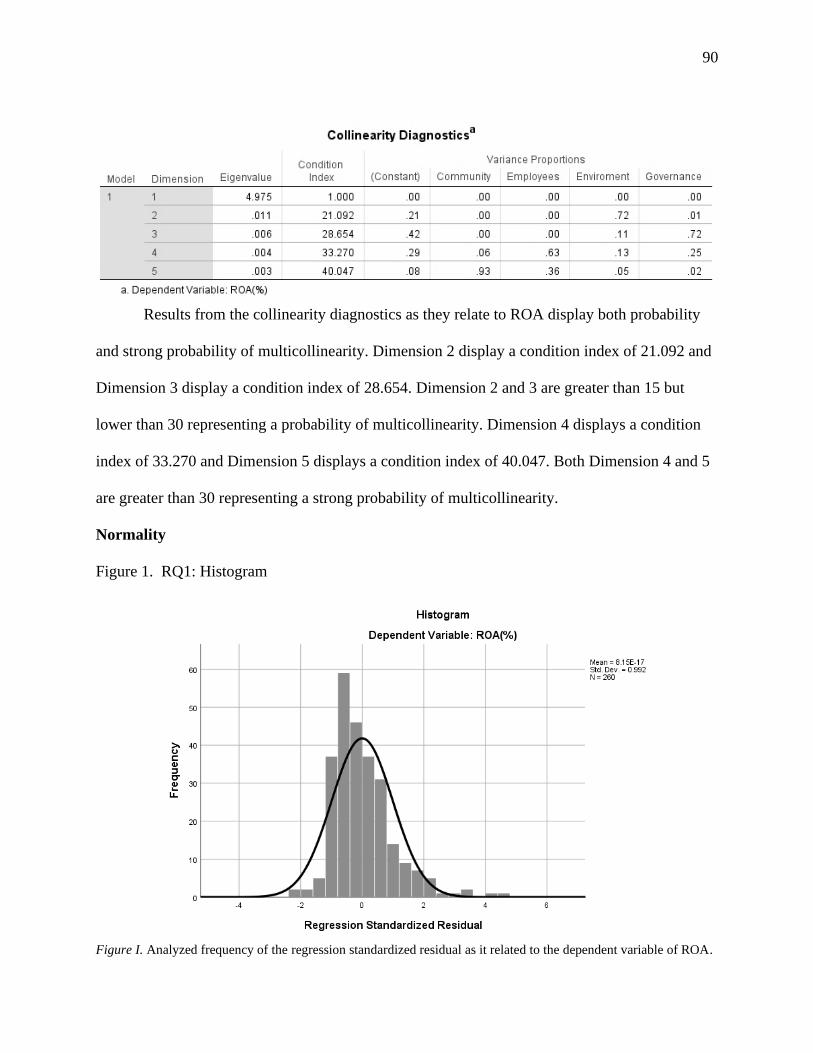
90
Results from the collinearity diagnostics as they relate to ROA display both probability
and strong probability of multicollinearity. Dimension 2 display a condition index of 21.092 and
Dimension 3 display a condition index of 28.654. Dimension 2 and 3 are greater than 15 but
lower than 30 representing a probability of multicollinearity. Dimension 4 displays a condition
index of 33.270 and Dimension 5 displays a condition index of 40.047. Both Dimension 4 and 5
are greater than 30 representing a strong probability of multicollinearity.
Normality
Figure 1. RQ1: Histogram
Figure I. Analyzed frequency of the regression standardized residual as it related to the dependent variable of ROA.
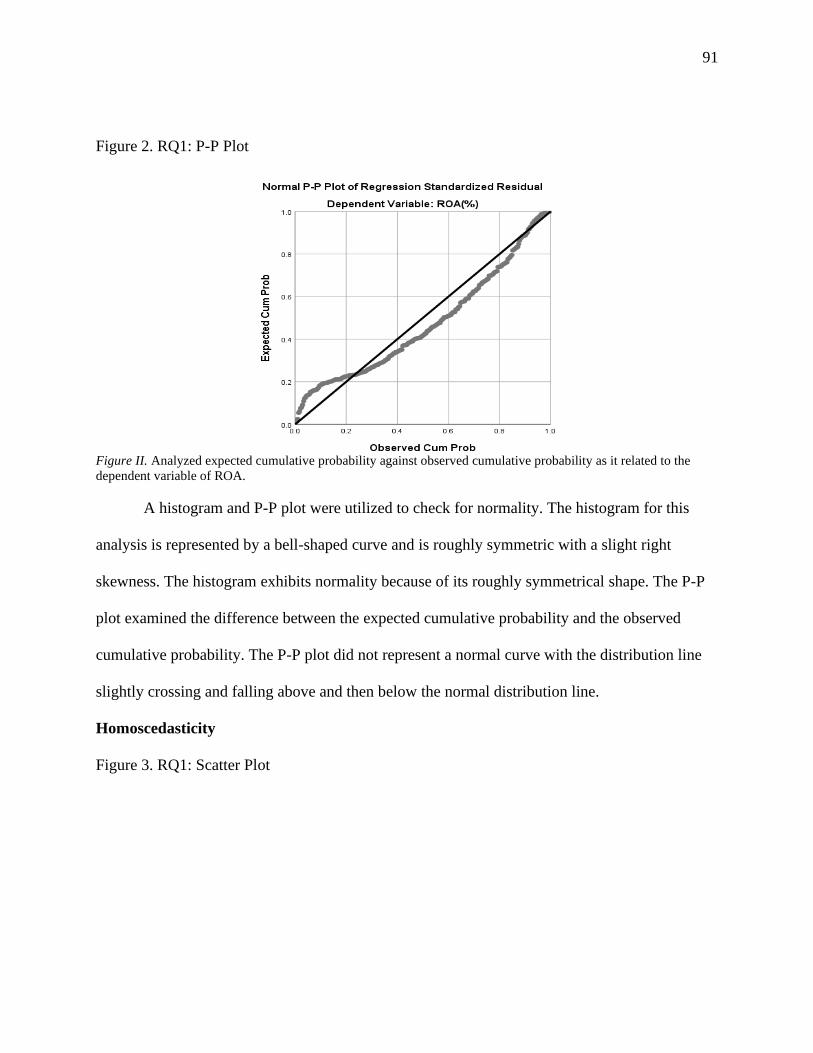
91
Figure 2. RQ1: P-P Plot
Figure II. Analyzed expected cumulative probability against observed cumulative probability as it related to the
dependent variable of ROA.
A histogram and P-P plot were utilized to check for normality. The histogram for this
analysis is represented by a bell-shaped curve and is roughly symmetric with a slight right
skewness. The histogram exhibits normality because of its roughly symmetrical shape. The P-P
plot examined the difference between the expected cumulative probability and the observed
cumulative probability. The P-P plot did not represent a normal curve with the distribution line
slightly crossing and falling above and then below the normal distribution line.
Homoscedasticity
Figure 3. RQ1: Scatter Plot
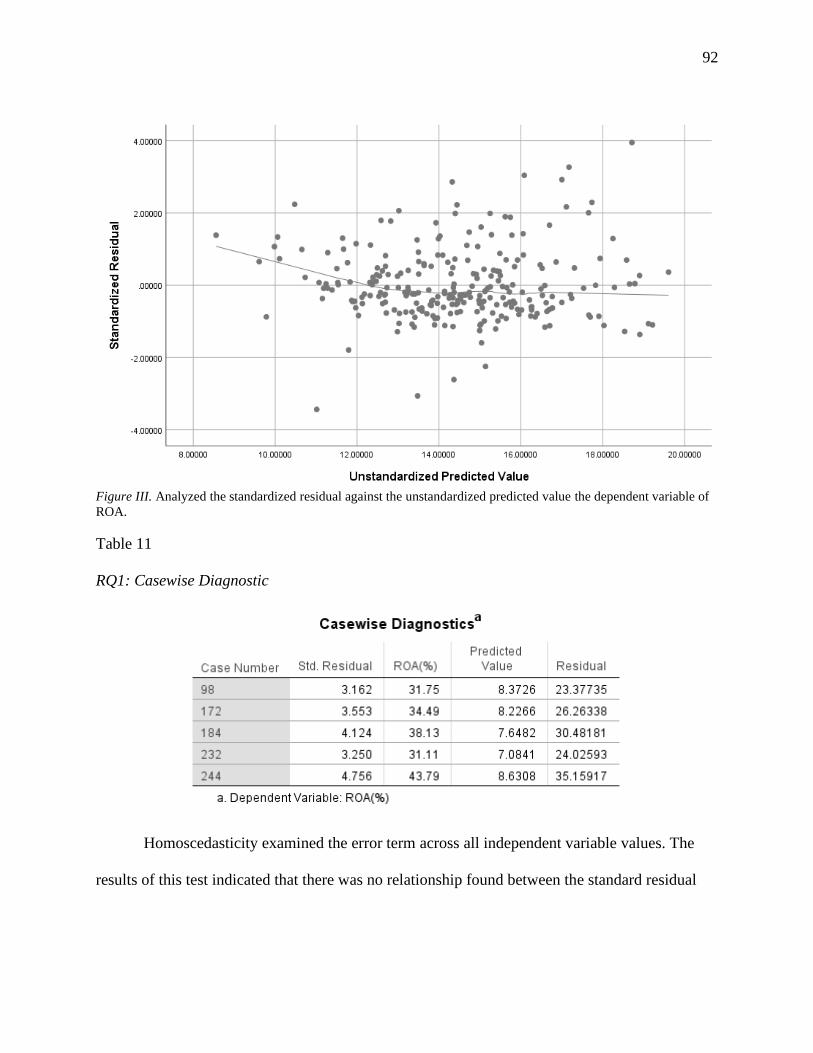
92
Figure III. Analyzed the standardized residual against the unstandardized predicted value the dependent variable of
ROA.
Table 11
RQ1: Casewise Diagnostic
Homoscedasticity examined the error term across all independent variable values. The
results of this test indicated that there was no relationship found between the standard residual
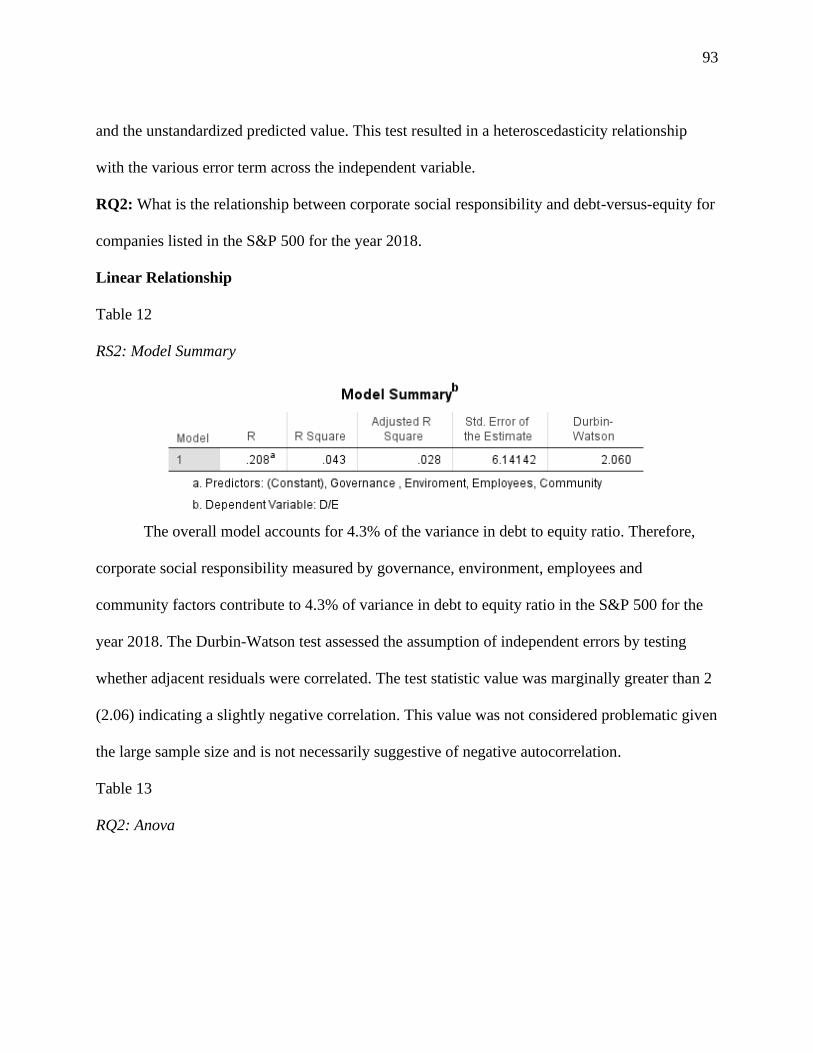
93
and the unstandardized predicted value. This test resulted in a heteroscedasticity relationship
with the various error term across the independent variable.
RQ2: What is the relationship between corporate social responsibility and debt-versus-equity for
companies listed in the S&P 500 for the year 2018.
Linear Relationship
Table 12
RS2: Model Summary
The overall model accounts for 4.3% of the variance in debt to equity ratio. Therefore,
corporate social responsibility measured by governance, environment, employees and
community factors contribute to 4.3% of variance in debt to equity ratio in the S&P 500 for the
year 2018. The Durbin-Watson test assessed the assumption of independent errors by testing
whether adjacent residuals were correlated. The test statistic value was marginally greater than 2
(2.06) indicating a slightly negative correlation. This value was not considered problematic given
the large sample size and is not necessarily suggestive of negative autocorrelation.
Table 13
RQ2: Anova
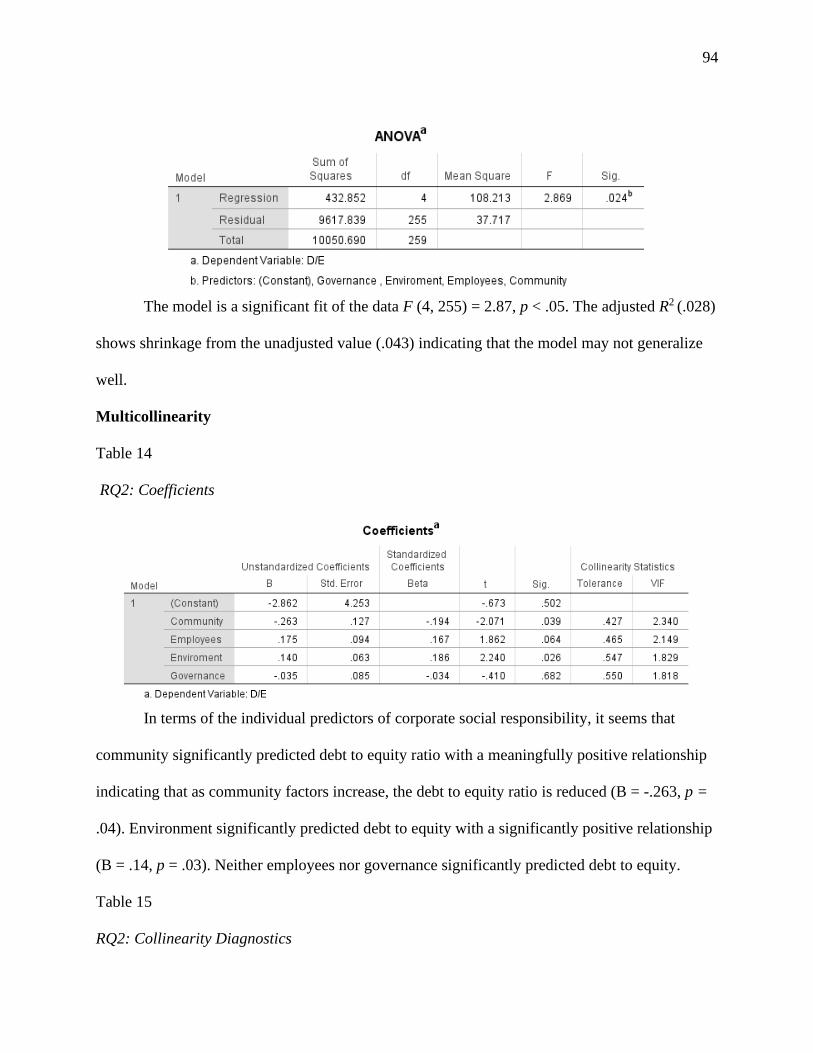
94
The model is a significant fit of the data F (4, 255) = 2.87, p < .05. The adjusted R2 (.028)
shows shrinkage from the unadjusted value (.043) indicating that the model may not generalize
well.
Multicollinearity
Table 14
RQ2: Coefficients
In terms of the individual predictors of corporate social responsibility, it seems that
community significantly predicted debt to equity ratio with a meaningfully positive relationship
indicating that as community factors increase, the debt to equity ratio is reduced (B = -.263, p =
.04). Environment significantly predicted debt to equity with a significantly positive relationship
(B = .14, p = .03). Neither employees nor governance significantly predicted debt to equity.
Table 15
RQ2: Collinearity Diagnostics
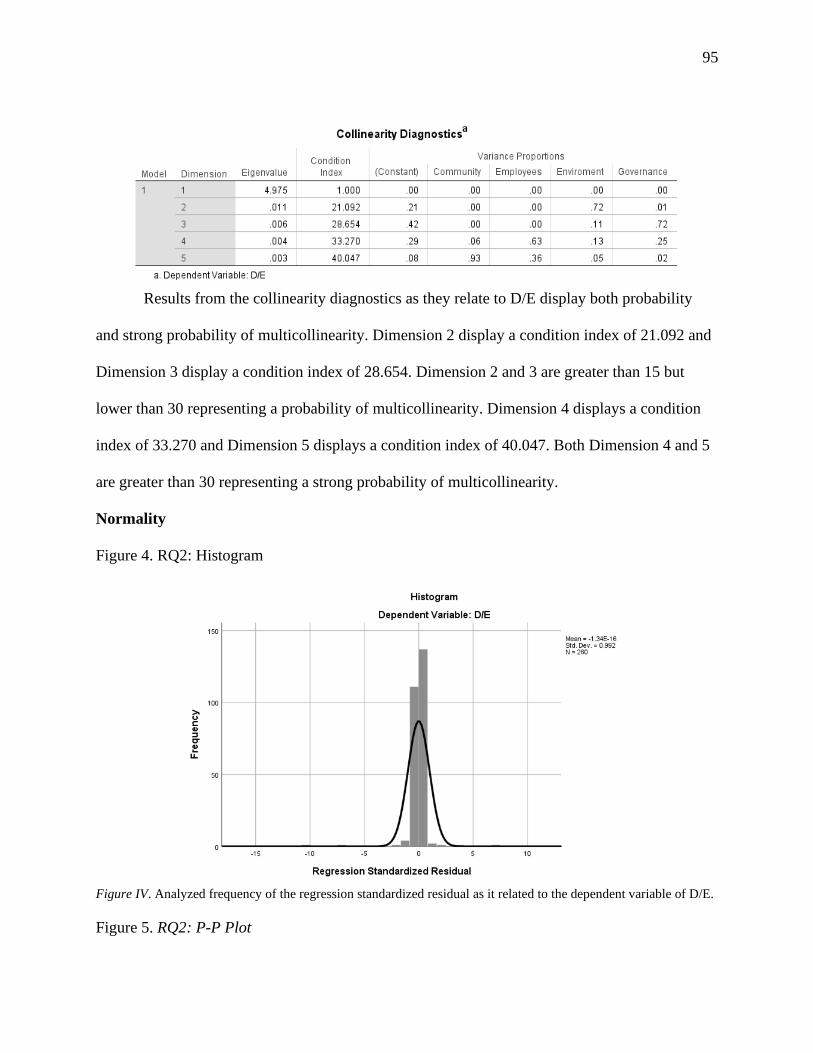
95
Results from the collinearity diagnostics as they relate to D/E display both probability
and strong probability of multicollinearity. Dimension 2 display a condition index of 21.092 and
Dimension 3 display a condition index of 28.654. Dimension 2 and 3 are greater than 15 but
lower than 30 representing a probability of multicollinearity. Dimension 4 displays a condition
index of 33.270 and Dimension 5 displays a condition index of 40.047. Both Dimension 4 and 5
are greater than 30 representing a strong probability of multicollinearity.
Normality
Figure 4. RQ2: Histogram
Figure IV. Analyzed frequency of the regression standardized residual as it related to the dependent variable of D/E.
Figure 5. RQ2: P-P Plot

96
Figure IV. Analyzed expected cumulative probability against observed cumulative probability as it related to the
dependent variable of D/E.
A histogram and P-P plot were utilized to check for normality. The histogram for this
analysis is represented by a bell-shaped curve and is roughly symmetric with a slight right
skewness. The histogram exhibits normality because of its roughly symmetrical shape. The P-P
plot examined the difference between the expected cumulative probability and the observed
cumulative probability. The P-P plot did not represent a normal curve with the distribution line
greatly crossing and falling above and then below the normal distribution line.
Homoscedasticity
Figure 6. RQ2: Scatter Plot

97
Figure VI. Analyzed the standardized residual against the unstandardized predicted value the dependent variable of
D/E.
Table 16
RQ2: Casewise Diagnostics
Homoscedasticity examined the error term across all independent variable values. The
results of this test indicated that there was no relationship found between the standard residual
and the unstandardized predicted value. This test resulted in a heteroscedasticity relationship
with the various error term across the independent variable.
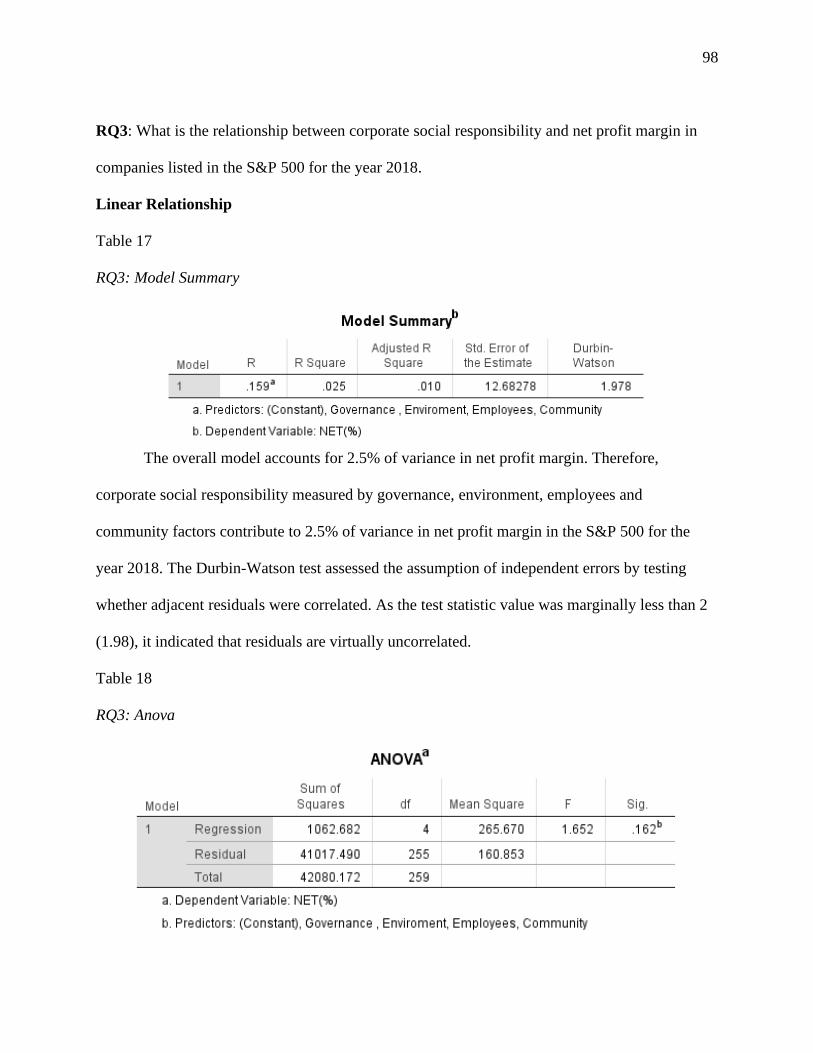
98
RQ3: What is the relationship between corporate social responsibility and net profit margin in
companies listed in the S&P 500 for the year 2018.
Linear Relationship
Table 17
RQ3: Model Summary
The overall model accounts for 2.5% of variance in net profit margin. Therefore,
corporate social responsibility measured by governance, environment, employees and
community factors contribute to 2.5% of variance in net profit margin in the S&P 500 for the
year 2018. The Durbin-Watson test assessed the assumption of independent errors by testing
whether adjacent residuals were correlated. As the test statistic value was marginally less than 2
(1.98), it indicated that residuals are virtually uncorrelated.
Table 18
RQ3: Anova

99
The model is not a significant fit of the data F (4, 255) = 1.65, p > .05. The adjusted R2
(.01) shows shrinkage from the unadjusted value (.025) indicating that the model may not
generalize well.
Multicollinearity
Table 19
RQ3: Coefficients
In terms of the individual predictors of corporate social responsibility, it seems that
governance significantly predicted net profit margin with a significantly negative relationship
indicating that as governance factors increase, the net profit margin decreased (B = -.428, p =
.02). Community, employees, and environment did not significantly predict net profit margin.
Table 20
RQ3: Collinearity Diagnostics

100
Results from the collinearity diagnostics as they relate to NPM display both probability
and strong probability of multicollinearity. Dimension 2 display a condition index of 21.092 and
Dimension 3 display a condition index of 28.654. Dimension 2 and 3 are greater than 15 but
lower than 30 representing a probability of multicollinearity. Dimension 4 displays a condition
index of 33.270 and Dimension 5 displays a condition index of 40.047. Both Dimension 4 and 5
are greater than 30 representing a strong probability of multicollinearity.
Normality
Figure 7. RQ3: Histogram
Figure VII. Analyzed frequency of the regression standardized residual as it related to the dependent variable of
NPM.
Figure 8. RQ3: P-P Plot
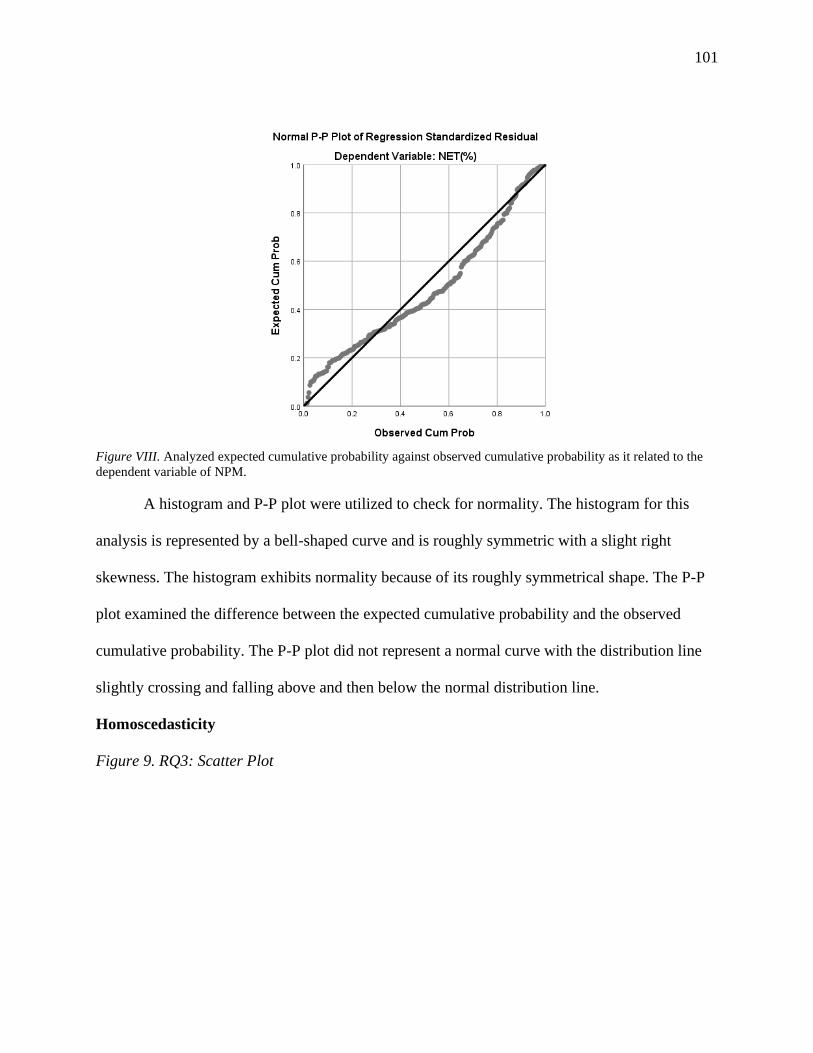
101
Figure VIII. Analyzed expected cumulative probability against observed cumulative probability as it related to the
dependent variable of NPM.
A histogram and P-P plot were utilized to check for normality. The histogram for this
analysis is represented by a bell-shaped curve and is roughly symmetric with a slight right
skewness. The histogram exhibits normality because of its roughly symmetrical shape. The P-P
plot examined the difference between the expected cumulative probability and the observed
cumulative probability. The P-P plot did not represent a normal curve with the distribution line
slightly crossing and falling above and then below the normal distribution line.
Homoscedasticity
Figure 9. RQ3: Scatter Plot

102
Figure VI. Analyzed the standardized residual against the unstandardized predicted value the dependent variable of
NPM.
Table 21
RQ3: Casewise Diagnostics
Homoscedasticity examined the error term across all independent variable values. The
results of this test indicated that there was no relationship found between the standard residual
and the unstandardized predicted value. This test resulted in a heteroscedasticity relationship
with the various error term across the independent variable.
103
Chapter 5: Discussion, Conclusions, and Recommendations
The purpose of this quantitative multiple regression-based study was to examine what
relationship existed between an organization’s corporate social responsibility policy (CSR) and
its financial performance. Quantitative research is consistent with understanding and measuring
the level of correlation between an organization’s CSR and its financial performance.
Stakeholder theory (ST) (Freeman, 1984) and the triple bottom-line framework (TBL)
(Elkington, 1999) were utilized to frame this study as both theories focus on CSR. Results from
previous studies have been mixed (Allard, 2018; Gangi et al., 2019; Martínez & Nishiyama,
2019; Macaulay et al., 2019; Yim et al., 2019). This study’s purpose was to expand and refine
the available information that can be used by upper management when making decisions on
whether to implement an organizational CSR based policy. Results from this study did not find
any statistically significant relationship between corporate social responsibility and return on
assets and net profit margin for companies listed in the S&P 500 for the year 2018. A limited
statistically significant relationship was discovered when analyzing debt to equity and CSR.
Interpretation of Findings
Research Question 1 Results:
RQ1: What is the relationship between corporate social responsibility and return on assets for
companies listed in the S&P 500 for the year 2018.
H10: There is no statistically significant relationship between corporate social
responsibility and return on assets for companies listed in the S&P 500 for the year 2018.
H1A: There is a statistically significant relationship between corporate social
responsibility and return on assets for companies listed in the S&P 500 for the year 2018.
104
Finding for RQ1 are described using the four separate assumptions of multiple regression
analysis: Linearity, multicollinearity, homoscedasticity, and normality.
Linearity
Linearity for ROA relationship with corporate financial performance was found not to be
significant. This model is not a significant fit of the data F (4, 255) = 2.10, p = .08. The adjusted
R2 (.017) shows considerable shrinkage from the unadjusted value (.032) indicating that the
model may not generalize well. The model accounted for 3.2% of variance in return on assets.
Adjacent residuals were found to be correlated based on the Durbin-Watson test. The statistic
value was greater than 2 (2.04). It indicated a slightly negative correlation, however given the
large size of the sample, this was not considered problematic.
Multicollinearity
Multicollinearity for ROA relationship with CSR was mixed. The predictor variables of
community (.038) and employees (.035) displayed a significant relationship. Community
significantly predicted ROA with a meaningfully positive relationship indicating that as
community factors increase, the return on assets increases (B = .318, p < .05). Environment
significantly predicted ROA with a significantly negative relationship (B = -.239, p < .05).
Neither environment nor governance significantly predicted return on assets. The collinearity
diagnostic resulted in a probability and strong probability of multicollinearity as related to ROA.
Normality
A roughly symmetric and slightly right skewed bell-shaped curve was found for ROA’s
relationship with CSR using a histogram. To better understand the result of the slight right
skewed bell-shaped curve a P-P plot was run. The P-P plot examined the difference between the
expected cumulative probability and the observed cumulative probability. The P-P plot did not

105
represent a normal curve with the distribution line slightly crossing and falling above and then
below the normal distribution line. Because of the slight right skew on the histogram and the
offline distribution curve found on the P-P plot, normality could not be confirmed.
Homoscedasticity
Homoscedasticity examined the error term across all independent variable values for
ROA relationship with financial performance. The results of this test indicated that there was no
relationship found between the standard residual and the unstandardized predicted value. This
test resulted in a heteroscedasticity relationship with the various error term across the
independent variable.
Conclusion
Results for ROA relationship with CSR found linearity and normality to be outside their
allotted tolerances. Evidence of the probability and strong probability of multicollinearity and a
heteroscedasticity relationship with the various error term across the independent variable was
also present. The results for these assumption support H10: There are no statistically significant
relationships between corporate social responsibility and return on assets for companies listed in
the S&P 500 for the year 2018.
Research Question 2 Results:
RQ2: What is the relationship between corporate social responsibility and debt-versus-equity for
companies listed in the S&P 500 for the year 2018.
H20: There is no statistically significant relationship between corporate social
responsibility and debt-versus-equity in companies listed in the S&P 500 for the year
2018.

106
H2A: There is a statistically significant relationship between corporate social
responsibility and debt-versus-equity in companies listed in the S&P 500 for the year
2018.
Finding for RQ2 are described using the four separate assumptions of multiple regression
analysis: Linearity, multicollinearity, homoscedasticity, and normality.
Linearity
Linearity for D/E relationship with financial performance was found to be significant.
This model is a significant fit of the data F (4, 255) = 2.87, p < .05. The adjusted R2 (.028) shows
shrinkage from the unadjusted value (.043) indicating that the model may not generalize well.
The model accounted for 4.3% of variance in debt to equity ratio. Adjacent residuals were found
to be correlated based on the Durbin-Watson test. The statistic value was greater than 2 (2.06), it
indicated a slightly negative correlation however, given the large size of the sample, this was not
considered problematic.
Multicollinearity
Multicollinearity for D/E relationship with CSR had mixed significance levels. The
predictor variables of community (.039) and environment (.026) displayed a significant
relationship (p < .05). Community significantly predicted D/E with a meaningfully positive
relationship indicating that as community factors increase, the D/E decrease (B = -.263, p < .05).
Environment significantly predicted D/E with a significantly negative relationship indicating that
as environmental factors increase, the D/E increases (B = .140, p < .05). Neither employees nor
governance significantly predicted D/E. The collinearity diagnostic resulted in a probability and
strong probability of multicollinearity as related to D/E.

107
Normality
A roughly symmetric and slightly right skewed bell-shaped curve was found for D/E’s
relationship with CSR using a histogram. To better understand the result of the slight right
skewed bell-shaped curve a P-P plot was run. The P-P plot examined the difference between the
expected cumulative probability and the observed cumulative probability. The P-P plot did not
represent a normal curve with the distribution line greatly crossing and falling above and then
below the normal distribution line. Because of the slight right skew on the histogram and the
offline distribution curve found on the P-P plot, normality could not be confirmed.
Homoscedasticity
Homoscedasticity examined the error term across all independent variable values for D/E
relationship with financial performance. The results of this test indicated that there was no
relationship found between the standard residual and the unstandardized predicted value. This
test resulted in a heteroscedasticity relationship with the various error term across the
independent variable.
Conclusion
Results for D/E relationship with CSR found linearity for all measures to be within the
allotted tolerance. Evidence of nonconforming normality, the probability and strong probability
of multicollinearity, and a heteroscedasticity relationship with the various error term across the
independent variable were also present. The results for these assumption support H2A: There are
a statistically significant relationships between corporate social responsibility and debt-versus-
equity in companies listed in the S&P 500 for the year 2018. Both predictor variables of
community (.039) and environment (.026) displayed a significant relationship (p < .05).
Community significantly predicted D/E with a significantly positive relationship indicating that
108
as community factors increase, the D/E decrease (B = -.263, p < .05). This result would indicate
that implementing a community-based CSR policy would have a positive impact on a business’s
debt level and contribute to lower debt loads and/or increased earnings. Environment
significantly predicted D/E with a significantly negative relationship (B = .140, p < .05). This
result would indicate that implementing an environmental-based CSR policy would have a direct
negative impact on a business’s debt level by either increasing debt levels or lowering earnings.
Employees and governance were found to not be significant when testing for multicollinearity.
Research Question 3 Results:
RQ3: What is the relationship between corporate social responsibility and net profit margin in
companies listed in the S&P 500 for the year 2018.
H30: There is no statistically significant relationship between corporate social
responsibility and net profit margin in companies listed in the S&P 500 for the year 2018.
H3A: There is a statistically significant relationship between corporate social
responsibility and net profit margin in companies listed in the S&P 500 for the year 2018.
Linearity
Linearity for NPM relationship with financial performance was found not to be
significant. This model is not a fit of the data F (4, 255) = 1.65, p > .05. The adjusted R2 (.01)
shows shrinkage from the unadjusted value (.025) indicating that the model may not generalize
well. The model accounted for 2.5% of variance in net profit margin. Adjacent residuals were
found to be correlated based on the Durbin-Watson test. The statistic value was less than 2
(1.98). It indicated a slightly positive correlation, however given the large size of the sample, this
was not considered problematic.
109
Multicollinearity
Multicollinearity for NPM relationship with CSR was mixed. The predictor variable of
governance (.016) displayed a significant relationship. Governance significantly predicted NPM
with a meaningfully negative relationship indicating that as governance factors increase, the
return on assets decrease (-.428, p = .02). Neither community, employees, nor environment
significantly predicted return on assets. The collinearity diagnostic resulted in a probability and
strong probability of multicollinearity as related to NPM.
Normality
A roughly symmetric and slightly right skewed bell-shaped curve was found for NPM’s
relationship with CSR using a histogram. To better understand the result of the slight right
skewed bell-shaped curve a P-P plot was run. The P-P plot examined the difference between the
expected cumulative probability and the observed cumulative probability. The P-P plot did not
represent a normal curve with the distribution line slightly crossing and falling above and then
below the normal distribution line. Because of the slight right skew on the histogram and the
offline distribution curve found on the P-P plot, normality could not be confirmed.
Homoscedasticity
Homoscedasticity examined the error term across all independent variable values for
NPM relationship with financial performance. The results of this test indicated that there was no
relationship found between the standard residual and the unstandardized predicted value. This
test resulted in a heteroscedasticity relationship with the various error term across the
independent variable.
110
Conclusion
Results for ROA relationship with CSR found linearity and normality to be outside their
allotted tolerances. Evidence of the probability and strong probability of multicollinearity and a
heteroscedasticity relationship with the various error term across the independent variable was
also present. The results for these assumption support H10: There are no statistically significant
relationships between corporate social responsibility and net profit margin for companies listed
in the S&P 500 for the year 2018.
Overall Findings
Overall findings suggest that there is not any significance or correlation between ROA an
NPM. This goes against the previous findings of similar CSR based research from Benlemlih et
al. (2018), Gangi et al. (2019), Martínez and Nishiyama (2019), Stanley (2011), and Yim et al.,
(2019) but supports the findings of Allard (2018), Baird et al. (2012), Peng and Yang (2014), and
Stanley (2011). These findings also do not align with the frameworks of triple bottom line
(Elkington, 1999) and Stakeholder Theory (Freeman, 1984) which emphasize the importance of
CSR through concerns of community, environment, employees, and governance.
Significance was found when examining D/E. Overall linearity was confirmed to be
significant for the whole category. Multicollinearity spit the D/E categories into two distinct
groups: Significant - community (.039) and environment (.026); Insignificant – employees
(.064), and governance (.682). D/E’s employees and governance categories did not pass the
significance test and can be added to ROA and NPM as not significantly aligning to Elkington
(1999) and Freeman’s (1984) Theories. Further confounding these D/E results. Environment
resulted in a significant negative correlation indicating that as environmental factors increase, the
debt to equity ratio will increase (B = .140, p < .05). Investing in the environment will cost the
111
utilizing business more to implement then they will generate in return. This calls into question
whether Elkington (1999) and Freeman’s (1984) theories should be utilized by organizations. In
contrast, community resulted in a significant positive correlation indicating that as community
factors increase, the debt to equity ratio is reduced (B = -.263, p < .05). Investing in the
community will cost the utilizing business less to implement then they will generate in return.
This result fits within Elkington (1999) and Freeman’s (1984) framework while providing
context and reinforces their theories.
Limitations of the Study
Limitations found while conducting this study fell into four distinct categories: Internal
and external validity, objectivity, and reliability. Internal validity was identified as the degree to
which observed outcomes represent reality in the data being studied (Patino & Ferreira, 2018).
Studies that fail to adequately account for internal validity will deviate from the study and be
rendered extraneous (Patino & Ferreira, 2018). Whereas internal validity focuses on the study’s
data and construction, external validity focuses on how the study results affect those for which
the research was intended (Patino & Ferreira, 2018). Increasing both internal and external
validity was essential for research integrity and for overcoming limitations within this study.
Careful preparation and quality control drove internal validity. Data gathering, data analysis
techniques, and proper study sample size were critical for increasing internal validity (Patino &
Ferreira, 2018). Comprehensive inclusion standards that mirrored the study’s intended
population improved external validity. Research reliability centered on the consistency of the
measurement tools and their results (Phelan & Wren, 2006). Stability within the statistical results
ensured that the research was valid and useful in presenting this study’s findings. The final
limitation facing this study was objectivity. Objectivity happens when the researcher remains
112
neutral while conducting and analyzing each component of the study. Doing this helped reduce
research bias and increase the validity of the study (Payne & Payne, 2004).
Internal Validity
This research’s nonlongitudinal nature can be a threat to its internal validity. This study
relied on the 2018 fiscal year for its measures. Using only one year of data provided just a
snapshot in time. A longitudinal study could provide a complete examination of the relationship
between CSR and corporate financial performance (CFP). Without long term research that
focuses on many years’ worth of data, a direct CSR link could not be definitively established
(Gaille, 2020). A nonlongitudinal study was not undertaken because of the nature of the S&P
500 index. The S&P 500 index had an approximately 25 percent turnover rate between the years
2014 – 2018 (S&P Dow Jones Indices, 2019). Not being able to examine the same businesses
year over year made a longitudinal study of the S&P 500 problematic. This issue also caused
concerns when determining CSR’s effect on social change. With only one year of data analyzed,
social change could only be estimated based on the significance level of each research sample. A
correlation could influence the direction corporate managers take when developing policies that
affect social change. Additional long-range research may need to be completed to reinforce the
results of this study.
External Validity
The primary external limitation facing this study was that of CSR relevancy based on
organizational size. The S&P 500 index contains only the top two market capitalization tiers, as
represented in Table 3. Research conducted for this study utilized a large dataset that is
representative of approximately 80% of all U.S. economic market capitalization (S&P Dow
Jones Indices, 2019; United States, 2019). With nearly 80% of U.S. market capitalization
113
accounted for, the results of this study could be interpreted for the whole of the U.S. firms.
Without incorporating other indexes such as the S&P 400 mid-cap and S&P 600 small-cap into
this study, an actual evaluation of CSR’s influence on corporate finance may not fully be
completed. Because of the enormity of the data contained within all S&P indexes, a
comprehensive study was outside the scale of this study. The S&P 500 was chosen as it aligned
and expanded on previous works by Lim (2017) and Stanly (2011). The study’s market
capitalization represented approximately 80% of the U.S. market. With 4/5 of the U.S. market
capitalization represented, the S&P 500 index provided the most external validity of this study.
Reliability
Both the dependent and independent data points must be properly calculated and
interpreted using regression analysis. SPSS software was utilized to ensure calculation accuracy.
The reliability of the regression calculation is only as good as the inputs entered into the
software. The reliability of this study depended on two primary components: CSRHub’s ratings
and the S&P 500 data. Though CSRHub has taken detailed steps to ensure reliability, its data
inputs are aggregated from other rating agencies. The only way to ensure complete reliability
would be to develop a proprietary rating scale and examine each organization’s CSR initiatives
individually before providing classification and rating. With the production of a proprietary
rating system time prohibiting, CSRHub’s selection provided the best alternative for the most
reliable information.
CSRHub’s reliability was improved by the collection and investigating of any data
related to each of the four independent variables: of four primary categories: (a) community, (b)
employee, (c) environment, (d) and governance, calculated by CSRHub ESG index. CSRHub’s
indexes have been analyzed for credibility by previous researchers (Anderson, 2019; Kruse,

114
2019; Barny, 2018) and found reliable for use in measuring CSR. CSRHub was selected for this
study based on their proprietary system of assimilating and standardizing 186 million data sets
from over 618 data sources (About CSRHub, 2019). Included within the CSRHub’s ratings are
leading SRI and ESG organizations such as Institutional Shareholder Services, MSCI, Trucost,
and Vigeo EIRIS (About CSRHub, 2019). CSRHub positioned itself to provide a reliable rating
methodology. A five-step approach was utilized to ensure validity: (a) Developed proprietary
rating scale; (b) Standardized ratings scale from multiple rating agencies so they would be
compatible with CSRHub proprietary scale; (c) Standardized ESG rating by creating four
primary categories and twelve subcategories; (d) Provides continually updated data; (e)
Incorporated all subsidiaries into their parent companies when rating (About CSRHub, 2019).
Objectivity
Research bias is a concerned with all postpositivist research designed studies. It was
assumed that all data provided from outside agencies such as CSRHub and each S&P 500
companies was reported accurate and without attempt to deceive. Secondary data proves only as
accurate as it is collected and reported by the outside agencies. The rating agency’s reputation
was relied upon when selecting the most accurate and trustworthy organization.
Data availability and continuity has proven to be a limitation to this study. There have
been a wide range of CSR based studies that have utilized proprietary rating agencies. The two
most common that were found during the literature review process were CSRHub and MSCI.
CSRHub was chosen because they are a leader in environment, social, and governance (ESG)
reporting. Selecting the CSRHub rating agency provided continuity with studies such as
Anderson, (2019) Lin, Hung, Chou, and Lai, (2019), and Mardonov (2017). Those studies that
utilized MSCI or one of the many other rating agencies may provide different results.
115
Recommendations
Review of the research results has generated the potential need for further studies. Three
recommendations have been included for further study. The first recommendation is to have
consistency in measurement type and source. Throughout the literature review process there have
been many different sources used as rating agencies. After careful review agencies such as
CSRHub and MSCI were found to be encompassing and well-constructed. Other agencies that
have been used do not offer the reputation, breadth, or scope need to ensure validity. I encourage
others studying this topic to utilize one of the two primary CSR research agencies, CSRHub or
MSCI. The more research that is completed using these resources, the more accurate and relevant
the result will become.
The second recommendation is focuses on debt levels associated with CSR policies. The
sole significant positive correlation that was found during this study came when examining D/E
to CSR. Finding more data regarding debts effect on CSR is important in understanding the
complete picture of CSR effect on corporate finance. Do debt levels increase because of CSR
policies, or are they the result of other actions?
The last recommendation is to replicate this same study within indexes that contain small
and medium organization based on market capitalization. Using indexes such as the S&P Small-
Cap 600 and S&P Mid-Cap 400 (market capitalization found in table 3) could provide a more
breadth of knowledge that could be used within combination of this study to determine the full
extent of CSR’s influence on corporate finances. It might also help to determine what market
size, and in turn which stakeholders, are most influenced by a CSR policy.
116
Implications
The importance of social change is not solely exclusive to S&P 500 organizations.
Change can start from the smallest to the largest business. CSR has long been associated with
large and mega cap organizations with equally as big financial abilities. The results of this study
have shown that social change through CSR is not always correlated with a company’s financial
performance. Programs that do not result in a profit often fall victim to cuts. The importance of
these type of programs cannot be undervalued. Without a direct link to their benefits, future CSR
policies may fail to materialize. The outcomes of this study found limited significant correlations
between CSR and a firm’s financial performance. With previous studies results inconclusive, the
likelihood of a top manger utilizing a CSR policy to influence organizational financial
performance continues to be in doubt.
Results from this study provide an expansion of information related to stakeholder theory
(Freeman, 1984) and triple bottom line theory (Elkington, 1999). The continued mix of results
discovered when utilizing these theories may lead to the next step in CSR evolution. This
evolution may result in a CSR program that benefits both stakeholders and the organization from
both a micro and macro level. Focusing on the small scale may work to build up the goodwill
needed to make a significant financial impact.
One area of promise is the significant finding that a CSR policy focusing on the
community can reduce an organizations D/E. Communities are directly affected by business
activities. By investing in activities that provide goodwill in their local community, a business
can not only improve their D/E, but also improve the quality of life within that community. If
this proven relationship is added into the theoretical assumption that CSR focus on a micro scale,
then perhaps a significant correlation can be obtained.
117
Conclusions
The idea of CSR and its implications on financial performance has been debated ever
since stakeholder (Freeman, 1984) and triple bottom line (Elkington, 1999) theories were
introduced. Top corporate decision makers have had to decide whether not utilizing a corporate
social responsibility (CRS) strategy would result in losing customers and if lost customers would
have a direct impact on a firm’s financial performance. Previous studies have provided mixed
results while trying to substantiate these theories. Information gleaned from this study provides a
more complete understanding on the effects of short- and long-term profits and organizational
debt level as they relate to CSR initiatives. This research provides new information that can now
be used by corporate decision makers interested in introducing or expanding CSR based policies.
An organization’s CSR engagement affects more than just business financials. CSR
initiatives affects all stakeholders who are influenced by the policies. Community,
environmental, employment and governance initiatives provide programs designed to improve
the quality of stakeholders’ lives. Corporations must balance the cost of these programs with
financial benefits. If a corporation overextends themselves implementing a CSR programs it may
have a damaging effect that compromise the business’s health and cause the opposite of its
intended effect. The importance of research focusing on CSR and its impact on financial
performance will assist corporate decision makers in selecting the best decision possible for their
company and stakeholders.

118
References
Abbott, W., & Monsen, R. J. (1979). On the measurement of corporate social responsibility:
Self-reported disclosures as a method of measuring corporate social involvement.
Academy of Management Journal, 22, 501–515
Acquay, J. (2017). The impact of integrating corporate social responsibility into business
strategies. Available from ProQuest Dissertations & Theses Global. (Order No.
1882289418).
Ağan, Y., Kuzey, C., Acar, M., & Açıkgöz, A. (2016). The relationships between corporate
social responsibility, environmental supplier development, and firm performance.
Journal of Cleaner Production, Volume 112(Part 3), 1872-1881.
doi:10.1016/j.jclepro.2014.08.090
Aguilera, R. V., Judge, W. Q., & Terjesen, S. A. (2018). Corporate governance deviance.
Academy of Management Review, 43(1), 87-109. doi:10.5465/amr.2014.0394
Aguinis, H. (2011). Organizational responsibility: Doing good and doing well. In Zedeck, S.
(Ed.), APA handbook of industrial and organizational psychology: 855-879. Washington,
DC: American Psychological Association
Ahamed, W. S. W., Almsafir, K. M., & Al-Smadi, W. A. (2014). Does corporate social
responsibility lead to improve in firm financial performance? Evidence from
Malaysia. International Journal of Economics and Finance, 6(3), 126.
doi:10.5539/ijef.v6n3p126.
Al-Thaqeb, S. (2016). Is government a unique customer? The impact of government as a major
customer on corporate cash holdings. Available from ProQuest Dissertations & Theses
Global. (Order No. 1854169437).
119
Allard, H. M. (2018). Corporate social responsibility and financial performance in the healthcare
Industry. (Order No. 10689748). Available from ProQuest Dissertations & Theses
Global.
Alexander, I. (2005). A Taxonomy of stakeholders: Human roles in system, development.
International Journal of Technology and Human Interaction, 1(1), pp 23 – 59.
Alexandra, M., & Ion, M. (2014). New Trends in Management. Annals of the University of
Oradea, Economic Science Series, 23(1), 1194–1199.
Ames, D. A., Hines, C. S., & Sankara, J. (2018). Board risk committees: Insurer financial
strength ratings and performance. Journal of Accounting & Public Policy, 37(2), 130–
145. doi:10.1016/j.jaccpubpol.2018.02.003
Anderson, M. A. (2019). The business case for CSR: A supply chain management strategy.
Available from ProQuest Dissertations & Theses Global. (2185919561).
Aras, G., Aybars, A., & Kutlu, O. (2010). Investigating the relationship between corporate social
responsibility and financial performance in emerging markets. Managing Corporate
Performance, 59, 229–254. doi:10.1108/17410401011023573
Arko-Achemfuor, A., & Dzansi, D. Y. (2015). Business doing well by doing good in the
community: The case of Sedikong sa Lerato in South Africa. Journal of Commerce
(22206043), 7(2), 53–68.
Arnott, R. D., Beck, N., & Kalesnik, V. (2016). Rip Van Winkle indexing. Journal of Portfolio
Management, 41(4), 23-27.
Arumemi, A. O. (2016). Balancing business owners' corporate social responsibility and
stakeholder profitability (Order No. 10247545). Available from ProQuest Dissertations &
Theses Global. (1846106362).

120
Aupperle, K. E., Carroll, A. B., & Hatfield, J. D. (1985). An empirical examination of the
relationship between corporate social responsibility and profitability. Academy of
Management Journal, 28, 446–463.
Austin, J. S. (1994). Corporate social responsibility: An empirical study (Order No. 1361794).
Available from ProQuest Dissertations & Theses Global.
Baird, P. L., Geylani, P. C., & Roberts, J. A. (2012). Corporate social and financial performance
re-examined: Industry effects in a linear mixed model analysis. Journal of Business
Ethics, 109, 367–388. doi:10.1007/s10551-011-1135-z
Barnett, M. L., & Salomon, R. M. (2012). Does it pay to be really good? Addressing the shape of
the relationship between social and financial performance. Strategic Management
Journal, 33, 1304–1320. doi:10.1002/smj.1980
Barnham, C. (2015). Quantitative and qualitative research. International Journal of Market
Research, 57(6), 837–854. https://doi-org.ezp.waldenulibrary.org/10.2501/IJMR-2015-
070
Barney, V. C. (2018). Exploring the relationships between corporate social responsibility
dimensions and tax disclosures with corporate tax avoidance. Available from ProQuest
Dissertations & Theses Global. (2049786370).
Benlemlih, M. (2017). Corporate social responsibility and firm debt maturity. Journal of
Business Ethics, 144(3), 491–517. doi:10.1007/s10551-015-2856-1
Benlemlih, M., Jaballah, J., & Peillex, J. (2018). Does it really pay to do better? Exploring the
financial effects of changes in CSR ratings. Applied Economics, 50(51), 5464–5482.
https://doi-org.ezp.waldenulibrary.org/10.1080/00036846.2018.1486997
Blomgren, A. (2011). Does corporate social responsibility influence profit margins? A case study
121
of executive perceptions. Corporate Social Responsibility & Environmental
Management, 18(5), 263-274. doi:10.1002/csr.246
Bramble, M. (2016). Understanding gross margin. Retrieved from
https://www.sba.gov/blogs/understanding-gross-margin
Branco, M. C., & Rodrigues, L. L. (2007). Positioning stakeholder theory within the debate on
corporate social responsibility. EJBO: Electronic Journal of Business Ethics and
Organization Studies, Vol. 12 No 1.
Branzei, O., Frooman, J., McKnight, B., & Zietsma, C. (2018). What good does doing good do?
The effect of bond rating analysts’ corporate bias on investor reactions to changes in
social responsibility. Journal of Business Ethics, 148(1), 183–203. doi:10.1007/s10551-
016-3357-6
Breece, D. D. (2017). The determinants of firm growth in the U.S. industrial sector: A firm level
Analysis. Retrieved from ProQuest Dissertations & Theses Global. (Order No.
10641702).
Brondoni, S. M. (2014). Global Capitalism and Sustainable Growth. From Global Products to
Network Globalization. Symphonya. Emerging Issues in Management, 1, 10-31.
http://dx.doi.org.ezp.waldenulibrary.org/10.4468/2014.1.02brondoni
Brower, J., & Mahajan, V. (2013). Driven to be good: A stakeholder theory perspective
on the drivers of corporate social performance. Journal of Business Ethics,
117(2), 313-331. doi:10.1007/s10551-012-1523-z
Cadez, S., & Czerny, A. (2016). Climate change mitigation strategies in carbon intensive firms.
Journal of Cleaner Production, 112, 4132–4143. doi:10.1016/j.jclepro.2015.07.099
Callan, S. J., & Thomas, J. M. (2009). Corporate financial performance and corporate
122
social performance: An update and reinvestigation. Corporate Social
Responsibility and Environmental Management, 16(2), 61-78. doi:10.1002/csr.182
Cantor, D. E., Morrow, P. C., & Blackhurst, J. (2015). An examination of how supervisors
influence their subordinates to engage in environmental behaviors. Decision Sciences,
46(4), 697–729. https://doi-org.ezp.waldenulibrary.org/10.1111/deci.12149
Carroll, A. B. (1979). A three-dimensional conceptual model of corporate social performance.
Academy of Management Review, 4, 497–505.
Carroll, A. B., & Shabana, K. M. (2010). The business case for corporate social responsibility: A
review of concepts, research and practice. International Journal of Management Reviews,
12(1), 85–105. doi:10.1111/j.1468-2370.2009.00275.x
Casalegno, C., & Civera, C. (2016). Business and CSR: Successful 'non-communication'. Rules
for responsible relationship management". Innovation Creativity Setting. InCreaSe, 208
Çetinkaya, M., Ağca, V., & Özutku, H. (2016). Priorities for corporate social responsibility
reporting: Evidence from listed Turkish companies in Istanbul Stock Exchange. Journal
of Economic & Social Studies (JECOSS), 6(2), 57–77.
Chalmers, A. W., & van den Broek, O. M. (2019). Financial volatility and public scrutiny as
institutional determinants of financial industry firms’ CSR. Business & Politics, 21(2),
240–266. doi:10.1017/bap.2018.28
Chang, K., Kim, I., & Li, Y. (2014). The heterogeneous impact of corporate social
responsibility activities that target different stakeholders. Journal of Business
Ethics, 125(2), 211-234. doi:10.1007/s10551-013-1895-8
Chen, C.-J., Guo, R.-S., Hsiao, Y.-C., & Chen, K.-L. (2018). How business strategy in non-
financial firms moderate the curvilinear effects of corporate social responsibility and
123
irresponsibility on corporate financial performance. Journal of Business Research, 92,
154–167. doi.10.1016/j.jbusres.2018.07.030
Chen, l., Feldmann, A., & Tang, O. (2015). The relationship between disclosure of corporate
social performance and financial performance: Evidence from GRI reports in
manufacturing industry. International Journal of Production Economics, 170, 445–456.
doi:10.1016/j.ijpe.2015.04.004
Coco, C. M. (2018). Stakeholders and student perceptions: Choosing the primary group.
American Journal of Management, 18(2), 80–82.
Collver, C. (2014). Final rule: Method for determining market capitalization and dollar value of
average daily trading volume. Retrieved from https://www.sec.gov/rules/final/34-
44724.htm
Conway, N., Kiefer, T., Hartley, J., & Briner, R. B. (2014). Doing more with less? Employee
reactions to psychological contract breach via target similarity or spillover during public
sector organizational change. British Journal of Management, 25(4), 737-754.
doi:10.1111/1467-8551.12041
Coskun-Arslan, M., & Kisacik, H. (2017). The corporate sustainability solution: Triple bottom
line. Journal of Accounting & Finance, 18-34.
Crane, A., McWilliams, A., Matten, D., Moon, J., & Siegel, D. (2008). The Oxford handbook of
CSR. Oxford: Oxford University Press.
Crane, A., Palazzo, G., Spence, L. J., & Matten, D. (2014). Contesting the value of "creating
shared value". California Management Review, 56(2), 130-153.
doi:10.1525/cmr.2014.56.2.130
124
Crifo, P., & Forget, V. D. (2015). The economics of corporate social responsibility: A firm-level
perspective survey. Journal of Economic Surveys, 29(1), 112-130.
doi:10.1111/joes.12055
Dahlsrud, A. (2008). How corporate social responsibility is defined: An analysis of 37
definitions. Corporate Social Responsibility and Environmental Management, 15, 1–13.
doi:10.1002/csr.132
Daniel, O. (2018). The relationship between corporate social responsibility, corporate
sustainability, and corporate financial performance (Order No. 10976327). Available
from ProQuest Dissertations & Theses Global.
Das, R. (2016). Economic exchange: Interdisciplinary conceptualizations for management
applications. Vilakshan: The XIMB Journal of Management, 13(2), 115–124.
Davis, K. (1973). The case for and against business assumption of social responsibilities.
Academy of Management Journal, 16, 312–322.10.2307/255331
de Colle, S., Henriques, A., & Sarasvathy, S. (2014). The paradox of corporate social
responsibility standards. Journal of Business Ethics, 125(2), 177-191.
doi:10.1007/s10551-013-1912-y
De Leaniz, Martínez García, P., & Del, B. R. (2016). Corporate image and reputation as
drivers of customer loyalty. Corporate Reputation Review, 19(2), 166-178.
doi:10.1057/crr.2016.2
Debt, strategy and CSR practices. (2018). Strategic Direction, 34(6), 1–3.
doi:10.1108/SD-04-2018-0086
DeLong, J. F. (2016). Using corporate social responsibility activities to build customer value
and positive stakeholder relationships in the lighting industry: A delphi study (Order No.
125
3733495). Available from ProQuest Dissertations & Theses Global. (1731272736).
Demirguc-Kunt, A., & Levine, R. (1999). Bank-based and market-based financial systems:
Cross-country comparisons. Retrieved from
https://pdfs.semanticscholar.org/18e5/660bef2325f326bb8077bd0dd6f5225b1bf8.pdf b
Dhakal, H. R. (2017). An alternative to paradoxical leadership model: Fulfilling the triple
bottom line. Available from ProQuest Dissertations & Theses Global. (Order No.
10623991).
Dhanesh, G. S. (2017). Putting engagement in its proper place: State of the field, definition and
model of engagement in public relations. Public Relations Review, 43(5), 925–933.
https://doi-org.ezp.waldenulibrary.org/10.1016/j.pubrev.2017.04.001
Doorn, J., Onrust, M., Verhoef, P., & Bügel, M. (2017). The impact of corporate social
responsibility on customer attitudes and retention-the moderating role of brand success
indicators. Marketing Letters, 28(4), 607–619. https://doi-
org.ezp.waldenulibrary.org/10.1007/s11002-017-9433-6
Dzansi, D. Y. (2011). Social responsibility of small businesses in a typical rural
African setting: Some insights from a South African Study, African Journal
of Business Management, 5(14): 5710-5723.
EDGAR: Company Filings. (2019). Retrieved from
https://www.sec.gov/edgar/searchedgar/companysearch.html
El Akremi, A., Gond, J.P., Swaen, V., De Roeck, K., & Igalens, J. (2018). How do employees
perceive corporate responsibility? Development and validation of a multidimensional
corporate stakeholder responsibility scale. Journal of Management, 44(2), 619–657.
https://doi.org/10.1177/0149206315569311
126
Elkington, J. (1999). Cannibals with forks: the triple bottom line of 21st century business.
Oxford: Capstone.
Epstein, M. J., & Rejc-Buhovac, A. (2014). Making sustainability work, best practices in
managing and measuring corporate social, environmental, and economic impacts.
Sheffield, UK: Greenleaf Publishing.
Eren, S. S., & Eker, S. (2012). The effects of corporate social responsibility activities on brand
image, perceived value, customer satisfaction and brand loyalty: brand x. Suleyman
Demirel University The Journal of Faculty of Economics and Administrative Sciences,
17(2), 451-472.
ESG data to drive corporate, financial, & consumer decisions. (2019). Retrieved from
https://www.csrhub.com/.
European Commission (2001). Promoting a European framework for corporate social
responsibility: Green Paper. Office for Official Publications of the European
Communities, Brussels, Directorate-General for Employment. Retrieved from
http://www.europa.eu.int/comm/employment_social/soc-dial/csr/csr_index.htm
Faul, F., Erdfelder, E., Buchner, A., & Lang, A. G. (2009). Statistical power analyses using
G*Power 3.1: Tests for correlation and regression analyses. Behavior Research Methods,
41, 1149-1160.
Filings & Forms (2017). Securities and Exchange Commission. Retrieved from
https://www.sec.gov/edgar.shtml
FINCA (2018). What is microfinance? Retrieved from https://www.finca.org/our-
work/microfinance/
Ford, C. (2017). Getting started with multivariate multiple regression. Retrieved from
127
https://data.library.virginia.edu/getting-started-with-multivariate-multiple-regression/
Freeman, R. E. (1984). Strategic management: A stakeholder approach. San Bernardino, CA:
University of Minnesota Press.
Freeman, R. E. (2018). About. Retrieved from http://stakeholdertheory.org/about/
Freeman, R. E. (2010). Strategic management: A stakeholder approach. Cambridge, UK:
Cambridge University Press.
Freeman, R. E., & Dmytriyev, S. (2017). Corporate social responsibility and stakeholder theory:
Learning from each other. Symphonya, (1), 7-15. doi:10.4468/2017.1.02freeman.dmytriyev
Freeman, R. E., Harrison, J.S., Wicks, A.C., Parmar, B.L. and de Colle, S. (2010), Stakeholder
Theory: The state of the art. Cambridge University Press, New York, NY.
Freeman, R. E. & Liedtka, J. (1991). “Corporate social responsibility: A critical approach –
Corporate social responsibility no longer a useful concept.” Business Horizons, July-
August 1991.
Freeman, R. E., & Velamuri, S. R. (2006). A new approach to CSR: Company stakeholder
responsibility. In Corporate social responsibility (pp. 9-23). Cambridge, UK: Palgrave
Macmillan. doi:10.2139/ssrn.1186223
Fu, G., & Jia, M. (2012). On the reasons for the vexing CSP-CFP relationship:
Methodology, control variables, stakeholder groups, and measures: The review of
63 studies from 1990s. International Journal of Business and Management, 7(12),
130-137. doi:10.5539/ijbm.vn12p130
Gaille, L. (2020). 13 Advantages of Disadvantages of Longitudinal Studies. Retrieved from
https://vittana.org/13-advantages-of-disadvantages-of-longitudinal-studies
Galant, A. & Cadez S. (2017) Corporate social responsibility and financial performance
128
relationship: A review of measurement approaches. Economic Research-Ekonomska
Istraživanja, 30:1, 676-693, doi:10.1080/1331677X.2017.1313122
Gallo, A. (2015). A refresher on debt-to-equity ratio. Harvard Business Review
Digital Articles, 2-5.
Gallo, A. (2017). Contribution margin: What it is, how to calculate it, and why you need it.
Harvard Business Review Digital Articles, 2-5.
Gallo, A., Davenport, T. H., & Kim, J. (2017). A refresher on regression analysis. Retrieved
from https://hbr.org/2015/11/a-refresher-on-regression-analysis
Gangi, F., Mustilli, M., & Varrone, N. (2019). The impact of corporate social responsibility
(CSR) knowledge on corporate financial performance: evidence from the European
banking industry. Journal of Knowledge Management, 23(1), 110–134. https://doi-
org.ezp.waldenulibrary.org/10.1108/JKM-04-2018-0267
Garcia-Castro, R., Ariño, M. A., & Canela, M. A. (2010). Does social performance really lead to
financial performance? Accounting for Endogeneity, Journal of Business Ethics, 92, 107–
126. doi:10.1007/s10551-009-0143-8
George, M. (2016). Consumer perspectives: Corporate social responsibility through
advertisement and publicity (Order No. 10147466). Available from ProQuest
Dissertations & Theses Global.
Glavas, A., & Godwin, L. (2013). Is the perception of “goodness” good enough? Exploring the
relationship between perceived corporate social responsibility and employee
organizational identification. Journal of Business Ethics, 114, 15-27.
Goering, G. E. (2014). The profit-maximizing case for corporate social responsibility in a
129
bilateral monopoly. Managerial & Decision Economics, 35(7), 493-499.
doi:10.1002/mde.2643
Graafland, J., Eijffinger, S. C. W., & SmidJohan, H. (2004). Benchmarking of corporate social
responsibility: Methodological problems and robustness. Journal of Business Ethics, 53,
137–152. doi:10.1023/B:BUSI.0000039404.67854.e1
Grant, P. (2011). How the declining marginal utility of rewards accentuates MR-MC divergence
at profit optimization. Journal of Leadership, Accountability & Ethics, 8(5), 91-102.
Greenwood, M. (2007). Stakeholder engagement: Beyond the myth of corporate responsibility,
Journal of Business Ethics, 74(4), pp. 315–327.
Hao, F. (2016). A panel regression study on multiple predictors of environmental concern for 82
countries across seven years. Social Science Quarterly (Wiley-Blackwell), 97(5), 991-
1004. doi:10.1111/ssqu.12237
Harjoto, M. (2017). Corporate social responsibility and degrees of operating and financial
leverage. Review of Quantitative Finance & Accounting, 49(2), 487–513.
doi:0.1007/s11156-016-0598-5
Harness, D., Ranaweera, C., Karjaluoto, H., & Jayawardhena, C. (2018). The role of negative
and positive forms of power in supporting CSR alignment and commitment between
large firms and SMEs. Industrial Marketing Management, 75, 17–30. https://doi-
org.ezp.waldenulibrary.org/10.1016/j.indmarman.2018.03.006
Heidelberg, R. L. (2017). Political accountability and spaces of contestation. Administration &
Society, 49(10), 1379–1402. https://doi-
org.ezp.waldenulibrary.org/10.1177/0095399715581033
Hill, C., & Jones, T. M. (1992). Stakeholder-agency theory. Journal of Management Studies, 29:

130
131–154.
Hoskisson, R. E., Gambeta, E., Green, C. D., & Li, T. X. (2018). Is my firm specific investment
protected? Overcoming the stakeholder investment dilemma in the resource-based view.
Academy of Management Review, 43(2), 284-306. doi:10.5465/amr.2015.0411
Hou, T. C. T. (2018). The relationship between corporate social responsibility and sustainable
financial performance: Firm‐level evidence from Taiwan. Corp Soc Resp Env Ma. 2019;
26: 19–28. doi.org/10.1002/csr.1647
Hourneaux, F. Jr., da Silva Gabriel, M. L., & Gallardo-Vázquez, D. A. (2018). Triple bottom line
and sustainable performance measurement in industrial companies. REGE Revista de
Gestão, 25(4), 413–429. https://doi-org.ezp.waldenulibrary.org/10.1108/REGE-04-2018-
0065
Hsu, F.-J., & Liu, I.-C. (2017). Quantitative easing and default probability of corporate social
responsibility in US. Applied Economics Letters, 24(10), 681–685.
doi:10.1080/13504851.2016.1221032
Hur, W.M, Kim H., & Woo J. (2014), "How CSR leads to corporate brand equity: Mediating
mechanisms of corporate brand credibility and reputation", Journal of Business Ethics,
125(1), pp. 75-86
Hussain, N., Rigoni, U., & Orij, R. P. (2018). Corporate governance and sustainability
performance: Analysis of Triple Bottom Line performance. Journal of Business Ethics,
149(2), 411-432. doi:10.1007/s10551-016-3099-5
Ibm.com. (2020). IBM Knowledge Center. Retrieved from:
https://www.ibm.com/support/knowledgecenter/en/SSLVMB_23.0.0/spss/tutorials/reg_c
ars_collin_01.html
131
Igan, D., & Mishra, P. (2014) YEAR “Wall Street, Capitol Hill, and K Street: Political influence
and financial regulation.” Journal of Law and Economics, 57 (2014), 1063–1084.
Introduction to Correlation and Regression Analysis. (2013). Boston University. Retrieved from
http://sphweb.bumc.bu.edu/otlt/MPH
Modules/BS/BS704_Multivariable/BS704_Multivariable5.html
ISO 26000 social responsibility. (2017). Retrieved from https://www.iso.org/iso-26000-social-
responsibility.html
Jamali, D., & Mirshak, R. J. (2007). Corporate social responsibility (CSR): Theory and practice
in a developing country context. Journal of Business Ethics, 72: 243.
doi:10.1007/s10551-006-9168-4
Jerónimo, B., Vázquez-Brust, D., Plaza-Úbeda, J. A., & Dijkshoorn, J. (2013). Environmental
protection and financial performance: An empirical analysis in wales. International
Journal of Operations & Production Management, 33(8), 981-1018. Retrieved from
doi:10.1108/IJOPM-11-2010-0374
Jeurissen, R. (2000). Cannibals with forks: The triple bottom line of 21st century business.
Journal of Business Ethics, 23(2), 229-231.
John Elkington, (2014a). Professional. Retrieved from
http://johnelkington.com/about/professional/
John Elkington, (2014b). Awards & listings. Retrieved from
http://johnelkington.com/about/awards&listings/
Jones, T. M., Harrison, J. S., & Felps, W. (2018). How applying Instrumental stakeholder theory
can provide sustainable competitive advantage. Academy of Management Review, 43(3),
132
371–391. https://doi-org.ezp.waldenulibrary.org/10.5465/amr.2016.0111
Jovanovic, Z. (2015). Management and changes in business environment. Ekonomika, 61(2),
143-151. doi:10.5937/ekonomika1502143J
Jung, J. (2015). Shareholder Value and Workforce Downsizing, 1981-2006. Social Forces,
93(4), 1335–1368. https://doi-org.ezp.waldenulibrary.org/10.1093/sf/sou108
Karagiorgos, T. (2010). Corporate social responsibility and financial performance: An empirical
analysis on Greek companies. European Research Studies, 13, 85–108.
Kariv, A., & Pollock, R. (2018). About DataHub. Retrieved from https://datahub.io/docs/about
Kim, K., Kim, M., & Qian, C. (2018). Effects of corporate social responsibility on corporate
financial performance: A competitive-action perspective. Journal of Management, 44(3),
1097-1118. doi:10.1177/0149206315602530
Krunic, M. (2017) The relationship between corporate social responsibility and firm
performance. doi:10.2139/ssrn.2957906
Kruse, D. S. (2019). Corporate social responsibility and firm production: Using neoclassical
economic theory and modern estimation techniques to measure the impact of socially
activities on firm output (Order No. 13863932).
La Rosa, F., Liberatore, G., Mazzi, F., & Terzani, S. (2018). The impact of corporate social
performance on the cost of debt and access to debt financing for listed European non-
financial firms. European Management Journal, 36(4), 519–529.
doi:10.1016/j.emj.2017.09.007
Lagoarde-Segot, T. (2011). Corporate social responsibility as a bolster for economic
performance: Evidence from emerging markets. Global Business & Organizational
Excellence, 31(1), 38-53. doi:10.1002/joe.21403

133
Lantos, G. P. (2001) “The boundaries of strategic corporate social responsibility”, Journal of
Consumer Marketing, Vol. 18 No. 7, pp. 595-630.
Lash, T. L., Fox, M. P., Cooney, D., Lu, Y., & Forshee, R. A. (2016). Quantitative bias analysis
in regulatory settings. American Journal of Public Health, 106(7), 1227-1230.
doi:10.2105/AJPH.2016.303199
Lim, C. (2017). Relationship between corporate social responsibility and corporate financial
Performance. Retrieved from ProQuest Dissertations & Theses Global. (Order No.
10683732).
Limkriangkrai, M., Koh, S., & Durand, R. B. (2017). Environmental, Social, and Governance
(ESG) Profiles, Stock Returns, and Financial Policy: Australian Evidence. International
Review of Finance, 17(3), 461–471. doi:10.1111/irfi.12101
Lin, S. M. (2016). Understanding corporate social responsibility and brand equity: An
investigation of restaurant brand attributes and customer traits Retrieved from ProQuest
Dissertations & Theses Global. (Order No. 10191464).
Lin, Pi-Hsia Hung, De-Wai Chou, & Lai, C. W. (2019). Financial performance and corporate
social responsibility: Empirical evidence from Taiwan. Asia Pacific Management Review,
24(1), 61-71.
Lioui, A., & Sharma, Z. (2012). Environmental corporate social responsibility and
financial performance: Disentangling direct and indirect effects. Ecological
Economics, 78(5), 100-111. doi:10.1016/j.ecolecon.2012.04.004
Loi, T. H. (2016). Stakeholder management: A case of its related capability and performance.
Management Decision, 54(1), 148-173.
Lugovoy, R. A., Mazelis, L. S., & Solodukhin, K. S. (2012). A conceptual model of value
134
apportioning among organization's stakeholders. Management Review: An International
Journal, 7(1), 4-16.
Maas, S., & Reniers, G. (2014). Development of a CSR model for practice: Connecting
five inherent areas of sustainable business. Journal of Cleaner Production, 64,
104–114. Retrieved from
http://www.xcdsystem.com/iie2014/abstract/finalpapers/I700.pdf
Macaulay, C. D., Peng, M. W., Richard, O. C., & Washburn, M. (2019). Balancing on the Triple
Bottom Line: An examination of firm CSR strategies. SAM Advanced Management
Journal (07497075), 83(2), 27–36.
Mardonov, R. (2017). An explanatory study of the relationship between CSR ratings and U.S.
retail fee-based bank prices as moderated by firm. Available from ProQuest Dissertations
& Theses Global. (1894100630).
Margolis, J. D., Elfenbein, H. and Walsh, J. (2012). Does it pay to be good… and does it matter?
A meta‐analysis and redirection of research on corporate social and financial
performance. Working Paper, Harvard University.
Markowitz, H. (1952). Portfolio Selection. The Journal of Finance, Vol. 7, No. 1.pp. 77-91.
Retrieved from http://links.jstor.org/sici?sici=0022-
1082%28195203%297%3A1%3C77%3APS%3E2.0.CO%3B2-1
Martínez, P., & Nishiyama, N. (2019). Enhancing customer-based brand equity through CSR in
the hospitality sector. International Journal of Hospitality & Tourism Administration,
20(3), 329–353. https://doi-org.ezp.waldenulibrary.org/10.1080/15256480.2017.1397581
Martínez-Ferrero, J., Banerjee, S., & García-Sánchez, I. M. (2014). Corporate social
135
responsibility as a strategic shield against costs of earnings management practices.
Journal of Business Ethics, 133(2), 305-324. https://doi.org/10.1007/s10551-014-2399-x
Maslow, A. H. (1943). A theory of human motivation. Psychological Review, 50, 310-396.
Mason, C., & Simmons, J. (2014). Embedding corporate social responsibility in corporate
governance: A stakeholder systems approach. Journal of Business Ethics, 119(1), 77-86.
doi:10.1007/s10551-012-1615-9
McGregor, D., & Cutcher-Gershenfeld, J. E. (2008). The human side of enterprise. McGraw-Hill
Professional.
McWilliams, A., & Siegel, D. S. (2011). Creating and capturing value: Strategic corporate social
responsibility, resource-based theory, and sustainable competitive advantage. Journal of
Management, 37(5), 1480–1495. doi:10.1177/0149206310385696
Meyer, M. (2015). Positive business: Doing good and doing well. Business Ethics: A European
Review, 24, S175–S197
Mitchell, R. K., Agle, B. R., & Wood, D. J. (1997). Toward a theory of stakeholder identification
and salience: Defining the principle of who and what really counts. Academy of
Management Review, 22: 853–886.
Mokhtar, N., Jusoh, R., & Zulkifli, N. (2016). Corporate characteristics and
environmental management accounting implementation: Evidence from Malaysian public
listed companies. Journal of Cleaner Production, 136, doi:111–
122.10.1016/j.jclepro.2016.01.085
Morgeson, F., Aguinis, H., Waldman, D., & Siegel, D. (2013). Extending corporate social
responsibility research to the human resource management and organizational behavior
domains: A look to the future. Personnel Psychology, 66(4), 805-824.
136
doi:10.1111/peps.12055
Mosca, F., Casalegno, C., & Civera, C. (2016). "Opportunities and peculiarities of the online for
communicating corporate social responsibility. A cross investigation on luxury players
and consumers' perceptions". British Academy of Management, Book of Proceedings, 1-
26
Mouffe, C. (2009). The democratic paradox. London: Verso.
Moussu, C., & Ohana, S. (2016). Do leveraged firms underinvest in corporate social
responsibility? Evidence from health and safety programs in U.S. firms. Journal of
Business Ethics, 135(4), 715–729. doi:10.1007/s10551-014-2493-0
Naranjo-Gil, D. (2016). The role of management control systems and top teams in implementing
environmental sustainability policies. Sustainability, 8, 359–371. doi:10.3390/su8040359
Nega, F. T. (2017). The relationship between financial performance, firm size, leverage and
corporate social responsibility. Retrieved from
https://scholarworks.waldenu.edu/dissertations
Oladimeji, M. S. PhD., Adebayo, L. A., & Ogunshola, B. G. (2017). Effects of corporate social
responsibility (CSR) on customers’ loyalty and retention. BVIMSR’s Journal of
Management Research, 9(1), 1-7.
Olsen, T. D. (2017). Political stakeholder theory: The state, legitimacy, and the ethics of
microfinance in emerging economies. Business Ethics Quarterly, 27(1), 71-98.
Ouchi, W. G. (1993). Theory Z: How American business can meet the Japanese challenge. New
York: Avon.
Park, Y. E. (2018). Co-creation for corporate social responsibility: When and why CSR co-
creation influences consumer evaluations and behavioral intentions (Order No.
137
10829544). Available from ProQuest Dissertations & Theses Global.
Parker, S., & Parker, M. (2017). Antagonism, accommodation and agonism in Critical
Management Studies: Alternative organizations as allies. Human Relations, 70(11),
1366–1387. https://doi.org/10.1177/0018726717696135
Patino, C. M., & Ferreira, J. C. (2018). Internal and external validity: Can you apply research
study results to your patients? Retrieved from
https://www.ncbi.nlm.nih.gov/pmc/articles/PMC6188693/
Payne, G., & Payne, J. (2004). Objectivity. Retrieved from
https://dx.doi.org/10.4135/9781849209397.n32
Peloza, J., & Shang, J. (2011). How can corporate social responsibility activities create value for
stakeholders? A systematic review. Academy of Marketing Science Journal, 39(1), 117–
135. doi:10.1007/s11747-010-0213-6
Peng, C. W., & Yang, M. L. (2014). The effect of corporate social performance on financial
performance: The moderating effect of ownership concentration. Journal of Business
Ethics, 123, 171–182. doi:10.1007/s10551-013-1809-
Phelan, C., & Wren, J. (2006). Exploring reliability in academic assessment. Retrieved from
https://chfasoa.uni.edu/reliabilityandvalidity.htm
Phillips, J. F., & Strickland, P. J. (2016). Initial evidence on the association between local
government fiscal distress and environmental protection programs. Issues in Social &
Environmental Accounting, 10(3), 45–62.
Quéré, B. P., Nouyrigat, G., & Baker, C. R. (2018). A bi-directional examination of the
relationship between corporate social responsibility ratings and company financial
138
performance in the European context. Journal of Business Ethics, 148(3), 527–544.
https://doi-org.ezp.waldenulibrary.org/10.1007/s10551-015-2998-1
Ramaswamy, V., and Ozcan, K. (2016), “Brand value co-creation in a digitalized world: An
integrative framework and research implications”. International Journal of Research in
Marketing, Vol. 33 No. 1, pp. 93-106.
Ratings criteria. (2018). S&P global. Retrieved from
https://www.standardandpoors.com/en_US/web/guest/ratings/ratings-criteria
Raza, A., Ilyas, M., Rauf, R., & Qamar, R. (2012) Relationship between Corporate Social
Responsibility (CSR) and Corporate Financial Performance (CFP): Literature
review approach. Finance Management. 46. 8404-8409.
Rodgers, W., Choy, H. L., & Guiral, A. (2013). Do investors value a firm’s commitment to
social activities? Journal of Business Ethics, 114, 607–623. doi:10.1007/s10551-013-
1707-1
Rodriquez, M. A., Ricart, J. E., & Sanchez, P. (2002). Sustainable development and the
sustainability of competitive advantage: A dynamic and sustainable view of the firm.
Creativity and Innovation Management, 11(3): 135-146.
Rokka, J., Karlsson, K., and Tienari, J. (2014), “Balancing acts: managing employees and
reputation in social media”. Journal of Marketing Management, Vol. 30 Nos 7/8, pp.
802-827.
Root, T., Rozycki, J., & Suh, I. (2014). Share repurchases and long-term dilution: Firm
characteristics and industry differences. Quarterly Journal of Finance & Accounting,
52(3/4), 1–52.
Roszkowska-Menkes, M. (2016). What does CSR really stand for? An analysis of corporate
139
definitions of CSR in Poland. Research Papers of the Wroclaw University of Economics
/ Prace Naukowe Uniwersytetu Ekonomicznego We Wroclawiu, (423), 94–106.
doi:10.15611/pn.2016.423.07
Rudolph, P. (2005). Letters to the Editor. "An Adam Smith Look at Green Regulations" The
Wall Street Journal, June 6. Opinion section.
Rupp, D. E., Shao, R., Thornton, M. A., & Skarlicki, D. P. (2013). Applicants’ and employees’
reactions to corporate social responsibility: The moderating effects of first-party justice
perceptions and moral identity. Personnel Psychology, 66: 895-933.
S&P Dow Jones Indices. (2019). Retrieved from https://us.spindices.com/indices/equity/sp-500
Schembera, S. (2016). Implementing corporate social responsibility: Empirical insights on the
impact and accountability of the UN Global Compact. Business & Society. Online First.
http://bas.sagepub.com/content/early/2016/03/14/0007650316635579
Singh, J. (2016). The influence of CSR and ethical self-identity in consumer evaluation of
cobrands. Journal of Business Ethics, 138(2), 311-326. doi:10.1007/s10551-015-2594-4
Smith, V., & Langford, P. (2009). Evaluating the impact of corporate social responsibility
programs on consumers. Journal of Management and Organization, 15(1), 97–
109. ISSN: 0736-3761
Soana, M. G. (2011). The relationship between corporate social performance and corporate
financial performance in the banking sector. Journal of Business Ethics, 104, 133–148.
doi:10.1007/s10551-011-0894-x
Spiller, R. (2000). Ethical business and investment: A model for business and society.
Journal of Business Ethics. 27, 149-160.
140
Spreckley, F. (1981). Social audit: A management tool for co-operative working. Beechwood
College.
Stanfield, J., & Tumarkin, R. (2018). Does the political power of nonfinancial stakeholders affect
firm values? Evidence from labor unions. Journal of Financial & Quantitative Analysis,
53(3), 1101–1133. https://doi-org.ezp.waldenulibrary.org/10.1017/S002210901800008X
Stanley, S. (2011). A correlational study examining the relationship between social
responsibility and financial performance. Retrieved from ProQuest Dissertations &
Theses Global. (Order No. 3453666).
Starik, M. (1994). Management and the natural environment. Orlando, FL: Dryden Press.
Subramanian, G., Barton, D., & Wiseman, M. (2015). Corporate Governance 2.0. Retrieved from
https://hbr.org/2015/03/corporate-governance-2-0
Taneja, S. S., Taneja, P. K., & Gupta, R. K. (2011). Researches in corporate social
responsibility: A review of shifting focus, paradigms, and methodologies. Journal
of Business Ethics, 101, 343-364. doi:10.1007/s10551-010-0732-6
Tate, W. L., & Bals, L. (2018). Achieving shared triple bottom line (TBL) value creation:
Toward a social resource-based view (SRBV) of the firm. Journal of Business Ethics,
152(3), 803–826.
United States economy at a glance. (2019). Bureau of Labor Statistics. Retrieved from
https://www.bls.gov/eag/eag.us.htm
Urbaniak, G. C., & Plous, S. (2013). Research Randomizer (Version 4.0) [Computer software].
Retrieved from https://www.randomizer.org
Van Der Linden, B., & Freeman, R. E. (2017). Profit and other values: Thick evaluation in
decision making. Business Ethics Quarterly, 27(3), 353-379. doi:10.1017/beq.2017.1

141
Varenova, D., Samy, M., & Combs, A. (2013). Corporate social responsibility and
profitability: trade-off or synergy. Perceptions of executives of FTSE all-share
companies. Sustainability Accounting, Management and Policy Journal. 4(2),
190-215. doi:10.1108/SAMPJ-May-2012-0020
Vashchenko, M. (2017). An external perspective on CSR: What matters and what does not?
Business Ethics: A European Review, 26(4), 396–412. https://doi-
org.ezp.waldenulibrary.org/10.1111/beer.12162
Villarón-Peramato, O., García-Sánchez, I.-M., & Martínez-Ferrero, J. (2018). Capital structure as
a control mechanism of a CSR entrenchment strategy. European Business Review, 30(3),
340–371. doi:10.1108/EBR-03-2017-0056
Visser, W. (2012). The future of CSR: Towards transformative CSR, or CSR 2.0. Kaleidoscope
Futures Paper Series, 1
Walden, J. (2018). Guiding the conversation. Corporate Communications: An International
Journal, 23(3), 423–437. https://doi-org.ezp.waldenulibrary.org/10.1108/CCIJ-06-2017-
0057
Wang, P., Zhongtian, J., Bo, Z., & Chengbo X. (2018) A pricing model for self-help
investigation offline based on multivariate linear regression analysis. (2018). 2018 IEEE
Third International Conference on Data Science in Cyberspace (DSC), Data Science in
Cyberspace (DSC), 2018 IEEE Third International Conference on, DSC, 842. https://doi-
org.ezp.waldenulibrary.org/10.1109/DSC.2018.00135
Welford, R., Chan, C., & Man, M. (2007). Priorities for corporate social responsibility: a survey
of businesses and their stakeholders. Corporate Social Responsibility and Environmental
Management, 15, 52–62.
142
Wiemken, J. (2019). General criteria: Principles of credit ratings. Standard & Poor. Retrieved
from https://www.standardandpoors.com/en_US/web/guest/article/-
/view/type/HTML/id/2168132.
Wong-Fupuy, C., & McGuigan, M. (2018). Best's credit rating methodology. Retrieved from
http://www3.ambest.com/ambv/ratingmethodology/OpenPDF.aspx?rc=250950.
Wood, D. J. (2010). Measuring corporate social performance: A review. International Journal of
Management Reviews, 12(1), 50–84. doi:10.1111/j.14682370.2009.00274.x
Yang, F. J., Lin, C.-W., & Chang, Y.-N. (2009). The linkage between corporate social
performance and corporate financial performance. African Journal of Business
Management, 44, 406–413.
Yim, S., Bae, Y. H., Lim, H., & Kwon, J. (2019). The role of marketing capability in linking
CSR to corporate financial performance: When CSR gives positive signals to
stakeholders. European Journal of Marketing, 53(7), 1333–1354. https://doi-
org.ezp.waldenulibrary.org/10.1108/EJM-08-2017-0526
Yudhoyono, S. B. (2015). Economic growth can complement environmental conservation.
OECD Observer, 58.
Żak, A. (2015). Triple bottom line concept in theory and practice. Research papers of the
Wroclaw University of Economics, (387), 251.
Zou, J. (2015). Selective engagement in corporate social responsibility: A stakeholder
perspective. Frontiers of Business Research in China (Higher Education Press), 9(3),
371–399. https://doi-org.ezp.waldenulibrary.org/10.3868/s070-004-015-0015-3
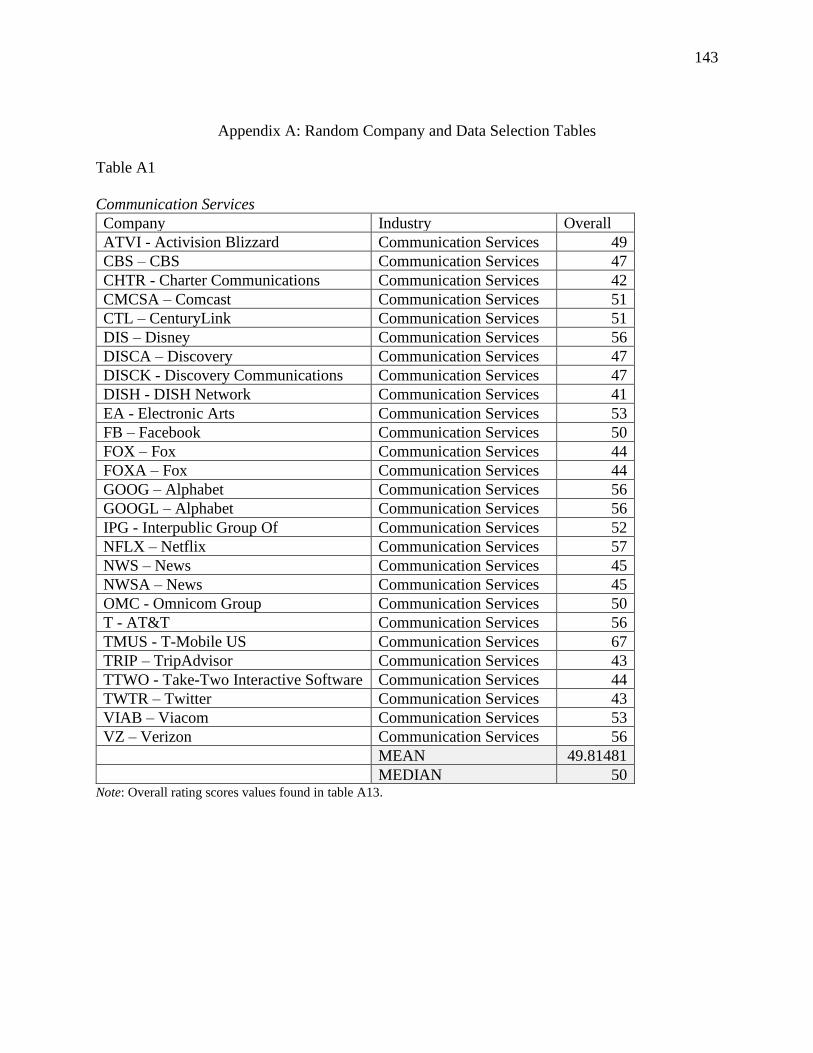
143
Appendix A: Random Company and Data Selection Tables
Table A1
Communication Services
Company Industry Overall
ATVI - Activision Blizzard Communication Services 49
CBS – CBS Communication Services 47
CHTR - Charter Communications Communication Services 42
CMCSA – Comcast Communication Services 51
CTL – CenturyLink Communication Services 51
DIS – Disney Communication Services 56
DISCA – Discovery Communication Services 47
DISCK - Discovery Communications Communication Services 47
DISH - DISH Network Communication Services 41
EA - Electronic Arts Communication Services 53
FB – Facebook Communication Services 50
FOX – Fox Communication Services 44
FOXA – Fox Communication Services 44
GOOG – Alphabet Communication Services 56
GOOGL – Alphabet Communication Services 56
IPG - Interpublic Group Of Communication Services 52
NFLX – Netflix Communication Services 57
NWS – News Communication Services 45
NWSA – News Communication Services 45
OMC - Omnicom Group Communication Services 50
T - AT&T Communication Services 56
TMUS - T-Mobile US Communication Services 67
TRIP – TripAdvisor Communication Services 43
TTWO - Take-Two Interactive Software Communication Services 44
TWTR – Twitter Communication Services 43
VIAB – Viacom Communication Services 53
VZ – Verizon Communication Services 56
MEAN 49.81481
MEDIAN 50 Note: Overall rating scores values found in table A13.
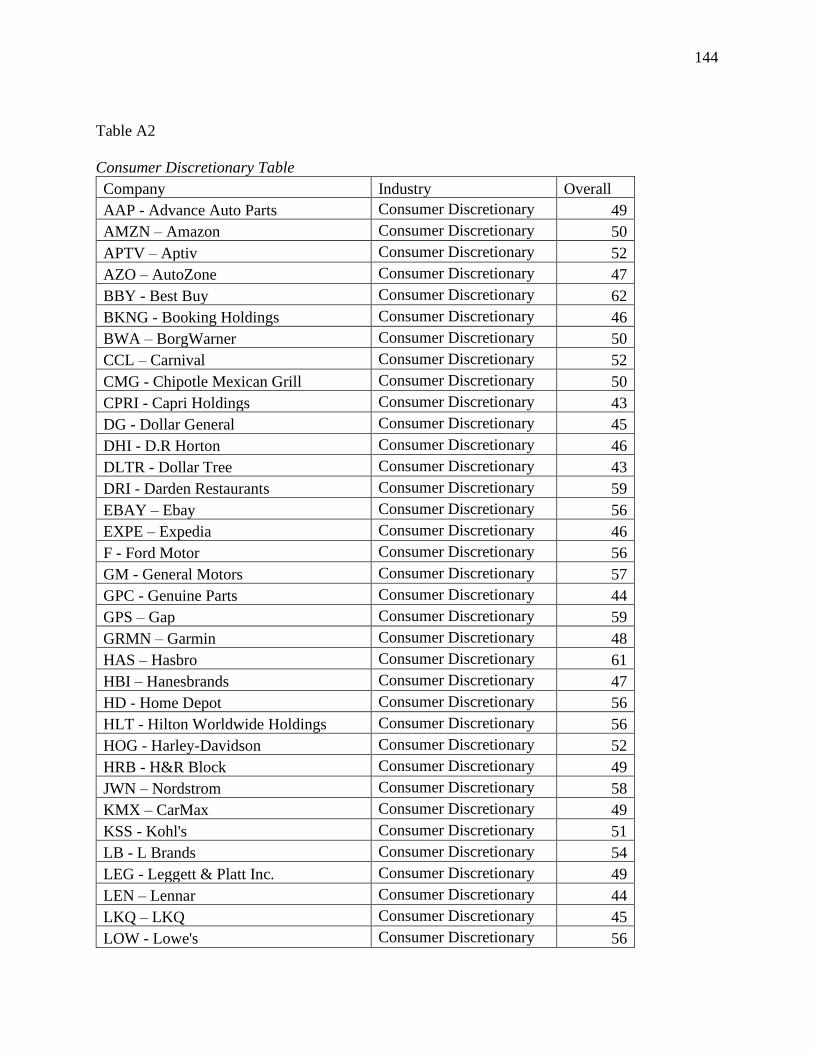
144
Table A2
Consumer Discretionary Table
Company Industry Overall
AAP - Advance Auto Parts Consumer Discretionary 49
AMZN – Amazon Consumer Discretionary 50
APTV – Aptiv Consumer Discretionary 52
AZO – AutoZone Consumer Discretionary 47
BBY - Best Buy Consumer Discretionary 62
BKNG - Booking Holdings Consumer Discretionary 46
BWA – BorgWarner Consumer Discretionary 50
CCL – Carnival Consumer Discretionary 52
CMG - Chipotle Mexican Grill Consumer Discretionary 50
CPRI - Capri Holdings Consumer Discretionary 43
DG - Dollar General Consumer Discretionary 45
DHI - D.R Horton Consumer Discretionary 46
DLTR - Dollar Tree Consumer Discretionary 43
DRI - Darden Restaurants Consumer Discretionary 59
EBAY – Ebay Consumer Discretionary 56
EXPE – Expedia Consumer Discretionary 46
F - Ford Motor Consumer Discretionary 56
GM - General Motors Consumer Discretionary 57
GPC - Genuine Parts Consumer Discretionary 44
GPS – Gap Consumer Discretionary 59
GRMN – Garmin Consumer Discretionary 48
HAS – Hasbro Consumer Discretionary 61
HBI – Hanesbrands Consumer Discretionary 47
HD - Home Depot Consumer Discretionary 56
HLT - Hilton Worldwide Holdings Consumer Discretionary 56
HOG - Harley-Davidson Consumer Discretionary 52
HRB - H&R Block Consumer Discretionary 49
JWN – Nordstrom Consumer Discretionary 58
KMX – CarMax Consumer Discretionary 49
KSS - Kohl's Consumer Discretionary 51
LB - L Brands Consumer Discretionary 54
LEG - Leggett & Platt Inc. Consumer Discretionary 49
LEN – Lennar Consumer Discretionary 44
LKQ – LKQ Consumer Discretionary 45
LOW - Lowe's Consumer Discretionary 56
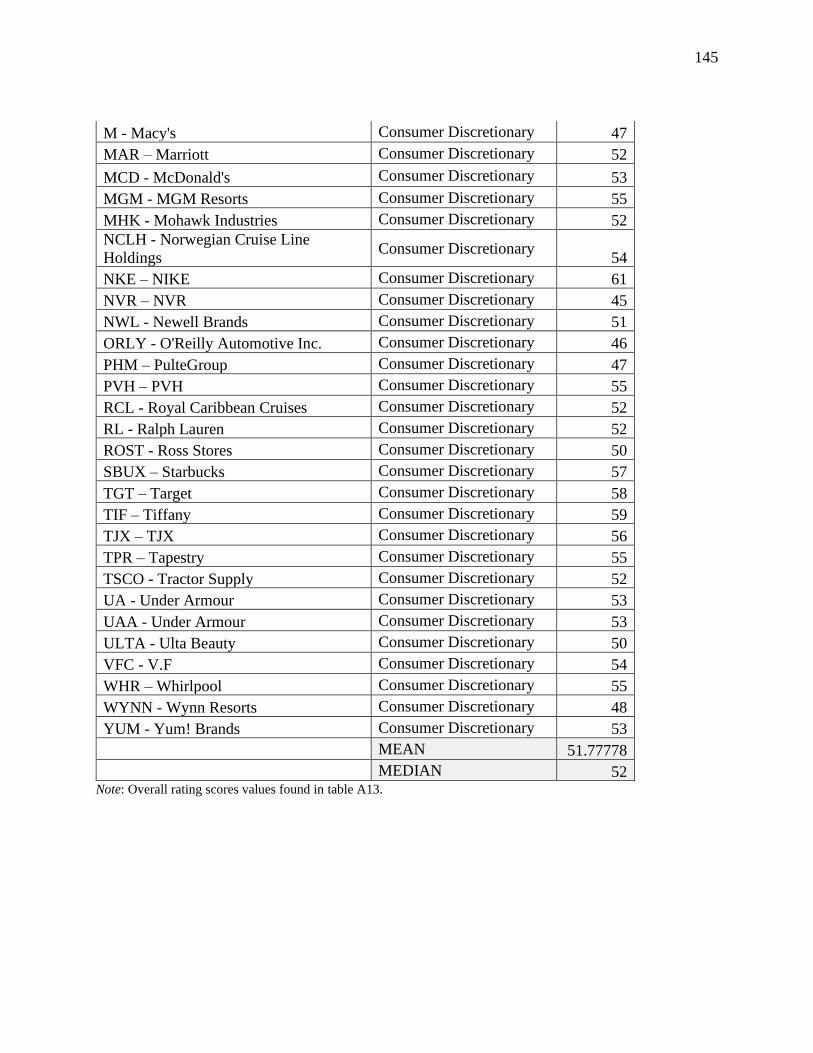
145
M - Macy's Consumer Discretionary 47
MAR – Marriott Consumer Discretionary 52
MCD - McDonald's Consumer Discretionary 53
MGM - MGM Resorts Consumer Discretionary 55
MHK - Mohawk Industries Consumer Discretionary 52
NCLH - Norwegian Cruise Line
Holdings Consumer Discretionary
54
NKE – NIKE Consumer Discretionary 61
NVR – NVR Consumer Discretionary 45
NWL - Newell Brands Consumer Discretionary 51
ORLY - O'Reilly Automotive Inc. Consumer Discretionary 46
PHM – PulteGroup Consumer Discretionary 47
PVH – PVH Consumer Discretionary 55
RCL - Royal Caribbean Cruises Consumer Discretionary 52
RL - Ralph Lauren Consumer Discretionary 52
ROST - Ross Stores Consumer Discretionary 50
SBUX – Starbucks Consumer Discretionary 57
TGT – Target Consumer Discretionary 58
TIF – Tiffany Consumer Discretionary 59
TJX – TJX Consumer Discretionary 56
TPR – Tapestry Consumer Discretionary 55
TSCO - Tractor Supply Consumer Discretionary 52
UA - Under Armour Consumer Discretionary 53
UAA - Under Armour Consumer Discretionary 53
ULTA - Ulta Beauty Consumer Discretionary 50
VFC - V.F Consumer Discretionary 54
WHR – Whirlpool Consumer Discretionary 55
WYNN - Wynn Resorts Consumer Discretionary 48
YUM - Yum! Brands Consumer Discretionary 53
MEAN 51.77778
MEDIAN 52 Note: Overall rating scores values found in table A13.
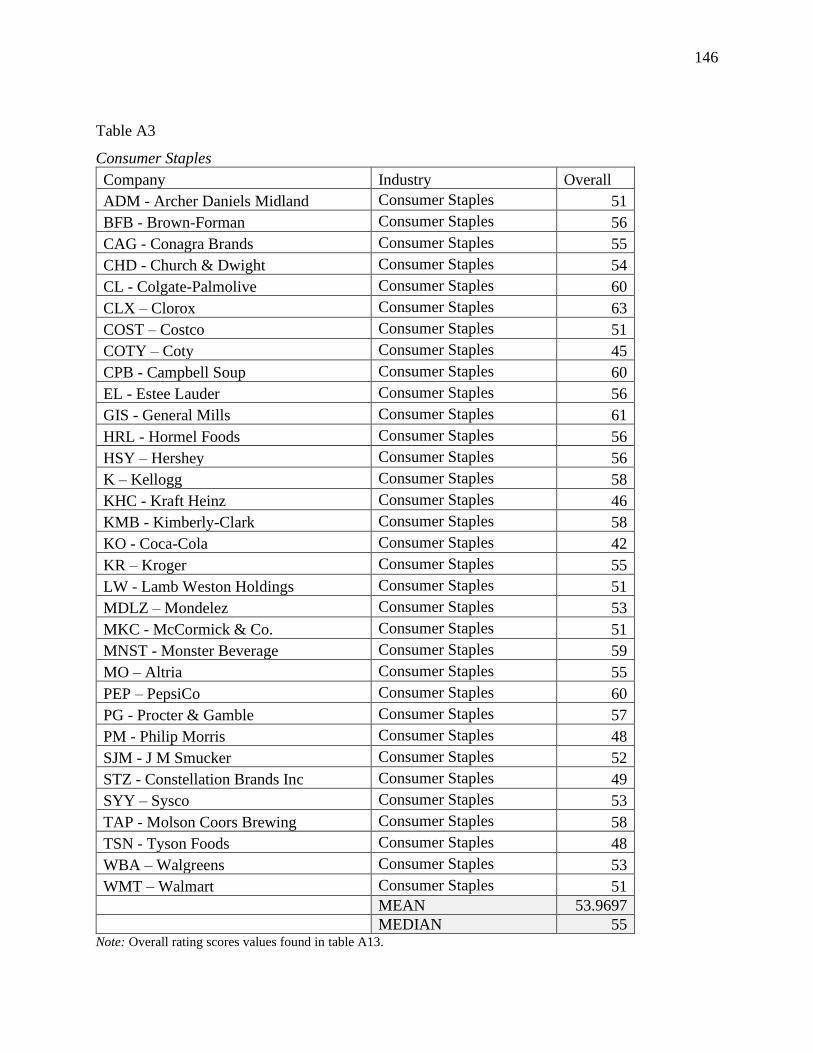
146
Table A3 Consumer Staples
Company Industry Overall
ADM - Archer Daniels Midland Consumer Staples 51
BFB - Brown-Forman Consumer Staples 56
CAG - Conagra Brands Consumer Staples 55
CHD - Church & Dwight Consumer Staples 54
CL - Colgate-Palmolive Consumer Staples 60
CLX – Clorox Consumer Staples 63
COST – Costco Consumer Staples 51
COTY – Coty Consumer Staples 45
CPB - Campbell Soup Consumer Staples 60
EL - Estee Lauder Consumer Staples 56
GIS - General Mills Consumer Staples 61
HRL - Hormel Foods Consumer Staples 56
HSY – Hershey Consumer Staples 56
K – Kellogg Consumer Staples 58
KHC - Kraft Heinz Consumer Staples 46
KMB - Kimberly-Clark Consumer Staples 58
KO - Coca-Cola Consumer Staples 42
KR – Kroger Consumer Staples 55
LW - Lamb Weston Holdings Consumer Staples 51
MDLZ – Mondelez Consumer Staples 53
MKC - McCormick & Co. Consumer Staples 51
MNST - Monster Beverage Consumer Staples 59
MO – Altria Consumer Staples 55
PEP – PepsiCo Consumer Staples 60
PG - Procter & Gamble Consumer Staples 57
PM - Philip Morris Consumer Staples 48
SJM - J M Smucker Consumer Staples 52
STZ - Constellation Brands Inc Consumer Staples 49
SYY – Sysco Consumer Staples 53
TAP - Molson Coors Brewing Consumer Staples 58
TSN - Tyson Foods Consumer Staples 48
WBA – Walgreens Consumer Staples 53
WMT – Walmart Consumer Staples 51
MEAN 53.9697
MEDIAN 55 Note: Overall rating scores values found in table A13.

147
Table A4
Energy
Company Industry Overall
APA – Apache Energy 53
BKR - Baker Hughes Energy 50
COG - Cabot Oil & Gas Energy 45
COP – ConocoPhillips Energy 55
CVX – Chevron Energy 49
CXO - Concho Resources Energy 46
DVN - Devon Energy Energy 50
EOG - EOG Resources Energy 50
FANG - Diamondback Energy Energy 39
FTI – TechnipFMC Energy 63
HAL – Halliburton Energy 50
HES – Hess Energy 55
HFC – HollyFrontier Energy 49
HP - Helmerich & Payne Energy 44
KMI - Kinder Morgan Energy 45
MPC - Marathon Petroleum Energy 56
MRO - Marathon Oil Energy 61
NBL - Noble Energy Energy 49
NOV - National Oilwell Varco Energy 48
OKE – ONEOK Energy 53
OXY - Occidental Petroleum Energy 51
PSX - Phillips 66 Energy 48
PXD - Pioneer Natural Resources Energy 48
SLB – Schlumberger Energy 54
VLO - Valero Energy Energy 46
WMB – Williams Energy 48
XEC - Cimarex Energy Co Energy 47
XOM – Exxon Energy 45
MEAN 49.89286
MEDIAN 49 Note: Overall rating scores values found in table A13.
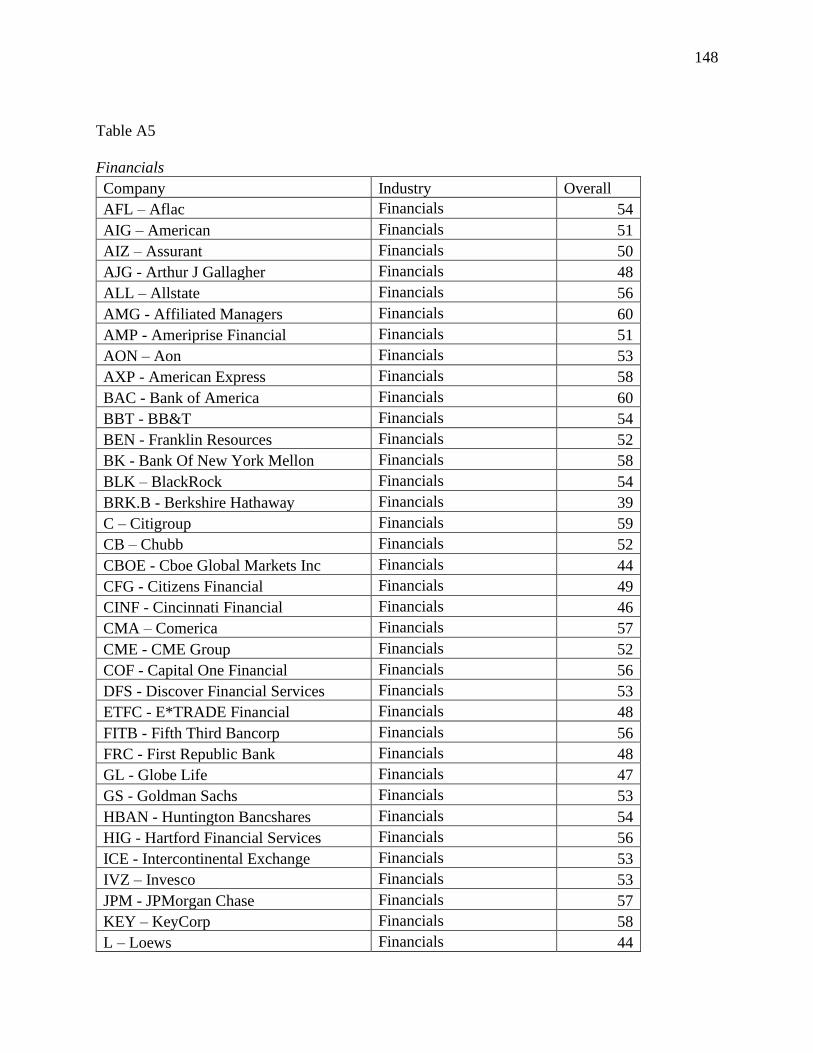
148
Table A5
Financials
Company Industry Overall
AFL – Aflac Financials 54
AIG – American Financials 51
AIZ – Assurant Financials 50
AJG - Arthur J Gallagher Financials 48
ALL – Allstate Financials 56
AMG - Affiliated Managers Financials 60
AMP - Ameriprise Financial Financials 51
AON – Aon Financials 53
AXP - American Express Financials 58
BAC - Bank of America Financials 60
BBT - BB&T Financials 54
BEN - Franklin Resources Financials 52
BK - Bank Of New York Mellon Financials 58
BLK – BlackRock Financials 54
BRK.B - Berkshire Hathaway Financials 39
C – Citigroup Financials 59
CB – Chubb Financials 52
CBOE - Cboe Global Markets Inc Financials 44
CFG - Citizens Financial Financials 49
CINF - Cincinnati Financial Financials 46
CMA – Comerica Financials 57
CME - CME Group Financials 52
COF - Capital One Financial Financials 56
DFS - Discover Financial Services Financials 53
ETFC - E*TRADE Financial Financials 48
FITB - Fifth Third Bancorp Financials 56
FRC - First Republic Bank Financials 48
GL - Globe Life Financials 47
GS - Goldman Sachs Financials 53
HBAN - Huntington Bancshares Financials 54
HIG - Hartford Financial Services Financials 56
ICE - Intercontinental Exchange Financials 53
IVZ – Invesco Financials 53
JPM - JPMorgan Chase Financials 57
KEY – KeyCorp Financials 58
L – Loews Financials 44
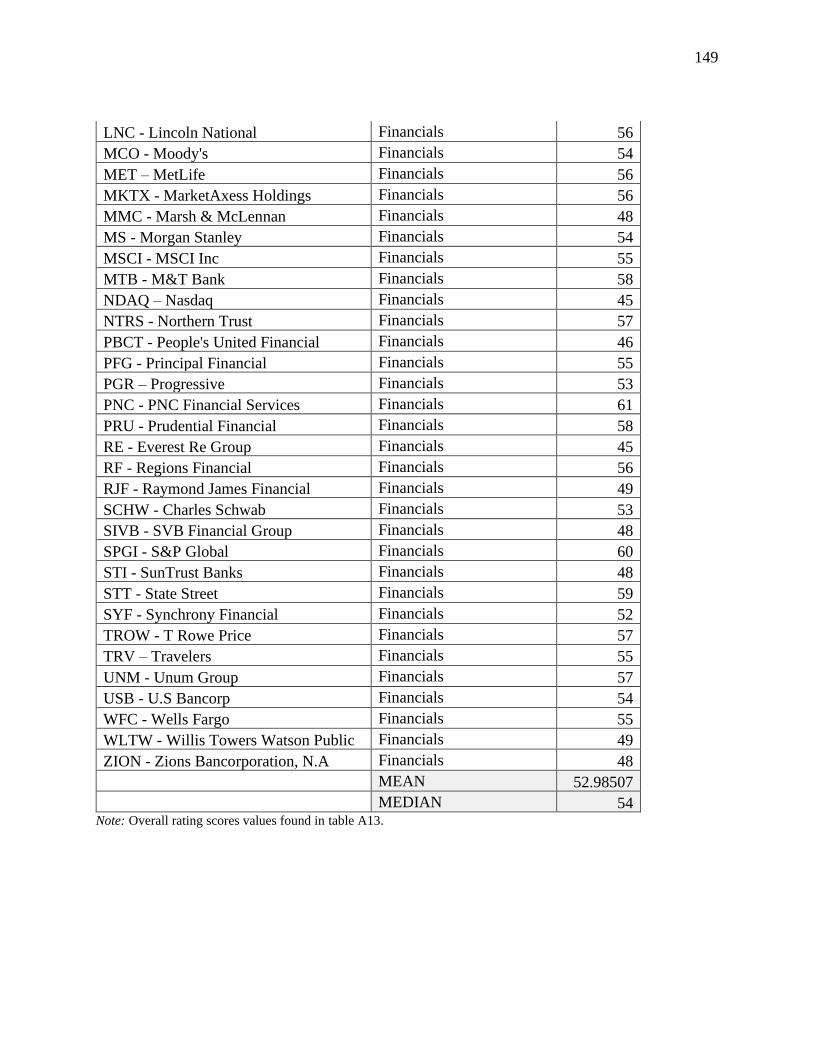
149
LNC - Lincoln National Financials 56
MCO - Moody's Financials 54
MET – MetLife Financials 56
MKTX - MarketAxess Holdings Financials 56
MMC - Marsh & McLennan Financials 48
MS - Morgan Stanley Financials 54
MSCI - MSCI Inc Financials 55
MTB - M&T Bank Financials 58
NDAQ – Nasdaq Financials 45
NTRS - Northern Trust Financials 57
PBCT - People's United Financial Financials 46
PFG - Principal Financial Financials 55
PGR – Progressive Financials 53
PNC - PNC Financial Services Financials 61
PRU - Prudential Financial Financials 58
RE - Everest Re Group Financials 45
RF - Regions Financial Financials 56
RJF - Raymond James Financial Financials 49
SCHW - Charles Schwab Financials 53
SIVB - SVB Financial Group Financials 48
SPGI - S&P Global Financials 60
STI - SunTrust Banks Financials 48
STT - State Street Financials 59
SYF - Synchrony Financial Financials 52
TROW - T Rowe Price Financials 57
TRV – Travelers Financials 55
UNM - Unum Group Financials 57
USB - U.S Bancorp Financials 54
WFC - Wells Fargo Financials 55
WLTW - Willis Towers Watson Public Financials 49
ZION - Zions Bancorporation, N.A Financials 48
MEAN 52.98507
MEDIAN 54 Note: Overall rating scores values found in table A13.
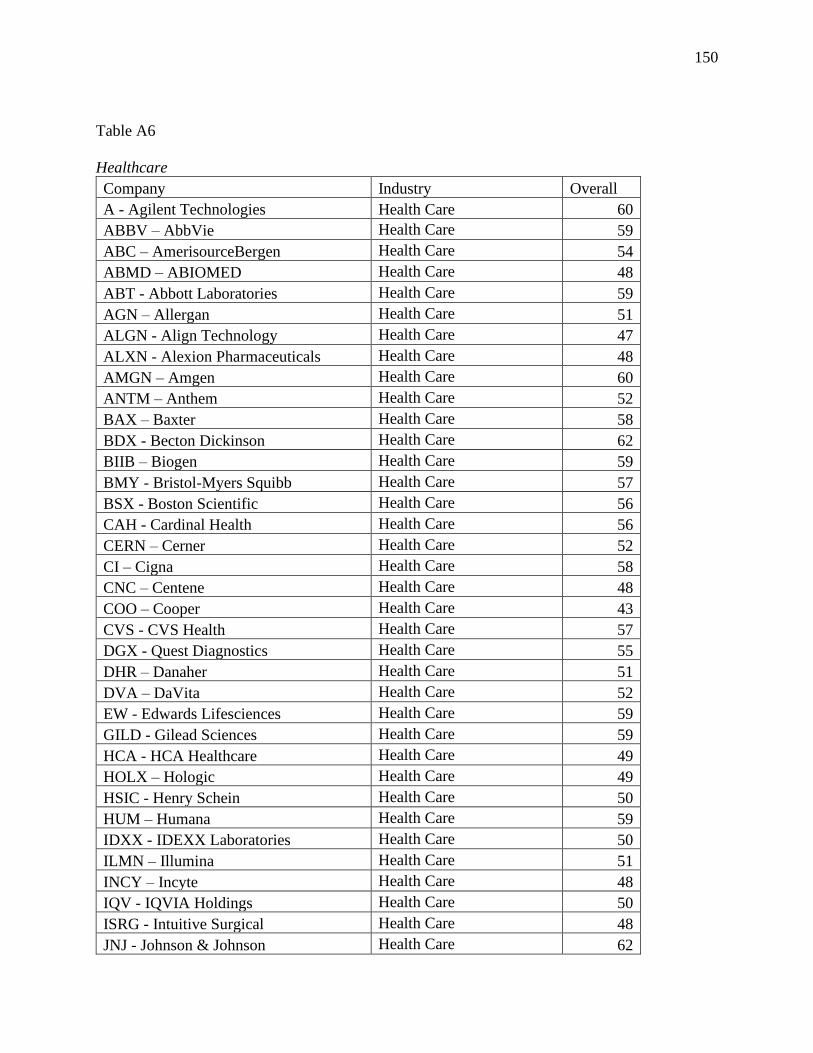
150
Table A6
Healthcare
Company Industry Overall
A - Agilent Technologies Health Care 60
ABBV – AbbVie Health Care 59
ABC – AmerisourceBergen Health Care 54
ABMD – ABIOMED Health Care 48
ABT - Abbott Laboratories Health Care 59
AGN – Allergan Health Care 51
ALGN - Align Technology Health Care 47
ALXN - Alexion Pharmaceuticals Health Care 48
AMGN – Amgen Health Care 60
ANTM – Anthem Health Care 52
BAX – Baxter Health Care 58
BDX - Becton Dickinson Health Care 62
BIIB – Biogen Health Care 59
BMY - Bristol-Myers Squibb Health Care 57
BSX - Boston Scientific Health Care 56
CAH - Cardinal Health Health Care 56
CERN – Cerner Health Care 52
CI – Cigna Health Care 58
CNC – Centene Health Care 48
COO – Cooper Health Care 43
CVS - CVS Health Health Care 57
DGX - Quest Diagnostics Health Care 55
DHR – Danaher Health Care 51
DVA – DaVita Health Care 52
EW - Edwards Lifesciences Health Care 59
GILD - Gilead Sciences Health Care 59
HCA - HCA Healthcare Health Care 49
HOLX – Hologic Health Care 49
HSIC - Henry Schein Health Care 50
HUM – Humana Health Care 59
IDXX - IDEXX Laboratories Health Care 50
ILMN – Illumina Health Care 51
INCY – Incyte Health Care 48
IQV - IQVIA Holdings Health Care 50
ISRG - Intuitive Surgical Health Care 48
JNJ - Johnson & Johnson Health Care 62

151
LH - Laboratory of America Holdings Health Care 49
LLY - Eli Lilly Health Care 58
MCK – McKesson Health Care 48
MDT – Medtronic Health Care 53
MRK – Merck Health Care 47
MTD - Mettler-Toledo Health Care 48
MYL – Mylan Health Care 53
NKTR – Nektar Health Care 60
PFE – Pfizer Health Care 56
PKI – PerkinElmer Health Care 54
PRGO – Perrigo Health Care 51
REGN - Regeneron Pharmaceuticals Health Care 52
RMD – ResMed Health Care 54
SYK – Stryker Health Care 51
TFX – Teleflex Health Care 47
TMO - Thermo Fisher Scientific Health Care 56
UHS - Universal Health Services Health Care 42
UNH - UnitedHealth Group Health Care 53
VAR - Varian Medical Systems Health Care 54
VRTX - Vertex Pharmaceuticals Health Care 49
WAT – Waters Health Care 51
WCG - WellCare Health Plans Health Care 49
XRAY - DENTSPLY SIRONA Health Care 52
ZBH - Zimmer Biomet Holdings Health Care 51
ZTS – Zoetis Health Care 51
MEAN 52.86885
MEDIAN 52 Note: Overall rating scores values found in table A13.
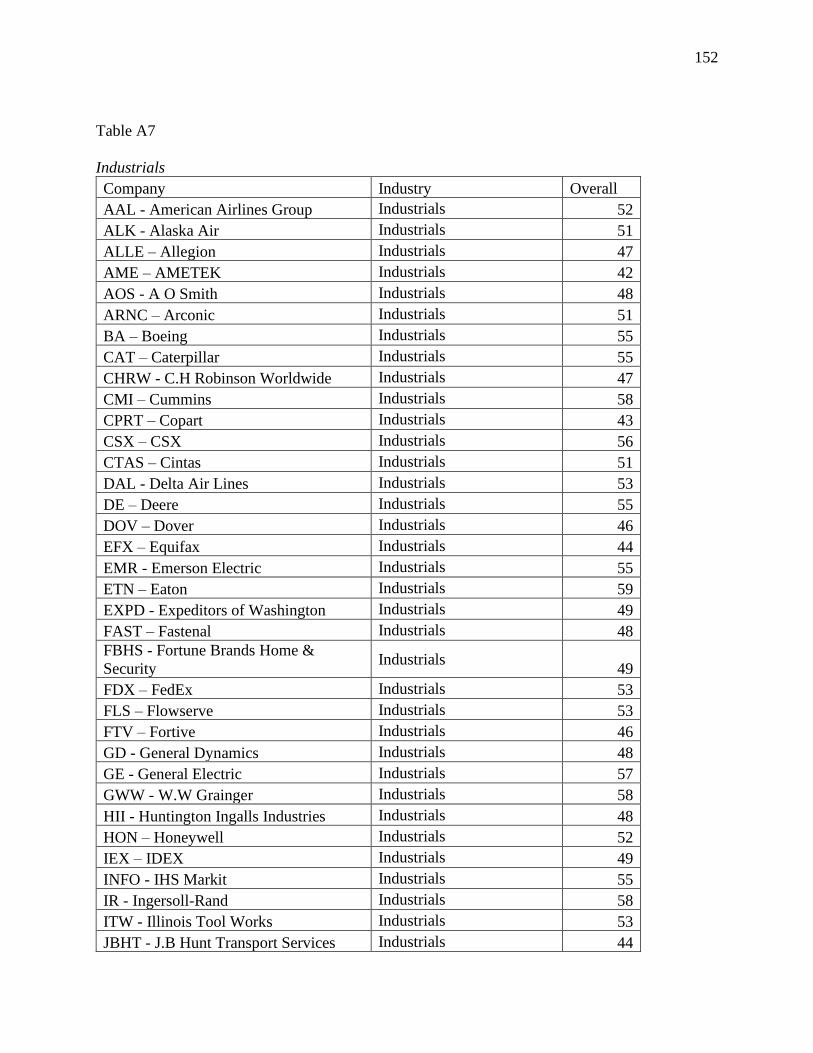
152
Table A7
Industrials
Company Industry Overall
AAL - American Airlines Group Industrials 52
ALK - Alaska Air Industrials 51
ALLE – Allegion Industrials 47
AME – AMETEK Industrials 42
AOS - A O Smith Industrials 48
ARNC – Arconic Industrials 51
BA – Boeing Industrials 55
CAT – Caterpillar Industrials 55
CHRW - C.H Robinson Worldwide Industrials 47
CMI – Cummins Industrials 58
CPRT – Copart Industrials 43
CSX – CSX Industrials 56
CTAS – Cintas Industrials 51
DAL - Delta Air Lines Industrials 53
DE – Deere Industrials 55
DOV – Dover Industrials 46
EFX – Equifax Industrials 44
EMR - Emerson Electric Industrials 55
ETN – Eaton Industrials 59
EXPD - Expeditors of Washington Industrials 49
FAST – Fastenal Industrials 48
FBHS - Fortune Brands Home &
Security Industrials
49
FDX – FedEx Industrials 53
FLS – Flowserve Industrials 53
FTV – Fortive Industrials 46
GD - General Dynamics Industrials 48
GE - General Electric Industrials 57
GWW - W.W Grainger Industrials 58
HII - Huntington Ingalls Industries Industrials 48
HON – Honeywell Industrials 52
IEX – IDEX Industrials 49
INFO - IHS Markit Industrials 55
IR - Ingersoll-Rand Industrials 58
ITW - Illinois Tool Works Industrials 53
JBHT - J.B Hunt Transport Services Industrials 44
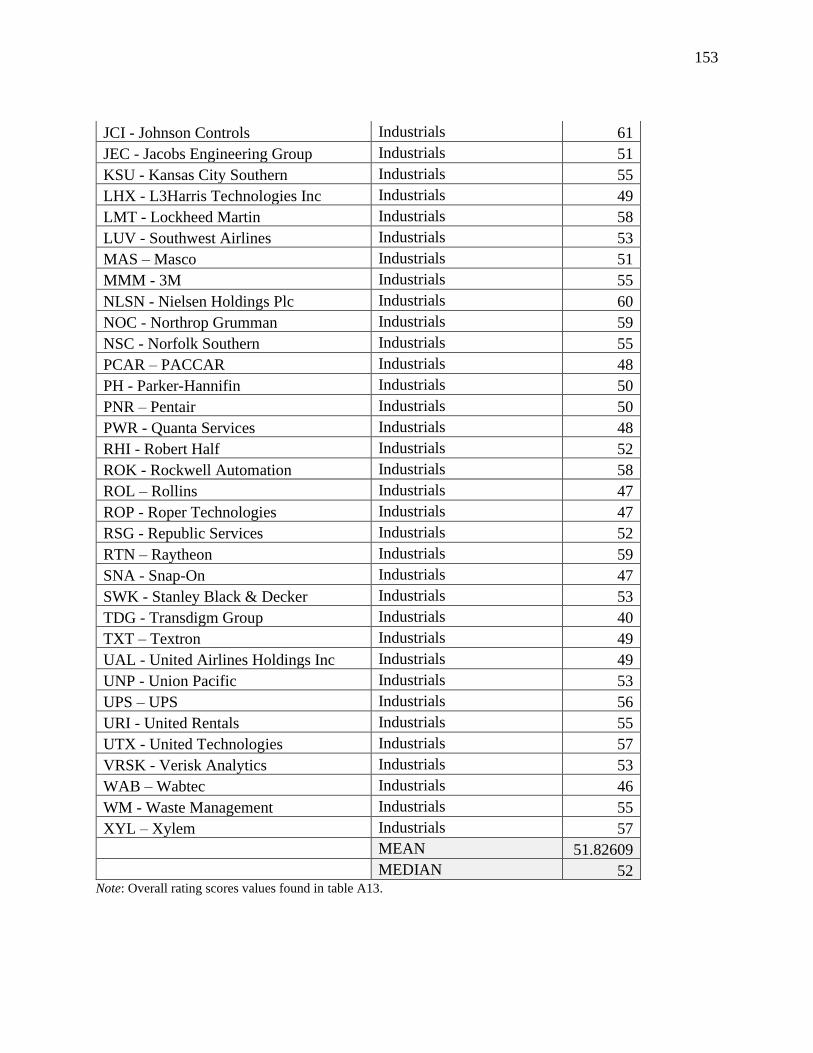
153
JCI - Johnson Controls Industrials 61
JEC - Jacobs Engineering Group Industrials 51
KSU - Kansas City Southern Industrials 55
LHX - L3Harris Technologies Inc Industrials 49
LMT - Lockheed Martin Industrials 58
LUV - Southwest Airlines Industrials 53
MAS – Masco Industrials 51
MMM - 3M Industrials 55
NLSN - Nielsen Holdings Plc Industrials 60
NOC - Northrop Grumman Industrials 59
NSC - Norfolk Southern Industrials 55
PCAR – PACCAR Industrials 48
PH - Parker-Hannifin Industrials 50
PNR – Pentair Industrials 50
PWR - Quanta Services Industrials 48
RHI - Robert Half Industrials 52
ROK - Rockwell Automation Industrials 58
ROL – Rollins Industrials 47
ROP - Roper Technologies Industrials 47
RSG - Republic Services Industrials 52
RTN – Raytheon Industrials 59
SNA - Snap-On Industrials 47
SWK - Stanley Black & Decker Industrials 53
TDG - Transdigm Group Industrials 40
TXT – Textron Industrials 49
UAL - United Airlines Holdings Inc Industrials 49
UNP - Union Pacific Industrials 53
UPS – UPS Industrials 56
URI - United Rentals Industrials 55
UTX - United Technologies Industrials 57
VRSK - Verisk Analytics Industrials 53
WAB – Wabtec Industrials 46
WM - Waste Management Industrials 55
XYL – Xylem Industrials 57
MEAN 51.82609
MEDIAN 52 Note: Overall rating scores values found in table A13.

154
Table A8
Information Technology
Company Industry Overall
AAPL – Apple Information Technology 58
ACN – Accenture Information Technology 64
ADBE – Adobe Information Technology 59
ADI - Analog Devices Information Technology 55
ADP – ADP Information Technology 59
ADS - Alliance Data Systems Information Technology 52
ADSK – Autodesk Information Technology 58
AKAM - Akamai Technologies Information Technology 54
AMAT - Applied Materials Information Technology 60
AMD – AMD Information Technology 55
ANET - Arista Networks Information Technology 48
ANSS – ANSYS Information Technology 51
APH – Amphenol Information Technology 46
AVGO – Broadcom Information Technology 46
BR - Broadridge Financial Solutions Information Technology 49
CDNS - Cadence Design Systems Information Technology 49
CDW – CDW Information Technology 51
CRM - Salesforce, Inc Information Technology 57
CSCO – Cisco Information Technology 63
CRM - Salesforce, Inc Information Technology 58
CTSH - Cognizant Technology
Solutions Information Technology
54
CTXS - Citrix Systems Information Technology 54
DXC - DXC Technology Information Technology 55
FFIV - F5 Networks Information Technology 49
FIS - Fidelity National Information
Services Information Technology
47
FISV – Fiserv Information Technology 47
FLIR - FLIR Systems Information Technology 45
FLT - FleetCor Technologies Information Technology 43
FTNT – Fortinet Information Technology 50
GLW – Corning Information Technology 55
GPN - Global Payments Information Technology 44
HPE - Hewlett Packard Enterprise Information Technology 57
HPQ – HP Information Technology 63
IBM – IBM Information Technology 60
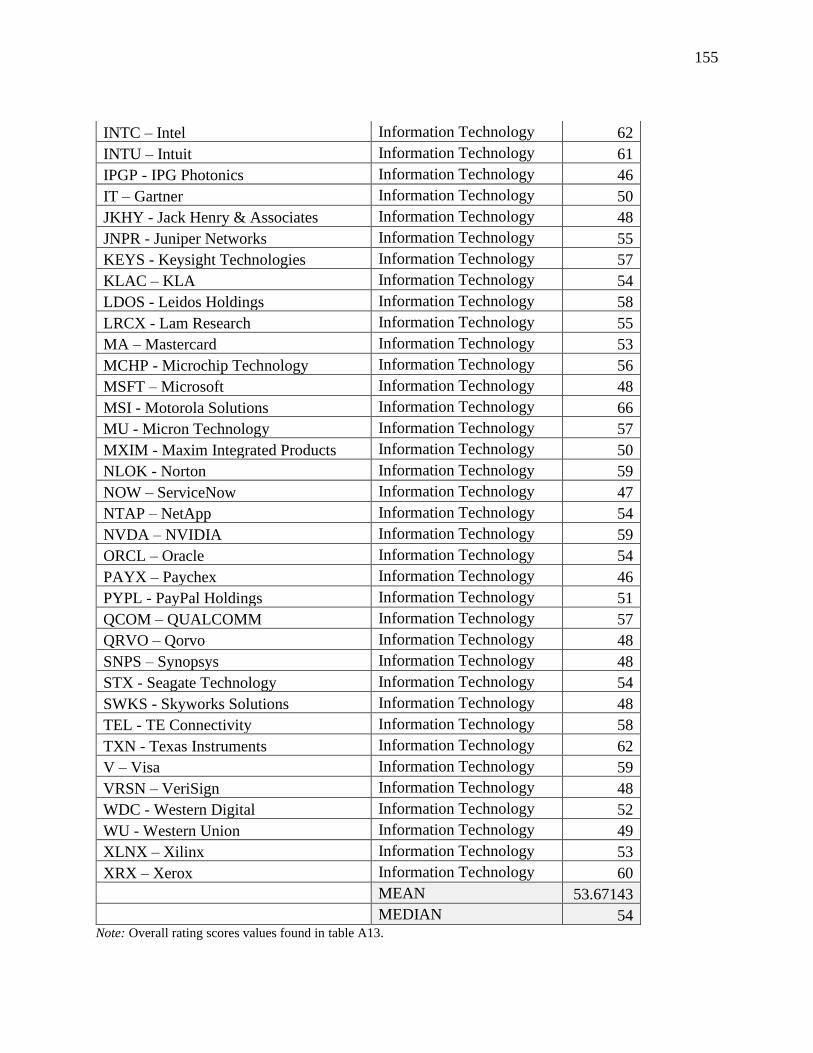
155
INTC – Intel Information Technology 62
INTU – Intuit Information Technology 61
IPGP - IPG Photonics Information Technology 46
IT – Gartner Information Technology 50
JKHY - Jack Henry & Associates Information Technology 48
JNPR - Juniper Networks Information Technology 55
KEYS - Keysight Technologies Information Technology 57
KLAC – KLA Information Technology 54
LDOS - Leidos Holdings Information Technology 58
LRCX - Lam Research Information Technology 55
MA – Mastercard Information Technology 53
MCHP - Microchip Technology Information Technology 56
MSFT – Microsoft Information Technology 48
MSI - Motorola Solutions Information Technology 66
MU - Micron Technology Information Technology 57
MXIM - Maxim Integrated Products Information Technology 50
NLOK - Norton Information Technology 59
NOW – ServiceNow Information Technology 47
NTAP – NetApp Information Technology 54
NVDA – NVIDIA Information Technology 59
ORCL – Oracle Information Technology 54
PAYX – Paychex Information Technology 46
PYPL - PayPal Holdings Information Technology 51
QCOM – QUALCOMM Information Technology 57
QRVO – Qorvo Information Technology 48
SNPS – Synopsys Information Technology 48
STX - Seagate Technology Information Technology 54
SWKS - Skyworks Solutions Information Technology 48
TEL - TE Connectivity Information Technology 58
TXN - Texas Instruments Information Technology 62
V – Visa Information Technology 59
VRSN – VeriSign Information Technology 48
WDC - Western Digital Information Technology 52
WU - Western Union Information Technology 49
XLNX – Xilinx Information Technology 53
XRX – Xerox Information Technology 60
MEAN 53.67143
MEDIAN 54 Note: Overall rating scores values found in table A13.
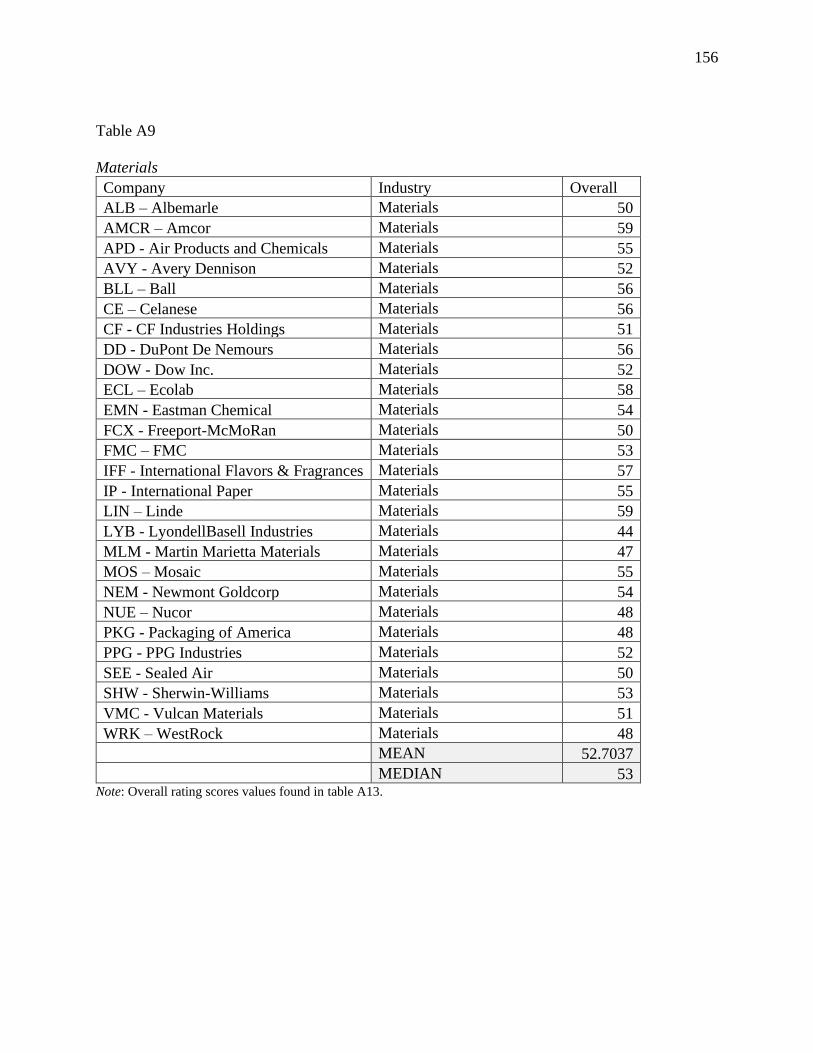
156
Table A9
Materials
Company Industry Overall
ALB – Albemarle Materials 50
AMCR – Amcor Materials 59
APD - Air Products and Chemicals Materials 55
AVY - Avery Dennison Materials 52
BLL – Ball Materials 56
CE – Celanese Materials 56
CF - CF Industries Holdings Materials 51
DD - DuPont De Nemours Materials 56
DOW - Dow Inc. Materials 52
ECL – Ecolab Materials 58
EMN - Eastman Chemical Materials 54
FCX - Freeport-McMoRan Materials 50
FMC – FMC Materials 53
IFF - International Flavors & Fragrances Materials 57
IP - International Paper Materials 55
LIN – Linde Materials 59
LYB - LyondellBasell Industries Materials 44
MLM - Martin Marietta Materials Materials 47
MOS – Mosaic Materials 55
NEM - Newmont Goldcorp Materials 54
NUE – Nucor Materials 48
PKG - Packaging of America Materials 48
PPG - PPG Industries Materials 52
SEE - Sealed Air Materials 50
SHW - Sherwin-Williams Materials 53
VMC - Vulcan Materials Materials 51
WRK – WestRock Materials 48
MEAN 52.7037
MEDIAN 53 Note: Overall rating scores values found in table A13.
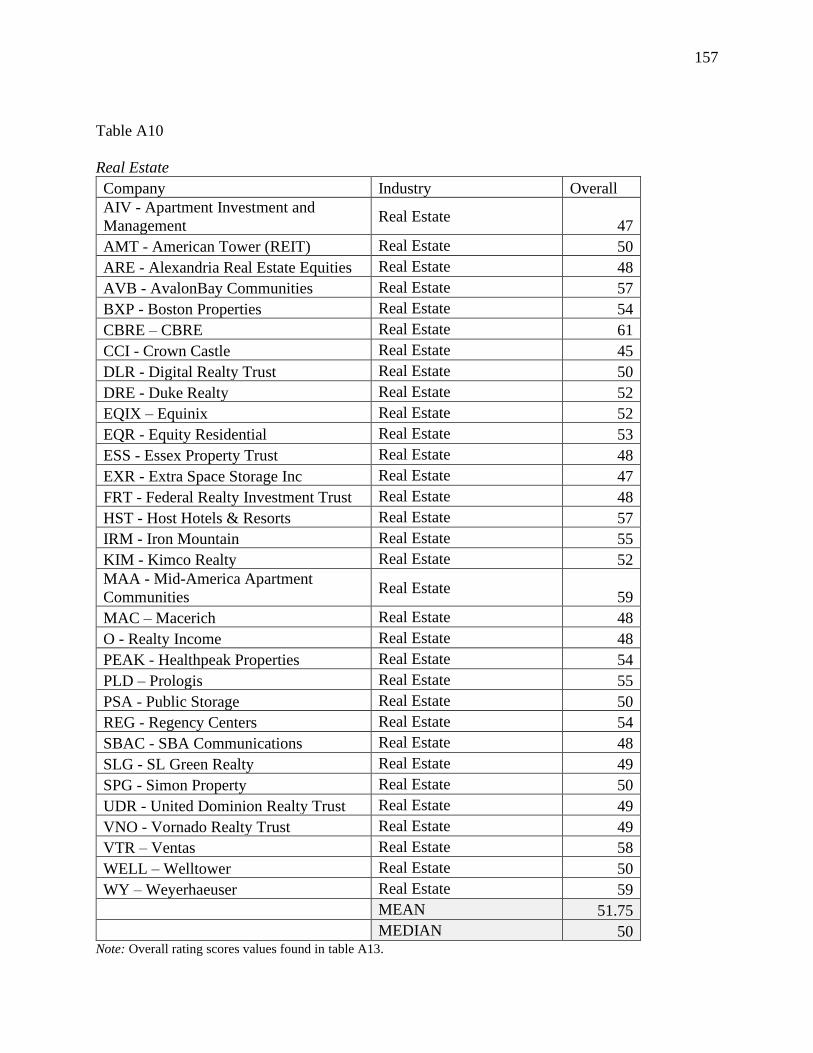
157
Table A10
Real Estate
Company Industry Overall
AIV - Apartment Investment and
Management Real Estate
47
AMT - American Tower (REIT) Real Estate 50
ARE - Alexandria Real Estate Equities Real Estate 48
AVB - AvalonBay Communities Real Estate 57
BXP - Boston Properties Real Estate 54
CBRE – CBRE Real Estate 61
CCI - Crown Castle Real Estate 45
DLR - Digital Realty Trust Real Estate 50
DRE - Duke Realty Real Estate 52
EQIX – Equinix Real Estate 52
EQR - Equity Residential Real Estate 53
ESS - Essex Property Trust Real Estate 48
EXR - Extra Space Storage Inc Real Estate 47
FRT - Federal Realty Investment Trust Real Estate 48
HST - Host Hotels & Resorts Real Estate 57
IRM - Iron Mountain Real Estate 55
KIM - Kimco Realty Real Estate 52
MAA - Mid-America Apartment
Communities Real Estate
59
MAC – Macerich Real Estate 48
O - Realty Income Real Estate 48
PEAK - Healthpeak Properties Real Estate 54
PLD – Prologis Real Estate 55
PSA - Public Storage Real Estate 50
REG - Regency Centers Real Estate 54
SBAC - SBA Communications Real Estate 48
SLG - SL Green Realty Real Estate 49
SPG - Simon Property Real Estate 50
UDR - United Dominion Realty Trust Real Estate 49
VNO - Vornado Realty Trust Real Estate 49
VTR – Ventas Real Estate 58
WELL – Welltower Real Estate 50
WY – Weyerhaeuser Real Estate 59
MEAN 51.75
MEDIAN 50 Note: Overall rating scores values found in table A13.
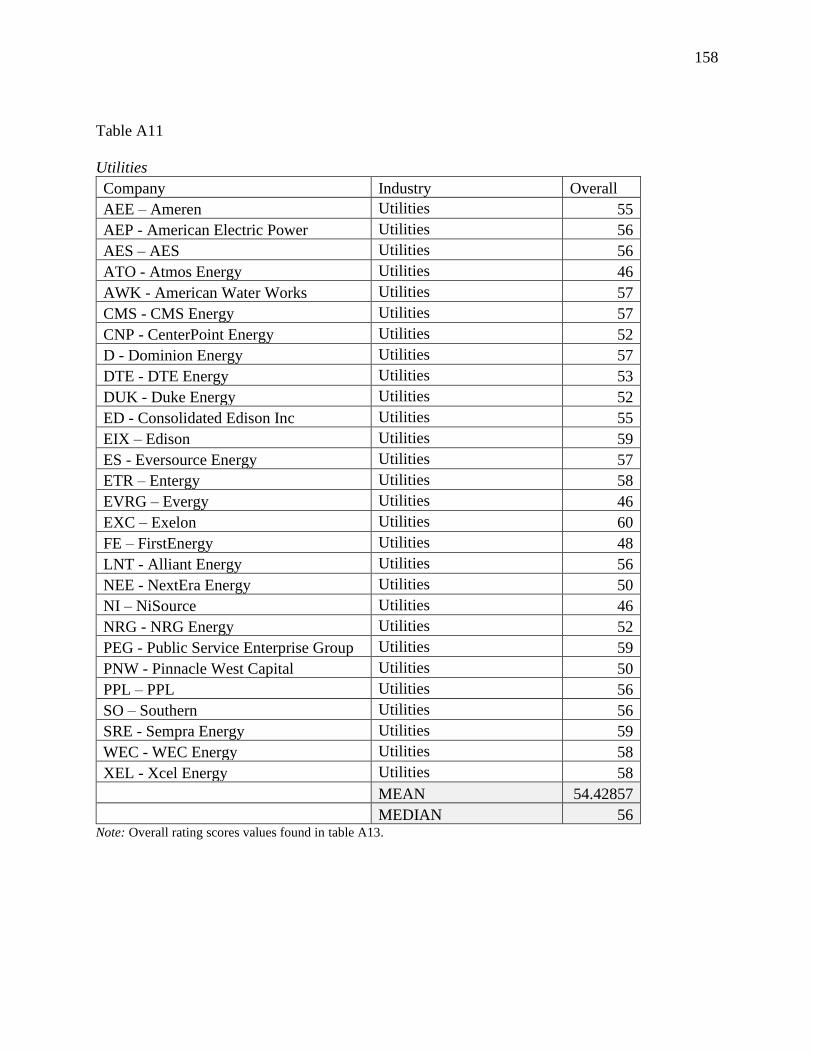
158
Table A11
Utilities
Company Industry Overall
AEE – Ameren Utilities 55
AEP - American Electric Power Utilities 56
AES – AES Utilities 56
ATO - Atmos Energy Utilities 46
AWK - American Water Works Utilities 57
CMS - CMS Energy Utilities 57
CNP - CenterPoint Energy Utilities 52
D - Dominion Energy Utilities 57
DTE - DTE Energy Utilities 53
DUK - Duke Energy Utilities 52
ED - Consolidated Edison Inc Utilities 55
EIX – Edison Utilities 59
ES - Eversource Energy Utilities 57
ETR – Entergy Utilities 58
EVRG – Evergy Utilities 46
EXC – Exelon Utilities 60
FE – FirstEnergy Utilities 48
LNT - Alliant Energy Utilities 56
NEE - NextEra Energy Utilities 50
NI – NiSource Utilities 46
NRG - NRG Energy Utilities 52
PEG - Public Service Enterprise Group Utilities 59
PNW - Pinnacle West Capital Utilities 50
PPL – PPL Utilities 56
SO – Southern Utilities 56
SRE - Sempra Energy Utilities 59
WEC - WEC Energy Utilities 58
XEL - Xcel Energy Utilities 58
MEAN 54.42857
MEDIAN 56 Note: Overall rating scores values found in table A13.

159
Table A12
Industry Sector by Mean and Median
Industry Sector Mean Industry Sector Median
Utilities 54.42857 Utilities 56
Consumer Staples 53.96969 Consumer Staples 55
Information Technology 53.67142 Information Technology 54
Financials 52.98507 Financials 54
Health Care 52.86885 Materials 53
Materials 52.7037 Industrials 52
Industrials 51.82608 Health Care 52
Consumer Discretionary 51.77777 Consumer Discretionary 52
Real Estate 51.75 Real Estate 50
Energy 49.89285 Communication Services 50
Communication Services 49.814814 Energy 49 Note: Overall rating scores values found in table A13.
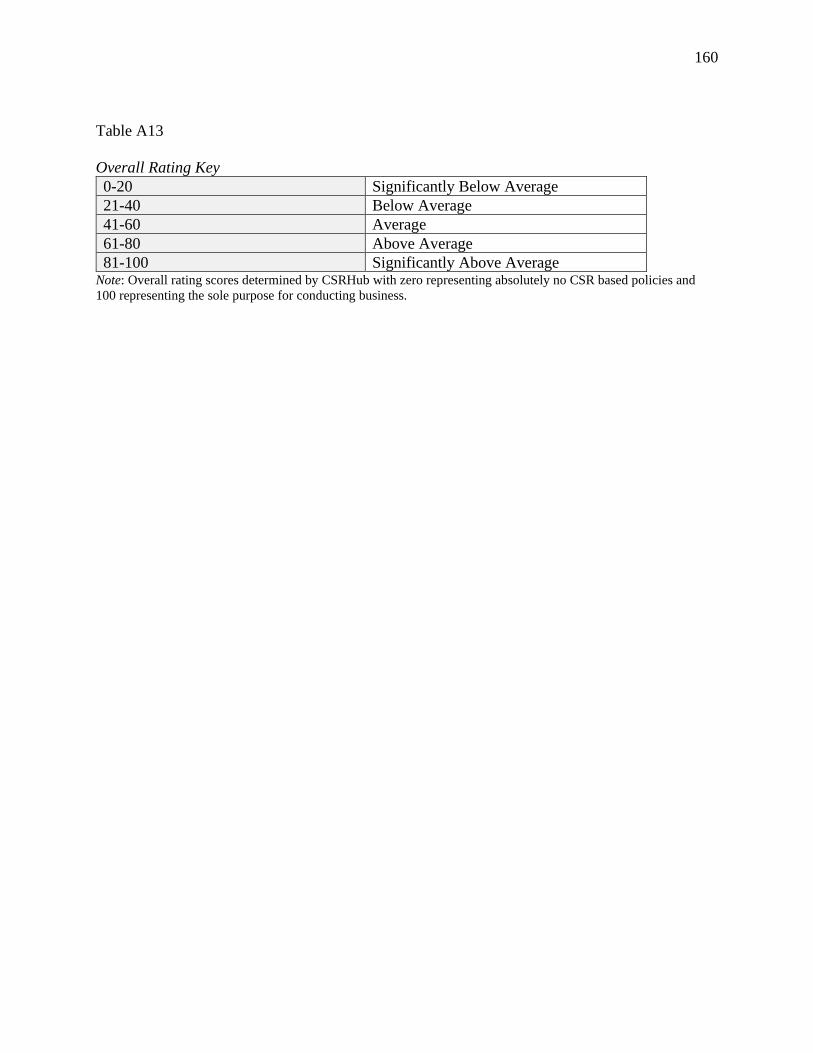
160
Table A13
Overall Rating Key
0-20 Significantly Below Average
21-40 Below Average
41-60 Average
61-80 Above Average
81-100 Significantly Above Average Note: Overall rating scores determined by CSRHub with zero representing absolutely no CSR based policies and
100 representing the sole purpose for conducting business.
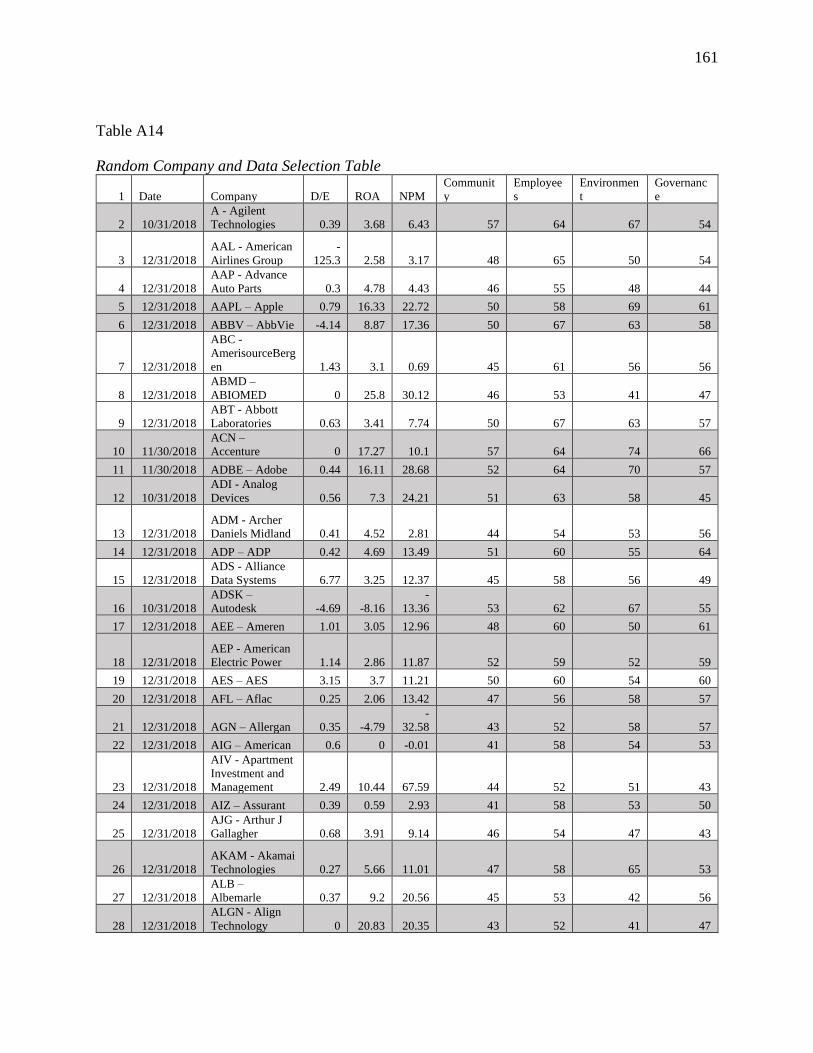
161
Table A14
Random Company and Data Selection Table
1 Date Company D/E ROA NPM
Communit
y
Employee
s
Environmen
t
Governanc
e
2 10/31/2018
A - Agilent
Technologies 0.39 3.68 6.43 57 64 67 54
3 12/31/2018
AAL - American
Airlines Group
-
125.3 2.58 3.17 48 65 50 54
4 12/31/2018
AAP - Advance
Auto Parts 0.3 4.78 4.43 46 55 48 44
5 12/31/2018 AAPL – Apple 0.79 16.33 22.72 50 58 69 61
6 12/31/2018 ABBV – AbbVie -4.14 8.87 17.36 50 67 63 58
7 12/31/2018
ABC -
AmerisourceBerg
en 1.43 3.1 0.69 45 61 56 56
8 12/31/2018
ABMD –
ABIOMED 0 25.8 30.12 46 53 41 47
9 12/31/2018
ABT - Abbott
Laboratories 0.63 3.41 7.74 50 67 63 57
10 11/30/2018
ACN –
Accenture 0 17.27 10.1 57 64 74 66
11 11/30/2018 ADBE – Adobe 0.44 16.11 28.68 52 64 70 57
12 10/31/2018
ADI - Analog
Devices 0.56 7.3 24.21 51 63 58 45
13 12/31/2018
ADM - Archer
Daniels Midland 0.41 4.52 2.81 44 54 53 56
14 12/31/2018 ADP – ADP 0.42 4.69 13.49 51 60 55 64
15 12/31/2018
ADS - Alliance
Data Systems 6.77 3.25 12.37 45 58 56 49
16 10/31/2018
ADSK –
Autodesk -4.69 -8.16
-
13.36 53 62 67 55
17 12/31/2018 AEE – Ameren 1.01 3.05 12.96 48 60 50 61
18 12/31/2018
AEP - American
Electric Power 1.14 2.86 11.87 52 59 52 59
19 12/31/2018 AES – AES 3.15 3.7 11.21 50 60 54 60
20 12/31/2018 AFL – Aflac 0.25 2.06 13.42 47 56 58 57
21 12/31/2018 AGN – Allergan 0.35 -4.79
-
32.58 43 52 58 57
22 12/31/2018 AIG – American 0.6 0 -0.01 41 58 54 53
23 12/31/2018
AIV - Apartment
Investment and
Management 2.49 10.44 67.59 44 52 51 43
24 12/31/2018 AIZ – Assurant 0.39 0.59 2.93 41 58 53 50
25 12/31/2018
AJG - Arthur J
Gallagher 0.68 3.91 9.14 46 54 47 43
26 12/31/2018
AKAM - Akamai
Technologies 0.27 5.66 11.01 47 58 65 53
27 12/31/2018
ALB –
Albemarle 0.37 9.2 20.56 45 53 42 56
28 12/31/2018
ALGN - Align
Technology 0 20.83 20.35 43 52 41 47

162
29 12/31/2018
ALK - Alaska
Air 0.43 4 5.29 47 62 40 45
30 12/31/2018 ALL – Allstate 0.33 1.86 5.28 48 61 63 55
31 12/31/2018 ALLE – Allegion 2.16 16.11 15.92 46 48 45 50
32 12/31/2018
ALXN - Alexion
Pharmaceuticals 0.31 0.57 1.89 47 52 47 45
33 10/31/2018
AMAT - Applied
Materials 0.78 17.99 19.2 54 53 62 63
34 6/30/2018 AMCR – Amcor 0 7.92 4.88 53 62 62 62
35 12/31/2018 AMD – AMD 0.88 8.04 5.2 48 63 60 52
36 12/31/2018
AME –
AMETEK 0.54 9.44 16.05 41 46 41 40
37 12/31/2018
AMG - Affiliated
Managers 0.44 2.88 10.26 50 72 49 65
38 12/31/2018 AMGN – Amgen 2.36 12.32 35.35 53 63 67 61
39 12/31/2018
AMP -
Ameriprise
Financial 0.83 1.47 16.35 44 57 54 51
40 12/31/2018
AMT - American
Tower (REIT) 3.12 3.67 16.5 41 61 49 47
41 12/31/2018
AMZN –
Amazon 0.54 7.11 4.33 40 57 52 53
42 12/31/2018
ANET - Arista
Networks 0.02 11.58 15.2 45 48 49 52
43 12/31/2018 ANSS – ANSYS 0 13.58 32.41 48 54 53 49
44 12/31/2018
ANTM –
Anthem 0.6 5.11 4.07 42 56 56 56
45 12/31/2018 AON – Aon 1.42 4.24 10.53 47 57 57 52
46 12/31/2018
AOS - A O
Smith 0.13 14.48 13.96 46 53 45 44
47 12/31/2018 APA – Apache 0.92 0.18 0.54 46 57 52 59
48 12/31/2018
APD - Air
Products and
Chemicals 0.3 8.9 18.92 50 62 50 54
49 12/31/2018
APH –
Amphenol 0.69 12.46 14.7 41 50 50 45
50 12/31/2018 APTV – Aptiv 1.1 8.59 7.39 44 48 70 57
51 12/31/2018
ARE -
Alexandria Real
Estate Equities 0.7 2.65 27.43 39 56 57 41
52 12/31/2018 ARNC – Arconic 1.07 3.54 4.65 44 59 51 51
53 12/31/2018
ATO - Atmos
Energy 0.58 3.77 14.37 42 49 43 51
54 12/31/2018
ATVI -
Activision
Blizzard 0.23 10.22 24.17 49 53 44 45
55 12/31/2018
AVB -
AvalonBay
Communities 0.66 5.24 42.67 49 62 62 56
56 10/31/2018
AVGO –
Broadcom 0.66 23.35 58.8 42 53 45 43
57 12/31/2018
AVY - Avery
Dennison 1.86 9 6.54 49 56 57 46
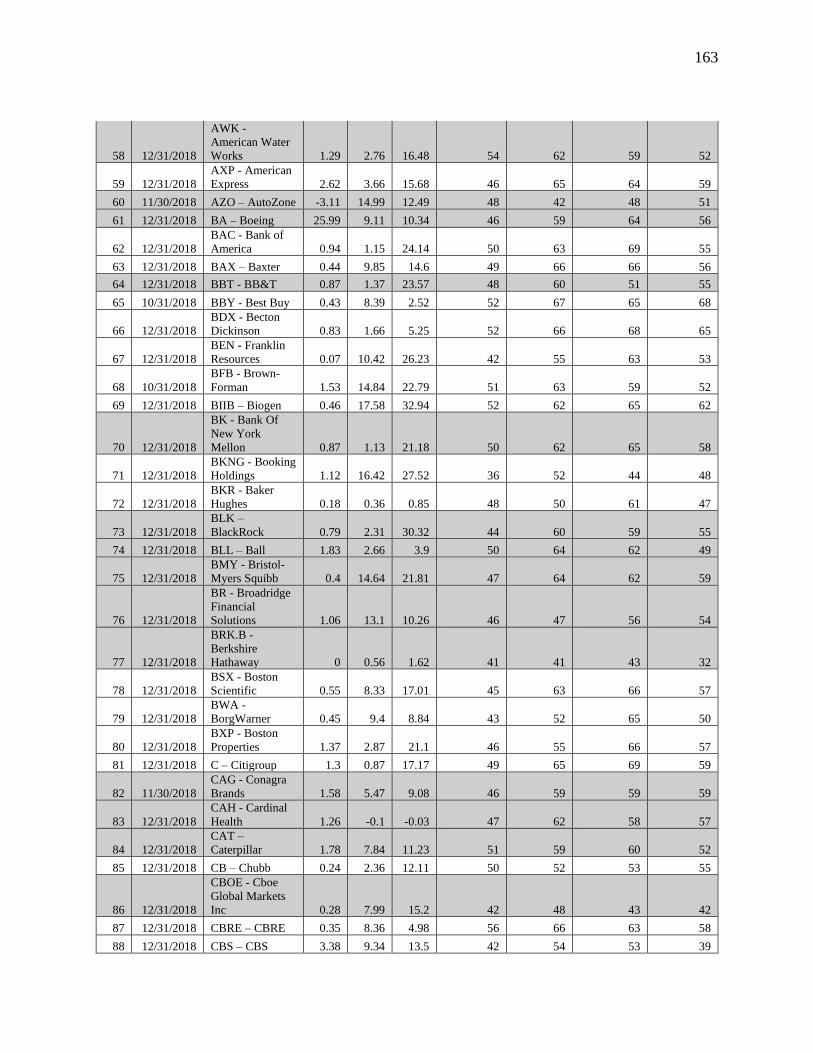
163
58 12/31/2018
AWK -
American Water
Works 1.29 2.76 16.48 54 62 59 52
59 12/31/2018
AXP - American
Express 2.62 3.66 15.68 46 65 64 59
60 11/30/2018 AZO – AutoZone -3.11 14.99 12.49 48 42 48 51
61 12/31/2018 BA – Boeing 25.99 9.11 10.34 46 59 64 56
62 12/31/2018
BAC - Bank of
America 0.94 1.15 24.14 50 63 69 55
63 12/31/2018 BAX – Baxter 0.44 9.85 14.6 49 66 66 56
64 12/31/2018 BBT - BB&T 0.87 1.37 23.57 48 60 51 55
65 10/31/2018 BBY - Best Buy 0.43 8.39 2.52 52 67 65 68
66 12/31/2018
BDX - Becton
Dickinson 0.83 1.66 5.25 52 66 68 65
67 12/31/2018
BEN - Franklin
Resources 0.07 10.42 26.23 42 55 63 53
68 10/31/2018
BFB - Brown-
Forman 1.53 14.84 22.79 51 63 59 52
69 12/31/2018 BIIB – Biogen 0.46 17.58 32.94 52 62 65 62
70 12/31/2018
BK - Bank Of
New York
Mellon 0.87 1.13 21.18 50 62 65 58
71 12/31/2018
BKNG - Booking
Holdings 1.12 16.42 27.52 36 52 44 48
72 12/31/2018
BKR - Baker
Hughes 0.18 0.36 0.85 48 50 61 47
73 12/31/2018
BLK –
BlackRock 0.79 2.31 30.32 44 60 59 55
74 12/31/2018 BLL – Ball 1.83 2.66 3.9 50 64 62 49
75 12/31/2018
BMY - Bristol-
Myers Squibb 0.4 14.64 21.81 47 64 62 59
76 12/31/2018
BR - Broadridge
Financial
Solutions 1.06 13.1 10.26 46 47 56 54
77 12/31/2018
BRK.B -
Berkshire
Hathaway 0 0.56 1.62 41 41 43 32
78 12/31/2018
BSX - Boston
Scientific 0.55 8.33 17.01 45 63 66 57
79 12/31/2018
BWA -
BorgWarner 0.45 9.4 8.84 43 52 65 50
80 12/31/2018
BXP - Boston
Properties 1.37 2.87 21.1 46 55 66 57
81 12/31/2018 C – Citigroup 1.3 0.87 17.17 49 65 69 59
82 11/30/2018
CAG - Conagra
Brands 1.58 5.47 9.08 46 59 59 59
83 12/31/2018
CAH - Cardinal
Health 1.26 -0.1 -0.03 47 62 58 57
84 12/31/2018
CAT –
Caterpillar 1.78 7.84 11.23 51 59 60 52
85 12/31/2018 CB – Chubb 0.24 2.36 12.11 50 52 53 55
86 12/31/2018
CBOE - Cboe
Global Markets
Inc 0.28 7.99 15.2 42 48 43 42
87 12/31/2018 CBRE – CBRE 0.35 8.36 4.98 56 66 63 58
88 12/31/2018 CBS – CBS 3.38 9.34 13.5 42 54 53 39

164
89 12/31/2018
CCI - Crown
Castle 1.38 1.72 10.29 38 55 41 43
90 11/30/2018 CCL – Carnival 0.32 7.51 16.69 47 58 52 50
91 12/31/2018
CDNS - Cadence
Design Systems 0.27 14.14 16.14 46 50 48 52
92 12/31/2018 CDW – CDW 3.26 8.9 3.96 46 54 49 54
93 12/31/2018 CE – Celanese 0.88 12.47 16.87 49 59 52 62
94 12/31/2018 CERN – Cerner 0.09 9.48 11.72 46 53 55 57
95 12/31/2018
CF - CF
Industries
Holdings 0.82 2.22 6.55 47 55 39 58
96 12/31/2018
CFG - Citizens
Financial 0.8 1.08 23.01 44 56 45 47
97 12/31/2018
CHD - Church &
Dwight 0.62 9.53 13.72 50 56 60 53
98 12/31/2018
CHRW - C.H
Robinson
Worldwide 0.84 15.02 3.99 45 49 49 45
99 12/31/2018
CHTR - Charter
Communications 1.57 0.84 2.82 38 52 39 36
100 12/31/2018 CI – Cigna 0.96 2.91 5.42 48 64 62 60
101 12/31/2018
CINF -
Cincinnati
Financial 0.11 1.31 5.31 43 46 55 45
102 12/31/2018
CL - Colgate-
Palmolive 32.25 19 15.44 56 63 68 58
103 12/31/2018 CLX – Clorox 3.08 15.31 12.65 58 68 68 61
104 12/31/2018
CMA –
Comerica 0.86 1.71 34.13 49 65 63 54
105 12/31/2018
CMCSA –
Comcast 1.48 8.05 12.41 42 56 60 52
106 12/31/2018
CME - CME
Group 0.15 2.73 45.52 47 62 51 46
107 12/31/2018
CMG - Chipotle
Mexican Grill 0 8.07 3.62 44 54 53 50
108 12/31/2018 CMI – Cummins 0.19 11.36 9.01 51 62 66 59
109 12/31/2018
CMS - CMS
Energy 2.23 2.78 9.56 52 61 56 59
110 12/31/2018 CNC – Centene 0.6 3.1 1.5 45 51 54 42
111 12/31/2018
CNP -
CenterPoint
Energy 1.37 1.42 3.14 50 54 49 55
112 12/31/2018
COF - Capital
One Financial 1.13 1.56 17.64 46 61 66 59
113 12/31/2018
COG - Cabot Oil
& Gas 0.59 12.85 25.42 40 46 50 50
114 10/31/2018 COO – Cooper 0.6 2.24 5.53 42 46 43 39
115 12/31/2018
COP -
ConocoPhillips 0.46 8.93 16.16 50 59 53 58
116 11/30/2018 COST – Costco 0.48 8 2.25 44 53 60 51
117 12/31/2018 COTY – Coty 0.99 -5.46
-
13.58 44 51 42 41
118 10/31/2018
CPB - Campbell
Soup 5.65 1.38 2.52 58 61 62 59
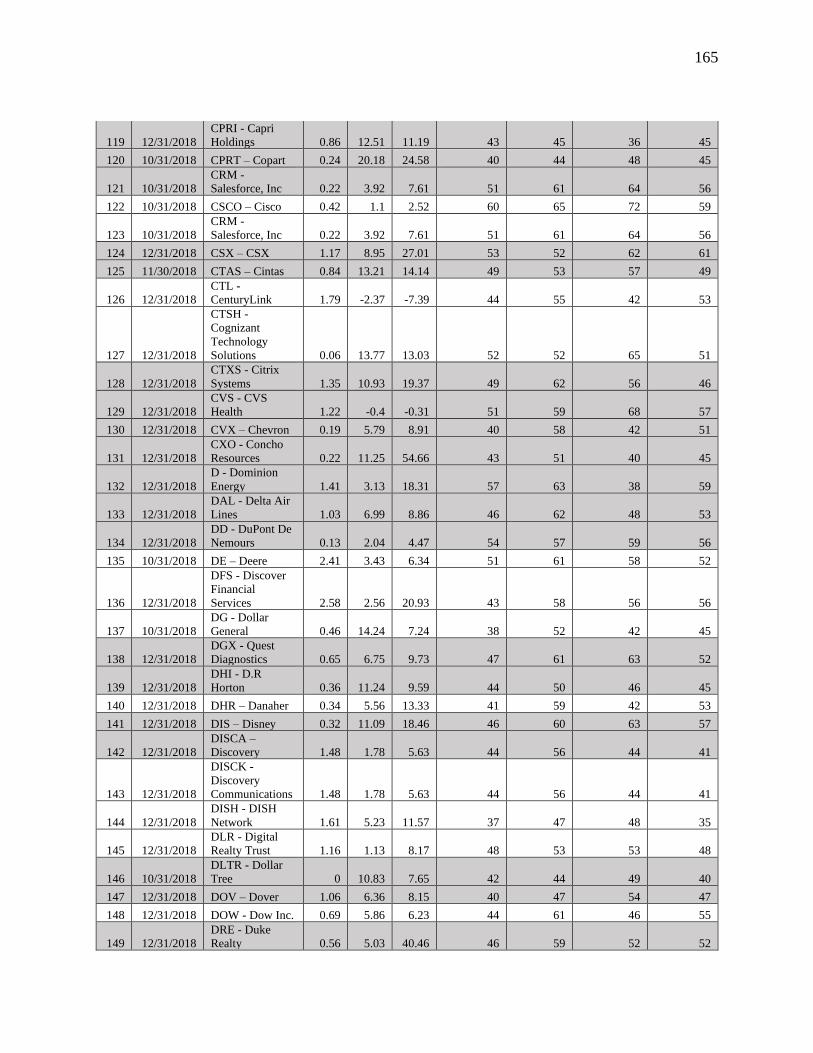
165
119 12/31/2018
CPRI - Capri
Holdings 0.86 12.51 11.19 43 45 36 45
120 10/31/2018 CPRT – Copart 0.24 20.18 24.58 40 44 48 45
121 10/31/2018
CRM -
Salesforce, Inc 0.22 3.92 7.61 51 61 64 56
122 10/31/2018 CSCO – Cisco 0.42 1.1 2.52 60 65 72 59
123 10/31/2018
CRM -
Salesforce, Inc 0.22 3.92 7.61 51 61 64 56
124 12/31/2018 CSX – CSX 1.17 8.95 27.01 53 52 62 61
125 11/30/2018 CTAS – Cintas 0.84 13.21 14.14 49 53 57 49
126 12/31/2018
CTL -
CenturyLink 1.79 -2.37 -7.39 44 55 42 53
127 12/31/2018
CTSH -
Cognizant
Technology
Solutions 0.06 13.77 13.03 52 52 65 51
128 12/31/2018
CTXS - Citrix
Systems 1.35 10.93 19.37 49 62 56 46
129 12/31/2018
CVS - CVS
Health 1.22 -0.4 -0.31 51 59 68 57
130 12/31/2018 CVX – Chevron 0.19 5.79 8.91 40 58 42 51
131 12/31/2018
CXO - Concho
Resources 0.22 11.25 54.66 43 51 40 45
132 12/31/2018
D - Dominion
Energy 1.41 3.13 18.31 57 63 38 59
133 12/31/2018
DAL - Delta Air
Lines 1.03 6.99 8.86 46 62 48 53
134 12/31/2018
DD - DuPont De
Nemours 0.13 2.04 4.47 54 57 59 56
135 10/31/2018 DE – Deere 2.41 3.43 6.34 51 61 58 52
136 12/31/2018
DFS - Discover
Financial
Services 2.58 2.56 20.93 43 58 56 56
137 10/31/2018
DG - Dollar
General 0.46 14.24 7.24 38 52 42 45
138 12/31/2018
DGX - Quest
Diagnostics 0.65 6.75 9.73 47 61 63 52
139 12/31/2018
DHI - D.R
Horton 0.36 11.24 9.59 44 50 46 45
140 12/31/2018 DHR – Danaher 0.34 5.56 13.33 41 59 42 53
141 12/31/2018 DIS – Disney 0.32 11.09 18.46 46 60 63 57
142 12/31/2018
DISCA –
Discovery 1.48 1.78 5.63 44 56 44 41
143 12/31/2018
DISCK -
Discovery
Communications 1.48 1.78 5.63 44 56 44 41
144 12/31/2018
DISH - DISH
Network 1.61 5.23 11.57 37 47 48 35
145 12/31/2018
DLR - Digital
Realty Trust 1.16 1.13 8.17 48 53 53 48
146 10/31/2018
DLTR - Dollar
Tree 0 10.83 7.65 42 44 49 40
147 12/31/2018 DOV – Dover 1.06 6.36 8.15 40 47 54 47
148 12/31/2018 DOW - Dow Inc. 0.69 5.86 6.23 44 61 46 55
149 12/31/2018
DRE - Duke
Realty 0.56 5.03 40.46 46 59 52 52
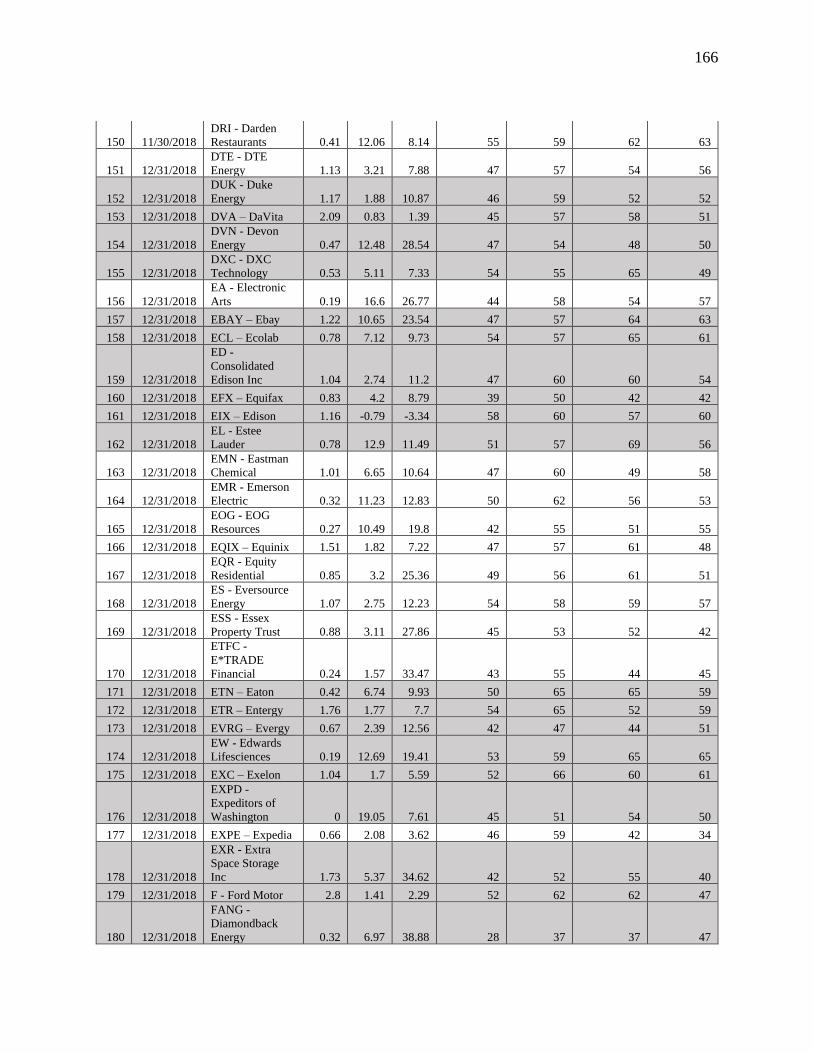
166
150 11/30/2018
DRI - Darden
Restaurants 0.41 12.06 8.14 55 59 62 63
151 12/31/2018
DTE - DTE
Energy 1.13 3.21 7.88 47 57 54 56
152 12/31/2018
DUK - Duke
Energy 1.17 1.88 10.87 46 59 52 52
153 12/31/2018 DVA – DaVita 2.09 0.83 1.39 45 57 58 51
154 12/31/2018
DVN - Devon
Energy 0.47 12.48 28.54 47 54 48 50
155 12/31/2018
DXC - DXC
Technology 0.53 5.11 7.33 54 55 65 49
156 12/31/2018
EA - Electronic
Arts 0.19 16.6 26.77 44 58 54 57
157 12/31/2018 EBAY – Ebay 1.22 10.65 23.54 47 57 64 63
158 12/31/2018 ECL – Ecolab 0.78 7.12 9.73 54 57 65 61
159 12/31/2018
ED -
Consolidated
Edison Inc 1.04 2.74 11.2 47 60 60 54
160 12/31/2018 EFX – Equifax 0.83 4.2 8.79 39 50 42 42
161 12/31/2018 EIX – Edison 1.16 -0.79 -3.34 58 60 57 60
162 12/31/2018
EL - Estee
Lauder 0.78 12.9 11.49 51 57 69 56
163 12/31/2018
EMN - Eastman
Chemical 1.01 6.65 10.64 47 60 49 58
164 12/31/2018
EMR - Emerson
Electric 0.32 11.23 12.83 50 62 56 53
165 12/31/2018
EOG - EOG
Resources 0.27 10.49 19.8 42 55 51 55
166 12/31/2018 EQIX – Equinix 1.51 1.82 7.22 47 57 61 48
167 12/31/2018
EQR - Equity
Residential 0.85 3.2 25.36 49 56 61 51
168 12/31/2018
ES - Eversource
Energy 1.07 2.75 12.23 54 58 59 57
169 12/31/2018
ESS - Essex
Property Trust 0.88 3.11 27.86 45 53 52 42
170 12/31/2018
ETFC -
E*TRADE
Financial 0.24 1.57 33.47 43 55 44 45
171 12/31/2018 ETN – Eaton 0.42 6.74 9.93 50 65 65 59
172 12/31/2018 ETR – Entergy 1.76 1.77 7.7 54 65 52 59
173 12/31/2018 EVRG – Evergy 0.67 2.39 12.56 42 47 44 51
174 12/31/2018
EW - Edwards
Lifesciences 0.19 12.69 19.41 53 59 65 65
175 12/31/2018 EXC – Exelon 1.04 1.7 5.59 52 66 60 61
176 12/31/2018
EXPD -
Expeditors of
Washington 0 19.05 7.61 45 51 54 50
177 12/31/2018 EXPE – Expedia 0.66 2.08 3.62 46 59 42 34
178 12/31/2018
EXR - Extra
Space Storage
Inc 1.73 5.37 34.62 42 52 55 40
179 12/31/2018 F - Ford Motor 2.8 1.41 2.29 52 62 62 47
180 12/31/2018
FANG -
Diamondback
Energy 0.32 6.97 38.88 28 37 37 47
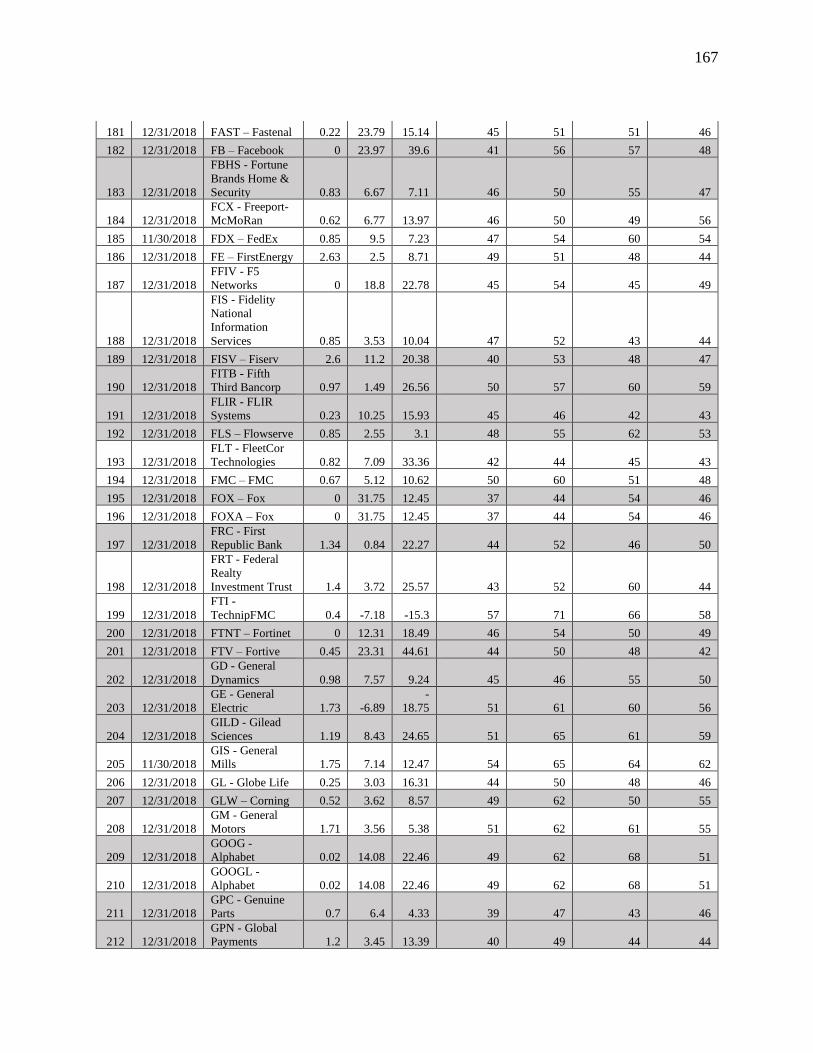
167
181 12/31/2018 FAST – Fastenal 0.22 23.79 15.14 45 51 51 46
182 12/31/2018 FB – Facebook 0 23.97 39.6 41 56 57 48
183 12/31/2018
FBHS - Fortune
Brands Home &
Security 0.83 6.67 7.11 46 50 55 47
184 12/31/2018
FCX - Freeport-
McMoRan 0.62 6.77 13.97 46 50 49 56
185 11/30/2018 FDX – FedEx 0.85 9.5 7.23 47 54 60 54
186 12/31/2018 FE – FirstEnergy 2.63 2.5 8.71 49 51 48 44
187 12/31/2018
FFIV - F5
Networks 0 18.8 22.78 45 54 45 49
188 12/31/2018
FIS - Fidelity
National
Information
Services 0.85 3.53 10.04 47 52 43 44
189 12/31/2018 FISV – Fiserv 2.6 11.2 20.38 40 53 48 47
190 12/31/2018
FITB - Fifth
Third Bancorp 0.97 1.49 26.56 50 57 60 59
191 12/31/2018
FLIR - FLIR
Systems 0.23 10.25 15.93 45 46 42 43
192 12/31/2018 FLS – Flowserve 0.85 2.55 3.1 48 55 62 53
193 12/31/2018
FLT - FleetCor
Technologies 0.82 7.09 33.36 42 44 45 43
194 12/31/2018 FMC – FMC 0.67 5.12 10.62 50 60 51 48
195 12/31/2018 FOX – Fox 0 31.75 12.45 37 44 54 46
196 12/31/2018 FOXA – Fox 0 31.75 12.45 37 44 54 46
197 12/31/2018
FRC - First
Republic Bank 1.34 0.84 22.27 44 52 46 50
198 12/31/2018
FRT - Federal
Realty
Investment Trust 1.4 3.72 25.57 43 52 60 44
199 12/31/2018
FTI -
TechnipFMC 0.4 -7.18 -15.3 57 71 66 58
200 12/31/2018 FTNT – Fortinet 0 12.31 18.49 46 54 50 49
201 12/31/2018 FTV – Fortive 0.45 23.31 44.61 44 50 48 42
202 12/31/2018
GD - General
Dynamics 0.98 7.57 9.24 45 46 55 50
203 12/31/2018
GE - General
Electric 1.73 -6.89
-
18.75 51 61 60 56
204 12/31/2018
GILD - Gilead
Sciences 1.19 8.43 24.65 51 65 61 59
205 11/30/2018
GIS - General
Mills 1.75 7.14 12.47 54 65 64 62
206 12/31/2018 GL - Globe Life 0.25 3.03 16.31 44 50 48 46
207 12/31/2018 GLW – Corning 0.52 3.62 8.57 49 62 50 55
208 12/31/2018
GM - General
Motors 1.71 3.56 5.38 51 62 61 55
209 12/31/2018
GOOG -
Alphabet 0.02 14.08 22.46 49 62 68 51
210 12/31/2018
GOOGL -
Alphabet 0.02 14.08 22.46 49 62 68 51
211 12/31/2018
GPC - Genuine
Parts 0.7 6.4 4.33 39 47 43 46
212 12/31/2018
GPN - Global
Payments 1.2 3.45 13.39 40 49 44 44

168
213 10/31/2018 GPS – Gap 0.36 11.74 5.57 54 64 66 56
214 12/31/2018 GRMN – Garmin 0 13.64 20.71 46 50 51 47
215 12/31/2018
GS - Goldman
Sachs 2.84 1.03 26.93 46 62 61 46
216 12/31/2018
GWW - W.W
Grainger 1 13.15 6.92 53 60 65 57
217 12/31/2018
HAL -
Halliburton 1.08 6.45 6.9 46 55 53 48
218 12/31/2018 HAS – Hasbro 0.97 4.29 4.83 56 66 65 59
219 12/31/2018
HBAN -
Huntington
Bancshares 0.87 1.25 25.1 45 61 56 57
220 12/31/2018
HBI -
Hanesbrands 3.64 7.51 8.13 47 51 60 46
221 12/31/2018
HCA - HCA
Healthcare
-
10.98 9.95 8.11 44 52 53 49
222 12/31/2018
HD - Home
Depot 17.68 23.12 10 48 61 60 56
223 12/31/2018 HES – Hess 0.61 -1.52 -5.19 50 62 53 55
224 12/31/2018
HFC -
HollyFrontier 0.37 9.79 6.18 41 55 44 55
225 12/31/2018
HIG - Hartford
Financial
Services 0.33 1.8 9.5 46 61 59 59
226 12/31/2018
HII - Huntington
Ingalls Industries 0.85 13.2 10.23 46 54 39 48
227 12/31/2018
HLT - Hilton
Worldwide
Holdings 13.02 5.42 8.58 53 61 57 54
228 12/31/2018
HOG - Harley-
Davidson 2.76 5.06 9.29 50 51 59 51
229 12/31/2018 HOLX – Hologic 1.18 -5.87
-
12.83 44 56 51 46
230 12/31/2018
HON -
Honeywell 0.53 11.25 16.18 47 53 55 55
231 12/31/2018
HP - Helmerich
& Payne 0.11 0.02 0.04 39 48 44 44
232 10/31/2018
HPE - Hewlett
Packard
Enterprise 0.48 3.25 6.18 53 56 67 59
233 10/31/2018 HPQ – HP -7.08 15.64 9.11 57 63 69 68
234 10/31/2018
HRB - H&R
Block
-
47.61 21.56 17.89 47 48 43 59
235 10/31/2018
HRL - Hormel
Foods 0.11 12.75 10.59 51 63 54 55
236 12/31/2018
HSIC - Henry
Schein 0.28 6.56 4.05 42 54 49 56
237 12/31/2018
HST - Host
Hotels & Resorts 0.51 8.99 19.68 49 60 64 61
238 12/31/2018 HSY – Hershey 2.31 15.56 15.12 49 63 62 54
239 12/31/2018 HUM – Humana 0.43 5.58 2.96 51 63 62 61
240 12/31/2018 IBM – IBM 2.1 7.09 10.97 56 65 67 53
241 12/31/2018
ICE -
Intercontinental
Exchange 0.38 2.31 39.93 52 53 56 54
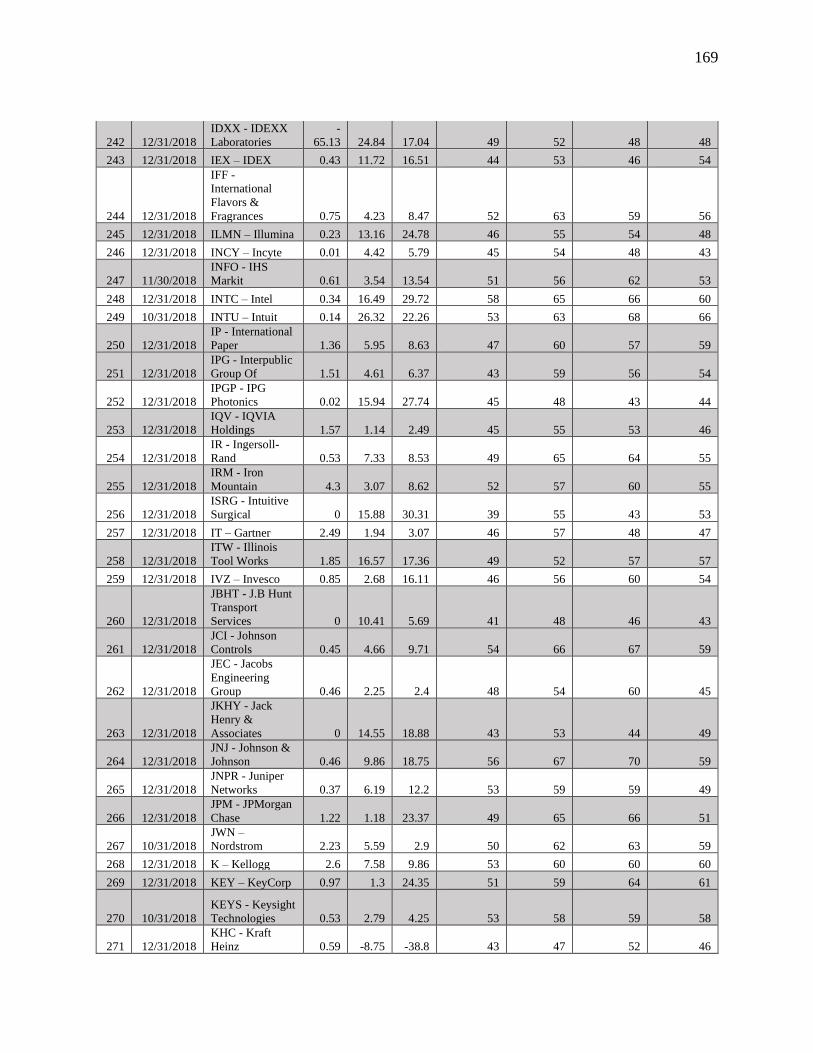
169
242 12/31/2018
IDXX - IDEXX
Laboratories
-
65.13 24.84 17.04 49 52 48 48
243 12/31/2018 IEX – IDEX 0.43 11.72 16.51 44 53 46 54
244 12/31/2018
IFF -
International
Flavors &
Fragrances 0.75 4.23 8.47 52 63 59 56
245 12/31/2018 ILMN – Illumina 0.23 13.16 24.78 46 55 54 48
246 12/31/2018 INCY – Incyte 0.01 4.42 5.79 45 54 48 43
247 11/30/2018
INFO - IHS
Markit 0.61 3.54 13.54 51 56 62 53
248 12/31/2018 INTC – Intel 0.34 16.49 29.72 58 65 66 60
249 10/31/2018 INTU – Intuit 0.14 26.32 22.26 53 63 68 66
250 12/31/2018
IP - International
Paper 1.36 5.95 8.63 47 60 57 59
251 12/31/2018
IPG - Interpublic
Group Of 1.51 4.61 6.37 43 59 56 54
252 12/31/2018
IPGP - IPG
Photonics 0.02 15.94 27.74 45 48 43 44
253 12/31/2018
IQV - IQVIA
Holdings 1.57 1.14 2.49 45 55 53 46
254 12/31/2018
IR - Ingersoll-
Rand 0.53 7.33 8.53 49 65 64 55
255 12/31/2018
IRM - Iron
Mountain 4.3 3.07 8.62 52 57 60 55
256 12/31/2018
ISRG - Intuitive
Surgical 0 15.88 30.31 39 55 43 53
257 12/31/2018 IT – Gartner 2.49 1.94 3.07 46 57 48 47
258 12/31/2018
ITW - Illinois
Tool Works 1.85 16.57 17.36 49 52 57 57
259 12/31/2018 IVZ – Invesco 0.85 2.68 16.11 46 56 60 54
260 12/31/2018
JBHT - J.B Hunt
Transport
Services 0 10.41 5.69 41 48 46 43
261 12/31/2018
JCI - Johnson
Controls 0.45 4.66 9.71 54 66 67 59
262 12/31/2018
JEC - Jacobs
Engineering
Group 0.46 2.25 2.4 48 54 60 45
263 12/31/2018
JKHY - Jack
Henry &
Associates 0 14.55 18.88 43 53 44 49
264 12/31/2018
JNJ - Johnson &
Johnson 0.46 9.86 18.75 56 67 70 59
265 12/31/2018
JNPR - Juniper
Networks 0.37 6.19 12.2 53 59 59 49
266 12/31/2018
JPM - JPMorgan
Chase 1.22 1.18 23.37 49 65 66 51
267 10/31/2018
JWN –
Nordstrom 2.23 5.59 2.9 50 62 63 59
268 12/31/2018 K – Kellogg 2.6 7.58 9.86 53 60 60 60
269 12/31/2018 KEY – KeyCorp 0.97 1.3 24.35 51 59 64 61
270 10/31/2018
KEYS - Keysight
Technologies 0.53 2.79 4.25 53 58 59 58
271 12/31/2018
KHC - Kraft
Heinz 0.59 -8.75 -38.8 43 47 52 46
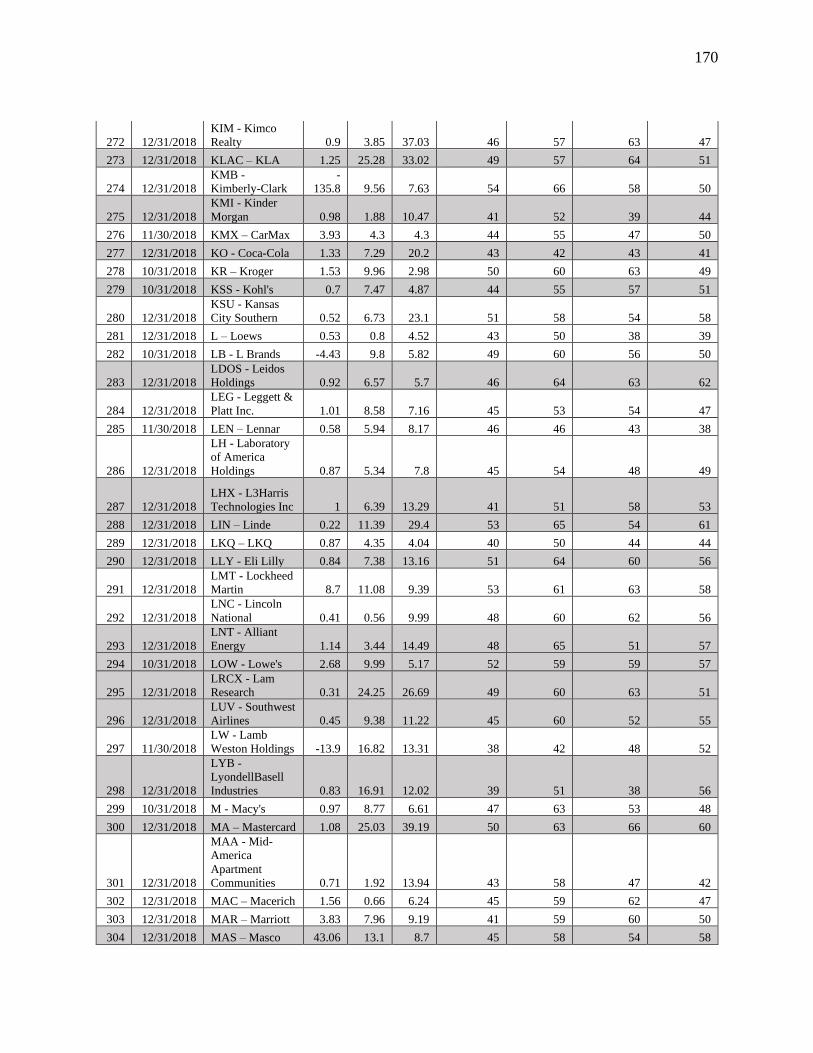
170
272 12/31/2018
KIM - Kimco
Realty 0.9 3.85 37.03 46 57 63 47
273 12/31/2018 KLAC – KLA 1.25 25.28 33.02 49 57 64 51
274 12/31/2018
KMB -
Kimberly-Clark
-
135.8 9.56 7.63 54 66 58 50
275 12/31/2018
KMI - Kinder
Morgan 0.98 1.88 10.47 41 52 39 44
276 11/30/2018 KMX – CarMax 3.93 4.3 4.3 44 55 47 50
277 12/31/2018 KO - Coca-Cola 1.33 7.29 20.2 43 42 43 41
278 10/31/2018 KR – Kroger 1.53 9.96 2.98 50 60 63 49
279 10/31/2018 KSS - Kohl's 0.7 7.47 4.87 44 55 57 51
280 12/31/2018
KSU - Kansas
City Southern 0.52 6.73 23.1 51 58 54 58
281 12/31/2018 L – Loews 0.53 0.8 4.52 43 50 38 39
282 10/31/2018 LB - L Brands -4.43 9.8 5.82 49 60 56 50
283 12/31/2018
LDOS - Leidos
Holdings 0.92 6.57 5.7 46 64 63 62
284 12/31/2018
LEG - Leggett &
Platt Inc. 1.01 8.58 7.16 45 53 54 47
285 11/30/2018 LEN – Lennar 0.58 5.94 8.17 46 46 43 38
286 12/31/2018
LH - Laboratory
of America
Holdings 0.87 5.34 7.8 45 54 48 49
287 12/31/2018
LHX - L3Harris
Technologies Inc 1 6.39 13.29 41 51 58 53
288 12/31/2018 LIN – Linde 0.22 11.39 29.4 53 65 54 61
289 12/31/2018 LKQ – LKQ 0.87 4.35 4.04 40 50 44 44
290 12/31/2018 LLY - Eli Lilly 0.84 7.38 13.16 51 64 60 56
291 12/31/2018
LMT - Lockheed
Martin 8.7 11.08 9.39 53 61 63 58
292 12/31/2018
LNC - Lincoln
National 0.41 0.56 9.99 48 60 62 56
293 12/31/2018
LNT - Alliant
Energy 1.14 3.44 14.49 48 65 51 57
294 10/31/2018 LOW - Lowe's 2.68 9.99 5.17 52 59 59 57
295 12/31/2018
LRCX - Lam
Research 0.31 24.25 26.69 49 60 63 51
296 12/31/2018
LUV - Southwest
Airlines 0.45 9.38 11.22 45 60 52 55
297 11/30/2018
LW - Lamb
Weston Holdings -13.9 16.82 13.31 38 42 48 52
298 12/31/2018
LYB -
LyondellBasell
Industries 0.83 16.91 12.02 39 51 38 56
299 10/31/2018 M - Macy's 0.97 8.77 6.61 47 63 53 48
300 12/31/2018 MA – Mastercard 1.08 25.03 39.19 50 63 66 60
301 12/31/2018
MAA - Mid-
America
Apartment
Communities 0.71 1.92 13.94 43 58 47 42
302 12/31/2018 MAC – Macerich 1.56 0.66 6.24 45 59 62 47
303 12/31/2018 MAR – Marriott 3.83 7.96 9.19 41 59 60 50
304 12/31/2018 MAS – Masco 43.06 13.1 8.7 45 58 54 58
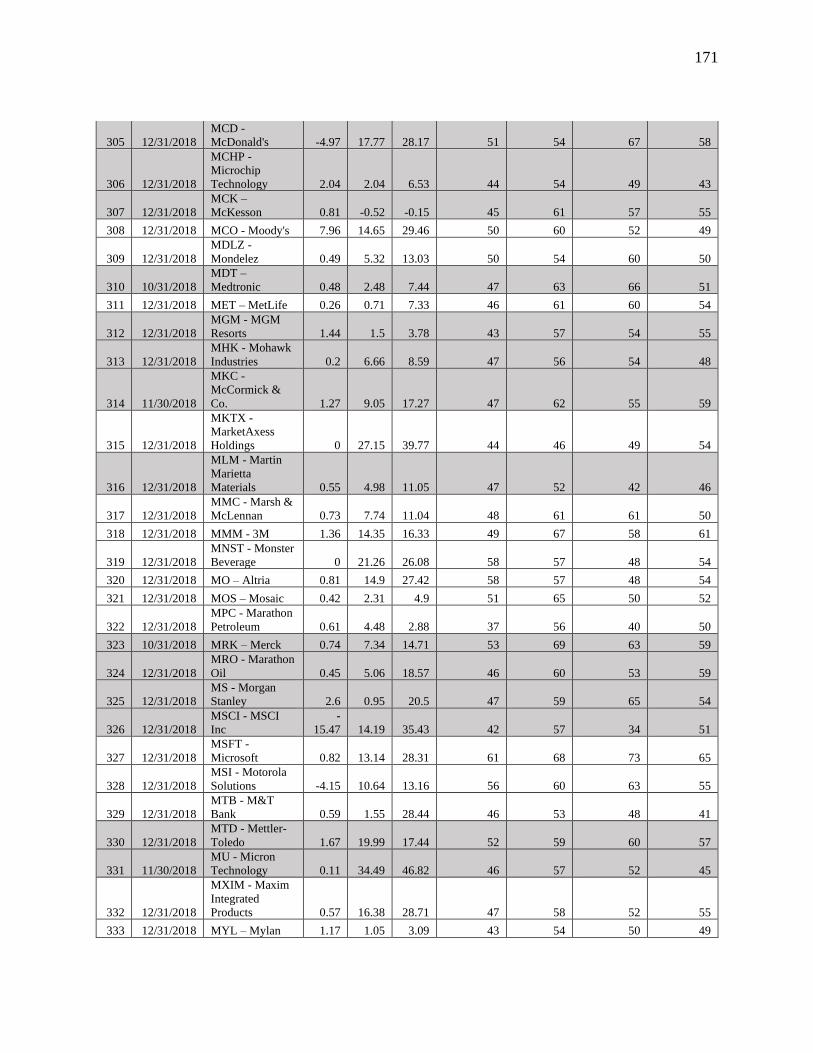
171
305 12/31/2018
MCD -
McDonald's -4.97 17.77 28.17 51 54 67 58
306 12/31/2018
MCHP -
Microchip
Technology 2.04 2.04 6.53 44 54 49 43
307 12/31/2018
MCK –
McKesson 0.81 -0.52 -0.15 45 61 57 55
308 12/31/2018 MCO - Moody's 7.96 14.65 29.46 50 60 52 49
309 12/31/2018
MDLZ -
Mondelez 0.49 5.32 13.03 50 54 60 50
310 10/31/2018
MDT –
Medtronic 0.48 2.48 7.44 47 63 66 51
311 12/31/2018 MET – MetLife 0.26 0.71 7.33 46 61 60 54
312 12/31/2018
MGM - MGM
Resorts 1.44 1.5 3.78 43 57 54 55
313 12/31/2018
MHK - Mohawk
Industries 0.2 6.66 8.59 47 56 54 48
314 11/30/2018
MKC -
McCormick &
Co. 1.27 9.05 17.27 47 62 55 59
315 12/31/2018
MKTX -
MarketAxess
Holdings 0 27.15 39.77 44 46 49 54
316 12/31/2018
MLM - Martin
Marietta
Materials 0.55 4.98 11.05 47 52 42 46
317 12/31/2018
MMC - Marsh &
McLennan 0.73 7.74 11.04 48 61 61 50
318 12/31/2018 MMM - 3M 1.36 14.35 16.33 49 67 58 61
319 12/31/2018
MNST - Monster
Beverage 0 21.26 26.08 58 57 48 54
320 12/31/2018 MO – Altria 0.81 14.9 27.42 58 57 48 54
321 12/31/2018 MOS – Mosaic 0.42 2.31 4.9 51 65 50 52
322 12/31/2018
MPC - Marathon
Petroleum 0.61 4.48 2.88 37 56 40 50
323 10/31/2018 MRK – Merck 0.74 7.34 14.71 53 69 63 59
324 12/31/2018
MRO - Marathon
Oil 0.45 5.06 18.57 46 60 53 59
325 12/31/2018
MS - Morgan
Stanley 2.6 0.95 20.5 47 59 65 54
326 12/31/2018
MSCI - MSCI
Inc
-
15.47 14.19 35.43 42 57 34 51
327 12/31/2018
MSFT -
Microsoft 0.82 13.14 28.31 61 68 73 65
328 12/31/2018
MSI - Motorola
Solutions -4.15 10.64 13.16 56 60 63 55
329 12/31/2018
MTB - M&T
Bank 0.59 1.55 28.44 46 53 48 41
330 12/31/2018
MTD - Mettler-
Toledo 1.67 19.99 17.44 52 59 60 57
331 11/30/2018
MU - Micron
Technology 0.11 34.49 46.82 46 57 52 45
332 12/31/2018
MXIM - Maxim
Integrated
Products 0.57 16.38 28.71 47 58 52 55
333 12/31/2018 MYL – Mylan 1.17 1.05 3.09 43 54 50 49
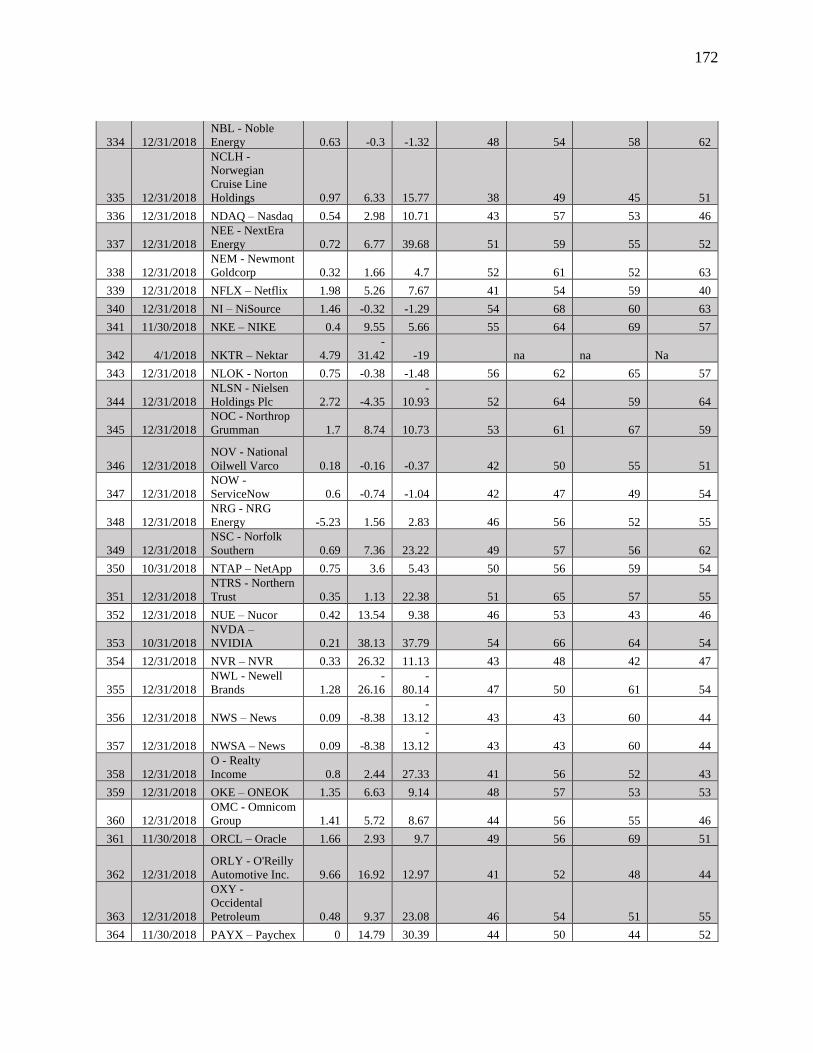
172
334 12/31/2018
NBL - Noble
Energy 0.63 -0.3 -1.32 48 54 58 62
335 12/31/2018
NCLH -
Norwegian
Cruise Line
Holdings 0.97 6.33 15.77 38 49 45 51
336 12/31/2018 NDAQ – Nasdaq 0.54 2.98 10.71 43 57 53 46
337 12/31/2018
NEE - NextEra
Energy 0.72 6.77 39.68 51 59 55 52
338 12/31/2018
NEM - Newmont
Goldcorp 0.32 1.66 4.7 52 61 52 63
339 12/31/2018 NFLX – Netflix 1.98 5.26 7.67 41 54 59 40
340 12/31/2018 NI – NiSource 1.46 -0.32 -1.29 54 68 60 63
341 11/30/2018 NKE – NIKE 0.4 9.55 5.66 55 64 69 57
342 4/1/2018 NKTR – Nektar 4.79
-
31.42 -19 na na Na
343 12/31/2018 NLOK - Norton 0.75 -0.38 -1.48 56 62 65 57
344 12/31/2018
NLSN - Nielsen
Holdings Plc 2.72 -4.35
-
10.93 52 64 59 64
345 12/31/2018
NOC - Northrop
Grumman 1.7 8.74 10.73 53 61 67 59
346 12/31/2018
NOV - National
Oilwell Varco 0.18 -0.16 -0.37 42 50 55 51
347 12/31/2018
NOW -
ServiceNow 0.6 -0.74 -1.04 42 47 49 54
348 12/31/2018
NRG - NRG
Energy -5.23 1.56 2.83 46 56 52 55
349 12/31/2018
NSC - Norfolk
Southern 0.69 7.36 23.22 49 57 56 62
350 10/31/2018 NTAP – NetApp 0.75 3.6 5.43 50 56 59 54
351 12/31/2018
NTRS - Northern
Trust 0.35 1.13 22.38 51 65 57 55
352 12/31/2018 NUE – Nucor 0.42 13.54 9.38 46 53 43 46
353 10/31/2018
NVDA –
NVIDIA 0.21 38.13 37.79 54 66 64 54
354 12/31/2018 NVR – NVR 0.33 26.32 11.13 43 48 42 47
355 12/31/2018
NWL - Newell
Brands 1.28
-
26.16
-
80.14 47 50 61 54
356 12/31/2018 NWS – News 0.09 -8.38
-
13.12 43 43 60 44
357 12/31/2018 NWSA – News 0.09 -8.38
-
13.12 43 43 60 44
358 12/31/2018
O - Realty
Income 0.8 2.44 27.33 41 56 52 43
359 12/31/2018 OKE – ONEOK 1.35 6.63 9.14 48 57 53 53
360 12/31/2018
OMC - Omnicom
Group 1.41 5.72 8.67 44 56 55 46
361 11/30/2018 ORCL – Oracle 1.66 2.93 9.7 49 56 69 51
362 12/31/2018
ORLY - O'Reilly
Automotive Inc. 9.66 16.92 12.97 41 52 48 44
363 12/31/2018
OXY -
Occidental
Petroleum 0.48 9.37 23.08 46 54 51 55
364 11/30/2018 PAYX – Paychex 0 14.79 30.39 44 50 44 52

173
365 12/31/2018
PBCT - People's
United Financial 0.53 1.01 23.61 47 48 42 43
366 12/31/2018
PCAR –
PACCAR 0.75 8.91 9.34 47 52 52 43
367 12/31/2018
PEAK -
Healthpeak
Properties 0.86 7.94 57.28 45 61 64 51
368 12/31/2018
PEG - Public
Service
Enterprise Group 0.92 3.25 14.83 54 65 57 56
369 12/31/2018 PEP – PepsiCo 1.94 16.05 19.35 57 61 61 61
370 12/31/2018 PFE – Pfizer 0.52 6.79 20.79 48 61 64 53
371 12/31/2018
PFG - Principal
Financial 0.29 0.61 10.87 47 62 55 58
372 12/31/2018
PG - Procter &
Gamble 0.4 8.9 16.12 52 61 61 56
373 12/31/2018
PGR -
Progressive 0.43 5.87 8.11 46 61 48 55
374 12/31/2018
PH - Parker-
Hannifin 0.74 9.04 9.69 47 51 58 48
375 12/31/2018
PHM -
PulteGroup 0.63 10.17 9.92 46 49 45 47
376 12/31/2018
PKG - Packaging
of America 0.94 11.47 10.43 43 52 46 50
377 12/31/2018
PKI -
PerkinElmer 0.73 3.98 8.57 48 61 55 50
378 12/31/2018 PLD – Prologis 0.43 4.84 58.63 48 63 63 50
379 12/31/2018
PM - Philip
Morris -2.51 19.38 26.65 40 52 58 46
380 12/31/2018
PNC - PNC
Financial
Services 1.1 1.32 25.21 55 63 68 62
381 12/31/2018 PNR – Pentair 0.43 6.7 11.73 46 47 60 54
382 12/31/2018
PNW - Pinnacle
West Capital 0.87 2.92 13.84 50 57 54 58
383 12/31/2018
PPG - PPG
Industries 0.92 8 8.72 46 58 53 49
384 12/31/2018 PPL – PPL 1.72 4.26 23.47 51 62 52 56
385 12/31/2018 PRGO – Perrigo 0.54 1.17 2.77 48 56 55 45
386 12/31/2018
PRU - Prudential
Financial 0.35 0.5 6.47 50 59 65 62
387 12/31/2018
PSA - Public
Storage 0.28 13.83 54.07 44 55 58 45
388 12/31/2018 PSX - Phillips 66 0.41 10.31 5.02 37 59 40 54
389 10/31/2018 PVH – PVH 0.51 5.91 7.2 51 62 56 49
390 12/31/2018
PWR - Quanta
Services 0.29 4.24 2.63 42 57 42 45
391 12/31/2018
PXD - Pioneer
Natural
Resources 0.19 5.51 10.33 37 53 47 55
392 12/31/2018
PYPL - PayPal
Holdings 0 4.81 13.31 46 56 54 48
393 12/31/2018
QCOM -
QUALCOMM 4.25 4.32 9.74 53 60 62 56
394 12/31/2018 QRVO – Qorvo 0.16 0.99 1.92 44 54 45 48
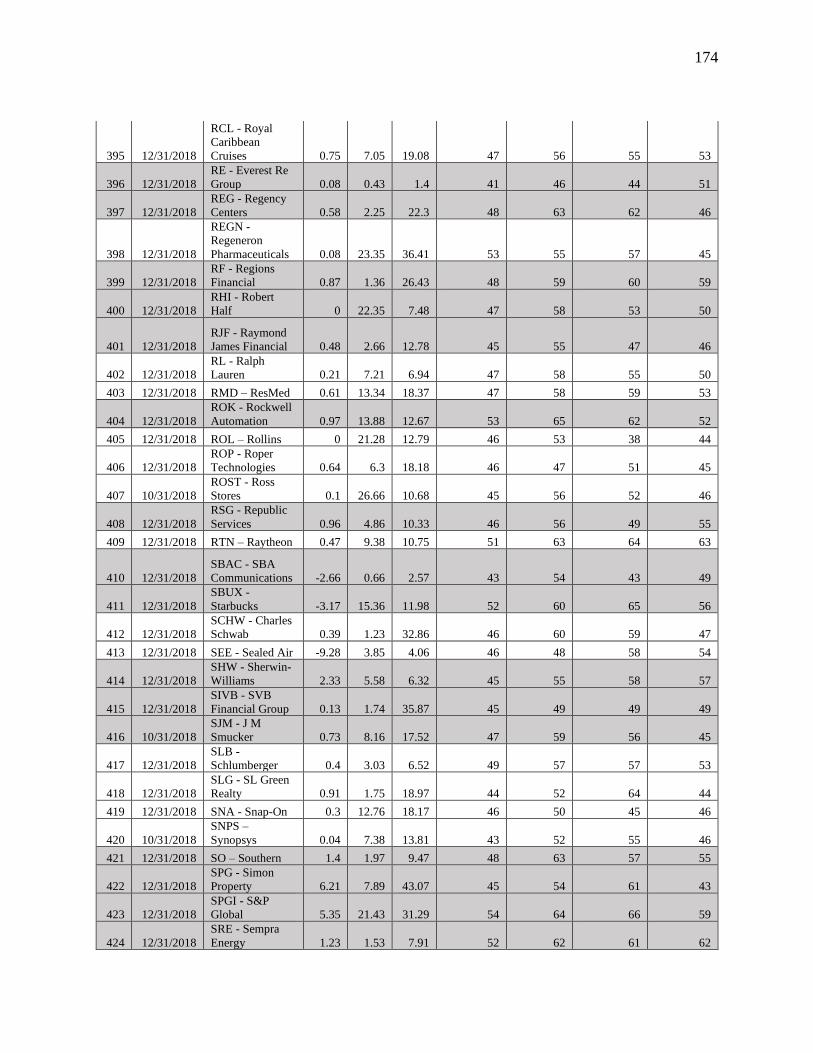
174
395 12/31/2018
RCL - Royal
Caribbean
Cruises 0.75 7.05 19.08 47 56 55 53
396 12/31/2018
RE - Everest Re
Group 0.08 0.43 1.4 41 46 44 51
397 12/31/2018
REG - Regency
Centers 0.58 2.25 22.3 48 63 62 46
398 12/31/2018
REGN -
Regeneron
Pharmaceuticals 0.08 23.35 36.41 53 55 57 45
399 12/31/2018
RF - Regions
Financial 0.87 1.36 26.43 48 59 60 59
400 12/31/2018
RHI - Robert
Half 0 22.35 7.48 47 58 53 50
401 12/31/2018
RJF - Raymond
James Financial 0.48 2.66 12.78 45 55 47 46
402 12/31/2018
RL - Ralph
Lauren 0.21 7.21 6.94 47 58 55 50
403 12/31/2018 RMD – ResMed 0.61 13.34 18.37 47 58 59 53
404 12/31/2018
ROK - Rockwell
Automation 0.97 13.88 12.67 53 65 62 52
405 12/31/2018 ROL – Rollins 0 21.28 12.79 46 53 38 44
406 12/31/2018
ROP - Roper
Technologies 0.64 6.3 18.18 46 47 51 45
407 10/31/2018
ROST - Ross
Stores 0.1 26.66 10.68 45 56 52 46
408 12/31/2018
RSG - Republic
Services 0.96 4.86 10.33 46 56 49 55
409 12/31/2018 RTN – Raytheon 0.47 9.38 10.75 51 63 64 63
410 12/31/2018
SBAC - SBA
Communications -2.66 0.66 2.57 43 54 43 49
411 12/31/2018
SBUX -
Starbucks -3.17 15.36 11.98 52 60 65 56
412 12/31/2018
SCHW - Charles
Schwab 0.39 1.23 32.86 46 60 59 47
413 12/31/2018 SEE - Sealed Air -9.28 3.85 4.06 46 48 58 54
414 12/31/2018
SHW - Sherwin-
Williams 2.33 5.58 6.32 45 55 58 57
415 12/31/2018
SIVB - SVB
Financial Group 0.13 1.74 35.87 45 49 49 49
416 10/31/2018
SJM - J M
Smucker 0.73 8.16 17.52 47 59 56 45
417 12/31/2018
SLB -
Schlumberger 0.4 3.03 6.52 49 57 57 53
418 12/31/2018
SLG - SL Green
Realty 0.91 1.75 18.97 44 52 64 44
419 12/31/2018 SNA - Snap-On 0.3 12.76 18.17 46 50 45 46
420 10/31/2018
SNPS –
Synopsys 0.04 7.38 13.81 43 52 55 46
421 12/31/2018 SO – Southern 1.4 1.97 9.47 48 63 57 55
422 12/31/2018
SPG - Simon
Property 6.21 7.89 43.07 45 54 61 43
423 12/31/2018
SPGI - S&P
Global 5.35 21.43 31.29 54 64 66 59
424 12/31/2018
SRE - Sempra
Energy 1.23 1.53 7.91 52 62 61 62
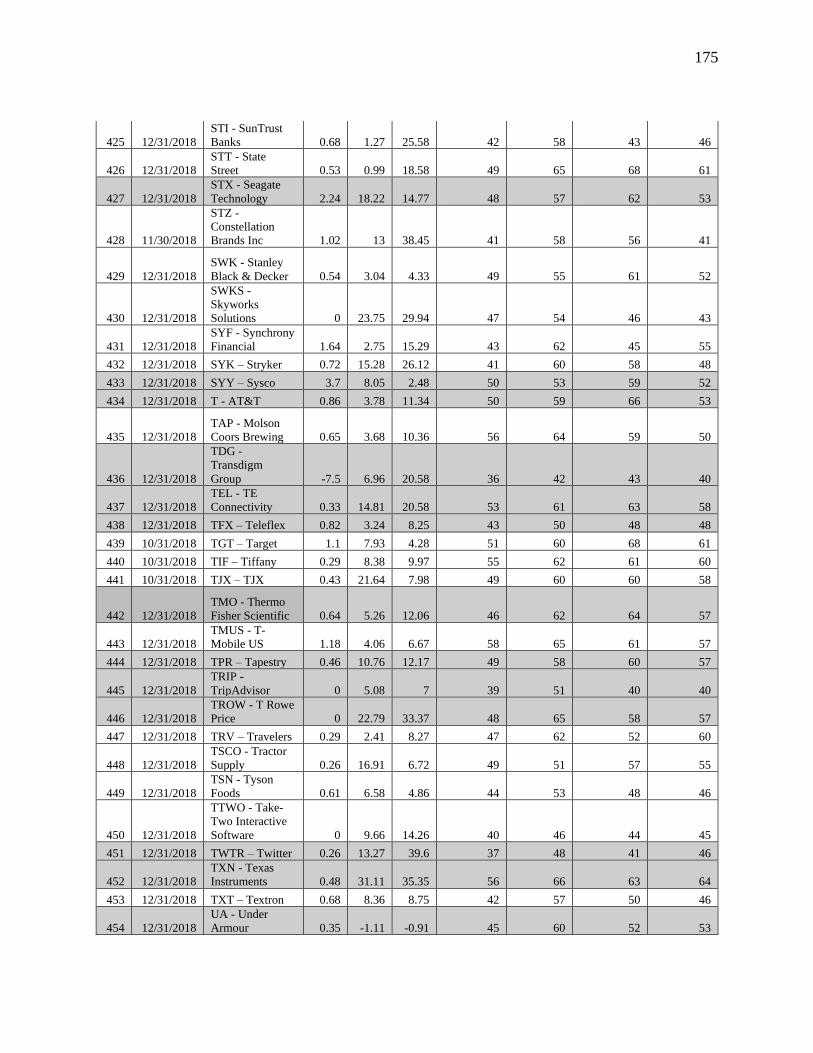
175
425 12/31/2018
STI - SunTrust
Banks 0.68 1.27 25.58 42 58 43 46
426 12/31/2018
STT - State
Street 0.53 0.99 18.58 49 65 68 61
427 12/31/2018
STX - Seagate
Technology 2.24 18.22 14.77 48 57 62 53
428 11/30/2018
STZ -
Constellation
Brands Inc 1.02 13 38.45 41 58 56 41
429 12/31/2018
SWK - Stanley
Black & Decker 0.54 3.04 4.33 49 55 61 52
430 12/31/2018
SWKS -
Skyworks
Solutions 0 23.75 29.94 47 54 46 43
431 12/31/2018
SYF - Synchrony
Financial 1.64 2.75 15.29 43 62 45 55
432 12/31/2018 SYK – Stryker 0.72 15.28 26.12 41 60 58 48
433 12/31/2018 SYY – Sysco 3.7 8.05 2.48 50 53 59 52
434 12/31/2018 T - AT&T 0.86 3.78 11.34 50 59 66 53
435 12/31/2018
TAP - Molson
Coors Brewing 0.65 3.68 10.36 56 64 59 50
436 12/31/2018
TDG -
Transdigm
Group -7.5 6.96 20.58 36 42 43 40
437 12/31/2018
TEL - TE
Connectivity 0.33 14.81 20.58 53 61 63 58
438 12/31/2018 TFX – Teleflex 0.82 3.24 8.25 43 50 48 48
439 10/31/2018 TGT – Target 1.1 7.93 4.28 51 60 68 61
440 10/31/2018 TIF – Tiffany 0.29 8.38 9.97 55 62 61 60
441 10/31/2018 TJX – TJX 0.43 21.64 7.98 49 60 60 58
442 12/31/2018
TMO - Thermo
Fisher Scientific 0.64 5.26 12.06 46 62 64 57
443 12/31/2018
TMUS - T-
Mobile US 1.18 4.06 6.67 58 65 61 57
444 12/31/2018 TPR – Tapestry 0.46 10.76 12.17 49 58 60 57
445 12/31/2018
TRIP -
TripAdvisor 0 5.08 7 39 51 40 40
446 12/31/2018
TROW - T Rowe
Price 0 22.79 33.37 48 65 58 57
447 12/31/2018 TRV – Travelers 0.29 2.41 8.27 47 62 52 60
448 12/31/2018
TSCO - Tractor
Supply 0.26 16.91 6.72 49 51 57 55
449 12/31/2018
TSN - Tyson
Foods 0.61 6.58 4.86 44 53 48 46
450 12/31/2018
TTWO - Take-
Two Interactive
Software 0 9.66 14.26 40 46 44 45
451 12/31/2018 TWTR – Twitter 0.26 13.27 39.6 37 48 41 46
452 12/31/2018
TXN - Texas
Instruments 0.48 31.11 35.35 56 66 63 64
453 12/31/2018 TXT – Textron 0.68 8.36 8.75 42 57 50 46
454 12/31/2018
UA - Under
Armour 0.35 -1.11 -0.91 45 60 52 53

176
455 12/31/2018
UAA - Under
Armour 0.35 -1.11 -0.91 45 60 52 53
456 12/31/2018
UAL - United
Airlines
Holdings Inc 1.76 4.66 5.15 43 56 43 50
457 12/31/2018
UDR - United
Dominion Realty
Trust 1.23 2.6 19.1 45 56 55 42
458 12/31/2018
UHS - Universal
Health Services 0.72 6.99 7.24 38 41 47 43
459 10/31/2018
ULTA - Ulta
Beauty 0 21.11 9.97 41 50 44 48
460 12/31/2018
UNH -
UnitedHealth
Group 0.64 7.81 5.3 47 53 61 57
461 12/31/2018
UNM - Unum
Group 0.35 0.84 4.52 50 59 57 62
462 12/31/2018
UNP - Union
Pacific 1.03 10.16 26.13 49 49 61 62
463 12/31/2018 UPS – UPS 6.56 10.28 6.67 51 59 64 56
464 12/31/2018
URI - United
Rentals 3.19 6.82 13.62 47 62 58 52
465 12/31/2018
USB - U.S
Bancorp 0.91 1.46 26.32 48 57 63 54
466 12/31/2018
UTX - United
Technologies 1.01 4.69 7.92 49 60 63 59
467 12/31/2018 V – Visa 0.58 15.47 50.61 52 64 63 58
468 12/31/2018
VAR - Varian
Medical Systems 0 11.14 12.24 48 57 67 52
469 6/30/2018 VFC - V.F 0.58 6.96 9.87 49 58 62 52
470 12/31/2018 VIAB – Viacom 1.12 6.49 11.6 43 62 58 49
471 12/31/2018
VLO - Valero
Energy 0.39 6.18 2.67 37 54 40 52
472 12/31/2018
VMC - Vulcan
Materials 0.53 5.29 11.78 45 56 48 52
473 12/31/2018
VNO - Vornado
Realty Trust 2.33 2.28 17.8 45 53 61 42
474 12/31/2018
VRSK - Verisk
Analytics 0.99 9.97 25.01 50 56 60 47
475 12/31/2018
VRSN –
VeriSign -1.29 27.02 47.94 42 50 57 46
476 12/31/2018
VRTX - Vertex
Pharmaceuticals 0.13 43.79 68.8 48 58 39 44
477 12/31/2018 VTR – Ventas 1.05 1.79 10.95 50 60 64 64
478 12/31/2018 VZ – Verizon 1.94 5.87 11.87 48 62 61 56
479 12/31/2018 WAB – Wabtec 1.32 3.82 6.74 45 44 45 49
480 12/31/2018 WAT – Waters 0.73 14.47 24.55 48 55 55 49
481 11/30/2018
WBA -
Walgreens 0.44 7.63 3.96 44 56 64 54
482 12/31/2018
WCG - WellCare
Health Plans 0.5 4.01 2.16 43 54 41 53
483 12/31/2018
WDC - Western
Digital 0.95 2.93 4.34 48 56 54 52
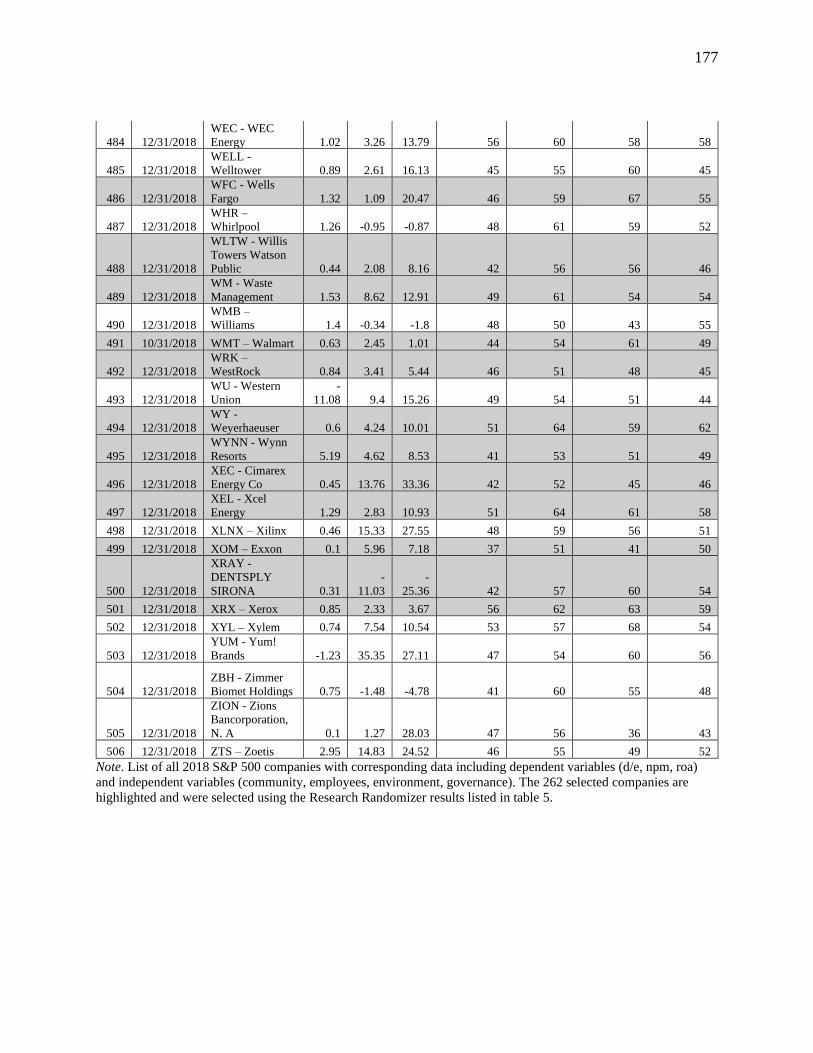
177
484 12/31/2018
WEC - WEC
Energy 1.02 3.26 13.79 56 60 58 58
485 12/31/2018
WELL -
Welltower 0.89 2.61 16.13 45 55 60 45
486 12/31/2018
WFC - Wells
Fargo 1.32 1.09 20.47 46 59 67 55
487 12/31/2018
WHR –
Whirlpool 1.26 -0.95 -0.87 48 61 59 52
488 12/31/2018
WLTW - Willis
Towers Watson
Public 0.44 2.08 8.16 42 56 56 46
489 12/31/2018
WM - Waste
Management 1.53 8.62 12.91 49 61 54 54
490 12/31/2018
WMB –
Williams 1.4 -0.34 -1.8 48 50 43 55
491 10/31/2018 WMT – Walmart 0.63 2.45 1.01 44 54 61 49
492 12/31/2018
WRK –
WestRock 0.84 3.41 5.44 46 51 48 45
493 12/31/2018
WU - Western
Union
-
11.08 9.4 15.26 49 54 51 44
494 12/31/2018
WY -
Weyerhaeuser 0.6 4.24 10.01 51 64 59 62
495 12/31/2018
WYNN - Wynn
Resorts 5.19 4.62 8.53 41 53 51 49
496 12/31/2018
XEC - Cimarex
Energy Co 0.45 13.76 33.36 42 52 45 46
497 12/31/2018
XEL - Xcel
Energy 1.29 2.83 10.93 51 64 61 58
498 12/31/2018 XLNX – Xilinx 0.46 15.33 27.55 48 59 56 51
499 12/31/2018 XOM – Exxon 0.1 5.96 7.18 37 51 41 50
500 12/31/2018
XRAY -
DENTSPLY
SIRONA 0.31
-
11.03
-
25.36 42 57 60 54
501 12/31/2018 XRX – Xerox 0.85 2.33 3.67 56 62 63 59
502 12/31/2018 XYL – Xylem 0.74 7.54 10.54 53 57 68 54
503 12/31/2018
YUM - Yum!
Brands -1.23 35.35 27.11 47 54 60 56
504 12/31/2018
ZBH - Zimmer
Biomet Holdings 0.75 -1.48 -4.78 41 60 55 48
505 12/31/2018
ZION - Zions
Bancorporation,
N. A 0.1 1.27 28.03 47 56 36 43
506 12/31/2018 ZTS – Zoetis 2.95 14.83 24.52 46 55 49 52
Note. List of all 2018 S&P 500 companies with corresponding data including dependent variables (d/e, npm, roa)
and independent variables (community, employees, environment, governance). The 262 selected companies are
highlighted and were selected using the Research Randomizer results listed in table 5.