Embed Size (px)
Citation preview

Modified version
FDI, Firm Heterogeneity and Exports
An examination of evidence in India
Maitri Ghosh and Saikat Sinha Roy
**
Abstract: The paper analyses the effect of foreign direct investment on firm-level export
performance across manufacturing sectors in India. FDI inflow in India during post reforms is
expected to improve export competitiveness. Such improvements are found to vary across
sectors with varying levels of FDI and hence MNE participation across sectors. Further, the
evidence of inter-firm variations in export performance across sectors is indicative of the
existence of factors specific to firms. In determination of export performance a firm specific
model has been set up for econometric estimation. Panel data estimation results show that
ownership along with import of technology (embodied and disembodied), in- house R &D,
import of raw materials, and expenditure on marketing, advertising and distribution are the major
determining factors of firm-level exports. Firm-level productivity and credit availability also play
significant role in certain sectors. As FDI brings with it a huge base of tangible and intangible
assets, it also results in positive externalities or spillovers through various channels of
transmission. The results also show presence of export spillovers from foreign to domestic firms
in some manufacturing sectors.
JEL Classification No: F16, F23, L25, C23
Key words: Export competitiveness, FDI, Multinational Enterprises, Export spillovers, Panel data estimation
Corresponding Author, Ph.D. Scholar, Department of Economics, Jadavpur University, Kolkata, and Assistant
Professor, Bethune College, 181 Bidhan Sarani, Kolkata – 700 006. INDIA. E-mail: [email protected]. **
Associate Professor, Department of Economics, Jadavpur University, Kolkata – 700 032. INDIA. E-mail:
The first author acknowledges funding from University Grants Commission Minor Research Project Scheme to
carry out this research. The authors are grateful to the Department of Economics, Jadavpur University, Kolkata for
permission to use the Prowess Database. An earlier version of this paper was presented in the recent UGC-sponsored
annual conferences at the Burdwan University, Jadavpur University and Kalyani University and at a UGC sponsored
National Seminar organised by Women’s Christian College, Kolkata. The authors thank Achin Chakraborty, Ajitava
Raychaudhuri, Biswajit Chatterjee, Chetan Ghate, M. Parameswaran, Pranab Kumar Das, Rajendra Vaidya, and
Sarmila Banerjee for comments on different stages of this work. Help from Pradyut Kumar Pyne is also gratefully
acknowledged. However, the responsibility of errors, if any, lies with the authors.
1
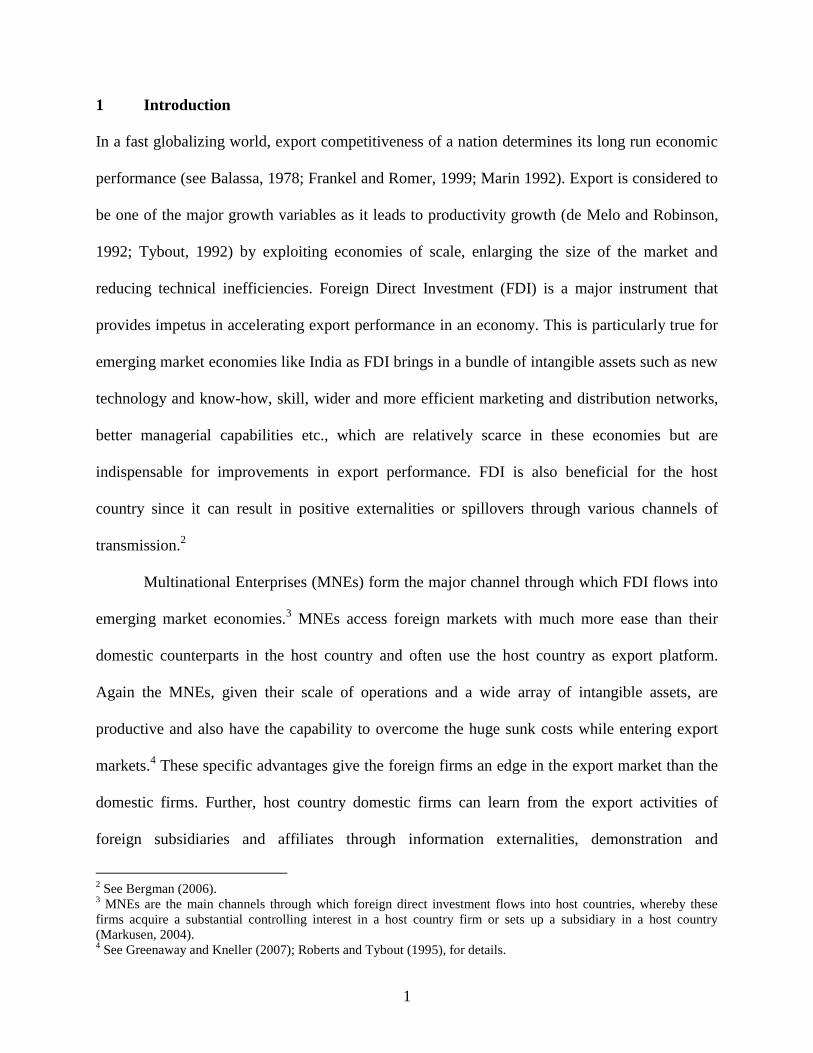
1 Introduction
In a fast globalizing world, export competitiveness of a nation determines its long run economic
performance (see Balassa, 1978; Frankel and Romer, 1999; Marin 1992). Export is considered to
be one of the major growth variables as it leads to productivity growth (de Melo and Robinson,
1992; Tybout, 1992) by exploiting economies of scale, enlarging the size of the market and
reducing technical inefficiencies. Foreign Direct Investment (FDI) is a major instrument that
provides impetus in accelerating export performance in an economy. This is particularly true for
emerging market economies like India as FDI brings in a bundle of intangible assets such as new
technology and know-how, skill, wider and more efficient marketing and distribution networks,
better managerial capabilities etc., which are relatively scarce in these economies but are
indispensable for improvements in export performance. FDI is also beneficial for the host
country since it can result in positive externalities or spillovers through various channels of
transmission.2
Multinational Enterprises (MNEs) form the major channel through which FDI flows into
emerging market economies.3 MNEs access foreign markets with much more ease than their
domestic counterparts in the host country and often use the host country as export platform.
Again the MNEs, given their scale of operations and a wide array of intangible assets, are
productive and also have the capability to overcome the huge sunk costs while entering export
markets.4 These specific advantages give the foreign firms an edge in the export market than the
domestic firms. Further, host country domestic firms can learn from the export activities of
foreign subsidiaries and affiliates through information externalities, demonstration and
2 See Bergman (2006).
3 MNEs are the main channels through which foreign direct investment flows into host countries, whereby these
firms acquire a substantial controlling interest in a host country firm or sets up a subsidiary in a host country
(Markusen, 2004). 4 See Greenaway and Kneller (2007); Roberts and Tybout (1995), for details.

2
competition channels thereby resulting in export spillovers. This paper investigates into these
various dimensions of firm-level export performance across manufacturing industries in India
during post-reforms period. In particular, the paper empirically tests whether ownership
determines firm-level export performance in India and in what way MNE export performance
impacts on domestic firms. The focus is to understand whether inflows of FDI following
economic reforms have provided the required trigger for an improvement in overall export
performance of Indian manufacturing industries.
After maintaining restrictions in cross-border trade till the mid-1980s and selective
approach towards foreign direct investment till late 1980s, policy reforms were introduced in
India. This was part of an entire gamut of policy changes since the early 1980s with industrial
delicensing to start with and followed by trade policy changes in 1985 and both carried forward
in 1991 along with wide-ranging complementary changes in other policies, thus embarking upon
a phase of openness in the economy. The reforms in foreign investment policy measures initiated
in 1991 made India more open and proactive with a view not only to get better access to
technology but also to build strategic alliances to penetrate the world market (Ahluwalia, 2008)
and improve India’s export competitiveness (see Kumar and Joseph, 2007).5 The reforms
provided equal incentives across sectors, the sectors responded differently to the stimuli resulting
in varied export performance6. Such evidence is indicative of the continuing existence of various
sector specific factors that determine performance across sectors. Further, within each sector,
there are firm specific factors including firm ownership that determine export performance.
Apart from ownership firm heterogeneity is one such factor determining export
performance. In any sector, firms widely differ in terms of size and productivity. Melitz (2003)
5 See Nagaraj (2003) for a different view which suggests that there is little evidence to show that higher FDI inflows
have led to faster output and export growth in India. 6 See Sinha Roy (2009) for detailed account of varying export performance across sectors.
3
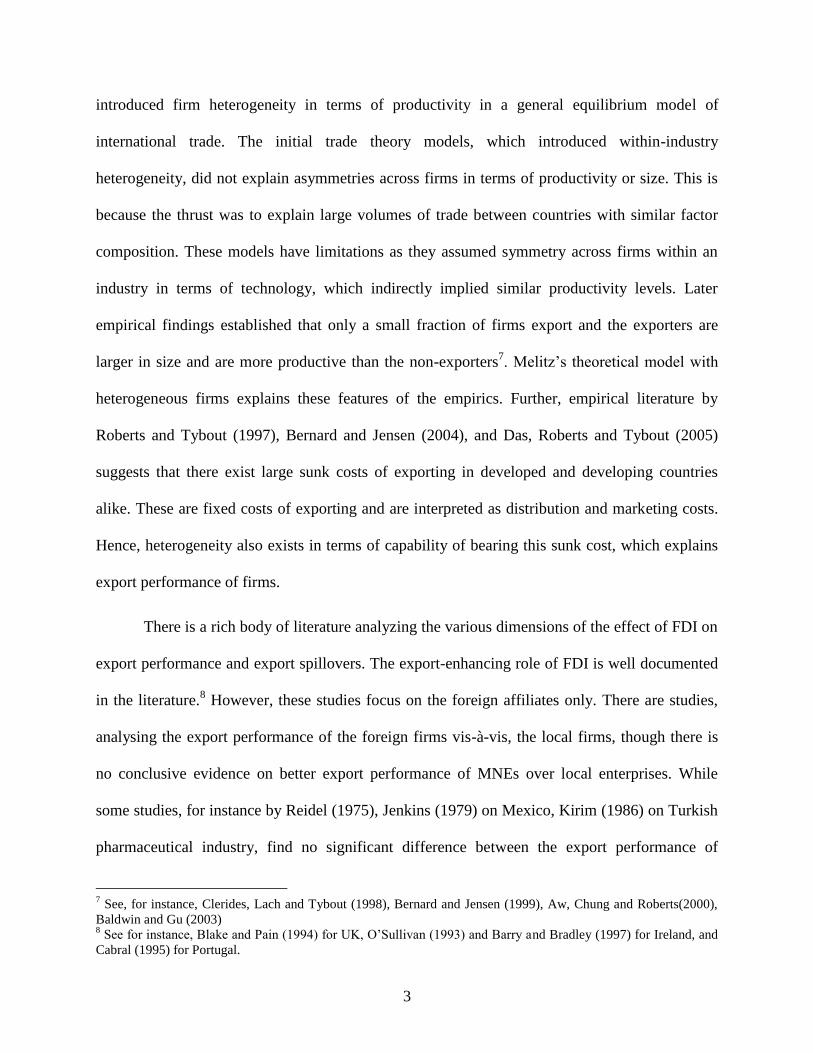
introduced firm heterogeneity in terms of productivity in a general equilibrium model of
international trade. The initial trade theory models, which introduced within-industry
heterogeneity, did not explain asymmetries across firms in terms of productivity or size. This is
because the thrust was to explain large volumes of trade between countries with similar factor
composition. These models have limitations as they assumed symmetry across firms within an
industry in terms of technology, which indirectly implied similar productivity levels. Later
empirical findings established that only a small fraction of firms export and the exporters are
larger in size and are more productive than the non-exporters7. Melitz’s theoretical model with
heterogeneous firms explains these features of the empirics. Further, empirical literature by
Roberts and Tybout (1997), Bernard and Jensen (2004), and Das, Roberts and Tybout (2005)
suggests that there exist large sunk costs of exporting in developed and developing countries
alike. These are fixed costs of exporting and are interpreted as distribution and marketing costs.
Hence, heterogeneity also exists in terms of capability of bearing this sunk cost, which explains
export performance of firms.
There is a rich body of literature analyzing the various dimensions of the effect of FDI on
export performance and export spillovers. The export-enhancing role of FDI is well documented
in the literature.8 However, these studies focus on the foreign affiliates only. There are studies,
analysing the export performance of the foreign firms vis-à-vis, the local firms, though there is
no conclusive evidence on better export performance of MNEs over local enterprises. While
some studies, for instance by Reidel (1975), Jenkins (1979) on Mexico, Kirim (1986) on Turkish
pharmaceutical industry, find no significant difference between the export performance of
7 See, for instance, Clerides, Lach and Tybout (1998), Bernard and Jensen (1999), Aw, Chung and Roberts(2000),
Baldwin and Gu (2003) 8 See for instance, Blake and Pain (1994) for UK, O’Sullivan (1993) and Barry and Bradley (1997) for Ireland, and
Cabral (1995) for Portugal.
4
foreign controlled enterprises and their local counterparts, Cohen (1975), based on some export
oriented firms in South Korea, Taiwan and Singapore, concludes that local firms’ export
performance outperformed that of foreign firms. For India, Aggarwal (2002) finds better export
performance of MNE affiliates than their local counterparts. However, no strong evidence was
found to suggest that India was attracting efficiency-seeking outward-oriented FDI. Further,
Aggarwal (2002) shows that low-tech industries with high foreign ownership have better
competitive advantage than high-tech ones. Earlier, Subrahmanian and Pillai (1979) and Kumar
(1989) also arrived at similar results in case of Indian manufacturing sector. This is in line with
other empirical works relating to India and other developing countries [Newfarmer and Marsh,
(1981), quoted in Lall and Mohammad, (1983)]. Singh (1986), in a different analysis on export
and import propensities and balance of trade for a sample of Indian pharmaceutical firms, finds
that, compared to the local firms, the foreign firms have higher export intensity along with a
much higher import intensity. Again, among the foreign firms, affiliates of relatively big MNEs
seem to have lower balance of trade deficit, arising from lesser dependence on imported raw
materials.
The MNEs endowed with specific advantages can bring indirect effects on the host
country domestic firms through various channels of transmission. This spillover effect of MNEs
might ultimately lead to productivity growth of the host economy as a whole [Caves (1972);
Globerman(1979), Blomstorm and Persson (1983), Haddad and Harrison (1993). Aitken, Hanson
and Harrison (1997), also looking into export spillovers for Mexican industries, tested whether
spillovers associated with one firms’ export activity reduce the cost of exporting for other firms.
Evidence of spillovers was found in MNEs, but not from general export activity. There is no
conclusive evidence on the export inducing presence of FDI in the host country. Greenaway,

5
Sousa and Wakelin (2004) confirm the presence of positive spillovers from MNEs on the
decision of domestic firms to export as well as their export propensity in the UK. Bergman
(2006) shows that despite high productivity for India’s pharmaceutical firms with foreign
ownership, the correlation between FDI and domestic firms’ productivity turns out to be
insignificant.
Any further research on the issue of FDI and export performance in an emerging country
such as India thus has to investigate into both export performance of MNEs vis-à-vis their local
counterparts at a further disaggregate level as well as spillover effects of MNEs on local firms
with regards to export performance. This research work investigates into these various
dimensions of firm-level export performance across manufacturing industries in India during
post-reforms period. In doing so, the study controls for various factors that determine export
performance of Indian manufacturing enterprises while highlighting on whether foreign
ownership is important for export performance and whether the exporting activity of the MNEs
has spillover effects on exporting behaviour of the domestic firms. This is where the study, in
particular, contributes to the existing literature.
The paper is organized as follows. Section 2 provides some stylized facts on the overall
export performance of the Indian manufacturing industries during 1991-2010. Section 3
discusses the analytical framework, the empirical model and method, and the database for
analyzing the determinants and spillover effects of firm-level export performance. Section 4
presents the empirical results and discusses on the determinants of firm-level export performance
and spillovers. Section 5 summarizes the major findings of the paper and puts forth the policy
implications.

6
2 Export Intensity during Post-Reforms: Some facts
Earlier studies have shown that India’s FDI inflows increased substantially since reforms
in 1991, with wide-ranging changes in sectoral composition (Kumar, 2005). The shift has been
from the primary to the secondary to the service sector. Within manufacturing, FDI stocks were
the largest in chemicals industry during the mid-1990s. FDI stocks in food and beverages and the
transport equipments industry became predominant in 2000.9 Along with increase in FDI stocks,
average firm-level export intensity across manufacturing sectors in India improved during post-
reforms, especially after the year 2000. The average intensity for manufacturing, as is evident in
Table 1, increased from 0.10 in 1990s to 0.15 in 2000s.
The sectors considered for the purpose are food and beverages, textiles, chemicals, metal
and metal products, machinery and transport equipment industries, which account for about 70
per cent of India’s merchandise exports. The choice of these industries also gives us the insight
about post-reform export performance of low technology industries in comparison to the medium
and high tech industries. This analysis is carried out using Prowess Database of the Centre for
Monitoring Indian Economy (CMIE).
Table 1: Firm-level Average Export Intensity in India during Post-Reforms
Year Food &
beverages Textiles Chemical
Ferrous
Metals
Non -
Ferrous
Metals
Electrical
Machinery Electronics
Non
Electrical
Machinery
Transport
Equipments
All
industries
1990s 0.24 0.22 0.09 0.04 0.13 0.06 .007 0.07 0.10
0.10
2000s 0.28 0.29 0.18 0.04 0.26 0.07 0.01 0.12 0.11
0.15
Source: Calculations based on CMIE, PROWESS database.
9 See Chakraborty and Nunnenkamp (2008) for industry specific FDI stocks.

7
The average export intensity for food and beverages, textiles, chemicals, non-ferrous
metals and non-electrical machinery industries as a whole, increased after 2000.10
Average
export intensity of chemicals and non ferrous metals doubled in the decade of 2000s over the
decade of the 1990s. The average export intensity in chemicals increased from 0.07 in 1991 to
0.28 in 2010, with drugs and pharmaceutical industry accounting for the largest share along with
a better performance than the sectoral average. It is important to mention here that foreign
investments up to 100 per cent have been allowed since December 2001 (Kumari, 2007). The
improvements in export intensity in textiles can largely be due to the potential benefit during the
post-MFA regime. Such improvements in textiles, though slow in comparison to China, is
impressive because it occurred despite, among other factors, low productivity, technological
obsolescence, low scale of operation, rigid labor laws (Tewari, 2005).
On the other hand, the corresponding improvements are relatively small for electrical
machinery and transport equipments11
. Despite improvements, the average export intensity for
electronics continues to remain low in the decade of 2000. This pattern is also true for ferrous
metals, which is despite substantial increase in export intensity of steel products (Table A.1) 12
.
There are further nuances underlying improvements in performance. It is important to
understand whether export performance depends on ownership13
of firms, given the common
perception that foreign firms perform better than the domestic firms especially during post
10
Calculation for the weighted average export intensity for each broad category of industry has been done taking the
2000 as the base year, as this was a normal year and post-reform export intensities across products are found to have
improved since this year. The export share of each sub category within each industry for the year 2000 is taken as
the weight. 11
Transport equipments show an increase in export intensity, particularly after 2003. This is of particular
importance as many joint ventures have been set up in India with foreign technical and financial collaboration with
leading global manufacturers. 12
China is one of the major iron and steel markets accounting for about 32 per cent of India’s total exports of these
products in 2006. 13
Ownership in our analysis is not related to equity shares, as the equity data for firms are not available for the
entire time period under consideration. Again, we could not use dummies as in that case we could not have dealt
with the fixed effect specifications.

8
reforms. Table 2 reveals differences export performance between foreign firms and their
domestic counterparts across manufacturing sectors. While foreign firms have significantly
higher average export intensities than domestic firms, domestic firms in chemicals, metal and
metal products and textiles industries are found to significantly perform better than foreign firms.
However, the differences in the average export intensities between the two ownership categories
Table 2: Ownership-wise difference in firm-level average export intensity
Industry Mean export
intensity of the
domestic firms
Mean export
intensity of the
foreign firms
t value Implication
Food and Beverages 2.49 .32 1.2 No significant difference
Machinery .08 .12 5.4 Significant differenceb
Metal and metal products .41 .10 4.5 Significant differencec
Textiles .23 .16 6.9 Significant differenced
Chemicals .13 .12 2.03a
Significant differencee
Transport Equipment .15 .05 1.24 No significant difference
Note:
t values calculated using two-sample (export intensity of the domestic and the foreign firms)mean
comparison test with unequal variances.
H0: mean (export intensity of domestic firms)- mean (export intensity of foreign firms)=0
HA: mean (export intensity of domestic firms) - mean (export intensity of foreign firms)0
For large sample the critical t value at 5% level of significance is 1.96 and at 1%level is 2.57.
a: Null hypothesis rejected at 5% level but accepted at 1% level.
b: Ha: diff < 0 , Pr(T < t) = 0.0000 c: Ha: diff > 0,Pr(T > t) = 0.0000 d: Ha: diff > 0,Pr(T > t) = 0.0000
e: Ha: diff > 0, Pr(T > t) = 0.039
of firms in the food and beverages and the transport equipment industries. These findings of no
better performance of foreign over domestic enterprises in the food and beverages, transport
equipment, chemical, textile and the metal and metal product industries in India are in
conformity with that of Kumar (1990), Pant (1993), and Siddharthan (1994).
On the whole, firm-level export intensity across manufacturing industries in India shows
an increase in the post reforms period particularly after 2000. The industries that show an
improvement are chemicals, food and beverages, textiles, non-ferrous metals, electrical
machinery, non-electrical machinery and transport equipments. Electrical machinery and
9
transport equipments industries are however exceptions to this pattern. In particular, the
improvements are spectacular for high/medium technology industries as chemicals and non-
ferrous metals. For low technology industries like food and beverages and textiles, the
improvements are noteworthy. Further, export intensities of multinational enterprises are not
significantly higher than that of their domestic counterparts across industries with the sole
exception of machinery. On the other hand, domestic firms show better performance than
foreign-controlled ones. The above observations call for an analysis of determinants of firm-level
export performance. The analysis that follows also show whether ownership pattern explains the
difference in firm-level export performance across industries.
3 Determinants of firm level export performance
3.1 Analytical framework
MNEs not only bring in capital investment but also prove to be beneficial to the host
country as they possess product/ process technology, marketing and managerial skills etc. and
use the host country as export platform. MNEs can also potentially help the domestic firms
particularly in terms of exporting. These perspectives with regards to MNEs help develop the
framework for analyzing firm-level export performance in an emerging market economy. Aitken
et al. (1997) tests the hypothesis that MNEs act as export catalysts to indigenous firms. Recent
empirical evidence however reflects that heterogeneity of firms is crucial in understanding firm-
level performance as well as international trade (Bernard, Eaton, Jensen and Kortum (2003),
Melitz (2003), Helpman, Melitz and Yeaple (2004), Melitz and Octaviano (2008), Yeaple
(2005)). Heterogeneity can be explained in terms of productivity of firms as well as in terms of

10
fixed/sunk costs of exporting. Schmitt and Yu (2001) present a model where they explain that
heterogeneity comes from specific costs rather than marginal costs.
The model that follows is essentially a supply side one based on Aitken, Hanson and
Harrission (1997). Aitken et al. (1997) analyzes the decision of a representative domestic firm to
choose between serving the domestic market, to export in the foreign market or to do both in
order to maximize profit. The profit function of a typical firm, which depends on prices, the
quantities sold in the domestic and the foreign market and the costs, is as follows:
(1)
0,, fd qqst
The subscripts d and f are for the domestic and the foreign markets respectively. The costs in
this framework are divided into three categories. The (.)h function signifies the production costs.
As production cost is independent of the market the commodity is sold, h is a function of
( fd qq ). The cost of distribution, as Aitken et al. (1997) put forth, varies according to
destination and it is assumed that domestic distribution costs are lower than foreign distribution
costs. )( dqm and )( fqm respectively represent the cost of distribution in the domestic and
foreign markets. The representative firm maximises profit . The cost function in Equation (1),
as specified by Aitken et al. (1997), is as follows:
)()(*2/)( 2
fdfdfd qqgqqaqqh and, (2)
),,,(
),(
),,(,
,
*2/1)(2
MNEEXfff
ddd
iiiiii
ZXcc
ZXcc
Xggwhere
dfi
qcqbqm
)()()( fdfdffdd qmqmqqhqpqp

11
X is the cost common to both markets. There are also specific market costs represented
by iZ . MNEEX , are respectively total export activity and total MNE export activity. Ω and ψ
respectively imply competition effects and imitation/demonstration effects. ii cbga ,,, are scalar
parameters.
Given the data limitations, the above model by Aitken et al. (1997) is modified to exclude
market specific costs. In this model, sunk cost of production and distribution incurred by the
representative firm is included. For instance, a firm’s R&D expenditure is treated as the sunk
cost of production, and the costs borne by the firm for advertising, creating export infrastructure,
developing market channels are sunk costs of distribution. The profit maximizing function of
representative firm can be written as:
(3)
where s is lump sum sunk cost of production and distribution.
Profit maximisation gives rise to the export function. Here exports not only depend on the sunk
costs of production and distribution, other supply side factors like size and age of a firm,
productivity, import of technology and in-house R&D, and ownership of a firm play important
roles. We also attempt to establish a case where exporting activity of MNEs may lead to
reduction in costs of exporting by the domestic firm. This in turn explains export spillovers. In
what follows is a detailing out of various factors that determine firm-level export performance
and spillovers.
sqqhqpqp fdffdd )(
12
3.2.1 Firm size
Firm size is often considered to be a proxy for the resource base, risk perception and
economies of scale that determines the export attitude and performance of the firm (Kumar and
Pradhan, 2003). Smaller firms with their resource constraints are mostly scale inefficient, while
larger firms can exploit economies of scale. A positive relationship between firm size and export
performance is thus expected. The empirical literature however has mixed findings on the
relationship between firm size and export performance14
. Some studies including Bonaccorsi,
(1992), Kumar and Sidhharthan (1994), and Sterlacchini (2001) establish a nonlinear
relationship. In view of the presence of this possible nonlinearity our analysis considers a
nonlinear relationship between size and firm-level export performance.
3.2.2 Age
Age of a firm is often used in the literature to capture the extent of a firms’ learning
experience leading to greater experimental and tacit knowledge. Older firms also might have
superior cost structure, as they are experienced from exporting and therefore able to bear the
sunk costs of exporting. Age of firms is considered to be positively associated with exporting
(Rasiah, 2003; Iyer, 2010). In our study we consider age of a firm to be positively related to
export intensity. Age is represented by the number of years the firm is in operation since
inception.
14
For instance, Bernard and Jensen (1999), Bernard and Wagner (1997) establish a linear relationship, and Kumar
and Siddharthan (1994), Bernard and Wagner (2001) establish a nonlinear relationship.

13
3.2.3 Productivity
Empirical works find that trade forces least productive firms to exit [see, among others,
Aw, Chung and Roberts (2000) and Clerides, Lack and Tybout (1998)]. These works imply that
a few productive firms within a sector, which expect a profit stream sufficiently high to cover the
sunk costs of entry into a foreign market, find it profitable to export. Following Melitz (2003),
models postulate that firms are heterogeneous and only productive firms self select into export
markets. In order to incorporate heterogeneity of firms in our model, following the literature we
use firm productivity. We postulate that firm-level export performance is positively related to
productivity.
3.2.4 Research and Development
In an increasingly knowledge based world, technological capacity is seen as an important
component of a country’s international competitiveness and growth (Kumar & Aggarwal, 2005),
and in most cases the government emphasizes on improving the innovative capacity of the
enterprises which is often referred to as techno-protectionism (Kumar & Sidhharthan, 1997). It is
believed that with research and development15
a firm becomes cost competitive and thereby has
an improved export performance (Fargerberg, 1988; Soete, 1981). Firm-level studies on Indian
manufacturing [for instance, Aggarwal (2001), Kumar and Sidhharthan (1994), Patibandala
(1995), Hassan and Ralini (2002)] also focus on export augmenting role of R&D expenditure. In
15
A complex debate exists in literature regarding the relationship between imports of foreign technology and
undertaking R&D by the manufacturing enterprise. Some studies explain a complementary relationship while others
argue substitution (Kumar and Aggarwal, 2005). Most studies have dealt with disembodied technology imports and
R&D expenditure. In case of India a complementary relationship is found between technology imports and R&D
expenditure in most of the cases (Lall, 1983, Katrak, 1989, Kumar, 1987, Aggarwal, 2000). It is believed that when
knowledge is imported, further research is taken up by the enterprises to absorb and adapt the imported knowledge.
Without in-firm research and development and local adaptation of foreign technology, it does not confer cost
effectiveness on firms automatically. Embodied knowledge can also aid R&D activities of a firm (Basant, 1997).
Following this we would consider complementarity between import of foreign technology and local R&D.

14
our study, we postulate in-house R&D as a determinant of export performance. The expenditure
of a firm on research and development is basically sunk in nature. Since cost functions are
inherently nonlinear, we postulate a nonlinear relationship between R&D expenditure and export
performance of a firm.
3.2.5. Import of technology
For most developing countries, research and development is mainly adaptive rather than
fundamental in nature and, since the late sixties, most developing countries have relied
extensively on technology import (Kathuria, 1998). In countries like India, import of technology
forms one of the major channels through which knowledge is acquired. Technology can be
imported in both embodied and disembodied forms. Embodied technology is imported in the
form of raw materials, intermediate goods and mostly capital goods, while imported disembodied
technology includes patented knowledge, technical know-how, drawings and designs etc. It is
believed that imported technology makes a firm cost competitive. We hypothesize that, in the
post-reforms period, imports of technology, embodied and disembodied are likely to positively
impact on firm-level exports. The relationship can possibly be non-linear as well. In this
analysis three variables, namely, imports of raw materials, import of capital goods, foreign
technical know-how to account for both embodied and disembodied technology imports are
considered. Further, foreign technical know-how and import of capital goods are summed up to
arrive at a new variable, import of foreign technology.
15
3.2.6 Specific costs
Exploring a foreign market requires strong marketing and distribution networks. If a firm
incurs expenditure on marketing and distribution, advertises for its product then it might attain
cost competitiveness in exporting its product in a foreign market. Hence, in our model we have
considered advertising expenditure, marketing expenditure, and distribution expenditure as
determinants positively influencing export performance. The data on firm-level expenditure on
advertising, marketing and distribution show a wide heterogeneity among the firms. As a result,
we expect non-linearity. For the purpose of our analysis and to avoid multicollinearity,
expenditures on marketing, distribution and advertising are added up to arrive at a single
variable, marketing and distribution costs.
3.2.7 Availability to Credit
There are empirical studies, which explain the trade- finance linkage and show the impact
of credit constraints on firm’s export performance16
. There is also a growing body of recent
theoretical literature that looks at the impact of credit market imperfections on firms within the
Melitz (2003) framework [e.g. Chaney (2005); Helpman, Melitz and Rubenstein (2006); Manova
(2008)]. The main results of these studies show that in addition to heterogeneity of firms in terms
of productivity and capability to overcome sunk costs, credit constraints also affect exports of
firms. In the Indian context, Kapoor, Ranjan and Raychaudhuri (2011) have established a causal
link from credit constraints to real outcomes of exporting firms following two exogenous policy
changes in India that affected the availability of subsidized credit to small firms. This study takes
into account availability of credit to a firm to impact on its export intensity. We hypothesise that
higher credit availability leads to better firm-level export performance.
16
See Mirabelle (2008) for Belgian firms, Greenaway, Guariglia and Kneller (2008) for UK firms and Paravisini,
Rappaport, Schnabl and Wolfenzen (2011) for Peruvian firms.

16
3.3 The Estimation Model
The estimation model, in its general form, is:
EXPI=α0 + α1(SIZE)+α2(SIZE)2+ α3(IMPR)+ α4(IMPR)
2+ α5(KI)+ α6(KI)
2+ α7(FPTR)
+ α8 (FPTR)2+ α9(MKTCOST)+ α10(MKTCOST)
2+ α11(AGE)+ α12(PDTIVITY)
+ α13 (PDTIVITY)2+ α14 (CRDT) + α15(RDI)+ α16 (RDI)
2 +uit (4)
where αi, i=1 to 16 > 0
SIZE: Ratio of firm sales to industry sales.
IMPR: Ratio of imports of raw materials to sales.
KI: Ratio of imports of capital goods to sales.
FPTR: Ratio of technical fees and royalties paid abroad to sales.
MKTCOST: Sum of ratio of advertising expenditure to sales, ratio of marketing expenditure to
sales and ratio of distribution expenditure to sales.
AGE: Absolute age of the firm in number of years.
PDTIVITY: Ratio of value of output to salaries and wages.
CRDT: Ratio of total borrowing to value of output.
RDI: Ratio of R&D expenditure to sales.
The model showing spillovers can be specified as:
DOMX=α0 + α1(SIZE)+α2(SIZE)2+ α3(IMPR)+ α4(IMPR)
2+ α5(KI)+ α6(KI)
2+ α7(FPTR)
+ α8 (FPTR)2+ α9(MKTCOST)+ α10(MKTCOST)
2+ α11(AGE)+ α12(PDTIVITY)
+ α13 (PDTIVITY)2+ α14 (CRDT) + α15(RDI)+ α16 (RDI)
2 + α17 FOR +uit (5)
where αi, i=1 to 17 > 0, and α 17 > 0 indicates positive export spillovers
DOMX: Export intensity of domestic firms.
FOR: Average Export intensity of foreign firms.

17
3.4 The Method and Data
In our analysis we have used the Ordinary Panel data estimation technique. To estimate
time series and cross sectional data in a single equation framework, Panel data estimation
technique is widely used in literature. It helps to simultaneously accommodate large volume of
data set across time and distinguishes between time-series movement and cross-sectional
movement of the data.
For estimation purposes17
of the model, both Fixed and Random effects specifications
are considered. When cross-sectional heterogeneity is correlated with the other explanatory
variables of the model, then fixed effect model provides an efficient estimator. On the other
hand, if the unobserved cross-sectional heterogeneity is assumed to be uncorrelated with other
explanatory variables of the model, then random effect model provides efficient estimator of the
parameters. In our model, the Hausman Specification test is taken into consideration to
distinguish between fixed and random effects. Both the fixed and random effects estimators are
efficient Feasible GLS estimators. The significance of F statistic and the Wald statistic for the
fixed and random effects respectively suggest that the explanatory variables significantly explain
variations in the dependent variable, which in this case is export intensity. The problem of
multicollinearity is avoided by studying the correlation matrices.
Firm-level data is obtained from Prowess Database published by the Centre for
Monitoring Indian Economy (CMIE) for the period 1991-2010 for the food and beverages,
textiles, chemicals, metal and metal products, machinery and transport equipments industries.
Statistical information are collected only for exporting firms in this database. A total of 204
observations for the Food & Beverages industry, 763 observations for the textiles and garments
17 The estimation is done using statistical software STATA 10.

18
industry, 1830 observations for the chemicals industry, 219 observations for the metal and metal
product industry, 972 observations for the machinery industry and 439 observations for the
transport equipments industry are thus obtained. These observations include both domestically
owned and foreign owned firms. Panel structures for each of the six industries are constructed
over a period of twenty years. In what follows is a discussion of the findings from various
estimations of model (3) for the food and beverages, textile and clothing, chemicals, metal and
metal products, machinery and transport equipment industries.
4 The Empirical Results
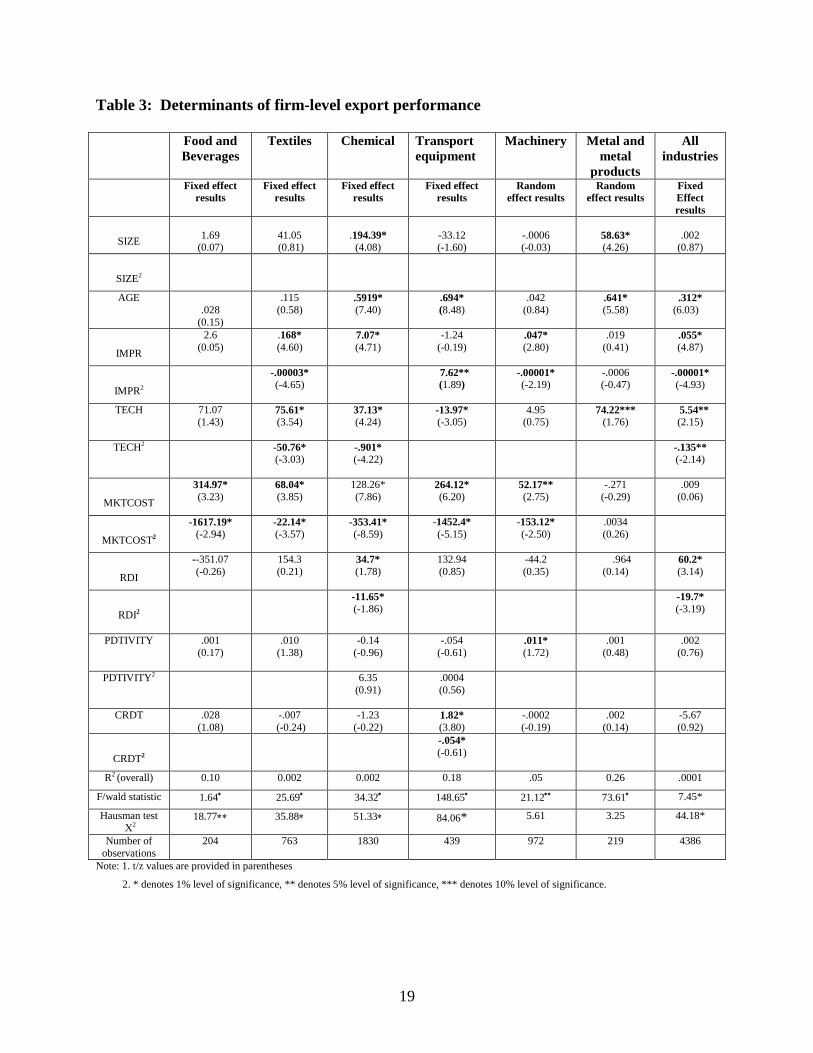
The panel data estimation results of equation (4) showing the determinants of firm-level
export performance are presented in Table 3. Both fixed and random effect results are considered
depending on the Hausman specification test results. If the individual time invariant effects are
correlated with the time varying independent (exogenous) variables then fixed effect method is
consistent. On the other hand, if the time invariant effects are uncorrelated with the independent
variables then random effect model is consistent and efficient. Our estimation exercise shows
fixed effect estimators to be efficient for the food and beverages, textiles, chemicals and
transport equipment industries, while random effect estimators are efficient for machinery and
metal products. The F and the Wald statistic for fixed and random effects respectively suggest
that the explanatory variables significantly explain the variations in firm-level export intensity.
The model thus fits the data well for all industries as well as across sectors.
Table 3 reflects that the Indian manufacturing industries heavily depend on imported raw
materials and foreign technological know-how for exporting. However, local R&D and the age
of the firms are also crucial in explaining the export performance of the Indian firms. The
various factors that explain export performance across industries are as follows.
19
Table 3: Determinants of firm-level export performance
Food and
Beverages
Textiles Chemical Transport
equipment
Machinery Metal and
metal
products
All
industries
Fixed effect
results
Fixed effect
results
Fixed effect
results
Fixed effect
results
Random
effect results
Random
effect results Fixed
Effect
results
SIZE
1.69 (0.07)
41.05 (0.81)
.194.39*
(4.08)
-33.12
(-1.60)
-.0006 (-0.03)
58.63*
(4.26)
.002 (0.87)
SIZE2
AGE
.028
(0.15)
.115
(0.58) .5919*
(7.40) .694*
(8.48)
.042
(0.84) .641*
(5.58) .312*
(6.03)
IMPR
2.6
(0.05)
.168*
(4.60) 7.07*
(4.71)
-1.24
(-0.19) .047*
(2.80)
.019
(0.41) .055*
(4.87)
IMPR2
-.00003*
(-4.65) 7.62**
(1.89)
-.00001*
(-2.19) -.0006 (-0.47)
-.00001*
(-4.93)
TECH
71.07 (1.43)
75.61*
(3.54) 37.13*
(4.24) -13.97*
(-3.05) 4.95
(0.75) 74.22***
(1.76) 5.54**
(2.15)
TECH2
-50.76*
(-3.03) -.901*
(-4.22) -.135**
(-2.14)
MKTCOST
314.97*
(3.23) 68.04*
(3.85)
128.26*
(7.86) 264.12*
(6.20) 52.17**
(2.75)
-.271
(-0.29)
.009
(0.06)
MKTCOST2
-1617.19*
(-2.94) -22.14*
(-3.57) -353.41*
(-8.59)
-1452.4*
(-5.15)
-153.12*
(-2.50)
.0034
(0.26)
RDI
--351.07
(-0.26)
154.3
(0.21) 34.7*
(1.78)
132.94
(0.85)
-44.2
(0.35)
.964
(0.14) 60.2*
(3.14)
RDI2
-11.65*
(-1.86)
-19.7*
(-3.19)
PDTIVITY
.001
(0.17)
.010
(1.38)
-0.14
(-0.96)
-.054
(-0.61) .011*
(1.72)
.001
(0.48)
.002
(0.76)
PDTIVITY2
6.35
(0.91)
.0004
(0.56)
CRDT .028
(1.08)
-.007
(-0.24)
-1.23
(-0.22) 1.82*
(3.80)
-.0002
(-0.19)
.002
(0.14)
-5.67
(0.92)
CRDT2
-.054*
(-0.61)
R2 (overall) 0.10 0.002 0.002 0.18 .05 0.26 .0001
F/wald statistic 1.64 25.69 34.32 148.65 21.12 73.61 7.45*
Hausman test
Χ2 18.77 35.88 51.33 84.06* 5.61 3.25 44.18*
Number of
observations
204 763 1830 439 972 219 4386
Note: 1. t/z values are provided in parentheses
2. * denotes 1% level of significance, ** denotes 5% level of significance, *** denotes 10% level of significance.

20
4.1.1 Firm size
It is found that size turns out to be significant in impacting on firm-level export
performance of chemicals and metal industries (see Table 3). Both of these industries are
medium or high tech industries. The relationship is however linear which is not in conformity
with the earlier works of Kumar and Siddharthan (1994) and Bernard and Wagner (2001) for
German manufacturing firms.
4.1.2 Age
Our estimation results show that Age of the firm, measured in terms of number of years
in operation since inception plays a significant role in determining the firm-level export
behaviour of the high tech industries like Chemicals, metals and metal products and transport
equipments. These industries are medium or high technology industries. This suggests that older
firms have acquired the capability to penetrate in the world market. For firms in low technology
industries like food and beverages and textiles, on the other hand the relationship between age
and export intensity remains insignificant. This might suggest that post reforms low old
technology industries of Indian manufacturing are concentrating more on the domestic markets
(Kumar and Pradhan, 2003), whereas older medium /high technology firms have become
globally competitive.
4.1.3 Productivity
Firm productivity is one of the major ways to explain firm heterogeneity. Estimation
results show that productivity of firms is significant in explaining the variations in firm-level
export intensity in the machinery industry. For the food, textiles and metal industry the

21
relationship is positive though not significant. These results are in conformity with low
productivity in most manufacturing industries during this period. These results however do not
conform to the pattern as shown in the theoretical conjectures by Melitz(2003).This is despite the
fact that technology variables are found to be significant determinants of firm-level export
intensity.
4.1.4 Research and Development
As expected, the impact of research and development intensity (RDI) is positive and
statistically significant on firm-level exports of chemicals. Non-linearity holds good in this
relationship. As chemicals industry is a knowledge-based research and development turns out to
be significant along with technology imports. R&D and technology imports play a
complementary role in acquiring global competitiveness. This result is in line with the
evolutionary school of thought, which suggests that building up own technological capabilities is
essential for competitiveness. However, RDI is not significant in explaining the export intensity
of the food, textile, machinery, metal & metal product and the transport equipment industries.
4.1.5 Import of technology
Import of raw materials capital goods and foreign technology by firms is one of the major
sources of acquiring knowledge from rest of the world and in achieving cost competitiveness by
by using frontier technology and cheaper inputs. Being better in quality than the local available
substitutes, imported raw materials and capital goods improve global competitiveness of firms
and thereby impact on export positively. Disembodied foreign technology aids the process. It is
found that for exports of textiles, chemicals, machinery and the transport equipment import of
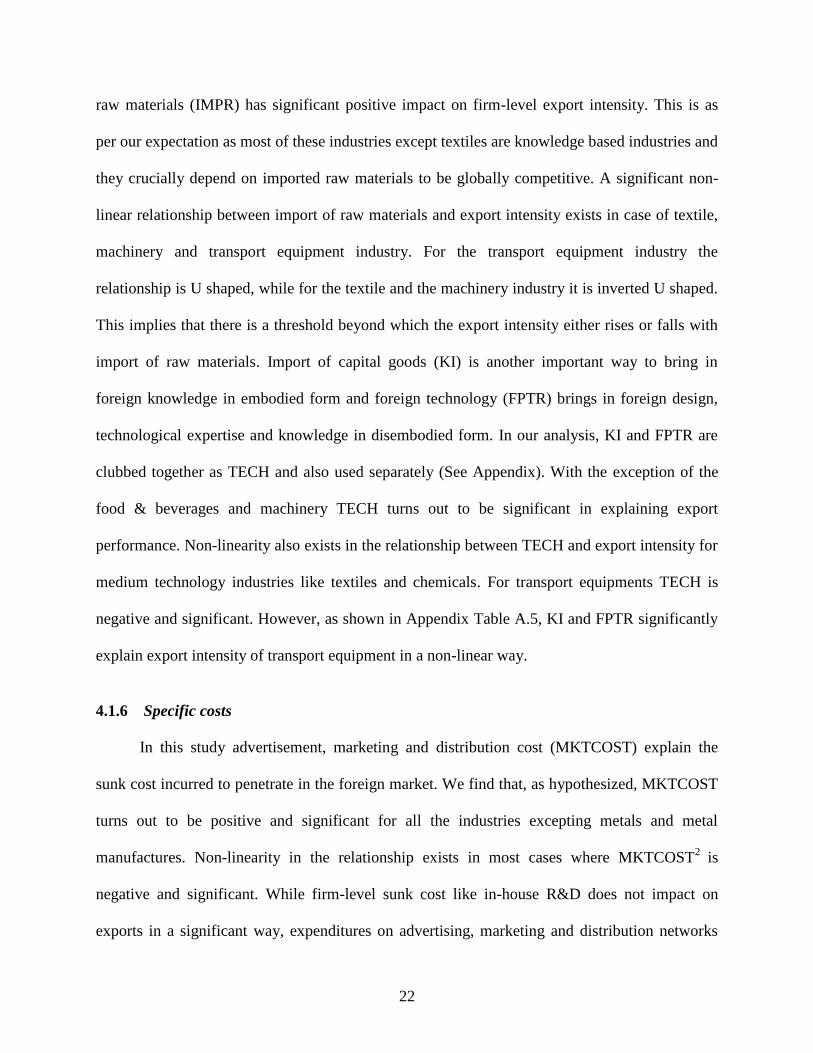
22
raw materials (IMPR) has significant positive impact on firm-level export intensity. This is as
per our expectation as most of these industries except textiles are knowledge based industries and
they crucially depend on imported raw materials to be globally competitive. A significant non-
linear relationship between import of raw materials and export intensity exists in case of textile,
machinery and transport equipment industry. For the transport equipment industry the
relationship is U shaped, while for the textile and the machinery industry it is inverted U shaped.
This implies that there is a threshold beyond which the export intensity either rises or falls with
import of raw materials. Import of capital goods (KI) is another important way to bring in
foreign knowledge in embodied form and foreign technology (FPTR) brings in foreign design,
technological expertise and knowledge in disembodied form. In our analysis, KI and FPTR are
clubbed together as TECH and also used separately (See Appendix). With the exception of the
food & beverages and machinery TECH turns out to be significant in explaining export
performance. Non-linearity also exists in the relationship between TECH and export intensity for
medium technology industries like textiles and chemicals. For transport equipments TECH is
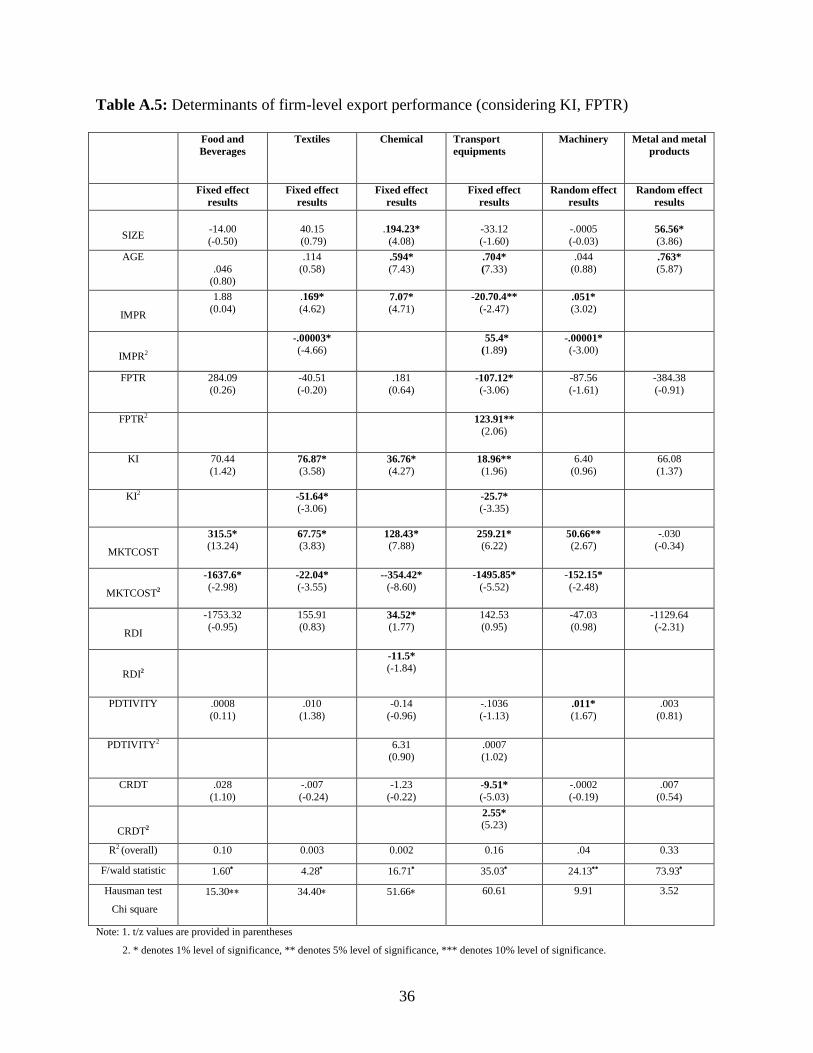
negative and significant. However, as shown in Appendix Table A.5, KI and FPTR significantly
explain export intensity of transport equipment in a non-linear way.
4.1.6 Specific costs
In this study advertisement, marketing and distribution cost (MKTCOST) explain the
sunk cost incurred to penetrate in the foreign market. We find that, as hypothesized, MKTCOST
turns out to be positive and significant for all the industries excepting metals and metal
manufactures. Non-linearity in the relationship exists in most cases where MKTCOST2
is
negative and significant. While firm-level sunk cost like in-house R&D does not impact on
exports in a significant way, expenditures on advertising, marketing and distribution networks

23
become important in exporting across most industries. It is important to note here while the later
has significantly increased over the years, the former continues to remain low in most industries.
These results conform to the theoretical conjecture that firms are heterogeneous in terms of sunk
costs and the capability of overcoming this sunk cost of entering a foreign market is quite an
important factor to explain export intensity.
4.1.7 Credit availability
Availability of credit is found to be significantly affecting the export intensity of
transport equipment industry. Thus the trade-finance linkage empirically suits well for this
industry .We also find presence of non-linearity in the relationship between credit availability
and export performance in this sector. However, in addition to heterogeneity in firm productivity
and the presence of sunk costs, credit availability does not contribute much in the exporting
behavior of the overall Indian manufacturing.
4.2 Export Spillovers
For the analysis of export spillovers we have segregated the firms according to ownership
patterns as domestic and foreign enterprises for machinery, transport equipment, food and
beverages and chemical industries. Textiles and metal and metal products are excluded as the
database does not indicate any firm to be of foreign ownership in these sectors. The only way to
get rid of such a problem relating to data is to look into the equity structure, which in the present
analysis could not be done on account of lack of information for the entire period. Considering
the number of foreign firms exporting each year we have calculated the average export intensity
of the foreign firms (FOR) over the years 1991-2010 for each industry. While estimating export
24
spillovers we postulate that the positive impact of foreign firms’ exporting behavior on the
exporting behavior of the domestic firms is indicative of export spillovers from foreign to
domestic enterprises. As specified in equation (4) we have considered FOR being one of the
variables determining the domestic firms’ export intensity (DOMX). We have a cross section of
228 domestically owned firms for food and beverages, 1601 firms for chemicals, 893 firms for
machinery, and 610 firms for transport equipments industries. Both fixed and random effects are
used in estimation. The Hausman specification test for the two effects is also carried out.
However, since we are studying four separate industries, which by nature are widely different,
the model specification has been changed depending upon the industry concerned. The export
spillover results are presented in Table 4.
The indirect approach to the theory of spillovers explains some important channels of
spillovers namely competition, demonstration and imitation and information externalities. The
direct approach on the other hand relates to spillovers that are directly linked to foreign presence.
From the estimation results presented in Table 4 it is evident that FOR have significant positive
effects for the chemical-exporting firms. This suggests presence of export spillovers from foreign
to domestic firms in this industry. For most other industries FOR remains positive though
insignificant. This implies that inflow of FDI and improved exporting activities of foreign firms
do not necessarily augment exporting activities of domestic firms in the Indian manufacturing.
Rather, the other controlling factors like in-house R&D, marketing and distribution costs and
import of raw materials explain the export performance of the domestic firms.
As MNCs are equipped with better technology, it puts added pressure on domestic firms
to remain competitive. Thus competition from foreign affiliate can have positive spillover effect
on the domestic firms. Hence upgradation of existing technology becomes important for the

25
Table 4: Determinants of firm-level export spillovers
Machinery Transport
equipment
Food & Beverages Chemicals
Fixed effect results Fixed effect results Random effect results Random effect results
FOR
.009
(0.07)
-11.9
(-0.52)
.078
(0.24) .383**
(2.56)
SIZE
-.0005
(-0.28)
2.64
(0.07)
252.06*
(3.39)
SIZE2
-473.58**
(-2.56)
AGE .017
(0.30)
.654*
(5.28) .004
(0.04)
IMPR
0.53*
(3.07) -1.87
(-0.47) 76.25 (0.56)
8.32*
(5.08)
IMPR2
-.00001*
(-3.06) -632.47
(-0.56)
TECH
-.396
(-0.06)
.134
(0.05)
102.08
(0.81)
14.77
(1.54)
TECH2
-.0001
(-0.04)
-.305
(-1.52)
MKTCOST
9.80
(1.02) 210.45*
(4.45) 306.97*
(3.76) 23.95**
(2.29)
MKTCOST2
-1128.02*
(-3.87)
-1646.86*
(-3.30)
RDI
-40.3 (-0.80)
135.37 (10.72)
-58.17 (-0.02)
5.03**
(2.25)
RDI2
-16.08**
(-2.24)
PDTIVITY
.009
(1.42)
-.024
(-0.67)
.001
(0.16)
-.025
(-1.59)
PDTIVITY2
.0002*
(4.20) 9.89
(1.36)
CRDT -.0002 (-0.15)
.089 (0..21)
.020 (0.79)
-1.84 (-0.32)
CRDT2 -.0007
(-0.23)
R2 (overall) 0.03 0.12 0.14 0.03
F/wald statistic 12.75 11.48 27.74 71.47
Hausman test
Chi square 2.34 123.29 2.58 2.30
Number of observations
893 610 228 1601
Note: 1. t values are provided in parentheses
2. * denotes 1% level of significance, ** denotes 5% level of significance, *** denotes 10% level of significance.
26
domestic firms to face the competition from the MNCs. This may be one of the reasons why
R&D significantly explains the export intensity of the domestic chemical firms. However, there
are other factors as well that strongly determines exports of most domestic firms. Exporting
requires very strong distribution networks, good infrastructure and linkages, knowledge of the
consumers’ tastes and preferences, regulatory arrangements in overseas markets etc. Investment
in advertising, marketing and distribution gives the Indian domestic firms in the transport
equipment, food and beverages and chemical industries an edge in exporting. Again, domestic
firms learn to export from the MNCs. This is perhaps true for the transport equipment firms who
have foreign collaborators. Therefore, older firms with high productivity are better performers.
So, not much of a direct spillover effect is felt in this sector either. For the machinery industry
heavy dependence on the imported raw materials is the major driving force.
5 Conclusions and Implications for Policy
In the present study we made an attempt to understand the behaviour of firm-level export
intensity in Indian manufacturing in the post reforms era. We identified the factors that
determine export performance of Indian manufacturing highlighting on whether foreign
ownership is important for export performance. Further, we investigated whether exporting
activity of the MNEs has spillover effects on exporting behaviour of the domestic firms. Panel
data estimation technique has been used for the empirical analysis.
The study establishes rising average export intensity across Indian manufacturing
industries including food and beverages, textiles, chemicals, metal and metal products,
machinery and transport equipment since 1991, in particular after 2000. This has happened
27
particularly in conjunction with rising FDI across sectors. Such stylized facts led us to inquire
into, in particular, whether firm level exports have responded to foreign direct investment.
Evidence from the estimation results show that with liberalization the manufacturing
industries for almost all technology groups have grown competitive with the import of raw
materials, foreign capital good, capability to bear sunk costs and technical know-how. This is
true for both the medium and high tech industries. Firm productivity and availability of credit do
also play significant role in the high tech industries like machinery and transport equipments.
Size also plays a major role particularly for the high tech industries. However, these results have
a possibility of improvement with dynamic panel data estimation. The evidence of varying
performance across sectors is indicative of the continuing existence of various constraints
operating in each sector, which by itself creates a case for industrial policy interventions.
Even though there can be several possible spillover channels, we investigated into direct
export spillovers from MNEs to domestic firms in India. Estimation results show significant
presence of direct export spillovers only in the chemical industry. With an exception of the
machinery industry, average export intensity of domestic firms are higher that for MNEs, and
hence, that explains insignificant direct spillovers across most industries. The better performance
of domestic enterprises is largely a result of import of raw materials and foreign knowledge and
technical know-how. The capability to cover sunk costs by domestic firms also turns out to be
very significant. However, excepting the chemical industry not much of in-house R&D has
promoted export. This can be one of the major areas of policy concern. The process of
liberalization thus played a strong role in augmenting exports from India and there is evidence of
FDI having some spillover effects on domestic firms.

28
References
Aggarwal, A., 2002, ‘Liberalisation, Multinational Enterprises and Export Performances:
Evidence from Indian Manufacturing’, Journal of Development Studies, 3, 119-37.
Ahluwalia, I. J, 2008, ‘Rapid Economic Growth: Contributing Factors and Challenges Ahead’,
Asian Economic Policy Review, 3, 180-204.
Aitken, B. and A. Harrison, 1999, ‘Do domestic firms benefit from Direct Foreign Investment?
Evidence from Venezuela’, American Economic Review, 89, 05-18.
Aitken, B., G. H. Hanson, and A.E. Harrison, 1997, ‘Spillovers, Foreign Investment and Export
Behaviour’, Journal of International Economics, 43, 103-132.
Aw, B, S. Chung, M.J. Roberts, 2000, ‘Productivity and Turnover in the Export Market:Micro
Level Evidence from the Republic of Korea and Taiwan (China)’, World Bank Economic
Review, 14, 65-90.
Balassa, B., 1978, ‘Exports and Economic growth: Further evidence’, Journal of Development
Economics, 5, 181-189.
Baldwin, R., W. Gu, 2003, ‘Export Market participation and Productivity Performance in
Canadian Manufacturing’, Canadian Journal of Economics, 36, 634-657.
Bergman, A., 2006, ‘FDI and Spillover Effects in the Indian Pharmaceutical Industry’, New
Delhi: Research and Information System for Developing Countries (RIS).
Bernard A and J. B. Jensen, 1999, ‘Exceptional Exporter Performance: Cause, Effect or Both?’
Journal of International Economics, 47, 1-25.
Bernard, A. B. and J. Wagner, 1997, ‘Exports and Success in German Manufacturing’,
Weltwirtschaftliches Archiv,133, 134-157.
Bernard, A.B., J. Eaton, J.B. Jensen and S. Kortum, 2003, ‘Plants and Productivity in
International Trade’, American Economic Review, 93, 1268-1290.
Bernard, A.B., J.B. Jensen, 2004, ‘Why some firms export?’ Review of Economics and
Statistics, 86, 561-569.
Blomstrom, M., 1986, ‘Foreign investment and productive efficiency: The case of Mexico’,
Journal of Industrial Economics, 15, 97-110.

29
Blomstrom, M. and A.Kokko, 1997, ‘The Impact of Foreign Investment on Host Countries: A
Review of the Empirical Evidence’, Policy Research Working Paper No: 1745, Washington
D.C.: World Bank.
Blomstrom,M. and A.Kokko. et al., 1994, ‘Host country competition, labour skills and
technology transfer by multinationals’, Weltwirtschaftliches Archiv ,128, 522-33.
Blomstrom,M., and H.Perssion 1983, ‘Foreign Investment and spillover efficiency in an
underdeveloped economy: Evidence from the Mexican manufacturing industry’, World
Development, 11 ,493-501.
Blonigen,B.A, 2005, ‘Review of empirical literature on FDI determinants’, International Atlantic
Economic Society Session, ASSA Conference , Philadelphia.
Bonaccorssi, A., 1992, ‘On the Relationship between Firm Size and Export Intensity’, Journal
of International Business Studies, 23, 605-35.
Cantwell, J. 1989, ‘Technological innovation and multinational Corporations’, Carriere (eds)
Industrialization and the State in Latin America, Amsterdam CEDLA, Incidentele Publicaties
Oxford: Basil Blackwell.
Caves, R.E., 1974, ‘Multinational firms, competition and productivity in host country markets’,
Economica , 41,176-93.
Chakraborty, C. and P. Nunnenkamp, 2008, ‘Economic Reforms, FDI and Economic Growth in
India: A Sector Level Analysis’, World Development, 36, 1192-1212.
Chaney, T. 2005, ‘Liquidity constrained exporters’, MIT, Cambridge: Massachusetts.
Cohen, B., 1975, Multinational firms and Asian Exports, London, Yale University Press.
Clerides.S, S. Lach and J .Tybout, 1998, ‘Is Learning by Exporting Important? Micro Dynamic
Evidence from Columbia, Mexico and Morocco’, The Quarterly Journal of Economics, CXIII,
903-947.
De Melo, J. and S. Robinson, 1992, ‘Productivity and Externalities: Models of Export Led
Growth,’ Journal of International Trade and Economic Development, 1, 41-68.
Das, S., M.J. Roberts and J.Tybout, 2001, ‘Market Entry Costs, Producer heterogeneity and
Export Dynamics’, Mimeo, Pennsylvania State University.
Fagerberg, J., 1988, ‘International Competitiveness’, Economic Journal, 98, 355-374.
Fan, E. X.., 2002 ‘Technological Spillovers from Foreign Direct Investment - A Survey,’ ERD
Working Paper Series No.33, Manila: Asian Development Bank.

30
Frankel, J. and D. Romer, 1999, ‘Does Trade cause Growth?’ Journal of Development
Economics, 12, 379-399.
Globerman,S., 1979, ‘Foreign Direct Investment and ‘Spillover’ Efficiency Benefits in Canadian
Manufacturing Industries’, Canadian Journal of Economics, 12 , 42-56.
Haddad, M and A. Harrison, 1991, ‘Are there Positive Spillovers from Foreign Direct
Investment? Evidence from Panel Data for Morocco’, Journal of Development Economics, 42,
51-74.
Helpman, E., M. Melitz, S. Yeaple, 2004, ‘Export versus FDI with Heterogeneous Firms’,
American Economic Review, 94, 300-317.
Helpman, E., M. Melitz and Y. Rubinstein, 2008, ‘Estimating Trade Flows: Trading Partners and
Trading Volumes,’ Quarterly Journal of Economics, 123, 441-487.
Hood, N. and S. Young, 1979, The Economics of Multinational Enterprise, UK: Longman.
Iyer, K., 2010, ‘The Determinants of Firm-level Export intensity in New Zealand Agriculture
and Forestry’, Economic Analysis and Policy, 40, 75-86.
Jenkins, R., 1979, ‘The Export Performance of Multinational Corporations in Mexican Industry’,
Journal of Development Studies, 89-107.
Kathuria, V., 1998, ‘Technology Transfer and Spillovers for Indian Manufacturing Firms’,
Development Policy Review, 16, 73-91.
Kathuria,V., 2001, ‘Foreign Firms, Technology Transfer and Knowledge Spillovers to Indian
Manufacturing Firms: A Stochastic Frontier Analysis’, Applied Economics, 33 , 625-642.
Kirim, A., 1986, ‘Transnational Corporations and Local Capital Comparative Conduct and
Performance in the Turkish Pharmaceutical Industry’ World Development, 14, 503-521.
Kokko, A., 1994, ‘Technology, Market Characteristics and Spillovers’, Journal of Development
Economics, 43, 279-293.
Kumar N. and K.J Joseph (eds.), 2007, International Competitiveness and Knowledge-based
Industries in India, New Delhi: Oxford University Press.
Kumar, N. and N. S. Siddharthan, 1997, Technology, Market Structure and Internationalisation:
Issues and Policies for Developing Countries, London: Routledge Publication.
Kumar, N, N.S Siddharthan., (1994) ‘Technology, Firm size and Export behavior in Developing
Countries: The case of Indian Enterprises’ The Journal of Development Studies, 31, 289-309.
Kumar, N. 1989, Multinational Enterprises in India, London: Oxford University Press.

31
Kumar, N., 1990, ‘Multinational Corporation and National Technological Capability’, Indian
Economic Review, 25, 275-276.
Kumar, N., and A. Aggarwal, 2005, ‘Liberalisation, Outward Orientation and in-house R & D
Activity of Multinational and Local Firms: A Quantitative Exploration for Indian
manufacturing’, Research Policy, 34, 441-460.
Kapoor, M, P. Ranjan and J. Raychaudhuri, 2011, ‘Impact of credit constraints on exporting
firms: Empirical evidence from India’, Paper presented at the Annual Conference on
Development Economics, Jadavpur University, Kolkata (mimeographed).
Lall S. and S. Mohammad, 1983, ‘Foreign Ownership and Export performance in the Large
Corporate Sector of India’, Journal of Development Studies, 20, 56-67.
Marin, D., 1992, ‘Is the Export-led Growth Hypothesis valid for Industrialized Countries?’
Review of Economics and Statistics, 74, 678-688.
Manova, K., 2008, ‘Credit Constraints, Heterogeneous Firms, and International Trade,’ NBER
Working Paper No. 14531, Cambridge MA: National Bureau of Economic Research.
Melitz, M.J., 2003, ‘The Impact of Trade on Intra-Industry Rellocations and Aggregate Industry
Productivity’, Econometrica, 71, 1695-1725.
Melitz, M.J. and G. I. P. Ottaviano, 2008, ‘Market Size, Trade and Productivity,’ Review of
Economic Studies, 75, 295–316.
Newfarmer, R.S. and L.C Marsh, 1981, ‘Foreign ownership, Market Structure and Industrial
Performance: Brazil’s Electrical Industry’, Journal of Development Economics, 8, 47-75.
Okamoto, Y., 1999, ‘Multinationals, Production Efficiency, and Spillover effects: The Case of
the US Auto Parts Industry’, Weltwirtschaftliches Archiv, 135, 241-60.
Pradhan, J.P., 2003, ‘Foreign Direct Investment and Economic Growth in Developing Countries:
Further Evidence from Panel Data,’ Asian Economic Review, 45, 197-217.
Paravisini, D., V. Rappoport, P. Schnabl, and D. Wolfenzen, 2011, ‘Dissecting the Effect of
Credit Supply on Trade: Evidence from Matched Credit-Export Data’ Working paper 16975,
Cambridge, MA: National Bureau of Economic Research.
Roberts, M. and Tybout, J, 1997, ‘The Decision to Export in Columbia: An Empirical Model of
Entry with Sunk costs’, American Economic Review, 87, 545-564.
Sikdar, S., 2003, Contemporary issues in globalization - An Introduction to Theory and Policy in
India, New Delhi: Oxford University Press.

32
Singh, N., 1986, ‘Trade Behaviour of firms: An empirical study of the size and foreign
collaboration effects’, Indian Economic Review, 14, 45-66.
Schmitt, N. and Z. Yu, 2001, ‘Economies of Scale and the Volume of Intra Industry Trade’,
Economics Letters, 74, 127-132.
Sinha Roy, S., 2009, ‘The Determinants of India’s Exports,’ International Trade Research Series
Working Paper No. 03-09, Department of Economics, Jadavpur University, Kolkata.
Soete, L., 1981, ‘A General Test of Technological Gap Trade Theory’, Weltwirtschaftliches
Archiv, 117, 638-659.
Sterlachhini, A., 2001 “The Determinants of Export Performance: A firm-level Study of Italian
Manufacturing’, Weltwirtschaftliches Archiv, 137, 450-472.
Subramaniam, K.K. and P. M. Pillai, 1979. Multinationals and Indian Exports, New Delhi:
Allied Publications.
Tewari, M., 1997, ‘Post MFA Adjustments in India’s Textile and Apparel industry: Emerging
issues and Trends’, ICRIER Working Paper no. 167, New Delhi: Indian Council for Research on
International Economic Relations.
Tsou, M.W. and J.T. Liu, 1994, ‘The Spillover Effects of Foreign Direct Investment: Empirical
Evidence from Taiwan Manufacturing Industries’, Taiwan Economic Review, 25, 155-81.
Tybout J., 1992, ‘Linking Trade and Productivity: New Research Direction’, World Bank
Economic Review, 6, 189-211.
Yeaple, S., 2005, ‘Firm Heterogeneity, International trade and Wages’, Journal of International
Economics, 65, 1-20.

33
Appendix Table A.1
Industry Export intensity
Ferrous metals Pre 2000 average Post 2000 average
Casting & forging 0.11 0.16
Metal product 0.11 0.11
Pig Iron 0.04 0.04
Sponge Iron 0.00 0.01
Steel 0.07 0.12
Steel, tubes & pipes 0.08 0.17
Calculations based on PROWESS database, CMIE.
Table A.2: Weighted Average Export Intensity
Year Food &
beverages
Textiles Chemical
Ferrous
Metals
Non -
Ferrous
Metals
Electrical
Machinery Electronics
Non-
Electrical
Machinery
Transport
Equipments
1991 0.13 0.15 0.07 0.05 0.10 0.04 0.00 0.07 0.09
1992 0.21 0.18 0.08 0.05 0.11 0.05 0.00 0.07 0.10
1993 0.27 0.19 0.08 0.05 0.15 0.05 0.01 0.07 0.11
1994 0.29 0.19 0.09 0.05 0.14 0.08 0.01 0.08 0.12
1995 0.27 0.22 0.10 0.04 0.12 0.07 0.01 0.07 0.12
1996 0.28 0.24 0.11 0.04 0.12 0.06 0.01 0.06 0.10
1997 0.25 0.26 0.11 0.04 0.16 0.06 0.01 0.08 0.10
1998 0.25 0.29 0.12 0.04 0.15 0.07 0.01 0.06 0.12
1999 0.26 0.30 0.12 0.04 0.12 0.07 0.01 0.08 0.12
2000 0.25 0.28 0.13 0.04 0.19 0.07 0.01 0.10 0.09
2001 0.32 0.29 0.14 0.04 0.22 0.08 0.01 0.10 0.10
2002 0.25 0.27 0.16 0.04 0.22 0.09 0.01 0.13 0.09
2003 0.27 0.28 0.17 0.04 0.24 0.08 0.01 0.11 0.11
2004 0.26 0.28 0.18 0.04 0.24 0.09 0.01 0.13 0.11
2005 0.26 0.30 0.20 0.04 0.26 0.07 0.01 0.14 0.11
2006 0.26 0.29 0.21 0.04 0.28 0.07 0.01 0.12 0.12
2007 0.29 0.34 0.24 0.04 0.37 0.07 0.01 0.14 0.13
2008 0.40 0.35 0.25 0.04 0.34 0.07 0.01 0.15 0.14
Note: Calculations based on PROWESS database, CMIE.

34
Table A.3: Determinants of firm-level export performance (considering linear relationship)
Food and
Beverages
Textiles Chemical Metal and
Metal
Products
Machinery Transport
SIZE
-.019
(-0.01)
.513
(1.13)
5.12*
(9.74)
.59
(0.59)
.137**
(2.65)
-1.41
(-0.77)
IMPR
-.54*
(-35.52)
.034
(1.37)
.006
(0.93)
.04**
(1.91)
-.0005**
(-1.6)
.013**
(2.16)
KI
.003
(0.09)
.0004
(0.41)
-.268
(-0.50)
-.03
(-1.540
.0001
(0.37)
0.002
(1.32)
FPTR
.49
(0.07)
-.02
(-0.8)
.07
(0.23)
-.071
(-0.26)
-.003
(-0.96)
.249
(0.51)
ADI
-1.00*
(-3.18)
-.77
(-2.07)
-4.06
(-2.01)
-5.5*
(-11.73)
-.318*
(-4.44)
0.73*
(8.71)
MI
-2.25*
(-7.09)
-.014
(-0.37)
-.103
(-0.00)
1.21
(0.41)
-.003
(-050)
.024
(0.99)
DI
7.81*
(51.18)
.56*
(2.86)
-.109
(-0.16)
33.8*
(16.78)
.408
(6.11)
2.73*
(18.97)
RDI
-.14
(-0.27)
.26
(0.31)
.011
(0.00)
64.72*
(46.79)
-.015
(-0.73)
-.021
(-0.44)
R2 (overall) 0.99 0.01 0.4 0.39 .003 0.25
F F/Wald Chi
square
75555* 1.69*** 182.36* 356.29* 7.13* 45.13*
Note: 1. t/z values are provided in parentheses
2. * denotes 1% level of significance, ** denotes 5% level of significance, *** denotes 10% level of significance.

35
Table A.4: Determinants of firm-level export spillovers (considering linear relationship)
Food and
Beverages
Chemical Machinery Transport
FOR
1.5*
(3.13)
.005
(0.3)
0.45*
(3.00)
.35*
(5.02)
SIZE
-.06
(-0.02)
.051
(0.70)
IMPR
-.57*
(-28.30)
1.54*
(8.62)
-.0006**
(-1.74)
.024*
(3.48)
KI
.355
(0.18)
-.001
(-0.15)
.0004
(0.97)
-.0005
(-0.49)
FPTR
.132
(0.02)
-.024
(-0.28)
-.002
(-0.62)
3.61
(0.98)
ADI
-1.3***
(-1.82)
1.5*
(39.56)
-.46**
(-2.05)
.048
(0.15)
MI
-2.77
(-5.52)
1.05*
(30.87)
.322*
(2.78)
.42*
(3.51)
DI
8.3*
(46.92)
-.79*
(-30.40)
.54*
(5.03)
2.92*
(16.26
RDI
6.54
(0.26)
-.002
(-0.34)
.096
(0.58)
-.379
(-1.80)
R2
0.99 0.24 0.02 0.28
F/Wald χ2
82335.46* 289.21* 5.77* 40.35*
Note: 1. t/z values are provided in parentheses 2. * denotes 1% level of significance, ** denotes 5% level of significance, *** denotes 10% level
of significance.
36
Table A.5: Determinants of firm-level export performance (considering KI, FPTR)
Food and
Beverages
Textiles Chemical Transport
equipments
Machinery Metal and metal
products
Fixed effect
results
Fixed effect
results
Fixed effect
results
Fixed effect
results
Random effect
results
Random effect
results
SIZE
-14.00
(-0.50)
40.15
(0.79)
.194.23*
(4.08)
-33.12
(-1.60)
-.0005
(-0.03)
56.56*
(3.86)
AGE
.046 (0.80)
.114
(0.58) .594*
(7.43) .704*
(7.33)
.044
(0.88) .763*
(5.87)
IMPR
1.88
(0.04)
.169*
(4.62) 7.07*
(4.71)
-20.70.4**
(-2.47) .051*
(3.02)
IMPR2
-.00003*
(-4.66)
55.4*
(1.89)
-.00001*
(-3.00)
FPTR
284.09
(0.26)
-40.51
(-0.20)
.181
(0.64) -107.12*
(-3.06)
-87.56
(-1.61)
-384.38
(-0.91)
FPTR2
123.91**
(2.06)
KI
70.44
(1.42) 76.87*
(3.58) 36.76*
(4.27) 18.96**
(1.96)
6.40
(0.96)
66.08
(1.37)
KI2
-51.64*
(-3.06)
-25.7*
(-3.35)
MKTCOST
315.5*
(13.24) 67.75*
(3.83) 128.43*
(7.88) 259.21*
(6.22) 50.66**
(2.67) -.030
(-0.34)
MKTCOST2
-1637.6*
(-2.98) -22.04*
(-3.55) --354.42*
(-8.60)
-1495.85*
(-5.52)
-152.15*
(-2.48)
RDI
-1753.32 (-0.95)
155.91 (0.83)
34.52*
(1.77) 142.53 (0.95)
-47.03 (0.98)
-1129.64 (-2.31)
RDI2
-11.5*
(-1.84)
PDTIVITY
.0008
(0.11)
.010
(1.38)
-0.14
(-0.96)
-.1036
(-1.13) .011*
(1.67)
.003
(0.81)
PDTIVITY2
6.31 (0.90)
.0007 (1.02)
CRDT .028
(1.10)
-.007
(-0.24)
-1.23
(-0.22) -9.51*
(-5.03)
-.0002
(-0.19)
.007
(0.54)
CRDT2
2.55*
(5.23)
R2 (overall) 0.10 0.003 0.002 0.16 .04 0.33
F/wald statistic 1.60 4.28 16.71 35.03 24.13 73.93
Hausman test
Chi square
15.30 34.40 51.66 60.61 9.91 3.52
Note: 1. t/z values are provided in parentheses
2. * denotes 1% level of significance, ** denotes 5% level of significance, *** denotes 10% level of significance.

37
Table A.6: Determinants of firm-level export spillovers (considering KI, FPTR)
Food &
Beverages
Transport
equipment
Machinery Chemicals
fixed effect
results
Fixed effect
results
Random effect results Random effect results
FOR
.075
(0.21)
.39
(0.25)
.006
(0.05) .364**
(2.45)
SIZE
-38.6 (-0.74)
-11.74 (-0.51)
-.0005 (-0.28)
238.85*
(3.21)
SIZE2
37.31
(0.58)
-447.67**
(-2.43)
AGE .042
(0.21) .637*
(5.16)
IMPR
12.49
(0.09)
-2.91
(-0.71)
.0199 (0.35)
8.22*
(5.03)
IMPR2
-100.1
(-0.09) 0.58*
(3.33)
KI
-60.66
(-0.48)
.131
(0.45) -.00001*
(-3.06) 82.63*
(3.63)
KI2
743.62
(1.11)
-.0002
(-0.04)
1.41
(0.22)
-72.78*
(-3.30)
FPTR 381.78
(0.32)
-17.4
(-0.43) -113.04*
(-2.00)
-5.40
(-0.06)
FPTR2 643.90
(0.02) - .136
(0.07)
MKTCOST
292.29*
(3.25) 211.5*
(4.48)
8,.26
(0.85) 27.7*
(2.64)
MKTCOST2
-1464.20*
(-2.84) -1153.39*
(-3.97)
RDI
1368.51 (0.34)
119.3 (0.64)
-43.093 (-0.80)
47.64**
(2.15)
RDI2
-603313.3
(-0.59) -15.32**
(-2.13)
PDTIVITY
.003 (0.46)
-.029 (-0.79)
.009 (1.36)
-.023 (-1.47)
PDTIVITY2
.0002 (4.32)
9.06 (1.24)
CRDT .021
(0.88)
.075
(0..18)
-.0002
(-0.16)
-1.72
(-3.30)
CRDT2
-.0006
(-0.20)
R2 (overall) 0.07 0.12 0.01 0.03
F/wald statistic 1.19 10.44 16.83 82.63
Hausman test
Chi square
17.13 64.28 5.37 12.79
Number of
observations
228 610 893 1601
Note: 1. t/z values are provided in parentheses 2. * denotes 1% level of significance, ** denotes 5% level of significance, *** denotes 10% level
of significance.