Embed Size (px)
Citation preview

3/23/20043/23/2004 11
An Examination of Private Oil Company An Examination of Private Oil Company GrowthGrowth
Rob ArnottRob ArnottOIES Internal SeminarOIES Internal Seminar
2525thth November 2003November 2003

3/23/20043/23/2004 22
Private oil company growthPrivate oil company growth
Overview of global industry trendsOverview of global industry trends–– Regional costs and capital migrationRegional costs and capital migration
Industry costs and implicationsIndustry costs and implications–– Why is further consolidation likely?Why is further consolidation likely?
Company specific growthCompany specific growth–– Where will growth come from?Where will growth come from?
ConclusionsConclusions–– How much more risk are companies taking on?How much more risk are companies taking on?

3/23/20043/23/2004 33
Capital growth is key to equity investorsCapital growth is key to equity investors
Source: LSE, NYSE

3/23/20043/23/2004 44
Reserve growth influences share priceReserve growth influences share price
Source: LSE, NYSE, Morgan Stanley

3/23/20043/23/2004 55
Replacement figures are deceptiveReplacement figures are deceptive
$0.0
$2.0
$4.0
$6.0
$8.0
$10.0
$12.0
$14.0
0% 50% 100% 150% 200% 250% 300%
Reserves Replacement %
Res
erve
s R
epla
cem
ent C
ost $
/boe
Africa/Middle East
Asia-Pacific
US
Canada
Europe
Latin America
Source: Company data, JS Herold
3/23/20043/23/2004 66
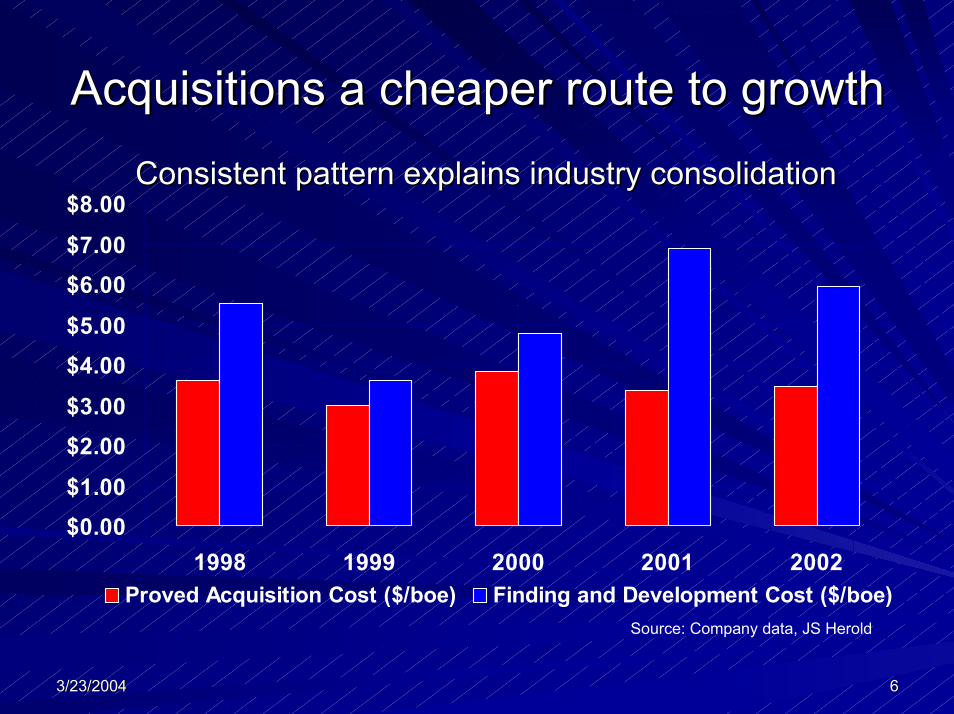
Acquisitions a cheaper route to growthAcquisitions a cheaper route to growth
$0.00$1.00
$2.00$3.00
$4.00$5.00
$6.00$7.00
$8.00
1998 1999 2000 2001 2002Proved Acquisition Cost ($/boe) Finding and Development Cost ($/boe)
Consistent pattern explains industry consolidationConsistent pattern explains industry consolidation
Source: Company data, JS Herold

3/23/20043/23/2004 77
US, Canada and Europe overheatedUS, Canada and Europe overheated
$0.0
$2.0
$4.0
$6.0
$8.0
$10.0
$12.0
$14.0
Europe LatinAmerica
Asia-Pacific Canada US Africa/MiddleEast
Proved Acquisition Cost ($/boe) Finding and Development Cost ($/boe)
Companies overpaying to achieve growthCompanies overpaying to achieve growth
Source: Company data, JS Herold

3/23/20043/23/2004 88
Migration of capital away from USMigration of capital away from US
-24%
-8%
47%
69%
40%
-40%
-20%
0%
20%
40%
60%
80%
US Canada Europe Africa/MiddleEast
Asia-Pacific
Spending changes 2000Spending changes 2000--20022002
Source: Company data, Harrison Lovegrove
3/23/20043/23/2004 99
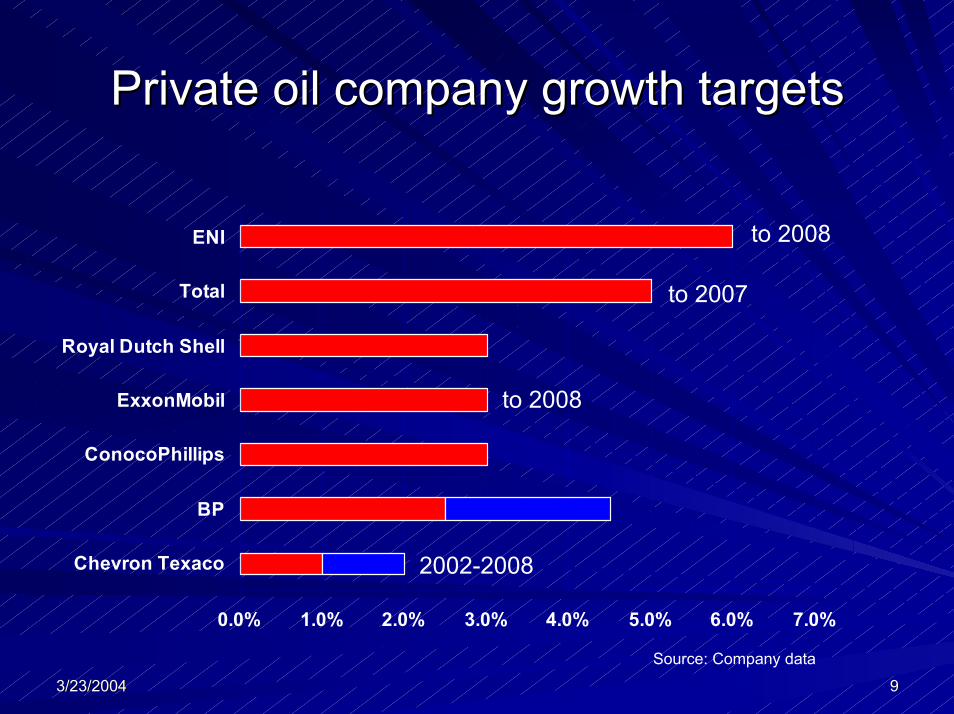
Private oil company growth targetsPrivate oil company growth targets
0.0% 1.0% 2.0% 3.0% 4.0% 5.0% 6.0% 7.0%
Chevron Texaco
BP
ConocoPhillips
ExxonMobil
Royal Dutch Shell
Total
ENI to 2008
to 2007
to 2008
2002-2008
Source: Company data

3/23/20043/23/2004 1010
The real cost of growthThe real cost of growth
-10
-5
0
5
10
15
20
$3.00 $5.00 $7.00 $9.00 $11.00 $13.00 $15.00Spending per boe produced
Ann
ual p
rodu
ctio
n gr
owth
(%)
Majors
E and P companies
Smaller companies chase growth at shareholders expenseSmaller companies chase growth at shareholders expense
Source: Company data, JS Herold

3/23/20043/23/2004 1111
Growth without acquisitions unrealisticGrowth without acquisitions unrealisticEven revised targets are unlikely to be achievedEven revised targets are unlikely to be achieved
02468
101214161820
80% 100% 120% 140% 160% 180%
3-Year F&D Replacement %
3-Ye
ar A
vg. F
&D
Cos
t $/b
oe
0% 3% 5%
Super-majorsInt.-Integrated
Int.-EP
Can.-EP Can.-Int
US.-Int
Small US.-EP
Super-EP Mid US.-EP
Large US.-EP
Source: Company data, JS Herold, OIES

3/23/20043/23/2004 1212
Decline versus growthDecline versus growth
More and more growth projects are needed to infill decline
0.0%
1.0%
2.0%
3.0%
4.0%
5.0%
6.0%
Chevron Texaco BP ConocoPhillips ExxonMobil Royal DutchShell
Total ENI
Ann
ual d
eclin
e ra
te (%
)
0.0%10.0%20.0%30.0%40.0%50.0%60.0%70.0%80.0%90.0%100.0%
% n
ew g
row
th u
sed
up
Annual decline 2002-2007 (%) % of new growth used infilling decline
Source: Company data, OIES

3/23/20043/23/2004 1313
BP’s oil production growth 2002BP’s oil production growth 2002--20072007
-400-200
0200400600800
100012001400
Europe NorthAmerica
Africa LatinAmerica
Asia-Pacific
MiddleEast
Russia Total
Prod
uctio
n m
boe/
d
Reliance on Russia a high risk strategy?Reliance on Russia a high risk strategy?
Source: Company data, OIES

3/23/20043/23/2004 1414
Shell’s oil production growth 2002Shell’s oil production growth 2002--20072007
-300
-200-100
0100
200
300400
500
Europe NorthAmerica
Africa LatinAmerica
Asia-Pacific
MiddleEast
Russia Total
Prod
uctio
n m
boe/
d
Growth reliant on Nigeria (Bonga, NLNG Growth reliant on Nigeria (Bonga, NLNG liquids)liquids)
Source: Company data, OIES

3/23/20043/23/2004 1515
Exxon’s oil production growth 2002Exxon’s oil production growth 2002--20072007
Growth from Bonga (Nigeria) + Kizomba/Dalia (Angola)Growth from Bonga (Nigeria) + Kizomba/Dalia (Angola)
-200
0
200
400
600
800
1000
1200
Europe NorthAmerica
Africa LatinAmerica
Asia-Pacific
MiddleEast
Other Total
Prod
uctio
n m
boe/
d
Source: Company data, OIES

3/23/20043/23/2004 1616
Total’s oil production growth 2002Total’s oil production growth 2002--20072007
-100-50
050
100150200250300350400450
Europe NorthAmerica
Africa LatinAmerica
Asia-Pacific
MiddleEast
Other Total
Prod
uctio
n m
boe/
d
Deepwater Africa the key (Nigeria: BongaMain, Congo: Deepwater Africa the key (Nigeria: BongaMain, Congo: Moho, Angola: Dalia)Moho, Angola: Dalia)
Source: Company data, OIES

3/23/20043/23/2004 1717
BP’s gas production growth 2002BP’s gas production growth 2002--20072007
-150
-100
-50
0
50
100
150
Europe NorthAmerica
Africa LatinAmerica
Asia-Pacific
MiddleEast
Russia Total
Prod
uctio
n m
boe/
d
A switch from Europe and North America to Egypt, Algeria A switch from Europe and North America to Egypt, Algeria and Trinidad LNGand Trinidad LNG
Source: Company data, OIES

3/23/20043/23/2004 1818
Shell’s gas production growth 2002Shell’s gas production growth 2002--20072007
-150
-100
-50
0
50
100
150
200
Europe NorthAmerica
Africa LatinAmerica
Asia-Pacific
MiddleEast
Russia Total
Prod
uctio
n m
boe/
d
NW shelf Australia and Nigeria LNG the driversNW shelf Australia and Nigeria LNG the drivers
Source: Company data, OIES
3/23/20043/23/2004 1919
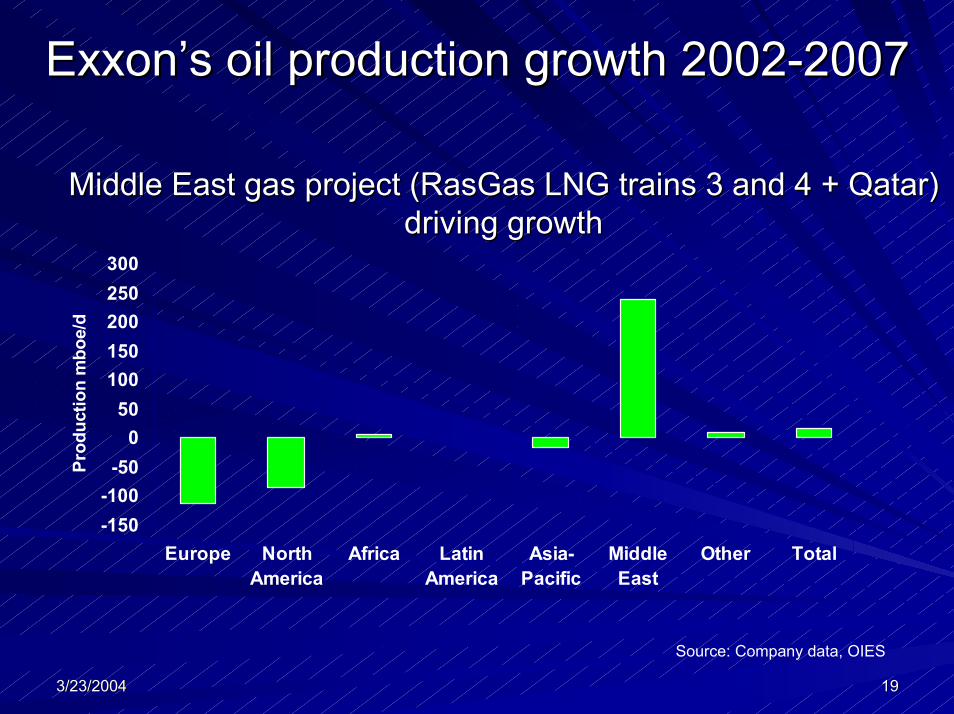
Exxon’s oil production growth 2002Exxon’s oil production growth 2002--20072007
-150-100
-500
50100150200250300
Europe NorthAmerica
Africa LatinAmerica
Asia-Pacific
MiddleEast
Other Total
Prod
uctio
n m
boe/
d
Middle East gas project (Middle East gas project (RasGasRasGas LNG trains 3 and 4 + Qatar) LNG trains 3 and 4 + Qatar) driving growth driving growth
Source: Company data, OIES

3/23/20043/23/2004 2020
Total’s gas production Total’s gas production growthgrowth 20022002--20072007
-100
-500
50100
150
200250
300
Europe NorthAmerica
Africa LatinAmerica
Asia-Pacific
MiddleEast
Other Total
Prod
uctio
n m
boe/
d
A more even spread from Indonesia, Venezuela (Yucal), A more even spread from Indonesia, Venezuela (Yucal), Argentina (Carina/Aries), Argentina (Carina/Aries),
Source: Company data, OIES

3/23/20043/23/2004 2121
Oil is still driving production growthOil is still driving production growth
Targets will only be met if ‘oil’ developments proceed as planneTargets will only be met if ‘oil’ developments proceed as plannedd
-3.0%-2.0%-1.0%0.0%1.0%2.0%3.0%4.0%5.0%6.0%7.0%
BP ChevronTexaco
ConocoPhillips ENI ExxonMobil Royal DutchShell
Total
CA
GR
(%)
Oil Growth Gas GrowthSource: Company data, OIES

3/23/20043/23/2004 2222
Oil regaining share of production mixOil regaining share of production mix
Only in Total does gas increase proportionatelyOnly in Total does gas increase proportionately
0.0%5.0%
10.0%15.0%20.0%25.0%30.0%35.0%40.0%45.0%50.0%
BP Chevron Texaco ConocoPhillips ENI ExxonMobil Royal DutchShell
Total
% G
as
2002 2007Source: Company data, OIES

3/23/20043/23/2004 2323
OPEC exposure is increasingOPEC exposure is increasing
0.0%
5.0%
10.0%
15.0%
20.0%
25.0%
30.0%
35.0%
40.0%
45.0%
50.0%
BP Chevron Texaco ConocoPhillips ENI ExxonMobil Royal DutchShell
Total
OPE
C O
il as
a p
erce
ntag
e of
tota
lpr
oduc
tion
2002 2007
3.6 million b/d out of 15.8 million b/d will come from OPEC 3.6 million b/d out of 15.8 million b/d will come from OPEC in 2007in 2007
220
628270
553
639719
581
Figure show oil production mb/d
Source: Company data, OIES

3/23/20043/23/2004 2424
The equity market expects growth but The equity market expects growth but delivery is at risk delivery is at risk
Source: Morgan Stanley

3/23/20043/23/2004 2525
More access on easier terms please!More access on easier terms please!Further consolidation inevitableFurther consolidation inevitable–– US, Canada and Europe are exUS, Canada and Europe are ex--growthgrowth–– Acquisition costs still below FD costsAcquisition costs still below FD costs
Oil continues to drive POC production growthOil continues to drive POC production growth–– Companies are not shifting to gas Companies are not shifting to gas –– Increasing differentiation between companiesIncreasing differentiation between companies
Capital flowing from low risk to high riskCapital flowing from low risk to high risk–– OPEC exposure increasingOPEC exposure increasing–– Technical and political risk increasingTechnical and political risk increasing
3/23/20043/23/2004 2626
An Examination of Private Oil Company An Examination of Private Oil Company GrowthGrowth
Rob ArnottRob ArnottOIES Internal SeminarOIES Internal Seminar
2525thth November 2003November 2003