Embed Size (px)
Citation preview

An expanded view of complex traits: from polygenic to omnigenic
How does human genetic variation drive variation in
complex traits/disease risk?
Evan Boyle Jonathan Pritchard
Yang I Li Stanford University
BIRS 2017

What did we learn from genome-wide association studies?
(Kaiser 2012, Science)
! Very polygenic architecture.! Effect sizes are generally very small.

! GWAS significant hits explain only a small % of heritability.
(Maher 2008, Nature)

Complex traits variation mostly explained by common variants
! GWAS significant hits explain only a small % of heritability.! But considering all common SNPs explains most of heritability.
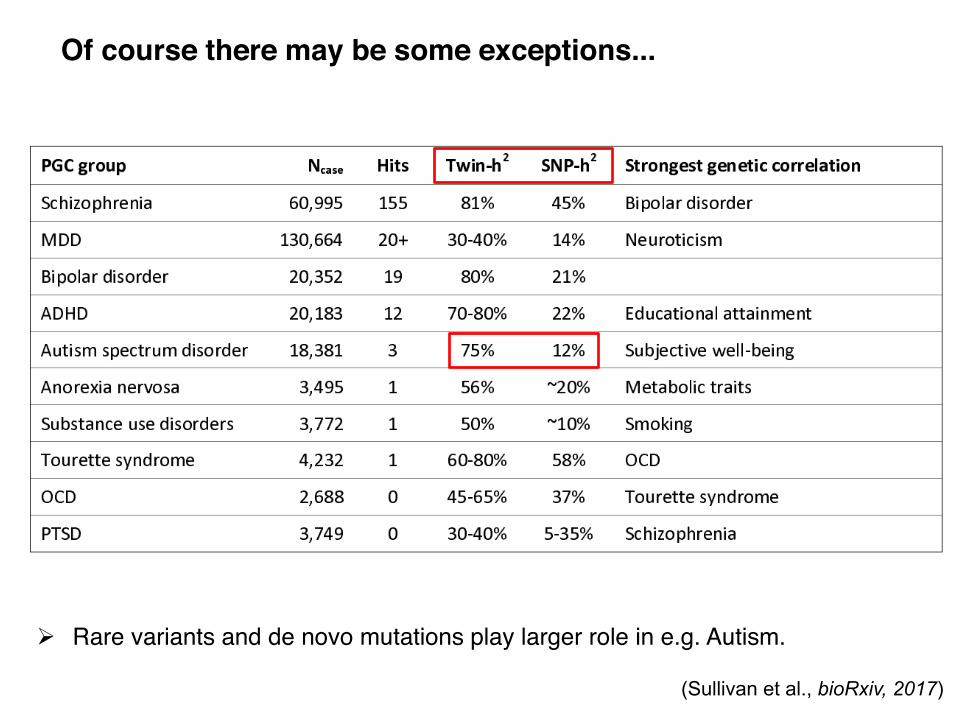
Of course there may be some exceptions...
! Rare variants and de novo mutations play larger role in e.g. Autism.
(Sullivan et al., bioRxiv, 2017)

Regulatory variation, not coding variation, drive variation in complex traits
- Over 90% of GWAS SNPs are noncoding- Enrichment in chromatin marks, eQTLs, sQTLs in relevant cell-types
(Farh et al., 2015; Trynka et al., 2013; Finucane et al., 2015; and many others…)
(Li et al., 2016, Science)
What does this tell us about why people get disease?

The classic view would be that causal variants are concentrated in core genes, pathways that drive disease/traits.
! Synaptic pruning in Schizophrenia (Sekar et al., 2016)! Adipocyte differentiation in obesity (Smemo et al., 2014, Claussnitzer et
al., 2015)
Figure from Wood et al 2014 NG

We argue that data from GWAS do not support this model: Heritability of many complex traits (e.g. schizophrenia) is (1) spread very widely across the genome and (2) shows limited pathway enrichment. Instead we propose an updated model that hypothesizes that most genes expressed in relevant tissues affect disease risk through highly-connected tissue-specific interaction networks. (We refer to this hypothesis as the “Omnigenic” model.)
Most expressed genes (n > 10K)
Core “disease” genes (n < 200)
Observation #1: For many traits, causal loci are spread nearly uniformly across the genome

schizophrenia heritability
4%
0%
Chromosome length (MB)
Loh…Price, Nature Genetics 2015.
Amount of schizophrenia heritability explained by each chromosome is highly correlated with its length
! At a broad scale, causal SNPs are spread widely across the genome! Loh et al: >70% of MB windows in the genome contribute to
schizophrenia heritability

Shi et al. AJHG 2016
Nearly all complex traits show a strong polygenic signature at a broad scale
! 30 traits were considered ranging from autoimmune diseases, to anthropomorphic traits, to metabolic traits, etc...
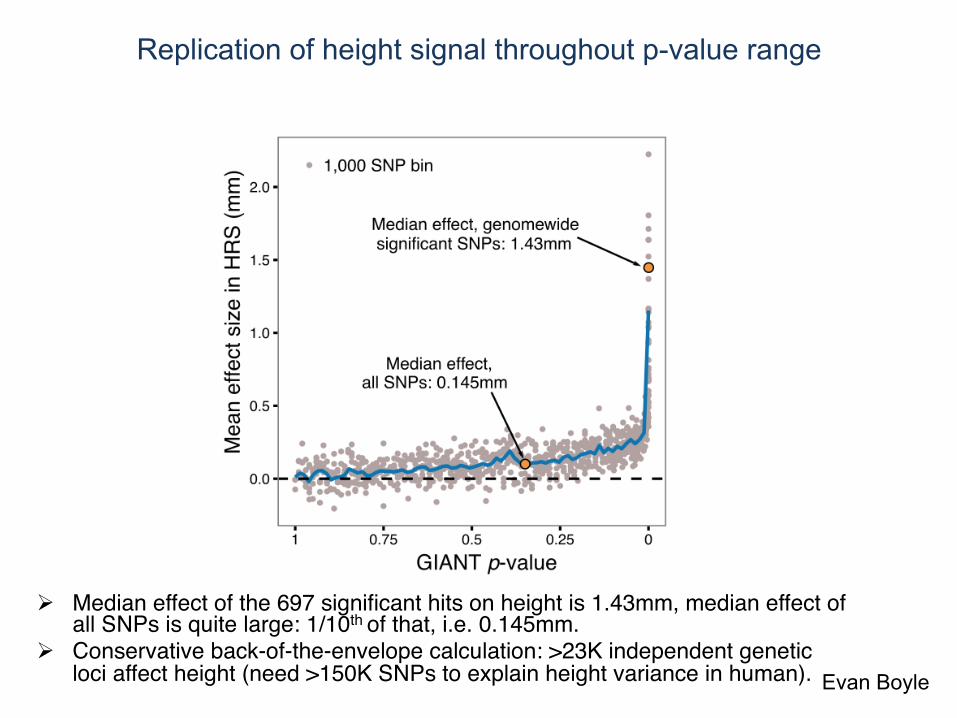
Replication of height signal throughout p-value range
! Median effect of the 697 significant hits on height is 1.43mm, median effect of all SNPs is quite large: 1/10th of that, i.e. 0.145mm.
! Conservative back-of-the-envelope calculation: >23K independent genetic loci affect height (need >150K SNPs to explain height variance in human). Evan Boyle
For many traits, causal SNPs are spread nearly uniformly across the genome
But “disease genes” are not, so causal SNPs
might often target other genes?
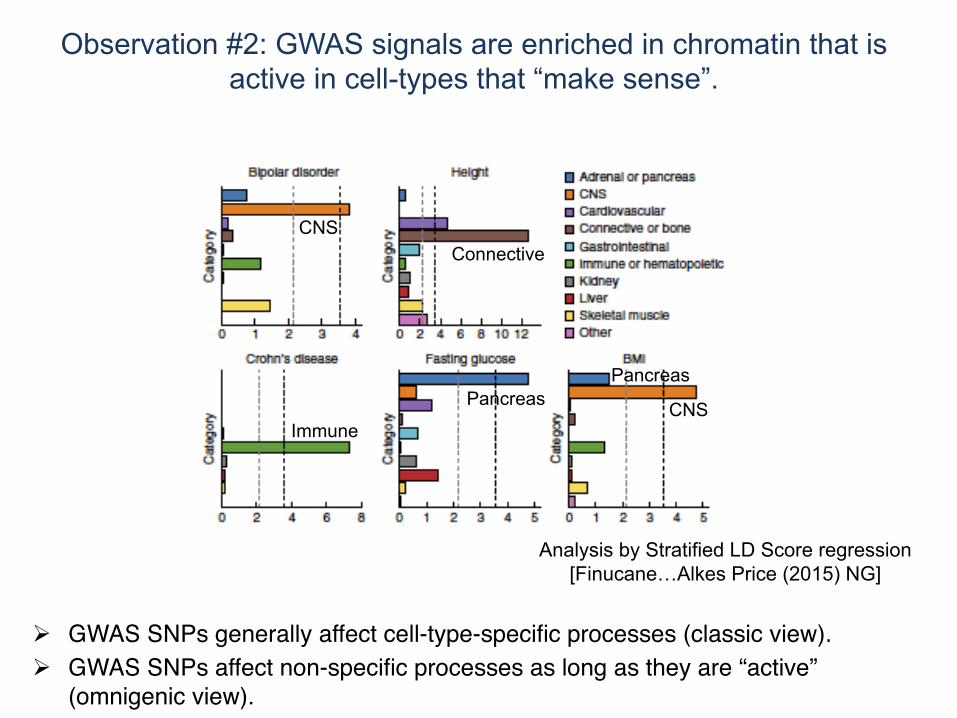
Analysis by Stratified LD Score regression [Finucane…Alkes Price (2015) NG]
CNS
Immune
Pancreas
Connective
CNS
Pancreas
! Although GWAS SNPs appear to be spread uniformly across the genome, they often fall within functional regions that suggests regulatory function.
! GWAS SNPs generally affect cell-type-specific processes (classic view).! GWAS SNPs affect non-specific processes as long as they are “active”
(omnigenic view).
Observation #2: GWAS signals are enriched in chromatin that is active in cell-types that “make sense”.
Analysis using Stratified LD Score regression and annotations from Finucane et al. 2015 Evan Boyle
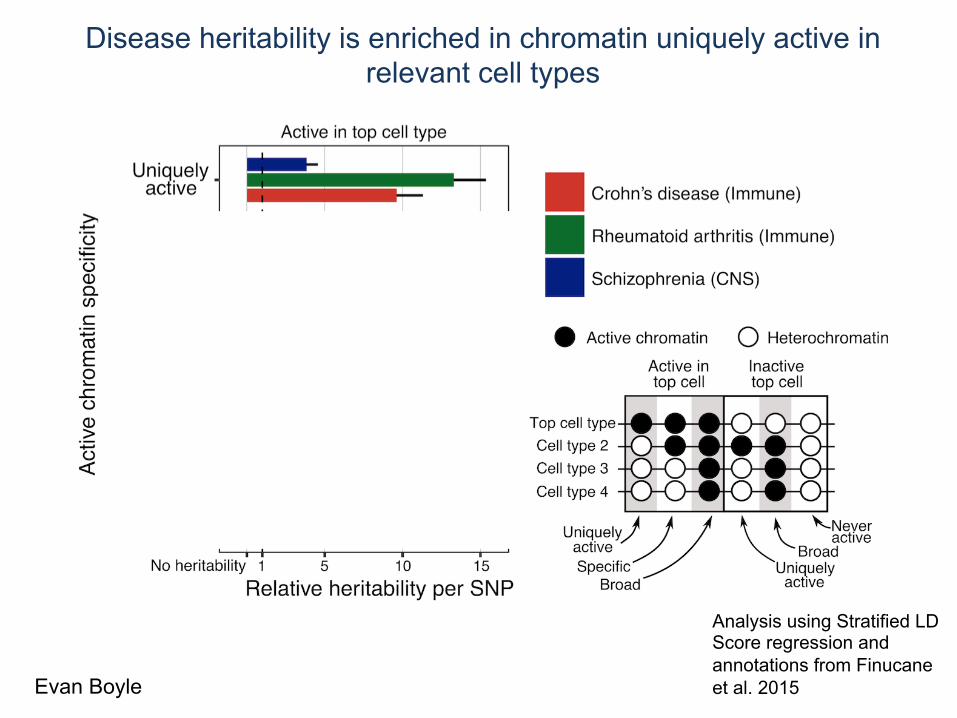
Disease heritability is enriched in chromatin uniquely active in relevant cell types

Analysis using Stratified LD Score regression and annotations from Finucane et al. 2015 Evan Boyle
Observation #2A: It doesn’t matter much whether the chromatin is broadly active, or uniquely active

Analysis using Stratified LD Score regression and annotations from Finucane et al. 2015 Evan Boyle
What matters is that they are active in the relevant cell type

Analysis using Stratified LD Score regression and annotations from Finucane et al. 2015 Evan Boyle
What matters is that they are active in the relevant cell type
Genetic effects are not mediated through cell-type-specific function?
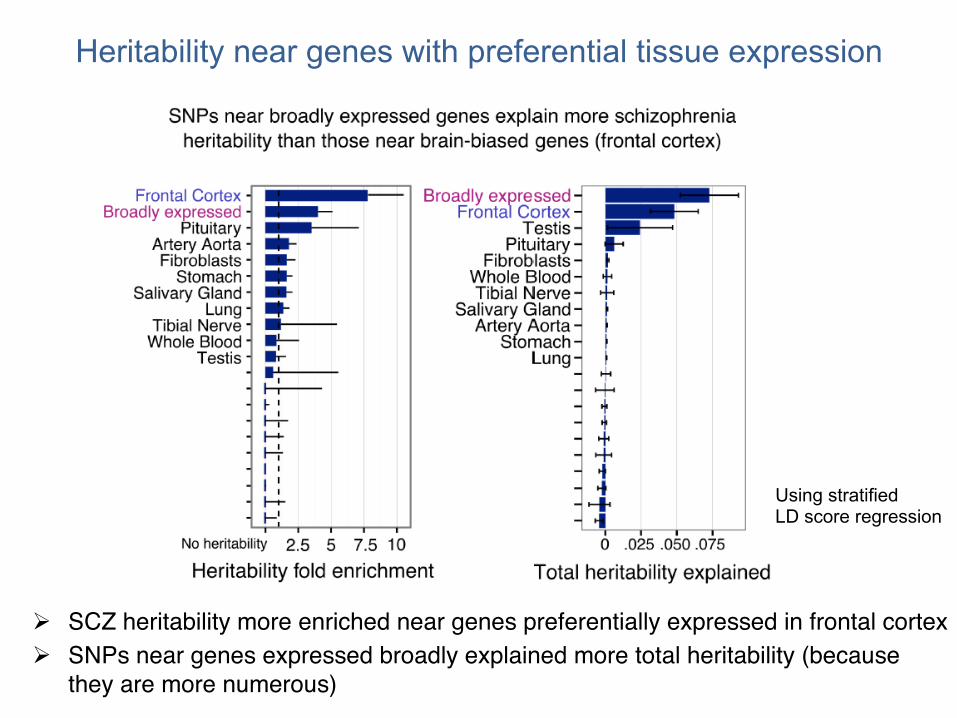
Heritability near genes with preferential tissue expression
! SCZ heritability more enriched near genes preferentially expressed in frontal cortex ! SNPs near genes expressed broadly explained more total heritability (because
they are more numerous)
Using stratified LD score regression
! Hypothesis: Genes that do not have a direct function in disease pathways might play, in aggregate, a larger role in disease so long as they have a function in the relevant tissue

Observation #3: SNPs near genes with relevant functional ontologies explain only a small fraction of disease heritability
! Relevant functional categories are enriched in heritability.! For all three diseases the category that explained the most heritability was
simply the largest category, i.e. “protein binding”.Evan Boyle

Summary: Variants in most of the genome contributes to heritability
The main shared feature of contributing variants is
that they are in regions that are active in relevant tissues, but not necessarily in pathways directly relevant to disease.

Model: 3 types of genes • Core genes: direct roles in disease (genes that make sense: eg
synaptic genes for schizophrenia) • Peripheral genes: Any gene expressed in the “right” cell types can
affect regulation/function of core genes, and most of them do • Inactive genes: Genes not expressed in the “right” cell types do not
contribute to heritability

Papers on “small world” property: applies to most real-life networks Watts & Strogatz 1998 Strogatz 2001
Small world property of networks: most nodes can be reached
from every other node by a small number of steps
! Suggests that most expressed genes may be “close” to core genes.! Network could be at the transcriptional, post-transcriptional level, and/
or an emergent property (e.g. cell function).

If the Small World property applies here then genes outside core pathways might cumulatively contribute
more heritability than the much smaller number of genes inside core pathways
Core genes

Summary: The contributions of thousands (tens of) of regulatory QTLs in peripheral genes might (paradoxically) drive most of the disease heritability. Therefore focusing only on core genes/pathways might never provide us with a full accounting of variation in disease risk.
More implications/future directions: • Mouse models for complex traits have limited use
(dysregulated pathway only account for a small fraction of disease cases)
• Drugs may need to focus on altering system states rather than individual genes/pathways.
• We need a better understanding of how genes/proteins interact together in a cell-type-specific fashion (could be PPI, transcriptional, etc..)
Final remarks
More implications in our perspective: Boyle*, Li*, and Pritchard* (under review)

Acknowledgments Arbel Harpak (Stanford) William Greenleaf (Stanford) Alex Marson (UCSF) Joe Pickrell (NYGC/Columbia) Guy Sella (Columbia) Molly Przeworski (Columbia) Discussion/criticism welcome!
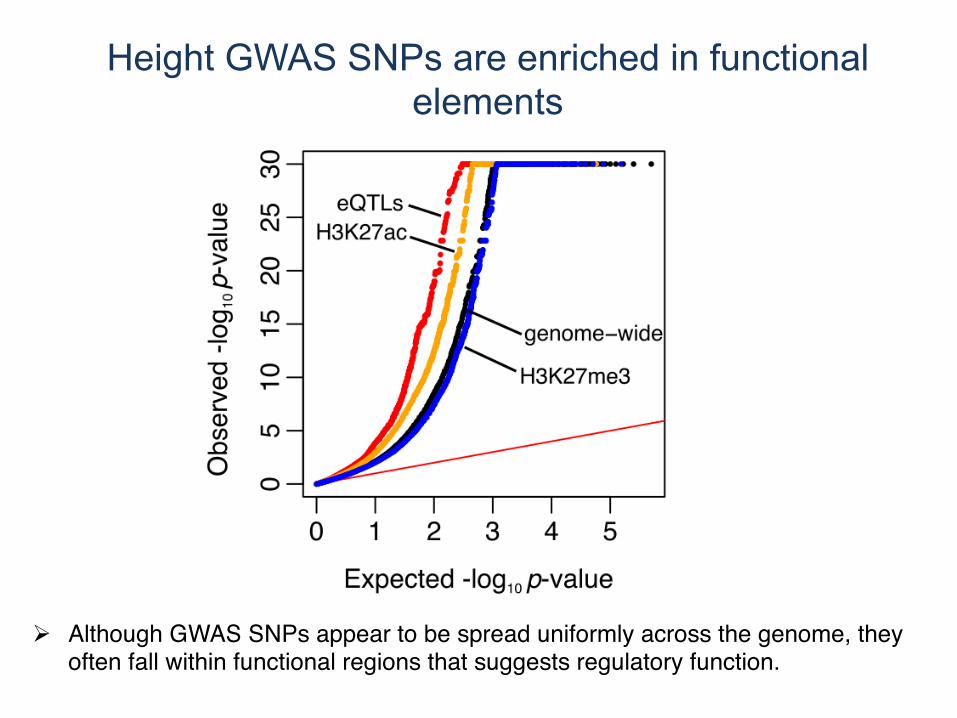
Height GWAS SNPs are enriched in functional elements
! Although GWAS SNPs appear to be spread uniformly across the genome, they often fall within functional regions that suggests regulatory function.

Family-based GWAS confirms the signals are not driven by confounding from population structure
Evan Boyle
! Median effect smaller likely due to higher rate of sign errors (sample size is 10% of GIANT).