Embed Size (px)
Citation preview

An Experimental Comparison of the FCC’s Combinatorial and
Non-Combinatorial Simultaneous Multiple Round Auctions
Prepared for the Wireless Telecommunications Bureau of the Federal Communications Commission
Jacob K. Goeree, Charles A. Holt, and John O. Ledyard∗
July 12, 2006
∗ Goeree and Ledyard: Caltech. Holt: University of Virginia. We are grateful to Walter Yuan and Charlie Hornberger for programming support, to Christoph Brunner, Lauren Feiler, Joel Grus, Guido Maretto, Alan Miller, Laura Panattoni, Brian Rogers, and David Young for helping run the experiments, and to Dash Optimization for the free academic use of their Xpress-MP software. The authors wish to acknowledge FCC staff Mark Bykowsky, William Sharkey, and Martha Stancill for input and helpful comments. The findings and conclusions in this report are those of the authors and do not necessarily represent the views of the Federal Communications Commission, the Wireless Telecommunications Bureau, or other members of the Commission's staff. Furthermore, any views expressed in this report are not purported to reflect those of Caltech and the University of Virginia.

Executive Summary Laboratory experiments were run to compare simultaneous, multi-round auctions (SMR) and simultaneous multi-round auctions with package bidding (SMRPB), using auction rules provided by FCC staff. The auction procedures were implemented with the jAuctions program developed by Jacob Goeree at Caltech. Each laboratory session consisted of a series of auctions in which the participants were assigned “national” or “regional” bidder roles. Bidders were provided with randomly generated license values and information about the extent to which combinations of licenses are worth more than the sum of the components (complementarities). High complementarities create an “exposure problem” in the sense that bidders may be hesitant to bid high on efficient networks of licenses if there is a risk of obtaining only part of the desired network. Package bidding is intended to minimize this exposure problem, although it may create other problems if efficient combinations of small bidders are unable to coordinate a response to an aggressive package bid by a large bidder, which is known as the “threshold problem.” For this reason, the revenue and efficiency effects of package bidding are an open question that is addressed with a series of laboratory experiments.
The three treatment variations spelled out in the Design Report implement changes in (1) the degree of valuation complementarities, (2) the degree of overlapping strength of national bidders, and (3) the relative strengths of national and regional bidders. There are two levels for each treatment, so this 2x2x2 design yields 8 variations for each of the two auction types for a total of 16 treatments.
This report is based on results from 64 laboratory sessions, each consisting of 6 to 10 auctions. Data are posted online at the jAuctions website described in the report that follows. The multi-dimensional experiment design permits an evaluation of the effects of package bidding under a wide range of market conditions. The main results are:
1. With high complementarities, package bidding raises efficiency, which measures the extent to which the auction allocates licenses to those with the highest valuations. However, allowing for package bids reduces efficiency when value complementarities are absent or small. We conjecture this is caused by the SMRPB requirement that bidders can only have one bid accepted (the XOR rule) as it requires bidders to bid on many combinations of licenses to find all possible efficiency gains.
2. In contrast with previous studies that have found revenues to be higher with SMR due to “over exposure” and resulting bidder losses, we find that package bidding raises revenues in some cases and not in others. In particular, package bidding raises revenues in all treatments where the national bidders have interests that are not fully overlapping. In treatments with full overlap of nationals’ interests, however, the introduction of package bidding lowers revenues slightly. We believe that the improved revenue results for package bidding reported here are caused, in part, by the license-price feedback central to the SMRPB format.
3. On average, the SMRPB auction requires about 20% more rounds of bidding than the SMR auction.
2

4. All licenses are sold under SMRPB, whereas licenses sometimes remain unsold with SMR (in about 5% of the cases with high complementarities, and rarely with low complementarities). The economic impact of unsold licenses in actual FCC auctions is diminished by the fact that these licenses are typically sold in subsequent auctions.
To summarize, the efficiency advantage for package bidding seems to be
persistent across environments with high complementarities, which generate the exposure problem that package bidding is intended to alleviate. This observation leads us to conjecture that the benefits of package bidding might be significant from an economic point of view.
3
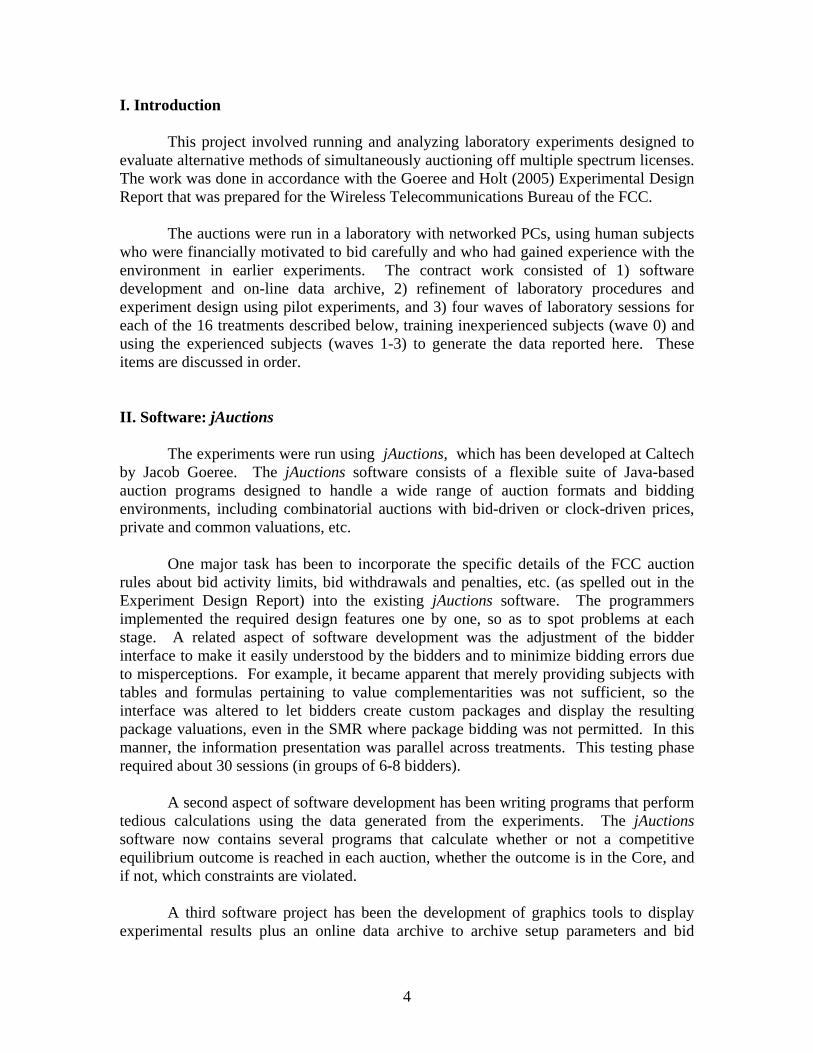
I. Introduction This project involved running and analyzing laboratory experiments designed to evaluate alternative methods of simultaneously auctioning off multiple spectrum licenses. The work was done in accordance with the Goeree and Holt (2005) Experimental Design Report that was prepared for the Wireless Telecommunications Bureau of the FCC. The auctions were run in a laboratory with networked PCs, using human subjects who were financially motivated to bid carefully and who had gained experience with the environment in earlier experiments. The contract work consisted of 1) software development and on-line data archive, 2) refinement of laboratory procedures and experiment design using pilot experiments, and 3) four waves of laboratory sessions for each of the 16 treatments described below, training inexperienced subjects (wave 0) and using the experienced subjects (waves 1-3) to generate the data reported here. These items are discussed in order. II. Software: jAuctions The experiments were run using jAuctions, which has been developed at Caltech by Jacob Goeree. The jAuctions software consists of a flexible suite of Java-based auction programs designed to handle a wide range of auction formats and bidding environments, including combinatorial auctions with bid-driven or clock-driven prices, private and common valuations, etc. One major task has been to incorporate the specific details of the FCC auction rules about bid activity limits, bid withdrawals and penalties, etc. (as spelled out in the Experiment Design Report) into the existing jAuctions software. The programmers implemented the required design features one by one, so as to spot problems at each stage. A related aspect of software development was the adjustment of the bidder interface to make it easily understood by the bidders and to minimize bidding errors due to misperceptions. For example, it became apparent that merely providing subjects with tables and formulas pertaining to value complementarities was not sufficient, so the interface was altered to let bidders create custom packages and display the resulting package valuations, even in the SMR where package bidding was not permitted. In this manner, the information presentation was parallel across treatments. This testing phase required about 30 sessions (in groups of 6-8 bidders). A second aspect of software development has been writing programs that perform tedious calculations using the data generated from the experiments. The jAuctions software now contains several programs that calculate whether or not a competitive equilibrium outcome is reached in each auction, whether the outcome is in the Core, and if not, which constraints are violated. A third software project has been the development of graphics tools to display experimental results plus an online data archive to archive setup parameters and bid
4
books. The jAuctions software now allows for easy data reports that generate graphs in HTML format, see:
http://jauctions.ssel.caltech.edu/fcc/index.php/Caltech_Experiments.
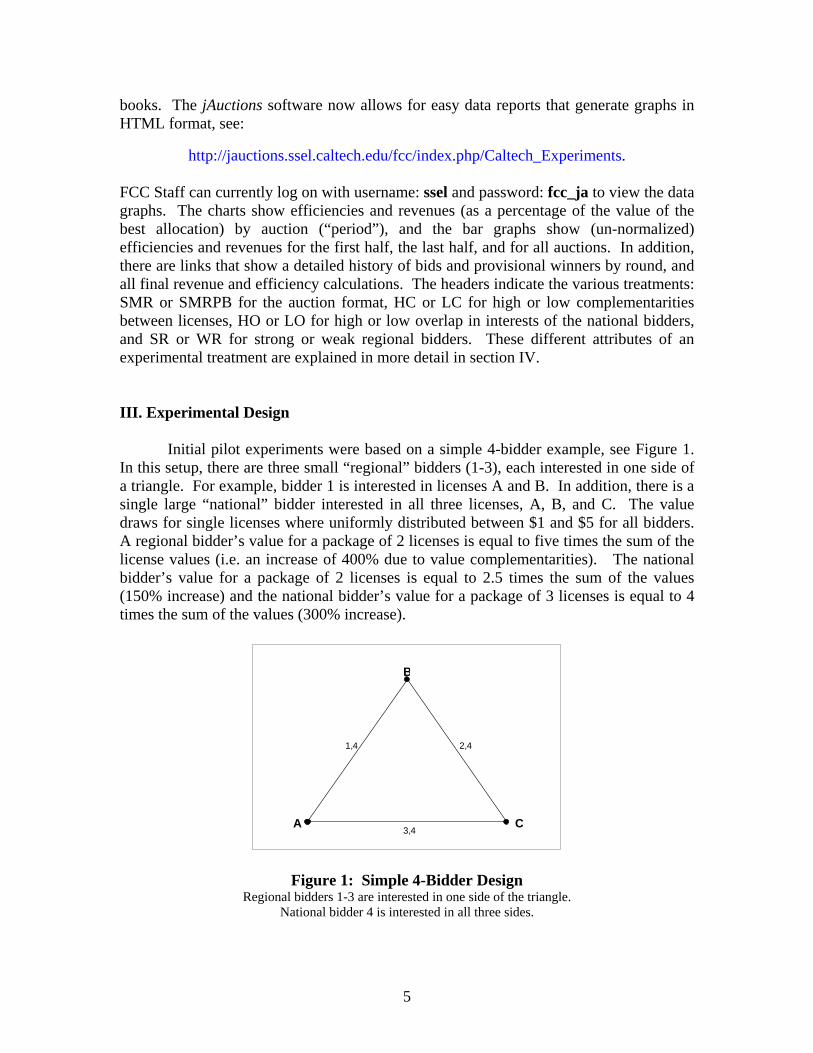
FCC Staff can currently log on with username: ssel and password: fcc_ja to view the data graphs. The charts show efficiencies and revenues (as a percentage of the value of the best allocation) by auction (“period”), and the bar graphs show (un-normalized) efficiencies and revenues for the first half, the last half, and for all auctions. In addition, there are links that show a detailed history of bids and provisional winners by round, and all final revenue and efficiency calculations. The headers indicate the various treatments: SMR or SMRPB for the auction format, HC or LC for high or low complementarities between licenses, HO or LO for high or low overlap in interests of the national bidders, and SR or WR for strong or weak regional bidders. These different attributes of an experimental treatment are explained in more detail in section IV. III. Experimental Design Initial pilot experiments were based on a simple 4-bidder example, see Figure 1. In this setup, there are three small “regional” bidders (1-3), each interested in one side of a triangle. For example, bidder 1 is interested in licenses A and B. In addition, there is a single large “national” bidder interested in all three licenses, A, B, and C. The value draws for single licenses where uniformly distributed between $1 and $5 for all bidders. A regional bidder’s value for a package of 2 licenses is equal to five times the sum of the license values (i.e. an increase of 400% due to value complementarities). The national bidder’s value for a package of 2 licenses is equal to 2.5 times the sum of the values (150% increase) and the national bidder’s value for a package of 3 licenses is equal to 4 times the sum of the values (300% increase).
A
B
C
1,4
3,4
2,4
Figure 1: Simple 4-Bidder Design Regional bidders 1-3 are interested in one side of the triangle.
National bidder 4 is interested in all three sides.
5
In this setup, bidders face an “extreme” exposure problem and, not surprisingly, bidders in pilot experiments incurred severe losses in the SMR auction (without bid withdrawals). The introduction of package bidding helped bidders to avoid such losses and significantly raised the efficiency of the final allocation (Brunner, Goeree, and Holt, 2005).
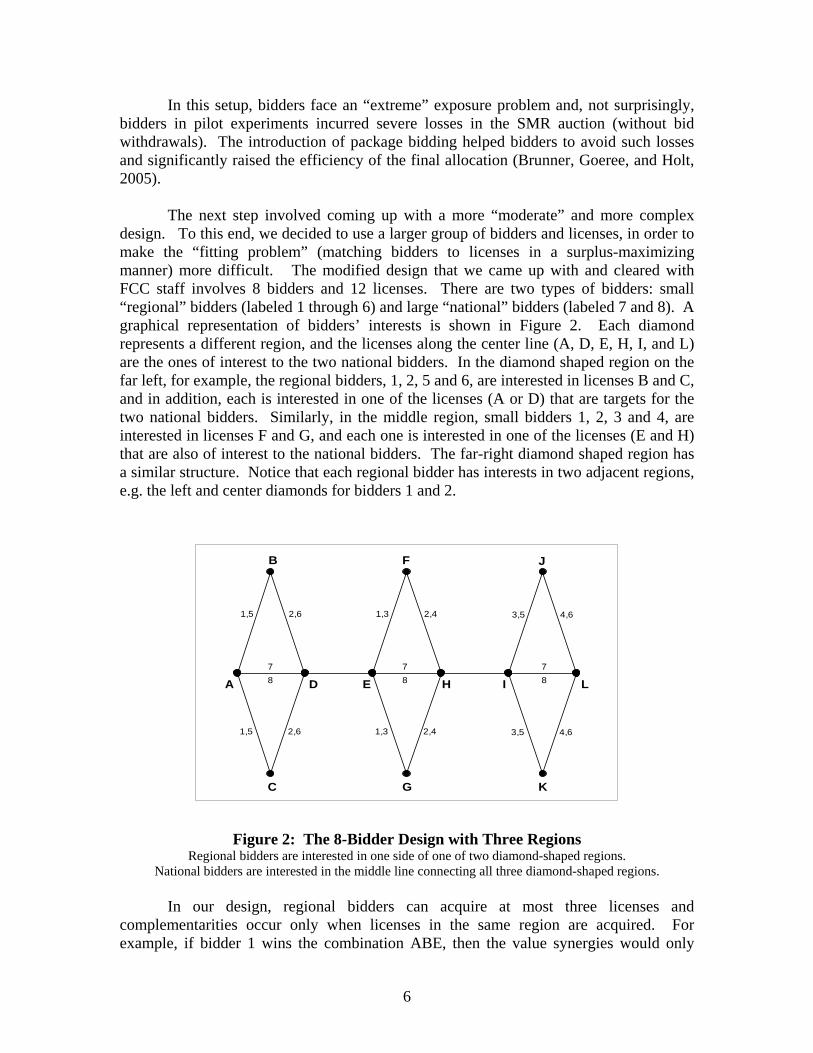
The next step involved coming up with a more “moderate” and more complex design. To this end, we decided to use a larger group of bidders and licenses, in order to make the “fitting problem” (matching bidders to licenses in a surplus-maximizing manner) more difficult. The modified design that we came up with and cleared with FCC staff involves 8 bidders and 12 licenses. There are two types of bidders: small “regional” bidders (labeled 1 through 6) and large “national” bidders (labeled 7 and 8). A graphical representation of bidders’ interests is shown in Figure 2. Each diamond represents a different region, and the licenses along the center line (A, D, E, H, I, and L) are the ones of interest to the two national bidders. In the diamond shaped region on the far left, for example, the regional bidders, 1, 2, 5 and 6, are interested in licenses B and C, and in addition, each is interested in one of the licenses (A or D) that are targets for the two national bidders. Similarly, in the middle region, small bidders 1, 2, 3 and 4, are interested in licenses F and G, and each one is interested in one of the licenses (E and H) that are also of interest to the national bidders. The far-right diamond shaped region has a similar structure. Notice that each regional bidder has interests in two adjacent regions, e.g. the left and center diamonds for bidders 1 and 2.
A D E H I L
B
C
F
G
J
K
78
1,5
78
78
2,6
1,5 2,6
1,3 2,4
1,3 2,4
3,5 4,6
3,5 4,6
Figure 2: The 8-Bidder Design with Three Regions
Regional bidders are interested in one side of one of two diamond-shaped regions. National bidders are interested in the middle line connecting all three diamond-shaped regions.
In our design, regional bidders can acquire at most three licenses and
complementarities occur only when licenses in the same region are acquired. For example, if bidder 1 wins the combination ABE, then the value synergies would only
6

apply to A and B, which are in the same region in Figure 2. By giving regional bidders value synergies within a region but not across regions, they face a more complex fitting problem. Notice that the XOR rule used in the SMRPB format facilitates bidders’ “choice of region” problem, since they can bid on packages from both regions knowing that at most one bid can be winning. In contrast, in the SMR auction, bidders have to change the contents of their bidding baskets if they want to switch to another region in response to price developments. National bidders can acquire up to six licenses and they have value complementarities for all six licenses in some treatments and for only four licenses in other treatments. The total number of possible allocations with this setup is 13,080,488.1 One issue that came up in discussions with FCC staff was whether or not to provide information about bidders’ values.2 In other words, should a bidder be told from what distributions others’ values are drawn? To get insights into the importance of such “common knowledge” of value distributions we conducted two package bidding pilots with the above design: one with full information about others’ value distributions and one without (in the latter, bidders know only which licenses they are interested in and their own values for those licenses). Interestingly, efficiencies were similar in the two treatments (96% versus 95%), but revenues were higher (by about 9%) in the treatment without common knowledge about others’ value distributions (11/28/05) than in the one with common knowledge (12/06/05). The data and graphs for these two sessions can be found on the jAuctions data archive, see:
http://jauctions.ssel.caltech.edu/fcc/index.php/Pilots.
After checking with FCC staff, we decided to go with the “intermediate level of common knowledge” where bidders know what licenses others are interested in, but not their value distributions. This setup seems most parallel to that which naturally occurs in actual FCC auctions. IV. Treatments
The two auction formats are described in Appendices A and B. The main differences are:
• Under SMR, the highest bids submitted for each license become the provisionally
winning bids, whereas under SMRPB the provisionally winning bids (for licenses or packages) are those that maximize seller revenue, a process that generates license “prices” that provide a measure of the marginal revenue value of the license at current bid levels.
1 Without the restriction that regional bidders can acquire at most 3 licenses, the total number of allocations would simply be 412 = 16,777,216. 2 This question refers to what type of information bidders have prior to the auction about the values of other bidders, and is distinct from the question of whether information on values is communicated during the auction through bidding activity.
7

• New bids at the start of a round must exceed provisionally winning bids under SMR, whereas new bids under SMRPB must exceed the price of a license or sum of prices for licenses in a package.
• Activity is defined in terms of the number of different licenses being bid for under SMR, and in terms of the maximal size of a package bid under SMRPB.
• Each bidder can have only one winning bid under SMBPR, whereas a bidder may have multiple winning bids under SMR.
• Bids cannot be withdrawn under SMRPB, but under SMR bidders have limited opportunities to withdraw, subject to penalties if the withdrawal results in a lower sales price.
Under both auction formats, bidders had full information about all bids during a
round and about provisional winning bids at the end of a round (identified by bidder ID), and hence they could observe others’ activity levels. The History Table on the bidders’ screens would also allow them to sort bids by ID, Round, or License.
For each auction format, the experiments cover 8 different treatments: high/low
overlap in national bidders’ interests (HO versus LO), high and low complementarities (HC versus LC), and strong or weak regional bidders (SR versus WR). For example, the treatment HOHCSR has high overlap, high complementarities, and strong regional bidders. First we will describe these treatments in a little more detail, and then we will summarize the results. Complementarities: The baseline value distributions are uniform on the range [5, 45] for each license of interest to national bidders, and on the range [5, 75] for each license of interest to regional bidders. With high complementarities, each license acquired by a national bidder goes up in value by 20% (with two licenses), by 40% (with three licenses), by 60% (with four licenses), by 80% (with five licenses) and by 100% (with all six licenses). With low complementarities, these numbers are 1%, 2%, 3%, 4% and 5%. With high complementarities, each license acquired in the same region by a regional bidder goes up in value by 12.5% (with two licenses in the same region), and by 25% (with three licenses in the same region). With low complementarities, these numbers are 1% and 2% for regional bidders. These minimal complementarities allowed us to maintain parallelism in instructions and procedures. High and low complementarities will be indicated by the notation HC and LC respectively. Regional Bidder Strength: With high complementarities, the national and regional bidders are of equal strength for maximally sized packages, since the 25% gain over the highest value of 75 for a regional bidder is about equal to a 100% gain over the highest value of 45 for a national bidder. We have termed this equal strength condition the “strong regional bidders” treatment (SR). The “weak regional bidders” treatment (WR) has the license values for both types of bidders coming from the same distribution [5, 45], which gives an advantage to the national bidders when complementarities are high, and which results in equal strength when complementarities are low.
8

Overlap:
With high overlap (HO), each national bidder, 7 and 8, has value draws from the same distribution for all six licenses on the center line of Figure 2, and the complementarities apply equally to all 6 licenses. In this sense, each national bidder is equally strong across the line, in an expected value sense. With low overlap (LO), national bidder 7 only receives complementarities for the 4 licenses on the left side of the central line (A, D, E, and H). Conversely, national bidder 8 receives complementarities for the 4 licenses on the right side (E, H, I, and L). Thus with high complementarities and low overlap, each national bidder has a natural focus of interest that only partially overlaps the other national bidder’s area. One issue of interest is whether this type of partial separation may yield tacit collusion and less aggressive bidding in the center. Treatment Structure:
The 2x2x2 treatment design yields 8 treatments for SMR and 8 matched treatments for SMRPB, for a total of 16. In each of the 8 treatments for SMR we used the same value draws as in the parallel SMRPB sessions so that differences between treatments cannot be attributed to specific sequences of value draws. Each session consisted of two practice auctions and a series of 6-10 auctions for cash payments. The treatment and auction type was unchanged for all auctions in each session, but the randomly generated value draws changed from one auction to the next in the same session. In addition, we used new sequences of random draws for each “wave” of 16 sessions that spanned all treatments.
Subjects and Sessions
The sessions with wave 0 draws (inexperienced subjects) and wave 3 draws (experienced subjects) consisted of 10 auctions each, and the sessions for waves 1 and 2 consisted of 6 auctions per session. Appendix C contains a list of all 64 sessions (16 for each wave), with 8 subjects per session. After extensive testing, we began with 128 subjects (16x8) from Caltech for the inexperienced sessions in wave 0, and we promised to pay each person a $60 bonus (in addition to other earnings) if they returned three more times. This decision to use experienced bidders was based on the complexity of the auction formats and on earlier pilot experiments conducted at UCLA and Caltech. Each point obtained in an auction was worth 40 cents. Earnings averaged $50 per person per session, including $10 show-up fees and bonuses, for sessions that lasted from one and a half to two hours, depending on the number of auctions.
9

V. Experiment Results
One way to measure market efficiency is to divide the sum of the values that winning bidders place on their acquired licenses (Sactual) by the sum of their values for licenses obtained under the value-maximizing assignment (Soptimal). This measure is useful for making comparisons of relative performance across treatments, but it is well known that this simple efficiency measure may be difficult to interpret in an absolute sense. For example, adding a constant to all value amounts will tend to raise this efficiency ratio, since efficiency losses are affected by differences in valuations, not absolute levels. A more natural measure of efficiency is calculated on the basis of the difference between the actual surplus and the surplus resulting from a random allocation (Srandom), this being normalized by the maximum such difference.
100%actual random
optimal random
S SefficiencyS S
−= ∗−
The value of a random allocation can be computed by taking the average of the surplus over all possible allocations, of which there are 13,080,488 in total for the design in Figure 2. This definition of efficiency measures how much the auction raises surplus relative to a random allocation mechanism. In the analysis that follows, we will use these normalized efficiency measures.
Similarly, revenues will be measured as the difference between actual auction revenue and the revenue from a random allocation in which bidders bid their full values on all licenses and packages (Rrandom = Srandom). This difference is then divided by the difference between the maximum possible revenue (Roptimal = Soptimal) and the revenue from a random allocation.
100%actual random
optimal random
R RrevenueR R
−= ∗−
Finally, the normalized sum of bidders’ profits is simply equal to the difference between normalized efficiency and normalized seller’s revenue
100% 100%iactualactual actual i
optimal random optimal random
S RprofitS S S S
π−= ∗ =− −
∗∑
For example, if efficiency is 90% and revenue is 50%, normalized profit would be 40% to be split among two national bidders and 6 regional bidders.
All efficiency, revenue, and profit measures reported below are normalized in this manner for the specific value sequences used in each auction for each of the three waves of sessions with experienced bidders.
10

Efficiency Package bidding is designed to help bidders avoid the “exposure problem” of bidding high for licenses with high complementarities. As expected, switching from SMR to SMRPB raises efficiency from 86% to 91% in the high complementarities treatments. This difference shows up for all 4 HC treatments, as seen from the left side of Figure 3, where the light bars indicate efficiencies for SMR and dark bars indicate efficiencies for SMRPB. In contrast, the switch to SMRPB lowers efficiencies from 94% to 87% when complementarities are minimal (our “low complementarities” treatment). Again, this difference shows up in all four of the LC treatments shown on the right side of Figure 3.
Efficiencies
80%
85%
90%
95%
100%
HOSR HOWR LOSR LOWR HOSR HOWR LOSR LOWR
High Complementarities Low Complementarities
Figure 3. Efficiencies by Treatment for SMR (Light) and SMRPB (Dark) Key: National Bidder Overlap: High (HO) or Low (LO) Regional Bidder Strength: Strong (SR) or Weak (WR)
The treatment comparisons shown in Figure 3 are also supported by non-parametric tests using averages for each session as data points. These session averages are grouped by wave and treatment in Appendix D. For example, consider the efficiencies for the HOHC treatments, combining strong and weak regional treatments. These numbers are shown in the four columns on the left side of Appendix D (top three rows). Here it is important to compare SMR and SMRPB sessions for the same wave, since the valuation draws change from one wave to another. All six of the paired comparisons for the HOHC treatments show higher efficiencies for package bidding. This effect is significant using a Wilcoxon matched-pairs signed-rank test (p = 0.03). Similarly, in the LOHC treatments, all but one of the comparisons show higher efficiencies for package bidding (p = 0.09). If we combine these pairings and consider all 12 paired measures for the HC treatments, the efficiency enhancing effect of package bidding is highly significant (p = 0.006). But these results are reversed with low complementarities, with all paired comparisons going in the opposite direction (lower
11
efficiency for SMRPB), and this effect is significant for the HOLC and LOLC treatments (p = 0.03 in each case, or p = 0.002 for all 12 LC pairs).
Our conjecture is that, in the presence of minimal complementarities, the SMRPB requirement that bidders can only have one bid accepted (the XOR rule) may reduce efficiency, since bidders have to bid on many combinations of licenses to find all possible efficiency gains.3 Note that in the absence of complementarities the ascending bid competition for each license under SMR will “discover” the bidder with the highest value for that license. Thus bidding should be highly efficient under SMR with minimal complementarities, as is the case in the experiments. With package bidding and minimal complementarities, however, a bidder who has the high value for, say, licenses A, C, and E must somehow figure this out by bidding on ACE, since separate bids on A, C, and E imply that at most one of these licenses will be obtained. This fitting problem is exacerbated when there are large numbers of licenses, since there are more possible combinations of licenses for which a specific bidder may have the highest value. Other evidence that supports our conjecture is provided by Kwasnica et al. (2005) who do not report efficiency reductions (relative to a simultaneous multi-round auction) with a package bidding procedure that does not use XOR bidding.
One cause of efficiency reductions with SMR is the incidence of unsold licenses,
which happens with rates of 5%, 2%, 6%, and 5% in the 4 treatments with high complementarities, and with rates 0%, 2%, 0%, and 1% with low complementarities, as shown in one of the bottom rows of Appendix D. With high complementarities, there are often bid withdrawals in the later rounds of the SMR auctions, after other bidders have lost activity and are not able to pick up “abandoned” licenses. There are no unsold licenses with package bidding. The difference between SMR and SMRPB in terms of license sales rates is significant with a Wilcoxon matched-pairs signed-ranks test (p = 0.03). Even though unsold licenses are a highly visible consequence of an actual auction, the economic costs are diminished by the sale of these licenses in subsequent auctions, so the main loss is the use value in the intervening period. Revenues The revenue comparisons for the two auction formats are basically determined by the degree of overlap in national bidder interests. With low overlap of national bidders’ interests, package bidding yields higher normalized revenues (40%) than is the case with SMR (33%). But with in the high overlap treatments, the introduction of package bidding reduces revenues from 42% to 38% (of the difference between the maximum revenue with all bids at value and the revenue resulting from a random allocation with all bids at value, see section V). Figure 4 shows the revenues averaged across sessions, and the averages for paired SMR and SMRPB sessions in the same parameter/experience wave are listed in Appendix D. As before, these comparisons can be evaluated with a Wilcoxon test based on using all 12 paired sessions of the HO treatments with the corresponding sessions of the LO treatments. The null of no effect for the HO treatments 3 Even though our design, in which regional bidders face a “choice of region” problem, favors the XOR rule, see section III.
12

can be rejected (p = 0.01, two-tailed test). Similarly, the null of no effect for the LO treatments can be rejected (p = 0.06 two-tailed test). With SMR, the decreased competition in the low overlap case lets the nationals earn more money in their “own” regions, thereby reducing revenues, as seen by the lower gray bars on the right side of Figure 4. But package bidding seems to cause the nationals to continue competing with large packages, even in the low overlap treatments, thereby keeping competition and seller revenues high (dark bars on the right side of Figure 4).
Another factor in the mixed revenue results may be due to the threshold problem.4 With high overlap and package bidding, the national bidder with the highest value realizations may enter a high bid on all 6 licenses on the center line in Figure 2, which creates a coordination problem for regional bidders who may seek to unseat the national’s bid. In the low overlap treatments, the national bidders’ bids are driven by the high values and synergies of only 4 licenses even when the package includes all six. The resulting package bid will not be as much of an obstacle for the regional bidders to unseat, i.e. the threshold problem is less severe in this case.
Revenues
20%
25%
30%
35%
40%
45%
50%
55%
HCSR HCWR LCSR LCWR HCSR HCWR LCSR LCWR
High Overlap Low Overlap
Figure 4. Revenues by Treatment for SMR (Light) and SMRPB (Dark) Key: Value Complementarities: High (HC) or Low (LC) Regional Bidder Strength: Strong (SR) or Weak (WR)
4 These mixed results for revenue only emerged after our subjects had gained experience in previous sessions. In contrast, package bidding yielded higher revenues in all paired SMR-SMRPB comparisons for inexperienced bidders. We believe that as bidders gained experience, they became more proficient at dealing with the exposure problem and at withdrawing bids in SMR auctions, which tended to raise revenues in these auctions. Conversely, revenues with package bidding tended to decline as bidders gained experience and learned to restrain bids and try for larger profit margins on the packages.
13
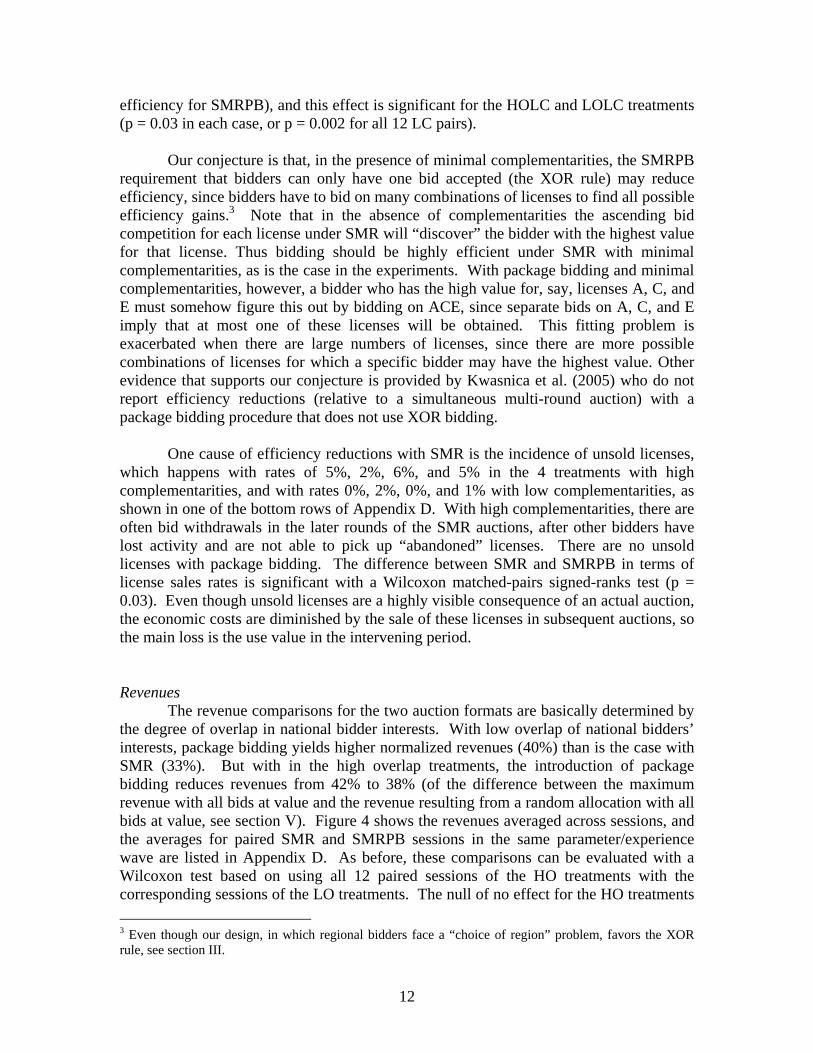
Profits Figures 5 and 6 show the effects of a switch from SMR (gray bars) to SMRPB (dark bars), by treatment. The ability to bid for combinations allows bidders to bid high on packages and avoid the exposure problem, an effect that is mainly relevant with high complementarities. But if all bidders are bidding higher, the effect on bidder profits is unclear. National bidders in our auctions have larger incentives to put together large packages, so one might expect package bidding to benefit the national bidders. This turns out to be the case in some treatments and not in others. With high complementarities and high overlap, profits of the national bidders rose, as can be seen from the two sets of bars on the left side of Figure 5. This effect showed up in 5 of the 6 sessions for these treatments, and the effect is marginally significant with a Wilcoxon test (p = 0.06). An additional consideration is that in the low overlap condition, nationals only have complementarities on the 4 licenses at “their end” of the line, as opposed to having complementarities on all 6 licenses. So in effect, low overlap results in lower complementarities for nationals, even in the “high complementarities” treatment. Therefore it is not surprising that package bidding does not necessarily raise national bidders’ profits with high complementarities and low overlap. Another consideration in the low overlap treatment is that the creation of (large) packages increases competition at the margin of overlap between the national bidders in the low overlap treatment.
Nationals' Profits
0%
5%
10%
15%
20%
25%
HOSR HOWR LOSR LOWR HOSR HOWR LOSR LOWR
High Complementarities Low Complementarities
Figure 5. Profits for National Bidders for SMR (Light) and SMRPB (Dark)
The increased competition between the nationals in the LOLC treatments with
package bidding is also a factor in the reduction in regional bidders’ profits in this case. For the 6 sessions matched pairs of sessions in the LOLC treatments (two sets of bars on
14
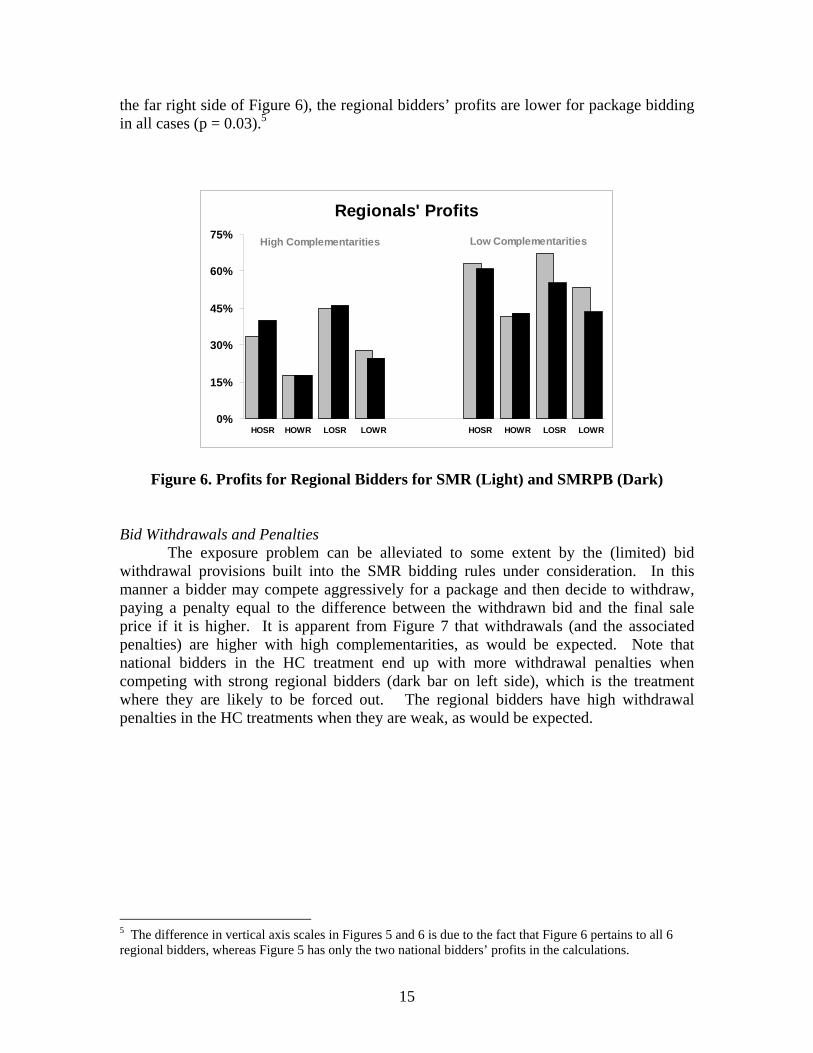
the far right side of Figure 6), the regional bidders’ profits are lower for package bidding in all cases (p = 0.03).5
Regionals' Profits
0%
15%
30%
45%
60%
75%
HOSR HOWR LOSR LOWR HOSR HOWR LOSR LOWR
High Complementarities Low Complementarities
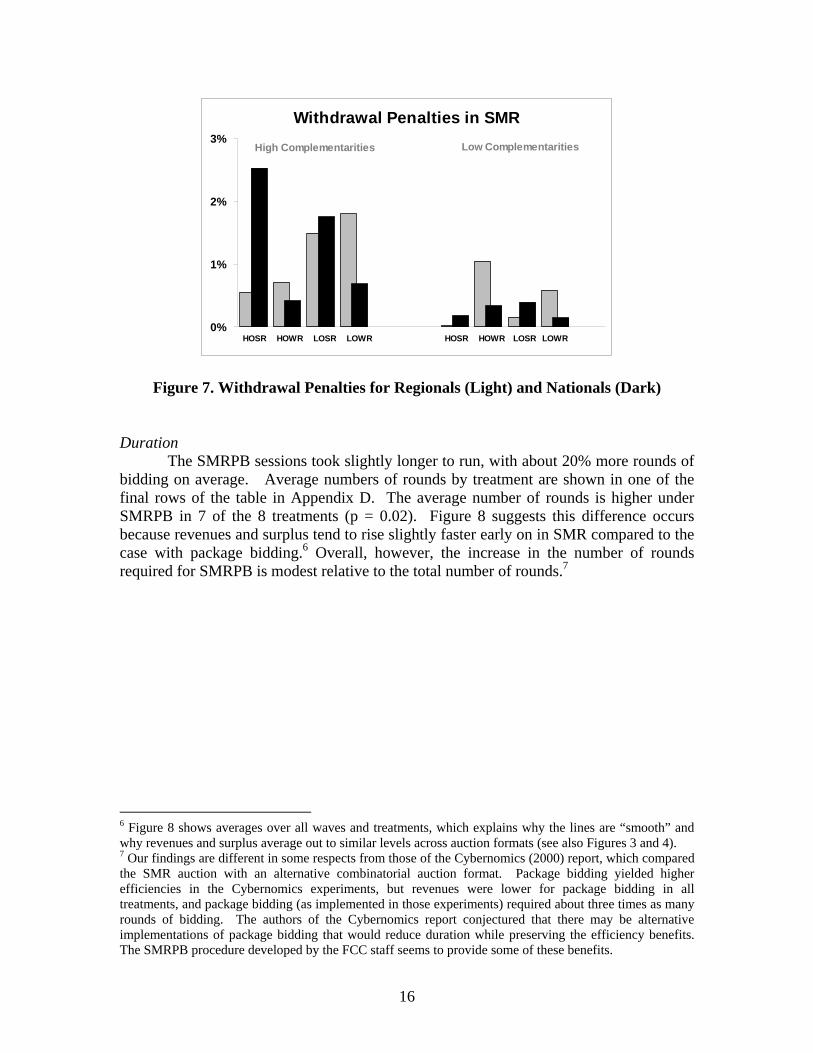
Figure 6. Profits for Regional Bidders for SMR (Light) and SMRPB (Dark) Bid Withdrawals and Penalties The exposure problem can be alleviated to some extent by the (limited) bid withdrawal provisions built into the SMR bidding rules under consideration. In this manner a bidder may compete aggressively for a package and then decide to withdraw, paying a penalty equal to the difference between the withdrawn bid and the final sale price if it is higher. It is apparent from Figure 7 that withdrawals (and the associated penalties) are higher with high complementarities, as would be expected. Note that national bidders in the HC treatment end up with more withdrawal penalties when competing with strong regional bidders (dark bar on left side), which is the treatment where they are likely to be forced out. The regional bidders have high withdrawal penalties in the HC treatments when they are weak, as would be expected.
5 The difference in vertical axis scales in Figures 5 and 6 is due to the fact that Figure 6 pertains to all 6 regional bidders, whereas Figure 5 has only the two national bidders’ profits in the calculations.
15
Withdrawal Penalties in SMR
0%
1%
2%
3%
HOSR HOWR LOSR LOWR HOSR HOWR LOSR LOWR
High Complementarities Low Complementarities
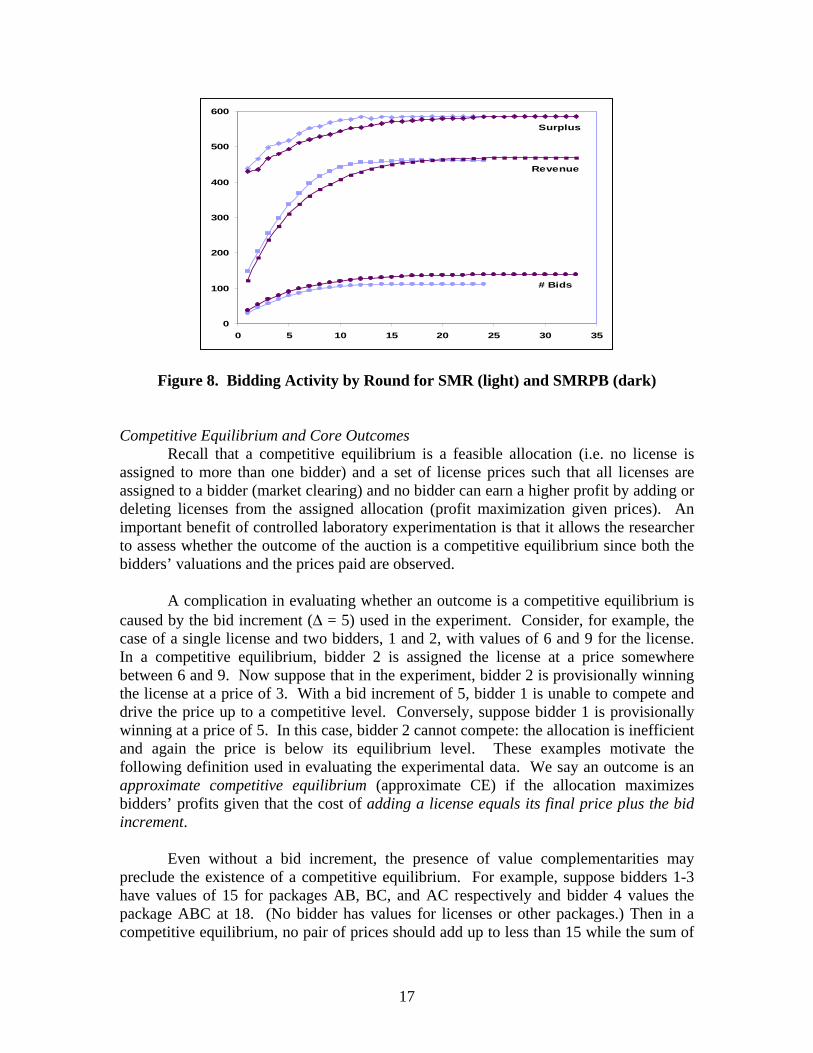
Figure 7. Withdrawal Penalties for Regionals (Light) and Nationals (Dark) Duration The SMRPB sessions took slightly longer to run, with about 20% more rounds of bidding on average. Average numbers of rounds by treatment are shown in one of the final rows of the table in Appendix D. The average number of rounds is higher under SMRPB in 7 of the 8 treatments (p = 0.02). Figure 8 suggests this difference occurs because revenues and surplus tend to rise slightly faster early on in SMR compared to the case with package bidding.6 Overall, however, the increase in the number of rounds required for SMRPB is modest relative to the total number of rounds.7
6 Figure 8 shows averages over all waves and treatments, which explains why the lines are “smooth” and why revenues and surplus average out to similar levels across auction formats (see also Figures 3 and 4). 7 Our findings are different in some respects from those of the Cybernomics (2000) report, which compared the SMR auction with an alternative combinatorial auction format. Package bidding yielded higher efficiencies in the Cybernomics experiments, but revenues were lower for package bidding in all treatments, and package bidding (as implemented in those experiments) required about three times as many rounds of bidding. The authors of the Cybernomics report conjectured that there may be alternative implementations of package bidding that would reduce duration while preserving the efficiency benefits. The SMRPB procedure developed by the FCC staff seems to provide some of these benefits.
16
0
100
200
300
400
500
600
0 5 10 15 20 25 30 35
Surplus
Revenue
# Bids
Figure 8. Bidding Activity by Round for SMR (light) and SMRPB (dark) Competitive Equilibrium and Core Outcomes
Recall that a competitive equilibrium is a feasible allocation (i.e. no license is assigned to more than one bidder) and a set of license prices such that all licenses are assigned to a bidder (market clearing) and no bidder can earn a higher profit by adding or deleting licenses from the assigned allocation (profit maximization given prices). An important benefit of controlled laboratory experimentation is that it allows the researcher to assess whether the outcome of the auction is a competitive equilibrium since both the bidders’ valuations and the prices paid are observed.
A complication in evaluating whether an outcome is a competitive equilibrium is
caused by the bid increment (∆ = 5) used in the experiment. Consider, for example, the case of a single license and two bidders, 1 and 2, with values of 6 and 9 for the license. In a competitive equilibrium, bidder 2 is assigned the license at a price somewhere between 6 and 9. Now suppose that in the experiment, bidder 2 is provisionally winning the license at a price of 3. With a bid increment of 5, bidder 1 is unable to compete and drive the price up to a competitive level. Conversely, suppose bidder 1 is provisionally winning at a price of 5. In this case, bidder 2 cannot compete: the allocation is inefficient and again the price is below its equilibrium level. These examples motivate the following definition used in evaluating the experimental data. We say an outcome is an approximate competitive equilibrium (approximate CE) if the allocation maximizes bidders’ profits given that the cost of adding a license equals its final price plus the bid increment.
Even without a bid increment, the presence of value complementarities may preclude the existence of a competitive equilibrium. For example, suppose bidders 1-3 have values of 15 for packages AB, BC, and AC respectively and bidder 4 values the package ABC at 18. (No bidder has values for licenses or other packages.) Then in a competitive equilibrium, no pair of prices should add up to less than 15 while the sum of
17

all three prices should be no more than 18. There are no prices that satisfy these constraints. As a relaxation of the competitive equilibrium we therefore consider the notion of the core, which does not require the calculation of prices for individual licenses and always exists in the framework being considered here. Intuitively, an outcome is in the core if the sum of the profits for any subset or “coalition” of players is no less than the total surplus generated by the coalition in isolation of the rest. If this condition were not satisfied then the coalition could form a “blocking coalition” that provides its members with a higher payoff than they currently receive. In the example, a core outcome obtains if bidder 4 is assigned the package ABC and bidder 4’s profit is 3 or less (yielding 15 or more for the seller).
Of course, in the experiment it may happen that bidder 1 provisionally wins the
package AB for a total price of 14. This is not a core outcome because bidder 4 and the seller could form a blocking coalition, but there is no way that bidder 4 can accomplish this by bidding further on the package ABC. Parallel to our definition of an approximate CE we say that an outcome is an approximate core outcome if the sum of the profits for any coalition of players is no less than the total surplus generated by the coalition in isolation of the rest minus the number of licenses the coalition would be assigned times the bid increment. The final rows of the table in Appendix D give the percentage of approximate CE and approximate Core outcomes by treatment.8 The fraction of approximate CE outcomes is generally low except for two low complementarities treatments, indicating that subjects “left some money on the table.” The notion of an approximate Core outcome seems to have more bite and indicates that the introduction of package bidding helps in finding stable outcomes when complementarities are high. In contrast, with low complementarities, the SMR auction almost always yields an approximate Core outcome.
VI. Conclusions and Suggestions for Further Work The laboratory experiments suggest several dimensions in which spectrum auction outcomes might be improved by switching from simultaneous multi-round auctions to a format with package bidding. The SMRPB format that is currently being considered by the FCC results in higher efficiencies when there is an exposure problem, i.e. when value complementarities are not minimal. These efficiency gains are significant from a statistical point of view, and the economic magnitudes could be quite large, given the high values of spectrum licenses. Our experienced subjects managed to use withdrawal provisions effectively to avoid losses in the SMR treatments, so the revenues for these treatments were no higher on average than for the SMRBP treatments. The SMRPB auctions required about 20% more rounds, but did not result in unsold licenses, which was observed in about 5% of the cases with SMR under high complementarities.
Additional experiments may help identify ways to improve both auction formats. In particular, the efficiency reductions generated by package bidding with low 8 These two rows are based on waves 1 and 2 only.
18

complementarities may be due to the fact that packages are not needed to overcome the exposure problem in these treatments, but packages are required by the XOR rule that bidders only have a single winning bid. This rule forces bidders to bid for multiple combinations of licenses in order to find the right “fit.” On the other hand, the rule does help bidders avoid cases when they have to pay more than is budgeted. One way to evaluate these two conflicting considerations would be to run experiments with budget constraints and default penalties for cases of overspending. These experiments could be run with and without the XOR rule (and its associated implications for the calculation of activity limits), as proposed by Kwasnica, Ledyard, Porter, and DeMartini (2005).
A second factor to consider is whether alternative, clock-driven package bidding
formats might enhance revenue generation (Porter et al., 2003; Ausubel, Cramton, and Milgrom, 2004). We have conducted some pilot experiments with the strong regionals (SR) treatments, and in all cases thus far, the combinatorial clock yielded higher revenues than the other auction formats considered (with or without package bidding).
A third issue is whether auction formats can be changed to deter tacit collusion
among bidders. In the designs considered here, bidders with high experience are able to restrain their bidding in a manner that reduces revenues below levels observed for inexperienced bidders. One possibility is that this type of tacit collusion is facilitated by the provision of ex post information about bidders’ identities and bid amounts after each round, as suggested by the withholding of this information in the upcoming AWS auctions. Another possibility is that a two-phase auction with a final stage of simultaneous bidding may break this type of tacit collusion (Klemperer, 2002; see Goeree and Offerman, 2004, for experimental evidence). For example, the ascending-price clock auction could be followed with a sealed bid competition among the highest bidders remaining at the end of the first phase.
19

References Ausubel, L. M., P. Cramton, and P. Milgrom (2004) “The Clock-Proxy Auction: A
Practical Combinatorial Auction Design,” in Combinatorial Auctions, eds. P. Cramton, Y. Shoam, and R. Steinberg, MIT Press, 2006, p. 115-138.
Brunner, C., J. K. Goeree and C. A. Holt (2005) “Bid-Driven versus Clock-Driven Package Auctions: Experimental Results,” presentation made at the Southern Economics Association meetings, November 2005, Washington DC.
Goeree, J. K. and C. A. Holt (2005) “Comparing the FCC’s Combinatorial and Non-Combinatorial Simultaneous Multi-Round Auctions: Experimental Design Report,” prepared for the Wireless Communications Bureau of the Federal Communications Commission.
Goeree, J. K. and T. Offerman (2004) “The Amsterdam Auction,” Econometrica, 72(1), January, 281-294.
Cybernomics (2000) “An Experimental Comparison of the Simultaneous Multi-Round Auction and the CRA Combinatorial Auction,” consulting report submitted to the Federal Communications Commission.
Klemperer, P. (2002) “What Really Matters in Auction Design,” Journal of Economic Perspectives, 16, Winter, 169-189.
Kwasnica, A. M., J. O. Ledyard, D. Porter, and C. DeMartini (2005) “A New and Improved Design for Multi-Object Iterative Auctions,” Management Science, 51(3), March, 419-434.
Porter, D., S. Rassenti, A. Roopnarine and V. Smith (2003) “Combinatorial Auction Design,” Proceedings of the National Academy of Sciences, 100(19), September, 11153-11157.
20
Appendix A: Rules for the SMR Laboratory Auctions Rounds and Bid Structure: All licenses are put up for bid simultaneously, and participants may only submit bids on individual licenses. The auction consists of successive rounds in which participants may place bids. Following each round, the high bid for each license is posted. These high bids then become the standing bids for the subsequent round. Acceptable Bids: In the first round, an acceptable bid must be equal to or exceed the initial price of 0 by 5 points (each point equaled 40 cents in the experiment). Subsequently, in order to be acceptable, a bid must exceed the provisionally winning bid for the license by at least 5 points. Bidders are given the choice of making one of eight incrementally higher bids (in 5 point increments). Bid Withdrawal: Each bidder has at most 2 rounds in which they are permitted to withdraw any of their provisionally winning bids. After the withdrawal, the seller becomes the provisionally winning bidder for the withdrawn license and the minimum acceptable bid in the following round equals the second highest bid received on the license, which may be less than or equal to (in the case of tied bids) the amount of the withdrawn bid. A withdrawing bidder pays a penalty equal to the maximum of zero or the difference between the price at which the bidder withdrew its bid and the final sale price in the current auction. If the license goes unsold, the bidder would normally be responsible for paying the difference between the withdrawn bid and the sale price in a subsequent auction, plus a small percentage penalty of 3%. In the experiment, there is no subsequent auction, so these penalties for the case of an unsold license were implemented by requiring that the bidder pay a penalty of 25% of the withdrawn bid. Bidding Eligibility and Activity: Each license in the experiment is assigned one bidding unit. The total number of bidding units available to the bidder establishes the bidder’s maximum “eligibility” to bid. National bidders begin each auction with 6 activity units and regional bidders begin with 3. In each round, a bidder’s activity is calculated as the number of licenses for which that bidder is a provisional winner, plus the number of licenses for which acceptable bids are submitted. If a bidder’s activity falls below the bidder’s current activity limit, that limit is reduced to equal the bidder’s actual activity. There were no activity rule wavers in the experiment, so a reduction in activity would put an upper limit on the bidder’s activity for all subsequent rounds of that auction. End of Round Feedback: At the end of each round, bidders receive information on all provisionally winning bids, withdrawn bids, and the corresponding bidder ID numbers. Bidders also see the sum of their own values for the licenses that they are provisionally winning and prices that would be paid for the licenses if the auction had ended. Closing Rule: The auction closes after any round in which no new bids were placed and no bids were withdrawn. In this case provisionally winning bids become winning bids that are used to calculate auction earnings. The experiment did not allow for defaults on payments, so gains were added to cumulative earnings and losses were subtracted.
21

Appendix B: Rules for the SMRPB Laboratory Auctions Rounds and Bid Structure: This is a simultaneous, multi-round auction in which participants may submit bids on individual licenses or on combinations of licenses (packages). Bids have an exclusive OR (XOR) structure in the sense that each bidder can have at most one provisionally winning bid. Winning bids are calculated by maximizing seller revenue for the round. Acceptable Bids: In the first round, an acceptable bid must be equal to or exceed the minimum opening bid of 0 by 5 points for each license, or by 5 points times the number of licenses in a package. After each subsequent round, “prices” are calculated for each license on the basis of bids received in the previous round. The pricing rule, as specified in Appendix D of the Experiment Design Report, calculates prices that reflect (as closely as possible) the marginal sales revenue of each license based on bids received. Prices for packages are the given by the sum of the prices for each license in the package. In order to be acceptable, a bid must exceed the price of a license or package at least 5 points times the number of licenses covered by the bid. Bidders are given the choice of making one of eight incrementally higher bids (in 5 point increments). Bidding Eligibility and Activity: Each license in the experiment is assigned one bidding unit. The total number of bidding units available to the bidder establishes the bidder’s maximum “eligibility” to bid (3 for regional bidders and 6 for national bidders). In each round, a bidder’s activity is calculated as the number of licenses for which that bidder is a provisional winner, plus the maximum number of licenses on any bid submitted. For example, a regional bidder with an initial activity limit of 3 who is provisionally winning license A would be able to bid on packages BC and BE, but not on BCE. If a bidder’s activity falls below the bidder’s current activity limit, that limit is reduced to equal the bidder’s actual activity. There were no activity rule wavers in the experiment, so a reduction in activity would put an upper limit on the bidder’s activity for all subsequent rounds of that auction. End of Round Feedback: At the end of each round, bidders receive information on all provisionally winning bids (for licenses and packages) and the corresponding bidder ID numbers. Bidders also see the prices for all licenses, the sum of their own values for the licenses and packages that they are provisionally winning, and the sum of prices that would be paid for those licenses and packages if the auction had ended. Closing Rule: The auction closes after any round in which no new bids were placed. In this case provisionally winning bids become winning bids that are used to calculate auction earnings. The experiment did not allow for defaults on payments, so gains were added to cumulative earnings and losses were subtracted.
22

Appendix C: List of Experiment Sessions
Sessions with Inexperienced Subjects: Wave 0 Parameters Date Auction Treatment Subjects # Auctions
2/06/06 SMRPB – 129/201 Ho Mc Sr 8 10 2/07/06 SMRPB – 129/201 Ho Lc Sr 8 10 2/08/06 SMRPB – 132/211 Ho Hc Wr 8 10 2/09/06 SMRPB – 137/216 Ho Lc Wr 8 10 2/10/06 SMRPB – 138/220 Lo Hc Sr 8 10 2/13/06 SMRPB – 159/261 Lo Hc Wr 8 10 2/14/06 SMR – 162/264 Ho Hc Sr 8 10 2/15/06 SMR – 163/269 Ho Hc Wr 8 10 2/16/06 SMR – 164/271 Ho Lc Wr 8 10 2/17/06 SMR – 166/272 Lo Hc Sr 8 10 2/21/06 SMR – 167/273 Lo Hc Wr 8 10 2/22/06 SMR – 168/274 Lo Lc Wr 8 10 2/23/06 SMRPB – 169/275 Lo Lc Wr 8 10 2/24/06 SMR – 170/276 Ho Lc Sr 8 10 3/01/06 SMRPB – 179/301 Lo Lc Sr 8 10 3/02/06 SMRPB – 124/308 Ho Hc Sr 8 10
Sessions with Experienced Subjects: Wave 1 Parameters Date Auction Treatment Subjects # Auctions
3/01/06 SMRPB – 172/299 Ho Hc Sr 8 6 3/02/06 SMRPB – 183/303 Ho Lc Wr 8 6 3/03/06 SMR – 186/313 Ho Lc Wr 8 6 3/04/06 SMR – 187/314 Lo Lc Sr 8 6 3/04/06 SMRPB – 188/315 Lo Lc Sr 8 6 3/05/06 SMR – 189/316 Lo Hc Wr 8 6 3/06/06 SMRPB – 190/319 Lo Hc Wr 8 6 3/07/06 SMRPB – 194/324 Lo Hc Sr 8 6 3/07/06 SMR – 197/325 Ho Hc Wr 8 6 3/08/06 SMRPB – 198/326 Ho Hc Wr 8 6 3/08/06 SMR – 199-327 Ho Lc Sr 8 6 3/09/06 SMR – 6/13 Ho Hc Sr 8 6 3/09/06 SMR – 201/329 Lo Lc Wr 8 6 3/10/06 SMRPB – 202/330 Ho Lc Sr 8 6 3/10/06 SMRPB – 203/332 Lo Lc Wr 8 6 3/24/06 SMR – 220/348 Lo Hc Sr 8 6
23

24
Sessions with Experienced Subjects: Wave 2 Parameters Date Auction Treatment Subjects # Auctions
3/06/06 SMR – 1/5 Lo Hc Sr 8 6 3/07/06 SMR – 3/8 Ho Hc Wr 8 6 3/08/06 SMR – 5/12 Ho Lc Sr 8 6 3/09/06 SMR – 8/14 Lo Lc Wr 8 6 3/10/06 SMRPB – 9/16 Ho Lc Sr 8 6 3/10/06 SMRPB – 10/17 Lo Lc Wr 8 6 3/11/06 SMRPB – 204/333 Lo Hc Sr 8 6 3/11/06 SMRPB – 206/334 Ho Hc Wr 8 6 3/11/06 SMRPB – 12/19 Ho Hc Sr 8 6 3/11/06 SMR – 207-335 Ho Hc Sr 8 6 3/12/06 SMR – 208/336 Ho Lc Wr 8 6 3/12/06 SMR – 14/21 Lo Lc Sr 8 6 3/12/06 SMRPB – 209/337 Lo Lc Sr 8 6 3/12/06 SMRPB – 15/22 Ho Lc Wr 8 6 3/24/06 SMR – 32/45 Lo Hc Wr 8 6 3/31/06 SMRPB – 43/59 Lo Hc Wr 8 6
Sessions with Experienced Subjects: Wave 3 Parameters Date Auction Treatment Subjects # Auctions
3/13/06 SMRPB – 212/339 Lo Lc Wr 8 10 3/13/06 SMRPB – 18/24 Lo Lc Sr 8 10 3/14/06 SMRPB – 20/26 Lo Hc Wr 8 10 3/15/06 SMRPB – 215/343 Ho Hc Sr 8 10 3/15/06 SMRPB – 22/28 Ho Hc Wr 8 10 3/16/06 SMRPB – 25/32 Ho Lc Sr 8 10 3/16/06 SMRPB – 218/346 Ho Lc Wr 8 10 3/27/06 SMR – 223/349 Ho Lc Wr 8 10 3/27/06 SMR – 35/46 Ho Lc Wr 8 10 3/28/06 SMR – 34/47 Ho Hc Wr 8 10 3/28/06 SMR – 222/350 Ho Hc Sr 8 10 3/29/06 SMR – 36/55 Lo Hc Wr 8 10 3/29/06 SMR – 224/351 Lo Hc Sr 8 10 3/30/06 SMR – 225/352 Lo Lc Wr 8 10 3/30/06 SMR – 37/58 Lo Lc Sr 8 10 3/31/06 SMRPB – 226/353 Lo Hc Sr 8 10

Appendix D: Efficiency, Revenue, and Profits by Treatment in the SMR and SMRPB Auctions
SMR SMRPB SMR SMRPB SMR SMRPB SMR SMRPB SMR SMRPB SMR SMRPB SMR SMRPB SMR SMRPB
EfficiencyWave 1 86% 88% 86% 95% 86% 89% 79% 91% 96% 88% 88% 76% 96% 93% 86% 85%Wave 2 85% 93% 90% 91% 79% 91% 85% 86% 96% 84% 94% 84% 97% 86% 91% 85%Wave 3 81% 93% 90% 94% 89% 91% 93% 91% 96% 93% 92% 85% 97% 90% 100% 88%
Average 83% 92% 89% 93% 85% 91% 87% 90% 96% 89% 91% 82% 97% 90% 94% 86%Revenue
Wave 1 54% 46% 55% 50% 40% 49% 40% 39% 30% 21% 41% 26% 30% 38% 7% 41%Wave 2 55% 44% 55% 61% 42% 48% 46% 53% 32% 15% 37% 38% 28% 36% 32% 37%Wave 3 44% 42% 46% 48% 42% 38% 36% 59% 28% 35% 36% 26% 25% 25% 28% 31%
Average 49% 44% 51% 52% 42% 43% 40% 52% 30% 26% 38% 29% 27% 32% 24% 35%Profit Nationals
Wave 1 3% 10% 19% 27% 4% -3% 21% 21% 4% 5% 12% 14% 3% 2% 18% 4%Wave 2 -4% 7% 18% 13% -2% 2% 19% 12% 4% 1% 13% 6% 2% 4% 15% 10%Wave 3 1% 7% 22% 28% 1% 3% 19% 9% 2% 3% 12% 10% 2% 3% 17% 8%
Average 0% 8% 20% 24% 1% 1% 19% 13% 3% 3% 12% 10% 2% 3% 17% 8%Losses 1% 0% 1% 0% 0% 1% 1% 0% 0% 0% 0% 0% 0% 0% 0% 1%
Profit RegionalsWave 1 29% 32% 11% 18% 48% 43% 18% 31% 62% 63% 35% 36% 63% 53% 61% 39%Wave 2 33% 42% 18% 17% 38% 42% 21% 22% 60% 68% 44% 40% 66% 46% 44% 38%Wave 3 36% 44% 22% 18% 46% 51% 38% 23% 65% 55% 44% 49% 70% 62% 55% 49%
Average 33% 40% 18% 18% 45% 46% 28% 25% 63% 61% 42% 43% 67% 55% 53% 43%Losses 0% 0% 0% 0% 1% 0% 1% 0% 0% 0% 0% 0% 0% 0% 0% 0%
# Rounds 15.3 16.7 10.4 9.7 16.0 18.3 10.5 11.5 14.3 17.8 8.5 10.3 15.3 21.8 8.9 11.1
Unsold Licenses 5% 0% 2% 0% 6% 0% 5% 0% 0% 0% 2% 0% 0% 0% 1% 0%
approximate CE 17% 8% 25% 0% 0% 0% 33% 0% 43% 0% 67% 0% 63% 10% 42% 0%
approximate CORE 58% 67% 67% 83% 42% 67% 75% 75% 100% 67% 100% 83% 100% 88% 92% 100%
HOLCSR HOLCWR LOLCSR LOLCWRHOHCSR HOHCWR LOHCSR LOHCWR
25