Embed Size (px)
Citation preview

An Experimental Study of Ceramic Dental Porcelain Materials
Using A 3D Print (3DP) Process
Shanshan Zhanga, Hadi Miyanajia, Li Yanga, Amir Ali Zandinejadb, J.J.S. Dilipa
and Brent Stuckera aDepartment of Industrial Engineering, J.B. Speed School of Engineering
bDepartment of Oral Health and Rehabilitation, School of Dentistry
University of Louisville, KY, 40292
Abstract
Dental porcelain materials have been used widely in dental restorations such as crowns,
veneers and onlays. In this study, a commercial dental-grade porcelain powder (IPS InLine Dentin)
was investigated for compatibility with 3D printing. An extensive experimental study was carried
out to evaluate the effects of various in-process and post-process parameters on the geometrical
accuracies and porosities of the dental porcelain structures, and optimal process parameters were
determined that result in homogeneous shrinkage and minimized part distortions. This study
established a practical guideline for the direct fabrication of dental porcelain structures, which
enabled further development of this material that focused on performance improvement.
1. Instruction
Traditionally, ceramic dental restorations produced using processes, such as hot/cold
isostatic pressing (HIP/CIP), sintering or slip casting processes (Li and Liao, 1996, Itoh et al. 1994)
generally have limited accuracy and capabilities for product customization, which has gradually
become the trend. With the generation and development of CAD/CAM methods, these processes
have been commonly used for fabricating dental structures due to high accuracy (Denry and Kelly,
2008, Martorelli, 2013, Mohanty, 2013).In the CAD-CAM process, the starting feedstock is
usually a block of material that is usually significantly larger than the part to be made, therefore
this also creates a considerable amount of waste. Additive manufacturing (AM) provides a
promising method to produce dental restorations (Gibson et al., 2009). In addition to their abilities
to fabricate parts directly from the digital model, AM technologies also offer some other potential
advantages such as higher geometrical accuracy control, mass customization and rapid production.
Currently there exist limited research and development work focused on functional ceramic
fabrication with AM, and the use of AM technologies in dental applications is largely focused on
the production of prototypes and molds, and the direct manufacturing of metal dental implants
(Wu et al., 2001, Azari et al., 2009). However, studies in this area have demonstrated the feasibility
of direct manufacturing of high quality ceramic structures using AM. Wang et al. fabricated
permanent dental restorations via a micro-extrusion process using slurry materials (Wang et al.,
2006). It was reported that a direct write based printing process can be applied for the fabrication
of zirconia dental prostheses (Ebert et al., 2009), and a powder-binder system was used for patient
specific implants and scaffolds (Khalyfa et al., 2007, Lam et al., 2002). Compared to other
processes, the 3D printing (3DP) binder jetting process possesses various advantages for ceramic
991

printing. In addition to its good resolution limit and geometrical accuracy, 3DP also has
considerably more flexibility for material selection compared to both extrusion and direct sintering
processes. Unlike the direct sintering process, 3DP does not involve extensive thermal input,
therefore is also less affected by the thermal shock sensitivity of the ceramic materials. Therefore,
the binder jetting based 3DP processes have the potential for direct manufacturing of functional
ceramic structures.
In this paper, an experimental study was performed to explore the feasibility of using a
3DP process for high accuracy manufacturing of dental ceramic porcelain structures. The goal of
this study is to identify the optimal processing and post-processing parameters for high accuracy
part fabrication with dental porcelain materials. The relationships between linear shrinkage,
porosity and microstructure of the printed dental porcelain structure and various process
parameters were investigated through experiments in order to find the proper parameter sets and
understand the influence of each parameter on part quality. Mechanical properties were not
investigated in this paper and will be addressed as an ongoing effort.
2. Materials Preparation and Fabrication Methods
2.1 Powder preparation
The material used in this study is IPS InLine Dentin powder (Manufacturer: Ivoclar
Vivadent Corporate, Principality of Liechtenstein), which is a commerical product for artificial
dental restorations such as crowns, veneers and onlays. The chemical composition and relative
basic properties of IPS InLine Dentin powder provided by the manufacturer is shown in Table 1
(InLine scientific documentation, 2010).
Table 1 Technical data of IPS InLine Dentin powder
Standard composition (in wt%)
SiO2: 59.5 - 65.5, Al2O3: 13.0 - 18.0, K2O: 10.0 -
14.0, Na2O: 4.0 - 8.0, Other oxides: 0.0 - 4.0,
Pigments 0.0 - 2.0
Flexural Strength 80 ± 20 MPa
Chemical solubility < 100 µg/cm2
Glass transition temperature 585 ± 10 °C
Coefficient of thermal expansion
(25-500°C)
2 firings: 12.60 ± 0.5 10-6 K-1
4 firings: 13.20 ± 0.5 10-6 K-1
The original powder exhibits significant aggregation, which made it unable to be spread
uniformly in the printing process. From the SEM microscopy, the IPS InLine Dentin particles had
irregular shape and different sizes ranging from 0.3-10 μm, as shown in Fig. 1. Laser-based particle
size analysis (PSA, Microtrac S3000) shows that the characteristic size of the aggregation was ~36
μm, shown in Fig. 2. It was found previously that the irregular morphology and large particle size
range significantly reduced its flowability (Yang et al., 2013). In order to improve the flowability
of the powder, a flow agent was added. The function of the flow agent is analogous to the addition
of sand between two surfaces, which serves as low friction contact media and therefore reduces
the resistance of relative motions between the powder particles. The chemical composition of the
992

flow agent is largely irrelevant to its primary functionality, therefore flow agent with composition
similar to the original powder was selected.
Fig. 1 Morphology of original IPS InLine Dentin powder in SEM
The flow agent chosen was Aerosil R 972 Hydrophobic fumed silica powder (COSMOS
Plastic & Chemicals), with an average particle size of 16 nm. This powder is composed of 99.8%
fumed silica after treated with dimethyldichlorosilane (DDS) based on a hydrophilic fumed silica
with a specific surface area of 130 m2/g (Aerosil R 972 MSDS). Up to 10% volume percentage
flow agent was measured and added to the original IPS InLine Dentin powder, and the container
with the mixture was shaken by hand until well-proportioned mixed powder was visually
discernable. The flowability was evaluated using both angle of repose and particle size analyzer
for the original powder and treated powder with flow agent additive.
(a) Original Powder
25µm 5µm
993

(b) Flow agent added
Fig.2 Particle size analysis results of the IPS InLine Dentin powder
From the results of particle size analysis, flow agent has a significant effect on aggregation.
In Fig. 2(a), it can be seen that the mean particle size of the original powder is about 25 μm, and
the 95 percentile particle size is 52.89 μm. After adding flow agent, the average particle size
reduced to about 19 μm as shown in Fig.2(b), and the 95 percentile particle size also decreased to
36.79 μm.
The angle of repose test also showed significant improvement of flowability with the
prepared powder. The comparison of angles of repose of the original powder and the one with flow
agent additive is shown in Fig. 3, and the measurement results are listed in Table 2. Apparently,
the addition of 10% by volume flow agent significantly reduced the aggregation and flowability
issue of the original powder. This was further verified with a preliminary trial, and was
consequently used as the standard powder preparation method for the study.
(a) Original (b) Flow agent added
Fig. 3 Angles of repose of original powder and flow agent-added powder
Table 2 Angles of repose of powder
Powder type Angle of repose (degree)
Original 67
10% (vt.) addition of flow agent 58
The ExOne M-Lab system was used for this study, which is a powder bed based binder
jetting 3DP process. During the process, binder liquid infiltrates into the powder bed and bonds
the powder particles to create the geometries. After the printing operation of each layer, the powder
994

bed is heated by an infrared heater for a set amount of time in order to partially cure the binder and
to gain necessary strength. For each new layer, the powder is fed from the powder feeding box via
a roller. The procedures are repeated until the parts are completed. The schematic of the ExOne
3DP process is shown in Fig. 4.
Fig. 4 Schematic of 3D printing process for an ExOne M-lab system
The M-Lab system uses two special parameters for the control of binder amount and drying
level, which are the power level and the saturation level. The default setting for these two
parameters are 60% power level and 70% saturation, which was developed for stainless steel
powder. In order to identify suitable parameters for the dental porcelain powder used in this study,
a preliminary experiment was performed. Two sets of cubic specimens with size of 10x10x10 mm
were designed and fabricated under different power levels and saturation levels. The fabricated
green parts were put into a drying oven and baked at 200°C for 2 hours to fully cure the binder.
2.2 Saturation level
The first set of experiments evaluated the effect of saturation level on the print quality of
the porcelain powder. The binder saturation levels were set at 45%, 50%, 60% and 70%,
respectively, with the power level fixed at 60%. The printed samples are shown in Fig. 5. It is
obvious that saturation level could significantly affect the geometry of green parts. When the
saturation level was set as 70%, the printed parts deformed in the direction of roller spreading.
This was likely caused by insufficient drying of binder and the resulting low strength of the printed
area, which could be displaced under the frictional force of the roller when a new layer of powder
is deployed. As the saturation level reduced, less distortion was observed. On the other hand, when
the saturation continued to reduce to 45%, the amount of binder became insufficient, and the
strength of green parts was so low that the parts could not be handled without damage. A quick
loading test was performed on the green parts to evaluate the maximum compressive force that
could be applied to these parts without significant damage. A flat plate was placed on the top of
the samples, and weight was gradually added to the plate until the sample crumbled. The results
are shown in Fig. 6, and it was apparent that when fully cured, the strength of the green part
increases with the increase of binder amount. When the saturation level reduces from 50% to 45%,
there was a ~25% reduction of green part strength, which supported the experimental observation.
X
Z
Y
Powder Feeding Box
Parts Building Box
Binder Print Head
995
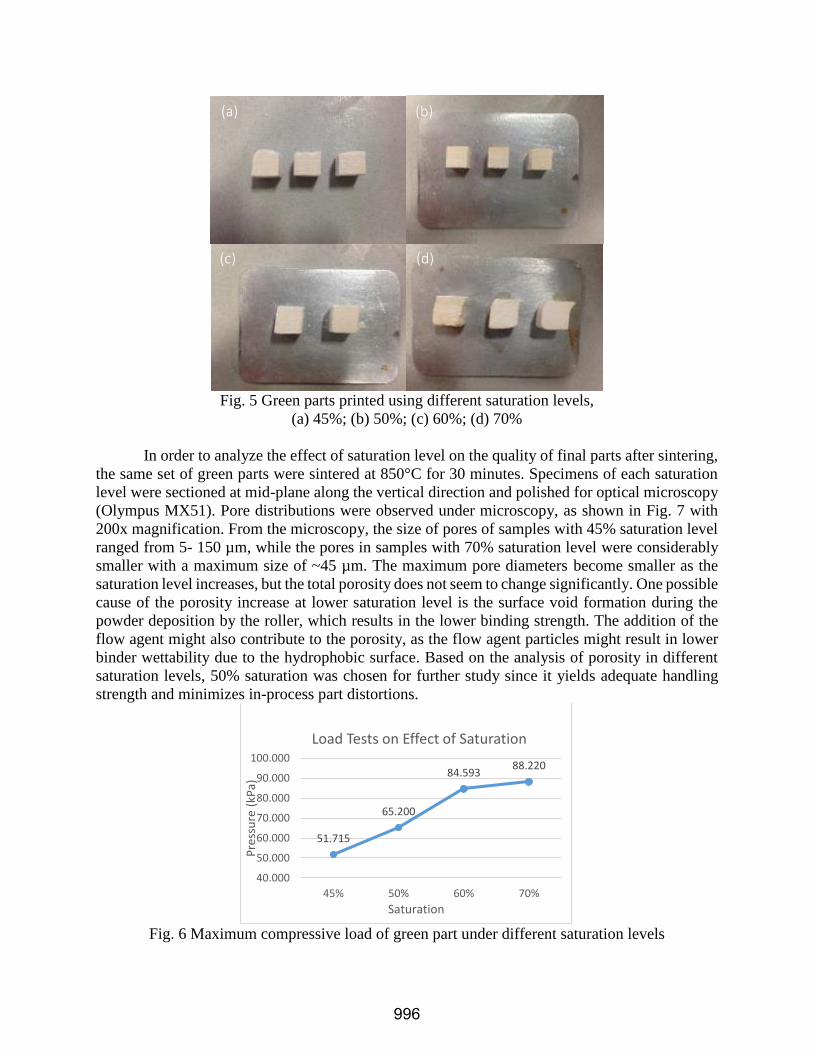
Fig. 5 Green parts printed using different saturation levels,
(a) 45%; (b) 50%; (c) 60%; (d) 70%
In order to analyze the effect of saturation level on the quality of final parts after sintering,
the same set of green parts were sintered at 850°C for 30 minutes. Specimens of each saturation
level were sectioned at mid-plane along the vertical direction and polished for optical microscopy
(Olympus MX51). Pore distributions were observed under microscopy, as shown in Fig. 7 with
200x magnification. From the microscopy, the size of pores of samples with 45% saturation level
ranged from 5- 150 µm, while the pores in samples with 70% saturation level were considerably
smaller with a maximum size of ~45 µm. The maximum pore diameters become smaller as the
saturation level increases, but the total porosity does not seem to change significantly. One possible
cause of the porosity increase at lower saturation level is the surface void formation during the
powder deposition by the roller, which results in the lower binding strength. The addition of the
flow agent might also contribute to the porosity, as the flow agent particles might result in lower
binder wettability due to the hydrophobic surface. Based on the analysis of porosity in different
saturation levels, 50% saturation was chosen for further study since it yields adequate handling
strength and minimizes in-process part distortions.
Fig. 6 Maximum compressive load of green part under different saturation levels
51.715
65.200
84.59388.220
40.000
50.000
60.000
70.000
80.000
90.000
100.000
45% 50% 60% 70%
Pre
ssu
re (
kPa)
Saturation
Load Tests on Effect of Saturation
(a) (b)
(c) (d)
996

Fig. 7 Microstructure of final parts with different saturations (heating treatment at 850°C for 30
min), (a) 45%; (b) 50%; (c) 60%; (d) 70%
2.3 Power Level
Since the powder bed is cured after each layer is printed, the power level could potentially
have significant influence on the in-process part qualities. Therefore, in the second set of
experiments, the power levels were set as 55%, 60% and 65% while the saturation levels were kept
at 50%. The printed samples are shown in Fig. 8. From the measurement results, the power level
does not seem to have apparent effects on the geometrical accuracies of the green parts. The same
set of samples was also sintered at 850°C for 30 minutes and prepared in the same way for
microscopy. The loading test of the green parts at all three power levels yield adequate strength as
shown in Fig. 9, while higher power levels appeared to be more advantageous. On the other hand,
higher power level corresponded to an increase of drying time, which was significant due to the
fact that the powder bed was dried at every layer. The microstructure of the samples is shown in
Fig. 10, and there was also no significant dependence between the power level and the porosity of
the final parts. This might be explained by the relatively low saturation level used for these studies.
It could be reasonably assumed that the binder could be adequately cured at the range of power
levels experimented with(e.g. 55%-65%), therefore no significant difference could be observed on
the green parts. It could also be expected that at higher saturation levels, higher power level might
be needed to achieve satisfactory handling strength.
Therefore, based on the preliminary experimental results, 60% power level was selected as
the standard parameter for further study.
(a)
(d) (c)
(b)
200µm 200µm
200µm 200µm
997

Fig. 8 Green parts printed in different power Levels,
(a) 55%; (b) 60%; (c) 65%
Fig. 9 Effect of power level on the compressive strength of the green parts
Fig. 10 Microstructure of final parts with different power levels (heating treatment at 850°C for
30 min), (a) 55%; (b) 60%; (c) 65%
3. Sintering Experiments
After the printed green parts are fully cured in the drying oven at 200°C for 2 hours, they
need to be cleaned and sintered to achieve the desired strength and density. A general firing
schedule for dental porcelain ceramic is shown in Fig. 11. The firing process started at room
temperature, and heated at a set rate to 500°C for half an hour (phase I), which aimed for burning
out the binder completely. After the burnout step, the part continued to be heated to the target
sintering temperature and subsequently held for a set amount of time (phase II), and then cooled
at 10°C/min to room temperature. Similar to the sintering of metal powders and other ceramic
powders, the sintering temperature, holding time and heating rate could have significant effect of
62.552 65.200
94.383
40.00050.00060.00070.00080.00090.000
100.000
55% 60% 65%
Pre
ssu
re (
kPa)
Power Level
Load Tests on Effect of Power Level
(b) (a) (c)
(a) (b) (c)
200µm 200µm 200µm
998

the shrinkage, microstructure and distortion of the final parts. Therefore these parameters were
investigated in this study in details. The experimental design is shown in Table 2, and the levels
of each variable were determined by standard firing schedules used in dental clinics for dental
porcelain.
Fig. 11 Firing schedule
Table 2 Factors and variables of experiment
Factors Levels
Temperature 750, 800, 850, 900, 925, 950°C
Holding time Instantaneous (1min), 10min, 30min, 2h, 10h
Heating rate 100°C/h, 500°C/h, 5000°C/h
Sintering of ceramics is a complicated process that involves mass transport driven by
multiple mechanisms. For low temperature sintering, the mass transporta is mainly controlled by
the surface energy and/or interface energy of the ceramic powder. From an atomic diffusion
perspective, higher firing temperature or longer holding time would facilitate greater diffusion and
therefore promote the sintering process. In the initial sintering stage, the driving force fordiffusion
is larger due to the large surface areas. However, as the sintering develops, excessive temperature
or holding time might cause excessive grain growth, and the overall properties of sintered parts
would deteriorate.
During the first stages of sintering, diffusion occurs mainly through the sintering neck
between two contacting particles, which results in shrinkage of the pores and the growing of the
neck size between the particles. This in turn causes shrinkage of the part. As diffusion continues,
the adjacent grain boundary intersects and forms networks. Driven by surface tension, the grain
boundary migrates, and the grains begin to grow. From powder metallurgy theory, the sintering
could be roughly estimated by the growth of the sintering neck (R) as a function of sintering
temperature (T) and holding time (t).
𝑅 ∝ 𝑒−1
𝑇⁄ 𝑡1
7⁄ (1)
From Eq.(1) (Huang, 1997), it is apparent that temperature has a pronounced effect on
sintering. Therefore, a multi-step experimental design approach was adopted, which was expected
to be more efficient and accurate compared to a Taguchi design or full scale design. The multi-
step experimental design is demonstrated in detail below.
Firing schedule:
Ⅰ: 500°C × 30min; Ⅱ: T × t; Cooling rate: 10°C/min
Ⅰ
Ⅱ
t/h
T/°C
999
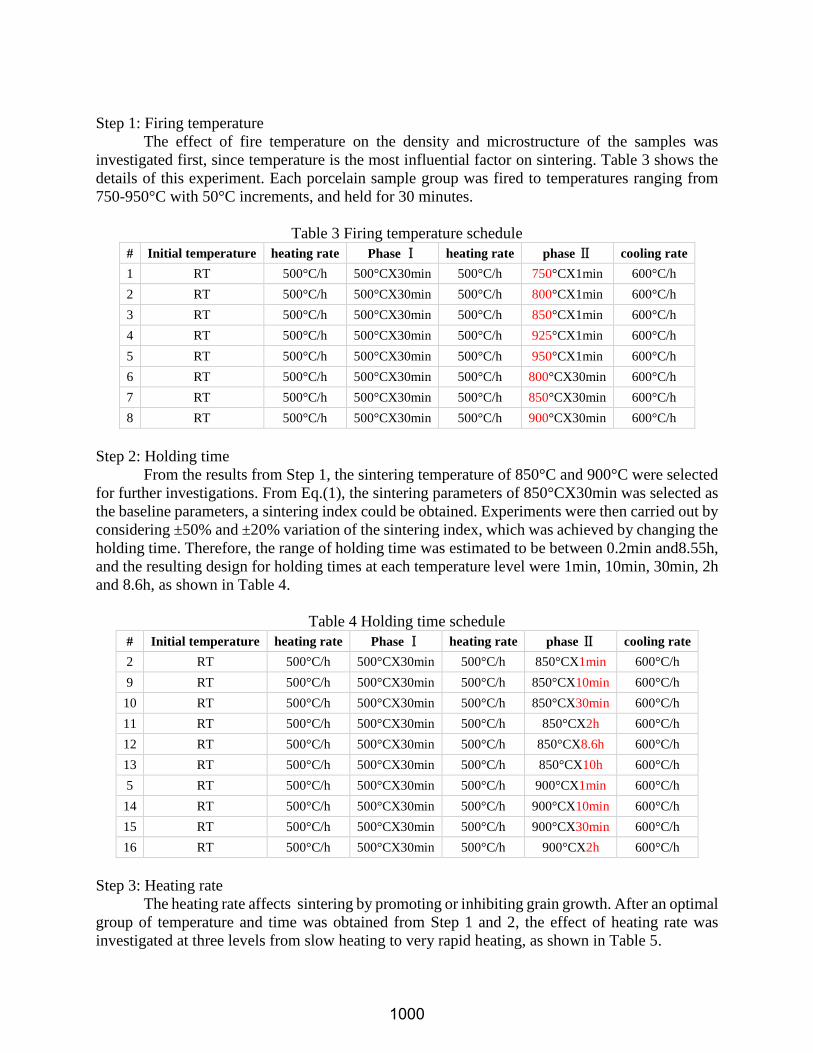
Step 1: Firing temperature
The effect of fire temperature on the density and microstructure of the samples was
investigated first, since temperature is the most influential factor on sintering. Table 3 shows the
details of this experiment. Each porcelain sample group was fired to temperatures ranging from
750-950°C with 50°C increments, and held for 30 minutes.
Table 3 Firing temperature schedule
# Initial temperature heating rate Phase Ⅰ heating rate phase Ⅱ cooling rate
1 RT 500°C/h 500°CX30min 500°C/h 750°CX1min 600°C/h
2 RT 500°C/h 500°CX30min 500°C/h 800°CX1min 600°C/h
3 RT 500°C/h 500°CX30min 500°C/h 850°CX1min 600°C/h
4 RT 500°C/h 500°CX30min 500°C/h 925°CX1min 600°C/h
5 RT 500°C/h 500°CX30min 500°C/h 950°CX1min 600°C/h
6 RT 500°C/h 500°CX30min 500°C/h 800°CX30min 600°C/h
7 RT 500°C/h 500°CX30min 500°C/h 850°CX30min 600°C/h
8 RT 500°C/h 500°CX30min 500°C/h 900°CX30min 600°C/h
Step 2: Holding time
From the results from Step 1, the sintering temperature of 850°C and 900°C were selected
for further investigations. From Eq.(1), the sintering parameters of 850°CX30min was selected as
the baseline parameters, a sintering index could be obtained. Experiments were then carried out by
considering ±50% and ±20% variation of the sintering index, which was achieved by changing the
holding time. Therefore, the range of holding time was estimated to be between 0.2min and8.55h,
and the resulting design for holding times at each temperature level were 1min, 10min, 30min, 2h
and 8.6h, as shown in Table 4.
Table 4 Holding time schedule
# Initial temperature heating rate Phase Ⅰ heating rate phase Ⅱ cooling rate
2 RT 500°C/h 500°CX30min 500°C/h 850°CX1min 600°C/h
9 RT 500°C/h 500°CX30min 500°C/h 850°CX10min 600°C/h
10 RT 500°C/h 500°CX30min 500°C/h 850°CX30min 600°C/h
11 RT 500°C/h 500°CX30min 500°C/h 850°CX2h 600°C/h
12 RT 500°C/h 500°CX30min 500°C/h 850°CX8.6h 600°C/h
13 RT 500°C/h 500°CX30min 500°C/h 850°CX10h 600°C/h
5 RT 500°C/h 500°CX30min 500°C/h 900°CX1min 600°C/h
14 RT 500°C/h 500°CX30min 500°C/h 900°CX10min 600°C/h
15 RT 500°C/h 500°CX30min 500°C/h 900°CX30min 600°C/h
16 RT 500°C/h 500°CX30min 500°C/h 900°CX2h 600°C/h
Step 3: Heating rate
The heating rate affects sintering by promoting or inhibiting grain growth. After an optimal
group of temperature and time was obtained from Step 1 and 2, the effect of heating rate was
investigated at three levels from slow heating to very rapid heating, as shown in Table 5.
1000

Table 5 Heating rate schedule
# Initial temperature heating rate Phase Ⅰ heating rate phase Ⅱ cooling rate
17 RT 100°C/h 500°CX30min 100°C/h 850°CX30min 600°C/h
10 RT 500°C/h 500°CX30min 500°C/h 850°CX30min 600°C/h
18 RT 5000°C/h 500°CX30min 5000°C/h 850°CX30min 600°C/h
Throughout the experiments, the linear shrinkage values were evaluated for each sample,
which was calculated according to ASTM C326-09 as:
𝑆 = [(𝐿1 − 𝐿2)/ 𝐿1] × 100% (2)
where S is percentage linear dimensional change, 𝐿1 is average length, width, or thickness of
specimen before sintering, and 𝐿2 is average length, width, or thickness of specimen after
sintering. After the parts were sintered, the porosity of each group of specimens was measured
using the Archimedes method (Spierings, 2011) according to ASTM B962-08 as:
𝑅𝐷 = 1 − 𝜌𝑒 𝜌𝑛⁄ (3)
where RD is porosity, 𝜌𝑒 is measured density, and 𝜌𝑛 is nominal density.
4. Results and Discussion
4.1 Linear shrinkage
4.1.1 Effect of heating temperature
Fig. 12 shows the linear shrinkage of the samples sintered at different temperatures for 1
minute. As sintering temperature increased, the linear shrinkage in horizontal directions (X and Y
directions) on the top surface of the sintered parts showed an ascending trend until 850°C, and
then remained largely constant at about 25%. However, the curve of the linear shrinkage in
horizontal directions at the bottom surface showed an obvious decrease after a small peak of linear
shrinkage at 850°C. It could be speculated that the glassy phase has a lower melting point, which
led to reduction in porosity and enhanced densification of the body. On the other hand, at elevated
temperature the glass phase might partially collapse under its own gravity due to the loss of
strength. This also explains the shrinkage phenomenon in the vertical direction (Z direction), which
showed an on-going ascending trend as the temperature increases, with the maximum value up to
32% (at 950°C).
In the group of specimens which were sintered for 30 minutes (Fig. 13), the linear shrinkage
in horizontal directions on the top surface kept increasing after 850°C. When the temperature
increased to the next level (925°C), the sintered body showed apparent signs of melting. At 950°C,
the specimen completely lost its original cubic shape due to melting. The linear shrinkage on the
bottom surface appeared to reach maximum at 850°C before it started to decrease, which was
similar to the group sintered for 1 minute.
1001

Fig. 12 Trend of linear shrinkage in X, Y and Z building directions as temperature changed
(holding for 1 min)
Fig. 13 Trend of linear shrinkage in X, Y and Z building directions as temperature changed
(holding for 30 min)
4.1.2 Effect of Holding Time
For the group sintered at 850°C, the linear shrinkage showed a slight increasing trend with
longer sintering time until the holding time reached 2 hours, and the linear shrinkage started to
decrease on the top surface of horizontal directions with longer holding time (Fig. 14). The linear
shrinkage at the bottom of horizontal directions also had the same trend except that the maximum
appeared at the holding time of 30 min. On the other hand, the linear shrinkage in the vertical
direction exhibited more or less constant linear shrinkage. The apparent decrease of linear
shrinkage at prolonged sintering times might be explained by the sintering dynamics. When
sintering develops to the late stage in which the pores are completely enclosed and become
spherical, further sintering no longer effectively eliminates the porosity. Instead, under the thermal
diffusion effect, the pores could start to migrate and coalesce, which could potentially lead to
macro-scale distortion of the sintered structures.
15.00%
20.00%
25.00%
30.00%
35.00%
750°C 800°C 850°C 900°C 925°C 950°C
Effect of Temperature (Holding for 1 min)
Top X Top Y Bottom X Bottom Y Z
15.00%17.00%19.00%21.00%23.00%25.00%27.00%29.00%31.00%33.00%
750°C 800°C 850°C 900°C
Effect of Temperature (Holding for 30 min)
Top X Top Y Bottom X Bottom Y Z
1002

Fig. 14 Trend of linear shrinkage in X, Y and Z building directions as holding time changed
(sintering at 850°C)
For the group of specimens sintered at 900°C as shown in Fig. 15, excessive sintering was
apparent beyond 1 minute of holding time. This was also clearly shown in the shapes of the final
parts, as partial melting and part distortion became obvious at longer holding times (Fig. 16).
Fig. 15 Trend of linear shrinkage in X, Y and Z building directions as holding time changed
(sintering at 900°C)
Fig. 16 Specimens sintered at 900°C holding for different time
17.00%
19.00%
21.00%
23.00%
25.00%
27.00%
29.00%
1min 10min 30min 2h 8.6h 10h
Effect of Holding Time in Phase II (850°C)
Top X Top Y Bottom X Bottom Y Z
17.00%
20.00%
23.00%
26.00%
29.00%
32.00%
1min 10min 30min
Effect of Holding Time in Phase II (900°C)
Top X Top Y Bottom X Bottom Y Z
Instantaneous (1min)
10min 2h 30min
1003

4.1.3 Effect of Heating Rate
The heating rate experiment was performed at 900°C for 1 minute, and the results of the
linear shrinkage are shown in Fig. 17. The linear shrinkage in all directions showed the same trend
as the heating rate changed from 100 °C/h to 5000 °C/h. Generally, the vertical direction had larger
shrinkage than horizontal directions, and top surface also had a little higher values than the bottom
surface.
For very rapid heating rate (5000 °C/h), smaller linear shrinkage could be expected due to
the insufficient sintering. On the other hand, at very slow heating rate (100 °C/h), the samples were
in fact subject to prolonged holding time at high temperature ranges, which might effectively cause
gravity induced distortion and over-sintering distortion as discussed before.
Fig. 17 Linear shrinkage in X, Y and Z building directions at different heating rates
4.2 Porosity
4.2.1 Effect of heating temperature
As shown in Fig. 18, as the sintering temperature increases, the porosity of the final part
reduces steadily due to more sufficient sintering. Also, at 925°C/30min significant melting already
occurred, therefore it appeared that the minimum porosity attainable porosity with the current
process method is about 7% for the dental porcelain.
Fig. 18 Porosity effect of heating temperature
20.00%
21.00%
22.00%
23.00%
24.00%
25.00%
26.00%
27.00%
100°C/h 500°C/h 5000°C/h
Effect of Heating Rate (900°Cx1min)
Top X Top Y Bottom X Bottom Y Z
0.109
0.0890.082
0.065 0.0680.072
0.050
0.060
0.070
0.080
0.090
0.100
0.110
0.120
750°C 800°C 850°C 900°C 925°C 950°C
Po
rosi
ty
Temperature
Effect of heating temperature (1min)0.094
0.0800.077
0.066
0.040
0.050
0.060
0.070
0.080
0.090
0.100
750°C 800°C 850°C 900°C
Po
rosi
ty
Temperature
Effect of heating temperature (30min)
1004
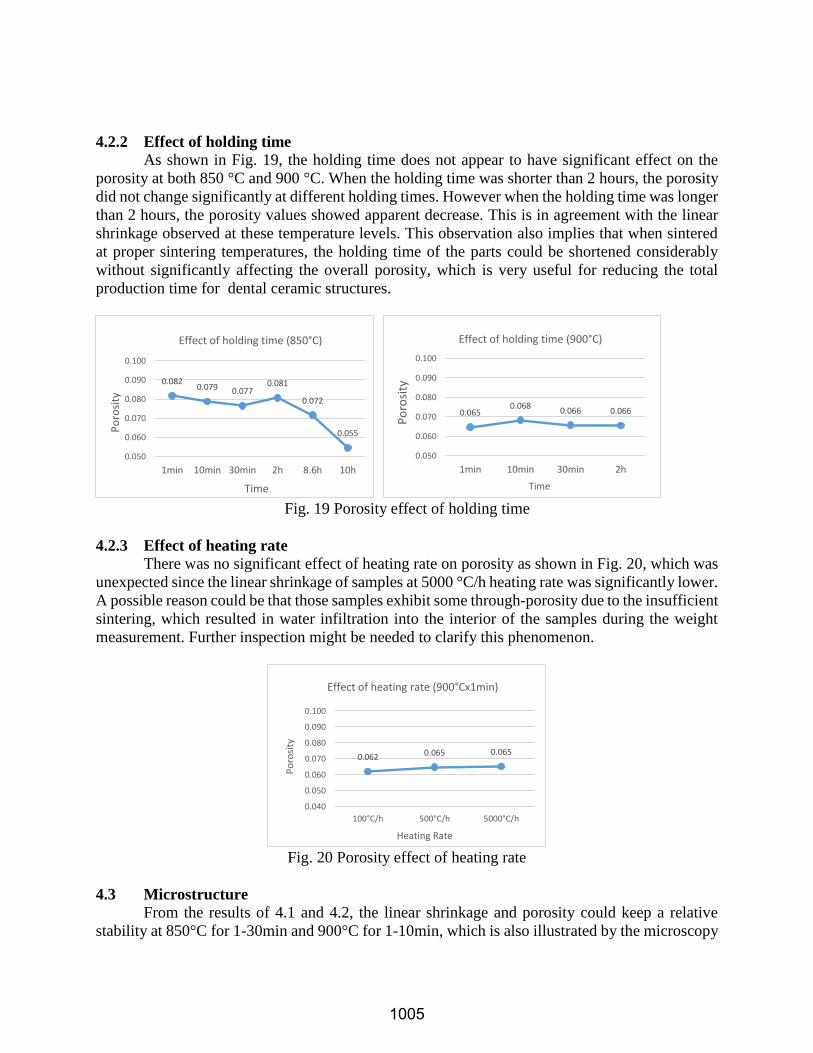
4.2.2 Effect of holding time
As shown in Fig. 19, the holding time does not appear to have significant effect on the
porosity at both 850 °C and 900 °C. When the holding time was shorter than 2 hours, the porosity
did not change significantly at different holding times. However when the holding time was longer
than 2 hours, the porosity values showed apparent decrease. This is in agreement with the linear
shrinkage observed at these temperature levels. This observation also implies that when sintered
at proper sintering temperatures, the holding time of the parts could be shortened considerably
without significantly affecting the overall porosity, which is very useful for reducing the total
production time for dental ceramic structures.
Fig. 19 Porosity effect of holding time
4.2.3 Effect of heating rate
There was no significant effect of heating rate on porosity as shown in Fig. 20, which was
unexpected since the linear shrinkage of samples at 5000 °C/h heating rate was significantly lower.
A possible reason could be that those samples exhibit some through-porosity due to the insufficient
sintering, which resulted in water infiltration into the interior of the samples during the weight
measurement. Further inspection might be needed to clarify this phenomenon.
Fig. 20 Porosity effect of heating rate
4.3 Microstructure
From the results of 4.1 and 4.2, the linear shrinkage and porosity could keep a relative
stability at 850°C for 1-30min and 900°C for 1-10min, which is also illustrated by the microscopy
0.0820.079 0.077
0.081
0.072
0.055
0.050
0.060
0.070
0.080
0.090
0.100
1min 10min 30min 2h 8.6h 10h
Po
rosi
ty
Time
Effect of holding time (850°C)
0.0650.068
0.066 0.066
0.050
0.060
0.070
0.080
0.090
0.100
1min 10min 30min 2h
Po
rosi
ty
Time
Effect of holding time (900°C)
0.062 0.065 0.065
0.040
0.050
0.060
0.070
0.080
0.090
0.100
100°C/h 500°C/h 5000°C/h
Po
rosi
ty
Heating Rate
Effect of heating rate (900°Cx1min)
1005

of these samples as shown in Fig. 21. In general, as sintering develops, the pore morphology and
size distribution should become more homogenous, which could also be seen from the microscopy.
The microscopy from the heating rate experiment samples are also indicative, as larger porosity
and pore size distribution as a result of insufficient sintering could be clearly seen from Fig. 22.
Fig. 21 Images of distribution of pores in optical microscopy (Shrinkage Stable)
Fig. 22 Images of distribution of pores (Heating rate)
850°C x 1min 900°C x 1min
850°C x 10min 900°C x 10min
850°C x 30min
200µm 200µm
200µm 200µm
200µm
100°C/h 5000°C/h 500°C/h
200µm 200µm 200µm
1006

5. Dental crown printing
A dental crown is a tooth-shaped cap that is placed over a tooth to cover the tooth and
improve its appearance. Thin wall features are designed in side of crown structures. Based on the
experimental results obtained from the study, a batch of dental ceramic crown prosthese from a
scanned model were printed using the ExOne M-Lab system using the optimal method with
relatively stable linear shrinkage. The 3D model was rescaled 40% larger than the original scanned
model to obtainthe correct size after shrinkage. The rescaled 3D model of a dental crown prosthesis
is shown in Fig. 23. The linear shrinkages in each direction (X, Y and Z directions) in the dental
crown were studied. Fig. 24 shows the final parts that were printed using processing parameters of
50% saturation and 60% power level, and sintered at 900°C for 1 minute.
Fig. 23 3D digital model of a dental crown prosthesis
Fig. 24 Porcelain crowns by 3D printing process
The average linear shrinkage values in each of three directions of the fabricated dental
crowns are shown in Fig. 25. The linear shrinkage in the Z (vertical) direction was larger than X
and Y (horizontal) directions. The lateral shrinkage values were similar to the experimental results
obtained from the cubic specimens. However, the linear shrinkage value in the Z direction was
15% larger than the results from the cubic specimens. This might be caused by the partial collapse
of the structure during sintering. Since the crown prosthesis has thin wall features, when the green
parts were placed in the furnace upside down, slight gravity induced distortion might have occurred
at the crown surfaces. Furthermore, with Archimedes method, the porosity was measured to be an
average value of 5.7%, which is in good agreement with the cubic specimens.
1007

Fig. 25 Linear shrinkage in X, Y and Z directions
For comparison purposes, a cubic specimen with the same dimensions was also fabricated
with the standard method currently used in dentistry. The specimen was made by manually forming
the cubic shape from the wetted InLine porcelain powder, which was then sintered using the
standard firing schedule (900 °C for 1 minute, heating rate 500 °C/hour). Fig. 26 shows the sintered
specimen. The geometrical accuracy of the fabricated specimen was not very good, which might
be caused by the manual manipulation during the fabrication. The porosity of this specimen was
3.3%, which was lower than the ones fabricated using the 3DP process. Fig. 27 shows the
distribution of pores under optical microscopy, and the image confirmed its lower porosity.
Fig. 26 A cubic specimen fabricated by a standard manual method
Fig. 27 Microstructure of the cube specimen fabricated by a standard manual method
24.78% 24.47%
30.69%
0.00%
5.00%
10.00%
15.00%
20.00%
25.00%
30.00%
35.00%
X Y Z
Dimensional linear shrinkage
200µm
1008

6. Summary and Conclusion As one of the less well understood types of AM processes, the 3DP process has a number
of control parameters that can significantly affect the fabrication quality. The experimental study
performed in this paper successfully revealed the relationships between these parameters and the
geometrical accuracy and microstructure of the final parts for a dental porcelain ceramic powder.
More specifically, some of the conclusions from this study can be directly applied to further
development with this material:
1) Flow agent had a significant effect on aggregation reduction, and improved flowability
significantly for the printing process.
2) When saturation was set above 60%, the green parts began to deform under the friction of
the roller. But when saturation was as low as 45%, the binder could not provide enough
strength to bind the powder. Additionally, saturation had a significant effect on the pores
of sintered parts in micrographs. The pore diameters decreased as the saturation level
increased, while total porosity did not seem to be significantly affected.
3) Power level does not have a significant effect on geometry and microstructure of the
green and final parts.
4) Effect of temperature: When distortion does not occur, linear shrinkage in horizontal
directions increases as the temperature increases. At higher temperature, parts are more
likely to exhibit gravity induced distortion, therefore reducing the accuracy of the part.
5) Effect of holding time: Holding time has a very mild effect on the linear shrinkage and
porosity of the parts. At higher temperature levels, longer holding time could result in
significant distortion of the parts. On the other hand, the surface finish could be improved
with longer holding time.
6) Effect of heating rate: Overall heating rate has a significant effect on the linear shrinkage
of the parts, which is primarily caused by the amount of sintering at different heating
rates. At very rapid heating rate (5000°C/h), longer holding time would be necessary in
order to avoid insufficient sintering.
7) The optimum process parameters obtained from the cubic specimens were successfully
applied to a thin-walled dental crown prosthesis, which exhibited good agreement of
linear shrinkage values in all three directions.
8) Binder jetting 3DP processes can produce better dimensional accuracies compared to the
current standard fabrication methods. However, the higher porosity level in the final parts
might affect the mechanical performance of the dental ceramic structures produced by
3DP, which needs to be characterized in further studies.
Acknowledgement The authors gratefully acknowledge the Rapid Prototyping Center (RPC) for their support
of facilities, test equipment and other assistance throughout this project, and Dr. Samuel Dilip for
the ceramic sample microscopy.
Reference
1009

J. Li, H. Liao and L. Hermansson, Sintering of partially-stabilized zirconia and partially-
stabilized zirconia—hydroxyapatite composites by hot isostatic pressing and pressureless
sintering, Biomaterials, 17 (1996), 1787-1790.
Itoh H, Wakisaka Y, Ohnuma Y, Kuboki Y, A new porous hydroxyapatite ceramic prepared by
cold isostatic pressing and sintering synthesized flaky powder. Dental Materials Journal,
13 (1994), 25-35.
Isabelle Denry and Robert Kelly, State of the art of zirconia for dental applications. Dental
Materials, 24 (2008), 299–307.
Massimo Martorelli, Salvatore Gerbino, Michele Giudice, Pietro Ausiello, A comparison
between customized clear and removable orthodontic appliances manufactured using RP
and CNC techniques, 29 (2013), e1-e10.
Saralasrita Mohanty, Arun Prabhu Rameshbabu, Santanu Dhara, Net shape forming of green
alumina via CNC machining using diamond embedded tool. 39 (2013), 8985-8993.
I. Gibson, D.W. Rosen, B. Stucker. AdditiveManufacturing Technologies: Rapid Prototyping to
Direct Digital Manufacturing. Springer, New York, NY, 2009.
M Wu, J Tinschert, M Augthun, I Wagner,J Schädlich-Stubenrauch, P.R Sahm, H Spiekermann
Application of laser measuring, numerical simulation and rapid prototyping to titanium
dental castings. Dental Materials, 17 (2001), 102-108.
Abbas Azari and Sakineh Nikzad, The evolution of rapid prototyping in dentistry: a review.
Rapid Prototyping Journal, 15 (2009), 216-225.
Jiwen Wang, Leon Shaw and Thomas Cameron, Solid Freeform Fabrication of permanent dental
restorations via slurry micro-extrusion. Journal of the American Ceramic Society, 89
(2006), 346-349.
J. Ebert, E. Ozkol, A. Zeichner, K. Uibel, O. Weiss, U. Koops, R. Telle, H. Fischer. Direct Inkjet
Printing of Dental Prostheses Made of Zirconia, Journal of Dental Research. 88(2009):
673‐676.
Alaadien Khalyfa, Sebastian Vogt, Jürgen Weisser, Gabriele Grimm, Annett Rechtenbach,
Wolfgang Meyer, Matthias Schnabelrauch, Development of a new calcium phosphate
powder-binder system for the 3D printing of patient specific implants. 18 (2007), 909-
916.
C.X.F Lama, X.M Moa, S.H Teoha, D.W Hutmacher, Scaffold development using 3D printing
with a starch-based polymer. 20 (2002), 49-56.
Scientific documentation IPS InLine system, 2010.
1010

Li Yang, Shanshan Zhang, Gustavo Oliveira, Brent Stucker, Development of a 3D Printing
Method for Production of Dental Application. Proceedings of the 24th International Solid
Freeform Fabrication Symposium. Austin, TX, USA. 2013.
Aerosil R 972 Hydrophobic fumed silica MSDS.
Peiyun Huang, Powder metallurgy principle, 2nd edition. Metallurgy Industrial press, 1997.
A.B. Spierings, M. Schneider. Comparison of density measurement techniques for additive
manufactured metallic parts. Rapid Prototyping Journal, 17(5), 2011, 380-386.
1011