Embed Size (px)
Citation preview

1
American Institute of Aeronautics and Astronautics
An Experimental Study of Dynamic Trailing Edge
Deflections on a Two Dimensional Translating Wing
Yun Liu 1, Bo Cheng
2, and Xinyan Deng
3
School of Mechanical Engineering, Purdue University, West Lafayette, IN 47906, USA
Abstract
In this study, dynamic trailing-edge deflections with different kinematics were applied on a
high-angle-of-attack translating wing. The effects of trailing-edge-deflection speed and
timing were investigated through PIV and force measurements. Both the PIV and force
measurement results indicate that the trailing edge deflection timing play a more important
role than that of deflection speed. Specially, by changing the trailing-edge-deflection timing,
three different flow patterns were captured while varying deflection speed results in similar
flow patterns. The force measurements show that a 22% variation of mean lift can be
achieved by changing the trailing edge deflection timing while much less variation was found
with deflection speed varying.
Nomenclature
AoA = Angle of Attack
C = Chord Length
Dis = Travel distance
K1 = Travel distance during wing acceleration (nondimensionalized by C)
K2 = Travel distance during wing deflection (nondimensionalized by C)
K3 = Travel distance when the wing starts to deflect (nondimensionalized by C)
Tac = Time span of wing acceleration
tdelay = Time when the wing starts to deflect
tend = Time when the wing stops deflecting
U = Velocity of wing translation
v = Measured flow velocity
Deflection angle
Circulation
Vorticity
__________________________ 1 Graduate student, School of Mechanical Engineering, Purdue University
2 Postdoctoral researcher, School of Mechanical Engineering, Purdue University
3 Associate Professor, School of Mechanical Engineering, Purdue University.
Email: [email protected]
Dow
nloa
ded
by P
UR
DU
E U
NIV
ER
SIT
Y o
n Ju
ne 9
, 201
4 | h
ttp://
arc.
aiaa
.org
| D
OI:
10.
2514
/6.2
013-
2816
31st AIAA Applied Aerodynamics Conference
June 24-27, 2013, San Diego, CA
AIAA 2013-2816
Fluid Dynamics and Co-located Conferences

2
American Institute of Aeronautics and Astronautics
I. Introduction
Conventional fixed wing aircrafts change the camber of airfoil to improve the aerodynamic
performance and create maneuvering forces, using flap mechanisms on the trailing-or-leading edges of
the wings1-4
. Recently, by introducing either novel actuators or material, morphing wings with
smoothly varying camber were proposed and widely studied 5-8
. Despite the differences in the camber
mechanisms, existing morphing wings operate under small angles of attack (generally lower than 15
o)
with attached flow on the leeward side of the airfoils 9 -10
.
Compared to fixed wings, flapping wings, which are adopted by fliers in nature, operate at a high angle
of attack. The reciprocal nature of this locomotion may allow us to develop micro air vehicle (MAV)
with not only hover capability but also superior maneuverability, properties required in operations in
confined space. Camber in flapping wings of insects was also observed 11-12
but studies have suggested
that it was created passively13-14
. Now the question is: does the active controlled camber, widely used in
fixed wing airplanes, also feasible and applicable in the flapping wings? To answer this question, the
flow features of the flapping wing, especially the vortical flow around the wings, needs to be
understood. As a matter of fact, extensive studies have been carried out addressing such problems,
including qualitative flow visualization and particle tracking measurement 15-20
. These studies have
suggested the flow around the flapping wing highly complex with prominent three dimensional and
unsteady effects, dominated by the generation and evolution of major vortices 21-23
.
Considering the complexity of flow features involved in the flapping wings, in the current study the
active change of camber was investigated in a simplified manner. Similar to previous studies 24-26
, a
high aspect-ratio wing was used to study the dynamic camber effect on a two-dimensional basis. The
trailing edge (TE) deflection was applied on the wing during the early stage of the wing translation
(0~3 chords length traveling) to actively change the camber. Similar to the studies on the acceleration
plates 27-28
, studying the dynamic TE deflection effect on a starting wing allow us to understand the
basic principle and physics in the active camber of the flapping wings.
Therefore, in this paper, the dynamic TE deflection effect on a translating plate, started from rest, was
studied systematically with different kinematic profile of TE deflection. The objective of this work is to
first determine the relation between the wing deformation and vortical flow by PIV measurements.
Especially, we will focus on the evolution of starting vortex, trailing edge vortex (TEV) and the leading
edge vortex (LEV) as well as their mutual interaction. Then through the corresponding force
measurements, a relation between the averaged aerodynamic force and kinematics will be established,
conclusions on how the active camber could affect the flow and how to apply the active camber on the
flapping wings will be drawn.
II. Experimental setup
The experimental setup, similar to Dickinson et al. 26
, is shown schematically in Fig.1. A rectangular
plexi-glass wing model with a 5cm wing chord and 48cm length was immersed in an oil tank which
filled with mineral oil (Kinematic Viscosity = 20 cSt at 20oC, density=840kg/m
3 ). To minimize the
spanwise flow and free surface effect, one large plexi-glass plate with a slot in the middle was used as
an end wall covering the surface of the mineral oil when the bottom of the tank severed as another end
Dow
nloa
ded
by P
UR
DU
E U
NIV
ER
SIT
Y o
n Ju
ne 9
, 201
4 | h
ttp://
arc.
aiaa
.org
| D
OI:
10.
2514
/6.2
013-
2816

3
American Institute of Aeronautics and Astronautics
wall on the other side of the wing tip. The wing model was installed vertically onto a linear stage using
an aluminum frame with the gaps between the wing tips and end walls were between 2~4 mms. The
wing model had two pieces which were connected by two hinges at the mid-chord. The wing was
bluntly rounded on leading edge and sharply tapered at the trailing edge. A micro digital servo HS-65
(Hitec, Poway, CA), installed in a 3D-printed support, was attached to the leading edge part of the wing
and the trailing edge part wing was driven by the servo through a one bar mechanism (Fig 2(a)). Using
this mechanism, the deflection angle equals to the rotation angle of the servo so that we can directly
control the wing deflection angle. In addition, a six-components force/torque sensor (Nano 17, ATI Ind.
Automation) along with a Q8 Quanser board DATA requisition system were used to measure the force
(sampling rate is 1000 Hz). The sensor was mounted on our wing model with one side connected to the
3D printed support and the other side connected to the aluminum frame.
In this study, a 2-D PIV system (TSI, Inc, Shoreview, MN) was applied on the flow measurement at the
middle section of the wing model while the mineral oil was seeded with air bubbles (average size of
20-50 microns). A 45o slanted front reflective mirror was installed underneath the tank to reflect the
image onto the camera. To ensure the wing is always in the view of the camera, the camera was
installed on a small trolley, moving along with the wing model and driven by the aluminum frame.
Before conducting the experiments, the possible parameters involved in the study were carefully
examined and designed. To simplify the experiments, all the experiments were conducted using one
identical kinematics of the wing translation, driven by the linear stage and the angle of attack is fixed at
45o.
Figure 2 gives a sketch of the wing translation and deflection kinematics. Wing starts translating at t =
0 s, after a 0.4s constant acceleration phase, the wing reaches its final velocity of 0.1 m/s which results
in a Reynolds number of 250. The wing translation lasts for 4 seconds and the total travel distance is
7.6 chords length. Wing deflection angle is designed as a linear function of time and eventually reaches
the same deflection angle of 45o (Initial acceleration of deflection angle is ignored). The wing starts to
Fig.1 A schematic of the experimental setup. The camera sits on a small trolley, translating with the wing model
to ensure the wing is in the view of the camera.
Dow
nloa
ded
by P
UR
DU
E U
NIV
ER
SIT
Y o
n Ju
ne 9
, 201
4 | h
ttp://
arc.
aiaa
.org
| D
OI:
10.
2514
/6.2
013-
2816
4
American Institute of Aeronautics and Astronautics
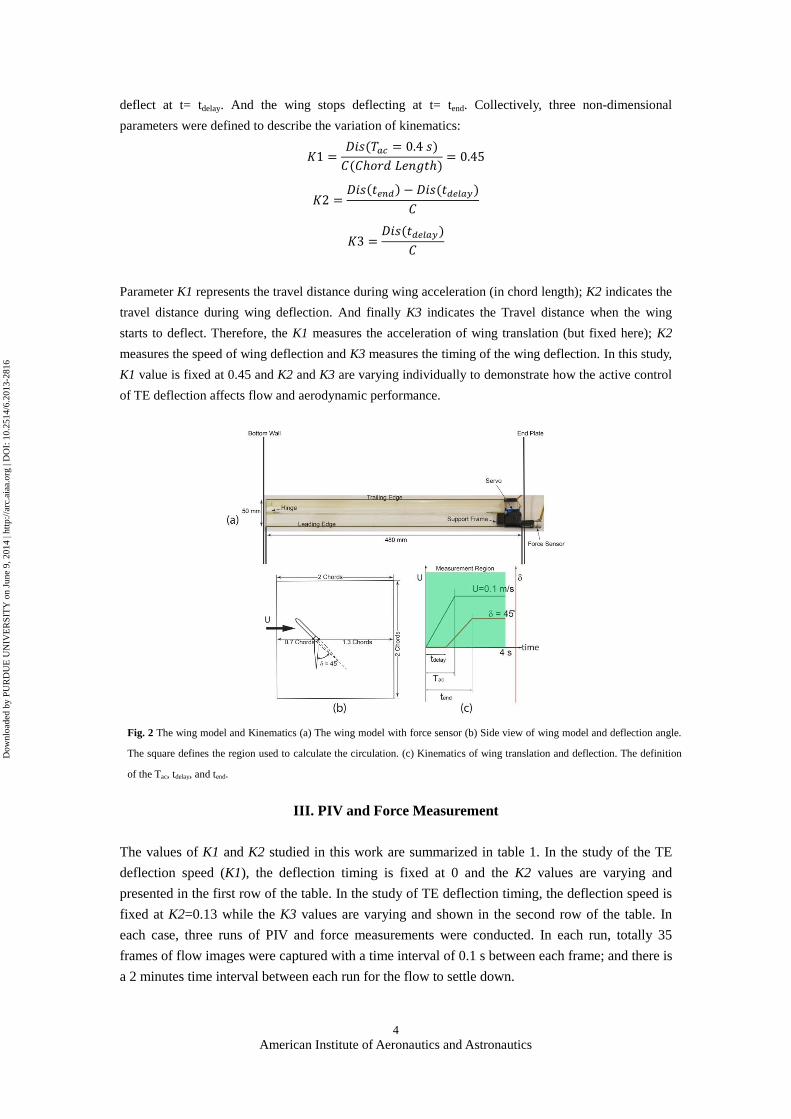
deflect at t= tdelay. And the wing stops deflecting at t= tend. Collectively, three non-dimensional
parameters were defined to describe the variation of kinematics:
𝐾1 =𝐷𝑖𝑠(𝑇𝑎𝑐 = 0.4 𝑠)
𝐶(𝐶ℎ𝑜𝑟𝑑 𝐿𝑒𝑛𝑔𝑡ℎ)= 0.45
𝐾2 =𝐷𝑖𝑠(𝑡𝑒𝑛𝑑) − 𝐷𝑖𝑠(𝑡𝑑𝑒𝑙𝑎𝑦)
𝐶
𝐾3 =𝐷𝑖𝑠(𝑡𝑑𝑒𝑙𝑎𝑦)
𝐶
Parameter K1 represents the travel distance during wing acceleration (in chord length); K2 indicates the
travel distance during wing deflection. And finally K3 indicates the Travel distance when the wing
starts to deflect. Therefore, the K1 measures the acceleration of wing translation (but fixed here); K2
measures the speed of wing deflection and K3 measures the timing of the wing deflection. In this study,
K1 value is fixed at 0.45 and K2 and K3 are varying individually to demonstrate how the active control
of TE deflection affects flow and aerodynamic performance.
III. PIV and Force Measurement
The values of K1 and K2 studied in this work are summarized in table 1. In the study of the TE
deflection speed (K1), the deflection timing is fixed at 0 and the K2 values are varying and
presented in the first row of the table. In the study of TE deflection timing, the deflection speed is
fixed at K2=0.13 while the K3 values are varying and shown in the second row of the table. In
each case, three runs of PIV and force measurements were conducted. In each run, totally 35
frames of flow images were captured with a time interval of 0.1 s between each frame; and there is
a 2 minutes time interval between each run for the flow to settle down.
Fig. 2 The wing model and Kinematics (a) The wing model with force sensor (b) Side view of wing model and deflection angle.
The square defines the region used to calculate the circulation. (c) Kinematics of wing translation and deflection. The definition
of the Tac, tdelay, and tend.
Dow
nloa
ded
by P
UR
DU
E U
NIV
ER
SIT
Y o
n Ju
ne 9
, 201
4 | h
ttp://
arc.
aiaa
.org
| D
OI:
10.
2514
/6.2
013-
2816
5
American Institute of Aeronautics and Astronautics
K2 :
K3=0
0.13 0.47 1.27 1.66 2.06 2.45 2.85
K3 :
K2=0.13
0 0.03 0.13 0.47 0.67 0.87 1.07 1.27 1.66 2.06 2.45 2.85
Table. 1 Values of K2 and K3 in the parameter studies
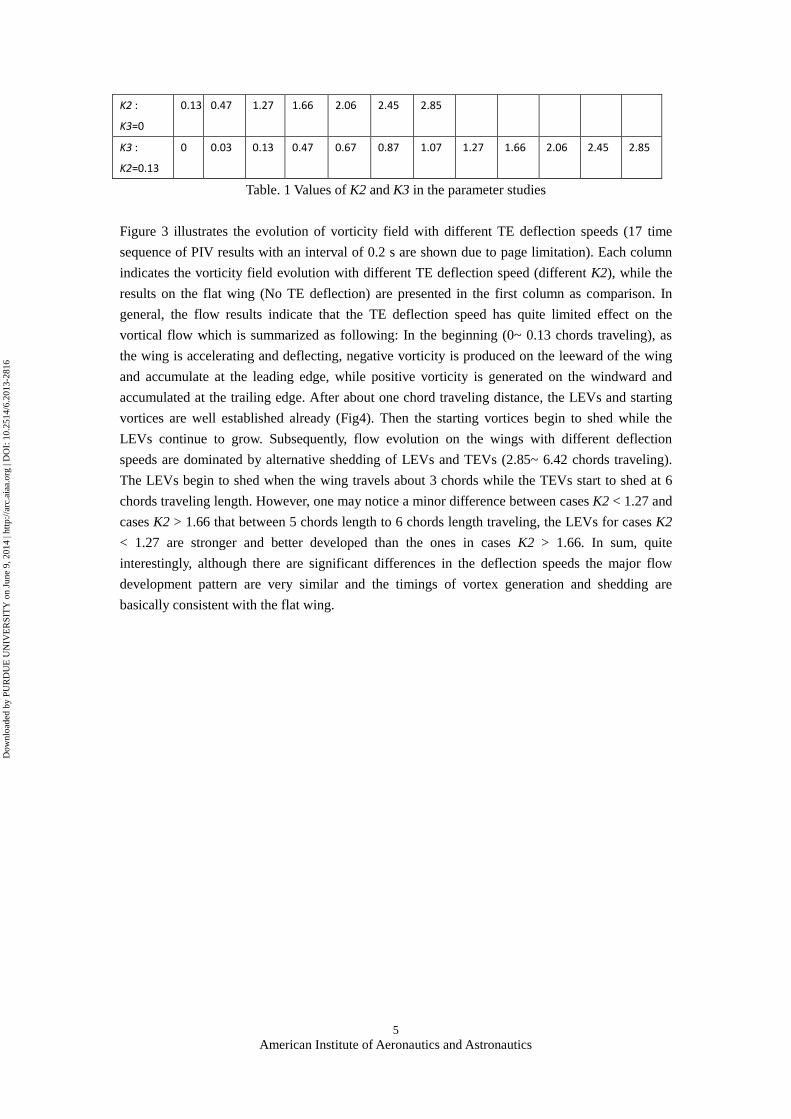
Figure 3 illustrates the evolution of vorticity field with different TE deflection speeds (17 time
sequence of PIV results with an interval of 0.2 s are shown due to page limitation). Each column
indicates the vorticity field evolution with different TE deflection speed (different K2), while the
results on the flat wing (No TE deflection) are presented in the first column as comparison. In
general, the flow results indicate that the TE deflection speed has quite limited effect on the
vortical flow which is summarized as following: In the beginning (0~ 0.13 chords traveling), as
the wing is accelerating and deflecting, negative vorticity is produced on the leeward of the wing
and accumulate at the leading edge, while positive vorticity is generated on the windward and
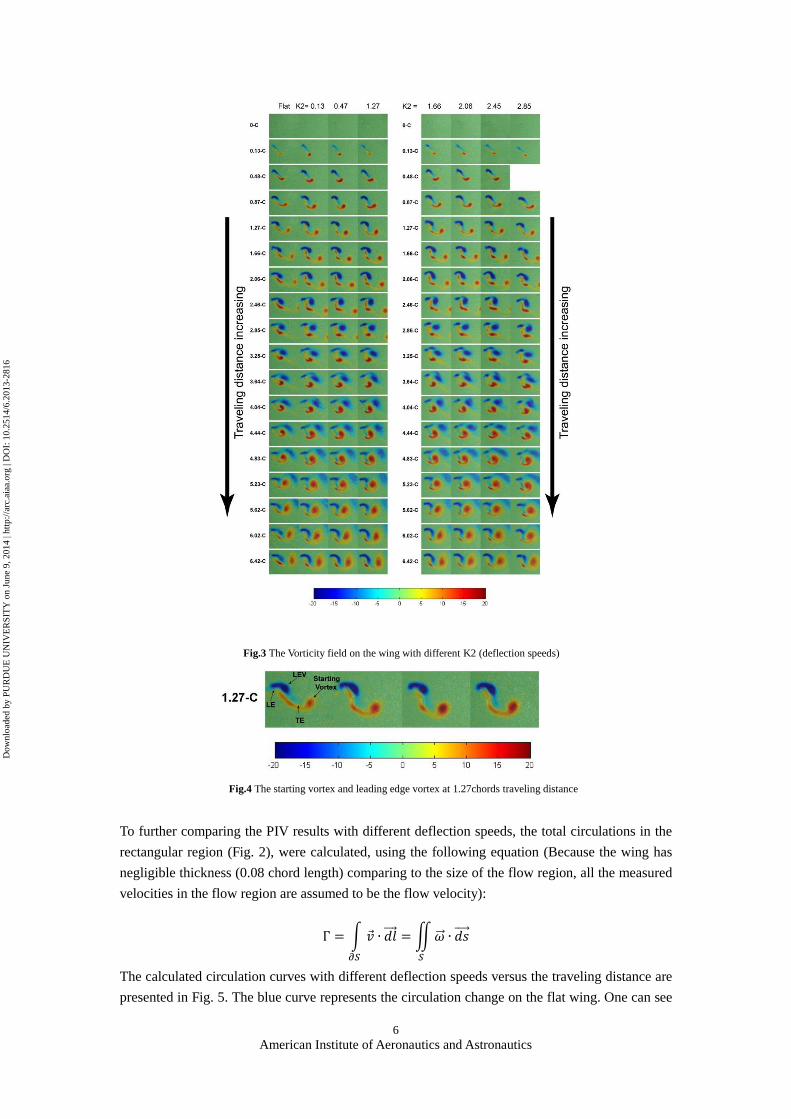
accumulated at the trailing edge. After about one chord traveling distance, the LEVs and starting
vortices are well established already (Fig4). Then the starting vortices begin to shed while the
LEVs continue to grow. Subsequently, flow evolution on the wings with different deflection
speeds are dominated by alternative shedding of LEVs and TEVs (2.85~ 6.42 chords traveling).
The LEVs begin to shed when the wing travels about 3 chords while the TEVs start to shed at 6
chords traveling length. However, one may notice a minor difference between cases K2 < 1.27 and
cases K2 > 1.66 that between 5 chords length to 6 chords length traveling, the LEVs for cases K2
< 1.27 are stronger and better developed than the ones in cases K2 > 1.66. In sum, quite
interestingly, although there are significant differences in the deflection speeds the major flow
development pattern are very similar and the timings of vortex generation and shedding are
basically consistent with the flat wing.
Dow
nloa
ded
by P
UR
DU
E U
NIV
ER
SIT
Y o
n Ju
ne 9
, 201
4 | h
ttp://
arc.
aiaa
.org
| D
OI:
10.
2514
/6.2
013-
2816
6
American Institute of Aeronautics and Astronautics
To further comparing the PIV results with different deflection speeds, the total circulations in the
rectangular region (Fig. 2), were calculated, using the following equation (Because the wing has
negligible thickness (0.08 chord length) comparing to the size of the flow region, all the measured
velocities in the flow region are assumed to be the flow velocity):
Γ = ∫ �⃗�
𝜕𝑆
∙ 𝑑𝑙⃗⃗⃗⃗ = ∬ �⃗⃗⃗�
𝑆
∙ 𝑑𝑠⃗⃗⃗⃗⃗
The calculated circulation curves with different deflection speeds versus the traveling distance are
presented in Fig. 5. The blue curve represents the circulation change on the flat wing. One can see
Fig.3 The Vorticity field on the wing with different K2 (deflection speeds)
Fig.4 The starting vortex and leading edge vortex at 1.27chords traveling distance
Dow
nloa
ded
by P
UR
DU
E U
NIV
ER
SIT
Y o
n Ju
ne 9
, 201
4 | h
ttp://
arc.
aiaa
.org
| D
OI:
10.
2514
/6.2
013-
2816
7
American Institute of Aeronautics and Astronautics
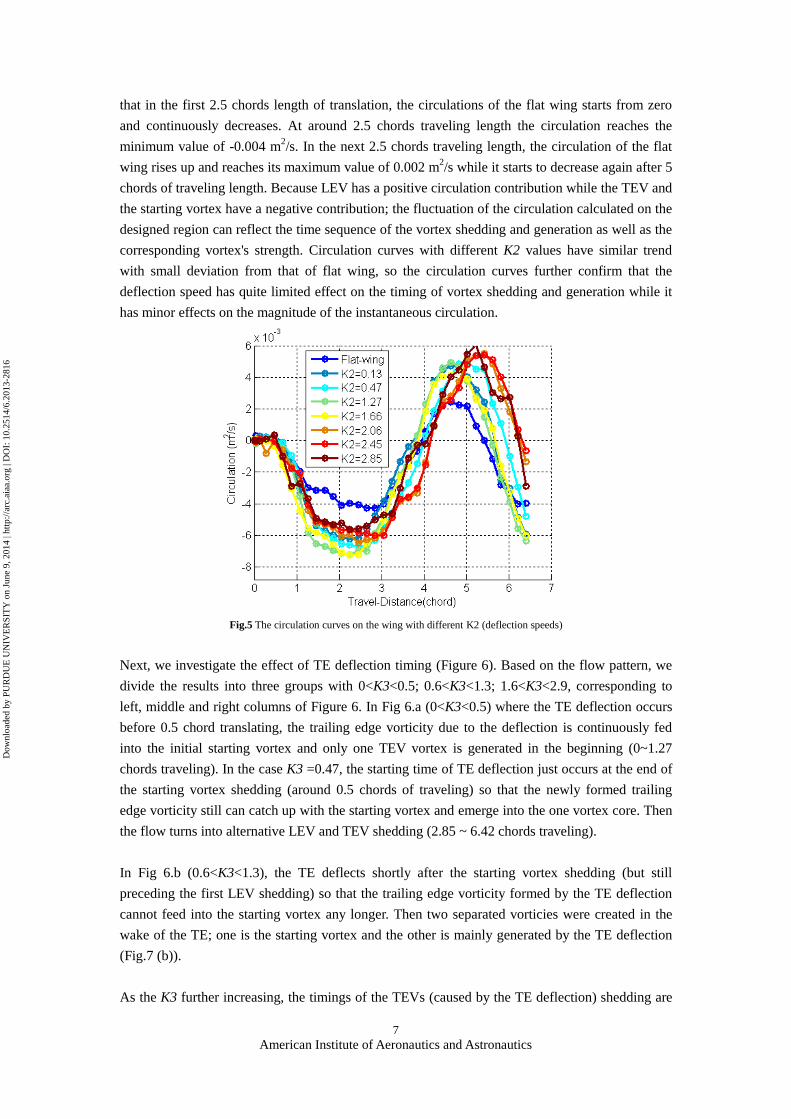
that in the first 2.5 chords length of translation, the circulations of the flat wing starts from zero
and continuously decreases. At around 2.5 chords traveling length the circulation reaches the
minimum value of -0.004 m2/s. In the next 2.5 chords traveling length, the circulation of the flat
wing rises up and reaches its maximum value of 0.002 m2/s while it starts to decrease again after 5
chords of traveling length. Because LEV has a positive circulation contribution while the TEV and
the starting vortex have a negative contribution; the fluctuation of the circulation calculated on the
designed region can reflect the time sequence of the vortex shedding and generation as well as the
corresponding vortex's strength. Circulation curves with different K2 values have similar trend
with small deviation from that of flat wing, so the circulation curves further confirm that the
deflection speed has quite limited effect on the timing of vortex shedding and generation while it
has minor effects on the magnitude of the instantaneous circulation.
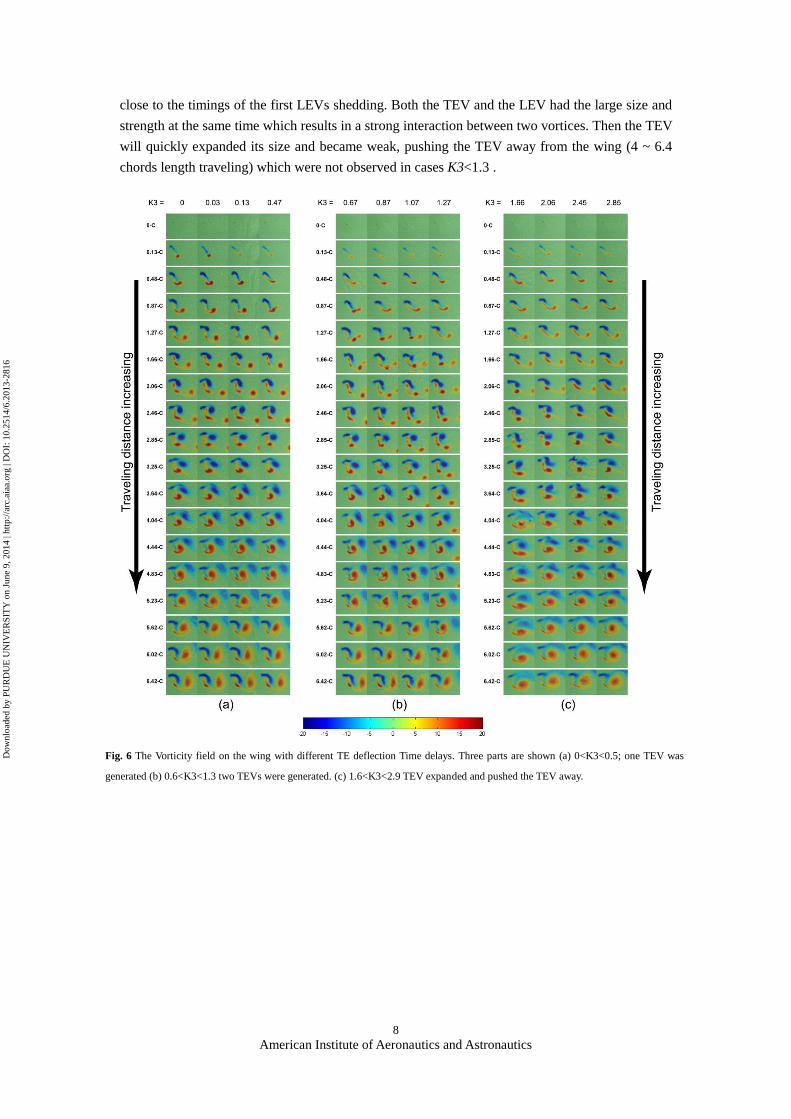
Next, we investigate the effect of TE deflection timing (Figure 6). Based on the flow pattern, we
divide the results into three groups with 0<K3<0.5; 0.6<K3<1.3; 1.6<K3<2.9, corresponding to
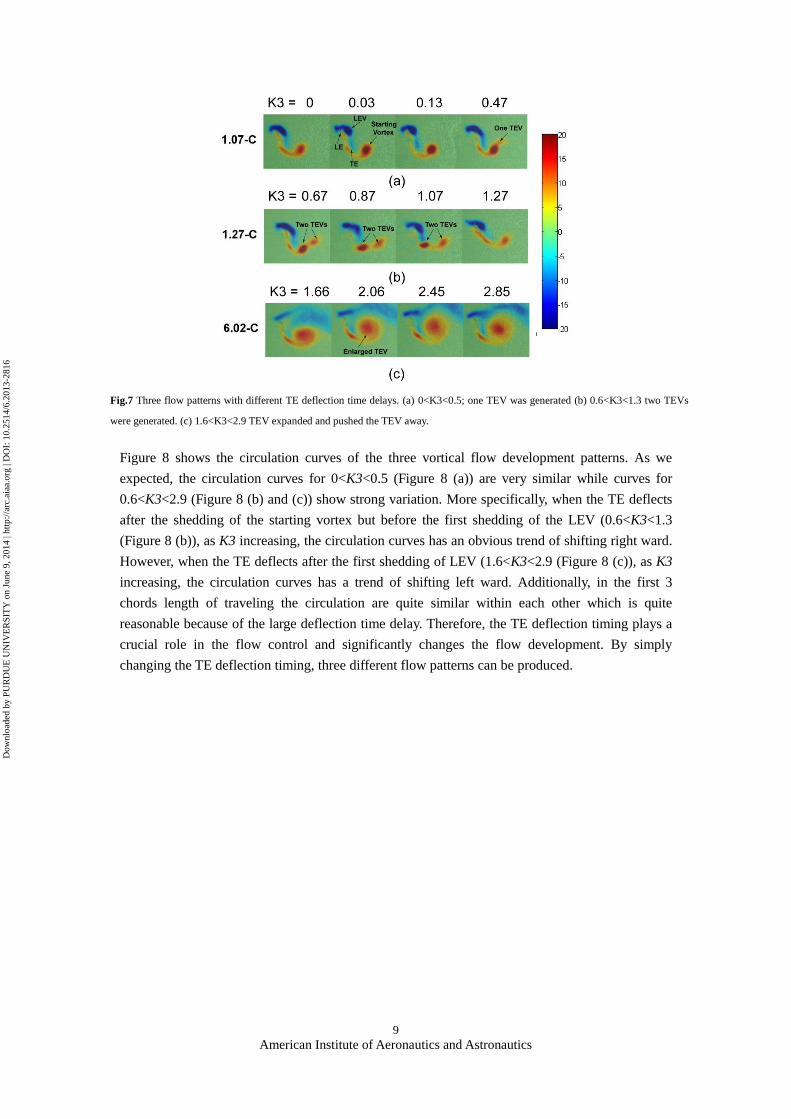
left, middle and right columns of Figure 6. In Fig 6.a (0<K3<0.5) where the TE deflection occurs
before 0.5 chord translating, the trailing edge vorticity due to the deflection is continuously fed
into the initial starting vortex and only one TEV vortex is generated in the beginning (0~1.27
chords traveling). In the case K3 =0.47, the starting time of TE deflection just occurs at the end of
the starting vortex shedding (around 0.5 chords of traveling) so that the newly formed trailing
edge vorticity still can catch up with the starting vortex and emerge into the one vortex core. Then
the flow turns into alternative LEV and TEV shedding (2.85 ~ 6.42 chords traveling).
In Fig 6.b (0.6<K3<1.3), the TE deflects shortly after the starting vortex shedding (but still
preceding the first LEV shedding) so that the trailing edge vorticity formed by the TE deflection
cannot feed into the starting vortex any longer. Then two separated vorticies were created in the
wake of the TE; one is the starting vortex and the other is mainly generated by the TE deflection
(Fig.7 (b)).
As the K3 further increasing, the timings of the TEVs (caused by the TE deflection) shedding are
Fig.5 The circulation curves on the wing with different K2 (deflection speeds)
Dow
nloa
ded
by P
UR
DU
E U
NIV
ER
SIT
Y o
n Ju
ne 9
, 201
4 | h
ttp://
arc.
aiaa
.org
| D
OI:
10.
2514
/6.2
013-
2816
8
American Institute of Aeronautics and Astronautics
close to the timings of the first LEVs shedding. Both the TEV and the LEV had the large size and
strength at the same time which results in a strong interaction between two vortices. Then the TEV
will quickly expanded its size and became weak, pushing the TEV away from the wing (4 ~ 6.4
chords length traveling) which were not observed in cases K3<1.3 .
Fig. 6 The Vorticity field on the wing with different TE deflection Time delays. Three parts are shown (a) 0<K3<0.5; one TEV was
generated (b) 0.6<K3<1.3 two TEVs were generated. (c) 1.6<K3<2.9 TEV expanded and pushed the TEV away.
Dow
nloa
ded
by P
UR
DU
E U
NIV
ER
SIT
Y o
n Ju
ne 9
, 201
4 | h
ttp://
arc.
aiaa
.org
| D
OI:
10.
2514
/6.2
013-
2816
9
American Institute of Aeronautics and Astronautics
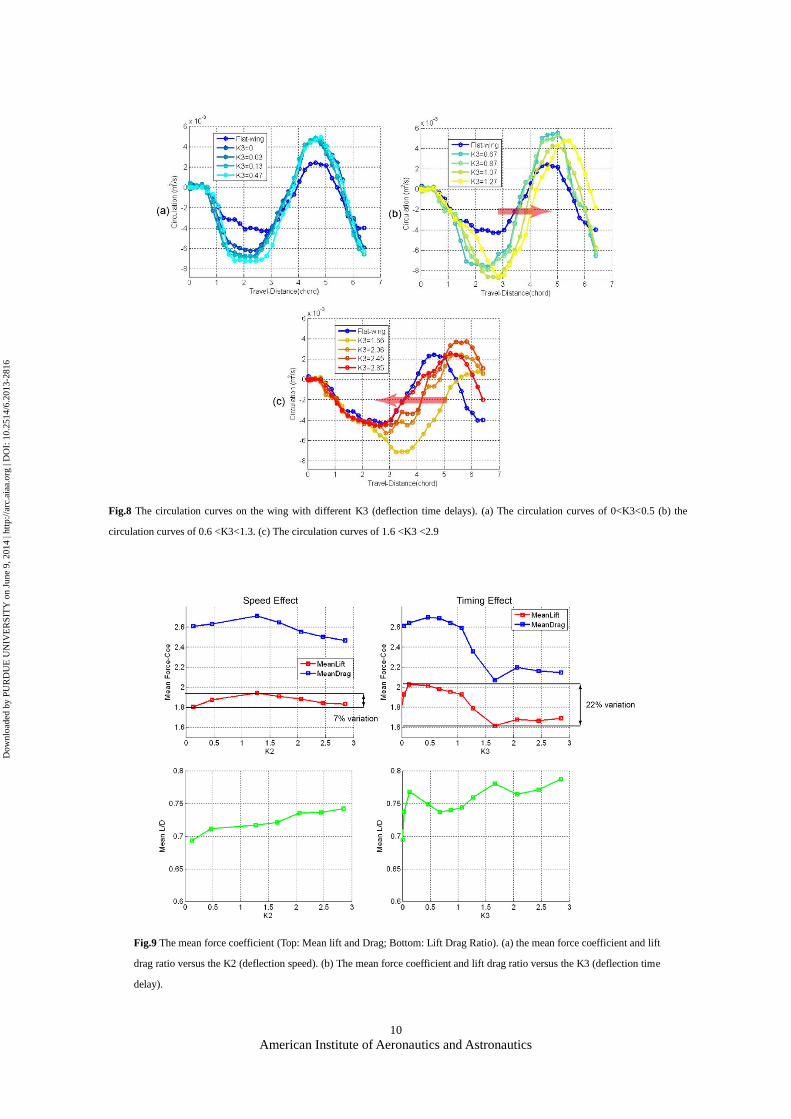
Similarly, the circulations of different TE deflection time delays are calculated and compared.
Figure 8 shows the circulation curves of the three vortical flow development patterns. As we
expected, the circulation curves for 0<K3<0.5 (Figure 8 (a)) are very similar while curves for
0.6<K3<2.9 (Figure 8 (b) and (c)) show strong variation. More specifically, when the TE deflects
after the shedding of the starting vortex but before the first shedding of the LEV (0.6<K3<1.3
(Figure 8 (b)), as K3 increasing, the circulation curves has an obvious trend of shifting right ward.
However, when the TE deflects after the first shedding of LEV (1.6<K3<2.9 (Figure 8 (c)), as K3
increasing, the circulation curves has a trend of shifting left ward. Additionally, in the first 3
chords length of traveling the circulation are quite similar within each other which is quite
reasonable because of the large deflection time delay. Therefore, the TE deflection timing plays a
crucial role in the flow control and significantly changes the flow development. By simply
changing the TE deflection timing, three different flow patterns can be produced.
Fig.7 Three flow patterns with different TE deflection time delays. (a) 0<K3<0.5; one TEV was generated (b) 0.6<K3<1.3 two TEVs
were generated. (c) 1.6<K3<2.9 TEV expanded and pushed the TEV away.
Dow
nloa
ded
by P
UR
DU
E U
NIV
ER
SIT
Y o
n Ju
ne 9
, 201
4 | h
ttp://
arc.
aiaa
.org
| D
OI:
10.
2514
/6.2
013-
2816
10
American Institute of Aeronautics and Astronautics
Fig.8 The circulation curves on the wing with different K3 (deflection time delays). (a) The circulation curves of 0<K3<0.5 (b) the
circulation curves of 0.6 <K3<1.3. (c) The circulation curves of 1.6 <K3 <2.9
Fig.9 The mean force coefficient (Top: Mean lift and Drag; Bottom: Lift Drag Ratio). (a) the mean force coefficient and lift
drag ratio versus the K2 (deflection speed). (b) The mean force coefficient and lift drag ratio versus the K3 (deflection time
delay).
Dow
nloa
ded
by P
UR
DU
E U
NIV
ER
SIT
Y o
n Ju
ne 9
, 201
4 | h
ttp://
arc.
aiaa
.org
| D
OI:
10.
2514
/6.2
013-
2816
11
American Institute of Aeronautics and Astronautics
In addition, the average lift and drag coefficient as well as the lift drag ratio are calculated and
presented here in Figure 9. Figure 9 (a) and (b) give the average force coefficient plots (top) and
lift drag ratio plots (bottom) versus K2 and K3 accordingly. In the study of speed effect (K2
varying; Fig 9 (a)), average lift and drag have the same developing trend. The lift and drag
increase when 0< K2 <1.27 and decrease when 1.27< K2 <2.85.At K2 =1.27 both the lift and
drag coefficient reach their maximum of 1.9 and 2.7 accordingly.
In Figure 9 (b), the study of timing effect, average lift and drag coefficient also have quite similar
development. In general, the lift and drag increase when 0< K3 <0.47and decrease when 1.27<
K3 <1.66. In the range of 2.06< K3 <2.85, the lift and drag only have minor variations. At K3
=1.66 both the lift and drag reach their minimum of 1.6 and 2.1. However, the average lift reaches
the maximum of 2.0 at K3 =0.13 (TE deflects before the SV shedding) and the average drag
reaches the maximum of 2.7 at K3=0.47 (when the TE deflection catches the SV shedding).
Additionally, the lift drag ratio plots, in both speed and timing studies, increase continuously in a
general manner. Finally, the lift drag ratio reach the maximum of 0.74 in speed study and 0.79 in
timing study when K2=2.85.
In the meantime, one can clearly see the dramatic force change in deflection timing study while
mild change in the deflection speed study. More specifically, by changing the deflection timing,
the lift changes as large as 22% but only 7% lift variation is found on changing the deflection
speed (on a basis of 1.8). Therefore, it can be concluded that the TE deflection speed has less
effect on mean force compared to the TE deflection timing and this difference provides us a
potential of using the deflection timing to improve the aerodynamic performance.
IV. Uncertainty and Error Analysis
The uncertainty of the flow measurement and force measurement are discussed here. Considering
the stiffness of the aluminum frame and the large toque exerted on the aluminum frame during the
wing acceleration. A significant relative motion between the camera and the wing model was
observed. As a result, the measured flow velocity does not equal to the flow velocity in the
translating coordinate frame which is fixed on the wing and has a constant velocity deviation.
However, the vorticity field derived from the measured flow velocity data does equal to the real
vorticity field since the constant velocity deviation is rule out when applying the space derivation
on the constant velocity (showed in following equation). Therefore, the uncertainty of the vorticity
field entirely depends on the uncertainty of the 2D PIV measurement and is not affected by the
relative motion between camera and wing model. And the estimated uncertainty of vorticity is
about 1.2 /s.
𝑈𝑟𝑒𝑎𝑙 = 𝑈𝑚𝑒𝑎𝑠𝑢𝑟𝑒 + 𝑐𝑜𝑛𝑠𝑡𝑎𝑛𝑡
𝜔𝑟𝑒𝑎𝑙 = ∇ × 𝑈𝑟𝑒𝑎𝑙 = ∇ × (𝑈𝑚𝑒𝑎𝑠𝑢𝑟𝑒 + 𝑐𝑜𝑛𝑠𝑡𝑎𝑛𝑡) = ∇ × 𝑈𝑚𝑒𝑎𝑠𝑢𝑟𝑒
In the force measurement, the force transducer Nano 17 with SI-12-0.12 calibration was used in
the experiments to provide a high resolution of 1/320 N while magnitude of measured force is
Dow
nloa
ded
by P
UR
DU
E U
NIV
ER
SIT
Y o
n Ju
ne 9
, 201
4 | h
ttp://
arc.
aiaa
.org
| D
OI:
10.
2514
/6.2
013-
2816
12
American Institute of Aeronautics and Astronautics
about 0.3 N. The inertia force caused by the acceleration of the wing was estimated and subtracted
from the measured force while the inertia force caused by the wing deflection is ignored (quite
small less than 4 % of the measured aerodynamics force). Hence considering all those factors, an
uncertainty of 0.01 N can be reached in the force measurement. Moreover, one should realize the
fact that it is impossible to setup a force measurement on an ideal 2D wing in reality and the force
results we get here are actually the resultant forces on a large aspect ratio wing 29
. Thus, to get the
aerodynamics force on an ideal 2D case, further CFD simulations are needed.
V. Conclusion and Discussion
The dynamic trailing edge deflections were applied on a high AoA translating wing which started
from rest under a fixed kinematics. The effect of TE deflection speed and timing on the flow
pattern and force were studied to determine how to apply the TE deflection control in the future
flapping-wing robots in order to improve their aerodynamic performance.
According to the results of PIV, the TE deflection speed has limited effect on the flow
development, as the deflection speed varying between K2 = 0.13 to 2.85, the flow pattern of
vortex shedding and generation are quite similar within each case in despite of some minor
differences. However, the flow developments under different TE deflection timings show
significant differences. Specifically, three basic flow patterns were found: 1) When the TE
deflection occurs before the shedding of the starting vortex (K3< 0.47), the trailing edge vorticity
continuously feed into the starting vortex and form a single TEV;2) When the TE deflection
occurs between the shedding of starting vortex and first shedding of LEV then another trailing
vortex is generated, following the initial starting vortex;3) when the TE deflection occurs close to
or after the first shedding of LEV then a major interaction between the LEV and TEV occurs and
the flow pattern is significantly different from the first two flow patterns.
On the other hand, the measured mean force coefficients indicate that the TE deflection speed has
a less effect on the mean force than that of the TE deflection timing. By changing the deflection
timing, 22% lift variation can be obtained while there is only 7% lift variation for changing the
deflection speed. Notably, when the deflection occurs around the timing of starting vortex
shedding (around K3=0.5) the lift and drag is maximized.
As a result, to apply the active trailing edge control, our results suggest that one may carefully
design the timing of the trailing edge deflection. The timing of deflection should approach that of
starting vortex shedding but avoid the LEV shedding timing to gain large lift.
Dow
nloa
ded
by P
UR
DU
E U
NIV
ER
SIT
Y o
n Ju
ne 9
, 201
4 | h
ttp://
arc.
aiaa
.org
| D
OI:
10.
2514
/6.2
013-
2816
13
American Institute of Aeronautics and Astronautics
Reference
1 Perry M.L, Mueller T.J., "Leading- and Trailing- edge flaps on a low Reynolds Number Airfoil". Journal of Aircraft Vol.24
No.9,1987
2 Drost K.J, Johnson H, Apte S.V, Liburdy J.A,"Low Reynolds Number Flow Dynamics of a Thin Airfoil with an Actuated
Leading edge". 41st AIAA Fluid Dynamics conference and Exhibit Honolulu Hawaii 27-30 June 2011.
3 Stefan Vey, Oliver C.Paschereit, David Greenblatt, Robert Meyer, " Flap Vortex Management by Active Gurney Flaps". 46Th
AIAA Aerospace Science Meeting and Exhibit Reno Nevada 7-10 Jan 2008
4 Stremel P.M, "Calculation of Unsteady Airfoil Loads with and without Flap Deflection at -90 Degree incidence". AIAA-9133-cp
5Onur Bilgen, Kevin B. Kochersberger, Daniel J. Inman,"Novel, Bi-Directional, Variable Camber Airfoil via Macro-Fiber
Composite Actuators". 50th AIAA/ ASMW/ASCE/AHS /ASC Structure,.Structural Dynamics and Materials conference. 2009
6 Onur Bilgen, Michael I. Friswell,"Surface Actuated Variable-Camber and Variable-Twist Morphing Wings Using
Piezocomposites".52ndAIAA/ ASMW/ASCE/AHS /ASC Structure,.Structural Dynamics and Materials conference. 4-7 April 2011
Denver Colorado
7 Arvind Santhanakrishnan, Nan J. Pern, Jamey D. Jacob "Optimization and Validation of a Variable Camber Airfoil". 46th AIAA/
ASMW/ASCE/AHS /ASC Structure,.Structural Dynamics and Materials conference 2005.
8 Vishesh Gupta, Corey Ippolito "Use of Discretization Approach in Autonomous Control of an Active Extrados/Intrados Camber
Morphing Wing". Infotech @ Aerospace 2012 19-21 June 2012
9 Jacobs E.N, Sherman. A "Airfoil section Characteristics as Affected by Variations in the Reynolds Number". NACA Technical
Report 586,1937
10 S.Mittal, P.Saxena "Prediction of Hysteresis Associated with the Static Stall of an Airfoil" AIAA Journal Vol 38 No.5
11 Dalton, S. The Miracle of Flight. London, Sampson Low. 1977
12 Brackenbury, J. H. Insects in Flight. London, Cassel. 1995
13 Ennos, A. R. "The importance of torsion in the design of insect wings." J Exp Biol 140: 137-160. 1987
14 Wootton, R. J. "Support and Deformability in Insect Wings." Journal of Zoology 193(Apr): 447-468.1981
15 Bomphrey, R. J., Taylor, G. K., Thomas, A. L. R. "Smoke visualization of free-flying bumblebees indicates independent
leading-edge vortices on each wing pair." Exp. Fluids. 46, 811-821
16 Birch, J. M. and M. H. Dickinson “Spanwise flow and the attachment of the leading-edge vortex on insect wings. ”
Nature. 412 (6848): 729-733
17 Birch, J.M and M.H. Dickinson. “The influence of wing-wake interactions on the production of aerodynamic forces in
flapping flight.” J. Exp. Biol. 206(13): 2257-2272
18 C. Poelma; W.B. Dickson; M.H. Dickinson “Time-resolved reconstruction of the full velocity field around a
dynamically-scaled flapping wing” Exp.Fluids. 41(2):213-225
19 Y Liu, B Cheng, X Deng “An application of smoke-wire visualization on a hovering insect wing” Journal of Visualization
2013 (April)
20 David L, Jardin T, Braud P, Farcy A “Time-resolved scanning tomorgraphy PIV measurements around a flapping wing.” Exp.
Fluids 52:857-864
21 Ellington, C.P. “The aerodynamics of normal hovering flight: three approaches. In Comparative Physiology - Water, Ions and
Fluid Mechanics”. ed. K. Schmidt-Nielsen, L. Bolis and S.H.P. Maddrell. pp. 327-345. Cambridge University Press
22 Ellington C.P. “The Aerodynamics of Hovering Insect Flight. V. A Vortex Theory.” Phil. Trans. R. Soc. Lond. B. 305(1122),
115-144
23 Ellington, C.P., van den Berg, C., Willmott, A.P. and Thomas, A.L.R. “Leading-edge vortices in insect flight.” Nature 384,
626-630
24 K.B.Lua, T.T. Lim, K.S.Yeo “Aerodynamics forces and flow fields of a two-dimensional hovering wing.” Exp Fluids 45
Dow
nloa
ded
by P
UR
DU
E U
NIV
ER
SIT
Y o
n Ju
ne 9
, 201
4 | h
ttp://
arc.
aiaa
.org
| D
OI:
10.
2514
/6.2
013-
2816

14
American Institute of Aeronautics and Astronautics
1047-1065
25 K.B.Lua, T.T. Lim, K.S. Yeo “Effect of wing-wake interaction on aerodynamic force generation on a 2D flapping wing.” Exp
Fluids 51 177-195
26 M.H Dickinson, K.G Gotz “Unsteady aerodynamics performance of model wings at low Reynolds Numbers.” J. Exp. Biol
174 56-64
27 K. Chen, T. Colonius, and K. Taira “The leading-edge vortex and quasi-steady vortex shedding on an accelerated plate”
Physics of Fluids, 22(3). Art. No. 033601, 2010.
28 Y.Elimelech, D.Kolomenskiy, S.B. Dalziel, H.K. Moffatt “volution of leading edge vortex over an accelerating rotating wing”
Procedia IUTAM 7 233-242
29 K. Taira and T. Colonius “Three-Dimensional Flows around Low-Aspect-Ratio Flat-Plate Wings at Low Reynolds Numbers.”
Journal of Fluid Mechanics,623:187-207, 2009.
Dow
nloa
ded
by P
UR
DU
E U
NIV
ER
SIT
Y o
n Ju
ne 9
, 201
4 | h
ttp://
arc.
aiaa
.org
| D
OI:
10.
2514
/6.2
013-
2816