Embed Size (px)
Citation preview
AN EXPERIMENTAL STUDY OF HULL GIRDER LOADS ON AN INTACT AND DAMAGED NAVAL SHIP
E.Begovic1, A.H. Day2, A. Incecik2
1 - Department of Industrial Engineering, University of Naples Federico II, Via Claudio 21,
Naples, Italy,
Tel. +39 081768 3708, fax + 39 081 239 0380, [email protected]
2 - Department of Naval Architecture Ocean and Marine Engineering, University of Strathclyde,
Glasgow, UK
ABSTRACT: This work is focused on experimental investigation of the hull girder loads on an
intact and damaged naval ship DTMB 5415 at zero speed. The experimental campaign was carried
out in head and beam regular waves at the University of Strathclyde. The effect of the use of
moorings in the model experimental setup was investigated in the context of loads assessment, and
the moorings are shown to influence the measured hull girder loads at some wave frequency
compared to the free drift case. Therefore the tests in beam seas are performed with free drifting
model while the moored model setup was adopted for head seas. The results for ship motions are
compared with those from a previous campaign giving an insight into repeatability and uncertainty
of measurements. The roll decay of the ship in both intact and damaged conditions is analysed and
the linear and quadratic extinction coefficients for the model and the ship scale are reported and
detailed discussion on intact-versus-damaged ship roll damping behaviour is given. The results for
the hull girder loads are presented for intact and damaged ship. An investigation of the nonlinear
effects due to wave height variation in the range wave height to wave length from 1/50 to 1/22 on
shear force and bending moment was carried out for a range of wave lengths to ship length ratios
from 0.8 to 1.4. The results of the extensive campaign are compared against similar experimental
studies forming a benchmark for validation of numerical methods.
Keywords: 5415 DTMB model, wave loads on intact and damaged ship; nonlinear responses;
experimental shear force and bending moments assessment, roll decay, equivalent linear roll
extinction coefficient
NOMENCLATURE
A – wave amplitude, m
BOA – beam over all, m
BWL – beam at waterline, m
CB – block coefficient
CM – midship section coefficient
CP – prismatic coefficient
D – depth, m
g – acceleration of gravity, 9.80665 m/s2
GM – transversal metacentric height, m
H – wave height, m
HBM - horizontal bending moment, Nm
HSF - horizontal shear force, N
H/λW – ratio between wave height and wave length
k – wave number, 2π/λW
KG – vertical position of the centre of gravity, from BL, m
KM – vertical position of the metacentre, from BL, m
kXX – radius of gyration with respect to x axis, m, ∆
= XXXX
Ik
kYY – radius of gyration with respect to y axis, m, ∆
= YYYY
Ik
kZZ – radius of gyration with respect to z axis, m, ∆
= ZZZZ
Ik
LCG – longitudinal position of the centre of gravity from transom, m
LOA – length over all, m
LPP – length between perpendiculars, m
T – draught, m
Tφ – natural roll period, s
TW – incident wave period, s
TM – torsional moment, Nm
V – displacement volume, m3
VBM - vertical bending moment, Nm
VSF – vertical shear force, N
Δ – displacement, kg, tons for ship scale
φ – roll angle, rad
η3/A non-dimensional heave response
η4/kA non-dimensional roll response
η5/kA non-dimensional pitch response
ηi measured motion, i=3, 4, 5 corresponds to heave, roll and pitch respectively
λ – ship model scale factor
λW – wave length, m
λw/LOA – wave length to ship length ratio
ρ – water density, kg/m3
ωE(LPP/g)0.5 – non-dimensional encounter wave frequency
ω – wave frequency, rad/s
ωE – encounter wave frequency, rad/s
ωφ0 – roll natural circular frequency, rad/s
ωφ – roll damped circular frequency, rad/s 220 eqαωω φφ −=
α – linear extinction coefficient, 1/s, ϕ
αI
B2
1=
αeq – equivalent linear extinction coefficient, γφωβφωπ
αα φφ22
83
342 aaeq ++=
β – quadratic extinction coefficient, 1/rad, ϕ
βIB2=
γ – cubic extinction coefficient, 1/rad2, ϕ
γIB3=
φMEAN – mean roll angle, rad, 2
1++= ii
MEANφφ
φ
1. INTRODUCTION
The determination of the hydrodynamic loads and the evaluation of structural response are key
elements in a sound design procedure for ships and offshore structures. A growing interest in
accurate prediction of hydrodynamic loads was highlighted by Hirdaris et al. (2014) who reported
that approximately 47% of papers published in the period from 2008-2012 in international peer-
reviewed journals are dedicated to research and development activities related to the computation of
wave-induced loads, followed by specialist ship structure topics (slamming, sloshing, etc.), fatigue
loads and uncertainties in wave load modelling and validation. Although wave load prediction can
be implemented at a wide range of levels of complexity, starting from simple potential strip theory
up to fully nonlinear methods (e.g. RANS CFD simulations), the authors pointed out that the
numerous partly nonlinear or blended methods require verification against experimental data.
Furthermore they highlighted the necessity for quality benchmark data, particularly for
measurements of global hull girder loads from model tests.
A variety of experimental results (Fonseca and Guedes Soares, 2002) have demonstrated that the
wave induced vertical bending moment (VBM) shows nonlinear behaviour for ships with small
block coefficients, such as container ships, naval ships such as frigates and destroyers, and some
passenger ships. The nonlinearities of vertical bending moment relate to three different aspects: the
asymmetry of the peaks in the time series, variation of the transfer function with the wave
amplitude, and higher order harmonics of the time signals.
Among the first studies dealing with experimental data on the vertical responses of ship models in
regular and irregular waves with an emphasis on the nonlinear effects are Watanabe et al. (1989)
and O’Dea et al. (1992). Both authors tested the S-175 ITTC benchmark container ship, reporting
for the first time second order harmonics of VBM and systematic variation of the first harmonic and
phase angle with the wave steepness.
Fonseca and Guedes Soares (2002) presented a partly-nonlinear time domain method, accounting
for nonlinear hydrostatic restoring and calculating Froude-Krilov forces on the instantaneous wetted
surface of the ship. The numerical method was verified with the experimental results of Watanabe
and O’Dea, showing that the method is able to capture the nonlinearities in vertical motions,
accelerations and vertical bending moment. Important experimental studies on the assessment of
vertical loads acting on the ITTC S-175 container ship in regular and irregular waves were
presented by Fonseca and Guedes Soares (2004 a, b). Tests in regular waves were performed over a
range of non-dimensional wave frequencies, with waves varying from λ/LPP =0.5 up to 3. For each
wave frequency several wave amplitudes were used ranging from small to large amplitude and thus
the influence of the wave amplitude on the nonlinear characteristics of the responses was assessed.
The measured responses include the absolute and relative motions, vertical accelerations, and cross-
sectional loads at midship and 1/4 LPP from the forward perpendicular. Irregular wave tests were
carried out for three sea states; the reported probability distributions of the positive and negative
peaks of motions and loads, indicated that the Rayleigh distribution cannot be used for wave-
induced vertical loads.
Song et al (2011) presented a weakly nonlinear 3D time domain Rankine panel method validation
on a 6500 TEU container ship segmented model in small and large wave amplitudes over a wide
range of wave frequencies. Results were presented as first-order response amplitude operators
(RAOs) and time histories; second order harmonics were not reported. The authors reported that the
nonlinear effects were observed for the three highest waves (wave heights of 5, 7 and 10 m in ship
scale). They concluded that the developed weakly-nonlinear method provides very good overall
agreement with experimental data, with better agreement for vertical than for horizontal and
torsional loads for moderate wave heights, and acceptable to poor agreement at the steepest wave.
Kukkanen et al (2014) presented a nonlinear time domain calculation method based on Green’s
functions for prediction of RoPax hull girder loads. Model test results of ship motions, vertical
shear forces and bending moments at two sections at zero speed and Fr = 0.25 were given for calm
water, regular and irregular head waves. The results were presented for the first order RAO and
phases for motions and loads. The presented numerical method is in good agreement with the
reported experimental data, although authors do not comment on the ability of the numerical
method to predict the effect of wave height variation.
Zhu and Moan (2013, 2014) presented extensive model tests on ultra-large containerships of 8600-
TEU and 13000-TEU conducted in head seas in regular and irregular waves with focus on the
nonlinear vertical responses in severe seas. The authors reported that in irregular waves, the motion
peaks and troughs generally agree with a Rayleigh distribution and that the asymmetries between
positive and negative peaks are limited and less pronounced than expected from existing empirical
formulas or state of the art tools.
It should be noted that the majority of works on structural responses have addressed intact ship
loads; however in the last decade some works on loads in damaged conditions have been presented.
Korkut et al. (2004) presented experimental results for motions of an intact and damaged RoRo ship
in regular waves at zero speed. The effects of wave amplitude variation in head, beam and
quartering seas were investigated. In Korkut et al. (2005) experimental results for the global loads
on an intact and damaged Ro-Ro ship model in regular waves are presented. The very extensive
experimental campaign comprises nine frequencies in head, beam and stern quartering seas varied
over four wave heights. The conclusions highlight the main experimental findings illustrating the
effect of damage on the loads; in general the structural response of the damaged model are greater
than those for the intact ship for most of the headings with the exception of the horizontal bending
moments in beam seas. The results also show the variation of the load responses with the wave
amplitude depending on the wave frequency.
Lee et al. (2012) developed a computational tool based on a two-dimensional linear method for the
prediction of hydrodynamic loads of damaged ships. The results of the theoretical method and an
experimental campaign on a 1/100 scale model of the well-known DTMB 5415 frigate hull tests
were compared over a variety of design conditions. The comparison demonstrated fair prediction of
vertical and horizontal bending moments and poor accuracy for torsional moment prediction.
Begovic et al. (2011) presented results obtained from an experimental test program at the
University of Strathclyde in which the ship model used was the same as in the study reported in Lee
et al. (2012). In addition to the model tests, the motion RAOs for the intact and damaged ship
model were compared with calculations using MARINTEK’s ShipX - 2D time domain software®
code, showing fairly good agreement for global load predictions. In Begovic et al. (2013), the
motion response characteristics of the DTMB Model 5415 in intact and damaged conditions in
head, beam and quartering seas at zero speed were presented based on measurements made with a
1:51 scale model. Experimental results were presented as the first and second harmonics of the
RAOs of heave, roll and pitch. A detailed discussion on intact-versus-damaged ship behaviour is
given, taking into considerations influence of the flow interaction between the ship, the
environment and the orientation of the opening. Furthermore the effect of model scale is discussed
according to the results of two test campaigns performed at different scales. Domeh et al. (2015)
presented an experimental study on segmented Leander class frigate model in waves at zero and
forward speed. The novelty of the experimental campaign was systematic permeability and damage
orifice size variations influence on vertical motions of damaged hull. In Parunov et al. (2015) the
case study for the determination of vertical motions and hull girder bending moments of damaged
5415 ship, presented by Lee (2012) is presented. Authors compared results from commonly used
the added mass method and the lost buoyancy method against the experimental results, reporting
that the lost buoyancy method underestimates while the added mass overestimates the experimental
vertical bending moments in the whole frequency range.
The present study was focused on the measurement of hull girder loads on a segmented model of
the naval benchmark hull DTMB 5415 at zero speed in intact and damaged conditions with
particular emphasis on nonlinear effects due to the wave height variation. The experimental
campaign, performed at the University of Strathclyde, consists of motions and loads in head sea for
the constant H/λW ratio = 1/50. An investigation of the nonlinear effects due to wave height
variation on shear force and bending moment is carried out for a range of wave lengths to ship
length ratios λW/LOA from 0.8 to 1.4 for the intact and damaged ship. The tests in beam seas have
been performed both for a soft-moored and a free drifting model, to examine the influence of elastic
mooring on loads. The experimental results of heave, roll and pitch motions are presented together
with the results of previous campaign to highlight the repeatability and uncertainty of measured
RAOs. The results for the hull girder loads are presented as non-dimensional vertical shear force,
hogging and sagging moments for intact and damaged ship. Furthermore the roll decay tests have
been carried out by varying the initial heel angle from 5 degrees to 25 degrees. Detailed discussion
on intact-versus-damaged ship roll damping behaviour is given based on the analysis of roll decay.
2. EXPERIMENTAL PROGRAM
2.1. Description of the facility and equipment
The experiments have been carried out in the Kelvin Hydrodynamic Laboratory at the University of
Strathclyde, Glasgow using a 1/51 scale model of the DTMB naval ship 5415. The towing tank is
76 metres long, 4.6 metres wide and has a water depth 2.15 metres; it is equipped with a multi-flap
type absorbing wave maker.
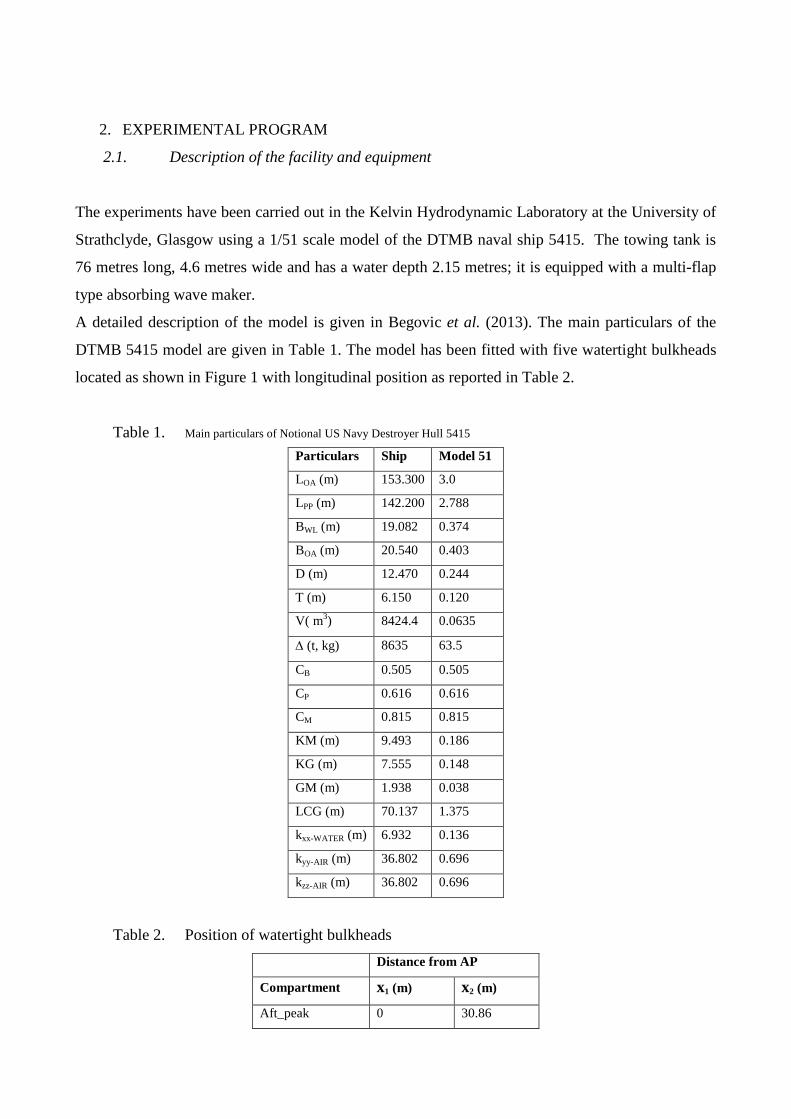
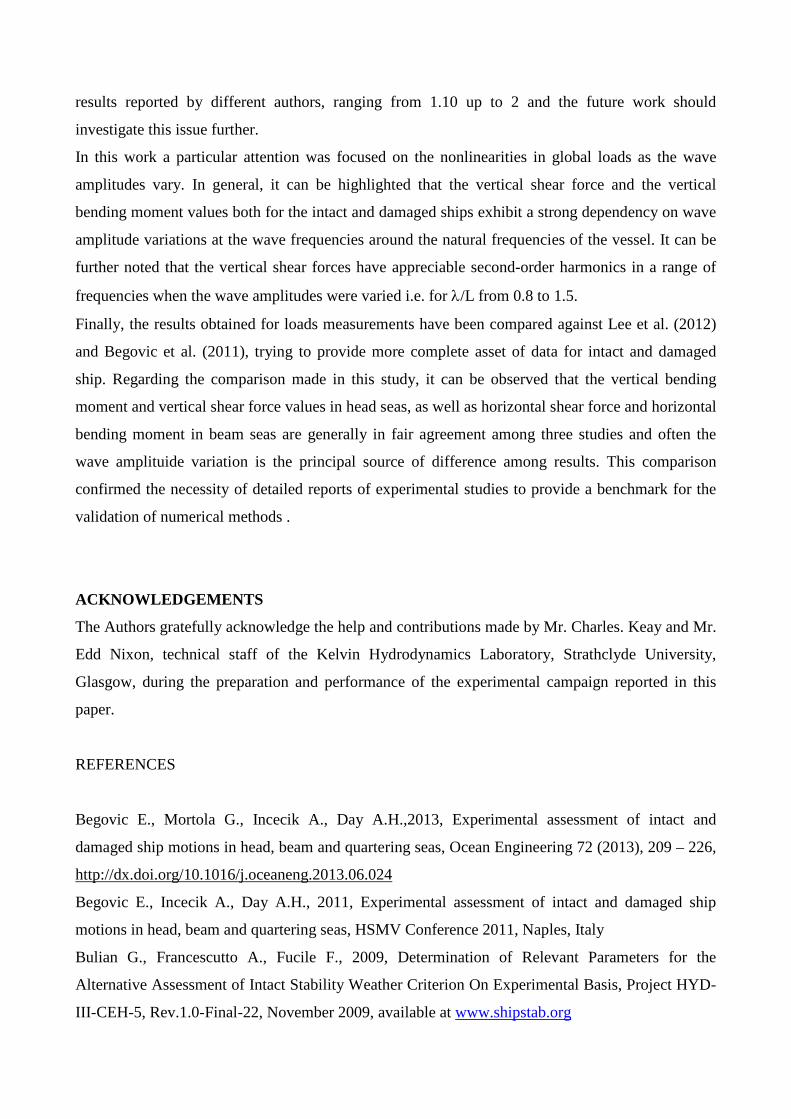
A detailed description of the model is given in Begovic et al. (2013). The main particulars of the
DTMB 5415 model are given in Table 1. The model has been fitted with five watertight bulkheads
located as shown in Figure 1 with longitudinal position as reported in Table 2.
Table 1. Main particulars of Notional US Navy Destroyer Hull 5415
Particulars Ship Model 51
LOA (m) 153.300 3.0
LPP (m) 142.200 2.788
BWL (m) 19.082 0.374
BOA (m) 20.540 0.403
D (m) 12.470 0.244
T (m) 6.150 0.120
V( m3) 8424.4 0.0635
∆ (t, kg) 8635 63.5
CB 0.505 0.505
CP 0.616 0.616
CM 0.815 0.815
KM (m) 9.493 0.186
KG (m) 7.555 0.148
GM (m) 1.938 0.038
LCG (m) 70.137 1.375
kxx-WATER (m) 6.932 0.136
kyy-AIR (m) 36.802 0.696
kzz-AIR (m) 36.802 0.696
Table 2. Position of watertight bulkheads
Distance from AP
Compartment x1 (m) x2 (m)
Aft_peak 0 30.86
Comp_2 30.86 65.66
Comp_3 65.66 76.15
Comp_4 76.15 90.02
Comp_5 90.02 108.63
Comp_6 108.63 130.56
Forward_Peak 130.56 142.20
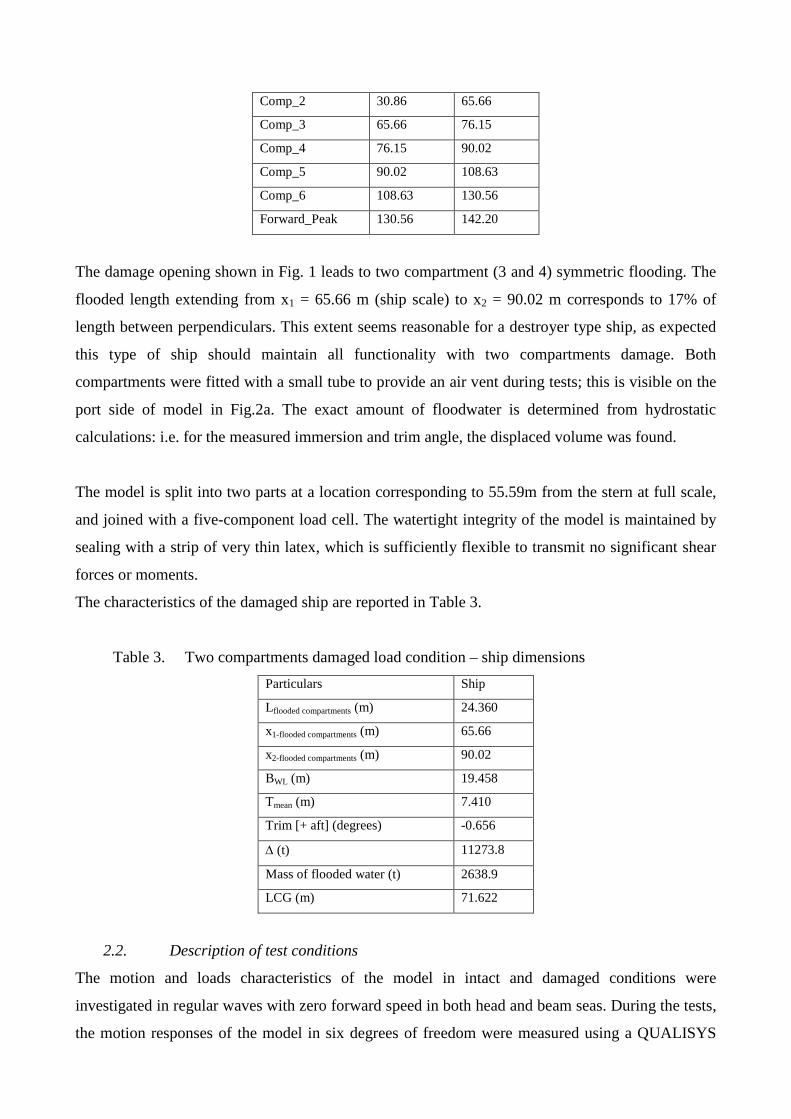
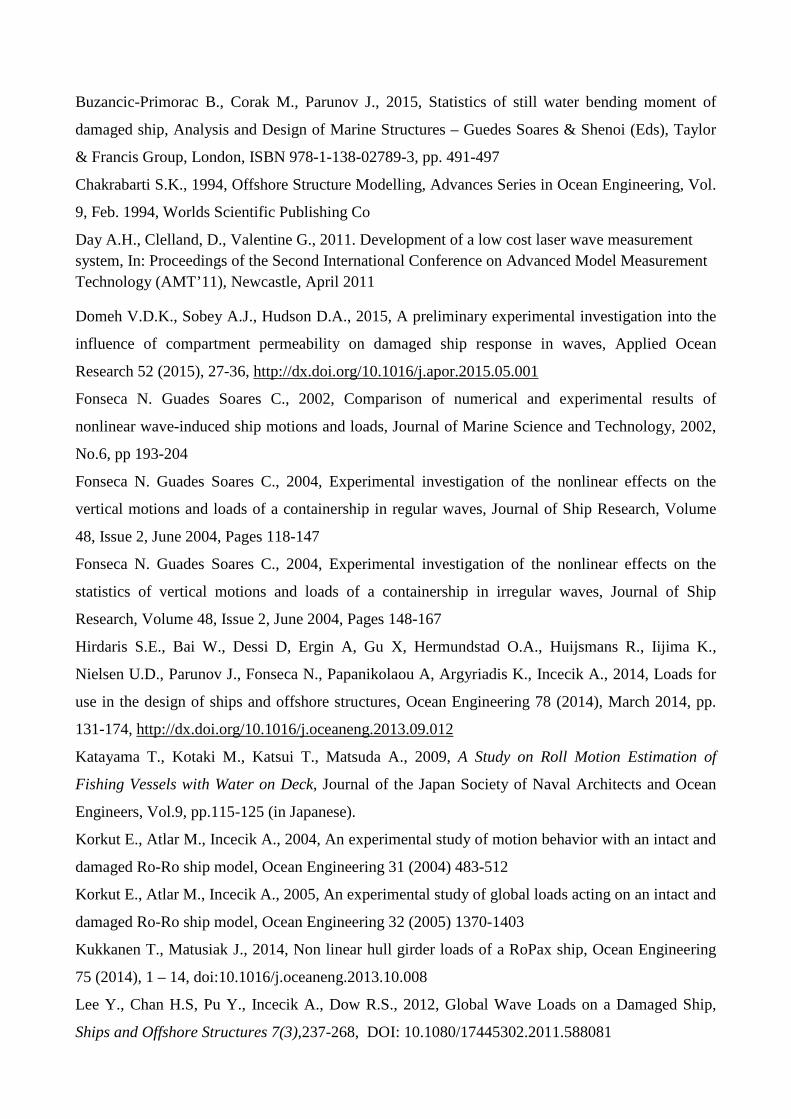
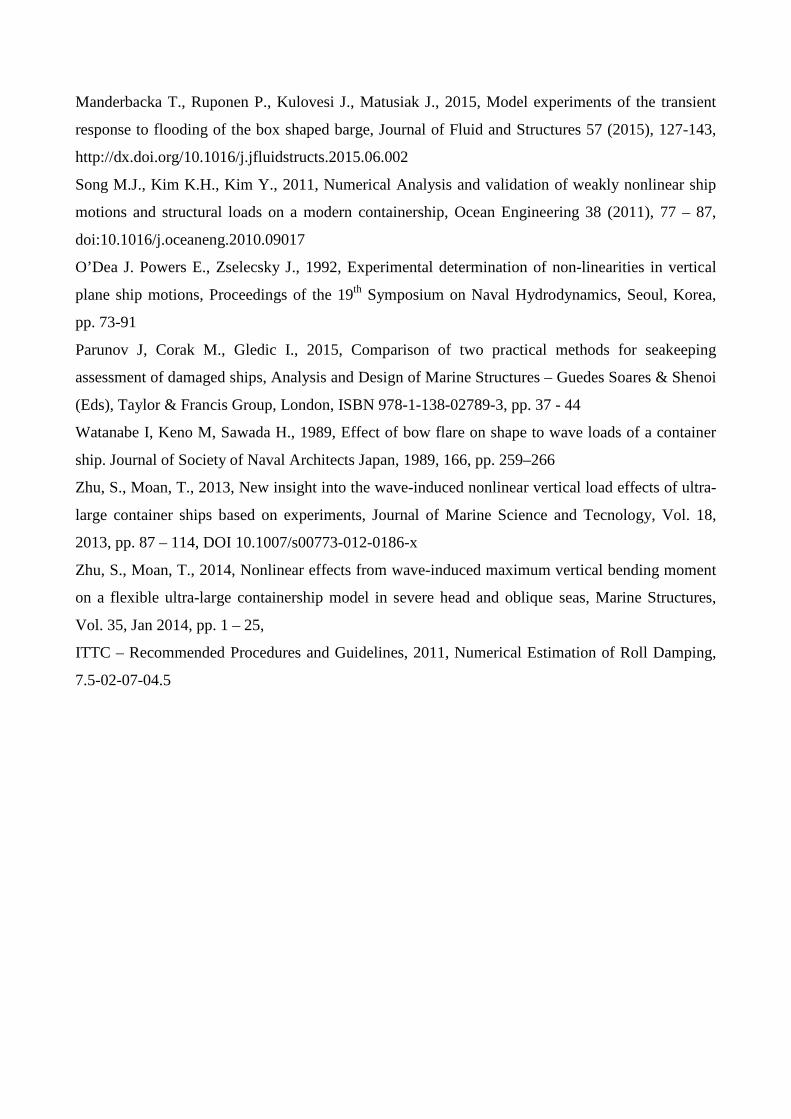
The damage opening shown in Fig. 1 leads to two compartment (3 and 4) symmetric flooding. The
flooded length extending from x1 = 65.66 m (ship scale) to x2 = 90.02 m corresponds to 17% of
length between perpendiculars. This extent seems reasonable for a destroyer type ship, as expected
this type of ship should maintain all functionality with two compartments damage. Both
compartments were fitted with a small tube to provide an air vent during tests; this is visible on the
port side of model in Fig.2a. The exact amount of floodwater is determined from hydrostatic
calculations: i.e. for the measured immersion and trim angle, the displaced volume was found.
The model is split into two parts at a location corresponding to 55.59m from the stern at full scale,
and joined with a five-component load cell. The watertight integrity of the model is maintained by
sealing with a strip of very thin latex, which is sufficiently flexible to transmit no significant shear
forces or moments.
The characteristics of the damaged ship are reported in Table 3.
Table 3. Two compartments damaged load condition – ship dimensions Particulars Ship
Lflooded compartments (m) 24.360
x1-flooded compartments (m) 65.66
x2-flooded compartments (m) 90.02
BWL (m) 19.458
Tmean (m) 7.410
Trim [+ aft] (degrees) -0.656
∆ (t) 11273.8
Mass of flooded water (t) 2638.9
LCG (m) 71.622
2.2. Description of test conditions
The motion and loads characteristics of the model in intact and damaged conditions were
investigated in regular waves with zero forward speed in both head and beam seas. During the tests,
the motion responses of the model in six degrees of freedom were measured using a QUALISYS
motion capture system. Five infra-red reflectors were strategically placed on the vessel as shown in
Fig.3. The coordinates of the markers in three dimensional space were measured by four cameras
suitably positioned on the towing carriage near the vessel; the six-degree-of-freedom motions are
calculated and output in real time. The wave elevation was monitored and recorded using two
ultrasonic wave probes, one close to the model and another one close to wavemaker. Loads were
measured by load cell DHI model 206/5C 130. The sampling frequency was 137.36 Hz.
2.3. ROLL DECAY DATA
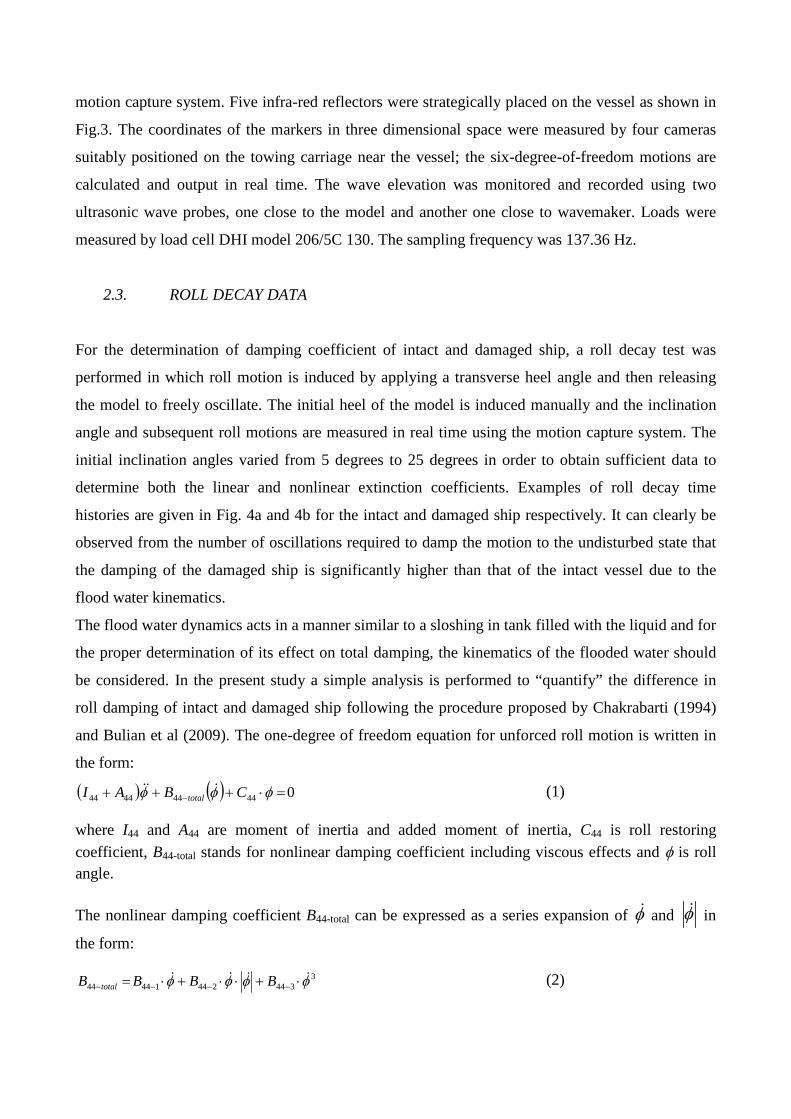
For the determination of damping coefficient of intact and damaged ship, a roll decay test was
performed in which roll motion is induced by applying a transverse heel angle and then releasing
the model to freely oscillate. The initial heel of the model is induced manually and the inclination
angle and subsequent roll motions are measured in real time using the motion capture system. The
initial inclination angles varied from 5 degrees to 25 degrees in order to obtain sufficient data to
determine both the linear and nonlinear extinction coefficients. Examples of roll decay time
histories are given in Fig. 4a and 4b for the intact and damaged ship respectively. It can clearly be
observed from the number of oscillations required to damp the motion to the undisturbed state that
the damping of the damaged ship is significantly higher than that of the intact vessel due to the
flood water kinematics.
The flood water dynamics acts in a manner similar to a sloshing in tank filled with the liquid and for
the proper determination of its effect on total damping, the kinematics of the flooded water should
be considered. In the present study a simple analysis is performed to “quantify” the difference in
roll damping of intact and damaged ship following the procedure proposed by Chakrabarti (1994)
and Bulian et al (2009). The one-degree of freedom equation for unforced roll motion is written in
the form:
( ) ( ) 044444444 =⋅+++ − φφφ CBAI total (1)
where I44 and A44 are moment of inertia and added moment of inertia, C44 is roll restoring coefficient, B44-total stands for nonlinear damping coefficient including viscous effects and φ is roll angle.
The nonlinear damping coefficient B44-total can be expressed as a series expansion of φ and φ in
the form:
334424414444 φφφφ ⋅+⋅⋅+⋅= −−−− BBBB total (2)
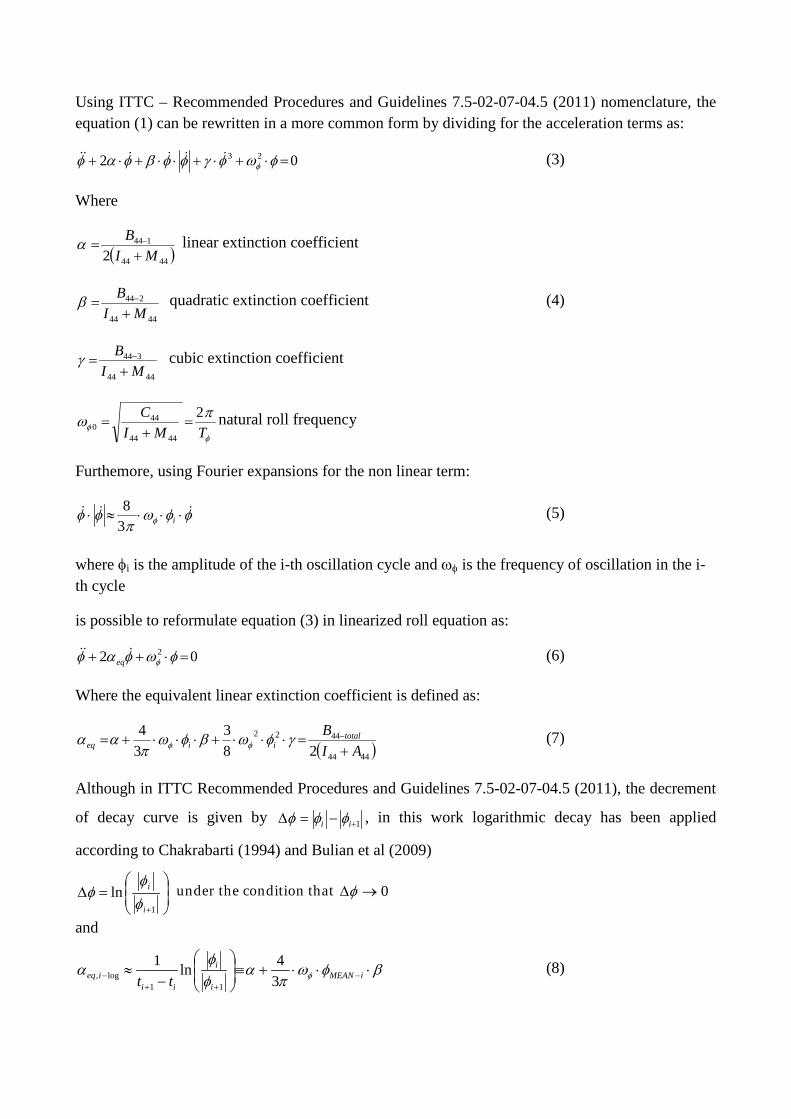
Using ITTC – Recommended Procedures and Guidelines 7.5-02-07-04.5 (2011) nomenclature, the equation (1) can be rewritten in a more common form by dividing for the acceleration terms as:
02 23 =⋅+⋅+⋅⋅+⋅+ φωφγφφβφαφ φ (3)
Where
( )4444
144
2 MIB
+= −α linear extinction coefficient
4444
244
MIB+
= −β quadratic extinction coefficient (4)
4444
344
MIB+
= −γ cubic extinction coefficient
φφ
πωTMI
C 24444
440 =
+= natural roll frequency
Furthemore, using Fourier expansions for the non linear term:
φφωπ
φφ φ ⋅⋅⋅≈⋅ i3
8 (5)
where φi is the amplitude of the i-th oscillation cycle and ωφ is the frequency of oscillation in the i-th cycle
is possible to reformulate equation (3) in linearized roll equation as:
02 2 =⋅++ φωφαφ φ
eq (6)
Where the equivalent linear extinction coefficient is defined as:
( )4444
4422
283
34
AIB total
iieq +=⋅⋅⋅+⋅⋅⋅+= −γφωβφω
παα φφ (7)
Although in ITTC Recommended Procedures and Guidelines 7.5-02-07-04.5 (2011), the decrement
of decay curve is given by 1+−=∆ ii φφφ , in this work logarithmic decay has been applied
according to Chakrabarti (1994) and Bulian et al (2009)
=∆
+1
lni
i
φφ
φ under the condition that 0→∆φ
and
βφωπ
αφφ
α φ ⋅⋅⋅+≡
−≈ −
++− iMEAN
i
i
iiieq tt 3
4ln111
log, (8)
Where φMEAN is defined by:
21++
= iiMEAN
φφφ (9)
And natural roll frequency:
220 eqαωω φφ +=
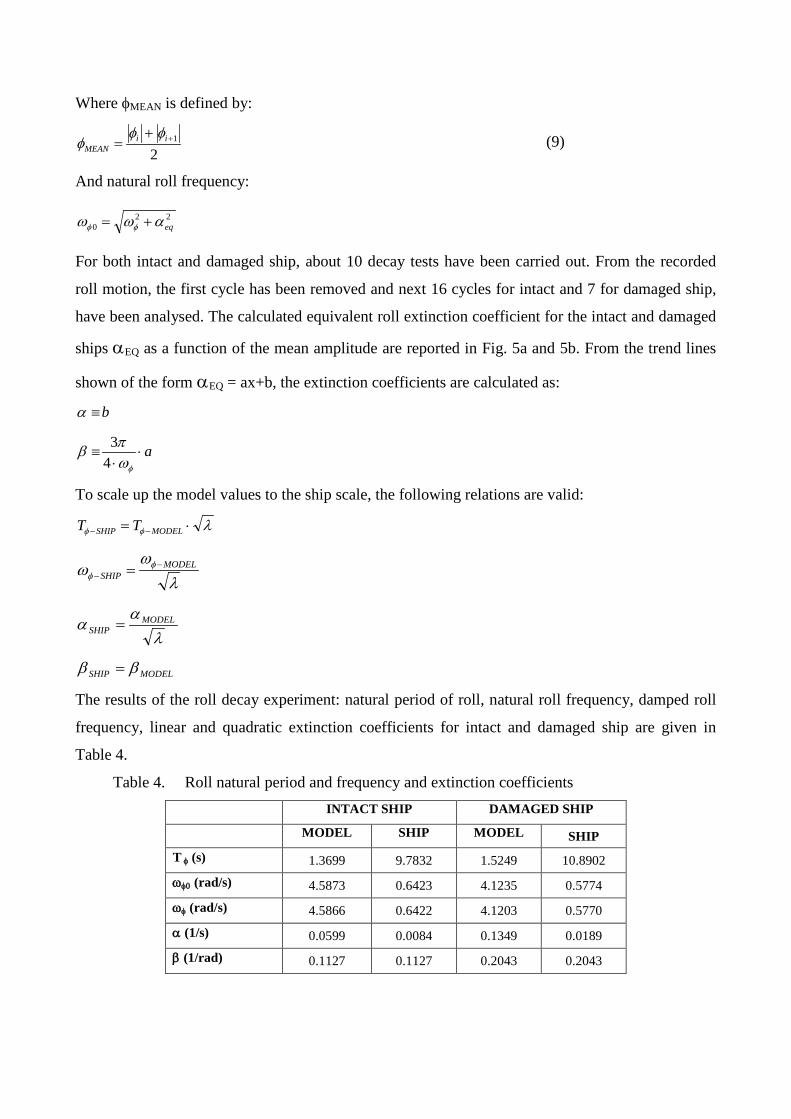
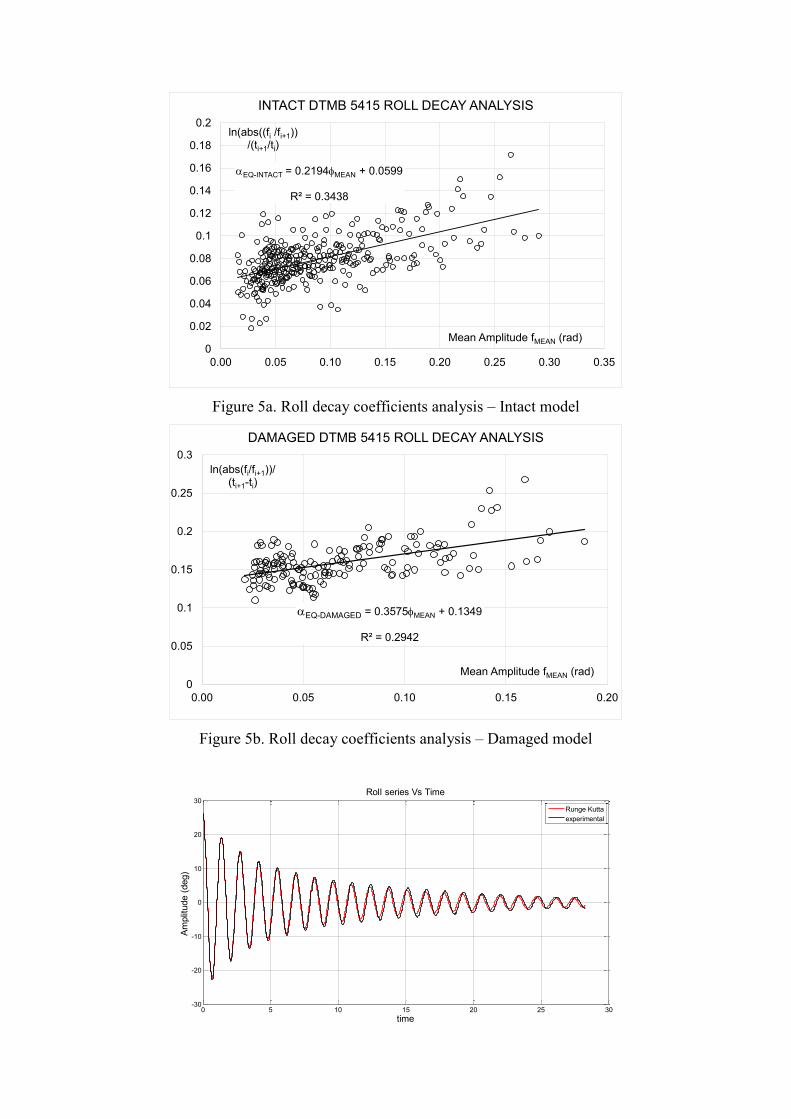
For both intact and damaged ship, about 10 decay tests have been carried out. From the recorded
roll motion, the first cycle has been removed and next 16 cycles for intact and 7 for damaged ship,
have been analysed. The calculated equivalent roll extinction coefficient for the intact and damaged
ships αEQ as a function of the mean amplitude are reported in Fig. 5a and 5b. From the trend lines
shown of the form αEQ = ax+b, the extinction coefficients are calculated as:
b≡α
a⋅⋅
≡φω
πβ43
To scale up the model values to the ship scale, the following relations are valid:
λφφ ⋅= −− MODELSHIP TT
λω
ω φφ
MODELSHIP
−− =
λα
α MODELSHIP =
MODELSHIP ββ =
The results of the roll decay experiment: natural period of roll, natural roll frequency, damped roll
frequency, linear and quadratic extinction coefficients for intact and damaged ship are given in
Table 4.
Table 4. Roll natural period and frequency and extinction coefficients INTACT SHIP DAMAGED SHIP
MODEL SHIP MODEL SHIP T φ (s) 1.3699 9.7832 1.5249 10.8902
ωφ0 (rad/s) 4.5873 0.6423 4.1235 0.5774
ωφ (rad/s) 4.5866 0.6422 4.1203 0.5770
α (1/s) 0.0599 0.0084 0.1349 0.0189
β (1/rad) 0.1127 0.1127 0.2043 0.2043
Table 4 shows that the damaged ship exhibits higher roll natural period as well as much higher
linear and quadratic extinction coefficients α and β. As stated before, this difference is mainly due
to the flood water dynamics inside and outside the compartment, generating some waves and some
vortices. It can be noted that both extinction coefficients have doubled. Similar results on the roll
damping behaviour have been reported by Manderbacka et al (2015) who studied experimentally
coupling of the flooded water and ship motions for the box shaped barge model. Authors reported
that the evaluated damping ratio is three to six times higher than for the intact ship depending on the
compartment geometry and amount of flooded water. It has to be highlighted that this comparison
should not be considered in quantitative way, but only as the trend of data; the fair quantitative
comparison of damping characteristics is impossible due to differences in experimental setup (in
Manderbacka the focus was on sloshing inside and the compartment was closed once filled with
water) and in the presentation of the results (damping ratio versus extinction coefficients).
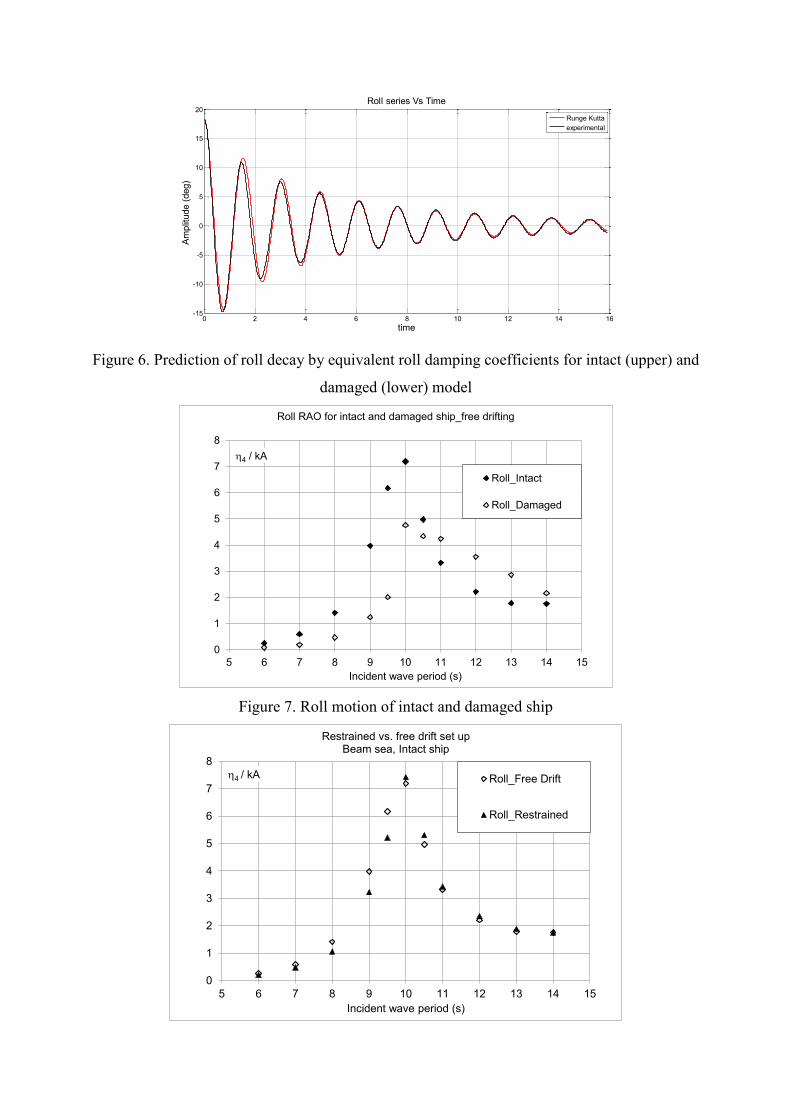
In order to examine how well this simplified damping model reflects the behaviour, the time
histories of the roll decay were reconstructed using the values obtained above via a Runge-Kutta
simulation for both intact and damaged cases, for decay cases with an initial angle of approximately
20 degrees. These results are shown in Fig. 6. It can be seen that although the damping model is not
perfect, the extinction coefficients, reported in Table 4, predict the global trend well and can be
used in more complicated simulations of damaged ship behaviour.
To illustrate how the flooding affects the roll motion responses, the results for the roll motion of the
intact and damaged ship are shown in Figure 7. It can be seen that the roll of the damaged ship is
clearly lower at frequencies less than the resonance frequency. At resonance the intact ship has a
value of roll RAO of 7.2 against a corresponding value for the damaged ship of 4.76. At waves with
periods higher than 11seconds, the damaged ship has higher response.
2.4. Restrained vs. free drift test setup
In the stationary tests models were moored to the tank walls as shown in Figure 3. Soft elastic
restraints were placed as close to the waterplane as possible and were always very slack. The
measured natural frequency of the restraint, evaluated from free oscillations tests in surge, was
found to be 0.03 Hz, which is an order of magnitude less than any wave frequency considered, as
recommended by ITTC (Recommended Procedures and Guidelines 7.5-02 07–03.1).
In the previous experimental campaign (Begovic et al. 2013) it was found that the restraint system
did not significantly influence the motion response and thus all tests were performed with a soft-
restrained model. In the present test campaign, the effect of the restraint system on the shear force
and bending moment was explored by performing the tests in both restrained and free drifting
conditions in beam seas for the intact ship.
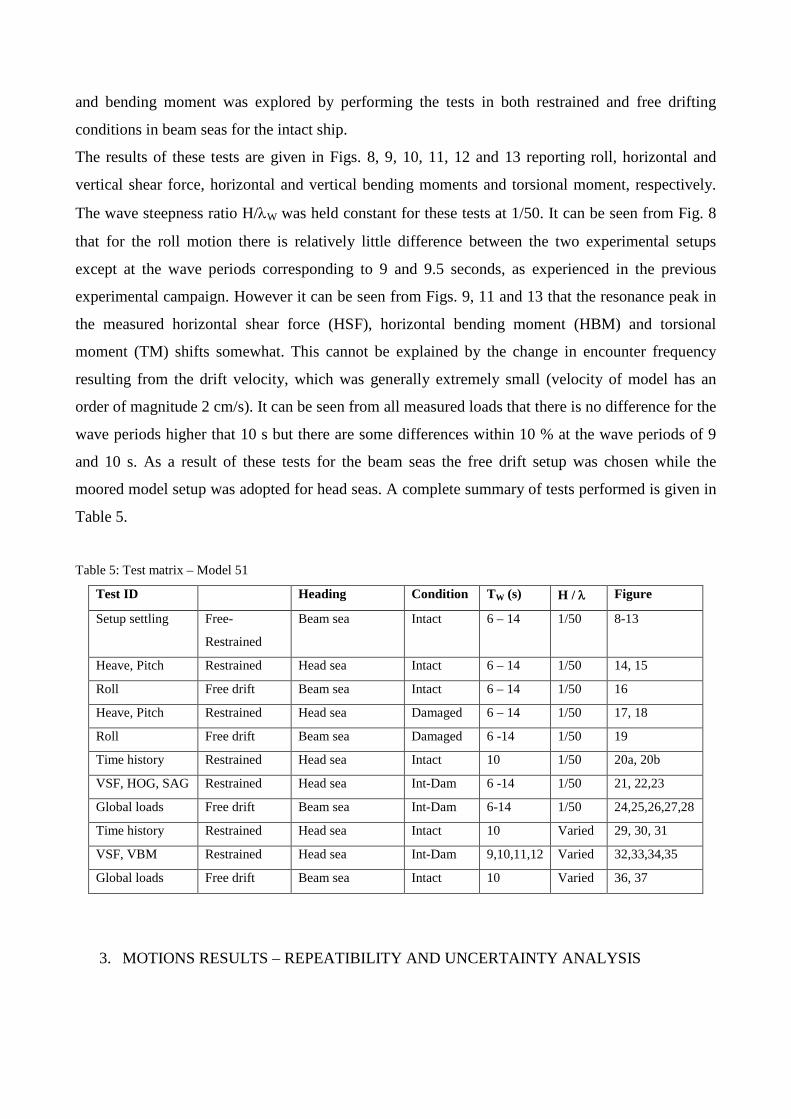
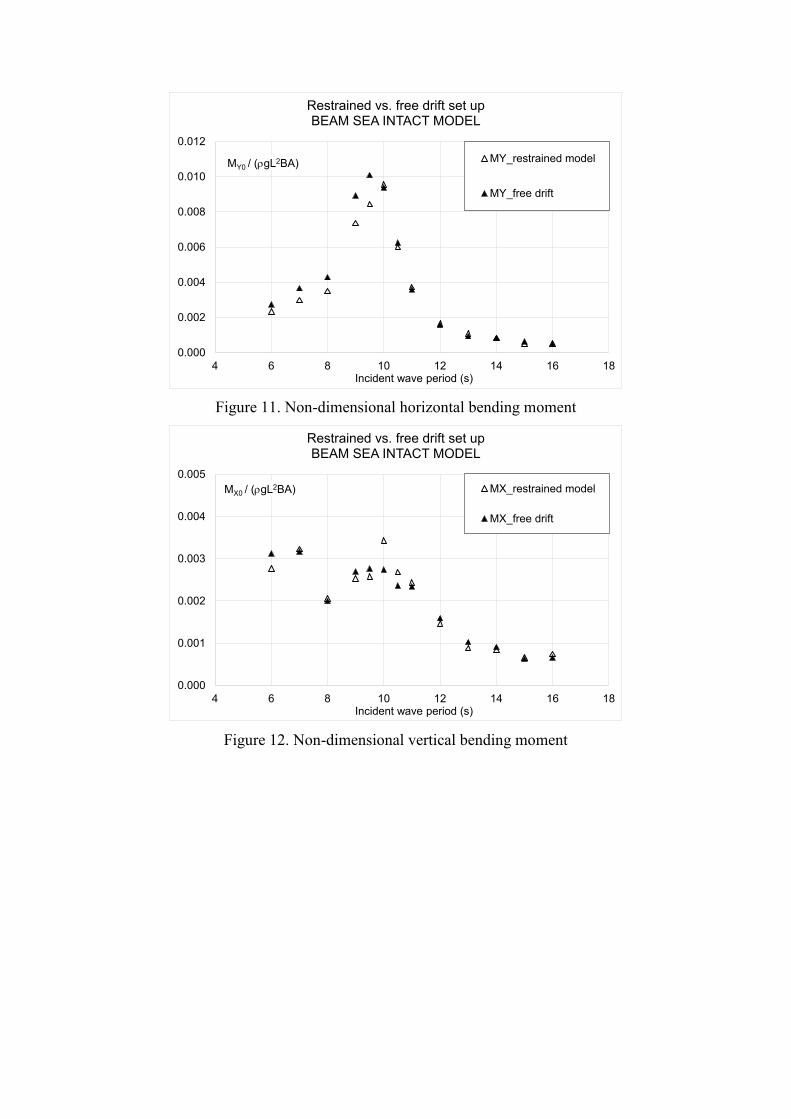
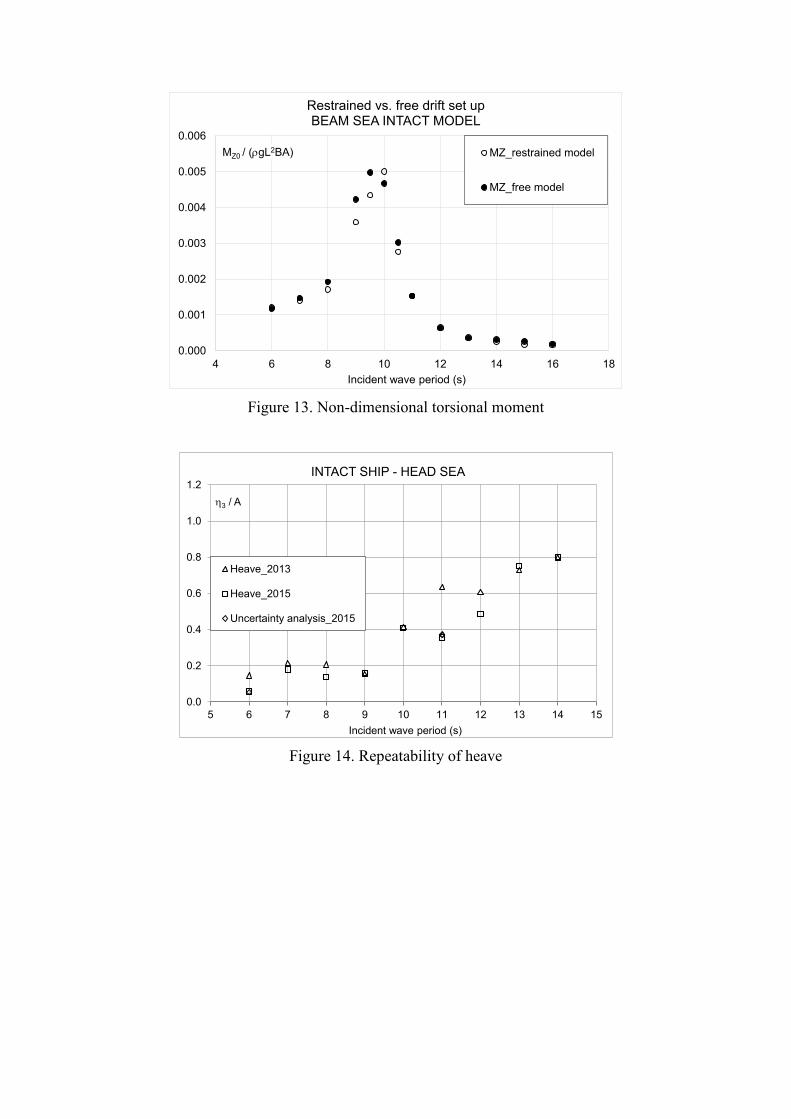
The results of these tests are given in Figs. 8, 9, 10, 11, 12 and 13 reporting roll, horizontal and
vertical shear force, horizontal and vertical bending moments and torsional moment, respectively.
The wave steepness ratio H/λW was held constant for these tests at 1/50. It can be seen from Fig. 8
that for the roll motion there is relatively little difference between the two experimental setups
except at the wave periods corresponding to 9 and 9.5 seconds, as experienced in the previous
experimental campaign. However it can be seen from Figs. 9, 11 and 13 that the resonance peak in
the measured horizontal shear force (HSF), horizontal bending moment (HBM) and torsional
moment (TM) shifts somewhat. This cannot be explained by the change in encounter frequency
resulting from the drift velocity, which was generally extremely small (velocity of model has an
order of magnitude 2 cm/s). It can be seen from all measured loads that there is no difference for the
wave periods higher that 10 s but there are some differences within 10 % at the wave periods of 9
and 10 s. As a result of these tests for the beam seas the free drift setup was chosen while the
moored model setup was adopted for head seas. A complete summary of tests performed is given in
Table 5.
Table 5: Test matrix – Model 51
Test ID Heading Condition TW (s) H / λ Figure
Setup settling Free-
Restrained
Beam sea Intact 6 – 14 1/50 8-13
Heave, Pitch Restrained Head sea Intact 6 – 14 1/50 14, 15
Roll Free drift Beam sea Intact 6 – 14 1/50 16
Heave, Pitch Restrained Head sea Damaged 6 – 14 1/50 17, 18
Roll Free drift Beam sea Damaged 6 -14 1/50 19
Time history Restrained Head sea Intact 10 1/50 20a, 20b
VSF, HOG, SAG Restrained Head sea Int-Dam 6 -14 1/50 21, 22,23
Global loads Free drift Beam sea Int-Dam 6-14 1/50 24,25,26,27,28
Time history Restrained Head sea Intact 10 Varied 29, 30, 31
VSF, VBM Restrained Head sea Int-Dam 9,10,11,12 Varied 32,33,34,35
Global loads Free drift Beam sea Intact 10 Varied 36, 37
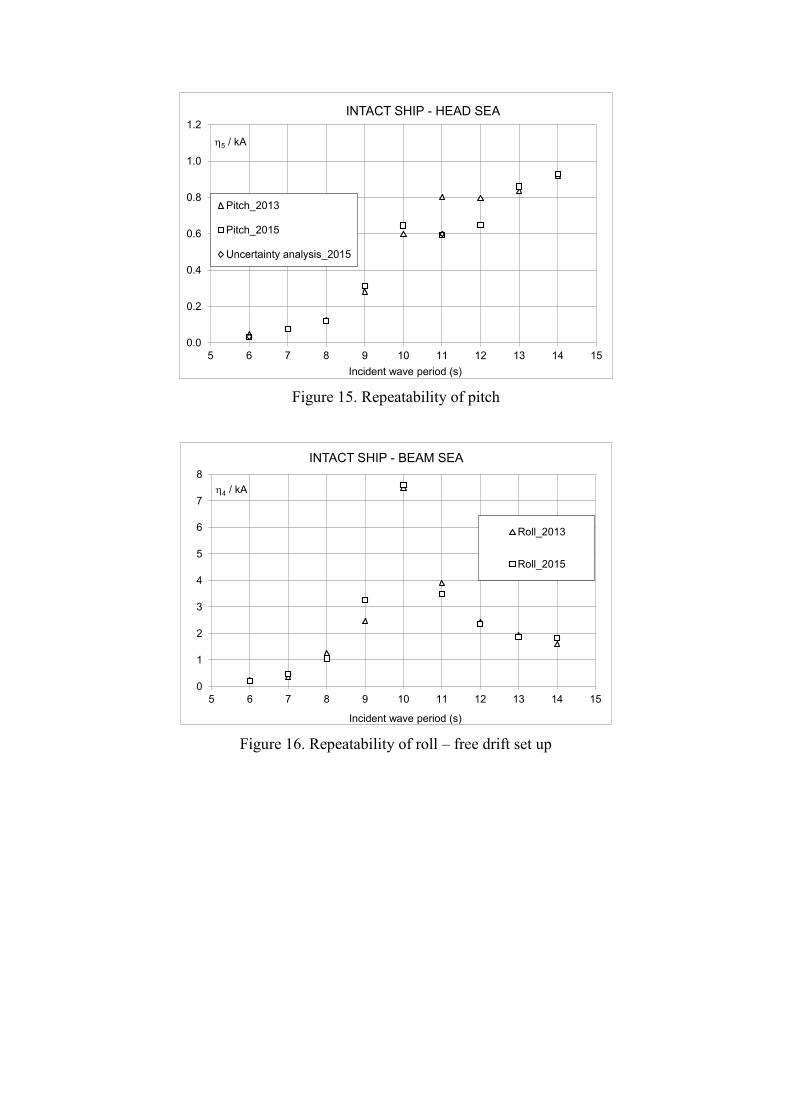
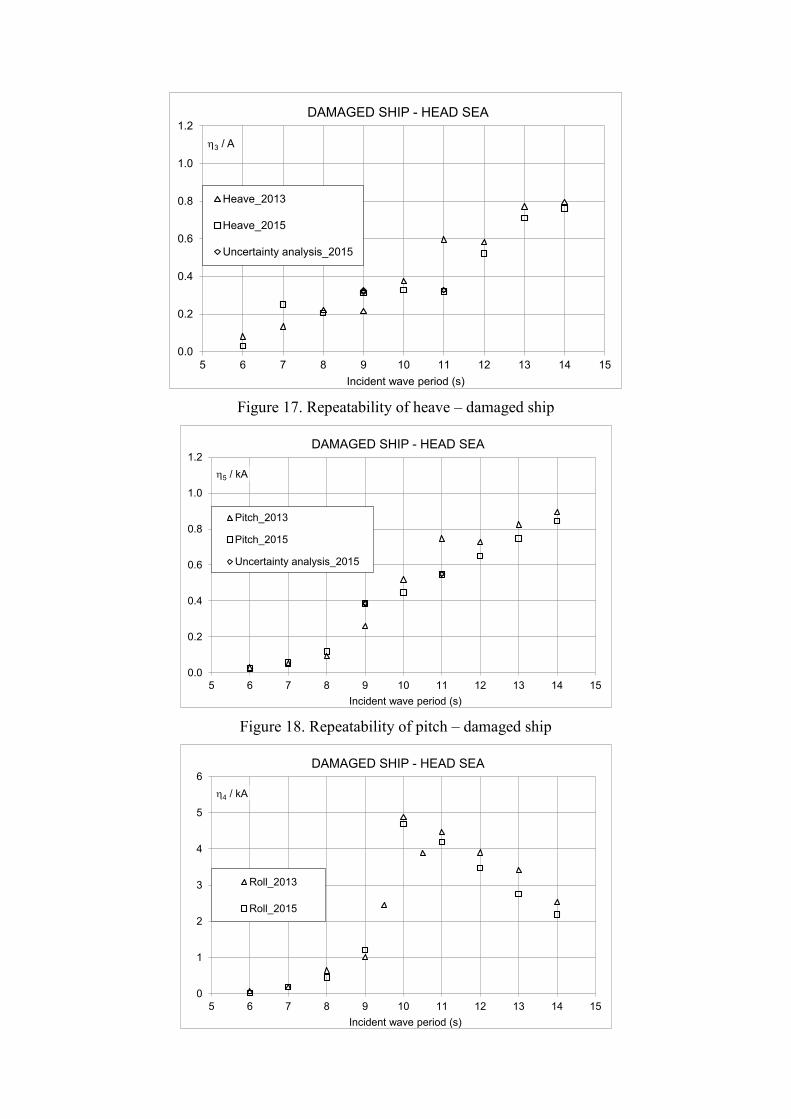
3. MOTIONS RESULTS – REPEATIBILITY AND UNCERTAINTY ANALYSIS
This campaign was focused primarily on the loads measurements during the tests in the same
conditions as reported in Begovic et al. (2013), i.e. for wave periods from 6 to 14 seconds, covering
range of wave length over ship length ratio from 0.4 to 2.0. The repeatability of the motion
measurements as part of the uncertainty assessment is controlled for intact and damaged ship
motions and all the results are reported in Figs. 14, 15, 16, 17, 18 and 19.
The repeatability analysis started from the re-ballasting of the model, the re-setting of the centre of
gravity position and the radii of inertia and the mooring of the model on the tank walls. After
obtaining the same values, the testing campaign started. It can be seen that the heave and pitch
motions in head seas, shown in Figs. 14 and 15, are almost identical for the wave periods shorter
than 9 s and longer than 11 s. Both responses show strong dependency on amplitude at wave
periods from 9 s to 11 s, where the bigger difference among results of the same campaign was
observed. This must be regarded as unexplained at present. In same figures the repeated
measurements are given for further uncertainty analysis.
As regards the intact ship roll RAO, shown in Fig. 16 there is almost no difference for all the waves
tested. The results for the damaged ship RAOs for heave, pitch and roll are shown in Figs. 17, 18
and 19, respectively. Small differences in heave and pitch for damaged ship are of the same order as
for intact ship. The damaged roll RAOs, given in Fig. 19 present small differences between two
experimental campaigns only for the wave periods higher than 12 seconds.
The ITTC recommendations 7.5-02-07-02.1 have been followed in assessment of uncertainty
analysis: to explore the ISO GUM Type A (random) uncertainty and Type B (systematic)
uncertainty. Some of the tests were repeated (indicated in diagrams by UA_2015) and to standard
deviation of the set of repeated tests, a confidence factor of 1.96 was applied in order to indicate the
95% confidence level. The results showed that the 95% confidence interval for the heave RAOs
related to Type A uncertainty lay between 1.5-3% for all cases, both intact and damaged. The
corresponding interval for the pitch RAOs lay in the region of 3-4%, whilst the confidence interval
for the roll RAOs was found to be less than 2% for intact cases, but typically between 4-5% for the
damaged cases.
The main components of Type B (systematic) uncertainty are expected to result from the key
measurement systems employed: the wave probes and the motion capture system. Day et. al. (2011)
explored the uncertainty related to calibration of different wave probe systems and estimated the
95% confidence values for the systems adopted in the present study as being between 0.5-0.8mm.
The Type B uncertainty related to measurement of model motions using an optical motion capture
system can be gained from the body residuals, which are typically substantially less than 0.5mm.
The other key source of systematic uncertainty results from the load cell, and in particular the
uncertainty associated with the calibration. The 5-DOF load cell was calibrated in three stages: first
Fy and Mx, secondly Fx and My, and finally Mz. In each of the first two cases the load cell was
calibrated in 36 steps in both ascending and descending loads. In these cases, the loading was
repeated three times, with the lever arm of the load varying between repeats, so that the same set of
applied shear forces generated different bending moments. The calibration constants for each of the
four components (Fx, Fy, Mx, My) were generated using the results from all three repeats. In the
case of Mz, only one loading set was applied. The standard error estimate was then calculated using
the calibration coefficients determined, and the 95% uncertainty estimated from the standard error
using a coverage factor of 2. These uncertainties were expressed as a percentage of the maximum
loading applied during calibration. The values obtained for Fx and Fy were 1.1% and 0.9%
respectively, whilst the corresponding values for Mx, My and Mz were 1.5%, 2.0% and 0.5%.
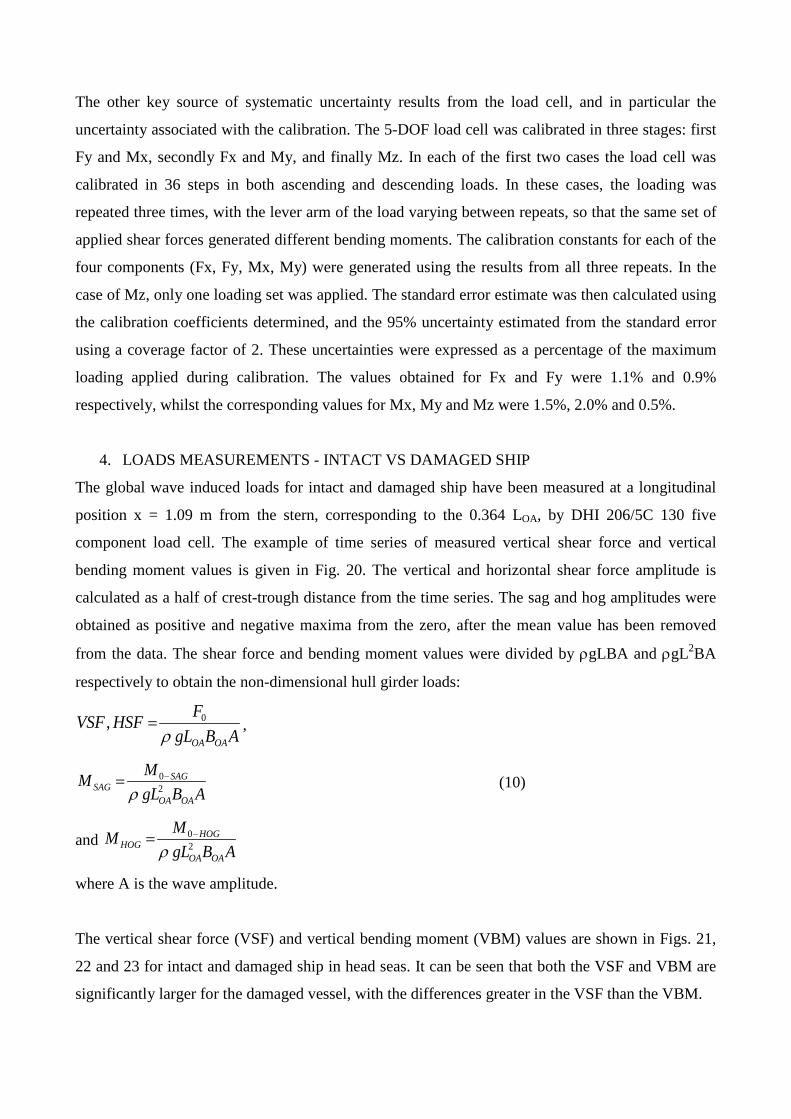
4. LOADS MEASUREMENTS - INTACT VS DAMAGED SHIP
The global wave induced loads for intact and damaged ship have been measured at a longitudinal
position x = 1.09 m from the stern, corresponding to the 0.364 LOA, by DHI 206/5C 130 five
component load cell. The example of time series of measured vertical shear force and vertical
bending moment values is given in Fig. 20. The vertical and horizontal shear force amplitude is
calculated as a half of crest-trough distance from the time series. The sag and hog amplitudes were
obtained as positive and negative maxima from the zero, after the mean value has been removed
from the data. The shear force and bending moment values were divided by ρgLBA and ρgL2BA
respectively to obtain the non-dimensional hull girder loads:
ABgLFHSFVSF
OAOAρ0, = ,
ABgLMM
OAOA
SAGSAG 2
0
ρ−= (10)
and ABgL
MMOAOA
HOGHOG 2
0
ρ−=
where A is the wave amplitude.
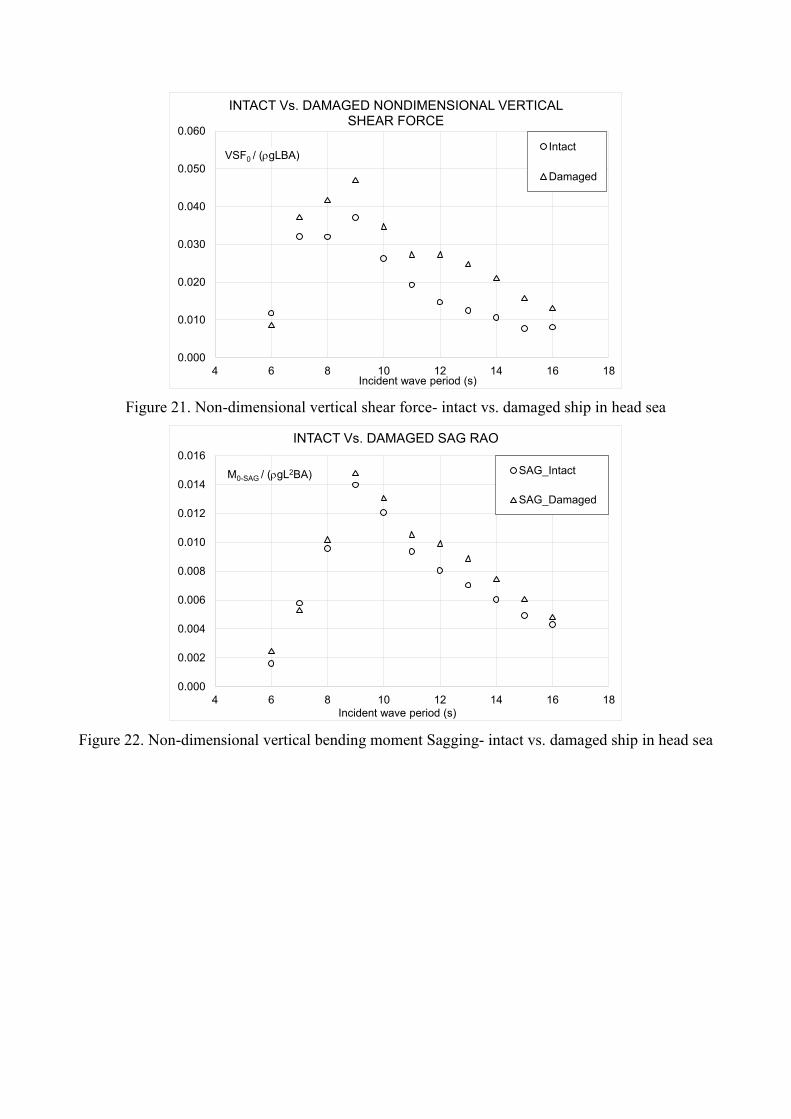
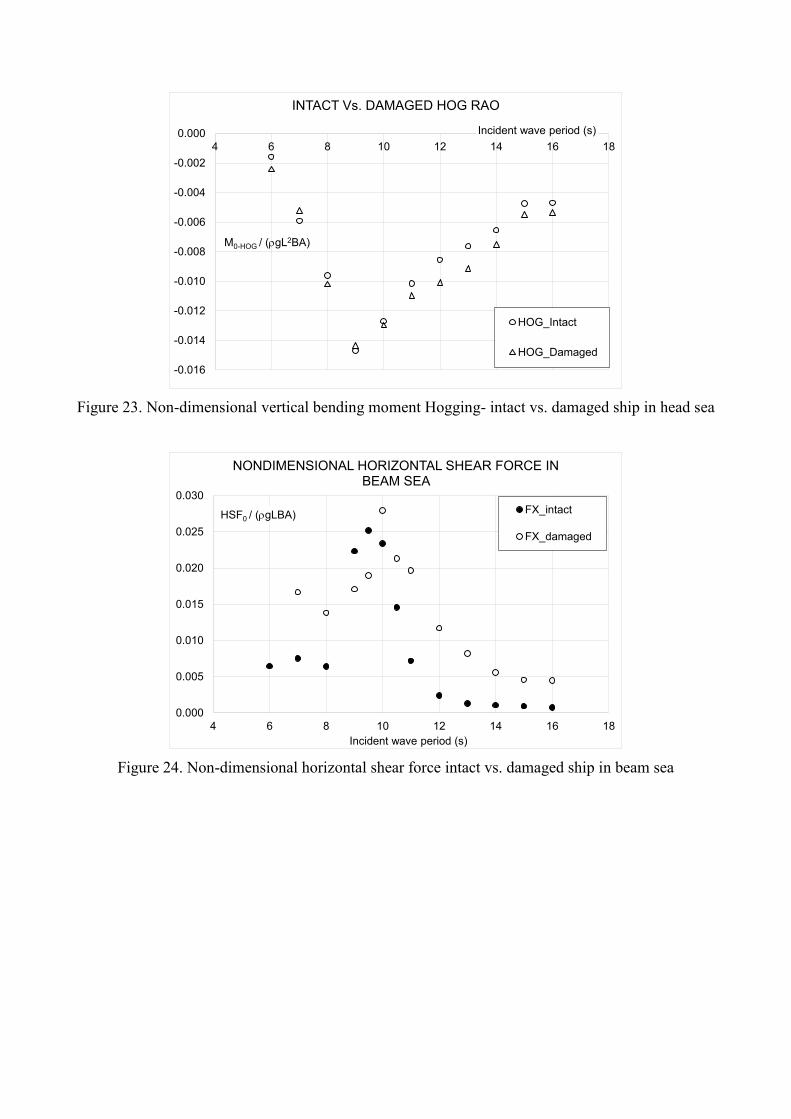
The vertical shear force (VSF) and vertical bending moment (VBM) values are shown in Figs. 21,
22 and 23 for intact and damaged ship in head seas. It can be seen that both the VSF and VBM are
significantly larger for the damaged vessel, with the differences greater in the VSF than the VBM.
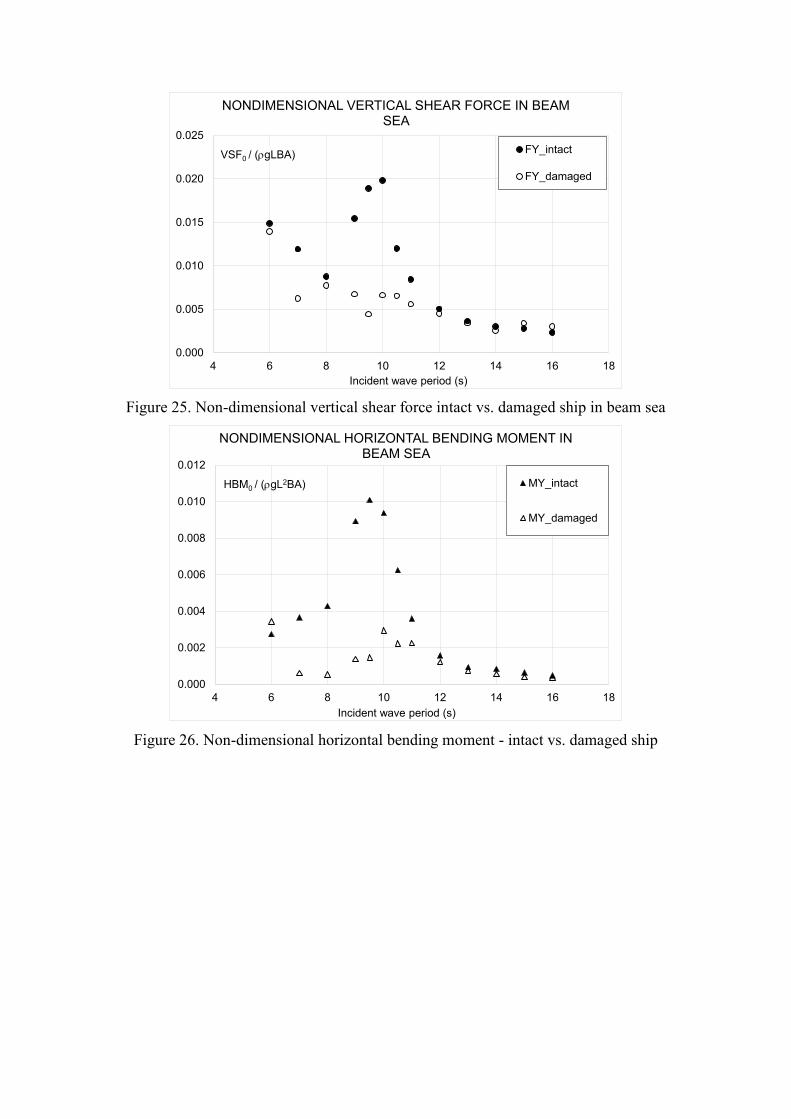
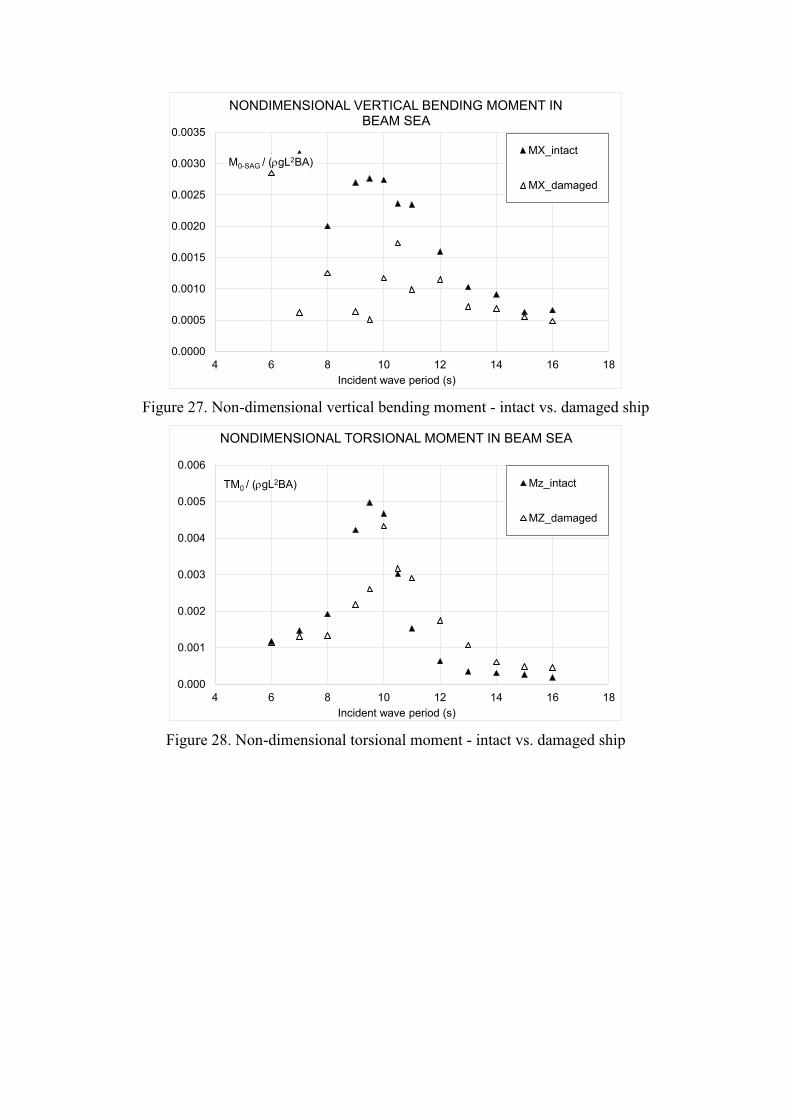
The loads measurements of intact vs. damaged ship in beam seas, in free drift test set up, are
presented for horizontal shear force (HSF) and vertical shear force (VSF) in Figs. 24 and 25.
Moments comparison in beam seas is given only for the positive peaks (SAG definition) of
horizontal, vertical and torsional moments and are shown in Figs. 26, 27 and 28.
It can be noted that the HSFs of damaged ship are significantly higher than for the intact case in the
whole wave range tested, whilst the maximum HSF response is shifted from 9.5 seconds for the
intact ship to 10s for the damaged ship. It can be noted from Figs. 25, 26 and 27 that the VSF, HBM
and TM values of the intact ship are higher than the corresponding values for the damaged ship, as
previously highlighted by Korkut et al. (2005). This behaviour in beam seas is directly related to the
lower RAOs of roll motion in this symmetric damage scenario.
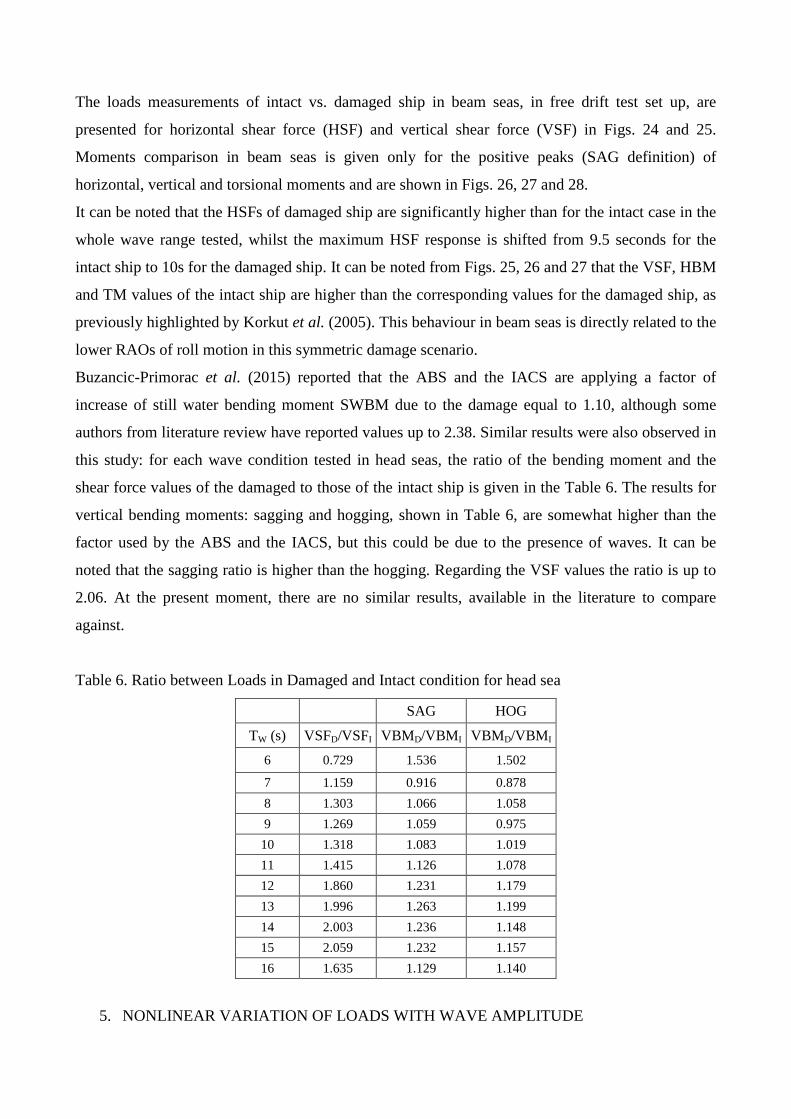
Buzancic-Primorac et al. (2015) reported that the ABS and the IACS are applying a factor of
increase of still water bending moment SWBM due to the damage equal to 1.10, although some
authors from literature review have reported values up to 2.38. Similar results were also observed in
this study: for each wave condition tested in head seas, the ratio of the bending moment and the
shear force values of the damaged to those of the intact ship is given in the Table 6. The results for
vertical bending moments: sagging and hogging, shown in Table 6, are somewhat higher than the
factor used by the ABS and the IACS, but this could be due to the presence of waves. It can be
noted that the sagging ratio is higher than the hogging. Regarding the VSF values the ratio is up to
2.06. At the present moment, there are no similar results, available in the literature to compare
against.
Table 6. Ratio between Loads in Damaged and Intact condition for head sea
SAG HOG
TW (s) VSFD/VSFI VBMD/VBMI VBMD/VBMI 6 0.729 1.536 1.502
7 1.159 0.916 0.878 8 1.303 1.066 1.058 9 1.269 1.059 0.975
10 1.318 1.083 1.019 11 1.415 1.126 1.078 12 1.860 1.231 1.179 13 1.996 1.263 1.199 14 2.003 1.236 1.148 15 2.059 1.232 1.157 16 1.635 1.129 1.140
5. NONLINEAR VARIATION OF LOADS WITH WAVE AMPLITUDE
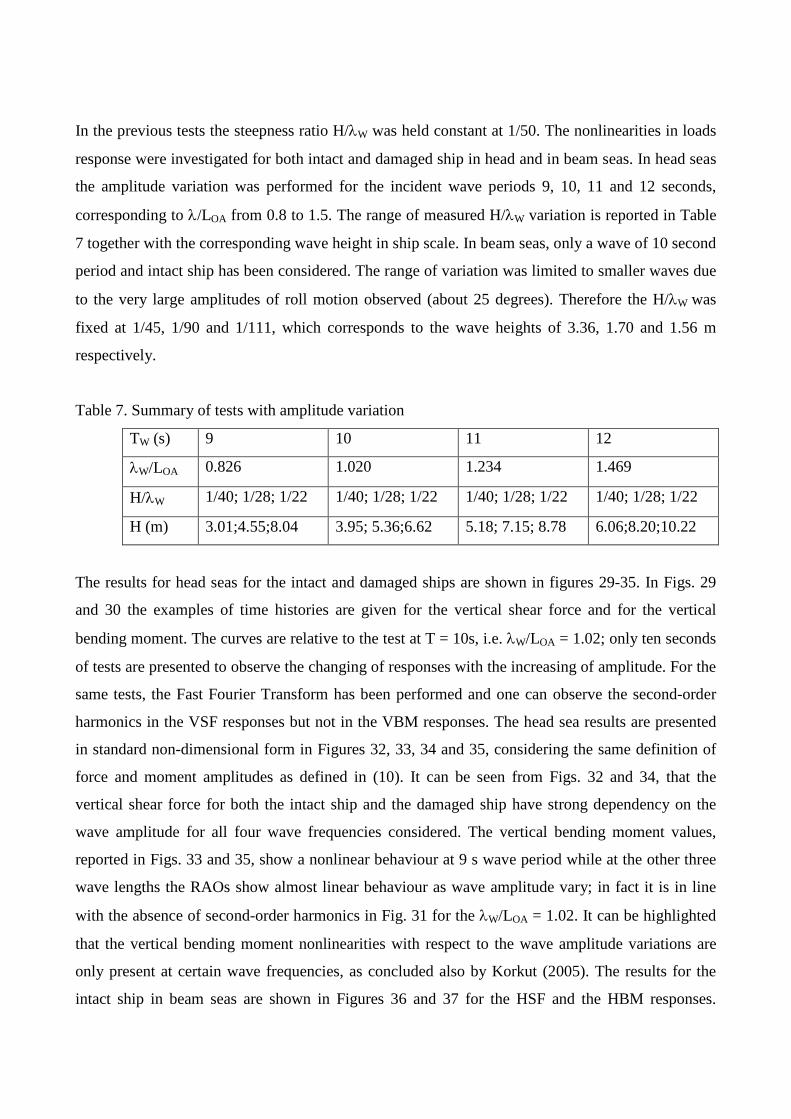
In the previous tests the steepness ratio H/λW was held constant at 1/50. The nonlinearities in loads
response were investigated for both intact and damaged ship in head and in beam seas. In head seas
the amplitude variation was performed for the incident wave periods 9, 10, 11 and 12 seconds,
corresponding to λ/LOA from 0.8 to 1.5. The range of measured H/λW variation is reported in Table
7 together with the corresponding wave height in ship scale. In beam seas, only a wave of 10 second
period and intact ship has been considered. The range of variation was limited to smaller waves due
to the very large amplitudes of roll motion observed (about 25 degrees). Therefore the H/λW was
fixed at 1/45, 1/90 and 1/111, which corresponds to the wave heights of 3.36, 1.70 and 1.56 m
respectively.
Table 7. Summary of tests with amplitude variation
TW (s) 9 10 11 12
λW/LOA 0.826 1.020 1.234 1.469
H/λW 1/40; 1/28; 1/22 1/40; 1/28; 1/22 1/40; 1/28; 1/22 1/40; 1/28; 1/22
H (m) 3.01;4.55;8.04 3.95; 5.36;6.62 5.18; 7.15; 8.78 6.06;8.20;10.22
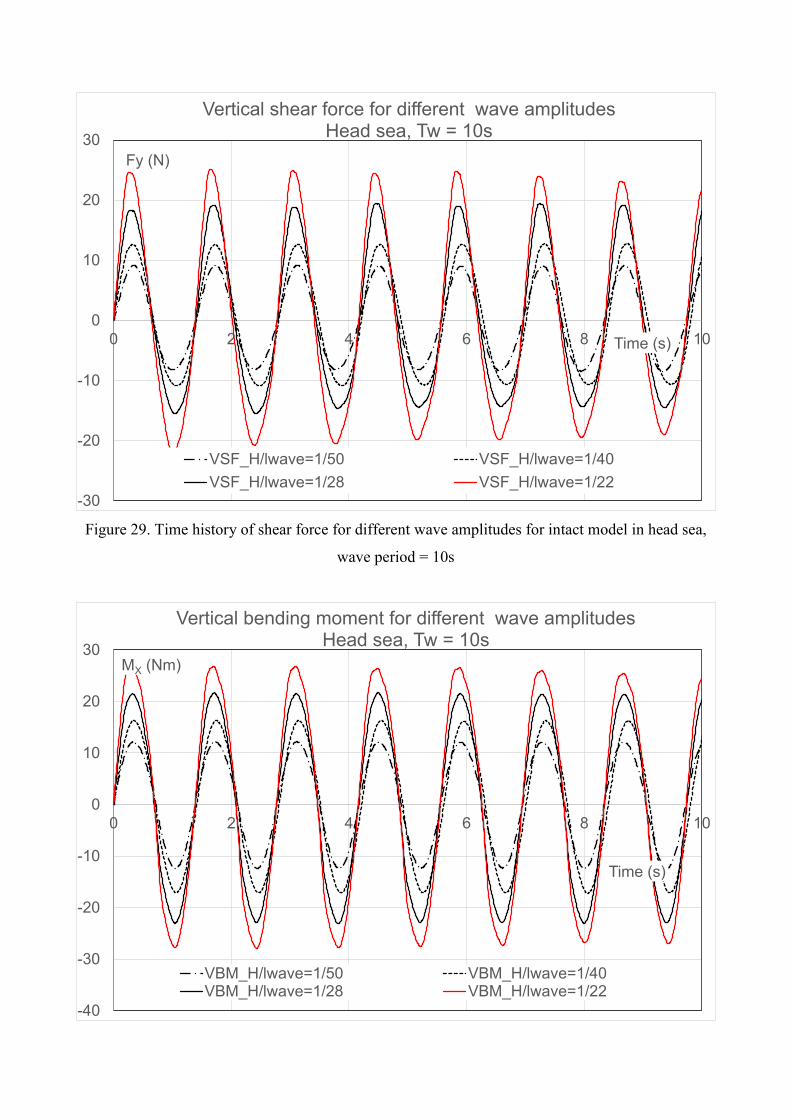
The results for head seas for the intact and damaged ships are shown in figures 29-35. In Figs. 29
and 30 the examples of time histories are given for the vertical shear force and for the vertical
bending moment. The curves are relative to the test at T = 10s, i.e. λW/LOA = 1.02; only ten seconds
of tests are presented to observe the changing of responses with the increasing of amplitude. For the
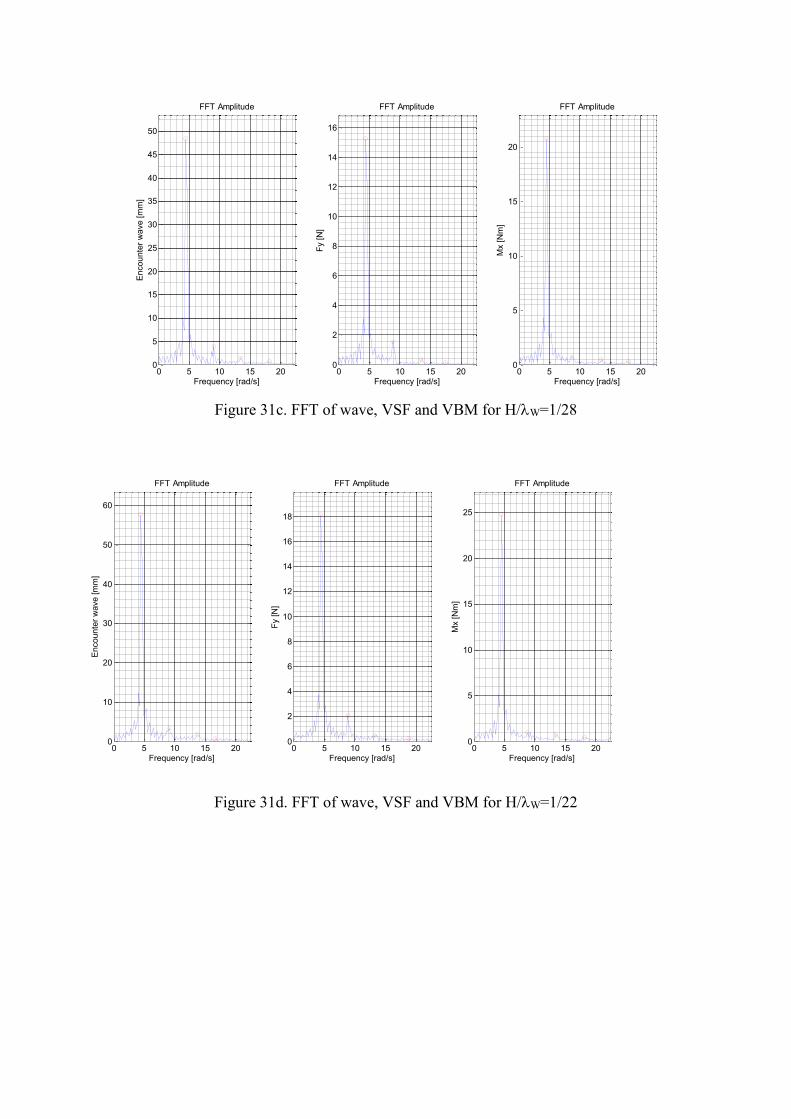
same tests, the Fast Fourier Transform has been performed and one can observe the second-order
harmonics in the VSF responses but not in the VBM responses. The head sea results are presented
in standard non-dimensional form in Figures 32, 33, 34 and 35, considering the same definition of
force and moment amplitudes as defined in (10). It can be seen from Figs. 32 and 34, that the
vertical shear force for both the intact ship and the damaged ship have strong dependency on the
wave amplitude for all four wave frequencies considered. The vertical bending moment values,
reported in Figs. 33 and 35, show a nonlinear behaviour at 9 s wave period while at the other three
wave lengths the RAOs show almost linear behaviour as wave amplitude vary; in fact it is in line
with the absence of second-order harmonics in Fig. 31 for the λW/LOA = 1.02. It can be highlighted
that the vertical bending moment nonlinearities with respect to the wave amplitude variations are
only present at certain wave frequencies, as concluded also by Korkut (2005). The results for the
intact ship in beam seas are shown in Figures 36 and 37 for the HSF and the HBM responses.
During these tests the wave amplitude was decreased due to the very high measured roll angles and
very strong variation of non-dimensional responses for the wave frequencies tested were observed.
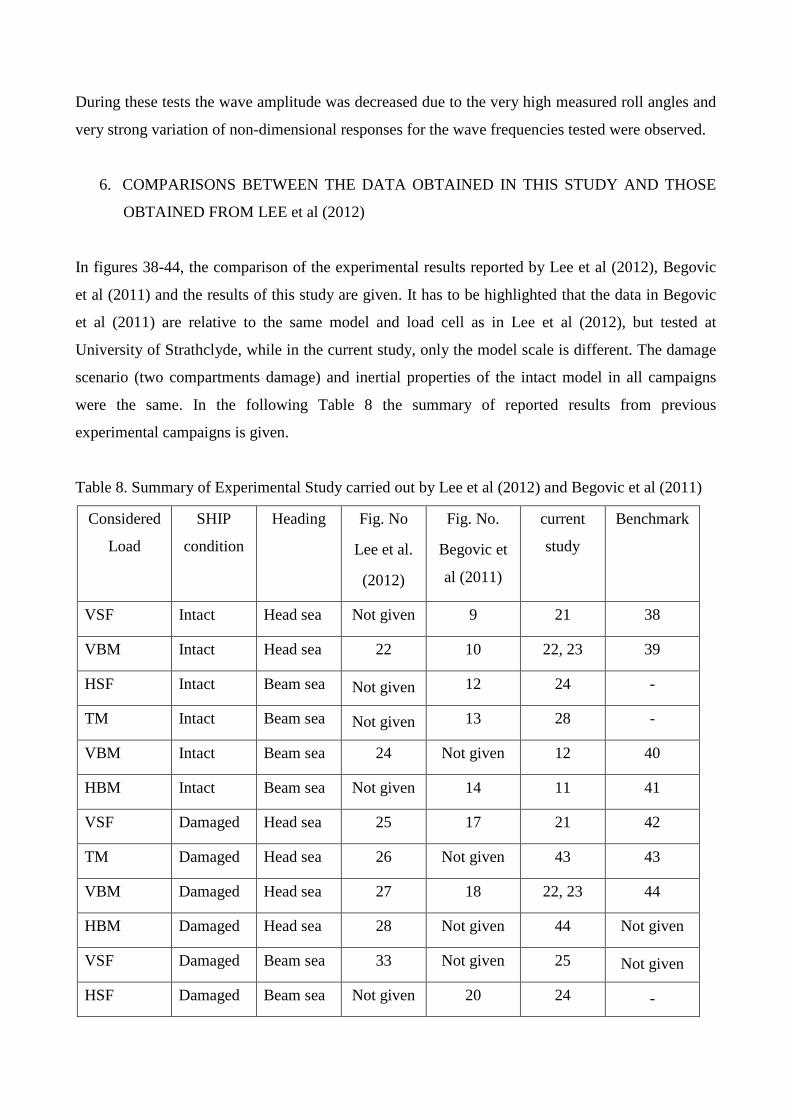
6. COMPARISONS BETWEEN THE DATA OBTAINED IN THIS STUDY AND THOSE
OBTAINED FROM LEE et al (2012)
In figures 38-44, the comparison of the experimental results reported by Lee et al (2012), Begovic
et al (2011) and the results of this study are given. It has to be highlighted that the data in Begovic
et al (2011) are relative to the same model and load cell as in Lee et al (2012), but tested at
University of Strathclyde, while in the current study, only the model scale is different. The damage
scenario (two compartments damage) and inertial properties of the intact model in all campaigns
were the same. In the following Table 8 the summary of reported results from previous
experimental campaigns is given.
Table 8. Summary of Experimental Study carried out by Lee et al (2012) and Begovic et al (2011)
Considered
Load
SHIP
condition
Heading Fig. No
Lee et al.
(2012)
Fig. No.
Begovic et
al (2011)
current
study
Benchmark
VSF Intact Head sea Not given 9 21 38
VBM Intact Head sea 22 10 22, 23 39
HSF Intact Beam sea Not given 12 24 -
TM Intact Beam sea Not given 13 28 -
VBM Intact Beam sea 24 Not given 12 40
HBM Intact Beam sea Not given 14 11 41
VSF Damaged Head sea 25 17 21 42
TM Damaged Head sea 26 Not given 43 43
VBM Damaged Head sea 27 18 22, 23 44
HBM Damaged Head sea 28 Not given 44 Not given
VSF Damaged Beam sea 33 Not given 25 Not given
HSF Damaged Beam sea Not given 20 24 -
TM Damaged Beam sea 34 21 28 45
VBM Damaged Beam sea 35 Not given 27 Not given
HBM Damaged Beam sea 36 22 26 46
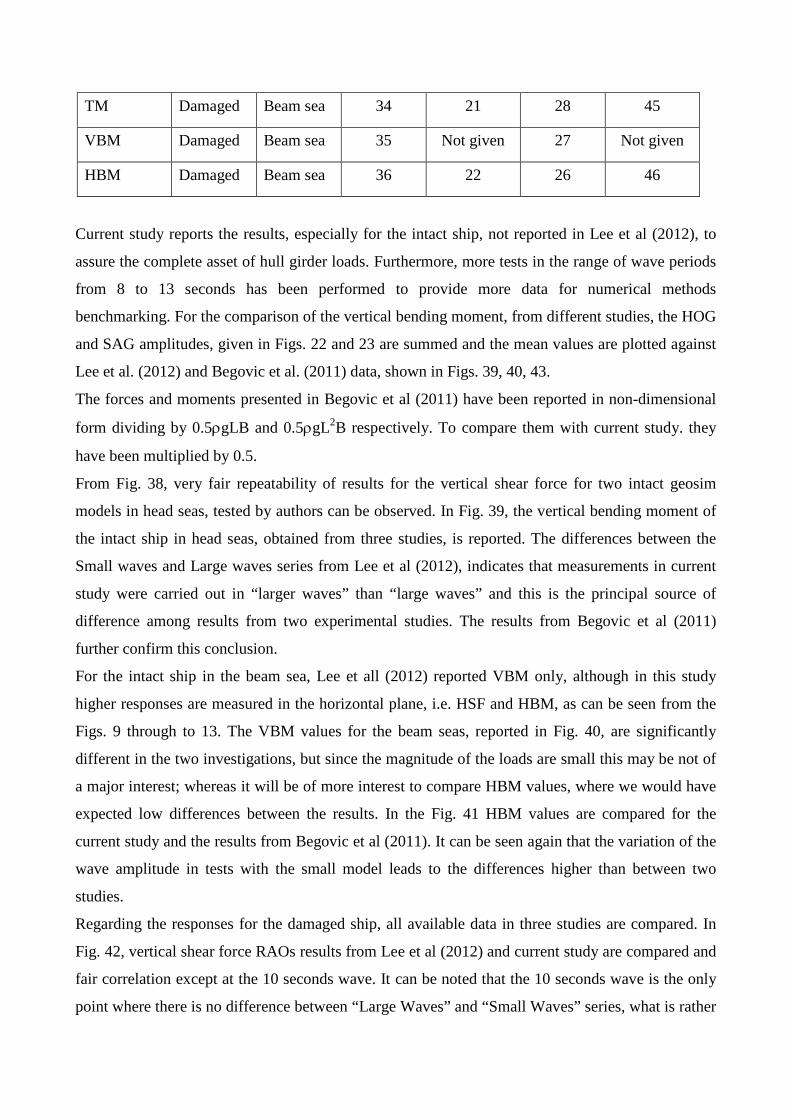
Current study reports the results, especially for the intact ship, not reported in Lee et al (2012), to
assure the complete asset of hull girder loads. Furthermore, more tests in the range of wave periods
from 8 to 13 seconds has been performed to provide more data for numerical methods
benchmarking. For the comparison of the vertical bending moment, from different studies, the HOG
and SAG amplitudes, given in Figs. 22 and 23 are summed and the mean values are plotted against
Lee et al. (2012) and Begovic et al. (2011) data, shown in Figs. 39, 40, 43.
The forces and moments presented in Begovic et al (2011) have been reported in non-dimensional
form dividing by 0.5ρgLB and 0.5ρgL2B respectively. To compare them with current study. they
have been multiplied by 0.5.
From Fig. 38, very fair repeatability of results for the vertical shear force for two intact geosim
models in head seas, tested by authors can be observed. In Fig. 39, the vertical bending moment of
the intact ship in head seas, obtained from three studies, is reported. The differences between the
Small waves and Large waves series from Lee et al (2012), indicates that measurements in current
study were carried out in “larger waves” than “large waves” and this is the principal source of
difference among results from two experimental studies. The results from Begovic et al (2011)
further confirm this conclusion.
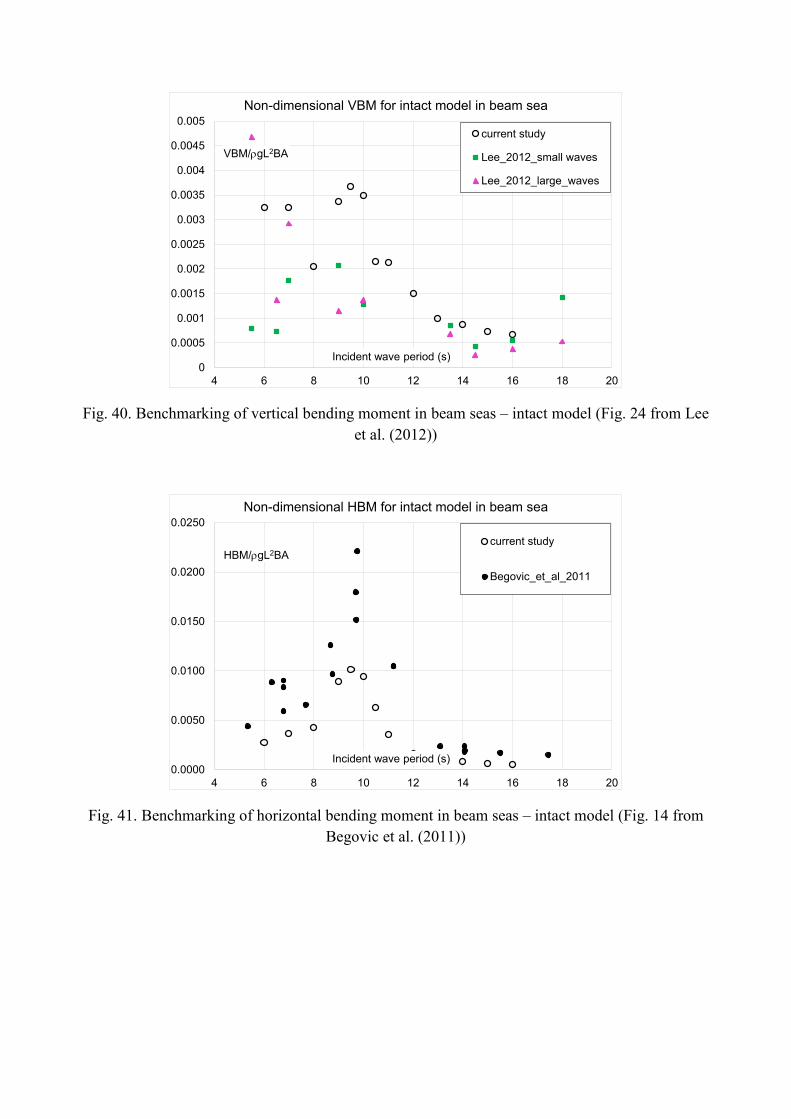
For the intact ship in the beam sea, Lee et all (2012) reported VBM only, although in this study
higher responses are measured in the horizontal plane, i.e. HSF and HBM, as can be seen from the
Figs. 9 through to 13. The VBM values for the beam seas, reported in Fig. 40, are significantly
different in the two investigations, but since the magnitude of the loads are small this may be not of
a major interest; whereas it will be of more interest to compare HBM values, where we would have
expected low differences between the results. In the Fig. 41 HBM values are compared for the
current study and the results from Begovic et al (2011). It can be seen again that the variation of the
wave amplitude in tests with the small model leads to the differences higher than between two
studies.
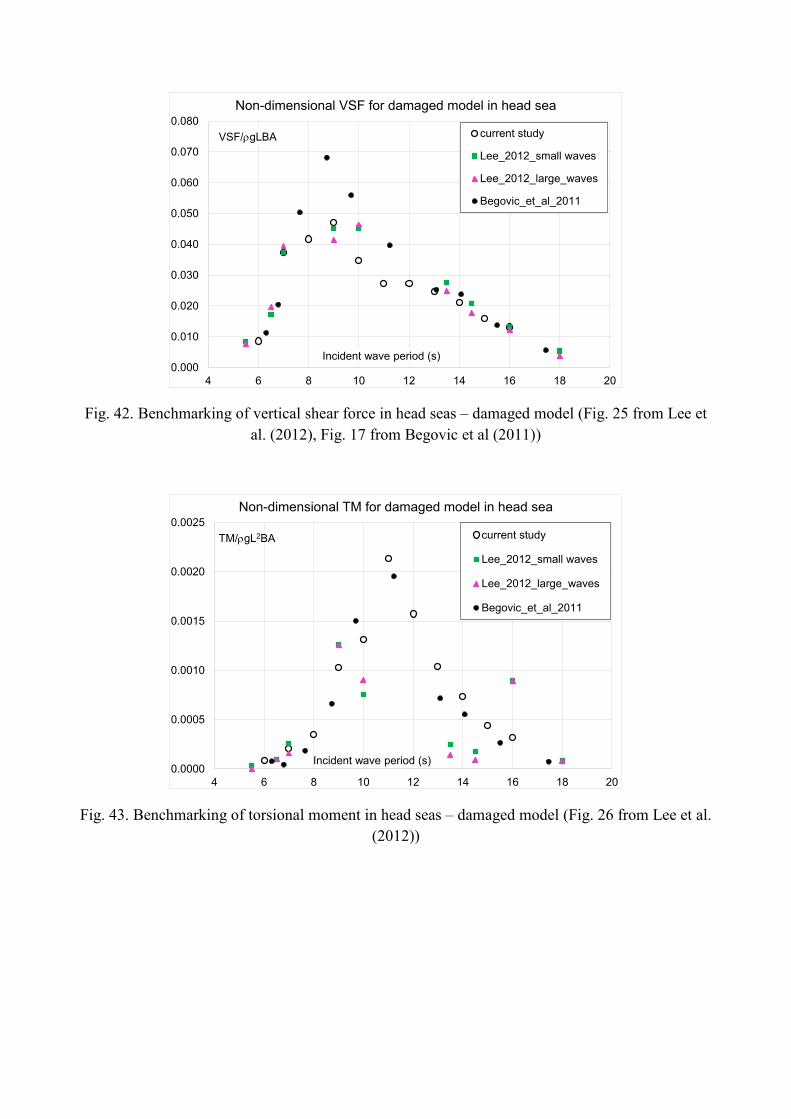
Regarding the responses for the damaged ship, all available data in three studies are compared. In
Fig. 42, vertical shear force RAOs results from Lee et al (2012) and current study are compared and
fair correlation except at the 10 seconds wave. It can be noted that the 10 seconds wave is the only
point where there is no difference between “Large Waves” and “Small Waves” series, what is rather
strange, as this range is close to the resonance period and the nonlinearity with the wave amplitude
variation is expected. The results from Begovic et al (2011) at the wave periods from 8 to 11
seconds have significant difference from the current study. The difference at wave period 11
seconds is of the same order of magnitude as Lee-current study at 10 second wave. Therefore, the
observed differences are attributed to the different wave steepness and sensibility of RAO results on
wave amplitudes.
The torsional moment measurements are compared in the Fig. 43, and it can be observed that in Lee
at al, (2012) the missing wave periods of 11, 12 and 13 seconds are not making possible to see
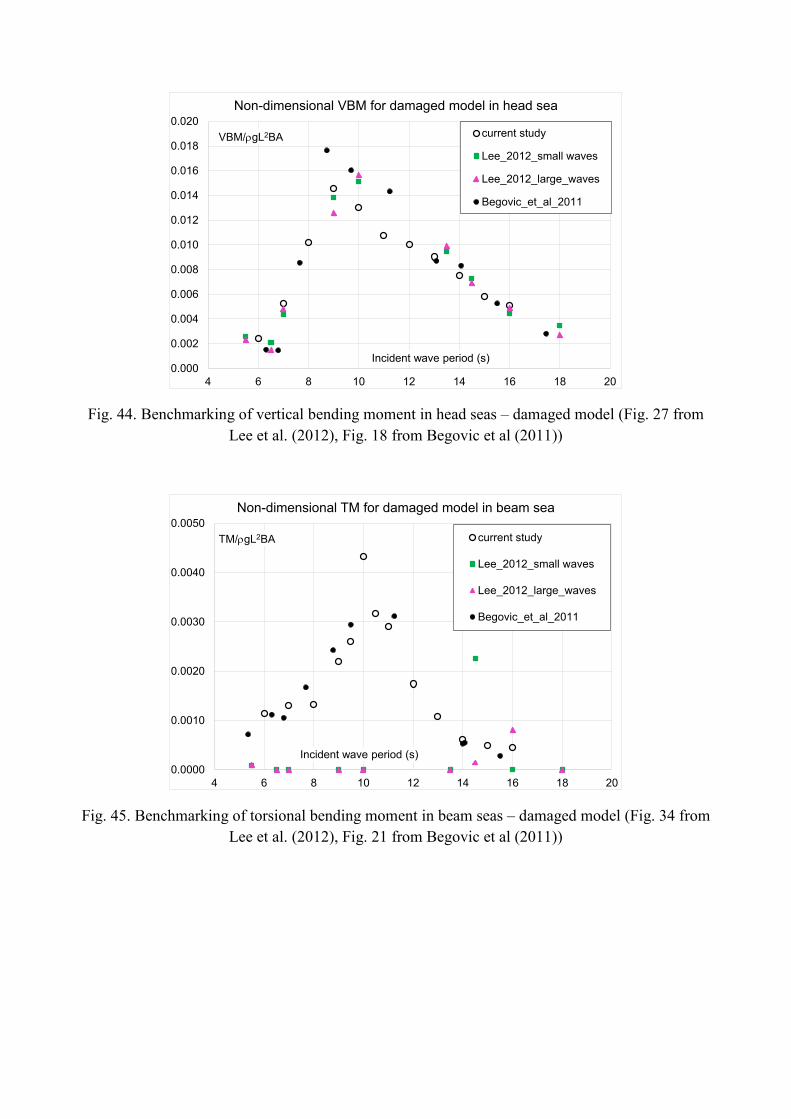
complete correlation. In Fig. 44, the vertical bending moment values are compared and a fair
correlation of results obtained from three studies can be noted.
The horizontal bending moment values for head sea from both campaigns has some irregularities, in
Lee et al (2012), an extremely high value at 14 seconds wave period occurs, while in the current
study the value at 9 seconds wave period is higher than expected. The diagram with comparison of
these experimental data has not been reported as HBM in head seas may not be of a major interest.
For the same reason the VSF and VBM results for damaged model in beam seas are not reported.
The same
Regarding the torsion moment values of damaged model in beam seas, given in Fig. 45 in Lee et al.
(2012) study seem to have some errors occurred during the measurement or the analysis of the data
since the values are almost zero in the whole frequency range. The results from Begovic et al.
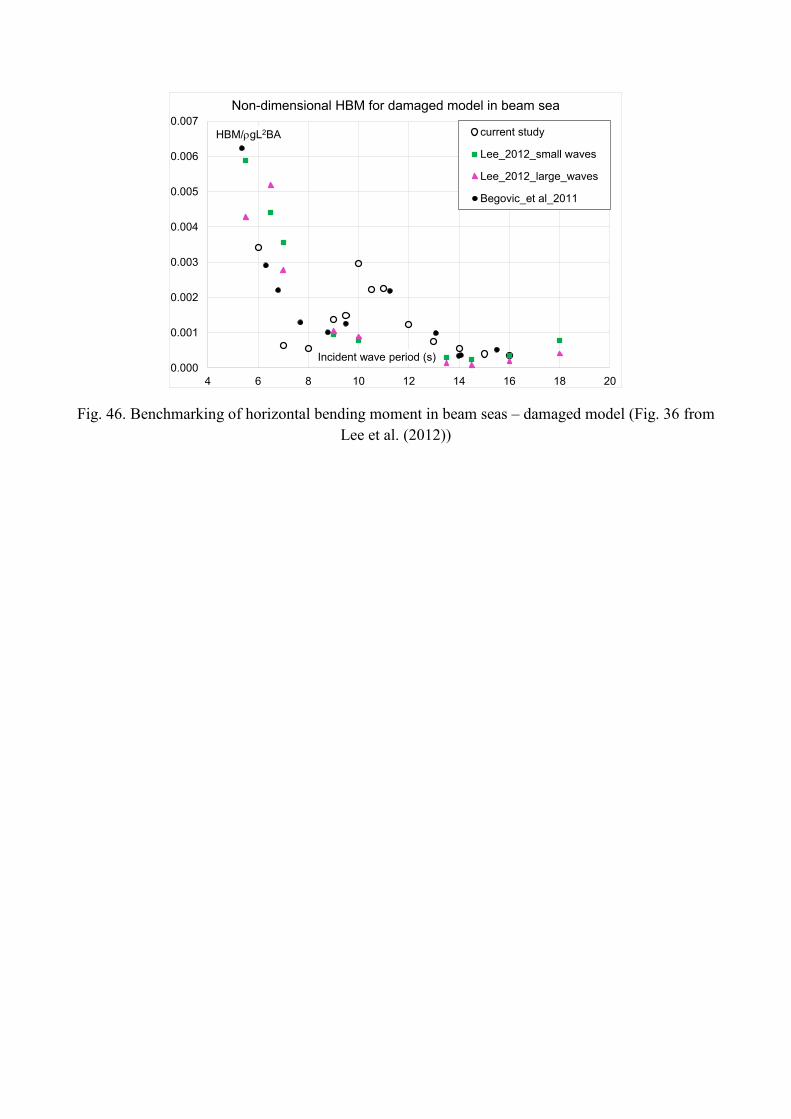
(2011) and the current study indicate very good correlation of measured data. The horizontal
bending moment values, shown in the Fig. 46, indicate that in the range of long waves the measured
results obtained from three studies are very close. Regarding the data from Lee et al (2012) it can be
noted that there are some data missing in that would have been very helpful for the correlations and
there is a significant difference at the shortest wave. The results from Begovic et al. (2011) and the
current study indicate very good correlation of measured data.
It is difficult to know how different experimental aspects, such as model scale, experimental
uncertainty, free drift vs. restrained model set up, frequency of sampling, data analysis, etc. affect
the final RAOs results obtained from three studies. Only extensive reports of experimental studies
can shed some light on these differences.
Regarding the comparison made in this study, it can be observed that the vertical bending moment
and vertical shear force values in head seas are generally in fair agreement between three studies.
Regarding the results in beam seas from the current study and Lee et al. (2012), the overall
agreement of loads in vertical plane (VSF, VBM, TM) is poor. The comparisons of HSF and HBM
values have not been possible for intact ship due to the missing data, and for the damaged ship,
some missing data at certain frequencies reported in Lee et al.(2012) would have been very helpful.
The results from Begovic et all (2011) have been helpful in explaining some experimental trends as
they are relative to the same model as in Lee et al (2012) and are tested by the authors of the current
study.
CONCLUSIONS
The main aim of this study was to provide benchmark data on global loads acting on intact and
damaged DTMB 5415 navy vessel in regular waves at zero speed. The experimental campaign
presented here is the continuation of the previous work by Begovic et al. (2011, 2013) dealing with
the ship motions in the same conditions.
The results show that the two compartment symmetric damage located abaft midship significantly
increases the roll damping of ship due to the waves and vortices generation during movement of
flood water inside and outside of the compartment. This additional roll damping has been analysed
in terms of equivalent damping, based on the experimental time histories of the roll motion in a free
oscillation test reporting linear and quadratic roll extinction coefficients and roll periods of intact
and damaged model. For the considered damage scenario, both linear and quadratic extinction
coefficients have been doubled compared to the intact case.
The results for vessel motions show that repeatability with the previous experimental campaign is
generally good although some unexplained discrepancies occur at 11 second wave period. As regard
to the uncertainty of the experiments carried out, almost all responses are in the range up to 3%. A
comparison of results in beam seas between a soft-moored vessel and a freely drifting vessel show
that the motions are very similar especially in the long waves. The differences in the hull girder
loads are up to 10 % but the shifting of resonant frequency suggested the choice a free drifting
model setup.
With regard to the measured loads, the structural response values of the damaged model are greater
than those on the intact model for most of the modes of motion with the exception of the vertical
and horizontal bending moments in the beam seas condition. The ratio of damaged and intact
vertical bending moment at each tested wave frequency is calculated and discussed with respect to
the results reported in the literature. It can be noted that there is a high discrepancy in the ratio
results reported by different authors, ranging from 1.10 up to 2 and the future work should
investigate this issue further.
In this work a particular attention was focused on the nonlinearities in global loads as the wave
amplitudes vary. In general, it can be highlighted that the vertical shear force and the vertical
bending moment values both for the intact and damaged ships exhibit a strong dependency on wave
amplitude variations at the wave frequencies around the natural frequencies of the vessel. It can be
further noted that the vertical shear forces have appreciable second-order harmonics in a range of
frequencies when the wave amplitudes were varied i.e. for λ/L from 0.8 to 1.5.
Finally, the results obtained for loads measurements have been compared against Lee et al. (2012)
and Begovic et al. (2011), trying to provide more complete asset of data for intact and damaged
ship. Regarding the comparison made in this study, it can be observed that the vertical bending
moment and vertical shear force values in head seas, as well as horizontal shear force and horizontal
bending moment in beam seas are generally in fair agreement among three studies and often the
wave amplituide variation is the principal source of difference among results. This comparison
confirmed the necessity of detailed reports of experimental studies to provide a benchmark for the
validation of numerical methods .
ACKNOWLEDGEMENTS
The Authors gratefully acknowledge the help and contributions made by Mr. Charles. Keay and Mr.
Edd Nixon, technical staff of the Kelvin Hydrodynamics Laboratory, Strathclyde University,
Glasgow, during the preparation and performance of the experimental campaign reported in this
paper.
REFERENCES
Begovic E., Mortola G., Incecik A., Day A.H.,2013, Experimental assessment of intact and
damaged ship motions in head, beam and quartering seas, Ocean Engineering 72 (2013), 209 – 226,
http://dx.doi.org/10.1016/j.oceaneng.2013.06.024
Begovic E., Incecik A., Day A.H., 2011, Experimental assessment of intact and damaged ship
motions in head, beam and quartering seas, HSMV Conference 2011, Naples, Italy
Bulian G., Francescutto A., Fucile F., 2009, Determination of Relevant Parameters for the
Alternative Assessment of Intact Stability Weather Criterion On Experimental Basis, Project HYD-
III-CEH-5, Rev.1.0-Final-22, November 2009, available at www.shipstab.org
Buzancic-Primorac B., Corak M., Parunov J., 2015, Statistics of still water bending moment of
damaged ship, Analysis and Design of Marine Structures – Guedes Soares & Shenoi (Eds), Taylor
& Francis Group, London, ISBN 978-1-138-02789-3, pp. 491-497
Chakrabarti S.K., 1994, Offshore Structure Modelling, Advances Series in Ocean Engineering, Vol.
9, Feb. 1994, Worlds Scientific Publishing Co
Day A.H., Clelland, D., Valentine G., 2011. Development of a low cost laser wave measurement system, In: Proceedings of the Second International Conference on Advanced Model Measurement Technology (AMT’11), Newcastle, April 2011
Domeh V.D.K., Sobey A.J., Hudson D.A., 2015, A preliminary experimental investigation into the
influence of compartment permeability on damaged ship response in waves, Applied Ocean
Research 52 (2015), 27-36, http://dx.doi.org/10.1016/j.apor.2015.05.001
Fonseca N. Guades Soares C., 2002, Comparison of numerical and experimental results of
nonlinear wave-induced ship motions and loads, Journal of Marine Science and Technology, 2002,
No.6, pp 193-204
Fonseca N. Guades Soares C., 2004, Experimental investigation of the nonlinear effects on the
vertical motions and loads of a containership in regular waves, Journal of Ship Research, Volume
48, Issue 2, June 2004, Pages 118-147
Fonseca N. Guades Soares C., 2004, Experimental investigation of the nonlinear effects on the
statistics of vertical motions and loads of a containership in irregular waves, Journal of Ship
Research, Volume 48, Issue 2, June 2004, Pages 148-167
Hirdaris S.E., Bai W., Dessi D, Ergin A, Gu X, Hermundstad O.A., Huijsmans R., Iijima K.,
Nielsen U.D., Parunov J., Fonseca N., Papanikolaou A, Argyriadis K., Incecik A., 2014, Loads for
use in the design of ships and offshore structures, Ocean Engineering 78 (2014), March 2014, pp.
131-174, http://dx.doi.org/10.1016/j.oceaneng.2013.09.012
Katayama T., Kotaki M., Katsui T., Matsuda A., 2009, A Study on Roll Motion Estimation of
Fishing Vessels with Water on Deck, Journal of the Japan Society of Naval Architects and Ocean
Engineers, Vol.9, pp.115-125 (in Japanese).
Korkut E., Atlar M., Incecik A., 2004, An experimental study of motion behavior with an intact and
damaged Ro-Ro ship model, Ocean Engineering 31 (2004) 483-512
Korkut E., Atlar M., Incecik A., 2005, An experimental study of global loads acting on an intact and
damaged Ro-Ro ship model, Ocean Engineering 32 (2005) 1370-1403
Kukkanen T., Matusiak J., 2014, Non linear hull girder loads of a RoPax ship, Ocean Engineering
75 (2014), 1 – 14, doi:10.1016/j.oceaneng.2013.10.008
Lee Y., Chan H.S, Pu Y., Incecik A., Dow R.S., 2012, Global Wave Loads on a Damaged Ship,
Ships and Offshore Structures 7(3),237-268, DOI: 10.1080/17445302.2011.588081
Manderbacka T., Ruponen P., Kulovesi J., Matusiak J., 2015, Model experiments of the transient
response to flooding of the box shaped barge, Journal of Fluid and Structures 57 (2015), 127-143,
http://dx.doi.org/10.1016/j.jfluidstructs.2015.06.002
Song M.J., Kim K.H., Kim Y., 2011, Numerical Analysis and validation of weakly nonlinear ship
motions and structural loads on a modern containership, Ocean Engineering 38 (2011), 77 – 87,
doi:10.1016/j.oceaneng.2010.09017
O’Dea J. Powers E., Zselecsky J., 1992, Experimental determination of non-linearities in vertical
plane ship motions, Proceedings of the 19th Symposium on Naval Hydrodynamics, Seoul, Korea,
pp. 73-91
Parunov J, Corak M., Gledic I., 2015, Comparison of two practical methods for seakeeping
assessment of damaged ships, Analysis and Design of Marine Structures – Guedes Soares & Shenoi
(Eds), Taylor & Francis Group, London, ISBN 978-1-138-02789-3, pp. 37 - 44
Watanabe I, Keno M, Sawada H., 1989, Effect of bow flare on shape to wave loads of a container
ship. Journal of Society of Naval Architects Japan, 1989, 166, pp. 259–266
Zhu, S., Moan, T., 2013, New insight into the wave-induced nonlinear vertical load effects of ultra-
large container ships based on experiments, Journal of Marine Science and Tecnology, Vol. 18,
2013, pp. 87 – 114, DOI 10.1007/s00773-012-0186-x
Zhu, S., Moan, T., 2014, Nonlinear effects from wave-induced maximum vertical bending moment
on a flexible ultra-large containership model in severe head and oblique seas, Marine Structures,
Vol. 35, Jan 2014, pp. 1 – 25,
ITTC – Recommended Procedures and Guidelines, 2011, Numerical Estimation of Roll Damping,
7.5-02-07-04.5
Figure 1. DTMB 5415 model, positions of bulkheads and load cell
Figure 2a. Detail – damage compartment
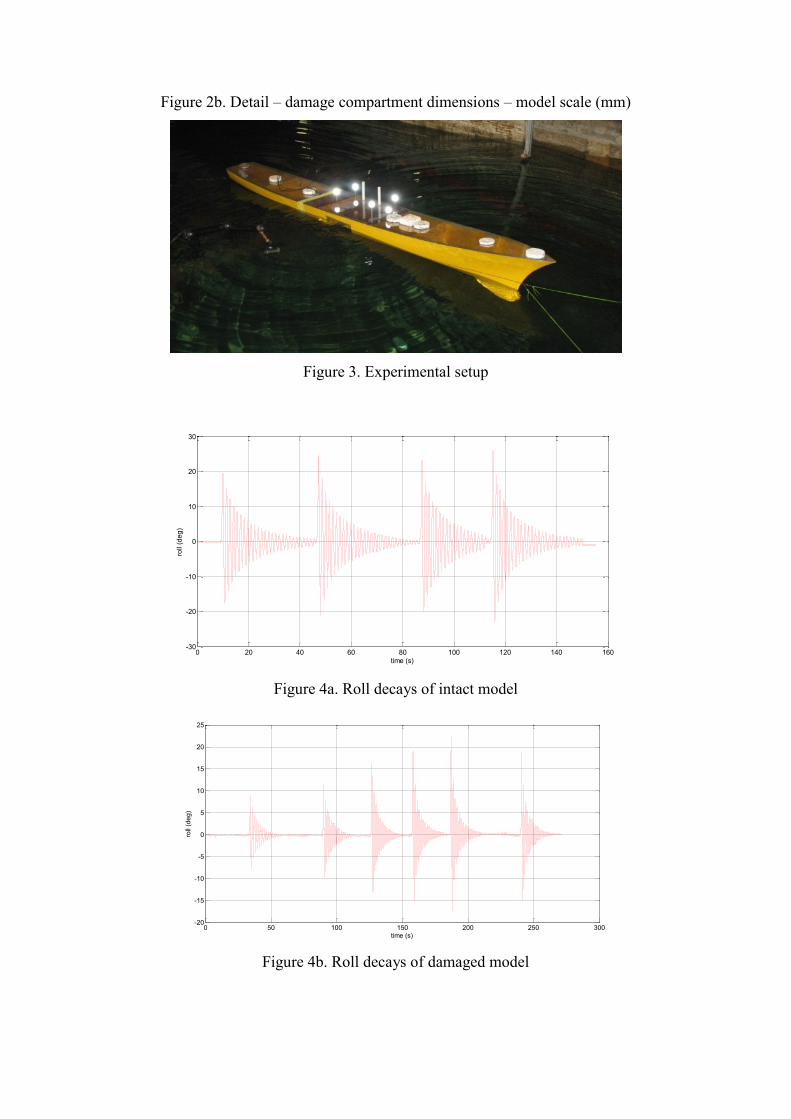
Figure 2b. Detail – damage compartment dimensions – model scale (mm)
Figure 3. Experimental setup
0 20 40 60 80 100 120 140 160-30
-20
-10
0
10
20
30
time (s)
roll
(de
g)
Figure 4a. Roll decays of intact model
0 50 100 150 200 250 300-20
-15
-10
-5
0
5
10
15
20
25
time (s)
roll
(de
g)
Figure 4b. Roll decays of damaged model
aEQ-INTACT = 0.2194fMEAN + 0.0599
R² = 0.3438
0
0.02
0.04
0.06
0.08
0.1
0.12
0.14
0.16
0.18
0.2
0.00 0.05 0.10 0.15 0.20 0.25 0.30 0.35
ln(abs((fi /fi+1))/(ti+1/ti)
Mean Amplitude fMEAN (rad)
INTACT DTMB 5415 ROLL DECAY ANALYSIS
Figure 5a. Roll decay coefficients analysis – Intact model
aEQ-DAMAGED = 0.3575fMEAN + 0.1349
R² = 0.2942
0
0.05
0.1
0.15
0.2
0.25
0.3
0.00 0.05 0.10 0.15 0.20
ln(abs(fi/fi+1))/(ti+1-ti)
Mean Amplitude fMEAN (rad)
DAMAGED DTMB 5415 ROLL DECAY ANALYSIS
Figure 5b. Roll decay coefficients analysis – Damaged model
0 5 10 15 20 25 30-30
-20
-10
0
10
20
30
time
Am
plit
ude (
deg)
Roll series Vs Time
Runge Kutta
experimental
0 2 4 6 8 10 12 14 16-15
-10
-5
0
5
10
15
20
time
Am
plit
ude (
deg)
Roll series Vs Time
Runge Kutta
experimental
Figure 6. Prediction of roll decay by equivalent roll damping coefficients for intact (upper) and
damaged (lower) model
0
1
2
3
4
5
6
7
8
5 6 7 8 9 10 11 12 13 14 15
h4 / kA
Incident wave period (s)
Roll RAO for intact and damaged ship_free drifting
Roll_Intact
Roll_Damaged
Figure 7. Roll motion of intact and damaged ship
0
1
2
3
4
5
6
7
8
5 6 7 8 9 10 11 12 13 14 15
h4 / kA
Incident wave period (s)
Restrained vs. free drift set upBeam sea, Intact ship
Roll_Free Drift
Roll_Restrained
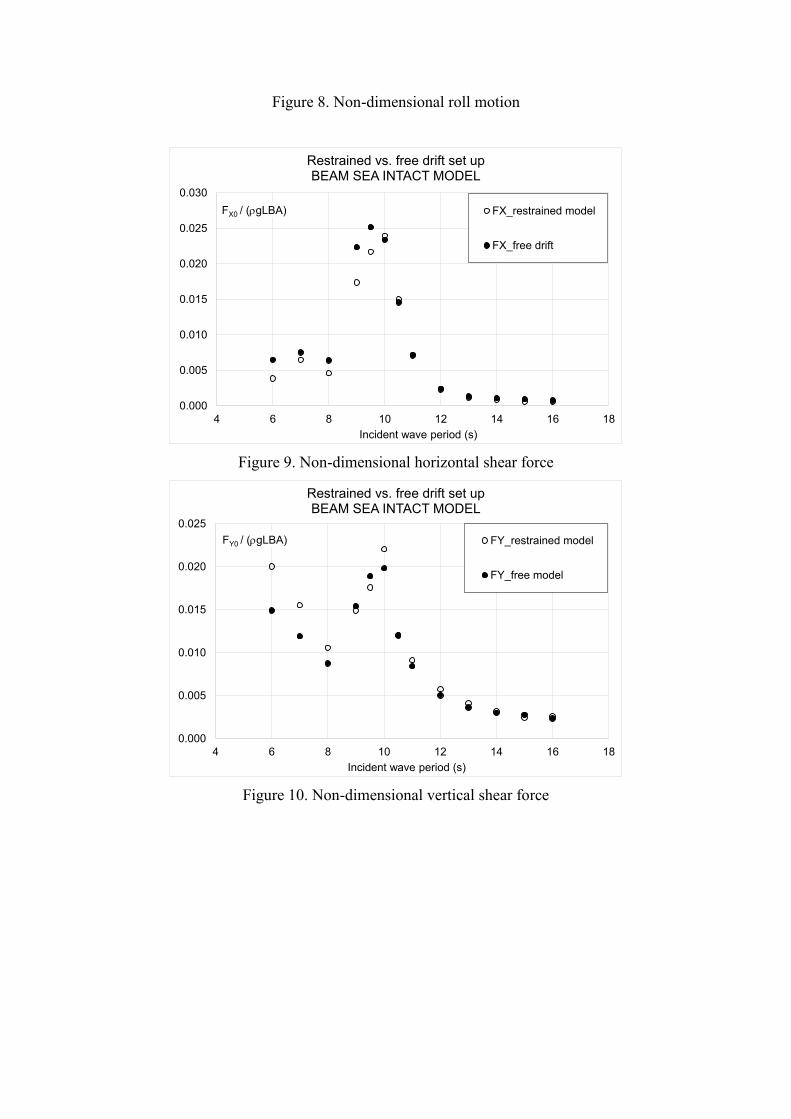
Figure 8. Non-dimensional roll motion
0.000
0.005
0.010
0.015
0.020
0.025
0.030
4 6 8 10 12 14 16 18
FX0 / (rgLBA)
Incident wave period (s)
Restrained vs. free drift set upBEAM SEA INTACT MODEL
FX_restrained model
FX_free drift
Figure 9. Non-dimensional horizontal shear force
0.000
0.005
0.010
0.015
0.020
0.025
4 6 8 10 12 14 16 18
FY0 / (rgLBA)
Incident wave period (s)
Restrained vs. free drift set up BEAM SEA INTACT MODEL
FY_restrained model
FY_free model
Figure 10. Non-dimensional vertical shear force
0.000
0.002
0.004
0.006
0.008
0.010
0.012
4 6 8 10 12 14 16 18
MY0 / (rgL2BA)
Incident wave period (s)
Restrained vs. free drift set upBEAM SEA INTACT MODEL
MY_restrained model
MY_free drift
Figure 11. Non-dimensional horizontal bending moment
0.000
0.001
0.002
0.003
0.004
0.005
4 6 8 10 12 14 16 18
MX0 / (rgL2BA)
Incident wave period (s)
Restrained vs. free drift set upBEAM SEA INTACT MODEL
MX_restrained model
MX_free drift
Figure 12. Non-dimensional vertical bending moment
0.000
0.001
0.002
0.003
0.004
0.005
0.006
4 6 8 10 12 14 16 18
MZ0 / (rgL2BA)
Incident wave period (s)
Restrained vs. free drift set up BEAM SEA INTACT MODEL
MZ_restrained model
MZ_free model
Figure 13. Non-dimensional torsional moment
0.0
0.2
0.4
0.6
0.8
1.0
1.2
5 6 7 8 9 10 11 12 13 14 15
h3 / A
Incident wave period (s)
INTACT SHIP - HEAD SEA
Heave_2013
Heave_2015
Uncertainty analysis_2015
Figure 14. Repeatability of heave
0.0
0.2
0.4
0.6
0.8
1.0
1.2
5 6 7 8 9 10 11 12 13 14 15
h5 / kA
Incident wave period (s)
INTACT SHIP - HEAD SEA
Pitch_2013
Pitch_2015
Uncertainty analysis_2015
Figure 15. Repeatability of pitch
0
1
2
3
4
5
6
7
8
5 6 7 8 9 10 11 12 13 14 15
h4 / kA
Incident wave period (s)
INTACT SHIP - BEAM SEA
Roll_2013
Roll_2015
Figure 16. Repeatability of roll – free drift set up
0.0
0.2
0.4
0.6
0.8
1.0
1.2
5 6 7 8 9 10 11 12 13 14 15
h3 / A
Incident wave period (s)
DAMAGED SHIP - HEAD SEA
Heave_2013
Heave_2015
Uncertainty analysis_2015
Figure 17. Repeatability of heave – damaged ship
0.0
0.2
0.4
0.6
0.8
1.0
1.2
5 6 7 8 9 10 11 12 13 14 15
h5 / kA
Incident wave period (s)
DAMAGED SHIP - HEAD SEA
Pitch_2013
Pitch_2015
Uncertainty analysis_2015
Figure 18. Repeatability of pitch – damaged ship
0
1
2
3
4
5
6
5 6 7 8 9 10 11 12 13 14 15
h4 / kA
Incident wave period (s)
DAMAGED SHIP - HEAD SEA
Roll_2013
Roll_2015
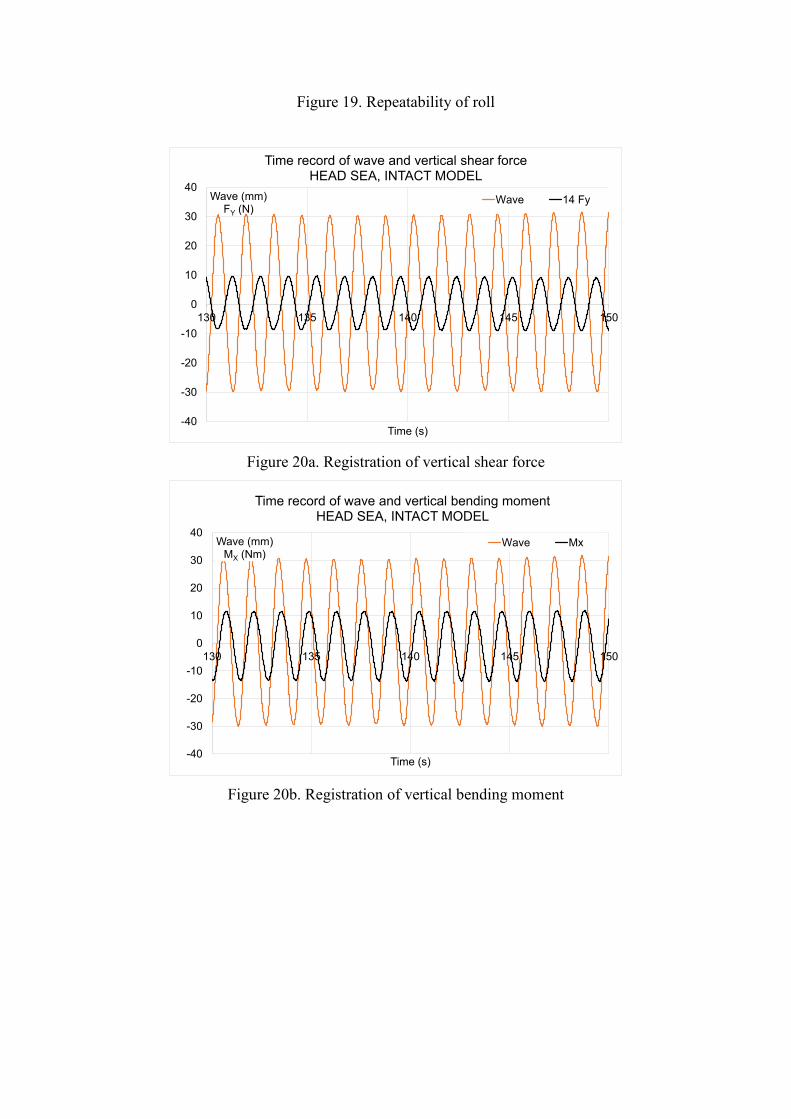
Figure 19. Repeatability of roll
-40
-30
-20
-10
0
10
20
30
40
130 135 140 145 150
Wave (mm)FY (N)
Time (s)
Time record of wave and vertical shear force HEAD SEA, INTACT MODEL
Wave 14 Fy
Figure 20a. Registration of vertical shear force
-40
-30
-20
-10
0
10
20
30
40
130 135 140 145 150
Wave (mm)MX (Nm)
Time (s)
Time record of wave and vertical bending momentHEAD SEA, INTACT MODEL
Wave Mx
Figure 20b. Registration of vertical bending moment
0.000
0.010
0.020
0.030
0.040
0.050
0.060
4 6 8 10 12 14 16 18
VSF0 / (rgLBA)
Incident wave period (s)
INTACT Vs. DAMAGED NONDIMENSIONAL VERTICAL SHEAR FORCE
Intact
Damaged
Figure 21. Non-dimensional vertical shear force- intact vs. damaged ship in head sea
0.000
0.002
0.004
0.006
0.008
0.010
0.012
0.014
0.016
4 6 8 10 12 14 16 18
M0-SAG / (rgL2BA)
Incident wave period (s)
INTACT Vs. DAMAGED SAG RAO
SAG_Intact
SAG_Damaged
Figure 22. Non-dimensional vertical bending moment Sagging- intact vs. damaged ship in head sea
-0.016
-0.014
-0.012
-0.010
-0.008
-0.006
-0.004
-0.002
0.000
4 6 8 10 12 14 16 18
M0-HOG / (rgL2BA)
Incident wave period (s)
INTACT Vs. DAMAGED HOG RAO
HOG_Intact
HOG_Damaged
Figure 23. Non-dimensional vertical bending moment Hogging- intact vs. damaged ship in head sea
0.000
0.005
0.010
0.015
0.020
0.025
0.030
4 6 8 10 12 14 16 18
HSF0 / (rgLBA)
Incident wave period (s)
NONDIMENSIONAL HORIZONTAL SHEAR FORCE IN BEAM SEA
FX_intact
FX_damaged
Figure 24. Non-dimensional horizontal shear force intact vs. damaged ship in beam sea
0.000
0.005
0.010
0.015
0.020
0.025
4 6 8 10 12 14 16 18
VSF0 / (rgLBA)
Incident wave period (s)
NONDIMENSIONAL VERTICAL SHEAR FORCE IN BEAM SEA
FY_intact
FY_damaged
Figure 25. Non-dimensional vertical shear force intact vs. damaged ship in beam sea
0.000
0.002
0.004
0.006
0.008
0.010
0.012
4 6 8 10 12 14 16 18
HBM0 / (rgL2BA)
Incident wave period (s)
NONDIMENSIONAL HORIZONTAL BENDING MOMENT IN BEAM SEA
MY_intact
MY_damaged
Figure 26. Non-dimensional horizontal bending moment - intact vs. damaged ship
0.0000
0.0005
0.0010
0.0015
0.0020
0.0025
0.0030
0.0035
4 6 8 10 12 14 16 18
M0-SAG / (rgL2BA)
Incident wave period (s)
NONDIMENSIONAL VERTICAL BENDING MOMENT IN BEAM SEA
MX_intact
MX_damaged
Figure 27. Non-dimensional vertical bending moment - intact vs. damaged ship
0.000
0.001
0.002
0.003
0.004
0.005
0.006
4 6 8 10 12 14 16 18
TM0 / (rgL2BA)
Incident wave period (s)
NONDIMENSIONAL TORSIONAL MOMENT IN BEAM SEA
Mz_intact
MZ_damaged
Figure 28. Non-dimensional torsional moment - intact vs. damaged ship
-30
-20
-10
0
10
20
30
0 2 4 6 8 10
Fy (N)
Time (s)
Vertical shear force for different wave amplitudesHead sea, Tw = 10s
VSF_H/lwave=1/50 VSF_H/lwave=1/40
VSF_H/lwave=1/28 VSF_H/lwave=1/22
Figure 29. Time history of shear force for different wave amplitudes for intact model in head sea,
wave period = 10s
-40
-30
-20
-10
0
10
20
30
0 2 4 6 8 10
MX (Nm)
Time (s)
Vertical bending moment for different wave amplitudesHead sea, Tw = 10s
VBM_H/lwave=1/50 VBM_H/lwave=1/40VBM_H/lwave=1/28 VBM_H/lwave=1/22
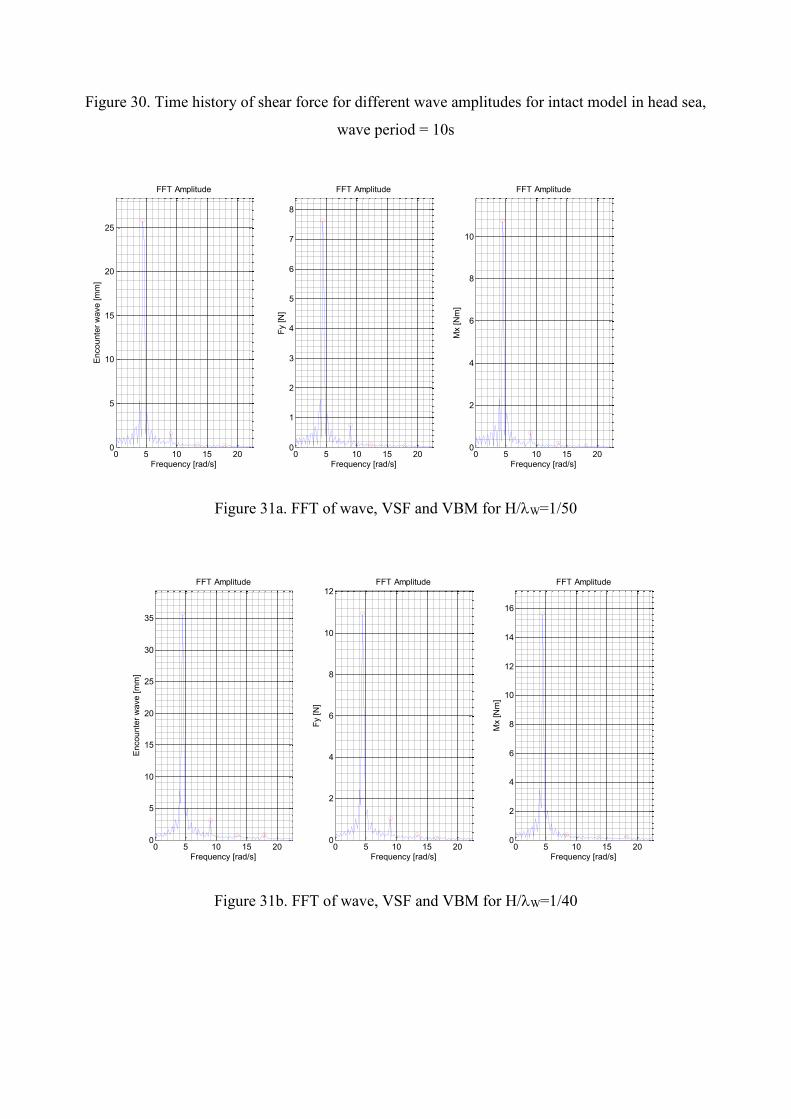
Figure 30. Time history of shear force for different wave amplitudes for intact model in head sea,
wave period = 10s
0 5 10 15 200
5
10
15
20
25
Frequency [rad/s]
En
co
unte
r w
ave [
mm
]
FFT Amplitude
0 5 10 15 200
1
2
3
4
5
6
7
8
Frequency [rad/s]
Fy [N
]
FFT Amplitude
0 5 10 15 200
2
4
6
8
10
Frequency [rad/s]M
x [N
m]
FFT Amplitude
Figure 31a. FFT of wave, VSF and VBM for H/W=1/50
0 5 10 15 200
5
10
15
20
25
30
35
Frequency [rad/s]
En
co
unte
r w
ave [
mm
]
FFT Amplitude
0 5 10 15 200
2
4
6
8
10
12
Frequency [rad/s]
Fy [N
]
FFT Amplitude
0 5 10 15 200
2
4
6
8
10
12
14
16
Frequency [rad/s]
Mx [N
m]
FFT Amplitude
Figure 31b. FFT of wave, VSF and VBM for H/W=1/40
0 5 10 15 200
5
10
15
20
25
30
35
40
45
50
Frequency [rad/s]
En
co
unte
r w
ave [
mm
]
FFT Amplitude
0 5 10 15 200
2
4
6
8
10
12
14
16
Frequency [rad/s]
Fy [N
]
FFT Amplitude
0 5 10 15 200
5
10
15
20
Frequency [rad/s]
Mx [N
m]
FFT Amplitude
Figure 31c. FFT of wave, VSF and VBM for H/W=1/28
0 5 10 15 200
10
20
30
40
50
60
Frequency [rad/s]
En
co
unte
r w
ave [
mm
]
FFT Amplitude
0 5 10 15 200
2
4
6
8
10
12
14
16
18
Frequency [rad/s]
Fy [N
]
FFT Amplitude
0 5 10 15 200
5
10
15
20
25
Frequency [rad/s]
Mx [N
m]
FFT Amplitude
Figure 31d. FFT of wave, VSF and VBM for H/W=1/22
0.000
0.005
0.010
0.015
0.020
0.025
0.030
0.035
0.040
4 6 8 10 12 14 16 18
VSF0 / (rgLBA)
Incident wave period (s)
Amplitude variation effect on vertical shear force in head sea, intact model
VSF
AMPLITUDE_VARIATION
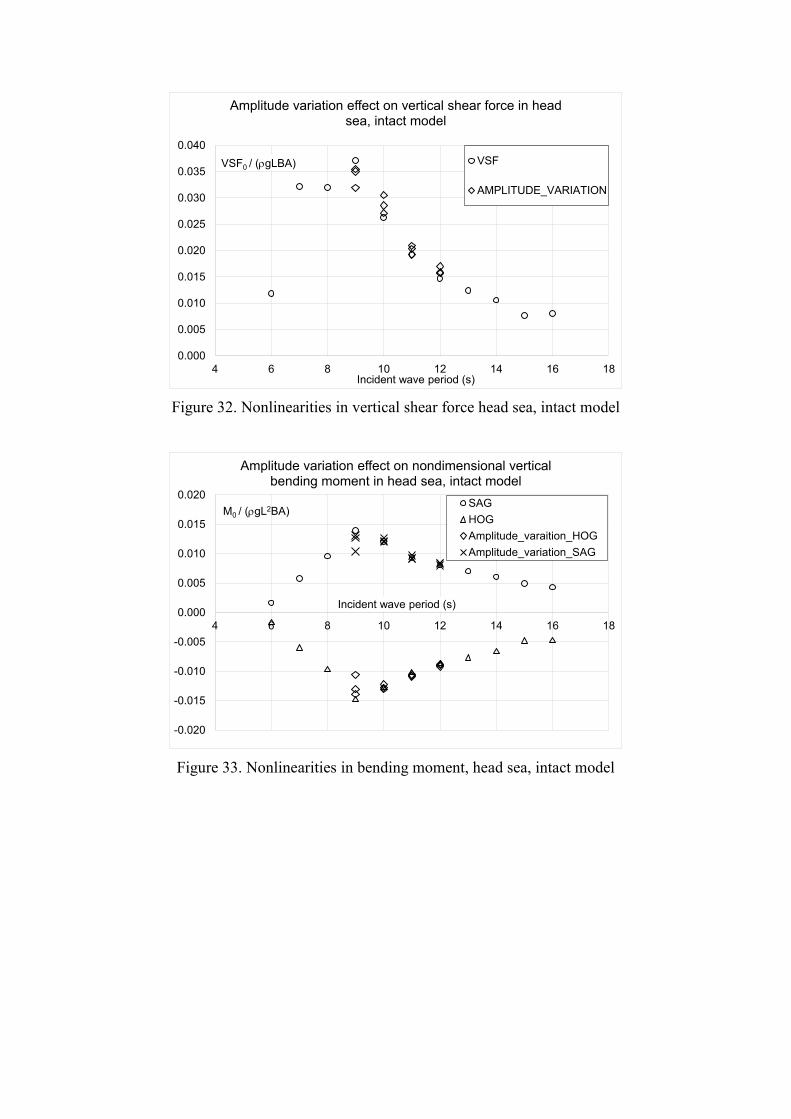
Figure 32. Nonlinearities in vertical shear force head sea, intact model
-0.020
-0.015
-0.010
-0.005
0.000
0.005
0.010
0.015
0.020
4 6 8 10 12 14 16 18
M0 / (rgL2BA)
Incident wave period (s)
Amplitude variation effect on nondimensional vertical bending moment in head sea, intact model
SAG
HOG
Amplitude_varaition_HOG
Amplitude_variation_SAG
Figure 33. Nonlinearities in bending moment, head sea, intact model
0.000
0.010
0.020
0.030
0.040
0.050
0.060
4 6 8 10 12 14 16 18
VSF0 / (rgLBA)
Incident wave period (s)
Amplitude variation effect on vertical shear force in head sea, damaged model
VSF
AMPLITUDE_VARIATION
UA_2015
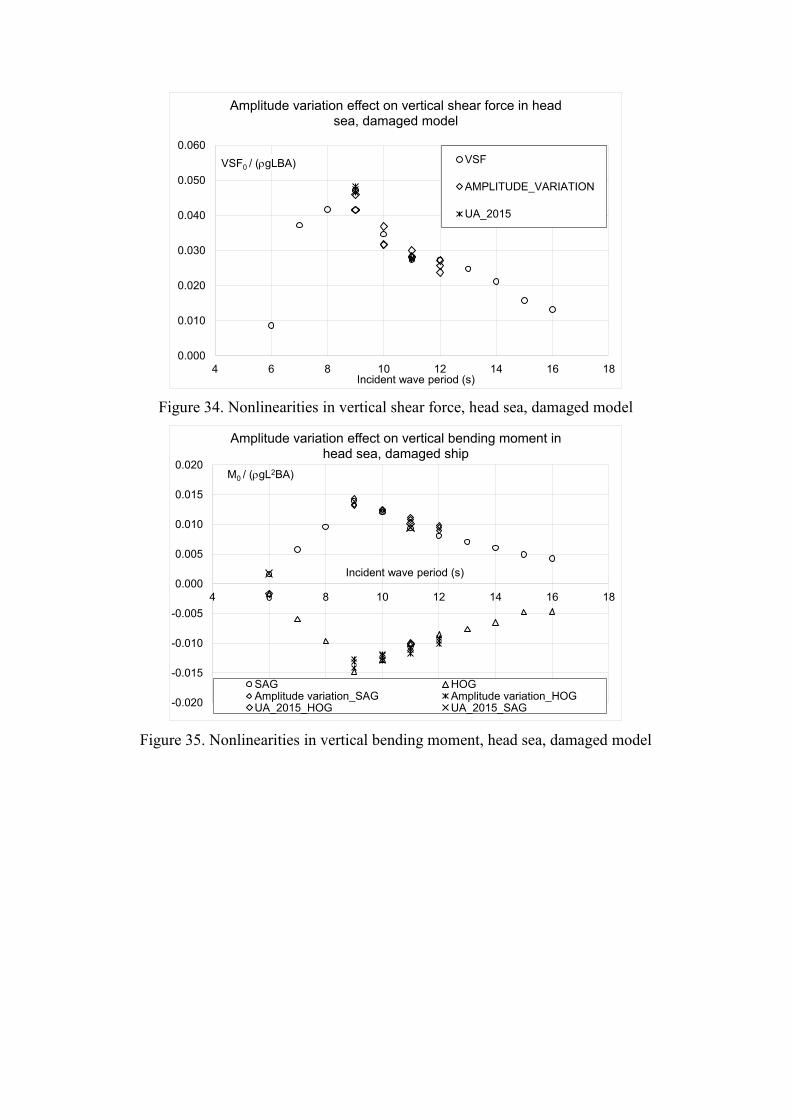
Figure 34. Nonlinearities in vertical shear force, head sea, damaged model
-0.020
-0.015
-0.010
-0.005
0.000
0.005
0.010
0.015
0.020
4 6 8 10 12 14 16 18
M0 / (rgL2BA)
Incident wave period (s)
Amplitude variation effect on vertical bending moment in head sea, damaged ship
SAG HOGAmplitude variation_SAG Amplitude variation_HOGUA_2015_HOG UA_2015_SAG
Figure 35. Nonlinearities in vertical bending moment, head sea, damaged model
0.000
0.005
0.010
0.015
0.020
0.025
0.030
0.035
4 6 8 10 12 14 16 18
HSF0 / (rgLBA)
Incident wave period (s)
Amplitude variation effect on horizontal shear force in beam sea, intact model
HSF
AMPLITUDE_VARIATION
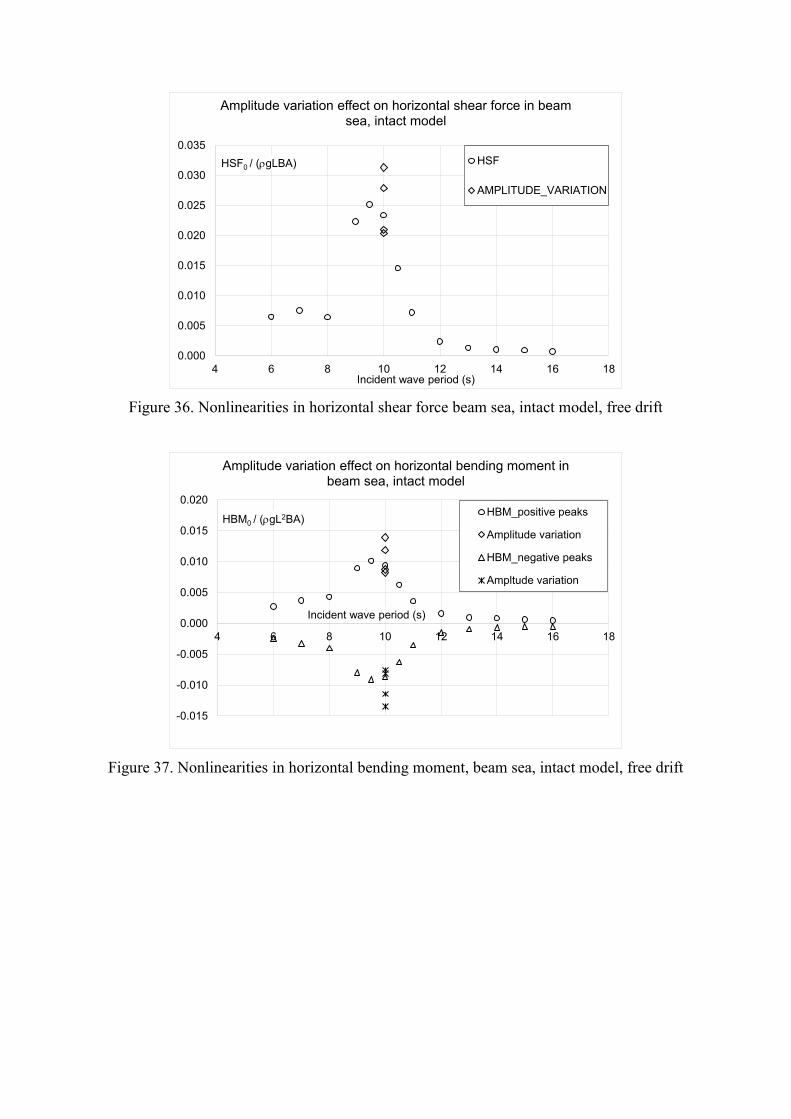
Figure 36. Nonlinearities in horizontal shear force beam sea, intact model, free drift
-0.015
-0.010
-0.005
0.000
0.005
0.010
0.015
0.020
4 6 8 10 12 14 16 18
HBM0 / (rgL2BA)
Incident wave period (s)
Amplitude variation effect on horizontal bending moment in beam sea, intact model
HBM_positive peaks
Amplitude variation
HBM_negative peaks
Ampltude variation
Figure 37. Nonlinearities in horizontal bending moment, beam sea, intact model, free drift
0.000
0.005
0.010
0.015
0.020
0.025
0.030
0.035
0.040
0.045
0.050
4 6 8 10 12 14 16 18 20
VSF/rgLBA
Incident wave period (s)
Non-dimensional VSF for intact model in head sea
current study
Begovic et al_2011
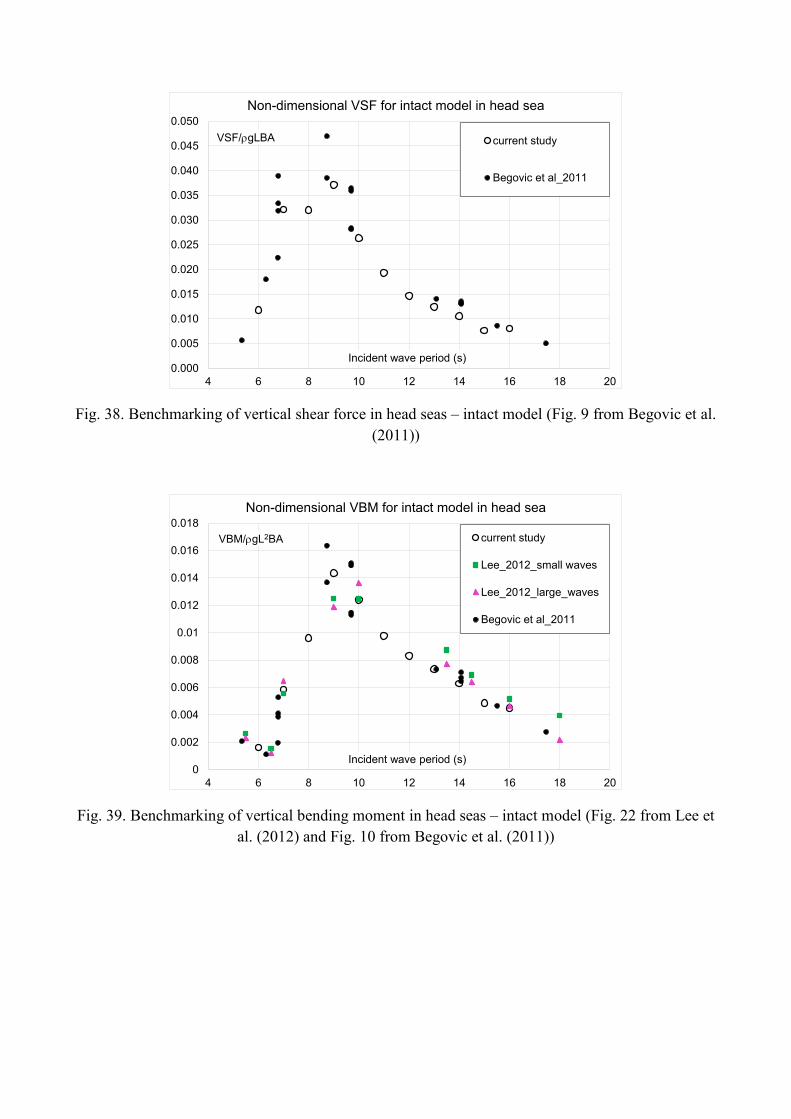
Fig. 38. Benchmarking of vertical shear force in head seas – intact model (Fig. 9 from Begovic et al.
(2011))
0
0.002
0.004
0.006
0.008
0.01
0.012
0.014
0.016
0.018
4 6 8 10 12 14 16 18 20
VBM/rgL2BA
Incident wave period (s)
Non-dimensional VBM for intact model in head sea
current study
Lee_2012_small waves
Lee_2012_large_waves
Begovic et al_2011
Fig. 39. Benchmarking of vertical bending moment in head seas – intact model (Fig. 22 from Lee et
al. (2012) and Fig. 10 from Begovic et al. (2011))
0
0.0005
0.001
0.0015
0.002
0.0025
0.003
0.0035
0.004
0.0045
0.005
4 6 8 10 12 14 16 18 20
VBM/rgL2BA
Incident wave period (s)
Non-dimensional VBM for intact model in beam sea
current study
Lee_2012_small waves
Lee_2012_large_waves
Fig. 40. Benchmarking of vertical bending moment in beam seas – intact model (Fig. 24 from Lee
et al. (2012))
0.0000
0.0050
0.0100
0.0150
0.0200
0.0250
4 6 8 10 12 14 16 18 20
HBM/rgL2BA
Incident wave period (s)
Non-dimensional HBM for intact model in beam sea
current study
Begovic_et_al_2011
Fig. 41. Benchmarking of horizontal bending moment in beam seas – intact model (Fig. 14 from
Begovic et al. (2011))
0.000
0.010
0.020
0.030
0.040
0.050
0.060
0.070
0.080
4 6 8 10 12 14 16 18 20
VSF/rgLBA
Incident wave period (s)
Non-dimensional VSF for damaged model in head sea
current study
Lee_2012_small waves
Lee_2012_large_waves
Begovic_et_al_2011
Fig. 42. Benchmarking of vertical shear force in head seas – damaged model (Fig. 25 from Lee et
al. (2012), Fig. 17 from Begovic et al (2011))
0.0000
0.0005
0.0010
0.0015
0.0020
0.0025
4 6 8 10 12 14 16 18 20
TM/rgL2BA
Incident wave period (s)
Non-dimensional TM for damaged model in head sea
current study
Lee_2012_small waves
Lee_2012_large_waves
Begovic_et_al_2011
Fig. 43. Benchmarking of torsional moment in head seas – damaged model (Fig. 26 from Lee et al.
(2012))
0.000
0.002
0.004
0.006
0.008
0.010
0.012
0.014
0.016
0.018
0.020
4 6 8 10 12 14 16 18 20
VBM/rgL2BA
Incident wave period (s)
Non-dimensional VBM for damaged model in head sea
current study
Lee_2012_small waves
Lee_2012_large_waves
Begovic_et_al_2011
Fig. 44. Benchmarking of vertical bending moment in head seas – damaged model (Fig. 27 from
Lee et al. (2012), Fig. 18 from Begovic et al (2011))
0.0000
0.0010
0.0020
0.0030
0.0040
0.0050
4 6 8 10 12 14 16 18 20
TM/rgL2BA
Incident wave period (s)
Non-dimensional TM for damaged model in beam sea
current study
Lee_2012_small waves
Lee_2012_large_waves
Begovic_et_al_2011
Fig. 45. Benchmarking of torsional bending moment in beam seas – damaged model (Fig. 34 from
Lee et al. (2012), Fig. 21 from Begovic et al (2011))
0.000
0.001
0.002
0.003
0.004
0.005
0.006
0.007
4 6 8 10 12 14 16 18 20
HBM/rgL2BA
Incident wave period (s)
Non-dimensional HBM for damaged model in beam sea
current study
Lee_2012_small waves
Lee_2012_large_waves
Begovic_et al_2011
Fig. 46. Benchmarking of horizontal bending moment in beam seas – damaged model (Fig. 36 from
Lee et al. (2012))