Embed Size (px)
Citation preview

An Experimental Study on Ultimate Bearing Capacity
of a Foundation in Anisotropic Rock Masses
Ajay Bindlish1
Mahendra Singh2*
N. K. Samadhiya2
1Civil Engineering Dept.
University College of Engineering
Rajasthan Technical University
Kota – 324 010 (India)
E-mail: [email protected]
2Civil Engineering Dept.
IIT Roorkee, Roorkee – 247 667 (India)
*E-mail of Corresponding Author: [email protected]
ABSTRACT
Rock Masses encountered beneath the foundations of heavy civil engineering structures
are generally jointed and anisotropic in mechanical behavior. General approach to
estimate the bearing capacity of shallow foundations in such rock masses is to consider
the rock mass an isotropic continuum. Very few studies are reported in literature which
consider the anisotropy in bearing capacity computations. Probably, the only
methodologies suggested for anisotropic rock masses are those proposed by Prakoso
and Kulhaway (2004), and, Singh and Rao (2005). Singh and Rao (2005) approach was
derived from the outcome of experimental studies comprising uniaxial and triaxial tests
on specimens of jointed model of plaster of Paris (POP). The approach considers four
fold failure mechanism namely rotation of blocks, shearing of blocks, tensile splitting
of intact rocks and sliding along the existing joint. However, no experimental or field
investigation is available to validate the four fold mechanism assumed by Singh and
Rao (2005). In the present study, an attempt has been made to investigate the failure
mechanism of jointed blocky rock mass below shallow foundations through bearing
capacity tests under plane strain conditions. Plaster of Paris has been used as a model
material to simulate the intact rock material. Specimens of rock mass, having various
joint configurations were assembled using plaster of Paris blocks. Broadly the jointed
rock mass specimens were divided into two categories. Type-A specimens comprised
of a set of continuous joints orthogonal to each other. The type-B specimens used
staggered joints. The orientation of joints was varied from 0ο to 90ο for both the
specimen types. A footing plate was placed on the top of the mass and was loaded up to
the bearing capacity failure. The results on failure modes, anisotropy in bearing
capacity and settlements are presented in this paper.
Keywords: Bearing capacity; Jointed rock mass; Anisotropic; Discontinuities; Joints

1. INTRODUCTION
A correct understanding of failure mechanism is essential for computing bearing capacity
while designing heavy structures like dams, bridge piers, tall buildings founded on rocks.
The rocks are invariably intersected by discontinuities like weak planes and joints. Due to
the presence of these discontinuities, the rock mass become weak and anisotropic making it
more complex to analyse. The ultimate bearing capacity of shallow foundations in such
rocks is not solely governed by characteristics of the homogeneous and isotropic rock
material but also depends on the characteristics of the joints and bedding planes, which
form the rock foundation. A foundation on rock should, therefore, be designed with much
care than a foundation on soil. Traditionally, rock masses have been considered to be
isotropic continuum until recently when few studies recognized the medium to be
anisotropic (Prakoso and Kulhaway, 2004 and Singh and Rao, 2005). Singh and Rao
(2005) explicitly recognized the importance of anisotropic behaviour of jointed rocks and
suggested a methodology for computing bearing capacity of shallow foundations placed in
non Hoek-Brown rock mass. The methodology has been derived from results of tests
conducted on intact and jointed rocks under uniaxial and triaxial stress conditions. The
methodology assumed a four fold failure mechanism and uses Bell’s approach to arrive at
ultimate bearing capacity of the foundation. Though the approach has been derived from
extensive tests, no validation has been carried out so far either in laboratory or in field to
assess the applicability of this approach. It was therefore felt essential to experimentally
investigate the behavior of foundation on rock mass containing joint sets which render
anisotropy to its engineering response. The objective of the study has been to investigate
the failure mechanism and anisotropy in ultimate bearing capacity of jointed blocky rock
mass through physical model tests.
2. HOEK-BROWN AND NON HOEK-BROWN ROCK MASSES
A rock mass is termed to be Hoek-Brown medium if it is heavily jointed and is isotropic in
engineering response. A rock mass, therefore, can be treated as a Hoek-Brown material
(Hoek, 2000), if (a) the block size is small in comparison to the structure being analyzed,
(b) sufficient numbers of closely spaced joints are there in the rock mass (c) surface
characteristics of all the joints are similar and none of the joint sets is significantly weaker
than the others. Theories defined for soils may be conveniently used for determining
ultimate bearing capacity in such cases.
A non Hoek-Brown medium is referred to as a natural anisotropic jointed rock mass with
the foundation-width large as compared to the joint spacing, but the number of joint sets is
not large enough to make it isotropic in strength behavior. Also the joints may not have
similar surface characteristics. The conventional soil mechanics theories are not applicable
in such rocks and a different approach is required. Singh and Rao (2005) approach was
suggested to handle bearing capacity problems in these rocks.
3. EXPERIMENTAL PROGRAMME
Physical model tests are one of the best ways to understand the mechanism of failure of
jointed rock masses. The following carefully planned experimental programme was
executed to achieve the objective of the study (Bindlish, 2007):
Design and fabrication of a bearing capacity test apparatus for testing the model
specimens in plane strain conditions.

Selection and characterization of a suitable model material which should represent
the characteristics of rock.
Preparation and testing of Type-A rock mass specimen (Fig. 1). The rock mass
specimens had two orthogonal sets of intersecting joints. The joint spacing is
25mm.
Preparation and testing of Type-B rock mass specimen (Fig. 2). The joint set-I was
continuous while the joint set-II was stepped. The stepping introduces interlocking
in the rock mass. The stepping s = 0.5b, where b is the width of the block.
A 25 mm thick steel plate of size 150 mm x 150 mm was placed at the centre of
the top of the specimen to apply the vertical load on the prepared specimens.
The vertical load and resulting vertical displacement were recorded during testing
of the specimen.
The mode of failure of each specimen was also recorded.
The summary of the testing programme is shown in Fig. 3.
Fig. 1 - Blocky rock mass specimen
having two continuous joint set
(Type-A specimen, s = 0, 90o)
Fig. 2 - Blocky rock mass specimen
having stepped joint set
(Type-B specimen, s = 0.5b, 90o)
3.1 Model Material and Its Characterization
For ease of working and reproducibility of results, model materials have been used
extensively by various investigators in rock mechanics studies (Goldstein et al., 1966,
Hayashi, 1966, Brown, 1970a,b, Brown and Trollop, 1970, Walker, 1971, Ladanyi and
Archambault (1972), Einstein and Hirschfeld, 1973, Lama, 1974, Baoshu et al., 1986,
Yang and Huang, 1995, Singh, 1997, Yang and Chiang, 2000 and Agrawal, 2005).
Rock mass specimens of model material allow for better control on parameters such as
intact rock strength, joint spacing, joint inclination and joint strength. A prerequisite for
a study undertaken herein is that the material and joint properties should be repeatable

and controllable. The choice was therefore made to use model material rather than
natural rock.
Plaster of Paris (POP) mixed with medium sand, passing through 1mm and retained on
425 micron IS sieve, was adopted as the model material for the present study. Trial
specimens (diameter 38 mm and height 76 mm) were prepared by selecting different
proportions of POP, sand and water. These trial specimens were air cured for 7 to 14
days and then tested in uniaxial compression. A mix proportion of 1(POP): 1.25(sand):
0.60(water) by weight was finally adopted, which, after 14 days of air curing was found
to give the uniaxial compressive strength ci, 7.0 MPa. The material is classified as EM
as per Deere-Miller (1966) classification for intact rocks. As the UCS became nearly
constant after 14 days of air curing, a curing period of 14 days was adopted.
Testing Programme
Material Characterization Bearing capacity tests
Specimens with two joint sets
(Type-A and B specimens) Physical
properties
Engineering
properties
Type-A
specimens
Type-B
specimens
θ = 0o 15
o 30
o 45
o θ = 0
o 15
o 30
o 45
o 60
o 75
o 90
o
Fig. 3 - Summary of the testing programme
The physical properties of the model material were obtained as per the suggested
methods of ISRM (1981). However, the uniaxial and triaxial strength tests were
conducted on cylindrical cores of 38 mm diameter and 76 mm height. Triaxial tests
were conducted at confining pressures equal to 0.5, 1.0, 1.5 and 2.0 MPa respectively to
obtain the shear strength parameters of the intact material. The tensile strength was
obtained from Brazilian tests. The cohesion cj and friction angle of the joints, j were
obtained by conducting conventional direct shear tests along the mating surfaces of the
blocks of size 6cm x 6cm x 1.5cm under low normal stress range of 50, 100, 150, 200,
250, 300, 350 and 400 kPa, respectively. The properties of the model material are
presented in Table 1.
3.2 Specimen Description
3.2.1 Type-A specimens
The jointed blocky mass specimens consisted of two sets of intersecting orthogonal

joints (Fig 1). Both the joint sets were continuous. The joints in set-I were inclined at an
angle θo with the horizontal. The angle ‘θ’ has been varied from 0o to 90o at an interval
of 15o. The joint configuration of the specimen is designated as 0o/90o, 15o/75o, 30o/60o
and 45o/45o, respectively.
Table 1 - Physical and engineering properties of the model material
Property Value
Dry unit weight, d (kN/m3) 16.0
Specific gravity, G 2.77
Uniaxial Compressive Strength, ci (MPa) 7.00
Failure strain, f (%) 0.50
Tangent modulus, Et50 (MPa) 2400
Brazilian strength , ti (MPa) 1.31
Friction angle of joint, j (degree) 39.0
Friction angle of intact model material, i (degree) 33.0
Cohesion of intact model material, ci (MPa) 2.1
Deere-Miller (1966) classification EM
3.2.2 Type-B specimens
The specimens again consisted of two sets of intersecting orthogonal joints. The joint
set-I having inclination θo with the horizontal was continuous while joint set-II was
stepped (Fig. 2). The angle ‘θ’ was varied from 0o to 90o at an interval of 15o. The
joints in the set-II were stepped at stepping ‘s’ equal to half the width of elemental
block. The joint configurations tested were 0o/90o, 15o/75o, 30o/60o and 45o/45o,
respectively.
3.3 Equipment Used
To test the blocky rock mass specimens of size 750mm x 750mm x 150mm under plane
strain condition, a large size bearing capacity test apparatus was designed and
fabricated in the Geotechnical Engineering Laboratory at IIT Roorkee. The apparatus
consists of the following parts:
Loading frame of 1000 kN capacity,
Arrangement for applying plane strain conditions,
Arrangement for applying vertical load, and
Arrangement for measuring settlements.
3.3.1 Loading frame of 1000 kN capacity
A loading frame of 1000 kN capacity was fabricated using 20 mm thick steel plates.
The frame has been designed so as to keep the plane strain apparatus in between the
pillars of the loading frame. The diameter of the pillars used is 100 mm. The bottom

plate of the frame is fixed whereas the upper plate is movable to adjust the space
required for placing plane strain apparatus, hydraulic jack and proving ring.
3.3.2 Arrangement for applying plane strain conditions
The plane strain box was fabricated using 10 mm thick mild steel plates on three sides
while the front of the box was made from perspex sheet to allow viewing of the
mechanism and failure process occurring within the specimen during testing. The
Perspex sheet was properly braced by steel angles (stiffeners) so that the displacement
and hence the strain in the z-direction is restricted. Similar stiffening was done on the
opposite side steel plate. The rock mass specimens were assembled in the plane strain
apparatus itself. The top of the box was kept open for applying the vertical load. A 25
mm thick steel test plate of size 150 x 150mm, which simulates a footing, was placed at
centre of the top of the specimen.
3.3.3 Arrangement for applying vertical load
The vertical load on the test plate was applied through a hydraulic jack by taking
reaction from loading frame. A proving ring was placed between the hydraulic jack and
upper plate of the loading frame to measure vertical load.
3.3.4 Arrangement for measuring settlement
A steel strip was fixed between the back pillars of the loading frame with the help of
the clamps. The magnetic bases of all the dial gauges were placed on this plate. To
measure vertical settlements, two dial gauges were used on the opposite sides of the
plate. Settlement of the footing, corresponding to a given load was taken as the average
of the settlement measured by these two dial gauges. The overall view of the apparatus
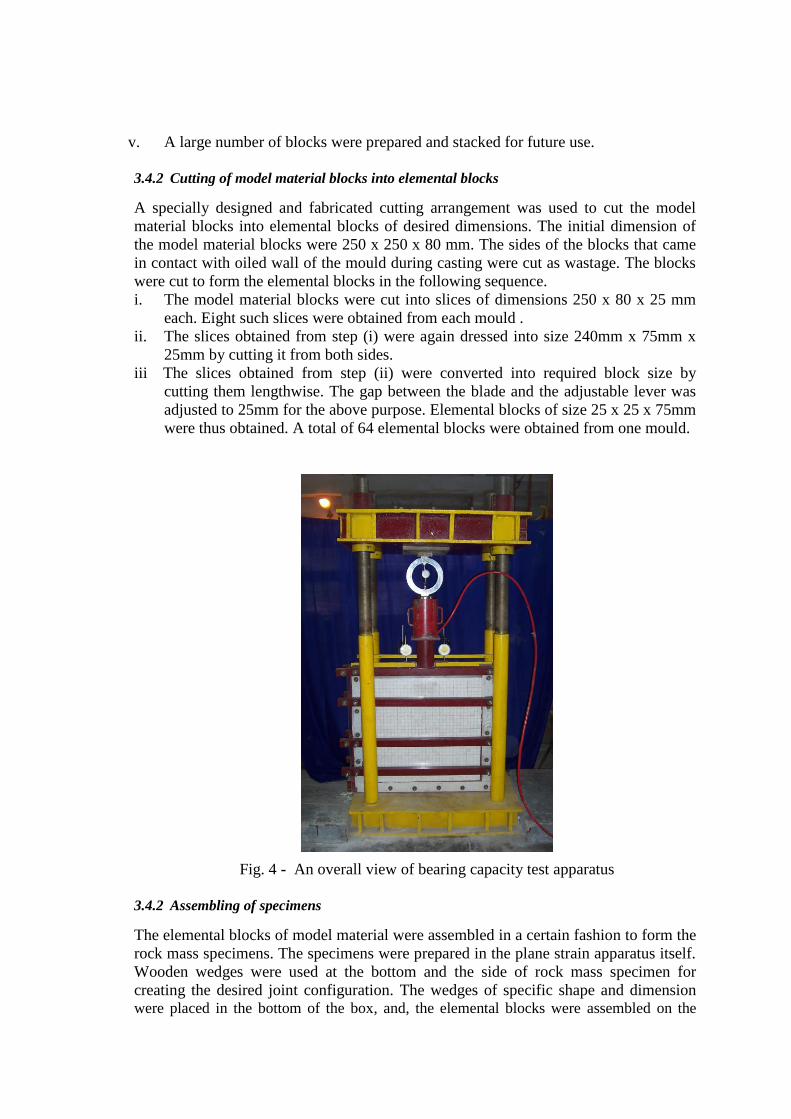
with specimen and loading arrangement is shown in Fig. 4.
3.4 Preparation of Blocky Mass Specimens with Two Joint Sets
The joint configurations of the blocky mass specimens, used in the present study, are
already shown in Figs. 1 and 2 respectively. The blocks of model material of size 25 x
25 x 75mm were used to form the specimens. The specimens with desired joint
configurations were prepared in the following manner:
3.4.1 Preparation of model material blocks
i. A dry mixture of plaster of Paris and sand in the specified proportion was
prepared. Water in the required quantity was added in the dry mix and proper
mixing of the material was carried out.
ii. The prepared model material mix was poured into the steel mould and of internal
dimension of 250 mm length x 250 mm width x 80 mm height. The internal sides
of the moulds were greased with mobil oil before pouring Plaster of Paris.
iii. The mould was shaken on vibration table for about 2 minutes to remove any
entrapped air in the mix.
iv. The moulds were opened after 1 hour and were air cured for a minimum period of
14 days.
v. A large number of blocks were prepared and stacked for future use.
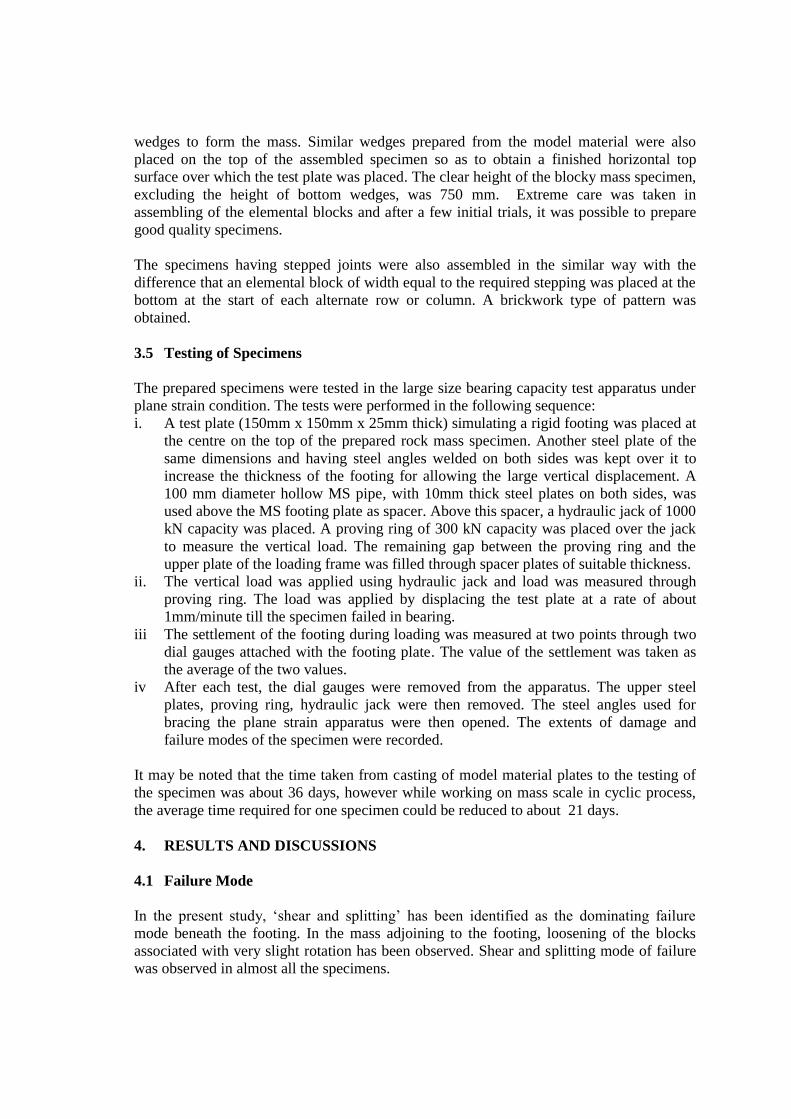
3.4.2 Cutting of model material blocks into elemental blocks
A specially designed and fabricated cutting arrangement was used to cut the model
material blocks into elemental blocks of desired dimensions. The initial dimension of
the model material blocks were 250 x 250 x 80 mm. The sides of the blocks that came
in contact with oiled wall of the mould during casting were cut as wastage. The blocks
were cut to form the elemental blocks in the following sequence.
i. The model material blocks were cut into slices of dimensions 250 x 80 x 25 mm
each. Eight such slices were obtained from each mould .
ii. The slices obtained from step (i) were again dressed into size 240mm x 75mm x
25mm by cutting it from both sides.
iii The slices obtained from step (ii) were converted into required block size by
cutting them lengthwise. The gap between the blade and the adjustable lever was
adjusted to 25mm for the above purpose. Elemental blocks of size 25 x 25 x 75mm
were thus obtained. A total of 64 elemental blocks were obtained from one mould.
Fig. 4 - An overall view of bearing capacity test apparatus
3.4.2 Assembling of specimens
The elemental blocks of model material were assembled in a certain fashion to form the
rock mass specimens. The specimens were prepared in the plane strain apparatus itself.
Wooden wedges were used at the bottom and the side of rock mass specimen for
creating the desired joint configuration. The wedges of specific shape and dimension were placed in the bottom of the box, and, the elemental blocks were assembled on the
wedges to form the mass. Similar wedges prepared from the model material were also
placed on the top of the assembled specimen so as to obtain a finished horizontal top
surface over which the test plate was placed. The clear height of the blocky mass specimen,
excluding the height of bottom wedges, was 750 mm. Extreme care was taken in
assembling of the elemental blocks and after a few initial trials, it was possible to prepare
good quality specimens.
The specimens having stepped joints were also assembled in the similar way with the
difference that an elemental block of width equal to the required stepping was placed at the
bottom at the start of each alternate row or column. A brickwork type of pattern was
obtained.
3.5 Testing of Specimens
The prepared specimens were tested in the large size bearing capacity test apparatus under
plane strain condition. The tests were performed in the following sequence:
i. A test plate (150mm x 150mm x 25mm thick) simulating a rigid footing was placed at
the centre on the top of the prepared rock mass specimen. Another steel plate of the
same dimensions and having steel angles welded on both sides was kept over it to
increase the thickness of the footing for allowing the large vertical displacement. A
100 mm diameter hollow MS pipe, with 10mm thick steel plates on both sides, was
used above the MS footing plate as spacer. Above this spacer, a hydraulic jack of 1000
kN capacity was placed. A proving ring of 300 kN capacity was placed over the jack
to measure the vertical load. The remaining gap between the proving ring and the
upper plate of the loading frame was filled through spacer plates of suitable thickness.
ii. The vertical load was applied using hydraulic jack and load was measured through
proving ring. The load was applied by displacing the test plate at a rate of about
1mm/minute till the specimen failed in bearing.
iii The settlement of the footing during loading was measured at two points through two
dial gauges attached with the footing plate. The value of the settlement was taken as
the average of the two values.
iv After each test, the dial gauges were removed from the apparatus. The upper steel
plates, proving ring, hydraulic jack were then removed. The steel angles used for
bracing the plane strain apparatus were then opened. The extents of damage and
failure modes of the specimen were recorded.
It may be noted that the time taken from casting of model material plates to the testing of
the specimen was about 36 days, however while working on mass scale in cyclic process,
the average time required for one specimen could be reduced to about 21 days.
4. RESULTS AND DISCUSSIONS
4.1 Failure Mode
In the present study, ‘shear and splitting’ has been identified as the dominating failure
mode beneath the footing. In the mass adjoining to the footing, loosening of the blocks
associated with very slight rotation has been observed. Shear and splitting mode of failure
was observed in almost all the specimens.

4.1.1 Type-A specimens ( = 0 to 90)
Rock mass specimens after failure are shown in Fig. 5(a-d) and details are shown in
Table 2. A compressed zone has been observed at the centre from base of the footing.
The boundaries of this zone are defined by joint planes. Openings of joints and relative
displacements were also observed along the boundaries of the compressed zone.
Maximum settlement was observed for 45°/45° and minimum was for 00°/90° case.
However, the displacement of the elemental blocks below the footing were observed up
to a depth of about 60cm, 55cm, 50cm, and 35cm from the top surface for the
specimens having joint configuration 00o/90o, 15o/75o, 30o/60o and 45o/45o respectively.
Fig. 5(a) - Failure mode in type-A specimen,
0o-90o (θ = 0o, s = 0)
Fig. 5(b) - Failure mode in type-A specimen,
15o-75o (θ =15o, s = 0)
Fig. 5(c) - Failure mode in type-A specimen,
30o-60o (θ = 30o, s = 0) Fig. 5(d) - Failure mode in type-A specimen,
45o-45o (θ =45o, s = 0)
4.1.2 Type-B specimens ( = 0 to 90, s = 0.5b)
Rock mass specimens after failure are shown in Fig. 6(a-g) and details are shown in
Table 3. A compressed zone was observed beneath the footing with the difference that
for 90°/0° configuration, the width of the zone was equal to the plate width. With the
increase in , the base width of this zone increased and reached its maximum value for
0°/90°. The displacement of the elemental blocks was observed up to a depth of about
30cm, 45cm, 36cm, 36cm, 36cm 56cm and 56cm from the top surface for the
specimens having joint configuration 0o/90o, 15o/75o, 30o/60o, 45o/45o, 60o/30o, 75o/15o,
and 90o/0o respectively.

Table 2 - Summary of experimental observations of Type-A specimens
(s = 0, = 0o to 90o)
Joint
Configuration
Experimental Observations
00o/90o
- Formation of compressed zone just below footing. This zone
extends upto a depth of about 4.0 times the footing size.
- Shear and splitting failure mode beneath the footing.
15o/75o
- The compressed zone below footing bounded by joint plane
dipping at 75°
- Shear and splitting failure mode beneath the footing.
- Joint dipping at 75 on right hand side of the footing opened up
to 1-2 mm.
- Displacements of rock blocks observed up to a depth of 55 cm
from footing base.
30o/60o
- The compressed zone below footing is bounded by joint
dipping at 60°
- Shear and splitting failure mode beneath the footing
- The joint dipping at 30 on the left hand side of the footing and
dipping at 60 on right hand side opened upto 2mm to 6mm at
the time of failure.
- Displacements of blocks observed up to a depth of 50 cm from
footing base
45o/45o
- The compressed zone below footing is bounded by joints
dipping at 45° on both sides of footing.
- Shear and splitting failure mode beneath the footing.
- The joint dipping at 45° on left hand side and right hand side of
footing opened upto about 2 mm to 4 mm.
- Displacements of the blocks observed up to a depth of about
35cm from footing base.
Fig. 6(a) - Failure mode in type-B specimen,
0o-90o (θ = 0o, s = 0.5b)
Fig. 6(b) - Failure mode in type-B specimen,
15o-75o (θ =15o, s =0. 5b)
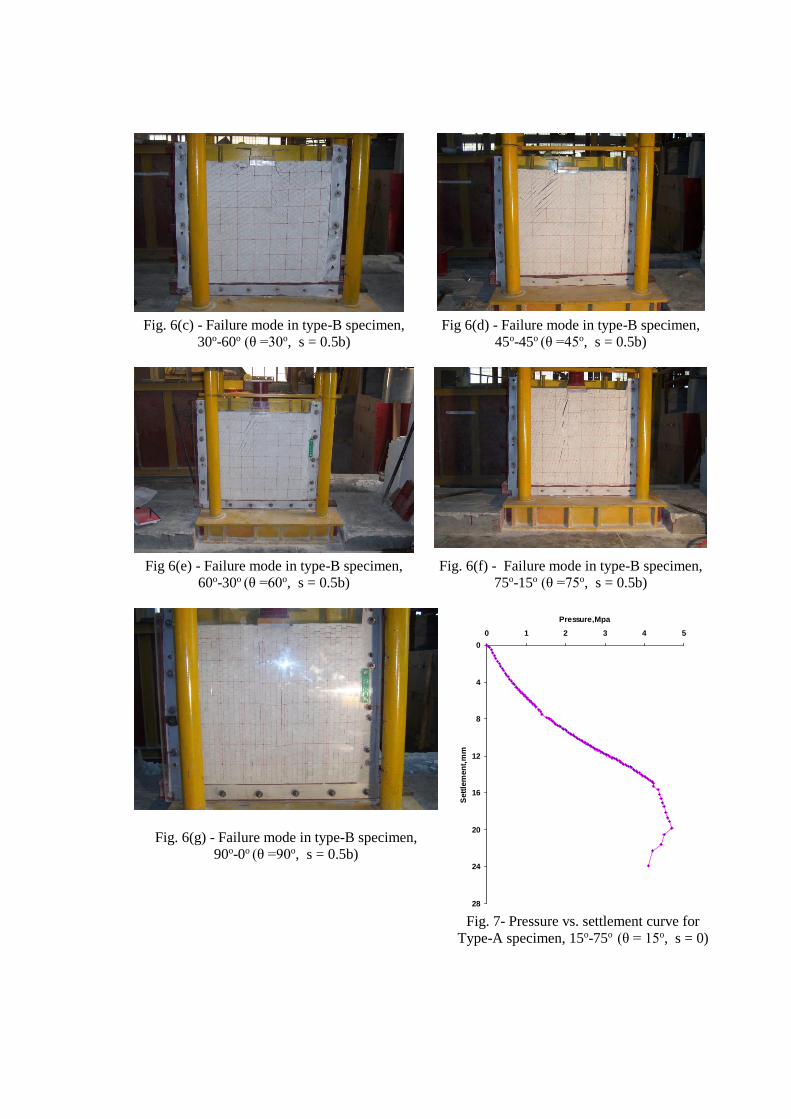
Fig. 6(c) - Failure mode in type-B specimen,
30o-60o (θ =30o, s = 0.5b)
Fig 6(d) - Failure mode in type-B specimen,
45o-45o (θ =45o, s = 0.5b)
Fig 6(e) - Failure mode in type-B specimen,
60o-30o (θ =60o, s = 0.5b)
Fig. 6(f) - Failure mode in type-B specimen,
75o-15o (θ =75o, s = 0.5b)
Fig. 6(g) - Failure mode in type-B specimen,
90o-0o (θ =90o, s = 0.5b)
Pressure vs settlement of footing,Test 15-75
0
4
8
12
16
20
24
28
0 1 2 3 4 5
Pressure,Mpa
Sett
lem
en
t,m
m
Fig. 7- Pressure vs. settlement curve for
Type-A specimen, 15o-75o (θ = 15o, s = 0)

Table 3 - Summary of Experimental Observations of Type-B Specimens
(s = 0.5b, = 0o to 90o)
Joint
Configuration
Experimental Observations
00o/90o
- Formation of a compressed zone from base of footing.
- Shearing and splitting failure mode beneath the footing.
- Displacements observed up to a depth of 30cm from footing base
15o/75o
- Shearing of elemental blocks at the right hand side corner of the
footing.
- Shearing and splitting of blocks beneath the footing.
- The joint dipping at 75 on the right hand side of the footing opened
upto 1mm to 2mm at the time of failure.
- Displacements observed up to a depth of 46 cm from footing base
30o/60o
- Shearing of the elemental blocks at the right hand side corner of the
footing.
- Shearing and splitting of blocks beneath the footing.
- The joint dipping at 30 on the left hand side of the footing opened
upto 6mm to 8mm and dipping at 60 on right hand side opened upto
1mm to 2mm at the time of failure.
- Displacements observed up to a depth of 36 cm from footing base
45o/45o
- Shearing of the elemental blocks at the right hand side corner of the
footing.
- Shearing and splitting failure mode beneath the footing.
- An opening of the joint of 5-7mm width extended from the left hand
side corner of the footing and dipped at 45 and an opening of the
joint of 1-1.5mm width which extended from the outer corner of the
footing and dipped at 45on the right hand side of the footing
- Displacements up to a depth of 36 cm from footing base
60o/30o
- Shearing of the elemental blocks at the left hand side corner of the
footing.
- Shearing and splitting failure mode beneath the footing.
- An opening of the joint of 3-6 mm width extended from the left
hand side corner of the footing and dipped at 60 and an opening of
the joint of 1mm width which extended from the outer corner of the
footing and dipped at 30on the right hand side of the footing
- Displacements up to a depth of 36 cm from footing base
75o/15o
- Elemental blocks at the left hand side corner of the footing got
sheared
- Shearing and splitting failure mode beneath the footing.
- An opening of the joint of 3-7mm width extended from the left hand
side corner of the footing and dipped at 75 and an opening of the
joint of 1mm width which extended from the outer corner of the
footing and dipped at 15 on the right hand side of the footing
- Displacements up to a depth of 56 cm from footing base
90o/00o
- A vertical compressed zone formation in the rock mass.
- Shearing and splitting failure mode beneath the footing.
- Displacements up to a depth of 56 cm from footing base
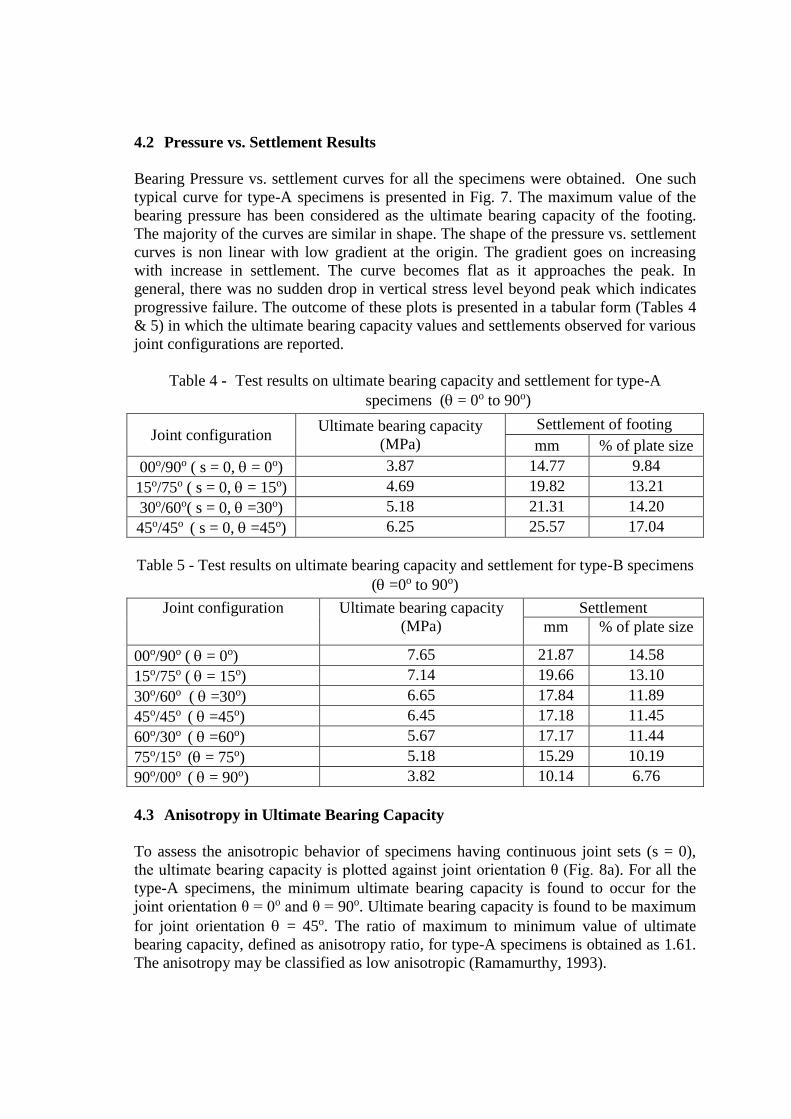
4.2 Pressure vs. Settlement Results
Bearing Pressure vs. settlement curves for all the specimens were obtained. One such
typical curve for type-A specimens is presented in Fig. 7. The maximum value of the
bearing pressure has been considered as the ultimate bearing capacity of the footing.
The majority of the curves are similar in shape. The shape of the pressure vs. settlement
curves is non linear with low gradient at the origin. The gradient goes on increasing
with increase in settlement. The curve becomes flat as it approaches the peak. In
general, there was no sudden drop in vertical stress level beyond peak which indicates
progressive failure. The outcome of these plots is presented in a tabular form (Tables 4
& 5) in which the ultimate bearing capacity values and settlements observed for various
joint configurations are reported.
Table 4 - Test results on ultimate bearing capacity and settlement for type-A
specimens ( = 0o to 90o)
Joint configuration Ultimate bearing capacity
(MPa)
Settlement of footing
mm % of plate size
00o/90o ( s = 0, = 0o) 3.87 14.77 9.84
15o/75o ( s = 0, = 15o) 4.69 19.82 13.21
30o/60o( s = 0, =30o) 5.18 21.31 14.20
45o/45o ( s = 0, =45o) 6.25 25.57 17.04
Table 5 - Test results on ultimate bearing capacity and settlement for type-B specimens
( =0o to 90o)
Joint configuration Ultimate bearing capacity
(MPa)
Settlement
mm % of plate size
00o/90o ( = 0o) 7.65 21.87 14.58
15o/75o ( = 15o) 7.14 19.66 13.10
30o/60o ( =30o) 6.65 17.84 11.89
45o/45o ( =45o) 6.45 17.18 11.45
60o/30o ( =60o) 5.67 17.17 11.44
75o/15o ( = 75o) 5.18 15.29 10.19
90o/00o ( = 90o) 3.82 10.14 6.76
4.3 Anisotropy in Ultimate Bearing Capacity
To assess the anisotropic behavior of specimens having continuous joint sets (s = 0),
the ultimate bearing capacity is plotted against joint orientation θ (Fig. 8a). For all the
type-A specimens, the minimum ultimate bearing capacity is found to occur for the
joint orientation θ = 0o and θ = 90o. Ultimate bearing capacity is found to be maximum
for joint orientation = 45o. The ratio of maximum to minimum value of ultimate
bearing capacity, defined as anisotropy ratio, for type-A specimens is obtained as 1.61.
The anisotropy may be classified as low anisotropic (Ramamurthy, 1993).

Anisotropy in ultimate bearing capacity of Type-B specimens may be observed from
the plot given in Fig. 8b. The minimum ultimate bearing capacity has been observed to
be for the joint orientation θ = 90o whereas the maximum value is obtained for joint
orientation =0o. The anisotropy ratio is obtained as 2.0. The anisotropy may be
classified as moderately anisotropic (Ramamurthy, 1993). The ultimate bearing
capacity is found to decrease with the increase in joint orientation θ = 0o to 90o.
= 0o
= 15o
= 30o
= 45o = 60
o = 75
o = 90
o
= 0o
= 15o
= 30o
= 45o = 60
o = 75
o = 90
o
Fig. 8(a) - Graphical representation of
anisotropy in ultimate bearing capacity
(Type-A specimens)
Fig. 8(b) - Graphical representation of
anisotropy in ultimate bearing capacity
(Type-B specimens)
It is observed that the anisotropy ratio varies from 1.61 for Type-A specimens to 2.0 for
Type-B specimens. The stepping may therefore be said to have increased anisotropy in
ultimate bearing capacity. This observation is quite logical as there may be
enhancement in bearing capacity due to resistance offered by the stepping specially
when the loading direction is normal to the stepping (Type-B, = 0). Due to stepping
of joints, the pressure acting over the bearing area is distributed on wider area below
the plate in case of θ = 0o . In case of θ = 90o the footing applies load on a pile of
block which virtually acts like a column; very little or no confinement is mobilized in
this case, on the sides of loaded column. As a result, the pressure does not distribute
laterally and the pressure bulb extends to great depths below the footing. Due to deeper
pressure bulb, the bearing capacity may be expected to be less and settlements large.
This observation has important significance in the field and suggest that in case of
vertical joints, the bearing capacity may be very low and pressure bulb goes very deep,
which need careful attention. Similar observations have been made by Singh (1973).
4.4 Effect of Stepping on Ultimate Bearing Capacity
The stepping, in this study, is considered to be an indirect way of introducing
interlocking in the mass. In the field, termination index (ISRM, 1978) gives an idea of
the interlocking of the mass. The effect of stepping on the ultimate bearing capacity of
specimens with two joint set is explained in the following paragraphs:
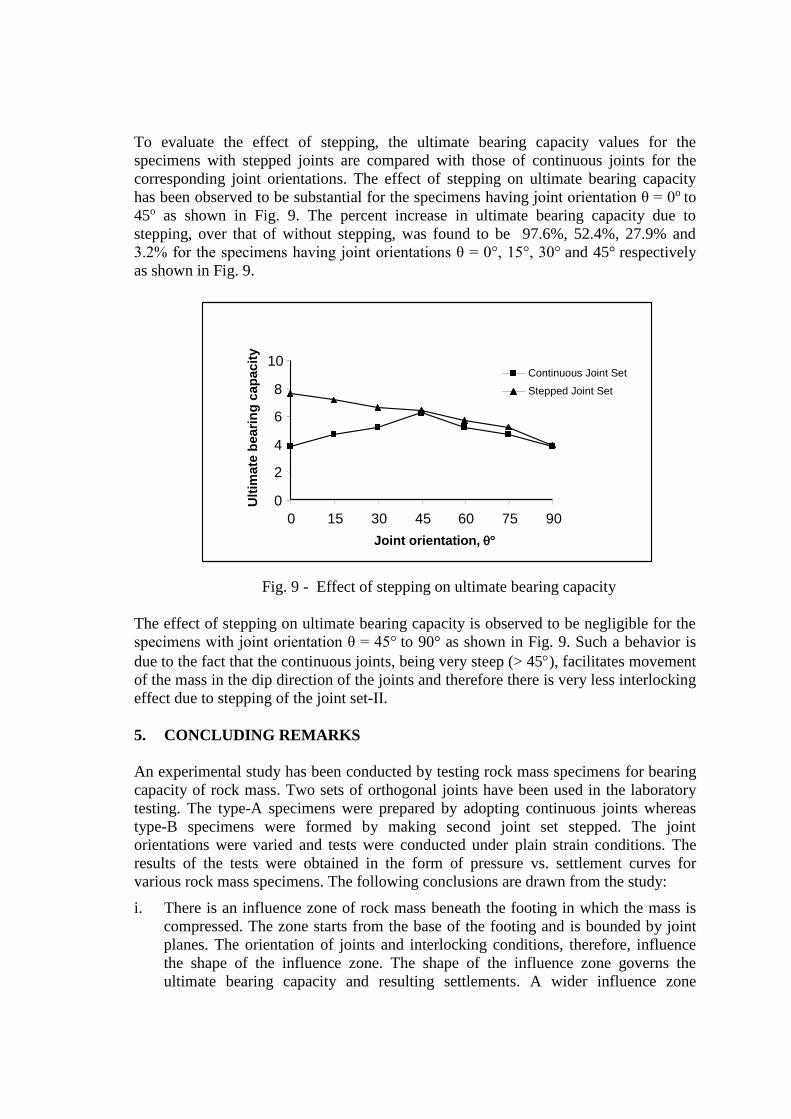
To evaluate the effect of stepping, the ultimate bearing capacity values for the
specimens with stepped joints are compared with those of continuous joints for the
corresponding joint orientations. The effect of stepping on ultimate bearing capacity
has been observed to be substantial for the specimens having joint orientation θ = 0o to
45o as shown in Fig. 9. The percent increase in ultimate bearing capacity due to
stepping, over that of without stepping, was found to be 97.6%, 52.4%, 27.9% and
3.2% for the specimens having joint orientations θ = 0°, 15°, 30° and 45° respectively
as shown in Fig. 9.
0
2
4
6
8
10
0 15 30 45 60 75 90
Joint orientation,
Ult
ima
te b
eari
ng
cap
ac
ity
Continuous Joint Set
Stepped Joint Set
Fig. 9 - Effect of stepping on ultimate bearing capacity
The effect of stepping on ultimate bearing capacity is observed to be negligible for the
specimens with joint orientation θ = 45° to 90° as shown in Fig. 9. Such a behavior is
due to the fact that the continuous joints, being very steep (> 45), facilitates movement
of the mass in the dip direction of the joints and therefore there is very less interlocking
effect due to stepping of the joint set-II.
5. CONCLUDING REMARKS
An experimental study has been conducted by testing rock mass specimens for bearing
capacity of rock mass. Two sets of orthogonal joints have been used in the laboratory
testing. The type-A specimens were prepared by adopting continuous joints whereas
type-B specimens were formed by making second joint set stepped. The joint
orientations were varied and tests were conducted under plain strain conditions. The
results of the tests were obtained in the form of pressure vs. settlement curves for
various rock mass specimens. The following conclusions are drawn from the study:
i. There is an influence zone of rock mass beneath the footing in which the mass is
compressed. The zone starts from the base of the footing and is bounded by joint
planes. The orientation of joints and interlocking conditions, therefore, influence
the shape of the influence zone. The shape of the influence zone governs the
ultimate bearing capacity and resulting settlements. A wider influence zone

indicates higher bearing capacity and low settlements whereas a narrow influence
zone indicates a lower bearing capacity and higher settlements.
ii. Contrary to four fold failure mechanism, shearing and splitting has been found to
be dominating failure modes of the rock mass beneath the footing. Opening of
joints occurred and loose zones formed near the surface.
iii. The zone beneath the footing, in which displacement occurred, was found to be
varying from 35cm (about 2.3 times the footing width, B) to 60cm (4.0 times the
footing width, B) from the base of footing. The depth of this zone for type-A
specimens has been found to be minimum for joint configuration 45°-45o and
maximum for 0o-90o, respectively.
iv. The displacements in the rock mass for type-B specimens were observed up to
depth ranging from 30cm (2.0B) to 56cm (3.7B) from base of the footing. The
depth of this zone has been found to be minimum for joint configuration 0o-90°
and maximum for 90o-0o respectively.
v. The pressure-settlement curves are found to be non linear. The gradient goes on
increasing with increase in settlement. The curve becomes flat as it approaches the
peak. In general, there was no sudden drop in vertical stress level beyond peak
stress indicating progressive failure.
vi. The ultimate bearing capacity has been found to be anisotropic in nature. For type-
A specimens, the anisotropy ratio is 1.61. Ultimate bearing capacity is found to be
maximum for the specimen with joint configuration 45o-45o and minimum for joint
configuration 0o-90o, respectively. Vertical joints represent the most unfavorable
joint condition for both specimen types.
vii. For type-B specimens, the anisotropy ratio is 2.0. The minimum ultimate bearing
capacity occurs for the specimen with joint configuration is 90o- 0o and maximum
with joint configuration 0o-90o.
viii. The stepping in this study is an indirect measure of interlocking conditions and has
been found to have substantial effect on ultimate bearing capacity for joint
orientation θ = 0o to 45o. The percent increase in ultimate bearing capacity due to
stepping, over that of without stepping, was found to be 97.6%, 52.4% and 27.9%
for the specimens having joint orientations θ = 0°, 15° and 30° respectively.
However, the stepping is found to have negligible increase in ultimate bearing
capacity in the range of 45° ≤ θ ≤ 90°. The reason being the shape of compressed
zone. In case θ ≤ 45°, the zone is wide due to stepping, for θ ≥ 45°, the loading
direction coincides with joint dip and compressed zone is limited to foundation
width and the dispersion of stress does not occur.
Acknowledgement
The work presented in this paper has been a part of the Ph. D. thesis of the first author
which was completed under the supervision of co-authors at I. I. T. Roorkee under
Quality Improment Programme of Government of India. The first author is thankful to
the authorities at University College of Engineering, Rajasthan Technical University,
Kota for sponsoring him for Ph. D. The authors are also thankful to Prof. Bhawani
Singh and Prof. M. N. Viladkar for their valuable guidance during the Ph. D.
programme.
Notations:
B Width of the footing
b Width of block = 25mm
ci and i Shear strength parameters of intact rock
ultq Ultimate bearing capacity
r Joint strength parameter
s Stepping of joint
Orientation of joint plane w.r.t. loading direction
Unit weight of the rock mass
d Dry density
Friction angle
j Joint friction angle
θ Dip of joint plane w. r. t. horizontal
n Applied normal stress
cj UCS of jointed rock; Apparent rock mass strength
ci Uniaxial compressive strength of the intact rock
References
Agarwal, B. K. (2005). Shear Strength Behaviour of Jointed Model Material Under
Low CNL Condition, Ph.D. Thesis, IIT Roorkee, Roorkee, India.
Baoshu, G., Huoyao, X. and Hanmin, W. (1986). An Experimental Study on the
Strength of Jointed Rock Mass, Proc. of Int. Symp. on Engineering in Complex
Rock Formations, 3-7 Nov, Beijing, China, pp.190-198.
Bindlish, A. (2007). Bearing Capacity of Strip Footings on Jointed Rocks. Ph.D.
Thesis, Civil Engg. Deptt., I. I.T., Roorkee, India.
Brown E.T. and Trollope D.H. (1970). Strength of a Model of Jointed Rock, J. of Soil
Mech. & Found. Div., Proc. ASCE, 96(SM2), 685-704.
Brown E.T. (1970a). Strength of Models of Rock with Intermittent Joints, J. of Soil
Mech. & Found. Div., Proc. ASCE, 96(SM6), pp.1935-1949.
Deere, D.U., Miller, R.P. (1966). Engineering Classification and Index Properties for
Intact Rock, Technical Report No. AFNL-TR-65-116. Air Force Weapons
Laboratory, New Mexico.
Einstein, H.H. and Hirschfeld, R.C. (1973). Model Studies on Mechanics of Jointed
Rock, J. of Soil Mech. & Found. Div. Proc. ASCE, 90, pp. 229-248.
Goldstein, M., Goosev, B., Pyrogovsky, N., Tulinov, R. and Turovskaya, A. (1966).
Investigation of Mechanical Properties of Cracked Rock, Proc. Ist Cong. ISRM,
Lisbon, 1, 521-524.
Hatashi, M. (1966). Strength and Dialatancy of Brittle Jointed Mass - The Extreme
Value Stochastic and Anisotropic Failure Mechanism., Proc Ist Cong. ISRM,
Lisbon, 1, pp.295-302.
Hoek, E. (2000). Practical Rock Engineering, 2000 Edition,
http://www.rocscience.com/hoek/Practical RockEngineering.asp.

ISRM (1981). Rock Characterization, Testing and Monitoring. ISRM Suggested
Methods. Brown E.T. (ed.), Pergamon Press.
Ladanyi, B. and Archambault, G. (1972). Evaluation of Shear Strength of a Jointed
Rock Mass, Proc. 24th Int. Geological Congress, Montreal, Section 13D, pp.249-
270.
Lama R. D. (1974). The Uniaxial Compressive Strength of Jointed Rock, Prof. L.
Müller Festschrift, Inst. Soil Mech. & Rock Mech., Univ. Karlsruhe, Karlsruhe,
pp.67-77.
Prakoso, W. A. and Kulhawy, F. H. (2004). Bearing Capacity of Strip Footings on
Jointed Rock Masses, J. of Geotechnical and Geoenvironmental Engineering, Vol.
130(12), pp. 1347-1349.
Ramamurthy, T. (1993). Strength and Modulus Response of Anisotropic Rocks,
Chapter 13, Comprehensive Rock Engg., Vol 1, Pergamon Press, U.K., pp. 313-329.
Singh, B. (1973). Continuum Characterization of Jointed Rock Mass Part II –
Significance of Low Shear Modulus, Int. J. Rock Mech. And Min. Sci. & Geomech.
Abstr., Pergamon, Vol. 10, pp. 337-349.
Singh, M. (1997). Engineering Behaviour of Jointed Model Materials, Ph.D. Thesis,
IIT Delhi, India.
Singh, M. and Rao, K. S. (2005). Bearing Capacity of Shallow Foundations in
Anisotropic Non Hoek-Brown Rock Masses, J. of Geotechnical and
Geoenvironmental Engineering, Vol. 131(8), pp. 1014-1023.
Sutcliffe, D. J., Yu, H. S. and Sloan, S.W. (2004). Lower Bound Solutions for Bearing
Capacity of Jointed Rock, Computers and Geotechnics, Vol. 31(1), pp. 23-36.
Walker, P. F. (1971). The Shearing Behaviour of Block Jointed Rock Model, Ph.D.
Thesis, Queens Univ., Belfast
Yang, Z. Y., Huang, T. H., (1995). Effect of Joint Sets on the Anisotropic Strength of
Rock Masses, Proc. 8th Cong. ISRM, Japan, pp.367-370.
Yang, Z. Y. and Chiang, D.Y. (2000). An Experimental Study on the Progressive Shear
Behaviour of Rock Joints with Tooth-Shaped Asperities, Int. J. of Rock Mechanics
and Mining Sciences, 37, pp.1247-1259.