Embed Size (px)
Citation preview

Clays and Clay Minerals, Vol. 41, No. 2, 162-177, 1993.
A N EXPERIMENTALLY DERIVED KINETIC MODEL FOR SMECTITE-TO-ILLITE CONVERSION A N D ITS USE AS A
GEOTHERMOMETER
Wuu-LIANG HOANG, JOHN M. LONGO, AND DAVID R. PEVEAR
Exxon Production Research Company P.O. Box 2189, Houston, Texas 77252-2189
Abstract--The smectite-to-illite conversion during shale diagenesis has recently been used to constrain the estimate of a basin's thermal history. We have systematically investigated the kinetics for the con- version of a Na-saturated montmorillonite (SWy-1) to a mixed-layer smectite/iUite as a function of KC1 concentration (from 0.1 to 3 moles/liter) over a temperature range of 250* to 325"C at 500 bars in cold- seal pressure vessels using gold capsules. The results show that the conversion rate can be described by a simple empirical rate equation:
- dS/dt = A. exp(- Ea/RT)- [K § S 2
where S = fraction of smectite layers in the I/S, t = time in seconds, A = frequency factor = 8.08 x 10 -4 sec -~ , exp = exponential function, Ea = activation Energy = 28 kcal/mole, R = gas constant, 1.987 cal/ deg-mole, T = temperature (degree Kelvin), [K § ] = K + concentration in molarity (M) in the fluid.
The results also show that Ca 2 + in solutions barely affects the illitization rate, whereas Mg 2+ significantly retards the rate. The retardation, however, is not as severe as previously reported. Na + ion can significantly retard the rate only if the concentration is high.
We found that by assuming a range 0.0026-0.0052 moles/liter (100-200 ppm) of K +, concentrations similar to the value typically reported in oil field brines, the present kinetic model can reasonably predict the extent of the smectite-to-illite conversion for a number of basins from various depths and age. This narrow range of potassium concentrations, therefore, is used to model the smectite-to-illite conversion in shale when the actual chemical information of pore fluid is not available.
The kinetic equation has been tested using field data from a large variety of geologic settings worldwide (i.e., the Gulf of Mexico, Vienna Basin, Salton Trough Geothermal Area, East Taiwan Basin, Huasna Basin, etc). The results show that the equation reasonably predicts the extent of the reaction within our knowledge of the variables involved, such as burial history, thermal gradients, and potassium concen- tration.
Key Words--Geothermometry, Illite, Kinetics, Smectite, Smectite/illite.
I N T R O D U C T I O N
Smect i te- to- i l l i te convers ion is the mos t impor t an t minera l react ion dur ing shale diagenesis. Smect i te c o m m o n l y occurs in f ine-grained sediments at shal low depths. Dur ing burial diagenesis, smect i te is conver ted to illite, generally releasing silica, water, and cat ions in the process. This reaction has been suggested as a source o f silica or carbonate cements for the host shale and adjacent sandstones, thereby significantly affecting the qual i ty o f a reservoi r and its seal. Wate r released f rom this react ion m a y enhance hydrocarbon migra t ion or fo rm overpressure (e.g., Boles and Franks, 1979; Bruce, 1984). Mos t impor tan t ly , this react ion can serve as an independen t g e o t h e r m o m e t e r to const ra in the pro- posed the rmal his tory o f a basin for bet ter predict ing source rock matura t ion (Pytte and Reynolds , 1989; Eslinger and Pevear , 1988; Elliot et aL, 1991).
The react ion also has rece ived a great deal o f aca- demic interest because o f the d isputed nature o f bo th mixed- layer i l l i te /smect i te (I/S) and the react ion mech- an i sm (e.g., Reynolds and Hower , 1970; Garrels, 1984;
Copyright �9 1993, The Clay Minerals Society
N a d e a u et al., 1984; Srodofi and Eberl, 1984; Bethke and Altaner , 1986; Sass etaL, 1987; Eberl et al., 1990; Inoue et aL, 1987; Whi tney and Nor th rop , 1988; Yau et al., 1987). Many exper iments have been carried out to conver t smecti te to illite or US hydrothermally. Mos t o f these exper iments were designed to focus on a va - riety o f special problems such as convers ion rates (Eberl and Hower , 1976), the effect o f interlayer cations (Eberl, 1978), octahedral subst i tut ion (Gi iven and Huang, 1991), te t rahedral subst i tut ion ( H u a n g and Otten, 1987), solut ion chemis t ry (Roberson and Lahann, 1981), kinetics o f layer charge d e v e l o p m e n t (Howard and Roy, 1985), control o f order ing o f mixed- layers (Eberl, 1977; Inoue and Utada , 1983; Bethke et al., 1986; Huang, 1989), convers ion m e c h a n i s m (Whi tney and Nor th rop , 1988), and the effect o f flow rate in flow through exper iments (Kacandes et aL, 1991).
There are few publ i shed reports on the kinetics o f this impor t an t reaction. Eberl and H o w e r (1976) con- c luded that the i l l i t izat ion rate o f synthetic beidel l i tes fol lows first-order kinetics. However , this kinetic m o d - el is no t appl icable to field observa t ions because the
162

Vol. 41, No. 2, 1993 Kinetic model for smectite-to-illite conversion 163
illitization rate of the synthetic smectite is found to be significantly lower than that of natural smectite (Eberl and Hower, 1976; Huang and Otten, 1987). Bethke and Altaner (1986) derived a theoretical rate law by assuming the layer-by-layer substitution mechanism of smectite to illite transformation. Pytte and Reynolds (1989) derived a sixth-order kinetic equation based on the field observations of progressive illitization of smectite in a contact metamorphic zone. The sixth- order kinetic equation has been widely used for mod- eling smectite-to-illite conversion in nature (e.g., A1- taner, 1989; Elliot et al., 1991). Recently, an empirical kinetic model was proposed by Velde and Vasseur (1992) based on field data from three sedimentary basins.
The present study aims to quantify the kinetics of the smectite-to-illite reaction experimentally using nat- ural smectite in order to forecast accurately the timing of the conversion. We focus on the effect of important parameters such as temperature and potassium con- centration on the conversion rate. These results en- abled us to develop a new kinetic equation for modeling the smectite-to-illite reaction during shale diagenesis.
EXPERIMENTAL MATERIALS AND PROCEDURES
Starting smectite
The starting smectite used for smectite-to-illite con- version experiments is montmoril lonite (SWy-1) from Crook County, Wyoming, and was supplied by the Source Clay Mineral Repository, Department of Ge- ology, University of Missouri. Four different batches of starting smectite were prepared using different pro- cedures (Table 1).
Batch # 1 represents a purified sample that was pre- pared using the following procedure: The <2 #m size fraction was obtained by suspension and centrifugation of SWy-1 clay; this fraction was then placed in a sat- urated NaC1 solution; the Na-saturated sample was then mixed with sodium acetate solution (pH 5) and heated to 85~ to remove carbonates; organic impu- rities in the sample were removed with H/O2 at < 80~ then the sample was washed with distilled water. Iron oxides were removed with a solution ofNa-citrate, Na- bicarbonate, and Na-dithionite; the sample was then washed again with distilled water. Finally, the salt in solution was removed by dialysis, and the purified sam- ple was freeze-dried. Batches #2 and #3 were prepared using the < 2 #m fraction of Na-saturated SWy-1 clay, then freeze-dried. Carbonate, organics, and iron oxide removal were not performed for these two samples. Batch #4 was prepared using the <2 ~m fraction of Na-saturated SWy-1 clay, then air-dried. Impurity re- moval was not performed.
Initial experiments used a purified and freeze-dried sample (Batch # 1). Later we found the conversion rate
of the purified and freeze-dried sample (Batch # 1) sig- nificantly different from that of the unpurified samples. In order to better simulate natural shale diagenesis, the unpurified and air-dried sample (Batch #4) was used in most runs. The use of different batches of the starting sample in the experiments partially accounts for the scatter of the data.
Experimental procedures
Mixtures of starting Na-saturated montmoriUonite (SWy-l) with quartz powder were reacted in solutions with a KCI concentration ranging from 0.1 M to 6 M and fluid/rock ratio from 5 to 10 in cold-seal pressure vessels at temperatures from 250~ to 325~ and 500 bars. Additional experiments with solutions containing Na § Mg 2+, and Ca 2+ ions were also performed in order to simulate reaction during shale diagenesis. Gold cap- sules were used as sample containers for all experi- ments. The solid run products were washed with dis- tilled water on filter paper to remove excess KC1 from the samples. These samples were ultrasonically dis- persed using l0 mg of sample in 0.5 ml of distilled water. They were then sedimented onto a glass slide, with sample coverage within an area 19 m m x 19 mm. Samples were solvated by placing the oriented mount in a desiccator over ethylene glycol at room temper- ature overnight. The solvated samples were examined by X-ray diffraction (XRD) for the illite/smectite ratio of mixed-layer clays using the NEWMOD (R. C. Reyn- olds, IBM PC-AT Version 1.0, 1985; Reynolds, 1980) computer program. The uncertainty of measurement of percent of illite in the I/S sample is considered to be _+5%; however, the overall uncertainty for % I is estimated to be + 15% when taking the uncertainty of the experimental temperature and the variation of the starting smectite sample into account. Selected run products were also resaturated with Na § in 1 M NaC1 solution (S. P. Altaner, personal communication, 1992). The results show that the expandability of the neo- formed I/S significantly increases after being resatur- ated with Na, results similar to those found by Whitney and Northrop (1988). The observation probably in- dicates that part of the neoformed 2: l layer has created interlayer charge only marginally for K fixation, prob- ably due to the high temperature/short time used in the experiments in contrast to the low temperature/ long time for natural samples that hardly show such behavior. While the mechanism behind this behavior requires further study, this paper, as well as Whitney and Northrop's (1988), used the expandability mea- sured from the untreated run products to calculate the % I (or S) layers in the neoformed I/S.
The pH of solutions from experiments were mea- sured, but there was insufficient solution for elemental analysis. However, the final K § concentration [K § in the solution can be calculated from the extent of the reaction. In fitting our experimental data to the kinetic
164 Huang, Long, and Pevear Clays and Clay Minerals
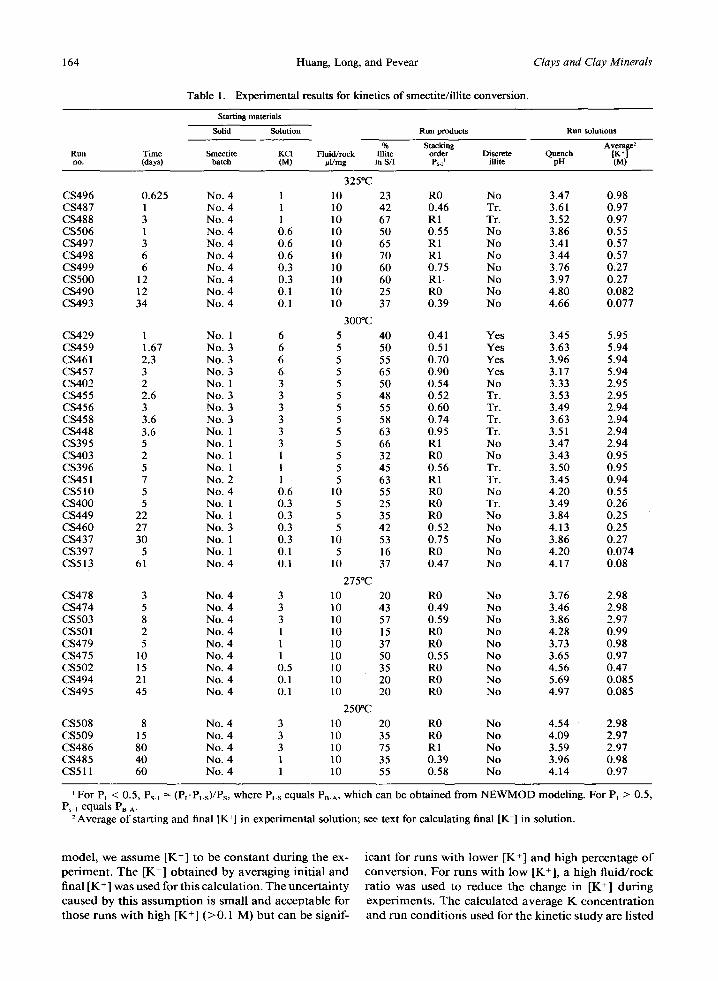
Table 1. Experimental results for kinetics of smectite/illite conversion.
Starting materials
Solid Solution Run products Run solutions
% Stacking Average 2 Run Time Smectite KC1 Fluid/rock lllite order Discrete Quench [K § ] no. (days) batch (M) td/mg in S/I Ps-i' illite pH (M)
325"C CS496 0.625 No. 4 1 10 23 R0 No 3.47 0.98 CS487 1 No. 4 1 10 42 0.46 Tr. 3.61 0.97 CS488 3 No. 4 1 10 67 R1 Tr. 3.52 0.97 CS506 1 No. 4 0.6 10 50 0.55 No 3.86 0.55 CS497 3 No. 4 0.6 10 65 R1 No 3.41 0.57 CS498 6 No. 4 0.6 10 70 R1 No 3.44 0.57 CS499 6 No. 4 0.3 10 60 0.75 No 3.76 0.27 CS500 12 No. 4 0.3 10 60 R1 No 3.97 0.27 CS490 12 No. 4 0.1 10 25 R0 No 4.80 0.082 CS493 34 No. 4 0.1 10 37 0.39 No 4.66 0.077
300~
CS429 1 No. 1 6 5 40 0.41 Yes 3.45 5.95 CS459 1.67 No. 3 6 5 50 0.51 Yes 3.63 5.94 CS461 2.3 No. 3 6 5 55 0.70 Yes 3.96 5.94 CS457 3 No. 3 6 5 65 0.90 Yes 3.17 5.94 CS402 2 No. 1 3 5 50 0.54 No 3.33 2.95 CS455 2.6 No. 3 3 5 48 0.52 Tr. 3.53 2.95 CS456 3 No. 3 3 5 55 0.60 Tr. 3.49 2.94 CS458 3.6 No. 3 3 5 58 0.74 Tr. 3.63 2.94 CS448 3.6 No. 1 3 5 63 0.95 Tr. 3.51 2.94 CS395 5 No. 1 3 5 66 R1 No 3.47 2.94 CS403 2 No. 1 1 5 32 R0 No 3.43 0.95 CS396 5 No. 1 l 5 45 0.56 Tr. 3.50 0.95 CS451 7 No. 2 l 5 63 R1 Tr. 3.45 0.94 CS510 5 No. 4 0.6 l0 55 R0 No 4.20 0.55 CS400 5 No. 1 0.3 5 25 R0 Tr. 3.49 0.26 CS449 22 No. 1 0.3 5 35 R0 No 3.84 0.25 CS460 27 No. 3 0.3 5 42 0.52 No 4.13 0.25 CS437 30 No. 1 0.3 l0 53 0.75 No 3.86 0.27 CS397 5 No. 1 0.1 5 16 R0 No 4.20 0.074 CS513 61 No. 4 0.1 10 37 0.47 No 4.17 0.08
275~ CS478 3 No. 4 3 10 20 R0 No 3.76 2.98 CS474 5 No. 4 3 l0 43 0.49 No 3.46 2.98 CS503 8 No. 4 3 10 57 0.59 No 3.86 2.97 CS501 2 No. 4 1 10 15 R0 No 4.28 0.99 CS479 5 No. 4 1 10 37 R0 No 3.73 0.98 CS475 10 No. 4 l l0 50 0.55 No 3.65 0.97 CS502 15 No. 4 0.5 10 35 R0 No 4.56 0.47 CS494 21 No. 4 0.1 l0 20 R0 No 5.69 0.085 CS495 45 No. 4 0.1 10 20 R0 No 4.97 0.085
250~ CS508 8 No. 4 3 10 20 R0 No 4.54 2.98 CS509 15 No. 4 3 10 35 R0 No 4.09 2.97 CS486 80 No. 4 3 10 75 R1 No 3.59 2.97 CS485 40 No. 4 1 10 35 0.39 No 3.96 0.98 CS511 60 No. 4 1 10 55 0.58 No 4.14 0.97
J For PI < 0.5, Ps~ = (P~'Prs)/Ps, where P~s equals PaA, which can be obtained from NEWMOD modeling. For P~ > 0.5, Ps.l equals PBA-
2 Average of starting and final [K § in experimental solution; see text for calculating final [K § in solution.
mode l , we a s sume [K § to be cons tan t dur ing the ex- pe r imen t . The [K +] ob t a ined by averaging init ial a n d final [K § ] was used for th is calculat ion. The uncer ta in ty caused by this a s s u m p t i o n is smal l and acceptable for those runs wi th high [K § (>0.1 M) bu t can be signif-
icant for runs wi th lower [K § a n d high percentage o f convers ion . Fo r runs wi th low [K§ a high f luid/rock rat io was used to reduce the change in [K § dur ing exper iments . The calcula ted average K concen t ra t ion and run cond i t i ons used for the kinet ic s tudy are l is ted
Vol. 41, No. 2, 1993 Kinetic model for smectite-to-illite conversion 165
T R A N S M I S S I O N E L E C T R O N M I C R O G R A P H S .
PARTICLE MORPHOLOGY.
Starting material : SMECTITE (Wyoming). Experimental product : I / S , 7 5 % Illite
. . . . . . . . . . . . . . . . . i ............
. . . . . . . . . . . . . . . . . . . . . . . . : . . . . . . . . . . . . . . . . . . . . . . . . . . . . . . . . . . . . . . . . . . . . . . . . . . . . . . . . . . . . . . . . . . . . . . . . . . . . . . . . . . . . . . . . . . . . . . . . . . . . . . . . . . . . . . . . . . . . . . . . . . . .
. . . . . . . . . . . . . . . . . i . . . . . . . . . .
F _ : - L
1 i iK c l r ! ........................ i . . . . . . . . . . . . , q " " - " " "T ' "T i .................. M i" " ' " "E " - ' " ~ . . . . . . . . . . . i i I Ii Ni ~ ~E
iiii i K i i
i ................. i ..................... i ................... i .................... i .................... i ............
,i ................... i . i . . . . .......................................... !._...E_....E ........
ELEMENTAL C O M P O S I T I O N .
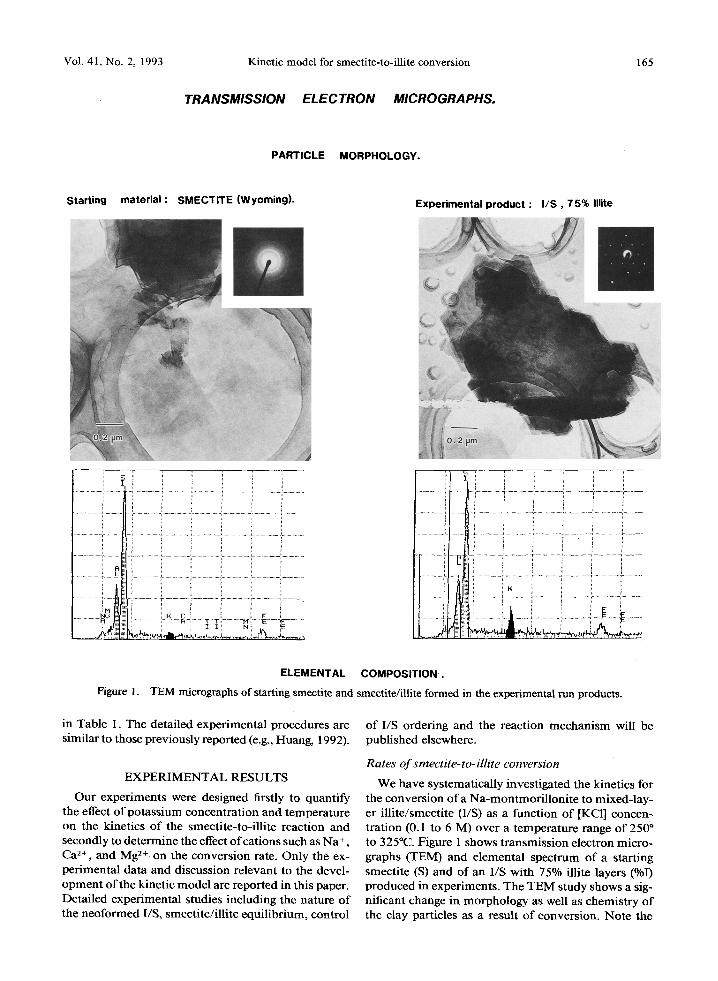
Figure 1. TEM micrographs of starting smectite and smectite/iUite formed in the experimental run products.
in Table I. The detai led experimental procedures are similar to those previously reported (e.g., Huang, 1992).
E X P E R I M E N T A L R E S U L T S
Our exper iments were des igned firstly to quanti fy the effect o f po tass ium concentrat ion and temperature on the kinetics o f the smecti te-to- i l l i te reaction and secondly to determine the effect o f cations such as N a +, Ca 2+, and Mg 2+ on the convers ion rate. O n l y the ex- perimental data and discuss ion relevant to the devel - o p m e n t o f the kinetic m o d e l are reported in this paper. Deta i led experimental studies including the nature o f the neo formed I/S, smect i te / i l l i te equi l ibr ium, control
o f I/S ordering and the reaction m e c h a n i s m wi l l be publ i shed elsewhere.
Rates of smectite-to-illite conversion
We have systematical ly invest igated the kinetics for the convers ion o f a N a - m o n t m o r i l l o n i t e to mixed- lay- er i l l i te /smect i te (I/S) as a funct ion o f [KC1] concen- tration (0.1 to 6 M) over a temperature range o f 250 ~ to 325~ Figure 1 shows transmiss ion electron micro- graphs (TEM) and e lementa l spectrum o f a starting smect i te (S) and o f an I/S wi th 75% illite layers (%I) produced in experiments . The T E M study shows a sig- nificant change in m o r p h o l o g y as wel l as chemistry o f the clay particles as a result o f convers ion. N o t e the

~Wy-I
1%1
166 Huang, Long, and Pevear Clays and Clay Minerals
3S 400
25%1
CS 449
35%1
CS 460
42%1
CS 395
66%1
CS 437
53%1
l l l l l l 1 1 1 1 1 1 1 1 1 1 1 1 1 1 1 , l , l , l , I 2 6 10 14 18 22 26 28
CuKa 2() ~
Figure 2. Examples of XRD patterns for starting smectite and I/S experimentally converted from smectite. The calcu- lated patterns using the program NEWMOD are also shown for comparison.
rigid and platelet-like I/S with significant amounts of potassium in contrast to flaky smectite containing no potassium (Figure 1). I/S with high expandability in run products exhibits curled flakelike habit, whereas I/S with low expandability has a lath or equant platelet appearance. The morphological change during con- version is similar to that observed in the synthetic systems (Gfiven and Huang, 1991) as well as in natural hydrothermal environments (Inoue et al., 1987). De- tailed morphology and particle size change as a func- tion of reaction extent is currently under investigation (R. E. Klimentidis, personal communication). TEM also shows the presence of amorphous silica and quartz in the run products. The distinction between the amor- phous silica, neoformed quartz, and the quartz initially present in the starting solid is mainly based on the morphology.
The pH of quench solutions in most runs is signif- icantly lower than that of the initial solution. The sig-
nificant decrease in pH appears to occur at a very early stage of the reaction, perhaps before the smectite-to- illite conversion. The results show no systematic vari- ation of quench pH as a function of the extent ofsmec- tite-to-illite conversion observed by XRD (Table 1).
The percentage of illite layers and degree of ordering of the neoformed clay were determined by matching the experimental XRD pattern with the calculated pat- tern (Figure 2). Trace amounts (< 3%) of discrete illite in addition to I/S were identified in some run products, particularly in runs using high [K § solutions (Table 1) and were ignored in calculating the illitization rate. Our experimental results (% illite in I/S vs time for each [K+]) at 325 ~ 300 ~ 275 ~ and 250~ are shown in Figure 3A-D and listed in Table 1. These data are fitted to a kinetic equation that enables us to extrap- olate the high temperature and high K concentration data to diagenetic conditions.
Effects o f other cations on kinetics
We have also investigated the effect of other cations such as Na t , Mg 2t, and Ca 2+ on the kinetics of the smectite-to-illite conversion in the presence of 0.6 M K t at 300~ The results show that the conversion rate can be retarded in the presence of significant amounts of Mg 2+ and Na t ions. Our results show that, at 300~ for 3 days, smectite converts to I/S with 45% illite in a 0.6 M KC1 solution but yields only 30% illite in the same solution containing 4950 mg/liter Mg 2t (0.2 M). However, in order to retard illite formation as much as Mg-bearing solutions do, a solution with 135,000 mg/liter Na t (5.9 M) is required. This suggests that Mg ions more effectively retard the smectite-to-illite conversion than Na t . Our results also show that the effect of these cations is more severe at early stages of conversion (for instance, 3 days vs 10 days in our ex- periments, Table 2). As the conversion approaches 60% illite in I/S, the effects of Mg 2+ and Na + become in- significant. The experimental results for the effect of different cations are listed in Table 2.
In general, our results show that the conversion rate is only slightly affected by [Na § and [Mg 2§ unless concentrations are very high ([Na § >50,000 ppm, [Mg 2t ] > 1500 ppm) relative to average oil field brine ([Na +] = 9400 ppm, [Mg 2+] = 127 ppm). The results also show that Ca 2+ ions, in contrast to Mg 2+ and Na § barely affect the smectite-to-illite conversion rate. The results are significantly different from those obtained by Roberson and Lahann (1981) using Cambers or Polkville montmoril lonite in solution with a fluid/rock ratio (110:1) that is much higher than that (5" 1 ) of this study. In the study o fNa t effect, both studies used Na- saturated montmoril lonite in KC1 + NaC1 solutions and showed the retardation of the rate is comparable in terms of [Nat] / [K t] ratios. In the study of Mg 2+ effect, both studies used Na-saturated montmoril lonite
106
80
f,O 66
._
4O
2 0
10C
8C
if) 6O
.c
4O
20
1 0.6
/ ./
/ /
[]
Vol. 41, No. 2, 1993 Kinetic model for smectite-to-illite conversion 167
0.3 M KCI
10 20 30 TIME (DAYS)
325 ~
6.1 M KCI
275 ~
1 M ~ C I
10 20 30 TIME (DAYS)
.1 M
c 410 50
lOC I 300 ~
80 6 3
~ 1 M KCI .3 M KCI
A 2 0 4 0 ' 0 �9
40 0 26 40 66
TIME (DAYS)
160~ I 2 5 0 ~
8o~
sol
4oL
2o L
%
3 MKCI
/~ ~/ I M KCI
i 810 ~ 20 40 60 100 TIME (DAYS)
D i 120 140
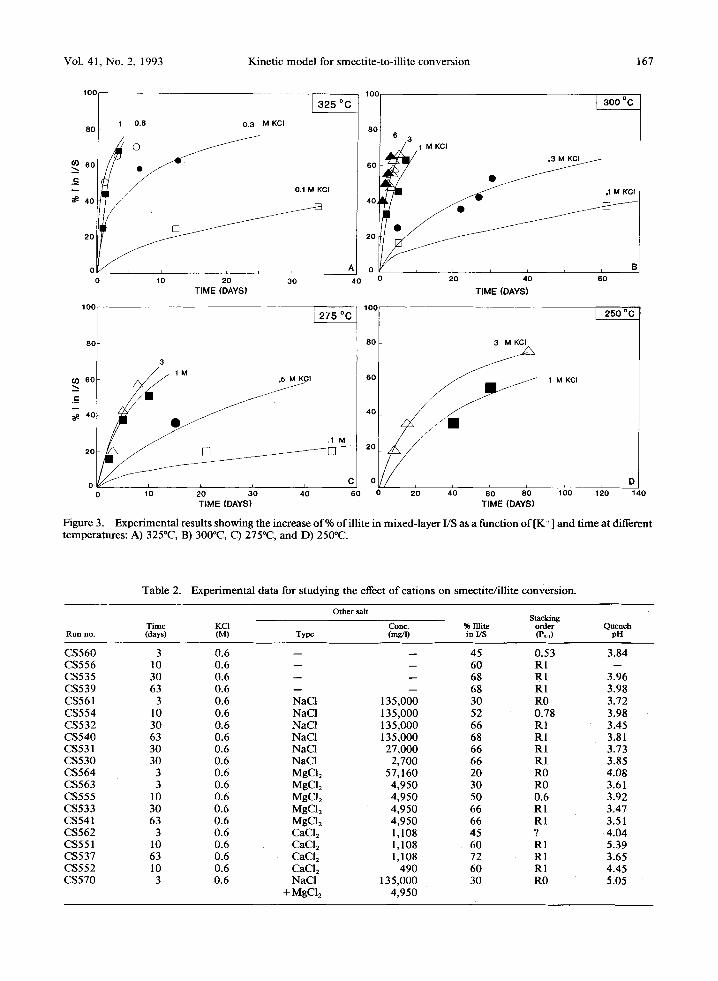
Figure 3. Experimental results showing the increase of% ofillite in mixed-layer I/S as a function of [K § and time at different temperatures: A) 325~ B) 300~ C) 275~ and D) 250~
Table 2. Experimental data for studying the effect of cations on smectite/illite conversion.
Other salt Stacking
Time KCI Cone. % Illite order Quench Run no. (days) (M) Type (rag/I) in I/S (Ps.t) pH
CS560 3 0.6 -- -- 45 0.53 CS556 10 0.6 -- -- 60 RI CS535 30 0.6 -- -- 68 R1 CS539 63 0.6 -- -- 68 R1 CS561 3 0.6 NaCI 135,000 30 R0 CS554 10 0.6 NaC1 135,000 52 0.78 CS532 30 0.6 NaC1 135,000 66 R 1 CS540 63 0.6 NaC1 135,000 68 R 1 CS531 30 0.6 NaC1 27,000 66 R1 CS530 30 0.6 NaC1 2,700 66 R1 CS564 3 0.6 MgCI2 57,160 20 R0 CS563 3 0.6 MgCI2 4,950 30 R0 CS555 10 0.6 MgC12 4,950 50 0.6 CS533 30 0.6 MgCI2 4,950 66 R1 CS541 63 0.6 MgC12 4,950 66 RI CS562 3 0.6 CaC12 1,108 45 ? CS551 10 0.6 CaC12 1,108 60 R 1 CS537 63 0.6 CaC12 1,108 72 R 1 CS552 10 0.6 CaC12 490 60 R 1 CS570 3 0.6 NaCI 135,000 30 R0
+MgC12 4,950
3.84
3.96 3.98 3.72 3.98 3.45 3.81 3.73 3.85 4.08 3.61 3.92 3.47 3.51 4.04 5.39 3.65 4.45 5.05
168 Huang, Long, and Pevear Clays and Clay Minerals
:." Vl I :"
2., II / i v s I~1 �9 ~ l ":.~ / "~ 0.1 M KCI S 0.1
'- t7 / [] i ,�9 ,7!/ i i 0 8 L i i -- i i - - i :30 35 0 . 8 1 ~ i i i ~ E , - -
�9 0 5 10 15 20 25 0 10 20 30 40 50 60 r o TIME (Days) TIME (Days)
2.(~ 3 1 M KCI 3 6 3 M KCI
1/Ss 1/
1.2!
0.8 110 2tO 30 4i0 " 50 0 20 40 60 80 100
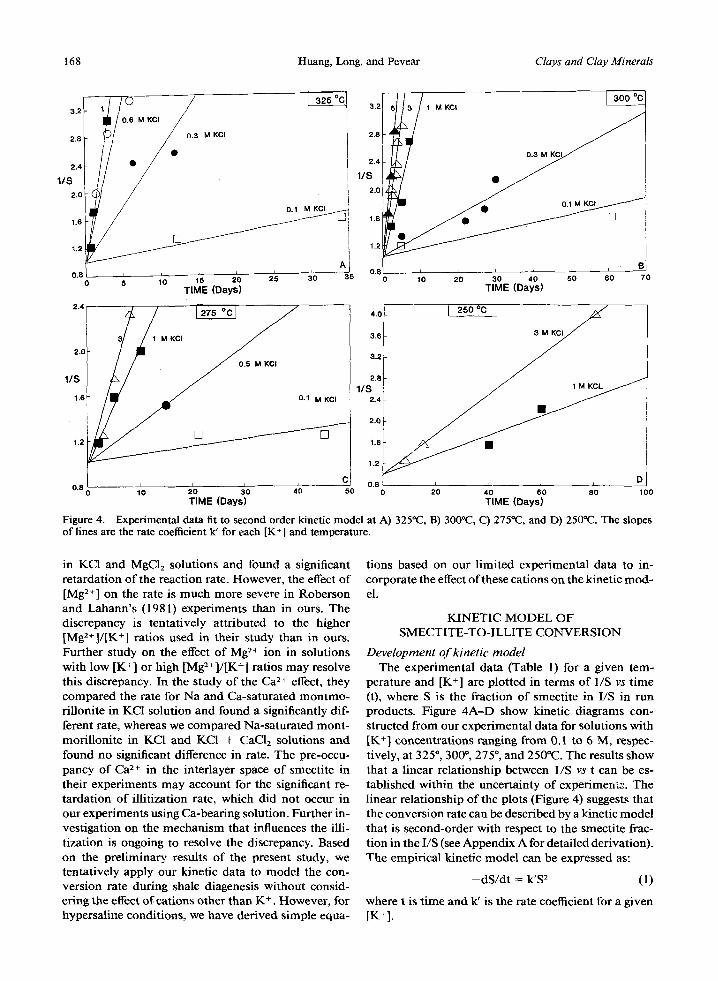
TIME (Days) TIME (Days) Figure 4. Experimental data fit to second order kinetic model at A) 325~ B) 300~ C) 275~ and D) 250~ The slopes of lines are the rate coefficient k' for each [K +] and temperature�9
in KC1 and MgC12 solutions and found a significant retardation of the reaction rate. However, the effect of [Mg 2§ ] on the rate is much more severe in Roberson and Lahann's (1981) experiments than in ours. The discrepancy is tentatively attributed to the higher [Mg2+]/[K +] ratios used in their study than in ours. Further study on the effect of Mg 2§ ion in solutions with low [K § or high [Mg2+]/[K +1 ratios may resolve this discrepancy. In the study of the Ca 2+ effect, they compared the rate for Na and Ca-saturated montmo- rillonite in KCI solution and found a significantly dif- ferent rate, whereas we compared Na-saturated mont- morillonite in KCI and KC1 + CaC12 solutions and found no significant difference in rate. The pre-occu- pancy of Ca 2§ in the interlayer space of smectite in their experiments may account for the significant re- tardation of illitization rate, which did not occur in our experiments using Ca-bearing solution. Further in- vestigation on the mechanism that influences the illi- tization is ongoing to resolve the discrepancy. Based on the preliminary results of the present study, we tentatively apply our kinetic data to model the con- version rate during shale diagenesis without consid- ering the effect of cations other than K + . However, for hypersaline conditions, we have derived simple equa-
tions based on our limited experimental data to in- corporate the effect of these cations on the kinetic mod- el.
KINETIC MODEL OF SMECTITE-TO-ILLITE CONVERSION
Development o f kinetic model The experimental data (Table l) for a given tem-
perature and [K § ] are plotted in terms of 1/S vs time (t), where S is the fraction of smectite in I/S in run products. Figure 4A-D show kinetic diagrams con- structed from our experimental data for solutions with [K +] concentrations ranging from 0.1 to 6 M, respec- tively, at 325 ~ 300 ~ 275 ~ and 250~ The results show that a linear relationship between 1/S vs t can be es- tablished within the uncertainty of experiments. The linear relationship of the plots (Figure 4) suggests that the conversion rate can be described by a kinetic model that is second-order with respect to the smectite frac- tion in the I/S (see Appendix A for detailed derivation). The empirical kinetic model can be expressed as:
- d S / d t = k'S 2 (1)
where t is t ime and k' is the rate coefficient for a given [K+].
Vol. 41, No. 2, 1993 Kinetic model for smectite-to-illite conversion 169
-0.4
~ " -0.8
g 3 2 5
- 1.6 2 2 0 ~ -
-2.0 i
- 2 .4 t " ~ i __:_ _ i _ i - 1.2 -0 .8 -0 .4 0 0.4 0.8
l og [K * ]
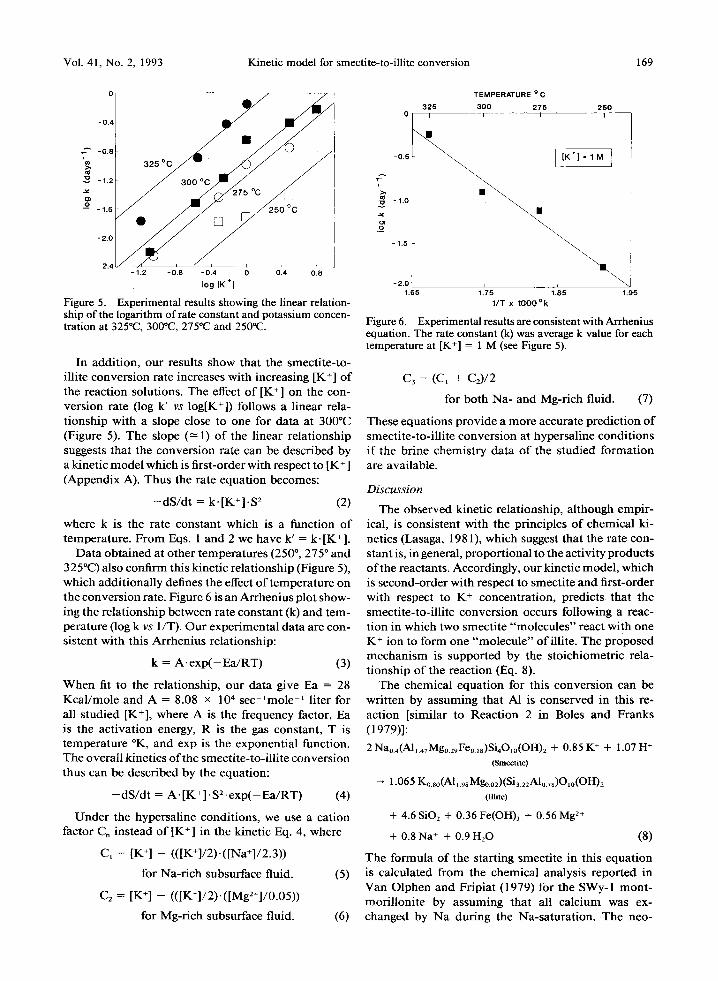
Figure 5. Experimental results showing the linear relation- ship of the logarithm of rate constant and potassium concen- tration at 325~ 300~ 275~ and 250~
In addi t ion, our results show that the smect i te- to- illite convers ion rate increases wi th increasing [K +] o f the react ion solutions. The effect o f [K +] on the con- vers ion rate (log k' vs log[K+]) follows a l inear rela- t ionship wi th a slope close to one for data at 300~ (Figure 5). The slope (-~ 1) o f the l inear re la t ionship suggests that the convers ion rate can be descr ibed by a kinetic m o d e l which is f irst-order with respect to [K + ] (Appendix A). Thus the rate equa t ion becomes:
- d S / d t = k - [K + ]-S 2 (2)
where k is the rate cons tant which is a funct ion o f tempera ture . F r o m Eqs. 1 and 2 we have k' = k-[K§
Data ob ta ined at o ther tempera tures (250 ~ 275 ~ and 325~ also conf i rm this kinet ic re la t ionship (Figure 5), which addi t ional ly defines the effect o f t empera ture on the convers ion rate. Figure 6 is an Arrhenius plot show- ing the re la t ionship be tween rate constant (k) and tem- perature (log k vs 1/T). Our exper imenta l data are con- sistent wi th this Arrhenius relat ionship:
k = A - e x p ( - E a / R T ) (3)
W h e n fit to the relat ionship, our data give Ea = 28 K c a l / m o l e and A = 8.08 x 10⁴ s e c - l m o l e -~ liter for all s tudied [K+], where A is the frequency factor, Ea is the ac t iva t ion energy, R is the gas constant , T is t empera tu re ~ and exp is the exponent ia l function. T h e overal l kinet ics o f the smect i te- to- i l l i te convers ion thus can be descr ibed by the equat ion:
- dS/d t = A. [K + ]- S 2- e x p ( - E a / R T ) (4)
U n d e r the hypersal ine condi t ions, we use a cat ion factor C, instead o f [K § in the kinet ic Eq. 4, where
C~ = [K § - (([K§
for Na- r ich subsurface fluid. (5)
C2 = [K § - (([K§247
for Mg-r ich subsurface fluid. (6)
TEMPERATURE o C
325 300 275 250 0 I I i I
- 0 .5 [ K ' ] 1 M ]
N - 1.o
; , \
-1.5 ~ ,~
-2.0 ~ 1.65 1.75 1.85 1.98
1 / T x 1 0 0 0 ~
Figure 6, Experimental results are consistent with Arrhenius equation. The rate constant (k) was average k value for each temperature at [K +] = 1 M (see Figure 5).
C 3 = ( C 1 q- C2)/2
for bo th Na- and Mg-rich fluid. (7)
These equat ions p rov ide a more accurate predic t ion o f smect i te- to- i l l i te convers ion at hypersal ine condi t ions i f the br ine chemis t ry da ta o f the s tudied fo rma t ion are available.
D i s c u s s i o n
The observed kinet ic relat ionship, a l though empi r - ical, is consis tent wi th the principles o f chemica l ki- netics (Lasaga, 1981), which suggest that the rate con- stant is, in general, p ropor t iona l to the ac t iv i ty products o f the reactants. Accordingly, our kinet ic model , which is second-order wi th respect to smect i te and first-order with respect to K + concentra t ion, predicts that the smect i te- to- i l l i te convers ion occurs fol lowing a reac- t ion in which two smect i te " m o l e c u l e s " react with one K + ion to fo rm one " m o l e c u l e " of i l l i te . The p roposed m e c h a n i s m is suppor ted by the s to ichiometr ic rela- t ionship o f the react ion (Eq. 8).
The chemica l equa t ion for this convers ion can be wri t ten by assuming that A1 is conserved in this re- act ion [similar to Reac t ion 2 in Boles and Franks (1979)]:
2 Nao.,(All.47Mg0.29Fe0.,8)Si4Oio(OH)2 + 0.85 K + + 1.07 H § (Smectite)
1.065 K0.s0(Al ,.98 Mgo.02)(Si3.~2 Alo.78)O10(OH)2 (nine)
+ 4.6 SiO= + 0.36 Fe(On)3 -F 0.56 Mg 2+
+ 0.8 Na § + 0.9 H20 (8)
The formula o f the starting smect i te in this equa t ion is calculated f rom the chemical analysis repor ted in Van Olphen and Fr ip ia t (1979) for the SWy-1 mon t - mor i l lon i te by assuming that all ca lc ium was ex- changed by N a dur ing the Na-satura t ion. The neo-

170 Huang, Long, and Pevear Clays and Clay Minerals
40 AGE 80 % ILLITE in I/S
5 0 0 M a - - . . . . ~ ~
28 ~ 0 pprn [ K" ] 100000 yts O0 2000 pore [ K" ]
-- 24
20 ~Metamorphisrn TEMP ~
200 150 125 100 75 1 6 _ _
1.9 2:1 2'.3 2'.5 217 219 1/T x 1000 OK
Figure 7. Time/temperature/[K +] relationships calculated from the kinetic model for the conversion of smectite to mixed- layer illite/smectite with 80% illite layers. The kinetic model using [K + ] in a range similar to that in average oil field brine (100-200 ppm) reasonably predicts the extent of illitization for four carefully studied shales (Pytte and Reynolds, 1989) from various depths and ages (symbols: O = K-bentonite (450 Ma), �9 = shale (300 Ma), shale (10 Ma) and shale (1 Ma)). Additional field data for samples from a hydrothermal well (Jennings and Thompson, 1986) and contact metamorphic rock (Reynolds, 1981, cited in Pytte and Reynolds, 1989) are also shown. Significantly higher [K +] concentrations are re- quired to model the observed 80% of smectite-to-illite con- version for these samples than those for shales and bentonite.
formed illite formula is calculated from Eq. 8 by assuming A1 conservation and assuming a similar amount of A1 substitution for Si in tetrahedral site as that in a natural illite composition [e.g., Grundy illite (K0.56 Nao.o4 (AlLgMg0.24) (Si3.22Alo.78)Olo(OH)2): Rees- man, 1978]. Because of the lack of composition of neoformed illite, there is a large uncertainty for the above reaction formula. The kinetic mechanism which is second-order with respect to the fraction ofsmectite may alternatively indicate that the surface area of smectite controls the reaction kinetics.
FIELD TESTING OF THE SMECTITE/ILLITE KINETIC MODEL
K + concentration in shalefluids Our experimental results suggest that variation of
[K +] in shale pore fluids can affect the smectite-to-illite conversion rate by as much as an order of magnitude. Therefore, in order to model accurately the conversion kinetics, information about the [K + ] of pore fluids in the studied formation is required. Because of the gen- eral lack of analytical data for shale fluid, the present study attempts to estimate indirectly the [K +] in shale fluids using our kinetic model and the observed extent of smectite-to-illite conversion for four studied shales cited in Pytte and Reynolds (1989).
By integration of the kinetic Eq. 4 using boundary conditions, So = 1 at to = 0 at constant T, we have
S = So/(l +So. [K§ (9)
where So is the smectite fraction in the initial I/S. Using this equation, we are able to calculate a relationship among temperature, time period, and [K +] for 80% smectite-to-illite conversion. The results for 20, 100, 200, 2000 ppm of [K + ] are plotted on Figure 7.
Data for six mixed-layer smectite/illite samples re- ported by Pytte and Reynolds (1989) are also plotted on the same diagram in Figure 7. Four samples are diagenetic, one is a contact metamorphic bentonite, and another is hydrothermal. All of these samples con- tain 80% illite. The results show that the calculated [K +] for four shales (one is bentonite) of diagenetic origin all fall within the range 100 to 200 ppm. This finding suggests that, in the absence of chemical anal- ysis of shale fluid, modeling shale diagenesis may be reasonably done by assuming a [K § of 200 ppm in the shale fluids, which is close to the average [K § ] in subsurface oil field brines (125 ppm) mainly from sand- stone reservoir or sea water (380 ppm) (Broecker and Oversby, 1971). Using this potassium concentration, we are able to predict reasonably the extent of the smectite conversion to i11ite when the actual chemical information of pore fluid in shale is not available (see case studies in next section).
Two samples in Figure 7 are from contact meta- morphic (Reynolds, 1981) and hydrothermal zones (Jennings and Thompson, 1986) and fall in a range of higher [K§ This indicates that the [K § in hydro- thermal and contact metamorphic fluid is significantly higher than in shale and bentonite. This is consistent with observations that show the increase of K/Na ratio in geothermal fluids with increasing aquifer tempera- tures (e.g., Kharaka and Mariner, 1989).
The mechanism that controls the [K § ] in shale with- in this narrow range is not fully understood. We have calculated the [K +] in solutions by equilibrating sea water with illite (with/without K-feldspar) using the geochemical modeling program Gt (C. M. Bethke, Uni- versity of Illinois). Anhydrite was suppressed during the calculation. The calculation was done for near- neutral solution (pH of pure water at 80~ is 6.35 or log Kwso~ c = 12.61) at pH 6.1 and 6.5 (fixed during calculation), each pH calculated at both 60 ~ and 100~ Although the pH of shale water is rarely reported, the assumption of near-neutral pore water in shale is rea- sonable for most shales due to their buffering capabil- ity. Our Gt modeling confirms that the initial pH 8.2 of seawater in contact with illite drifts to 5.5 at 100~ the final equilibrium mineral assemblage includes quartz, muscovite, kaolinite, and smectite. The min- eral assemblages saturated with the equilibrium solu- tions can be categorized into two major groups: one containing illite (or muscovite), kaolinite, and quartz with or without saponite and showing a lower [K +] in

Vol. 41, No. 2, 1993 Kinetic model for smectite-to-illite conversion 171
1200
1000
800
6 0 0 +
4 0 0
" , , . . .
" pH 6.1
Presence o f K-feldspar
pH 6.5
P r e s e n c e o f K - f e l d s p a r 8, k a o l i n i t e
f c o a s t S h a l e \
" . t
o P r e g e / i I
40 160 T E M P E R A T U R E ~
Figure 8. Potassium concentration o f pore f luid (seawater composition) in equi l ibr ium with K-feldspar + il l ite + quartz with or without phengite or i l l ite + kaolinite + quartz with or without saponite as a function of temperature calculated for two fixed pH using the program Gt. The arrow indicates the possible evolution path of [K + ] in the pore fluid of shale containing both kaolinite and K-feldspar such as found in the U.S. Gulf coast. [K + ] tends to approach to the illite + kaolinite + quartz boundary as K-feldspar is consumed.
0 Geotharm. Gradient �9 2.62 ~ m ,+++o+f
.~ �9 ~ �9
f-- Q. 3000
+
+ o
Burial rate -
305 to 122 m/Ma 6000 i , i i
0 20 40 60 80 100
% ILLITE in I /S
Figure 9. Comparison of modeled and observed smectite/ illite conversion found in CWRU Gulf Coast well 6 shale (Hower et al., 1976). Kinetic model predicts the smectite-to- illite conversion by reasonably estimating the geological pa- rameters, such as potassium concentration ([K+]), tempera- ture and age at each depth, for the studied area. Line indicates modeling result whereas symbols indicate field data: cross = <0.1 urn, circle = 0.1 to 0.5 um and square = 0.5 to 2 um.
the solution (e.g., 30 ppm at pH 6.5, 80~ and a second group containing illite (muscovite), K-feldspar (microcline), and quartz with or without phengite and showing a higher [K § in the solution (e.g., 800 ppm at pH 6.5, 80~ see Figure 8). The equilibrium [K § in both groups can significantly increase or decrease, respectively, with a decrease or increase of pH of the pore water (Figure 8). The presence of both K-feldspar and kaolinite in shale, although 'not in equilibrium, may also control the pore fluid chemistry at a steady state condition with [K+]/[H § (or [K +] at constant pH) ranging between these two groups depending on the K-feldspar/kaolinite ratio; the higher the K-feld- spar/kaolinite ratio, the higher the [K+]. Since the min- eralogy of most common shales is rather similar, it is not unexpected that [K + ] can be restricted to a narrow range such as 100 to 300 ppm (big arrow in Figure 8). [K +] may remain near this level until K-feldspar is significantly consumed. The consumption of K-feld- spar may eventually result in the decrease of [K + ] to a level controlled by the illite/kaolinite or illite/smec- tite equilibrium. The similar [K +] observed in sub- surface brines in sandstones may result from the same mineral control. In some organic-rich shales, pH of the pore fluids may significantly deviate from neutrality due to release of organic acids from kerogen in shales (Carothers and Kharaka, 1978). The decrease of fluid pH tends to increase the equilibrium [K +] as well as the rate of K-feldspar dissolution; thus, the smectite- to-illite conversion can significantly increase although the shale mineralogy (e.g., K-feldspar/kaolinite ratio) is similar. However, since the K-feldspar dissolution
does not limit the rate of smectite-to-illite conversion (Altaner, 1986), the effect o fpH on [K +] in shale fluids is mainly controlled by equilibrium (Figure 8').
Comparison with field data
The experimentally determined kinetic equation can be used to simulate smectite diagenesis under a variety of geological conditions. Since the model suggests that the extent of smectite-to-illite conversion depends on heating rate, [K +] in the pore fluids as well as initial smectite/illite ratio, we are able to predict the fraction (or percentage) of illite in an I/S sample at a given geological time if we know these parameters. The heat- ing rate of a sample, in turn, depends on the thermal history (geothermal gradient and burial rate) of the host rock formation. The thermal history required to model the smectite-to-illite conversion can also be estimated from the results of basin thermal modeling (Issler and Beaumont, 1989).
The kinetic equation has been tested using data from a large variety of geologic settings worldwide (e.g., the Gulf of Mexico; Vienna Basin; East Taiwan Basin; Sal- ton Trough Geothermal Area; Husana Basin, Califor- nia). The results show the equation to predict reason- ably the extent of the reaction within our knowledge of the variables involved, such as burial history, po- tassium concentration, thermal gradients, and surface temperature).
Gulf o f Mexico. Figure 9 compares the modeling result with field observations for a Gulf Coast shale (Hewer et al. 1976). The kinetic model can predict the smectite- to-illite conversion by reasonably estimating the gee-

172 Huang, Long, and Pevear Clays and Clay Minerals
"1" I - D.
1000
2 0 0 0
3 0 0 0
0
0%1 30%1 Geotherm. Gradient- 3.3B ~ m
[K " ] - 200 ppm
, i , i I
20 40 60 80 100
% ILLITE in I / $
Comparison of modeled (solid lines) and ob- Figure 10. served (squares) smectite-to-illite conversion for Vienna Ba- sin, Austria (Horton et al., 1985). Two initial I/S composi- tions, 0% and 30% I in I/S, are assumed in the modeling. Burial rates used are discussed in the text.
logical parameters from published information. The Gulf Coast sediments are described as Middle Mio- c e n e - U p p e r Oligocene. A geothermal gradient o f 2.62~ meter (m) is used. This is the average o f the present day thermal gradients that vary from 2.3 ~ to 2.95~ m (Bodner and Sharp, 1988), assuming a surface temperature of 10~ The burial rate for the sediment is chosen to give a 40 million year age (Ma) at 5800 m (305 m/Ma to 1520 m depth and then 122 m/Ma). These rates are similar to those reported for the Gul f Coast by McBride et al. (1987). Potassium concentration is fixed at 200 ppm as previously dis- cussed. Mineralogical data suggest that K-feldspar is the source of K. This source keeps [K +] in this shale nearly constant during the smectite-to-illite conver- sion. When K-feldspar in the shales is completely con- sumed at depths of around 3660 m (Hower et aL, 1976), the [K + ] abruptly drops to a level where both illite and smectite (on the univariant boundary) are stable phases and the smectite-to-illite conversion ceases (Haang, 1990). We model this situation by setting the potas- sium concentration to zero (which stops further reac- tion).
Vienna Basin, Austria. Our kinetic model has also been tested against data (Horton et aL, 1985) from the Vi- enna Basin where the burial and thermal history have been well constrained using organic maturation indi- cators (Johns and Hoefs, 1985; Ladwein, 1988). The smectite-to-illite conversion was modeled for four beds: 17.5 Ma, 16 Ma, 13 Ma, and 12 Ma. The average burial rates for modeling these four beds, respectively, are 162, 119, 82 and 67 m/Ma from the time of deposition of each bed to 8 Ma B. P.; then all four beds were buried at 8 m/Ma from 8 Ma B. P. to present (Johns and Hoefs, 1985; A. Young, personal communication, 1990). The temperature gradients used for modeling these four beds are, respectively, 3.87 ~ , 3.61 ~ , 3.44 ~ , and 3.38~ m, which are similar to the present-
1500
3 0 0 0 IX LU a
4 5 0 0
6 0 0 0
S
�9182
Modelec
�9 Geo therm. G rad ien t �9 1.64 ~ rn
I b Bur ia l Rate �9 4 9 0 0 to 920 m /Ma
D � 9 [K § ] �9 200 pprn
�9 E~ Observed [ ] ~ 0.2 um
[3 �9 < 2 u m
, , i 20 40 60 80 100
% I L L I T E in I / S
Figure 1 l. Comparison of modeled and observed smectite- to-illite conversion for East Taiwan Basin (Dorsey et al., 1988). Four combinations of geothermal gradient and [K +] which give the similar extent of smectite-to-illite conversion as that observed in the field are: 1.64~ m, 200 ppm [K+]; 1.97"(2/ 100 m, 40 ppm [K+]; 2.3"C/100 m, 10 ppm [K+]; 2.62~ 100 m, 2 ppm [K+].
day temperature gradient of 3.48~ m (Johns and Hoefs, 1985). [K § used is 200 ppm for all beds. Since no information is provided about initial smectite com- position, we have plotted two curves by assuming 0% and 30% I in the initial I/S. The predicted depth of significant conversion is in good agreement with min- eralogical data (Figure 10). A thermal history similar to that used in this study also predicts organic matu- ration consistent with the vitrinite field data from the same well (Aderklaa 78 hole, Johns and Hoefs, 1985; A. Young, personal communication, 1990).
East Ta iwan Basin. Figure 11 shows the application of the kinetic model to the East Taiwan Basin. Unlike the previous examples, this basin shows little smectite- to-illite conversion even though the sediments are bur- ied to 5490 m. The burial rate (initially at 4880 m/Ma to 3350 m, then slowly decreasing to 915 m/Ma at greater depths) used in modeling is consistent with that reported by Dorsey et al. (1988) for this basin. By assuming 200 ppm [K + ] and 10~ surface temperature, the present study quantitatively predicts an abnormally low geothermal gradient of 1.64~ m within the sediments of this basin. The abnormally low geother- mal gradient is likely since the rapid accumulation of the young, cold sediments (<4 Ma) may delay thermal equilibration. Alternatively, Dorsey et al. (1988) pro- posed that the rapid decay of the heat flow from the underlying volcanic arc may account for the abnor- mally low thermal gradient. A third possibility is that the low rate of smectite-to-illite conversion may simply reflect a low [K + ] in the fluid of the studied mudstone. This interpretation is consistent with the mineralogical observation that shows only trace amounts of K-feld- spar in the mudstone (Dorsey et aL, 1988). The model predicts a geothermal gradient (2.62~ m) similar to that of Gulf Coast area if a 2 ppm [K +] is assumed
Vol. 41, No. 2, 1993 Kinetic model for smectite-to-illite conversion 173
1500
v 3 0 0 0 "i- I -
UJ
4 5 0 0
Modeled
T 100
).28 uC/100 m and 1220 m /Ma
to
-Thermal event at 20 ,000 yrs
t hen
Temp. increased to present-day temp.
6 0 0 0 , i , 20 40 60 80
% I L L I T E in I / S
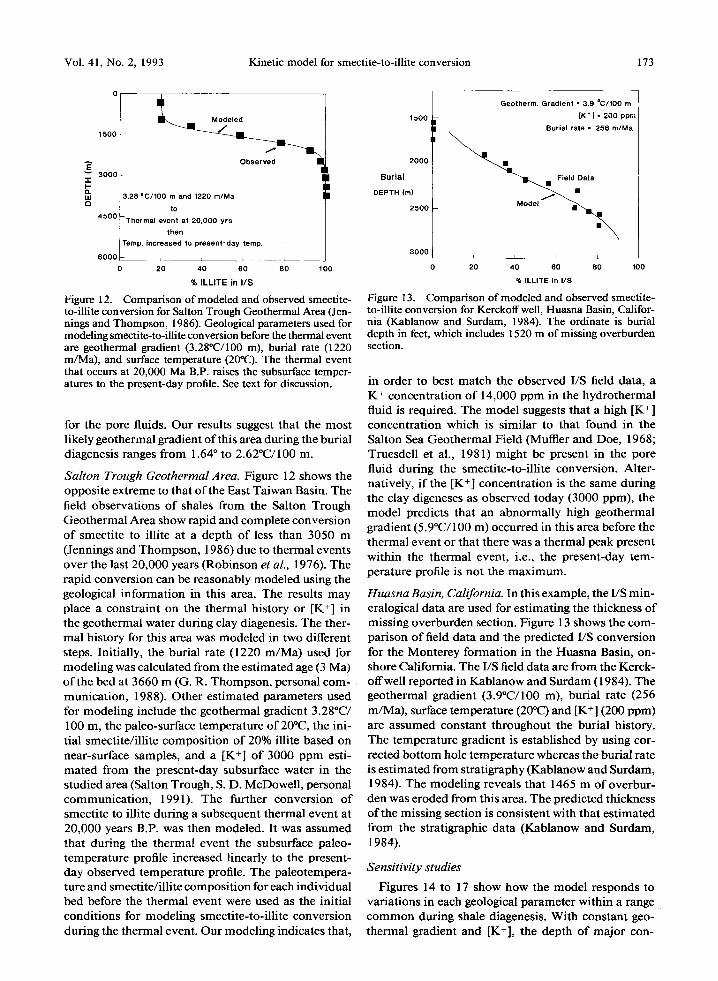
Figure 12. Comparison of modeled and observed smectite- to-illite conversion for Salton Trough Geothermal Area (Jen- nings and Thompson, 1986). Geological parameters used for modeling smectite-to-illite conversion before the thermal event are geothermal gradient (3.28"C/100 m), burial rate (1220 m/Ma), and surface temperature (20~ The thermal event that occurs at 20,000 Ma B.P. raises the subsurface temper- atures to the present-day profile. See text for discussion.
for the pore fluids. Our results suggest that the most likely geothermal gradient of this area during the burial diagenesis ranges from 1.64 ~ to 2.62~ m.
Salton Trough Geothermal Area. Figure 12 shows the opposite extreme to that of the East Taiwan Basin. The field observations of shales from the Salton Trough Geothermal Area show rapid and complete conversion of smectite to illite at a depth of less than 3050 m (Jennings and Thompson, 1986) due to thermal events over the last 20,000 years (Robinson et aL, 1976). The rapid conversion can be reasonably modeled using the geological information in this area. The results may place a constraint on the thermal history or [K § in the geothermal water during clay diagenesis. The ther- mal history for this area was modeled in two different steps. Initially, the burial rate (1220 m/Ma) used for modeling was calculated from the estimated age (3 Ma) of the bed at 3660 m (G. R. Thompson, personal com- munication, 1988). Other estimated parameters used for modeling include the geothermal gradient 3.28~ 100 m, the paleo-surface temperature of 20~ the ini- tial smectite/illite composition of 20% illite based on near-surface samples, and a [K § of 3000 ppm esti- mated from the present-day subsurface water in the studied area (Salton Trough, S. D. McDowell, personal communication, 1991). The further conversion of smectite to illite during a subsequent thermal event at 20,000 years B.P. was then modeled. It was assumed that during the thermal event the subsurface paleo- temperature profile increased linearly to the present- day observed temperature profile. The paleotempera- ture and smectite/illite composition for each individual bed before the thermal event were used as the initial conditions for modeling smectite-to-illite conversion during the thermal event. Our modeling indicates that,
Geotherm. Gradient - 3.9 ~ m
1500 {K" I - 200 ppm I
o o o
B u r i a l ata
DEPTH (m)
2 5 0 0 Model ~
3 0 0 0 ) i i i
0 20 40 60 80 100
% ILLITE in I /S
Figure 13. Comparison of modeled and observed smectite- to-illite conversion for Kerckoffwell, Huasna Basin, Califor- nia (Kablanow and Surdam, 1984). The ordinate is burial depth in feet, which includes 1520 m of missing overburden section.
in order to best match the observed US field data, a K § concentration of 14,000 ppm in the hydrothermal fluid is required. The model suggests that a high [K § concentration which is similar to that found in the Salton Sea Geothermal Field (Muffler and Doe, 1968; Truesdell et al., 1981) might be present in the pore fluid during the smectite-to-illite conversion. Alter- natively, if the [K +] concentration is the same during the clay digeneses as observed today (3000 ppm), the model predicts that an abnormally high geothermal gradient (5.9~ m) occurred in this area before the thermal event or that there was a thermal peak present within the thermal event, i.e., the present-day tem- perature profile is not the maximum.
Huasna Basin, California. In this example, the I/S min- eralogical data are used for estimating the thickness of missing overburden section. Figure 13 shows the com- parison of field data and the predicted I/S conversion for the Monterey formation in the Huasna Basin, on- shore California. The I/S field data are from the Kerck- off well reported in Kablanow and Surdam (1984). The geothermal gradient (3.9~ m), burial rate (256 m/Ma), surface temperature (20~ and [K § (200 ppm) are assumed constant throughout the burial history. The temperature gradient is established by using cor- rected bottom hole temperature whereas the burial rate is estimated from stratigraphy (Kablanow and Surdam, 1984). The modeling reveals that 1465 m of overbur- den was eroded from this area. The predicted thickness of the missing section is consistent with that estimated from the stratigraphic data (Kablanow and Surdam, 1984).
Sensitivity studies
Figures 14 to 17 show how the model responds to variations in each geological parameter within a range common during shale diagenesis. With constant geo- thermal gradient and [K+], the depth of major con-

174 Huang, Long, and Pevear Clays and Clay Minerals
0 Therm. Grad.- 2 .62~ m
[ K* ] = 200 ppm
Z ate = 153 m/Ma I-- 3 0 0 0
6000 ~ ,
O 20 40 60 80 100
% I L L I T E in I / S
Figure 14. Sensitivity study showing the effect of burial rate on the modeling of smectite-to-illite conversion.
150~
"l- 300( I - a. LU
450
600(
Burial Rate - 153 m/Ma
] ] T h e r m Gradient �9 2.62 ~ rn
i h , i
20 40 60 80 100
% I L L I T E in I / S
Figure 16. Sensitivity study showing the effect of initial smectite/illite composition on the modeling of smectite-to- illite conversion.
version varies only within a range of 500 m as the burial rate changes from 76 to 305 m/Ma (Figure 14).
On the other hand, a slight change in the geothermal gradient can drastically affect the depth a t which the major conversion occurs (Figure 15). The depth can be decreased as much as 1520 m just by changing the geothermal gradient from 1.97 ~ to 3.28~ m. This confirms that temperature is by far the most important factor influencing the smectite-to-iUite conversion rate and that the model can be used as a geothermometer to constrain a basin's thermal history.
Figure 16 shows the effect of initial illite percentage in the mixed-layer smectite/illite on the extent ofsmec- tite-to-illite conversion. The results show that the effect is initially significant but negligible where there is ma- jor conversion.
The modeling results show that the depth of major conversion varies within a range of 400 m as the [K +] is increased from 100 to 300 ppm (Figure 17). The effect of [K + ] is generally less than that of temperature during shale diagenesis. However, at very low [K+], a variation from 1 to 10 ppm has an effect as great as from 100 to 1000 ppm.
0 Burial Rate - 153 m/Ma
1500 ~_ [ K+ ] �9 200 ppm
[ \ ~ Geoth . . . . G,adient -
~ . 9 7
6000 , ,
0 20 40 60 80 100
% I L L I T E in I / S
Figure 15. Sensitivity study showing the effect of geothermal gradient on the modeling of smectite-to-illite conversion.
IMPLICATIONS FOR PETROLEUM EXPLORATION
The experimentally derived kinetic model can be used to predict the extent, depth, and timing of smec- tite-to-illite conversion in a shale if the geological vari- ables such as thermal history are known. Predicting depth or timing of smectite-to-illite conversion, in turn, might be used to risk the sealing integrity of shale, the reservoir quality of an adjacent sandstone, as well as the potential for overpressure (see review in Eslinger and Pevear, 1988). This technique is particularly useful in frontier areas where few well data are available. The burial and thermal history of the target formation re- quired for the modeling can be estimated using a basin modeling program such as reported by Issler and Beau- mont (1989).
On the other hand, the model can also be used to constrain basin thermal history if field data for the smectite-to-illite ratio in mixed-layer smectite/illite are available from cores or cuttings. The reaction kinetics provide an independent calibration for other matura-
0 [ / Therm. Gradient . 2.62 ~ m
1 5 0 0 ~ Burial Rate - 153 m/Ma
o m
E
6000 r- , , , , /
0 20 40 60 80 100
% I L L I T E in I / S
Figure 17. Sensitivity study showing the effect of potassium concentration on the modeling of smectite-to-illite conver- sion.

Vol. 41, No. 2, 1993 Kinetic model for smectite-to-illite conversion 175
tion indicators such as vitrinite reflectance, TAI or Tmax. The calibration can be used to refine the proposed thermal history model for a better prediction of hy- drocarbon maturation.
In addition, the incorporation of K into the diage- netic illite allows the mean age of illite formation to be dated using standard K/Ar methods. Because K § is incorporated into mixed-layer smectite/illite at a rate proportional to the conversion rate, the K/Ar age o f the mixed-layer smectite/illite can be calculated using burial history and smectite/illite ratio. The calculated age, when compared with the measured K/Ar age (e.g., Aronson and Hower, 1976) can be used as an inde- pendent calibration o f the burial history used in mod- eling smectite/illite conversion (Elliott et al., 1991; Pevear, 1992).
CONCLUSIONS
The kinetics of smectite-to-illite conversion are ex- perimentally quantified. The results show that the con- version rate can be described by a simple rate law that is second-order with respect to the fraction of smectite in the mixed-layer illite/smectite and first-order with respect to K § concentration. Our study concludes that temperature, time, and potassium concentration are by far the most important parameters controlling smec- tite-to-illite conversion.
Our model demonstrates that the variation o f [K § ] in shales can be limited to a narrow range (100-200 ppm). Assuming a range of K § concentration similar to those found in oil field brines (100-200 ppm), our model can accurately predict the extent of the smectite- to-illite conversion for a number of studied shales (Pytte and Reynolds, 1989) from various depths and ages. This finding has significantly reduced the uncertainty of the model due to the lack of information about [K § ] in the pore fluids of shales and thus improved the applicability o f the model to predict smectite-to-illite conversion during shale diagenesis.
The model has also been tested on data from a wide variety of geological settings (Gulf o f Mexico, East Tai- wan Basin, Salton Trough Geothermal Area). The re- suits show that the equation can reasonably predict the extent of the smectite-to-illite conversion within our knowledge of variables involved.
This quantitative model is useful for modeling the depth and timing of the conversion during shale dia- genesis under a variety o f thermal histories. The model can be used as a geothermometer to constrain basin thermal history if well data (percent illite in I/S) are available. It can also improve our ability to predict reservoir quality and seal integrity adjacent to a smec- tire-bearing formation. In addition, the comparison of calculated and measured K/Ar ages of mixed-layer smectite/illite provides an independent constraint on the burial history of a studied formation (Pevear, 1992).
A C K N O W L E D G M E N T S
The authors wish to thank our colleagues G. A. Otten for carrying out hydrothermal experiments, T. M. Fleissner for preparing X-ray patterns shown in Figure 5, R. E. Klimentidis for performing TEM studies o f starting smectite and experimental run products, A1 Young and W. James for testing the kinetic model in a basin modeling program, and E. J. Novotny for crit- ical review and discussion o f an early version o f this paper. Critical reviews and comments from S. P. A1- taner, D. D. Eberl, and E. Eslinger significantly con- tributed to the improvement of the final version of the paper.
REFERENCES
Altaner, S. P. (1986) Comparison of rates of smectite illi- tization with rates of K-feldspar dissolution: Clays & Clay Minerals 34, 608-611.
Altaner, S. P. (1989) Calculation of K diffusional rates in bentonite beds: Geochim. Cosmochim. Acta 53, 923-931.
Aronson, J. L. and Hower, J. (1976) Mechanism of burial metamorphism of argillaceous sediment: 2. Radiogenic ar- gon evidence: Geol. Soc. Amer. Bull. 87, 738-744.
Bethke, C. M. and Altaner, S. P. (1986) Layer-by-layer mechanism of smectite illitization and application to new rate law: Clays & Clay Minerals 34, 146-154.
Bethke, C. M., Vergo, N., and Altaner, S.P. (1986) Pathways of smectite illitization: Clays & Clay Minerals 34, 125-135.
Bodner, D. P. and Sharp, J. M., Jr. (1988) Temperature variations in south Texas subsurface: Amer. Assoc. Petrol. Geologist Bull. 82, 21-32.
Boles, J. R. and Franks, S. G. (1979) Clay diagenesis in Wilcox Sandstones of Southwest Texas: Implications of Smectite Diagenesis on Sandstone Cementation: J. Sed. Petrol. 49, 55-70.
Broecker, W. S. and Oversby, V. M., ( 1971) Chemical Equi- librium in the Earth: McGraw-Hill Book Company, New York.
Bruce, C. H. (1984) Smectite dehydration--Its relation to structural development and hydrocarbon accumulation in Northern Gulf of Mexico Basin: Amer. Assoc. Petrol. Ge- ologists Bull. 68, 673-683.
Carothers, W. W. and Kharaka, Y.K. (1978) Aliphatic acid anions in oilfield waters--Implications for origin of natural gas: Am. Assoc. Petroleum Geologists Bull. 62, 2441-2453.
Dorsey, R. J., Buchovecky, E. J., and Lundberg, N. (1988) Clay mineralogy and Pliocene-Pleistocene mudstone, east- ern Taiwan: Combined effects of burial diagenesis and provenance unroofing: Geology 16, 944-947.
Eberl, D. D. (1977) The hydrothermal transformation of sodium and potassium smectite into mixed-layer clay: Clays & Clay Minerals 25, 215-227.
Eberl, D. D. (1978) The reaction of montmorillonite to mixed-layer clay: The effect of interlayer alkali and alkaline earth cations: Geochim. Cosmochim. Acta 42, 1-7.
Eberl, D. D. and Hower, J. (1976) Kinetics of illite for- mation: Geol. Soc. Amer. Bull. 87, 1326-1330.
Eberl, D. D., Srodon, J., Kralik, M., Yaylor, B. E., and Pe- terman, Z. E. (1990) Ostwald ripening of clays and meta- morphic minerals: Science 248, 474-477.
Elliott, W. C., Aronson, J. L., Matisoff, G., and Gautier, D. L. (1991) Kinetics of the smectite to illite transformation in the Denver Basin: Clay mineral, K-At Data, and math- ematical model results: Amer. Assoc. Petrol. Geologists Bull. 75, 436-462.

176 Huang, Long, and Pevear Clays and Clay Minerals
Eslinger, E. V. and Pevear, D. R. (1988) Clay Minerals for Petroleum Geologists and Engineers: Soc. Econ. Paleon- tologists Mineralogists Short Course No. 22.
Garrels, R. M. (1984) Montmorillonite/illite stability dia- grams: Clays & Clay Minerals 3, 161-166.
Giiven, N., and Huang, W. L. (1991) Effect ofoctahedral Mg 2+ and Fe 3+ substitutions on hydrothermal illitization reactions: Clays & Clay Minerals 39, 387-399.
Horton, R. B., Johns, W. D., and Kurzweil, H. (1985) Illite diagenesis in the Vienna Basin, Austria: TMPM Tscher- maks Min. Petr. Mitt. 34, 239-260.
Hower, J., Eslinger, E. V., Hower, M. E., and Perry, E. A, (1976) Mechanism ofburial metamorphism ofargillaceous sediments: 1. Mineralogical and chemical evidence: Geol. Soc. Amer. Bull. 87, 725-737.
Howard, J. J. and Roy, D.M. (1985) Development of layer charge and kinetics of experimental smectite alteration: Clays & Clay Minerals 33, 81-88.
Huang, W. L. and Otten, G .A. (1987) Smectite illitization: effect of smectite composition: in Program and Abstracts, 24th Annual Meeting, The Clay Minerals Society, Socorro, New Mexico, 75.
Huang, W. L. (1989) Control on ordering of mixed-layer smectite/illite: An experimental study: in Program andAb- stracts, 26th Annual Meeting, The Clay Minerals Society, Sacramento, California, 94.
Huang, W. L. (1990) Experimental illitization of smectite and reerystallization of illite: in Programme and Abstracts, Research Conference on Phyllosilicates as Indicators of Very Low Grade Metamorphism and Diagenesis, IGCP, Man- chester, 10.
Huang, W. L. (1992) Illitic clay formation during experi- mental diagenesis of arkoses: in Origin, Diagenesis, and Petrophysics of Clay Minerals in Sandstones, D. W. House- knecht and E. D. Pittman, eds., Soc. Econ. Paleont. Mined. , Special Publication 47, 49-63.
Inoue, A. and Utada, M. (1978) Further Invesflgations of a conversion series of diochahedral mica/smectites in the Shinzan hydrothermal alteration area, northeast Japan: Clays & Clay Minerals 31, 400-412.
Inoue, A., Kohyama, N., Kitagawa, R., and Watanabe, T. (1987) Chemical and morphological evidence for the con- version ofsmectite to illite: Clays & Clay Minerals 35, 111- 120.
Issler, D. R. and Beaumont, C. (1989) Finite element model of the subsidence and thermal evolution of extensional ba- sins: Application to the Labrador Continental Margin: in Thermal History of Sedimentary Basins, N. D. Naeser and T. H. McCulloh, eds., Springer-Verlag, New York, 239- 267.
Jennings, S. and Thompson, G.R. (1986) Diagenesis of Plio- Pleistocene sediments of the Colorado River Delta, Southern California: J. Sed. Petrol. 56, 89-98.
Johns, W. D. and Hoefs, J. (1985) Maturation of organic matter in Neogene sediments from the Aderklaa oilfield, Vienna Basin, Austria: TMPM Tschemaks Min. Petr. Mitt. 34, 143-158.
Kablanow II, R. I. and Surdam, R. C. (1984) Diagenesis and hydrocarbon generation in the Monterey Formation, Huasna Basin, California: SEPM Guidebook 2, 53-68.
Kacandes, G. H., Barnes, H. L., and Kump, L. R. (1991) The smectite to illite reaction: fluid & solids evolution un- der flow-through conditions: in Program and Abstracts, 28th Annual Meeting, The Clay Minerals Society, Houston, Tex- as, 95.
Kharaka, Y. K. and Mariner, R. H. (1989) Chemical geo- thermometers and their application to formation waters from sedimentary basins: in Thermal History of Sedimen- taryBasins, N. D. Naeser and T. H. McCulloh, eds., Spring- er-Verlag, New York, 99-117.
Ladwein, H. W. (1988) Organic geochemistry of Vienna Basin: Model for hydrocarbon generation in overthrust belts: Am. Assoc. Petrol. Geologist Bull. 72, 586-599.
Lasaga, A. C. (1981) Rate laws of chemical reactions: in Kinetics of Geochemical Processes: Review of Mineralogy, A. C. Lasaga and R. J. Kirkpatrick, eds., Mineral. Soc. Amer. 8, 1-68.
McBride, E. F., Land, L. S., and Mack, L. E. (1987) Dia- genesis of eolian and fluvial feldspathic sandstones, Nor- phlet Formation (Upper Jurassic), Rankin County, Missis- sippi, and Mobile County, Alabama: Amer. Assoc. Petrol. Geologist Bull. 71, 1019-1034.
Muffler, L. J. P. and Doe, B. R. (1968) Composition and mean age of detritus of the Colorado River delta in the Salton Trough, southeastern California: J. Sed. Petrol. 38, 384--399.
Nadeau, P. H., Wilson, M. J., McHards, W. J., and Tait, J. M. (1984) Interparticle diffractions: A new concept for interstratified clays: Clay Miner. 19, 757-769.
Pevear, D. R. (1992) Illite age analysis, a new tool for basin thermal history analysis: in Proceeding 7th International Symposium on Water-Rock Interaction: Y. Kharaka, ed., A. B. Balkema, Rotterdam and Boston, 1251-1254.
Pytte, A. M. and Reynolds, R.C. (1989) The thermal trans- formation of smectite to illite: in Thermal History of Sed- imentary Basins, N. D. Naeser and T. H. McCulloh, eds., Springer-Verlag, New York, 133-140.
Reesman, A.L. (1978) Extrapolation ofaqueous dissolution data to determine comparative free energies of formation (C AGr ~ and relative mineral stabilities: Clays & ClayMin- erals 26, 217-226.
Reynolds Jr., R, C. (1981) Mixed-layered illite-smectite in a contact metamorphic environment: in Program and Ab- stracts, 28th Annual Meeting, The Clay Minerals Society, Urbana, Illinois, 5.
Reynolds Jr., R. C. (1980) Interstratified layer minerals: in Crystal Structures of Clay Minerals and their X-ray Iden- tifwation, G. W. Brindley and G. Brown, eds., Mineralogical Society London, 249-303.
Reynolds Jr., R. C. and Hower, J. (1970) The nature of interlayering in mixed-layer illite-montmorillonites: Clays & Clay Minerals 18, 25-26.
Roberson, H. E. and Lahann, R.W. (1981) Smectite to illite conversion rates: Effect of solution chemistry: Clays & Clay Minerals 29, 129-135.
Robinson, P. T., Elders, W. A., and Muffler, L. P.J . (1976) Quaternary volcanism in the Salton Sea Geothermal Field, Imperial Valley, California: Geol. Soc. Amer. Bull. 87, 347- 360.
Sass, B. M., Rosenberg, P. E., and Kittrick, J. A. (1987) The stability ofillite/smectite during diagenesis: An experimen- tal study: Geochim. Cosmochim. Acta 51, 2103-2115.
Srodofi, J. and Eberl, D. D. (1984) Illite: in Mica." Review of Mineralogy, S. W. Bailey, ed., Mineral. Soc. Amer. 13, 495-539.
Truesdell, A. H., Thompson, J. M., Coplen, T. B., Nehring, N. L., and Janik, C. J. (1981) The origin of the Cerro Prieto Geothermal Brine: Geothermics 10, 225-238.
Van Olphen, H. and Fripiat, J. J. (1979) Data Handbook for Clay Materials and other Non-metallic Minerals: Per- gamon Press, New York, 345 pp.
Velde, B., and Vasseur, G. (1992) Estimation of the dia- genetic smectite illite transformation in time-temperature space; Amer. Mineral. 77, 967-976.
Whitney, G. and Northrop, H. R. (1988) Experimental in- vestigation of the smectite to illite reaction: Dual reaction mechanisms and oxygen-isotope systematics: Amer. Min- eral. 73, 77-90.
Yau, Y., Peacor, D. R., and McDowell, S.D. (1987) Smectite to illite reactions in Salton Sea shales: A transmission and
Vol. 41, No. 2, 1993 Kinet ic mode l for smectite-to-il l i te convers ion 177
analytical electron microscopic study: J. Sed. Petrol. 57, 335-342.
(Received 18 February 1993; accepted 3 March 1993; Ms. 2332)
A P P E N D I X A
K I N E T I C M O D E L D E V E L O P E D F R O M
E X P E R I M E N T A L D A T A
Mode l development
The general kinetic equa t ion for smecti te-to-i l l i te convers ion at cons tan t t empera ture and pressure can be writ ten as
- d S / d t = k. [K+] a- S b (A- l)
where S is the mole fraction o f smect i te in the mixed- layer i l l i te/smectite, t is t ime, [K +] is the concentra t ion o f potas- s i um ions, k is the rate constant , a and b are cons tan ts (Pytte and Reynolds , 1989).
At cons tan t [K+], the equa t ion can be rewrit ten as
- d S / d t = k ' .S b (A-2)
where k' = k. [K+] a. The equat ion indicates tha t the decrease o f the smect i te fraction in the mixed- layer smectite/i l l i te with t ime is proport ional to the b power o f the mole fraction o f smecti te . I f b = 2, i.e., the kinetics are second-order with respect to the mole fraction ofsmect i te , the equat ion becomes:
- d S / d t = k ' .S 2
or (A-3)
- d S / S 2 = k 'd t
Integrat ing this equa t ion we have
1/S = k ' . t + I (A-4a)
where I is an integrat ion constant . Wi th bounda ry condi t ions , S = 1 at t = 0, we have I = 1. Eq. 6 becomes
1/S = k ' - t + 1 (A-4b)
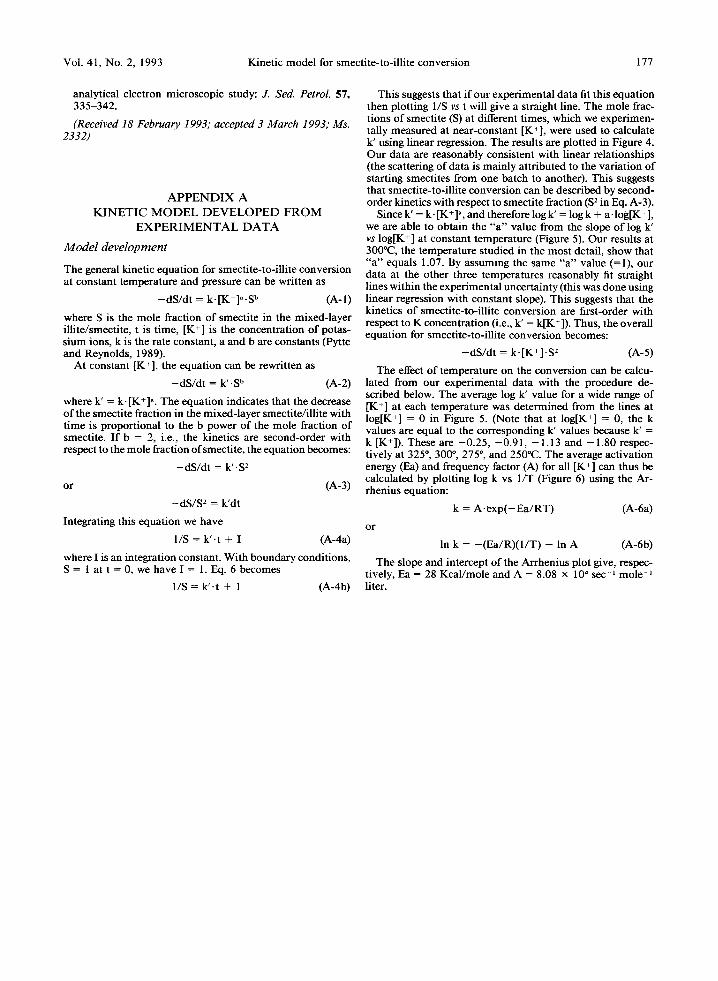
Th i s suggests tha t i f our exper imenta l da ta fit th is equa t ion then plott ing 1/S vs t will give a straight line. The mole frac- t ions o f smect i te (S) at different t imes, which we exper imen- tally measu red at near -cons tan t [K+], were used to calculate k' us ing l inear regression. The results are plot ted in Figure 4. Our da ta are reasonably consis tent with l inear re la t ionships (the scattering o f da ta is ma in ly a t t r ibuted to the var ia t ion o f start ing smect i tes f rom one batch to another) . This suggests tha t smecti te-to-i l l i te convers ion can be described by second- order kinetics with respect to smect i te fraction (S 2 in Eq. A-3).
Since k' = k- [K § ]a, and therefore log k' = log k + a . log[K + ], we are able to obta in the " a " value f rom the slope o f log k' vs log[K + ] at cons tan t t empera tu re (Figure 5). Our results at 300~ the t empera tu re s tudied in the m o s t detail, show that " a " equals 1.07. By a s s u m i n g the s ame "a'" value (= l ) , our da ta at the other three t empera tures reasonably fit straight l ines wi thin the exper imenta l uncer ta in ty (this was done us ing l inear regression with cons tan t slope). Th i s suggests tha t the kinetics o f smectite-to-il l i te convers ion are first-order with respect to K concent ra t ion (i.e., k' = k[K+]). Thus , the overall equa t ion for smecti te-to-i l l i te convers ion becomes:
- d S / d t = k. [K + ]. S 2 (A-5)
The effect o f t empera ture on the convers ion can be calcu- lated f rom our exper imenta l da ta with the procedure de- scribed below. The average log k' va lue for a wide range o f [K +] at each t empera tu re was de te rmined f rom the l ines at log[K +] = 0 in Figure 5. (Note tha t at log[K +] = 0, the k va lues are equal to the cor responding k' values because k' = k [K+]). These are - 0 . 2 5 , - 0 . 9 1 , - 1 . 1 3 and - 1 . 8 0 respec- t ively at 325 ~ 300 ~ 275 ~ and 250"C. The average act ivat ion energy (Ea) and frequency factor (A) for all [K + ] can thus be calculated by plott ing log k vs 1/T (Figure 6) us ing the Ar- rhen ius equation:
k = A - e x p ( - E a / R T ) (A-6a)
or
I n k = - ( E a / R ) ( 1 / T ) + In A (A-6b)
The slope and intercept o f the Ar rhen ius plot give, respec- tively, Ea = 28 Kca l /mole and A = 8.08 x 10⁴ sec -~ mole -~ liter.


![Designing a Low Voltage, High Current Tunneling Transistor · Consequently, we use an experimentally fitted tunneling effective mass derived in [1]. While in [1] a single band tunneling](https://img.pdfslide.net/doc/110x75/5f11a224e66364575f479f31/designing-a-low-voltage-high-current-tunneling-transistor-consequently-we-use.jpg)