Embed Size (px)
Citation preview
An expert system for diagnosis of the heart valve diseases
I. Turkoglua,*, A. Arslanb, E. Ilkayc
aDepartment of Electronics and Computer Science, Technical Education Faculty, Firat University, 23119 Elazig, TurkeybDepartment of Computer Engineering, Firat University, 23119 Elazig, Turkey
cDepartment of Cardiology, Firat University, 23119 Elazig, Turkey
Abstract
In this paper, an expert diagnosis system is presented for interpretation of the Doppler signals of the heart valve diseases based on the
pattern recognition. This paper especially deals with the feature extraction from measured Doppler signal waveforms at the heart valve using
the Doppler Ultrasound. Wavelet transforms and short time Fourier transform methods are used to feature extract from the Doppler signals on
the time–frequency domain. Wavelet entropy method is applied to these features. The back-propagation neural network is used to classify
the extracted features. The performance of the developed system has been evaluated in 215 samples. The test results showed that this system
was effective to detect Doppler heart sounds. The correct classification rate was about 94% for normal subjects and 95.9% for abnormal
subjects. q 2002 Elsevier Science Ltd. All rights reserved.
Keywords: Pattern recognition; Doppler heart sounds; Heart valves; Feature extraction; Wavelet decomposition; Spectrograms; Neural networks; Expert
systems
1. Introduction
Researches showed that the most of human deaths in
the world are due to heart diseases. The heart valve
disorders are of importance among the heart diseases.
Among them, mitral and aortic valve disorders are the
most common ones. For this reason, early detection of
heart valve disorders is one of the most important medical
research areas (Akay, Akay, & Welkowitz, 1992). Today,
the used methods for diagnosis of heart valve disorders
are non-invasive techniques (electrocardiograms, chest
X-rays, heart sounds and murmur from stethoscope,
ultrasound imaging and Doppler techniques) and invasive
techniques (angiography, transozefagial echocardiograph
(Nanda, 1993). However, each method is limited in its
ability to offer efficient and thorough detection and
characterization (Plett, 2000). All of these methods are
based on experience and information of physician. The
researches in this area are focused on improving human–
machine interfaces in existing methods. In this way, the
cardiologist can understand the output of the examination
systems more easily and diagnose the problem more
accurately (Philpot, Yoganathan, & Nanda, 1993).
Doppler techniques are the most preferred because of
their completely non-invasive and without risk in the serial
studies. The technique has improved much since Satomura
first demonstrated the application of the Doppler effect to
the measurement of blood velocity in 1959 (Keeton &
Schlindwein, 1997). In recent years, Doppler technique has
found increasing use in the assessment of heart disease
(Wright, Gough, Rakebrandt, Wahab, & Woodcock, 1997).
Doppler heart sounds (DHS) are one of the most important
sounds produced by blood flow, valves motion and vibration
of the other cardiovascular components (Jing, Xuemin,
Mingshi, & Wie, 1997). However, the factors such as
calcified disease or obesity often results in a diagnostically
unsatisfactory Doppler techniques assessment and, there-
fore, it is sometimes necessary to assess the spectrogram of
the Doppler shift signals to elucidate the degree of the
disease (Wright et al., 1997). A major motivation in our
work is to aid the diagnosis in such cases. Among Doppler
techniques, the most ubiquitous and straightforward are
waveform profile indices such as the pulsatility index (PI),
Pourcelot or resistance index (RI) and A/B Systolic Diastolic
ratio, which are highly correlated and led to highly
erroneous diagnostic results (Izzetoglu, Erkmen, & Beksac,
1995). These indices rely on the peak systolic and end-
diastolic velocities, with only the PI making use of the mean
velocity over the cardiac cycle. More sophisticated methods
have also been developed such as the Laplace transform and
principal components analysis. However, none of the simple
or more complex analytical techniques has yielded an
acceptable diagnostic accuracy so as to be commonplace in
0957-4174/02/$ - see front matter q 2002 Elsevier Science Ltd. All rights reserved.
PII: S0 95 7 -4 17 4 (0 2) 00 0 42 -8
Expert Systems with Applications 23 (2002) 229–236
www.elsevier.com/locate/eswa
* Corresponding author. Fax: þ90-424-2184674.
E-mail address: [email protected] (I. Turkoglu).
the vascular clinic (Wright et al., 1997). In this study, the
developed method is an expert diagnosis system and will
cause more effective usage of the Doppler technique. Until
now, many attempts have been undertaken to automatically
classify Doppler signals using pattern recognition (Chan,
Chan, Lam, Lui, & Poon, 1997; Guler & Kara, 1995).
Nevertheless, the studies on the DHS are fairly limited.
This study will introduce the technique that will aid
clinical diagnosis, enable further research of heart valve
disorders, and provide a novel expert system for recognition
of heart valve disorders. This study uses the powerful
mathematics of wavelet signal processing and entropy,
short-time Fourier transform (STFT) to efficiently extract
the features from pre-processed Doppler signals for the
purpose of recognizing between abnormal and normal of the
heart valve. An algorithm called the expert diagnostic
system is developed which is approximately the advanced
pattern recognition.
The DHS can be obtained simply by placing the Doppler
ultrasonic flow transducer over the chest of the patient. A
disadvantage of the Doppler method is that it requires the
constant attention of the doctor to detect subtle changes in
the DHS (Chan et al., 1997). The presented method prevents
subtle changes in the DHS from escaping physician’s eye by
perceiving them, even if the physician does not pay a
continuous attention.
The realized study has the stages of decision and
evaluation contrary to the existing diagnosis methods.
Thus, the doctor can make a comparison between the
diagnoses of developed method and the diagnoses of
existing methods. If the results are different, the examin-
ations can be repeated or performed more carefully. In this
way, the physician can decide more realistic.
The paper is organized as follows. In Section 2, we
review some basic properties of the pattern recognition, the
Doppler heart signals, wavelet decomposition, STFT,
wavelet entropy and neural networks. A new expert
diagnostic system is described in Section 3. This new
method enables a large reduction of the Doppler signal data
while retaining problem specific information which facili-
tates an efficient pattern recognition process. The effective-
ness of the proposed method for classification of Doppler
signals in the diagnosis of heart valve diseases is
demonstrated in Section 4. Finally Section 5 presents
discussion and conclusion.
2. Preliminaries
In this section, the theoretical foundations for the expert
diagnosis system used in the presented study are given in the
following subsections.
2.1. Pattern recognition
Pattern recognition can be divided into a sequence of
stages, starting with feature extraction from the occurring
patterns, which is the conversion of patterns to features that
are regarded as a condensed representation, ideally contain-
ing all-important information. In the next stage, the feature
selection step, a smaller number of meaningful features that
best represents the given pattern without redundancy is
identified. Finally, the classification is carried out, i.e. a
specific pattern is assigned to a specific class according to
the characteristic features selected for it. This general
abstract model, which is shown in Fig. 1, allows a broad
variety of different realizations and implementations.
Applying this terminology to the medical diagnostic
process, the patterns can be identified, for example, as
particular, formalized symptoms, recorded signals, or a set
of images of a patient. The classes obtained represent the
variety of different possible diagnoses or diagnostic
statements (Dickhous & Heinrich, 1996). The techniques
applied to pattern recognition uses artificial intelligence
approaches (Bishop, 1996).
2.2. DHS signals
The audio DHS is obtained by simply placing the
Doppler ultrasonic flow transducer over the chest of the
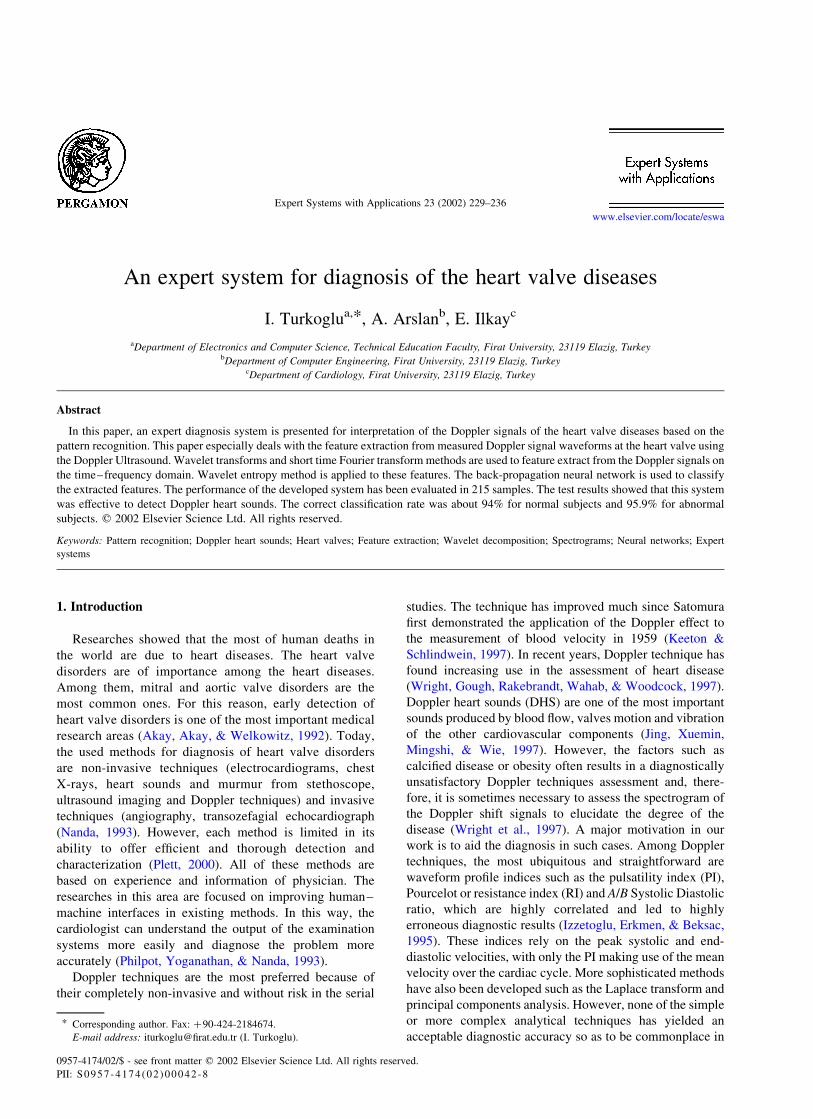
patient (Chan et al.,, 1997). Fig. 2 shows a DHS signal from
heart aortic valve. The DHS produced from echoes back-
scattered by moving blood cells is generally in the range of
0.5–10 kHz (Saini, Nanda, & Maulik, 1993). DHS signal
spectral estimation is now commonly used to evaluate blood
flow parameters in order to diagnose cardiovascular
diseases. Spectral estimation methods are particularly
used in Doppler ultrasound cardiovascular disease detec-
tion. Clinical diagnosis procedures generally include
analysis of a graphical display and parameter measure-
ments, produced by blood flow spectral evaluation.
Fig. 1. The pattern recognition approach.
Fig. 2. The waveform pattern of the Doppler heart sound.
I. Turkoglu et al. / Expert Systems with Applications 23 (2002) 229–236230
Ultrasonic instrumentation typically employ Fourier based
methods to obtain the blood flow spectra, and blood flow
measurements (Madeira, Tokhi, & Ruano, 2000).
A Doppler signal is not a simple signal. It includes
random characteristics due to the random phases of
scattering particles present in the sample volume. Other
effects such as geometric broadening and spatially varying
velocity also affect the signal (Karabetsos, Papaodysseus, &
Kountsouris, 1998).
The following Doppler equation:
Df ¼2vf cos u
cð1Þ
where v equals the velocity of the blood flow, f equals the
frequency of the emitted ultrasonic signal, c equals the
velocity of sound in tissue (approximately 1540 m/s), Df
equals the measured Doppler frequency shift, and u equals
the angle of incidence between the direction of blood flow
and the direction of the emitted ultrasonic beam (Saini et al.,
1993).
2.3. Wavelet decomposition
Wavelet transforms are rapidly surfacing in fields as
diverse as telecommunications and biology. Because of
their suitability for analyzing non-stationary signals, they
have become a powerful alternative to Fourier methods in
many medical applications, where such signals abound
(Akay, 1997; Keeton & Schlindwein, 1997; Liang &
Nartimo, 1998).
The main advantages of wavelets is that they have a
varying window size, being wide for slow frequencies and
narrow for the fast ones, thus leading to an optimal time–
frequency resolution in all frequency ranges. Furthermore,
owing to the fact that windows are adapted to the transients
of each scale, wavelets lack of the requirement of
stationarity (Quiroga, 1998).
Wavelet decomposition uses the fact that it is possible to
resolve high frequency components within a small time
window, and only low frequencies components need large
time windows. This is because a low frequency component
completes a cycle in a large time interval whereas a high
frequency component completes a cycle in a much shorter
interval. Therefore, slow varying components can only be
identified over long time intervals but fast varying
components can be identified over short time intervals.
Wavelet decomposition can be regarded as a continuous
time wavelet decomposition sampled at different frequen-
cies at every level or stage. The wavelet decomposition
function at level m and time location tm can be expressed as
Eq. (2):
dmðtmÞ ¼ xðtÞCm
t 2 tm2m
� �ð2Þ
where Cm is the decomposition filter at frequency level m.
The effect of the decomposition filter is scaled by the factor
2m at stage m, but otherwise the shape is the same at all
stages. The synthesis of the signal from its time–frequency
coefficients given in Eq. (3) can be rewritten to express the
composition of the signal x½n� from its wavelet coefficients.
d½n� ¼ x½n�h½n�; c½n� ¼ x½n�g½n� ð3Þ
where h½n� is the impulse response of the high pass filter and
g½n� is the impulse response of the low pass filter
(Devasahayam, 2000).
Wavelet packet analysis is an extension of the discrete
wavelet transform (DWT) (Burrus, Gopinath, & Guo, 1998)
and it turns out that the DWT is only one of the many
possible decompositions that could be performed on the
signal, instead of just decomposing the low frequency
component as well. It is therefore possible to subdivide the
whole time–frequency plane into different time–frequency
pieces. The advantage of wavelet packet analysis is that it is
possible to combine the different levels of decomposition in
order to achieve the optimum time–frequency represen-
tation of the original (Keeton & Schlindwein, 1997).
2.4. Short-time Fourier transform
STFT, also known as the time-dependent or the windowed
Fourier transform, attempts to analyze non-stationary
signals by dividing the whole signal into shorter data
frames. In short, the STFT can be compactly represented by
Eq. (4):
XðkÞ ¼XN21
n¼0
xðnÞvðn 2 n0Þexp 2j2pnk
N
� �ð4Þ
where vðn 2 n0Þ is a window function to suppress side lobes
while minimizing the main lobe leakage. The output of
successive STFTs can provide a time–frequency represen-
tation of the signal. To accomplish this the signal is
truncated into short data frames by multiplying it by a
window so that the modified signal is zero outside the data
frame. The frequency spectrums for the data frame is
calculated using the fast Fourier transform. One of the
limitations of STFT is that the time frame for analysis of the
signal is fixed (Keeton & Schlindwein, 1997).
2.5. Wavelet entropy
Entropy-based criteria describe information-related
properties for an accurate representation of a given signal.
Entropy is a common concept in many fields, mainly in
signal processing (Coifman & Wickerhauser, 1992). A
method for measuring the entropy appears as an ideal tool
for quantifying the ordering of non-stationary signals. An
ordered activity (i.e. a sinusoidal signal) is manifested as a
narrow peak in the frequency domain, thus having low
entropy. On the other hand, random activity has a wide band
response in the frequency domain, reflected in a high
entropy value (Quiroga, Roso, & Basar, 1999). The types of
I. Turkoglu et al. / Expert Systems with Applications 23 (2002) 229–236 231
entropy computing are shannon, threshold, norm, log
energy, and sure (Coifman & Wickerhauser, 1992).
2.6. Neural networks
An artificial neural network (ANN) is a mathematical
model consisting of a number of highly interconnected
processing elements organized into layers, the geometry and
functionality of which have been likened to that of the
human brain. The ANN may be regarded as processing
learning capabilities inasmuch as it has a natural propensity
for storing experimental knowledge and making it available
for later use. By virtue of its parallel distribution, an ANN is
generally robust, tolerant of faults and noise, able to
generalize well and capable of solving non-linear problems
(Haykin, 1994). The DHS, be it diseased or healthy, may be
regarded as an inherently non-linear system due to the
absence of the property of frequency preservation as
required by the definition of a linear system (Nichols &
O’Rourke, 1990). Applications of ANNs in the medical field
include EMG pattern identification (Asres, Dou, Zhou,
Zhang, & Zhu, 1997), images of human breast disease
(Allan & Kinsner, 2001) medical data mining (Brameier &
Banzhaf, 2001), Brachytherapy cancer treatment optimiz-
ation (Miller, Bews, & Kinsner, 2001), interpretation of
heart sounds (Turkoglu & Arslan, 2001), EEG pattern
identification (Saraoglu, Yumusak & Ferikoglu, 1999);
however, to date neural network analysis of DHS is a
relatively new approach.
3. Methodology
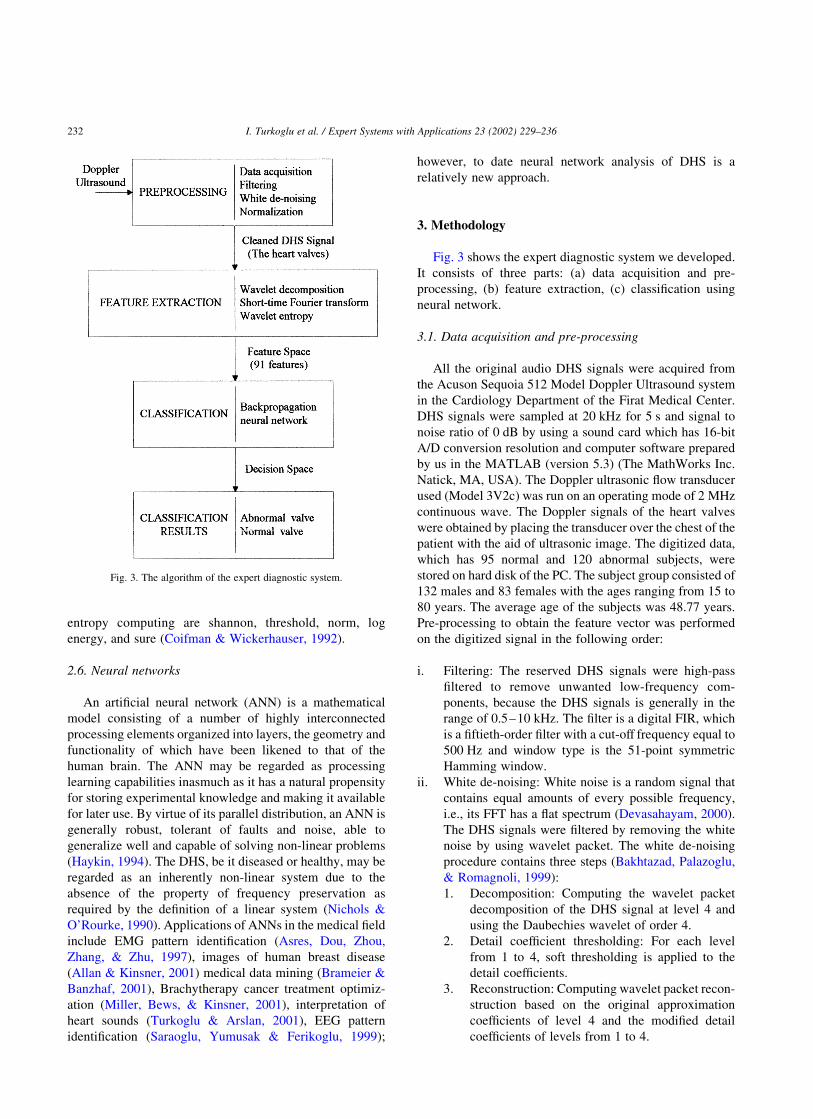
Fig. 3 shows the expert diagnostic system we developed.
It consists of three parts: (a) data acquisition and pre-
processing, (b) feature extraction, (c) classification using
neural network.
3.1. Data acquisition and pre-processing
All the original audio DHS signals were acquired from
the Acuson Sequoia 512 Model Doppler Ultrasound system
in the Cardiology Department of the Firat Medical Center.
DHS signals were sampled at 20 kHz for 5 s and signal to
noise ratio of 0 dB by using a sound card which has 16-bit
A/D conversion resolution and computer software prepared
by us in the MATLAB (version 5.3) (The MathWorks Inc.
Natick, MA, USA). The Doppler ultrasonic flow transducer
used (Model 3V2c) was run on an operating mode of 2 MHz
continuous wave. The Doppler signals of the heart valves
were obtained by placing the transducer over the chest of the
patient with the aid of ultrasonic image. The digitized data,
which has 95 normal and 120 abnormal subjects, were
stored on hard disk of the PC. The subject group consisted of
132 males and 83 females with the ages ranging from 15 to
80 years. The average age of the subjects was 48.77 years.
Pre-processing to obtain the feature vector was performed
on the digitized signal in the following order:
i. Filtering: The reserved DHS signals were high-pass
filtered to remove unwanted low-frequency com-
ponents, because the DHS signals is generally in the
range of 0.5–10 kHz. The filter is a digital FIR, which
is a fiftieth-order filter with a cut-off frequency equal to
500 Hz and window type is the 51-point symmetric
Hamming window.
ii. White de-noising: White noise is a random signal that
contains equal amounts of every possible frequency,
i.e., its FFT has a flat spectrum (Devasahayam, 2000).
The DHS signals were filtered by removing the white
noise by using wavelet packet. The white de-noising
procedure contains three steps (Bakhtazad, Palazoglu,
& Romagnoli, 1999):
1. Decomposition: Computing the wavelet packet
decomposition of the DHS signal at level 4 and
using the Daubechies wavelet of order 4.
2. Detail coefficient thresholding: For each level
from 1 to 4, soft thresholding is applied to the
detail coefficients.
3. Reconstruction: Computing wavelet packet recon-
struction based on the original approximation
coefficients of level 4 and the modified detail
coefficients of levels from 1 to 4.
Fig. 3. The algorithm of the expert diagnostic system.
I. Turkoglu et al. / Expert Systems with Applications 23 (2002) 229–236232
iii. Normalization: The DHS signals in this study were
normalized using Eq. (5) so that the expected
amplitude of the signal is not affected from the rib
cage structure of the patient.
DHSsignal ¼DHSsignal
lðDHSsignalÞmaxlð5Þ
3.2. Feature extraction
Feature extraction is the key to pattern recognition so that
it is arguably the most important component of designing
the expert diagnosis system based on pattern recognition
since even the best classifier will perform poorly if the
features are not chosen well. A feature extractor should
reduce the pattern vector (i.e. the original waveform) to a
lower dimension, which contains most of the useful
information from the original vector. The DHS waveform
patterns from heart valves are rich in detail and highly non-
stationary. The goal of the feature extraction is to extract
features from these patterns for reliable intelligent classi-
fication. After the data pre-processing has been realized,
three steps are proposed in this paper to extract the
characteristics of these waveforms using MATLAB with
the Wavelet Toolbox and the Signal Processing Toolbox:
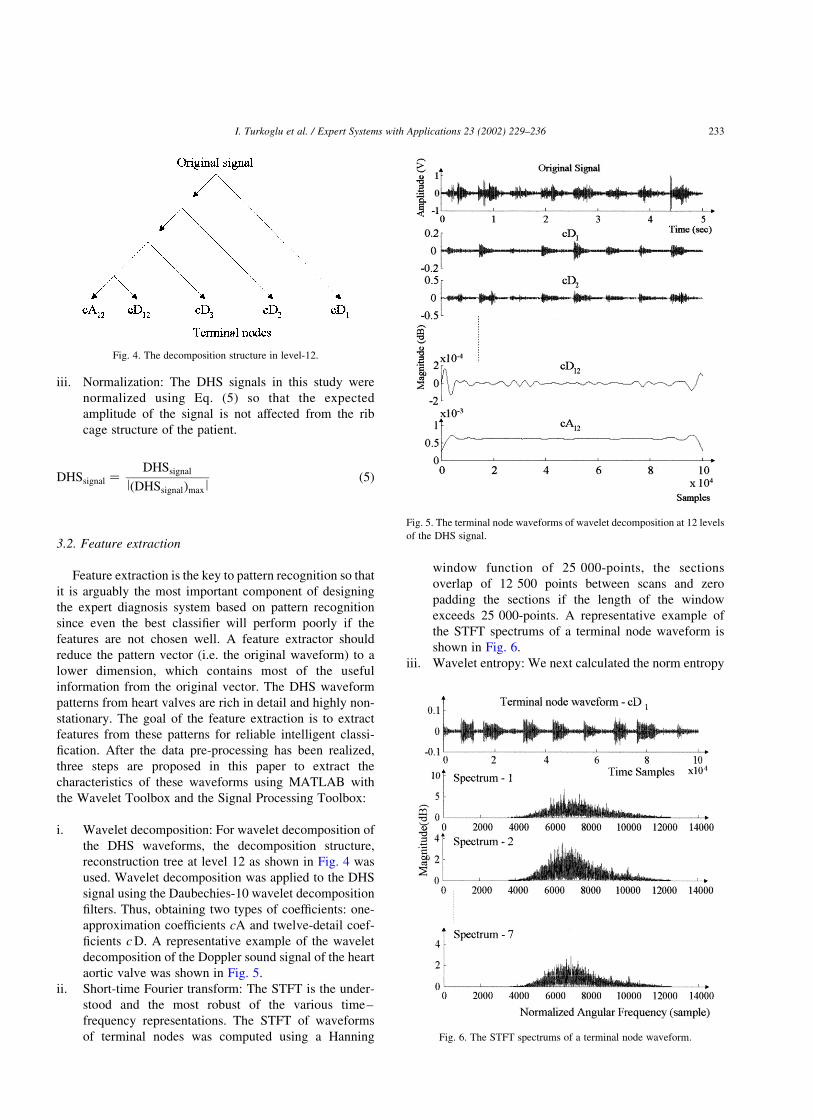
i. Wavelet decomposition: For wavelet decomposition of
the DHS waveforms, the decomposition structure,
reconstruction tree at level 12 as shown in Fig. 4 was
used. Wavelet decomposition was applied to the DHS
signal using the Daubechies-10 wavelet decomposition
filters. Thus, obtaining two types of coefficients: one-
approximation coefficients cA and twelve-detail coef-
ficients c D. A representative example of the wavelet
decomposition of the Doppler sound signal of the heart
aortic valve was shown in Fig. 5.
ii. Short-time Fourier transform: The STFT is the under-
stood and the most robust of the various time–
frequency representations. The STFT of waveforms
of terminal nodes was computed using a Hanning
window function of 25 000-points, the sections
overlap of 12 500 points between scans and zero
padding the sections if the length of the window
exceeds 25 000-points. A representative example of
the STFT spectrums of a terminal node waveform is
shown in Fig. 6.
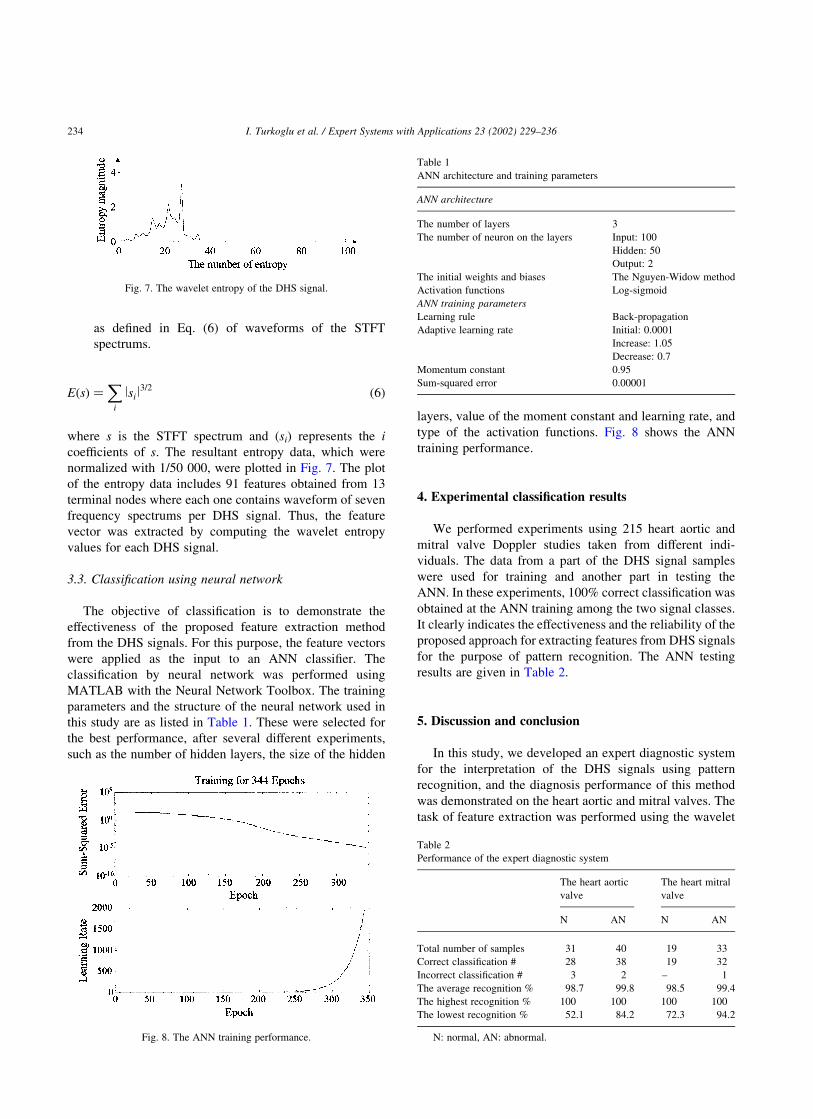
iii. Wavelet entropy: We next calculated the norm entropy
Fig. 4. The decomposition structure in level-12.
Fig. 5. The terminal node waveforms of wavelet decomposition at 12 levels
of the DHS signal.
Fig. 6. The STFT spectrums of a terminal node waveform.
I. Turkoglu et al. / Expert Systems with Applications 23 (2002) 229–236 233
as defined in Eq. (6) of waveforms of the STFT
spectrums.
EðsÞ ¼X
i
lsil3=2
ð6Þ
where s is the STFT spectrum and (si) represents the i
coefficients of s. The resultant entropy data, which were
normalized with 1/50 000, were plotted in Fig. 7. The plot
of the entropy data includes 91 features obtained from 13
terminal nodes where each one contains waveform of seven
frequency spectrums per DHS signal. Thus, the feature
vector was extracted by computing the wavelet entropy
values for each DHS signal.
3.3. Classification using neural network
The objective of classification is to demonstrate the
effectiveness of the proposed feature extraction method
from the DHS signals. For this purpose, the feature vectors
were applied as the input to an ANN classifier. The
classification by neural network was performed using
MATLAB with the Neural Network Toolbox. The training
parameters and the structure of the neural network used in
this study are as listed in Table 1. These were selected for
the best performance, after several different experiments,
such as the number of hidden layers, the size of the hidden
layers, value of the moment constant and learning rate, and
type of the activation functions. Fig. 8 shows the ANN
training performance.
4. Experimental classification results
We performed experiments using 215 heart aortic and
mitral valve Doppler studies taken from different indi-
viduals. The data from a part of the DHS signal samples
were used for training and another part in testing the
ANN. In these experiments, 100% correct classification was
obtained at the ANN training among the two signal classes.
It clearly indicates the effectiveness and the reliability of the
proposed approach for extracting features from DHS signals
for the purpose of pattern recognition. The ANN testing
results are given in Table 2.
5. Discussion and conclusion
In this study, we developed an expert diagnostic system
for the interpretation of the DHS signals using pattern
recognition, and the diagnosis performance of this method
was demonstrated on the heart aortic and mitral valves. The
task of feature extraction was performed using the wavelet
Fig. 7. The wavelet entropy of the DHS signal.
Table 1
ANN architecture and training parameters
ANN architecture
The number of layers 3
The number of neuron on the layers Input: 100
Hidden: 50
Output: 2
The initial weights and biases The Nguyen-Widow method
Activation functions Log-sigmoid
ANN training parameters
Learning rule Back-propagation
Adaptive learning rate Initial: 0.0001
Increase: 1.05
Decrease: 0.7
Momentum constant 0.95
Sum-squared error 0.00001
Fig. 8. The ANN training performance.
Table 2
Performance of the expert diagnostic system
The heart aortic
valve
The heart mitral
valve
N AN N AN
Total number of samples 31 40 19 33
Correct classification # 28 38 19 32
Incorrect classification # 3 2 – 1
The average recognition % 98.7 99.8 98.5 99.4
The highest recognition % 100 100 100 100
The lowest recognition % 52.1 84.2 72.3 94.2
N: normal, AN: abnormal.
I. Turkoglu et al. / Expert Systems with Applications 23 (2002) 229–236234
decomposition for multi-scale analysis, STFT for time–
frequency representations, and the wavelet entropy, while
classification was carried out by the back-propagation
neural network. The stated results show that the proposed
method can make an efficient interpretation. Although the
abnormal subjects were attained 95.9% correct classifi-
cation, the normal subjects were provided 94% correct
classification.
The feature choice was motivated by a realization that
wavelet decomposition is essentially a representation of a
signal at a variety of resolutions. In brief, the wavelet
decomposition has been demonstrated to be an effective tool
for extracting information from the DHS signals. However,
the proposed feature extraction method is robust against
noise in the DHS signals.
In this paper, the application of the wavelet entropy to the
feature extraction from DHS signals was shown. Wavelet
entropy proved to be a very useful tool for characterizing
the DHS signal, furthermore the information obtained with
the wavelet entropy probed not to be trivially related to the
energy and consequently with the amplitude of signal. This
means that with this method, new information can be
accessed with an approach different from the traditional
analysis of amplitude of DHS signal.
The most important aspect of the expert diagnostic
system is the ability of self-organization of the neural
network without requirements of programming and the
immediate response of a trained net during real-time
applications. These features make the expert diagnostic
system suitable for automatic classification in interpretation
of the DHS signals. These results point out the ability of
design of a new intelligent assistance diagnosis system.
The diagnosis performances of this study shows the
advantages of this system: it is rapid, easy to operate, non-
invasive, and not expensive. This system is of the better
clinical application over others, especially for earlier survey
of population. However, the position of the ultrasound
probe, which is used for data acquisition from the heart
valves, must be taken into consideration by physician.
Although our expert diagnosis system was carried out on
the heart aortic and mitral valves, similar results for the
other valves (tricuspid and pulmonary) and the other
Doppler studies can be expected. Besides the feasibility of
a real-time implementation of the expert diagnosis system,
by increasing the variety and number of DHS signals
additional information (i.e. quantification of the heart valve
regurgitation and stenosis) can be provided for diagnosis.
Acknowledgments
We want to thank, the Cardiology Department of the
Firat Medicine Center, Elazig, Turkey for providing the
DHS signals to us. This work was supported by Firat
University Research Fund. (Project No: 527).
References
Akay, M. (1997). Wavelet applications in medicine. IEEE Spectrum, 34,
50–56.
Akay, M., Akay, Y. M., & Welkowitz, W. (1992). Neural networks for the
diagnosis of coronary artery disease. International Joint Conference on
Neural Networks, IJCNN, (Vol. 2, pp. 419–424).
Allan, R., & Kinsner, W. (2001). A study of microscopic images of
human breast disease using competitive neural networks. Canadian
Conference on Electrical and Computer Engineering (Vol. 1, pp.
289–293).
Asres, A., Dou, H., Zhou, Z., Zhang, Y., & Zhu, S. (1997). A combination
of AR and neural network technique for EMG pattern identification.
Engineering in Medicine and Biology Society, Bridging Disciplines for
Biomedicine, Proceedings of the 18th Annual International Conference
of the IEEE (Vol. 4, pp. 1464–1465).
Bakhtazad, A., Palazoglu, A., & Romagnoli, J. A. (1999). Process data
de-noising using wavelet transform. Intelligent Data Analysis, 3,
267–285.
Bishop, C. M. (1996). Neural networks for pattern recognition. Oxford:
Clarendon Press.
Brameier, M., & Banzhaf, W. (2001). A comparison of linear genetic
programming and neural networks in medical data mining. IEEE
Transactions on Evolutionary Computation, 5, 17–26.
Burrus, C. S., Gopinath, R. A., & Guo, H. (1998). Introduction to wavelet
and wavelet transforms. NJ, USA: Prentice Hall.
Chan, B. C. B., Chan, F. H. Y., Lam, F. K., Lui, P. W., & Poon, P. W. F.
(1997). Fast detection of venous air embolism is Doppler heart sound
using the wavelet transform. IEEE Transactions on Biomedical
Engineering, 44(4), 237–245.
Coifman, R. R., & Wickerhauser, M. V. (1992). Entropy-based algorithms
for best basis selection. IEEE Transactions on Information Theory,
38(2), 713–718.
Devasahayam, S. R. (2000). Signals and systems in biomedical engineer-
ing. Dordrecht: Kluwer Academic Publishers.
Dickhous, H., & Heinrich, H. (1996). Classifying biosignals with wavelet
networks. IEEE Engineering in Medicine and Biology, 103–111.
Guler, I., & Kara, S. (1995). Detection of mitral stenosis by a pulsed
Doppler flow meter and autoregressive spectral analysis method.
Proceedings of the 14th Conference of the Biomedical Engineering
Society of India. An International Meeting, Proceedings of the First
Regional Conference, IEEE (pp. 2/91–2/92).
Haykin, S. (1994). Neural networks, a comprehensive foundation. New
York: Macmillan College Publishing Company Inc.
Izzetoglu, K., Erkmen, A. M., & Beksac, S. (1995). Intelligent classification
of fetal Doppler blood velocity waveform abnormalities using wavelet
transform and vector quantization algorithm. IEEE International
Conference on Systems, Man and Cybernetics, Intelligent Systems for
the 21st Century (Vol. 1, pp. 724–729).
Jing, F., Xuemin, W., Mingshi, W., & Wie, L. (1997). Noninvasive
acoustical analysis system of coronary heart disease. Biomedical
Engineering Conference, Proceedings of the 1997 Sixteenth Southern
(pp. 239–241).
Karabetsos, E., Papaodysseus, C., & Koutsouris, D. (1998). Design and
development of a new ultrasonic doppler technique for estimation of the
aggregation of red blood cells. Measurement, 24, 207–215.
Keeton, P. I. J., & Schlindwein, F. S. (1997). Application of wavelets in
Doppler ultrasound. Measurement, 17(1), 38–45.
Liang, H., & Nartimo, I. (1998). A feature extraction algorithm based on
wavelet packet decomposition for heart sound signals. Proceedings of
the IEEE-SP International Symposium (pp. 93–96).
Madeira, M. M., Tokhi, M. O., & Ruano, M. G. (2000). Real-time
implementation of a Doppler signal spectral estimator using sequential
and parallel processing techniques. Microprocessors and Microsystems,
24, 153–167.
Miller, S., Bews, J., & Kinsner, W. (2001). Brachytherapy cancer treatment
I. Turkoglu et al. / Expert Systems with Applications 23 (2002) 229–236 235
optimization using simulated annealing and artificial neural networks.
Canadian Conference on Electrical and Computer Engineering (Vol. 1,
pp. 649–654).
Nanda, N. C. (1993). Doppler echocardiography (2nd ed.). London: Lea &
Febiger.
Nichols, W. W., & O’Rourke, M. F. (1990). McDonald’s blood flow in
arteries: Theoretical, experimental and clinical principles (3rd ed.),
London.
Philpot, E. F., Yoganathan, A. P., & Nanda, N. C. (1993). Future directions
in Doppler echocardiography. Doppler echocardiography. Philadelphia,
London: Lea & Febiger.
Plett, M. I. (2000). Ultrasonic arterial vibrometry with wavelet based
detection and estimation. PhD Thesis (pp. 17–18), University of
Washington.
Quiroga, R. Q. (1998). Quantitative analysis of EEG signals: Time–
frequency methods and Chaos theory. Lubeck: Intitute of Physiology,
Medical University.
Quiroga, R. Q., Roso, O. A., & Basar, E. (1999). Wavelet entropy: A
measure of order in evoked potentials (Vol. 49). Evoked potentials and
magnetic fields, Amsterdam: Elsevier, pp. 298–302.
Saini, V. D., Nanda, N. C., & Maulik, D. (1993). Basic principles
of ultrasound and Doppler effect. Doppler echocardiography.
Philadelphia, London: Lea & Febiger.
Saraoglu, H. M., Yumusak, N., & Ferikoglu, A. (1999). Training of brain
signals by using neural networks. International symposium on
Mathematical and Computational Applications, September 1–3,
1999, 249–254. Baku, Azerbaijan.
Turkoglu, I., & Arslan, A. (2001). An intelligent pattern recognition system
based on neural network and wavelet decomposition for interpretation
of heart sounds. Proceedings of the 23rd Annual International
Conference of the IEEE Engineering in Medicine and Biology Society,
October 25–28, 2001 (pp. 4.2.7–3). Istanbul, Turkey.
Wright, I. A., Gough, N. A. J., Rakebrandt, F., Wahab, M., & Woodcock,
J. P. (1997). Neural network analysis of Doppler ultrasound blood flow
signals: A pilot study. Ultrasound in Medicine and Biology, 23(5),
683–690.
I. Turkoglu et al. / Expert Systems with Applications 23 (2002) 229–236236