Embed Size (px)
Citation preview
An Exploration of Environmental Impacts and Consumer Perceptions of Soft Drink
Packaging
Ryerson University Graphic Communications Management
GCM 490: Thesis Submitted To: Ian Baitz Submitted By: Jessica Huynh 500823870 Extended Due Date: Nov 30, 2020 Research Question: How does Coca Cola’s present North American plastic, glass and aluminum beverage packaging impact the environment, and how do the results compare with consumers’ environmental impact perception regarding those materials?
Acknowledgements
Writing a thesis during a pandemic would not be possible without some
outstanding individuals' support and encouragement. First and foremost, I would like to
extend my sincerest and heartfelt thanks to my thesis advisor, Dr. Jonghun (Jay) Park.
His guidance and expertise in the packaging field were pivotal in the development of my
research. Thank you for always taking the time to answer my unending questions and
the advice you have imparted throughout this journey.
I want to express gratitude to Ian Baitz, who led the thesis course. Ian provided
structure and resources that aided in the writing of my thesis. Thank you for always
taking the time to assure me that I and others were on track and understanding the
pressures and stress that we were experiencing. I would also like to thank Ian for
sharing my survey with all faculty members and students of the Graphic
Communications Management family. It was an immense help in generating
respondents for my survey.
I would also like to thank Dr. Ehsan Behzadfar, who provided me with the Life
Cycle Assessment software, central to my research.
I want to give a grateful thank you to those who took the time to respond to my
survey. The input and data collected were essential to my research.
And last but not least, thank you to my family and friends who supported me
throughout this thesis ordeal. Especially those who were undergoing the same thesis
process as I and those who had taken the time to sit in silent Zoom calls with me as we
struggled to finish work together. Without you, I would not have had the motivation to
continue and to finish. I love you all dearly.
1
Table of Contents Acknowledgements 1
Table of Contents 2
Abstract 4
Introduction 5
Literature Review 6
Packaging Information 9 The Plastic Bottle 9
Primary Package 9 Secondary Package 10
The Glass Bottle 10 Primary Packaging 10 Secondary Package 11
Metal Cans 12 Primary Packaging 12 Secondary Packaging 13
Life Cycle Assessment Information 14 System Boundary 14 Functional Unit 16 Assumptions and Limitations 16 Characteristics of Products Input into the LCA 17
Methodology 19 Life Cycle Assessment 19 Consumer Survey 20
LCA Results of Coca Cola’s Beverage Packaging Systems 21 Fossil Fuel Use (MJ Deprived) 21 GHG Emissions (kg CO2 eq.) 22 Water Use (Kiloliters) 23 Human Impact (DALY) 25
Survey Results 26 Environmental Impact Rating of Each Beverage Packaging 26 Recycling and Wash Habits of Consumers 30
2
Plastic Bottles 30 Glass Bottles 31 Aluminum Cans 32
Consumer Buy Decision 33
Discussion 34
Conclusion 39
References 40
Appendices 43 Appendix A 43
Convergent Factor and Functional Unit Calculations 43 Appendix B 44
Weights and Dimensions of Packages 44 Appendix C 46
Survey 46
3
Abstract
There is an increased concern with how packaging impacts the environment.
This thesis investigates the environmental impacts of The Coca Cola Company’s
plastic, glass and aluminum beverage packaging systems, including their secondary
packages. As well, consumer environmental impact perception will be explored. A Life
Cycle Assessment (LCA) methodology was used to evaluate the packaging systems.
An LCA provides a holistic view and identifies a connection between the packaging’s life
cycle and potential environmental impacts involving it. A survey was conducted with 160
responses asking consumers to rate each packaging on a numerical scale to provide
insight on their environmental impact perception. The LCA results concluded that Coca
Cola’s plastic bottle packaging with plastic shrink wrap had the least environmental
impact, followed by the aluminum can with paperboard box and lastly, glass bottle with
paperboard carrier had the greatest environmental impact. The survey results
contrasted the LCA findings, with consumers believing that Coca Cola’s glass
packaging has the least environmental impact, followed by aluminum and lastly, plastic
bottles have the greatest environmental impact. Further analysis of the results suggests
that plastic packaging has a negative connotation due to historical malpractices and the
existence of single-use plastic. For there to be a shift in consumer perception,
companies can implement more recycled plastic into their packaging, spread awareness
around this topic and enhance their packaging designs to reflect these changes.
However, there is also a need for more efficient recycling systems, a reduction in the
use and manufacturing of single-use plastics, a movement towards creating circular
economies and helping consumers understand how to recycle packaging properly.
4
Introduction
There has been an increasing need for environmental attention, especially in the
food and beverage industry (Del Rosso, 2020). The consumer market has influenced
the rise of increasing environmental packages that contain less polluting materials, are
manufactured in more ecological ways, and a focus on recyclability has been very
prominent (Del Rosso, 2020).
Though profit is the primary focus of many food and beverage companies,
consumers and their willingness to purchase goods that do not indicate ecological
consciousness decreases Whelan, & Kronthal-Sacco, 2019). In 2018, products that
visibly claimed to be sustainable accounted for 16.6% of the consumer packaged goods
market compared to 14.3% in 2013 Whelan, & Kronthal-Sacco, 2019). In addition,
products that were marketed as sustainable showed a 5.6% faster growth rate than their
competitors, who were not (Whelan, & Kronthal-Sacco, 2019).
The Coca Cola Company is one of the largest beverage manufacturing
companies in the world. With earnings of $37 billion in the past year, Coca Cola has
sold billions of beverage packages ranging from plastic bottles, glass bottles, aluminum
cans and paper cartons (The Coca Cola Company, 2019a). The Coca Cola Company
has also made strides in becoming more sustainable and environmentally conscious.
With a rise in environmental consciousness and sustainability prevalent in the
world today, it is important to utilize packaging in an effective and efficient manner that
contributes to decreasing environmental impacts. It is also important to study
consumers’ perception of the packaging and how they respond to the environmental
impacts of packaging options. This thesis aims to investigate the environmental impacts
of The Coca Cola Company’s classic Coca Cola beverage packaging. A focus will be on
the North American market, and an evaluation of plastic, glass and aluminum beverage
packaging will be pursued in addition to their secondary packages. The findings will also
be compared with consumers’ environmental impact perception regarding those
packaging materials. This thesis will be using a Life Cycle Assessment (LCA) to explore
the impacts of those materials on the environment and a Cradle-to-Cradle system
boundary will be used to examine the materials.
5
Literature Review A literature review evaluates the current landscape of knowledge relevant to
theories and methodologies in a topic (McCombes, 2019). This literature review aims to
provide an overview of the beverage packaging industry and discuss its impact on the
environment. This literature review will also explore consumer environmental impact
perception and its implications concerning beverage packaging materials. To further
explore this goal, research studies that examined these particular areas were analyzed.
Niero M., Hauschild M.Z., Hoffmeyer, S.B., & Olsen, S.I (2017) evaluates the use
of the Life Cycle Assessment (LCA) methodology concerning the beverage industry,
eco-efficiency, and eco-effectiveness. An LCA is used to identify a connection between
the packaging’s life cycle and potential environmental impacts involving it. The
packaging life cycle describes creating a package from its raw material extraction,
manufacturing, transportation, end-use and disposal phases. Companies in the
beverage packaging field had paved the way for implementing environmental
sustainability strategies into their businesses. The use of an LCA to approach
packaging and sustainability is common. It is a useful tool to quantify eco-efficiency
improvements, meaning increasing the value of a package while reducing resource use
and environmental impact. An LCA supports the integration of sustainability factors
related to design, innovation, and product evaluations. There is a focus on reducing
packaging material but maintaining the protective function of a package. Using an LCA
allows for opportunities to pinpoint areas to reduce environmental impacts through
comparisons. A Cradle-to-Cradle methodology, in particular, aims to provide a positive
increase in the footprint of packaging materials. Combining the LCA methodology and
Cradle to Cradle scope can offer more information on beverage packaging materials
and their impact on the environment.
Saleh, Y. (2016) researched the environmental impacts of beverage packaging
materials in Palestine. The materials chosen consisted of glass, aluminum, and PET
packaging. Saleh used an LCA methodology to evaluate and compare the materials.
6
The environmental impacts that are concerned with include "water consumption,
non-renewable energy, solid waste, human toxicity, terrestrial acidification, global
warming potential, and respiratory effects." Saleh concluded that PET beverage
packaging has the least environmental impact. Aluminum and glass packaging material
followed afterward. As this study was generally broad in its chosen materials, an
evaluation of secondary and tertiary packaging was not conducted.
Simon B, Amor M.B. & Földényi, R. (2016) concluded that packaging materials
significantly contribute to ththe beverage value chain’s overall impact. Recycling has a
significant effect on greenhouse gas emissions, specifically with aluminum cans and
glass bottles. There is an emphasis on convincing consumers to recycle, explicitly using
"kerbside" bag collection. Simon, Amor, and Földényi conducted an LCA to evaluate
beverage packaging materials' impacts on the environment. The research used a
functional unit of 1000 L to equalize the varying volumes of their beverages. The study
also used a "Cradle to Grave" system boundary to define the LCA evaluation. An
investigation of global warming potential, greenhouse gas emissions (GHG), human
toxicity air emissions, and transportation impact was carried out. These aspects covered
a wide range of factors impacting the environment; however, an evaluation of water
usage and human impact was not explored. When the whole life cycle of packaging
materials is considered, glass and aluminum beverage cans have the highest GHG
impact. However, aluminum cans' GHG impact may decrease more than PET bottles if
a closed-loop recycling method was implemented. From this research, it is clear that
proper recycling system implementation to recycle materials such as glass bottles,
aluminum cans, and PET bottles has a significant impact on the environment.
Dam Y. (1996) conveys the significance of incorporating consumer beliefs into
environmentally responsible packaging decisions. According to Dam, packaging needs
to be environmentally perceived by the consumer, or else the producer of the package
loses a competitive advantage. Marketing ecologically responsible packaging to
consumers requires information concerning consumer beliefs. Concerning materials,
consumers perceive glass as the most environmentally friendly packaging material by
7
consumers. Paper is second to glass, followed by tin cans and cardboard beverage
containers come after. Lastly, plastic packaging is perceived to have the most
significant environmental impact.
This literature review analyzed detailed research conducted in the beverage
packaging industry regarding its impact on the environment. It also investigated
consumers' environmental impact perception. The largest commonality present between
these research studies lies in using a Life Cycle Assessment (LCA) to compare various
beverage packaging material types. Using an LCA allows for an analysis of the material,
from raw extraction to end of life. However, as many of the studies discussed the broad
topic of beverage materials, a closer perspective into a specific company and a look into
secondary packaging and how that impacts the environment would be useful in this
field. In addition, there is research that separately investigates the environmental
impacts of packaging materials and research that separately investigates consumer
environmental impact perception. However, there is a lack of intersection between the
two areas. The research that will be conducted in this thesis will be combining the
results of an LCA methodology and information from consumers.
8
Packaging Information
This thesis will primarily investigate the following three primary packaging
materials; Polyethylene Terephthalate (PET) Bottle Grade Plastic, Container Glass and
Aluminum. Secondary packaging will also be considered, and these materials consist of
Solid Unbleached Board (SUB) and Low-Density Polyethylene (LDPE).
The Plastic Bottle
Primary Package
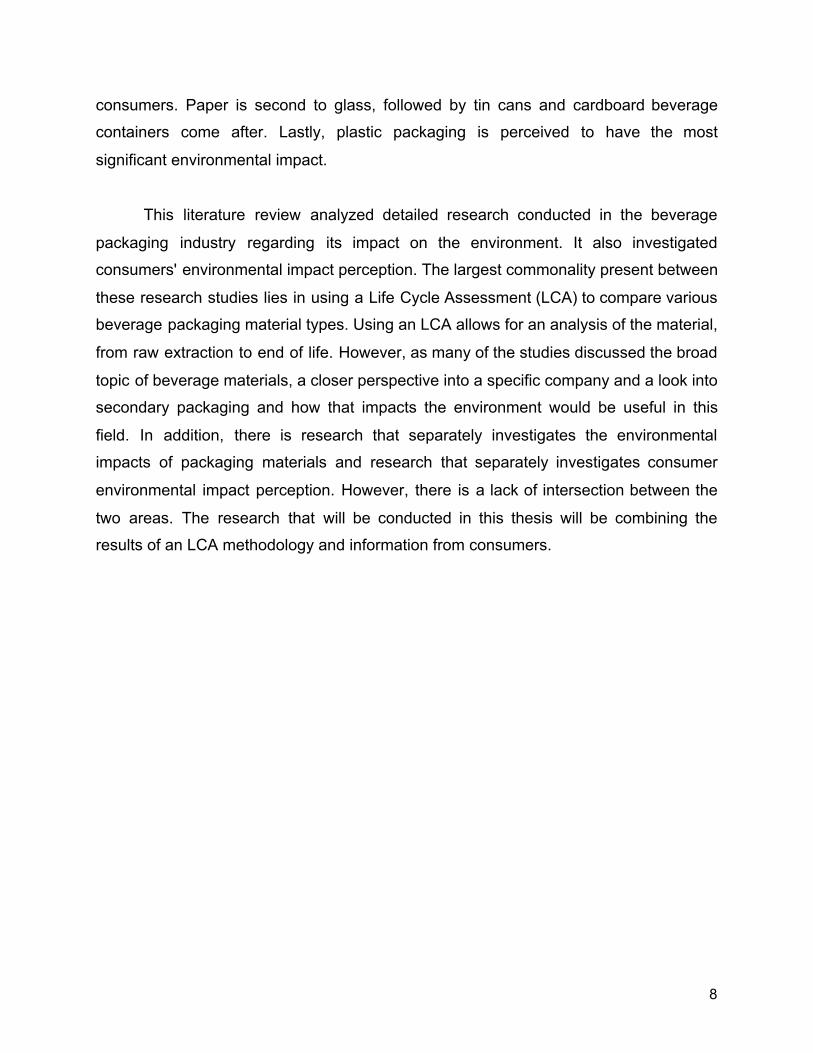
The Coca Cola Company produces a Polyethylene Terephthalate (PET) bottle
(Figure 1 ). And it will be assumed in this research that Coca Cola uses a bottle cap
composed of High-Density Polyethylene (HDPE).
PET, a type of thermoplastic, is commonly used in packaging (Emblem &
Emblem, 2012). It has high gas barrier properties,
and roughly 90% of PET is used to package
mineral water and carbonated beverages. The
use of recycled PET (rPET) is increasingly
popular for food and non-food products (Emblem
& Emblem, 2012).
HDPE is a rigid and high tensile strength
plastic (Emblem & Emblem, 2012). It is normally
used to manufacture bottles for milk and
household cleaner. It is also used for screw caps,
such as for milk containers and soft drink bottles
(Emblem & Emblem, 2012).
9
Figure 1: Photo of Coca Cola’s
Plastic Bottle Primary Packaging
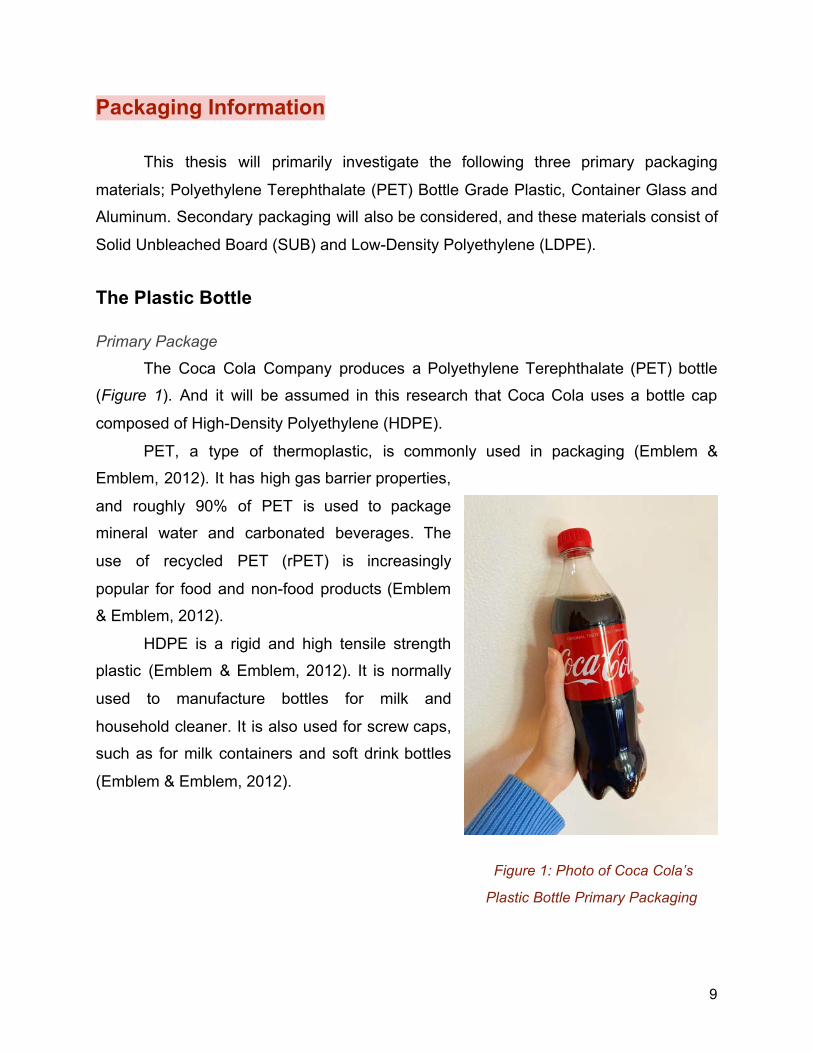
Secondary Package
The Coca Cola company uses a plastic shrink film to secure their primary
packaging (Figure 2 ). It will be assumed in this research that Coca Cola uses
Low-Density Polyethylene (LDPE) as their choice material for secondary packaging of
their PET primary packaging.
LDPE is commonly used as a collation shrink film for secondary packaging. It is a
soft and flexible material that stretches before breakage occurs (Emblem & Emblem,
2012).
Figure 2: Photos of Coca Cola’s Plastic Bottle Secondary Packaging
The Glass Bottle
Primary Packaging
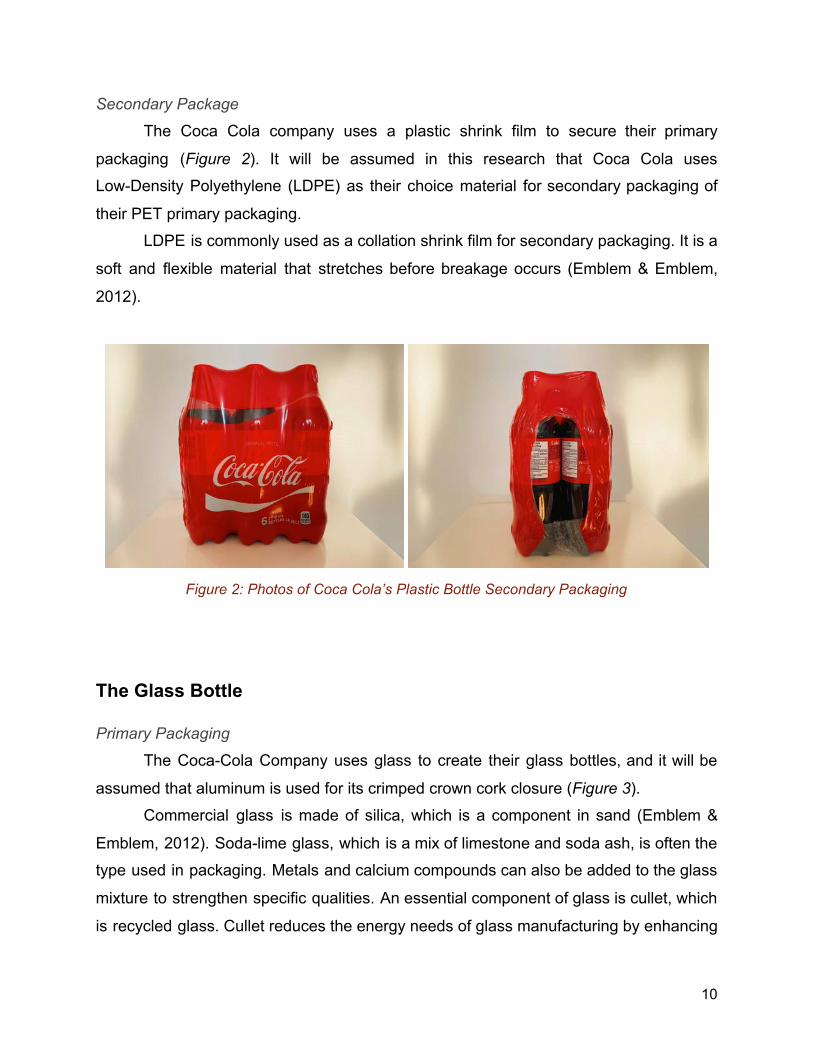
The Coca-Cola Company uses glass to create their glass bottles, and it will be
assumed that aluminum is used for its crimped crown cork closure ( Figure 3 ). Commercial glass is made of silica, which is a component in sand (Emblem &
Emblem, 2012). Soda-lime glass, which is a mix of limestone and soda ash, is often the
type used in packaging. Metals and calcium compounds can also be added to the glass
mixture to strengthen specific qualities. An essential component of glass is cullet, which
is recycled glass. Cullet reduces the energy needs of glass manufacturing by enhancing
10
the melting rate. Glass container production follows three primary methods:
blow-and-blow, press-and-blow and narrow neck press-and-blow (Emblem & Emblem,
2012).
A crimped crown cork acts as the glass bottle's closure (Emblem & Emblem,
2012). They seal carbonate beverages and withstand internal pressure from the liquid it
contains (Emblem & Emblem, 2012). For this LCA, it will be assumed that Coca Cola
uses closures composed of aluminum with a coating.
Figure 3: Photo of Coca Cola’s Glass Bottle Primary Packaging
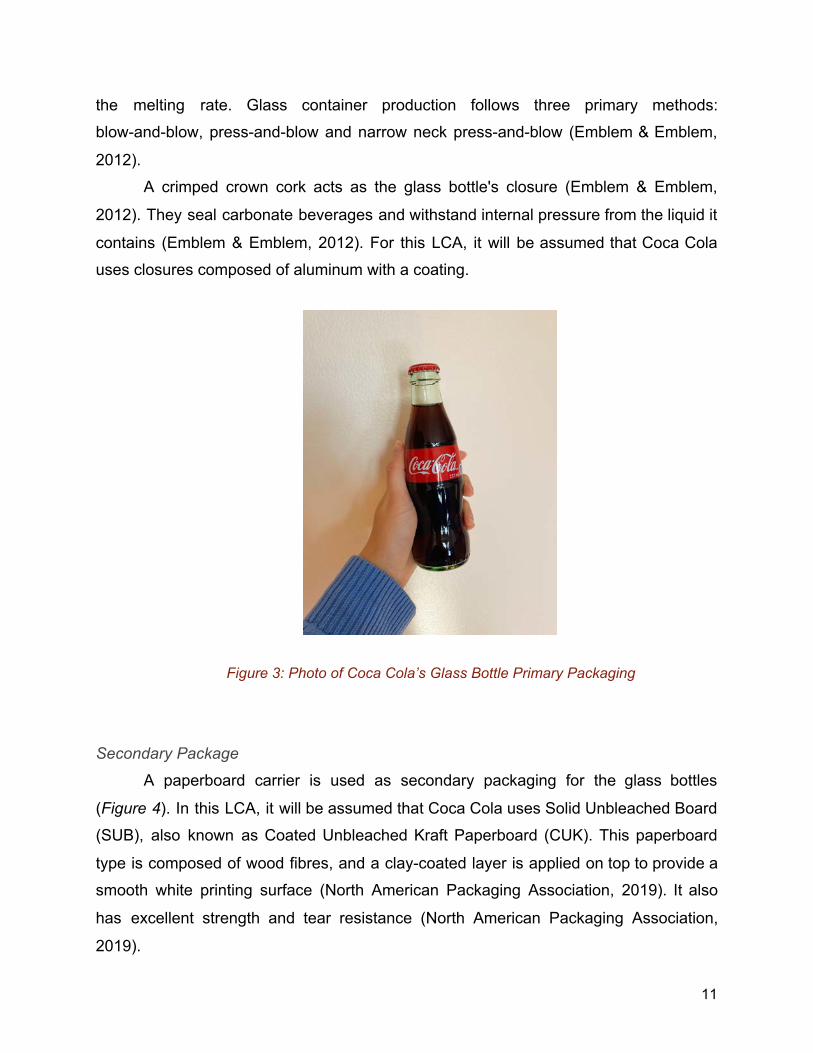
Secondary Package
A paperboard carrier is used as secondary packaging for the glass bottles
(Figure 4 ). In this LCA, it will be assumed that Coca Cola uses Solid Unbleached Board
(SUB), also known as Coated Unbleached Kraft Paperboard (CUK). This paperboard
type is composed of wood fibres, and a clay-coated layer is applied on top to provide a
smooth white printing surface (North American Packaging Association, 2019). It also
has excellent strength and tear resistance (North American Packaging Association,
2019).
11
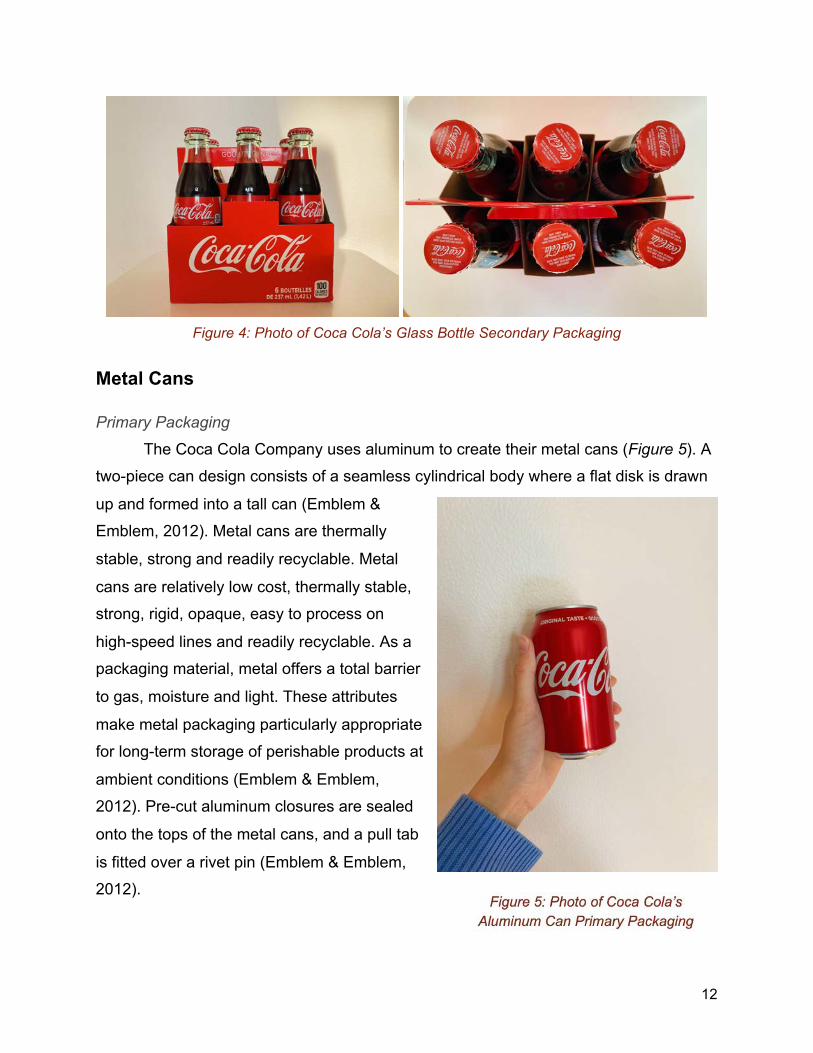
Figure 4: Photo of Coca Cola’s Glass Bottle Secondary Packaging
Metal Cans
Primary Packaging
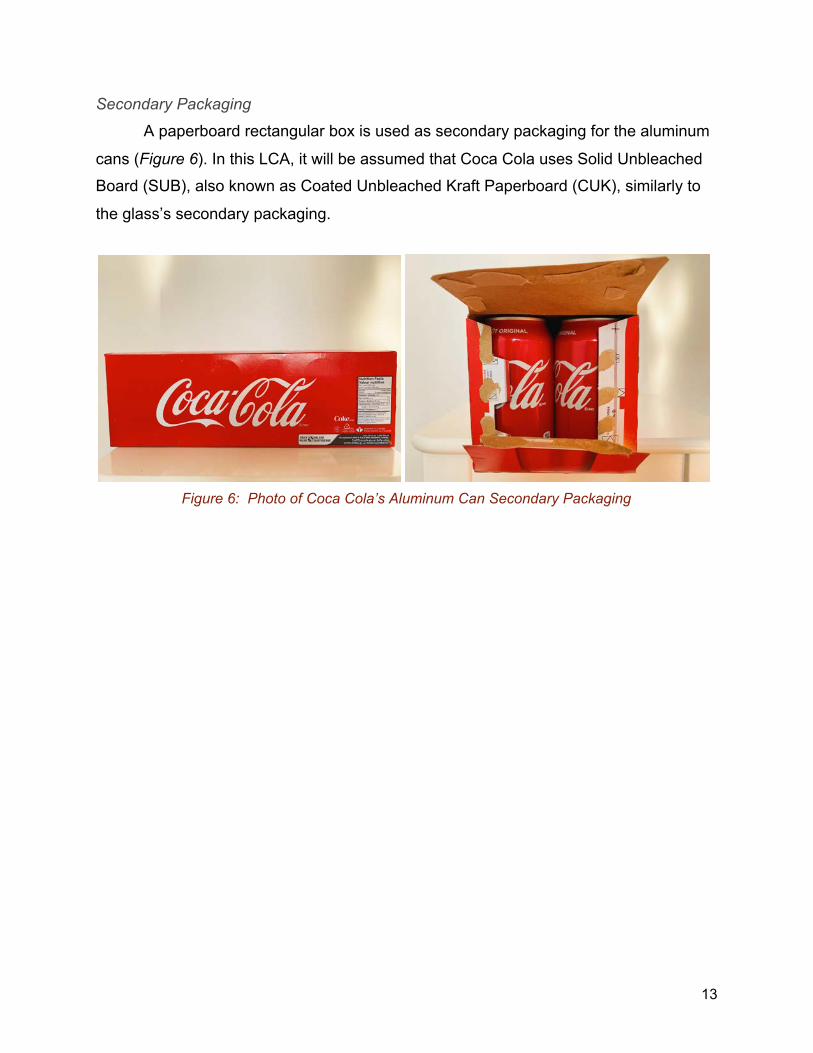
The Coca Cola Company uses aluminum to create their metal cans ( Figure 5 ). A
two-piece can design consists of a seamless cylindrical body where a flat disk is drawn
up and formed into a tall can (Emblem &
Emblem, 2012). Metal cans are thermally
stable, strong and readily recyclable. Metal
cans are relatively low cost, thermally stable,
strong, rigid, opaque, easy to process on
high-speed lines and readily recyclable. As a
packaging material, metal offers a total barrier
to gas, moisture and light. These attributes
make metal packaging particularly appropriate
for long-term storage of perishable products at
ambient conditions (Emblem & Emblem,
2012). Pre-cut aluminum closures are sealed
onto the tops of the metal cans, and a pull tab
is fitted over a rivet pin (Emblem & Emblem,
2012).
12
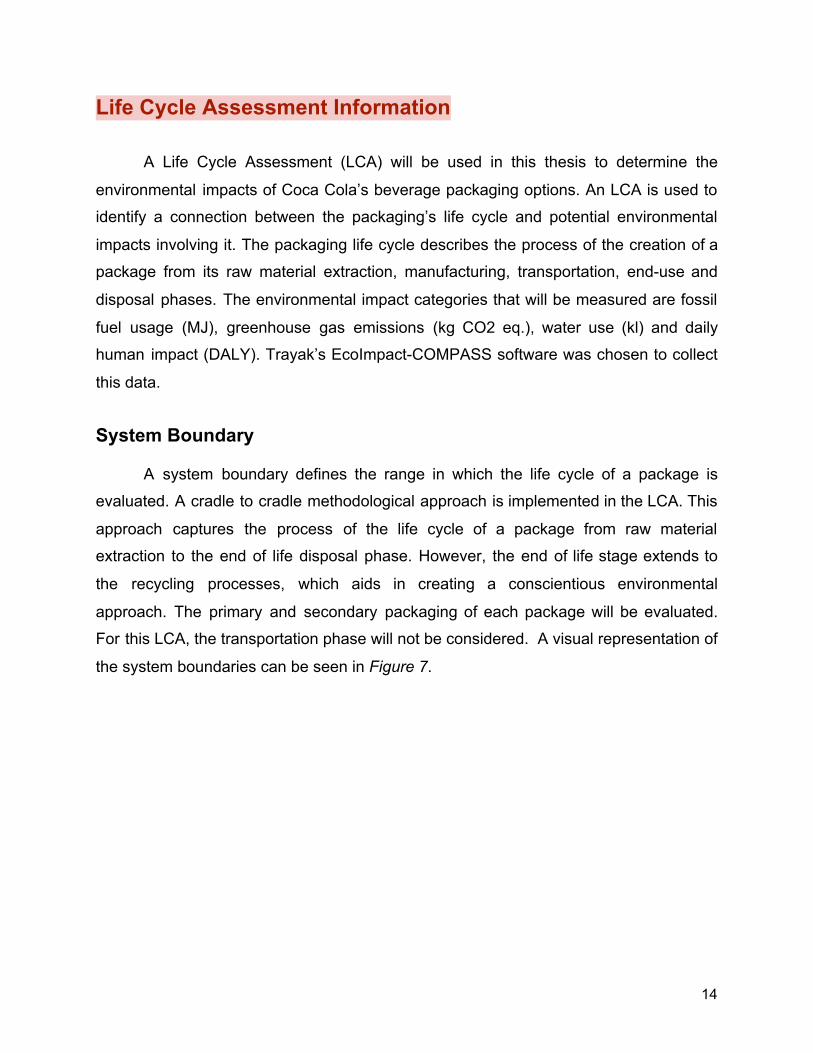
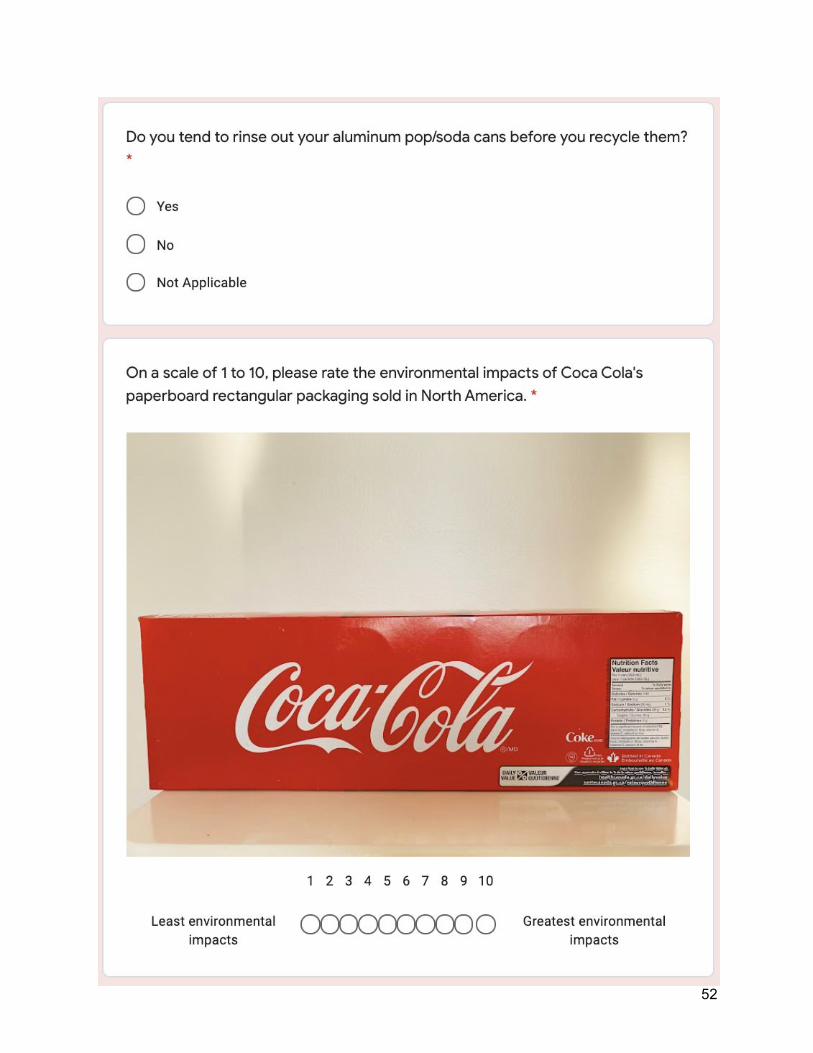
Secondary Packaging
A paperboard rectangular box is used as secondary packaging for the aluminum
cans (Figure 6 ). In this LCA, it will be assumed that Coca Cola uses Solid Unbleached
Board (SUB), also known as Coated Unbleached Kraft Paperboard (CUK), similarly to
the glass’s secondary packaging.
Figure 6: Photo of Coca Cola’s Aluminum Can Secondary Packaging
13
Life Cycle Assessment Information
A Life Cycle Assessment (LCA) will be used in this thesis to determine the
environmental impacts of Coca Cola’s beverage packaging options. An LCA is used to
identify a connection between the packaging’s life cycle and potential environmental
impacts involving it. The packaging life cycle describes the process of the creation of a
package from its raw material extraction, manufacturing, transportation, end-use and
disposal phases. The environmental impact categories that will be measured are fossil
fuel usage (MJ), greenhouse gas emissions (kg CO2 eq.), water use (kl) and daily
human impact (DALY). Trayak’s EcoImpact-COMPASS software was chosen to collect
this data.
System Boundary
A system boundary defines the range in which the life cycle of a package is
evaluated. A cradle to cradle methodological approach is implemented in the LCA. This
approach captures the process of the life cycle of a package from raw material
extraction to the end of life disposal phase. However, the end of life stage extends to
the recycling processes, which aids in creating a conscientious environmental
approach. The primary and secondary packaging of each package will be evaluated.
For this LCA, the transportation phase will not be considered. A visual representation of
the system boundaries can be seen in Figure 7 .
14
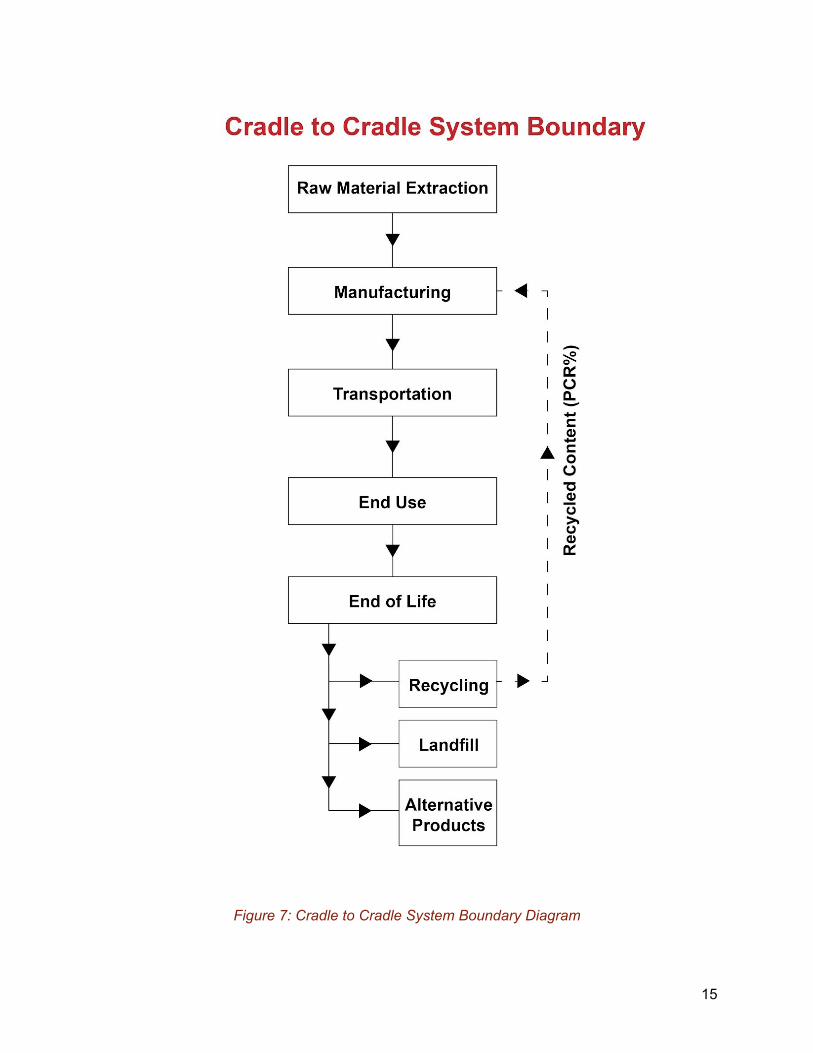
Figure 7: Cradle to Cradle System Boundary Diagram
15
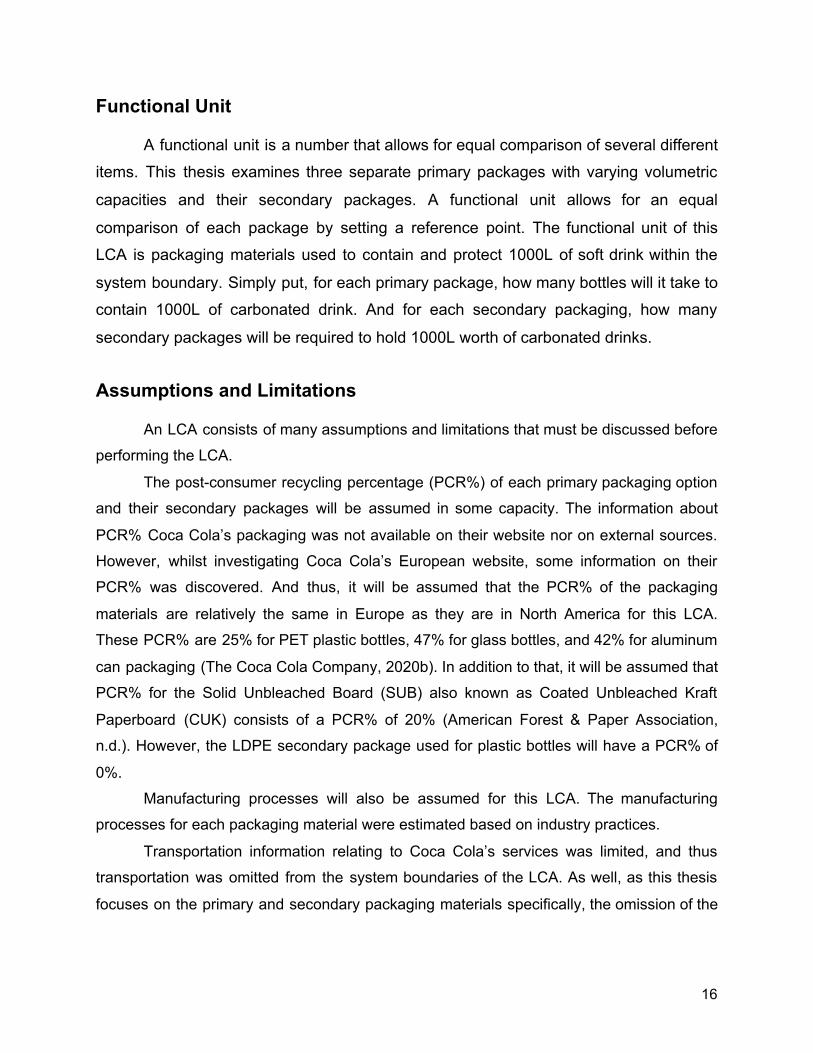
Functional Unit
A functional unit is a number that allows for equal comparison of several different
items. This thesis examines three separate primary packages with varying volumetric
capacities and their secondary packages. A functional unit allows for an equal
comparison of each package by setting a reference point. The functional unit of this
LCA is packaging materials used to contain and protect 1000L of soft drink within the
system boundary. Simply put, for each primary package, how many bottles will it take to
contain 1000L of carbonated drink. And for each secondary packaging, how many
secondary packages will be required to hold 1000L worth of carbonated drinks.
Assumptions and Limitations
An LCA consists of many assumptions and limitations that must be discussed before
performing the LCA.
The post-consumer recycling percentage (PCR%) of each primary packaging option
and their secondary packages will be assumed in some capacity. The information about
PCR% Coca Cola’s packaging was not available on their website nor on external sources.
However, whilst investigating Coca Cola’s European website, some information on their
PCR% was discovered. And thus, it will be assumed that the PCR% of the packaging
materials are relatively the same in Europe as they are in North America for this LCA.
These PCR% are 25% for PET plastic bottles, 47% for glass bottles, and 42% for aluminum
can packaging (The Coca Cola Company, 2020b). In addition to that, it will be assumed that
PCR% for the Solid Unbleached Board (SUB) also known as Coated Unbleached Kraft
Paperboard (CUK) consists of a PCR% of 20% (American Forest & Paper Association,
n.d.). However, the LDPE secondary package used for plastic bottles will have a PCR% of
0%.
Manufacturing processes will also be assumed for this LCA. The manufacturing
processes for each packaging material were estimated based on industry practices.
Transportation information relating to Coca Cola’s services was limited, and thus
transportation was omitted from the system boundaries of the LCA. As well, as this thesis
focuses on the primary and secondary packaging materials specifically, the omission of the
16
transportation phase did not play a pivotal role as it was omitted from every single
packaging system.
Lastly, due to limitations of the LCA software regarding the functional unit, a
convergent factor was manually calculated in order to determine the appropriate weight and
number of packages required to hold 1000L of Coca Cola. See (Appendix A) for
calculations.
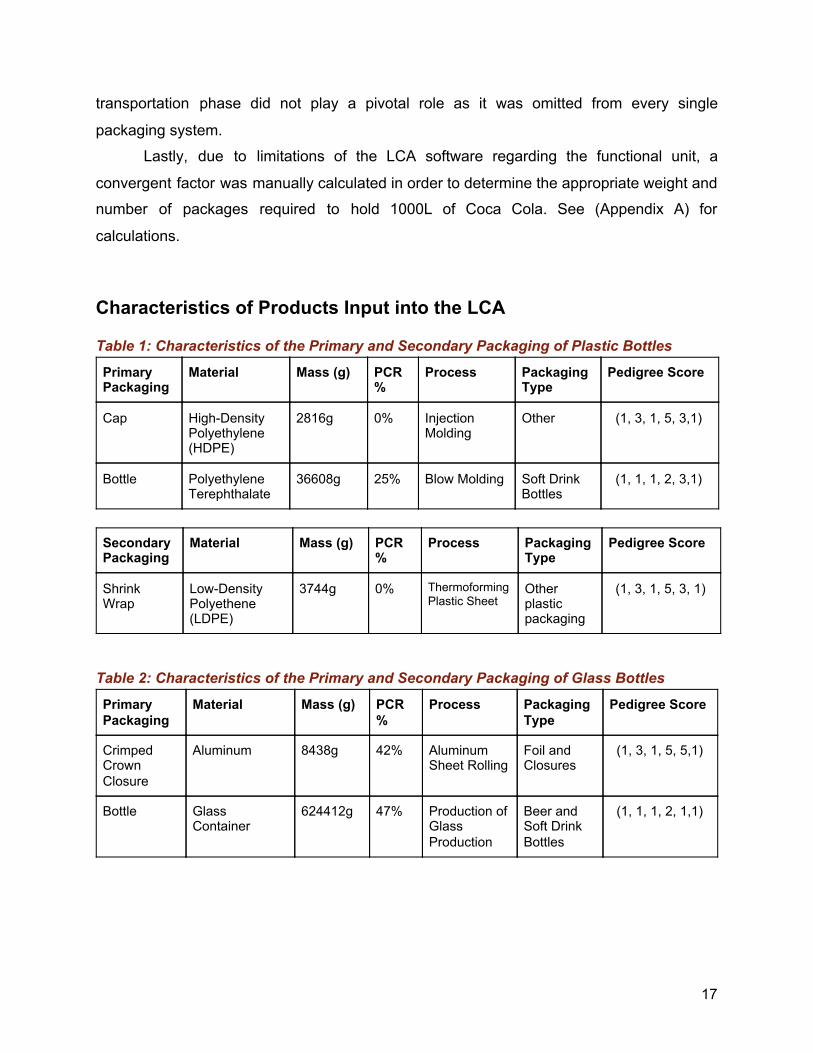
Characteristics of Products Input into the LCA
Table 1: Characteristics of the Primary and Secondary Packaging of Plastic Bottles
Table 2: Characteristics of the Primary and Secondary Packaging of Glass Bottles
17
Primary Packaging
Material Mass (g) PCR%
Process Packaging Type
Pedigree Score
Cap High-Density Polyethylene (HDPE)
2816g 0% Injection Molding
Other (1, 3, 1, 5, 3,1)
Bottle Polyethylene Terephthalate
36608g 25% Blow Molding Soft Drink Bottles
(1, 1, 1, 2, 3,1)
Secondary Packaging
Material Mass (g) PCR%
Process Packaging Type
Pedigree Score
Shrink Wrap
Low-Density Polyethene (LDPE)
3744g 0% Thermoforming Plastic Sheet
Other plastic packaging
(1, 3, 1, 5, 3, 1)
Primary Packaging
Material Mass (g) PCR%
Process Packaging Type
Pedigree Score
Crimped Crown Closure
Aluminum 8438g 42% Aluminum Sheet Rolling
Foil and Closures
(1, 3, 1, 5, 5,1)
Bottle Glass Container
624412g 47% Production of Glass Production
Beer and Soft Drink Bottles
(1, 1, 1, 2, 1,1)
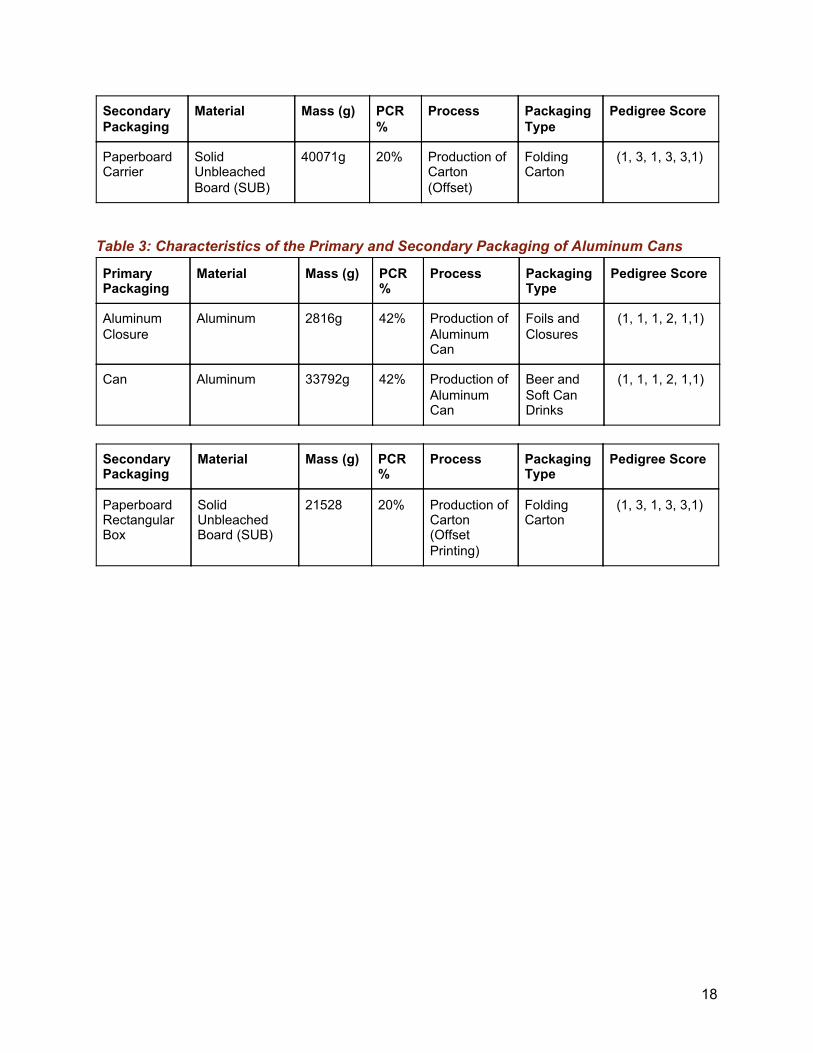
Table 3: Characteristics of the Primary and Secondary Packaging of Aluminum Cans
18
Secondary Packaging
Material Mass (g) PCR%
Process Packaging Type
Pedigree Score
Paperboard Carrier
Solid Unbleached Board (SUB)
40071g 20% Production of Carton (Offset)
Folding Carton
(1, 3, 1, 3, 3,1)
Primary Packaging
Material Mass (g) PCR%
Process Packaging Type
Pedigree Score
Aluminum Closure
Aluminum 2816g 42% Production of Aluminum Can
Foils and Closures
(1, 1, 1, 2, 1,1)
Can Aluminum 33792g 42% Production of Aluminum Can
Beer and Soft Can Drinks
(1, 1, 1, 2, 1,1)
Secondary Packaging
Material Mass (g) PCR%
Process Packaging Type
Pedigree Score
Paperboard Rectangular Box
Solid Unbleached Board (SUB)
21528 20% Production of Carton (Offset Printing)
Folding Carton
(1, 3, 1, 3, 3,1)
Methodology This research focuses on the environmental impacts of Coca Cola’s North
American plastic, glass and aluminum beverage packaging and investigates
environmental impact insights of consumers. Methodologies that would yield
quantitative data to evaluate the impacts of packaging on the environment was most
suitable. However, some qualitative data was collected to gauge consumers’
environmental impact perception. All data was collected through primary research
methods.
Life Cycle Assessment
To evaluate Coca Cola’s packaging, and its impacts on the environment, a life
cycle assessment (LCA) was used. Trayak’s EcoImpact-COMPASS software was
chosen to collect this data. An LCA methodology provided a holistic approach in the
investigation of evaluating environmental impacts. This form of research provides a
perspective of the entire life cycle of a package ranging from raw material extraction to
its end of life. This software required information such as weight (See Appendix B),
types of packaging materials and the characterizations of manufacturing processes. The
use of secondary research was used to assume the manufacturing processes of the
packages (Table 1, 2 & 3) . The manufacturing processes were assumed as Coca Cola
does not directly reveal information pertaining to their manufacturing procedures. As
well, post-consumer recyclability percentages about each packaging material was
gathered through secondary sources. The PCR% used in the LCA for plastic, aluminum
and glass materials were 25%, 42% and 47%, respectively. It was assumed that Coca
Cola’s European market uses the same PCR% as North America. This was because
the information about North America’s PCR% was not readily available. To perform the
LCA, a functional unit of 1000L was used to equalize the volumetric differences in
packages. A limitation of the LCA software is the calculation of the functional unit.
Therefore, to problem solve this limitation, a convergent factor was used in the
calculations of the weights of each primary package and secondary package in relation
to the functional unit (See Appendix A). Transportation was omitted from the LCA due to
the limited information present about Coca Cola’s transportation system. As well, since
19
this thesis focuses on the primary and secondary packaging materials, an omission of
transportation was not pivotal. Once the LCA was conducted, the results of each
package were compared and graphed against each other. The LCA provided insights
on 4 main categories, Fossil Fuel Use (MJ), GHG Emissions (kg CO2 eq.), Water Use
(kl) and Human Impact (DALY). Trayak’s EcoImpact-COMPASS provided graphs and
charts that displayed the results and no further processing of the data was required. An
LCA is an industry-standard, found in numerous studies conducting research on the
impacts of the beverage packaging field. As well, an LCA provided automatically
calculated findings according to industry standards. Thus, using an LCA was a clear
decision to evaluate Coca Cola’s packaging.
Consumer Survey
To investigate the insights of consumers’ environmental impact perception on
Coca Cola’s packaging, a survey was conducted (See Appendix C). The use of Google
Forms was chosen to collect this data. Google Forms was an accessible methodology
that allowed many participants to provide insights by answering both quantitative and
qualitative questions. The survey received 160 responses and was active from October
25, 2020 to Nov 7, 2020. The survey primarily received responses from those who were
in the age range of 18 - 24 living in Canada. The questionnaire had the participants
answer questions on their opinions on Coca Cola’s plastic, glass and aluminum
beverage packaging systems by rating each package based on a numerical system.
Participants were asked to rate each primary and secondary package on their
environmental impact. A scale from 1 to 10 was used to quantify their opinions, 1
indicating that the package has the least environmental impact and 10 being the
package has greatest environmental impact. The questionnaire also investigated
recycling, beverage washout practices and consumer purchase behaviour. Google
forms was used as it was relatively easy to set up, it allowed the use of images, and
their display of results was helpful. Following the collection of the results, they were
transferred into Microsoft Excel to have further processing done. The use of an ANOVA
single factor analysis was used to compare the mean of each package and to identify
the p-value. Lastly, graphs were created to visualize the data.
20
LCA Results of Coca Cola’s Beverage Packaging Systems (Primary + Secondary Package)
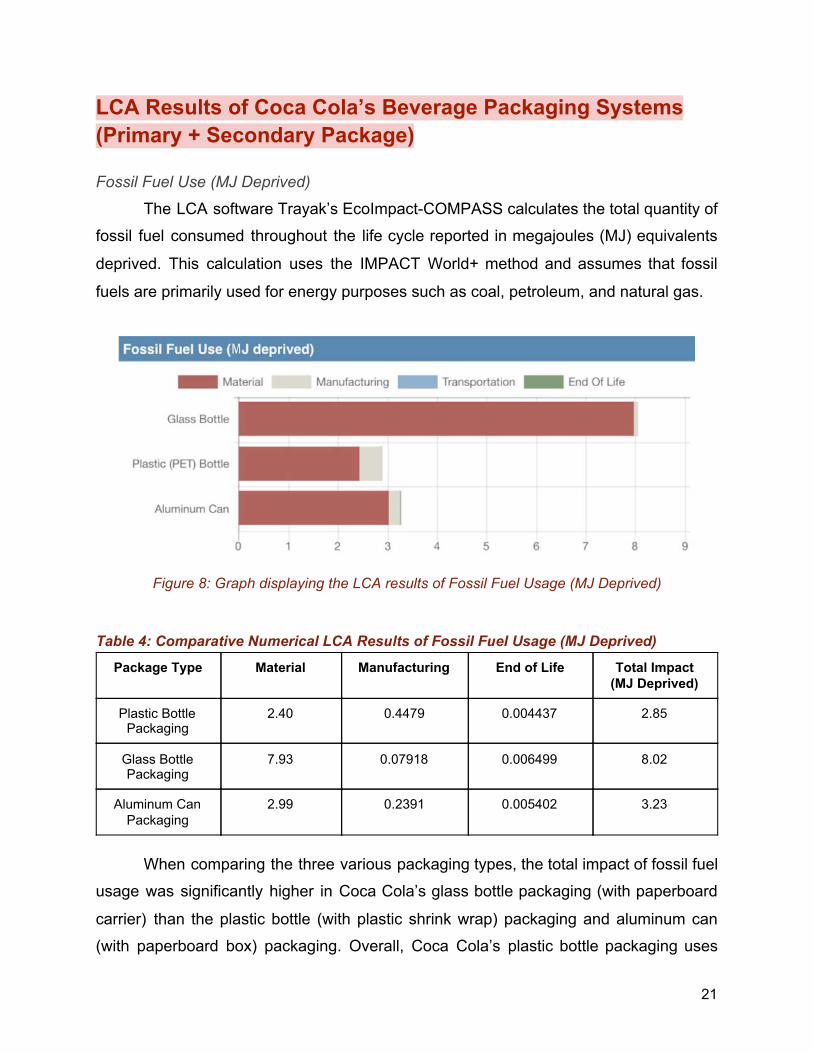
Fossil Fuel Use (MJ Deprived)
The LCA software Trayak’s EcoImpact-COMPASS calculates the total quantity of
fossil fuel consumed throughout the life cycle reported in megajoules (MJ) equivalents
deprived. This calculation uses the IMPACT World+ method and assumes that fossil
fuels are primarily used for energy purposes such as coal, petroleum, and natural gas.
Figure 8: Graph displaying the LCA results of Fossil Fuel Usage (MJ Deprived) Table 4: Comparative Numerical LCA Results of Fossil Fuel Usage (MJ Deprived)
When comparing the three various packaging types, the total impact of fossil fuel
usage was significantly higher in Coca Cola’s glass bottle packaging (with paperboard
carrier) than the plastic bottle (with plastic shrink wrap) packaging and aluminum can
(with paperboard box) packaging. Overall, Coca Cola’s plastic bottle packaging uses
21
Package Type Material Manufacturing End of Life Total Impact (MJ Deprived)
Plastic Bottle Packaging
2.40 0.4479 0.004437 2.85
Glass Bottle Packaging
7.93 0.07918 0.006499 8.02
Aluminum Can Packaging
2.99 0.2391 0.005402 3.23
64.41% fewer fossil fuels than their glass packaging, and aluminum can packaging uses
59.69% fewer fossil fuels than their glass packaging (Figure 8 & Table 4 ). The most
notable difference in fossil fuel usage is seen in the Material phase. In addition, the
manufacturing of the glass bottle packaging (with paperboard carrier) uses the least
amount of fossil fuel compared to aluminum can production and plastic bottle packaging
manufacturing. However, due to the material phase, Coca Cola’s glass packaging
overall has the highest fossil fuel usage.
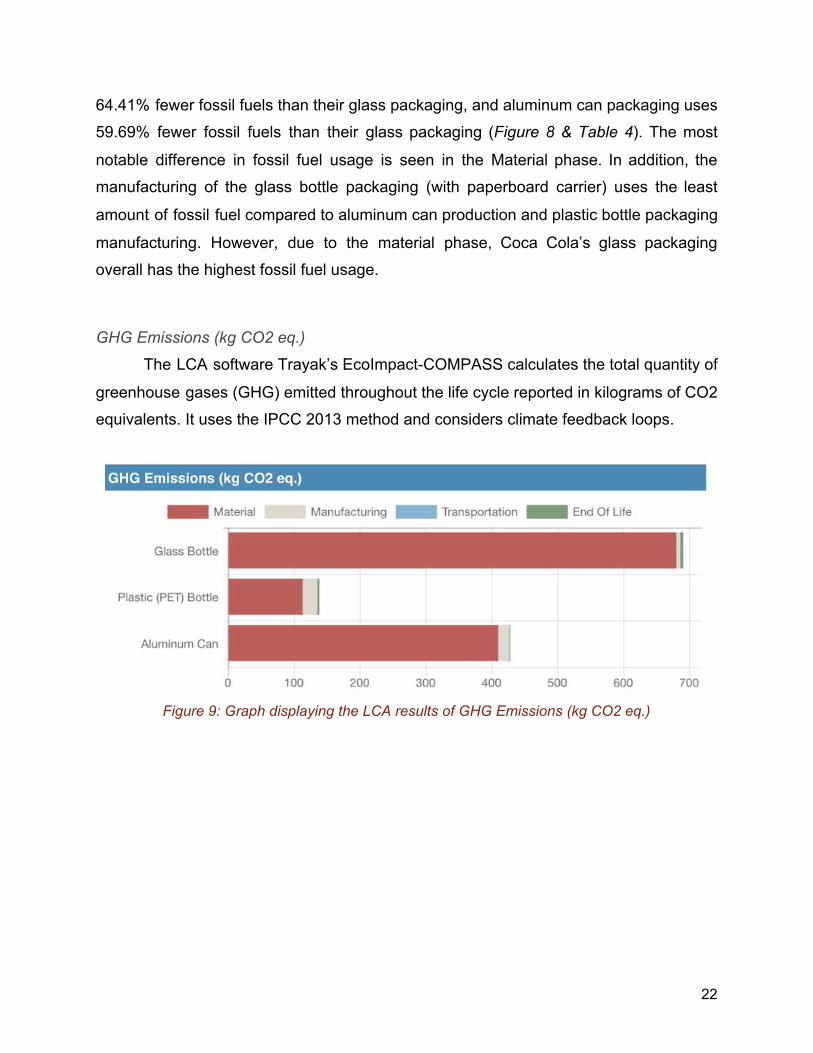
GHG Emissions (kg CO2 eq.)
The LCA software Trayak’s EcoImpact-COMPASS calculates the total quantity of
greenhouse gases (GHG) emitted throughout the life cycle reported in kilograms of CO2
equivalents. It uses the IPCC 2013 method and considers climate feedback loops.
Figure 9: Graph displaying the LCA results of GHG Emissions (kg CO2 eq.)
22
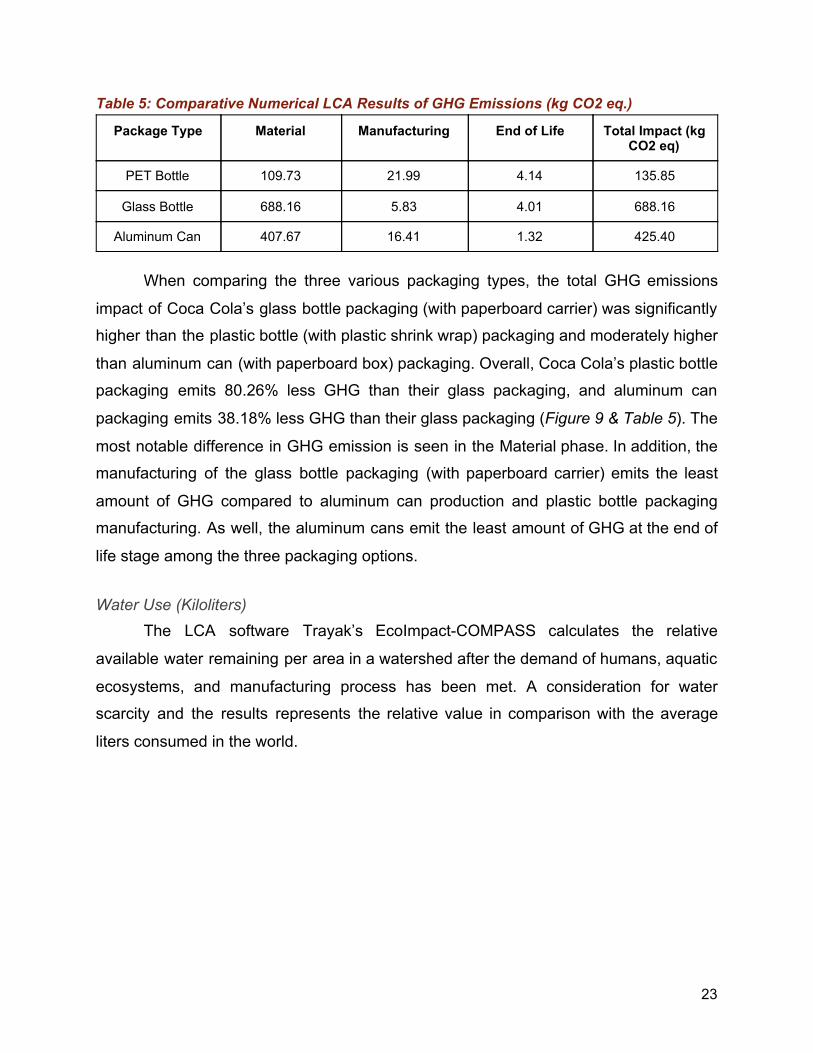
Table 5: Comparative Numerical LCA Results of GHG Emissions (kg CO2 eq.)
When comparing the three various packaging types, the total GHG emissions
impact of Coca Cola’s glass bottle packaging (with paperboard carrier) was significantly
higher than the plastic bottle (with plastic shrink wrap) packaging and moderately higher
than aluminum can (with paperboard box) packaging. Overall, Coca Cola’s plastic bottle
packaging emits 80.26% less GHG than their glass packaging, and aluminum can
packaging emits 38.18% less GHG than their glass packaging (Figure 9 & Table 5 ). The
most notable difference in GHG emission is seen in the Material phase. In addition, the
manufacturing of the glass bottle packaging (with paperboard carrier) emits the least
amount of GHG compared to aluminum can production and plastic bottle packaging
manufacturing. As well, the aluminum cans emit the least amount of GHG at the end of
life stage among the three packaging options.
Water Use (Kiloliters) The LCA software Trayak’s EcoImpact-COMPASS calculates the relative
available water remaining per area in a watershed after the demand of humans, aquatic
ecosystems, and manufacturing process has been met. A consideration for water
scarcity and the results represents the relative value in comparison with the average
liters consumed in the world.
23
Package Type Material Manufacturing End of Life Total Impact (kg CO2 eq)
PET Bottle 109.73 21.99 4.14 135.85
Glass Bottle 688.16 5.83 4.01 688.16
Aluminum Can 407.67 16.41 1.32 425.40
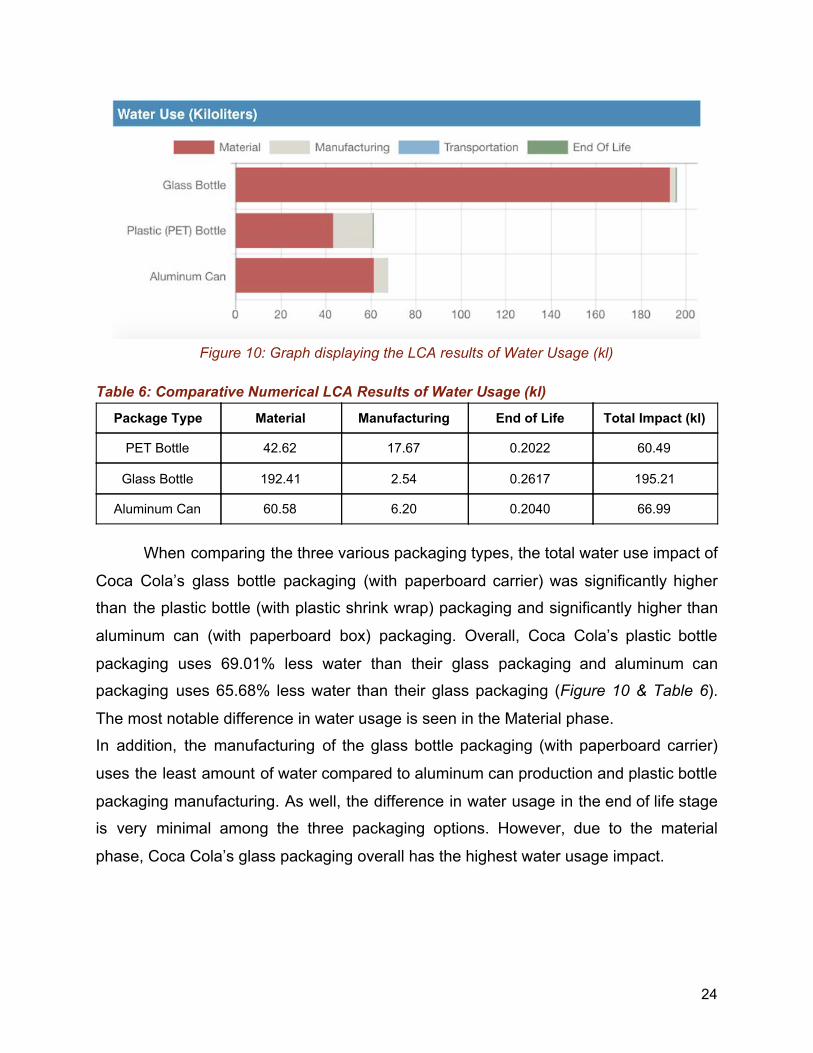
Figure 10: Graph displaying the LCA results of Water Usage (kl)
Table 6: Comparative Numerical LCA Results of Water Usage (kl)
When comparing the three various packaging types, the total water use impact of
Coca Cola’s glass bottle packaging (with paperboard carrier) was significantly higher
than the plastic bottle (with plastic shrink wrap) packaging and significantly higher than
aluminum can (with paperboard box) packaging. Overall, Coca Cola’s plastic bottle
packaging uses 69.01% less water than their glass packaging and aluminum can
packaging uses 65.68% less water than their glass packaging (Figure 10 & Table 6 ).
The most notable difference in water usage is seen in the Material phase.
In addition, the manufacturing of the glass bottle packaging (with paperboard carrier)
uses the least amount of water compared to aluminum can production and plastic bottle
packaging manufacturing. As well, the difference in water usage in the end of life stage
is very minimal among the three packaging options. However, due to the material
phase, Coca Cola’s glass packaging overall has the highest water usage impact.
24
Package Type Material Manufacturing End of Life Total Impact (kl)
PET Bottle 42.62 17.67 0.2022 60.49
Glass Bottle 192.41 2.54 0.2617 195.21
Aluminum Can 60.58 6.20 0.2040 66.99
Human Impact (DALY)
The LCA software Trayak’s EcoImpact-COMPASS calculates the number of
environmental emissions resulting in particulate, cancer & toxic non-cancer impacts to
humans released throughout the lifecycle. The results convey these three
measurements in Disability Adjusted Life Years (DALY). The guide of Impact World+ is
used and considerations of severity factors are included.
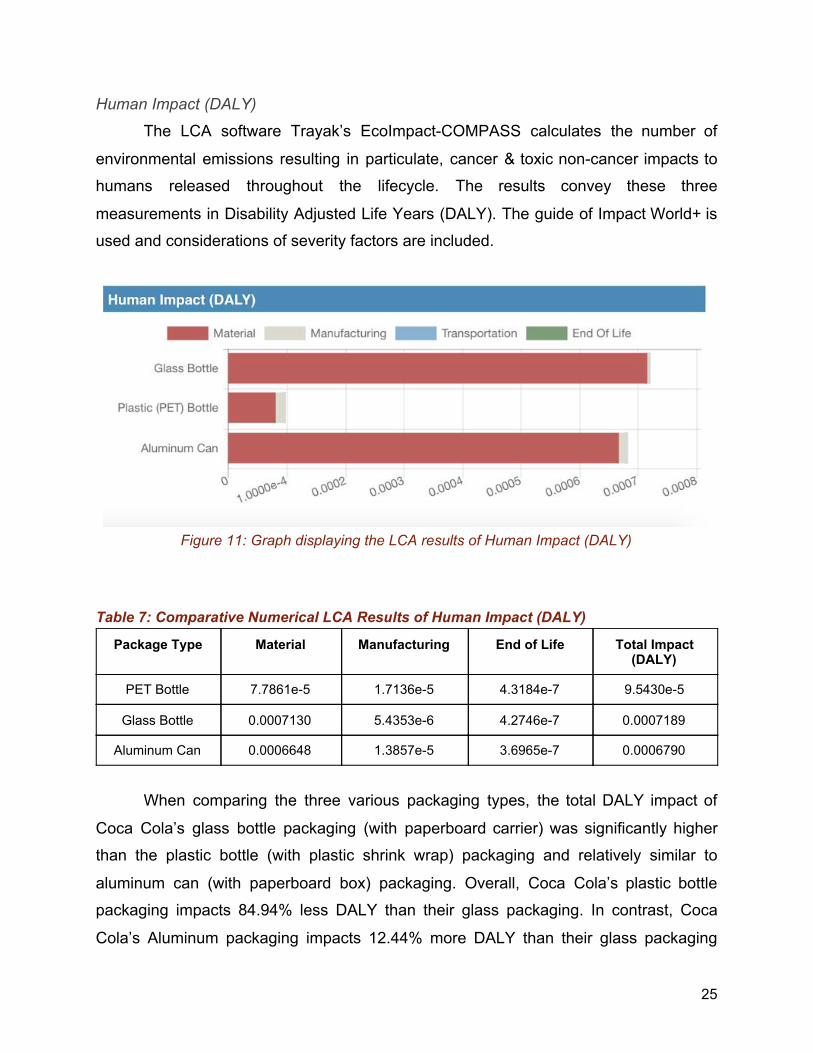
Figure 11: Graph displaying the LCA results of Human Impact (DALY)
Table 7: Comparative Numerical LCA Results of Human Impact (DALY)
When comparing the three various packaging types, the total DALY impact of
Coca Cola’s glass bottle packaging (with paperboard carrier) was significantly higher
than the plastic bottle (with plastic shrink wrap) packaging and relatively similar to
aluminum can (with paperboard box) packaging. Overall, Coca Cola’s plastic bottle
packaging impacts 84.94% less DALY than their glass packaging. In contrast, Coca
Cola’s Aluminum packaging impacts 12.44% more DALY than their glass packaging
25
Package Type Material Manufacturing End of Life Total Impact (DALY)
PET Bottle 7.7861e-5 1.7136e-5 4.3184e-7 9.5430e-5
Glass Bottle 0.0007130 5.4353e-6 4.2746e-7 0.0007189
Aluminum Can 0.0006648 1.3857e-5 3.6965e-7 0.0006790
(Figure 11 & Table 7 ). The most notable difference in DALY is seen in the Material
phase. In addition, the manufacturing of the glass bottle packaging (with paperboard
carrier) impacts with the least amount of DALY compared to aluminum can production
and plastic bottle packaging manufacturing. As well, the difference in DALY impact at
the end of life stage is very minimal among the three packaging options. However, due
to the material phase, Coca Cola’s glass packaging overall has the highest DALY
impact.
Survey Results
The following information showcases the results from the survey that was
conducted. To reiterate, the questionnaire had the participants answer questions on
their opinions on Coca Cola’s plastic, glass and aluminum beverage packaging systems
by rating each package based on a numerical system. Participants were asked to rate
each primary and secondary package on their environmental impact. A scale from 1 to
10 was used to quantify their opinions, 1 indicating that the package has the least
environmental impact and 10 being the package has greatest environmental impact.
The questionnaire also investigated recycling, beverage washing practices and
consumer purchase behaviour.
Environmental Impact Rating of Each Beverage Packaging The Null Hypothesis (Ho) states that the μa = μb = μc. In other words, the
average of the values in each group are equal.
The alternative hypothesis (Ha) states that there is at least one inequality (ALOI).
Meaning that at least one of the groups is different from another group.
The P-Value indicates whether the null hypothesis is not rejected, or in other
words, if the alternative hypothesis should be accepted. This analysis was based on an
alpha of 0.05.
26
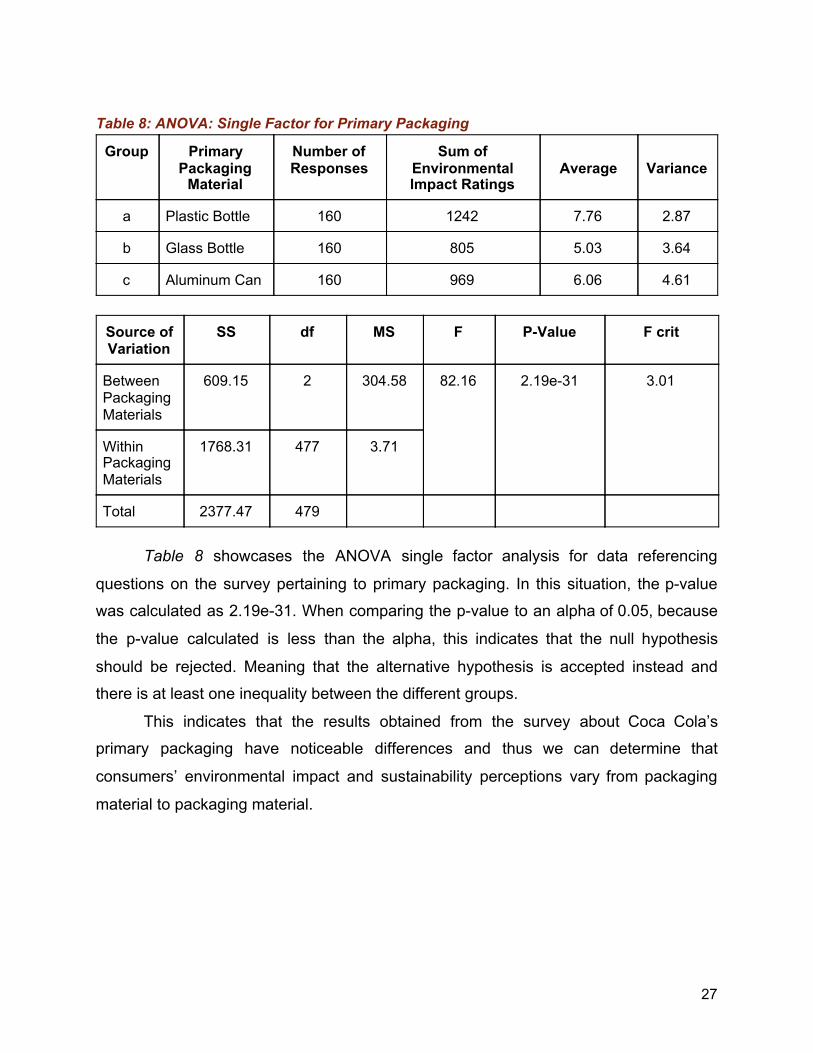
Table 8: ANOVA: Single Factor for Primary Packaging
Table 8 showcases the ANOVA single factor analysis for data referencing
questions on the survey pertaining to primary packaging. In this situation, the p-value
was calculated as 2.19e-31. When comparing the p-value to an alpha of 0.05, because
the p-value calculated is less than the alpha, this indicates that the null hypothesis
should be rejected. Meaning that the alternative hypothesis is accepted instead and
there is at least one inequality between the different groups.
This indicates that the results obtained from the survey about Coca Cola’s
primary packaging have noticeable differences and thus we can determine that
consumers’ environmental impact and sustainability perceptions vary from packaging
material to packaging material.
27
Group Primary Packaging
Material
Number of Responses
Sum of Environmental Impact Ratings
Average
Variance
a Plastic Bottle 160 1242 7.76 2.87
b Glass Bottle 160 805 5.03 3.64
c Aluminum Can 160 969 6.06 4.61
Source of Variation
SS df MS F P-Value F crit
Between Packaging Materials
609.15 2 304.58 82.16 2.19e-31 3.01
Within Packaging Materials
1768.31 477 3.71
Total 2377.47 479
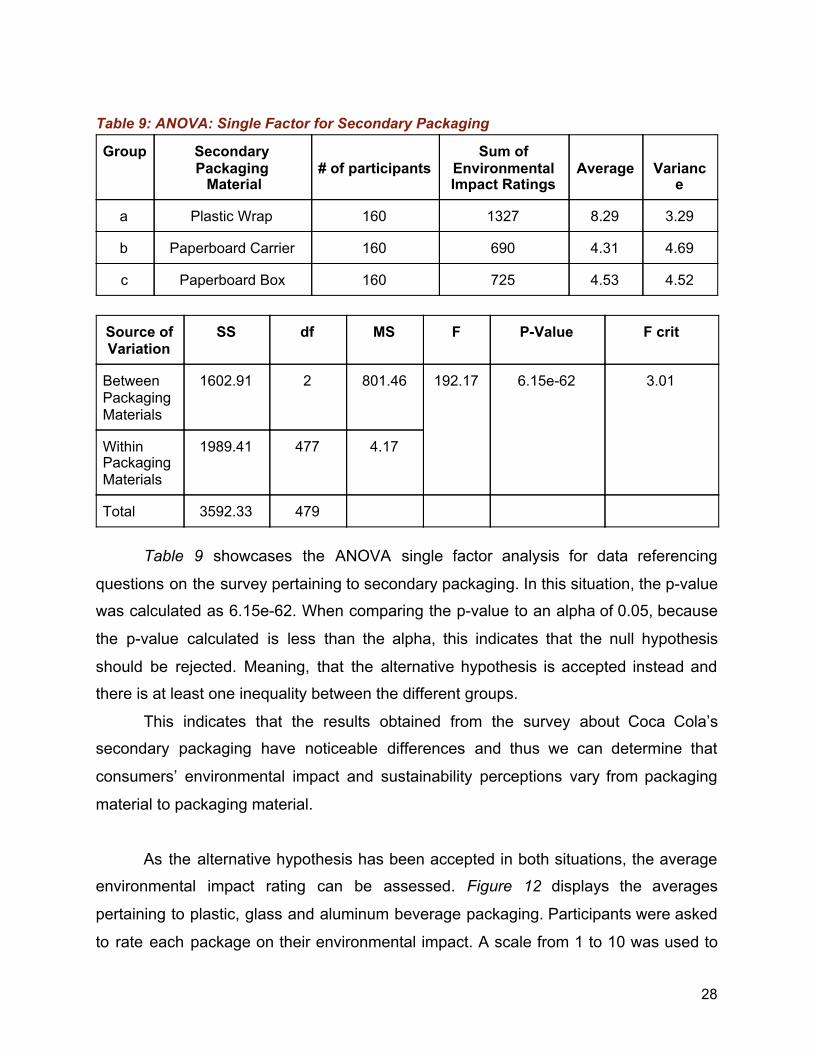
Table 9: ANOVA: Single Factor for Secondary Packaging
Table 9 showcases the ANOVA single factor analysis for data referencing
questions on the survey pertaining to secondary packaging. In this situation, the p-value
was calculated as 6.15e-62. When comparing the p-value to an alpha of 0.05, because
the p-value calculated is less than the alpha, this indicates that the null hypothesis
should be rejected. Meaning, that the alternative hypothesis is accepted instead and
there is at least one inequality between the different groups.
This indicates that the results obtained from the survey about Coca Cola’s
secondary packaging have noticeable differences and thus we can determine that
consumers’ environmental impact and sustainability perceptions vary from packaging
material to packaging material.
As the alternative hypothesis has been accepted in both situations, the average
environmental impact rating can be assessed. Figure 12 displays the averages
pertaining to plastic, glass and aluminum beverage packaging. Participants were asked
to rate each package on their environmental impact. A scale from 1 to 10 was used to
28
Group Secondary Packaging Material
# of participants
Sum of Environmental Impact Ratings
Average
Varianc
e
a Plastic Wrap 160 1327 8.29 3.29
b Paperboard Carrier 160 690 4.31 4.69
c Paperboard Box 160 725 4.53 4.52
Source of Variation
SS df MS F P-Value F crit
Between Packaging Materials
1602.91 2 801.46 192.17 6.15e-62 3.01
Within Packaging Materials
1989.41 477 4.17
Total 3592.33 479
quantify their opinions, 1 indicating that the package has the least environmental impact
and 10 being the package has greatest environmental impact.
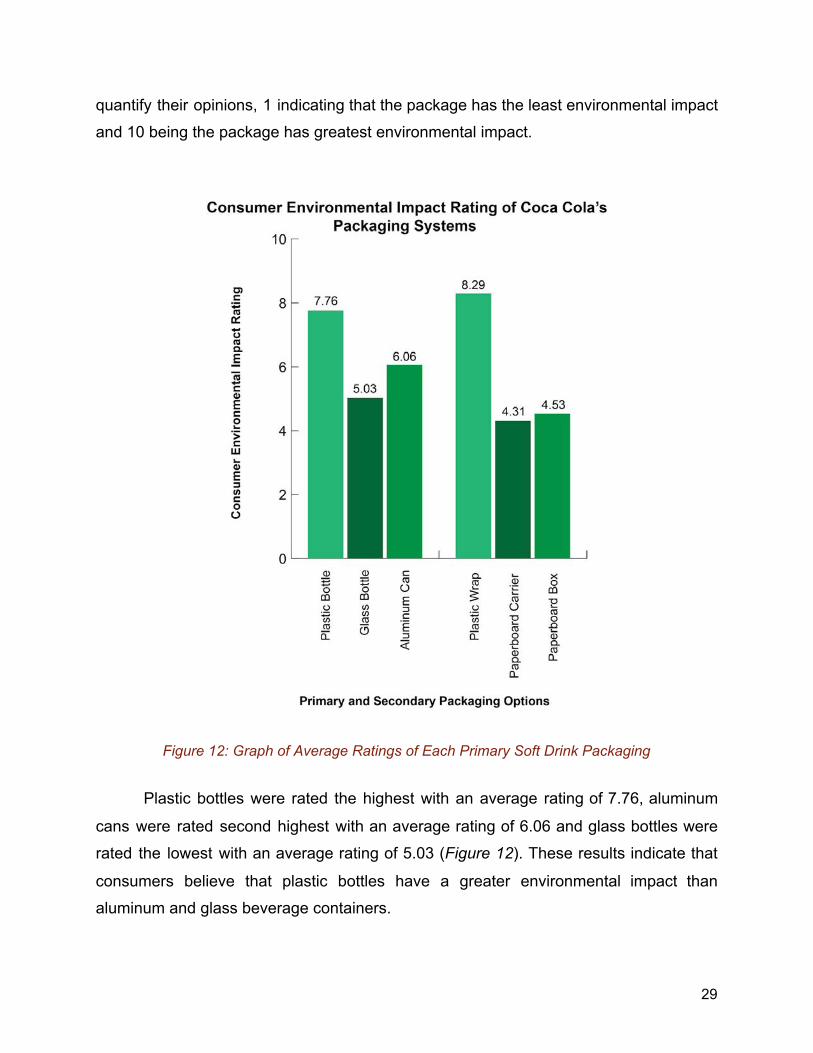
Figure 12: Graph of Average Ratings of Each Primary Soft Drink Packaging
Plastic bottles were rated the highest with an average rating of 7.76, aluminum
cans were rated second highest with an average rating of 6.06 and glass bottles were
rated the lowest with an average rating of 5.03 (Figure 12 ). These results indicate that
consumers believe that plastic bottles have a greater environmental impact than
aluminum and glass beverage containers.
29
This trend is similarly seen in the results pertaining to Coca Cola’s secondary
packaging. The plastic wrap packaged around the plastic bottles had the highest
average rating of 8.29. Whereas the paperboard box rated second highest with an
average rating of 4.53 and the paperboard carrier rated lowest with an average rating of
4.31 (Figure 12 ).
Recycling and Wash Habits of Consumers
Plastic Bottles
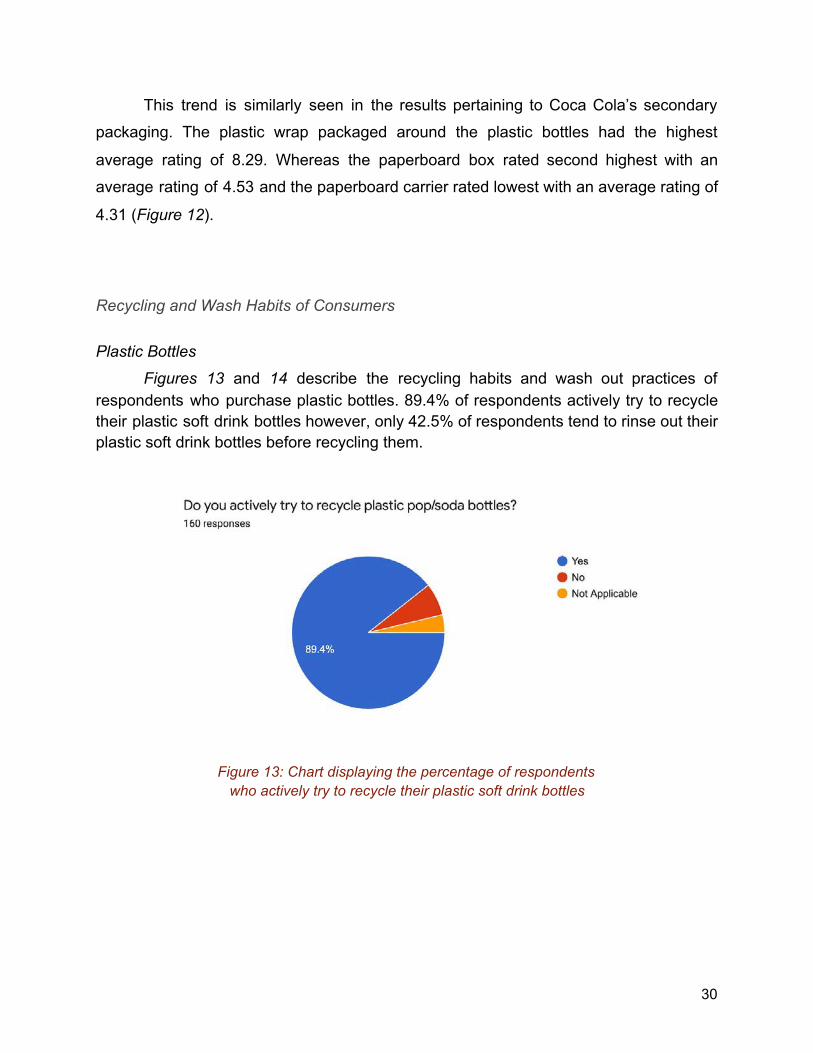
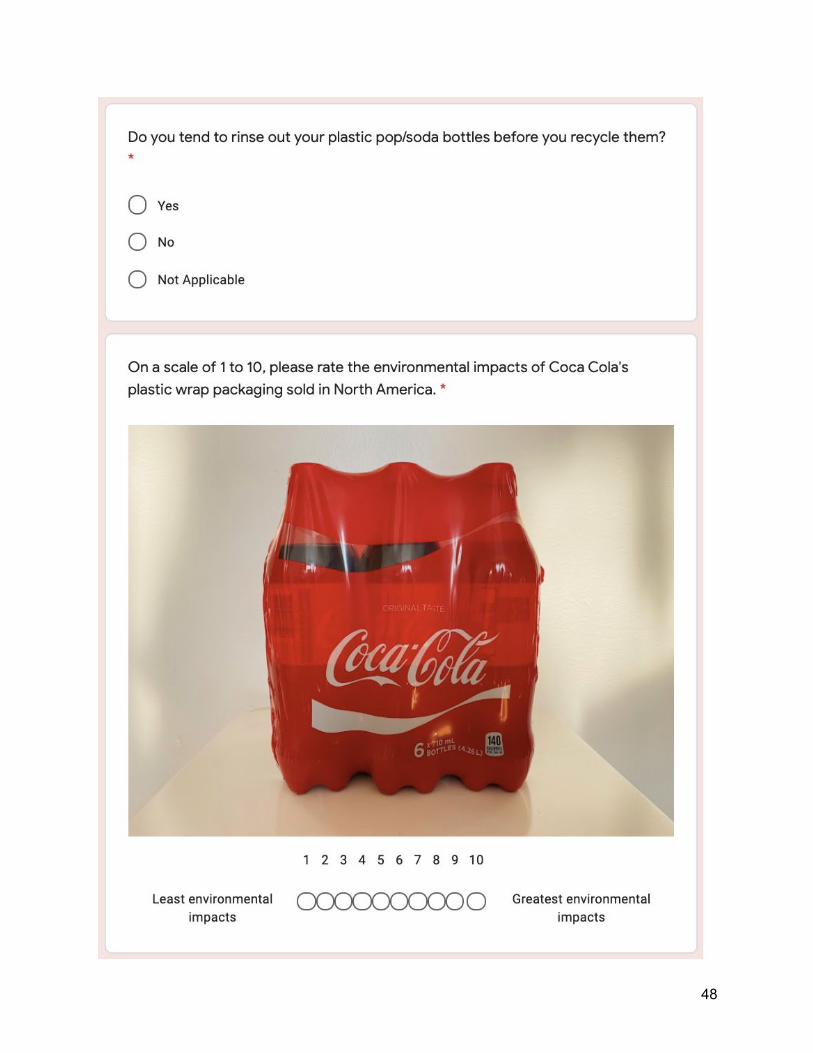
Figures 13 and 14 describe the recycling habits and wash out practices of respondents who purchase plastic bottles. 89.4% of respondents actively try to recycle their plastic soft drink bottles however, only 42.5% of respondents tend to rinse out their plastic soft drink bottles before recycling them.
Figure 13: Chart displaying the percentage of respondents who actively try to recycle their plastic soft drink bottles
30
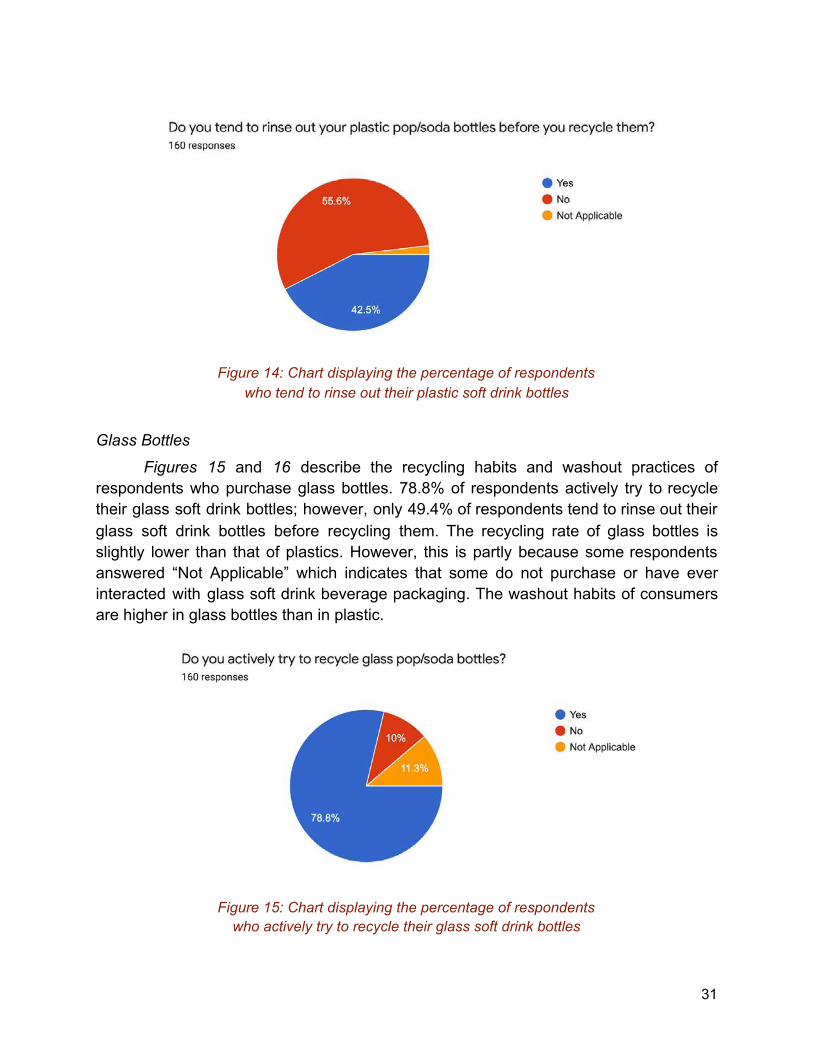
Figure 14: Chart displaying the percentage of respondents who tend to rinse out their plastic soft drink bottles
Glass Bottles
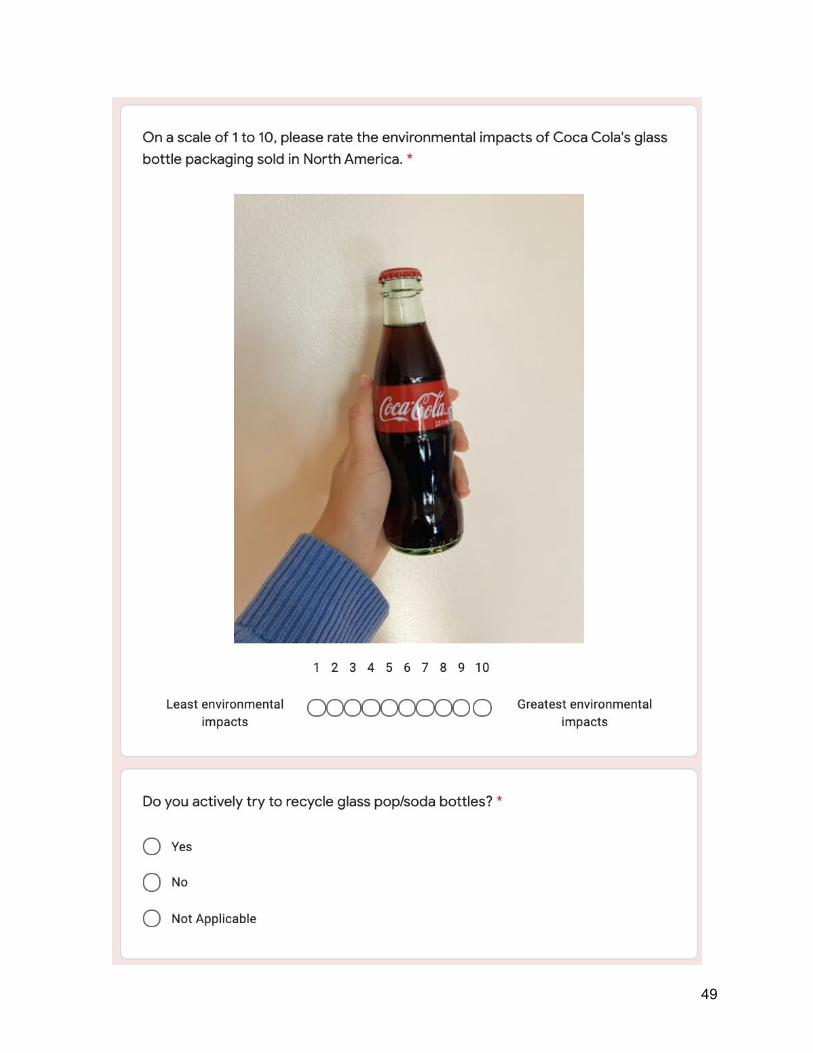
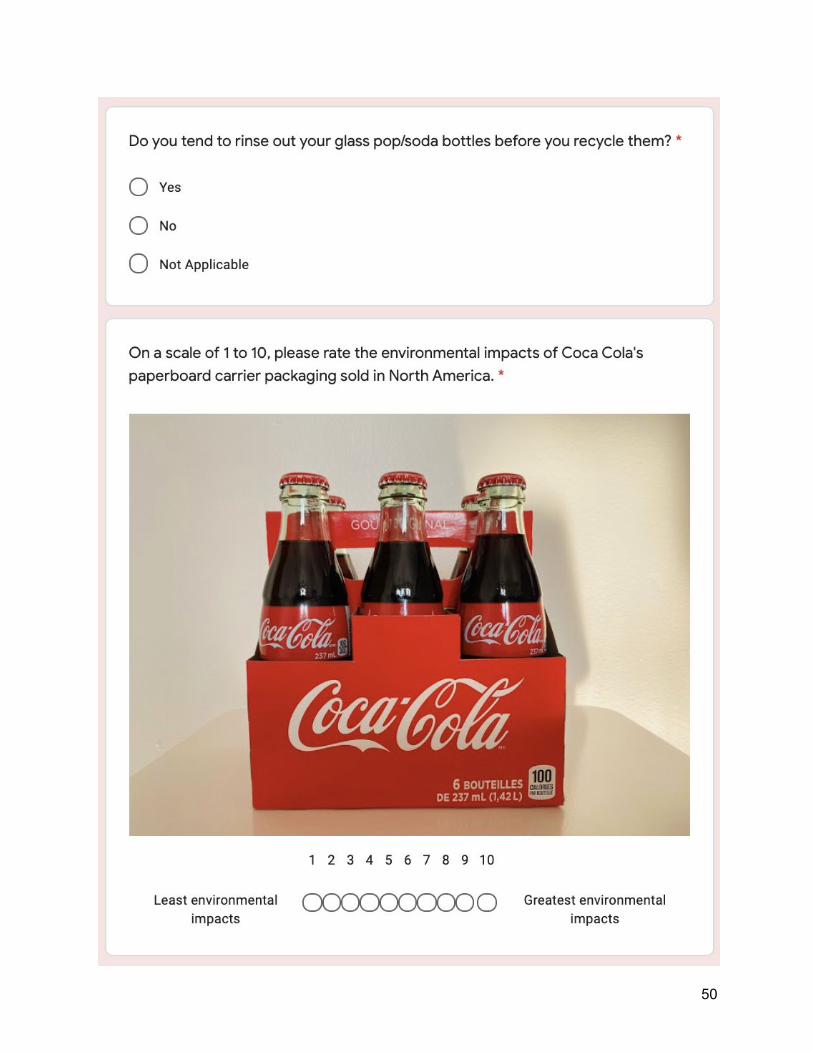
Figures 15 and 16 describe the recycling habits and washout practices of respondents who purchase glass bottles. 78.8% of respondents actively try to recycle their glass soft drink bottles; however, only 49.4% of respondents tend to rinse out their glass soft drink bottles before recycling them. The recycling rate of glass bottles is slightly lower than that of plastics. However, this is partly because some respondents answered “Not Applicable” which indicates that some do not purchase or have ever interacted with glass soft drink beverage packaging. The washout habits of consumers are higher in glass bottles than in plastic.
Figure 15: Chart displaying the percentage of respondents who actively try to recycle their glass soft drink bottles
31
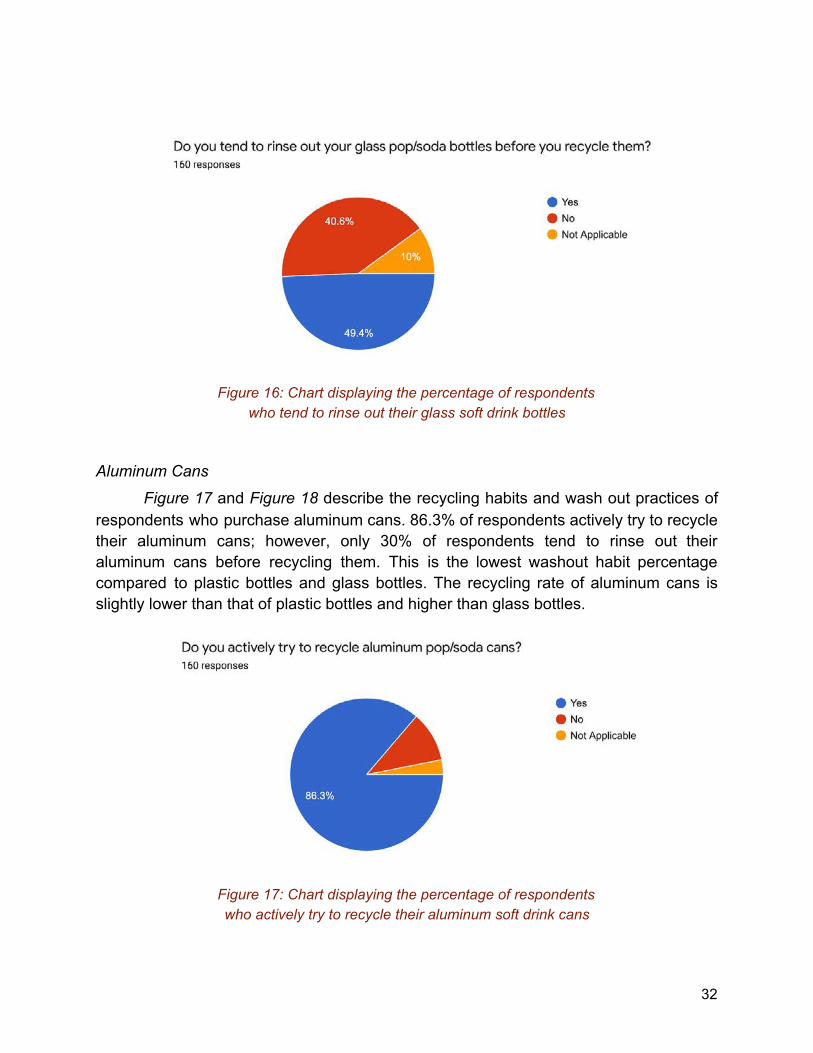
Figure 16: Chart displaying the percentage of respondents
who tend to rinse out their glass soft drink bottles Aluminum Cans
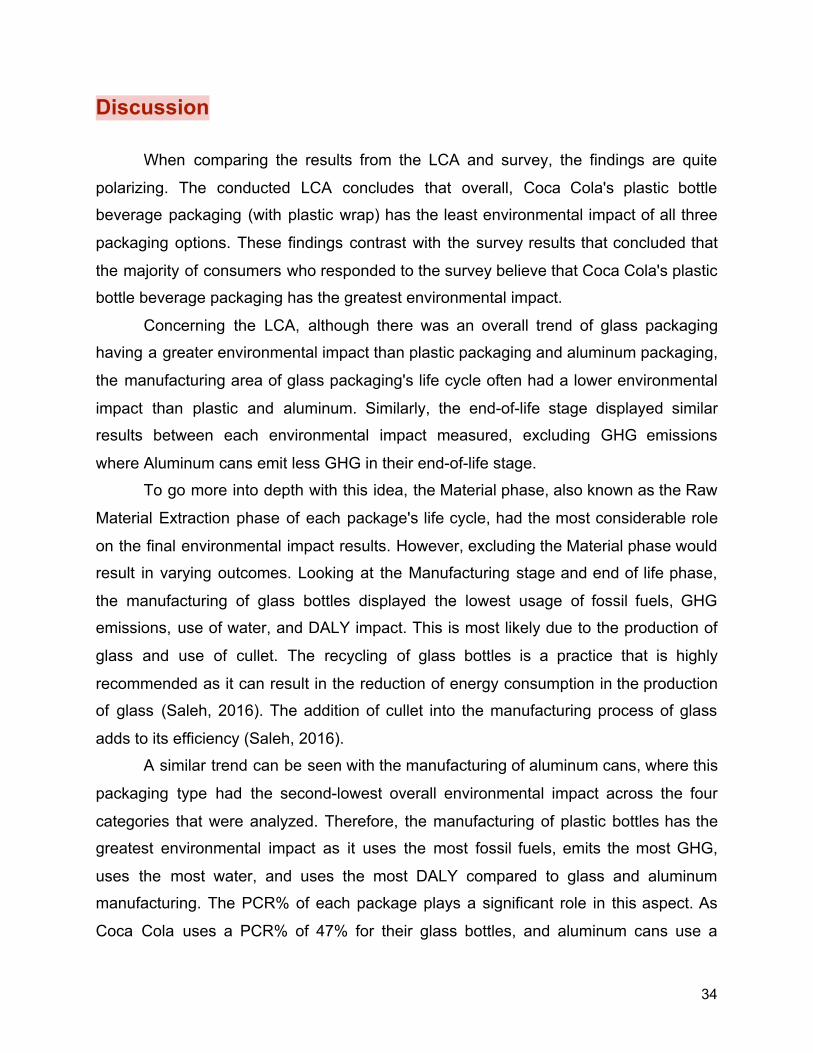
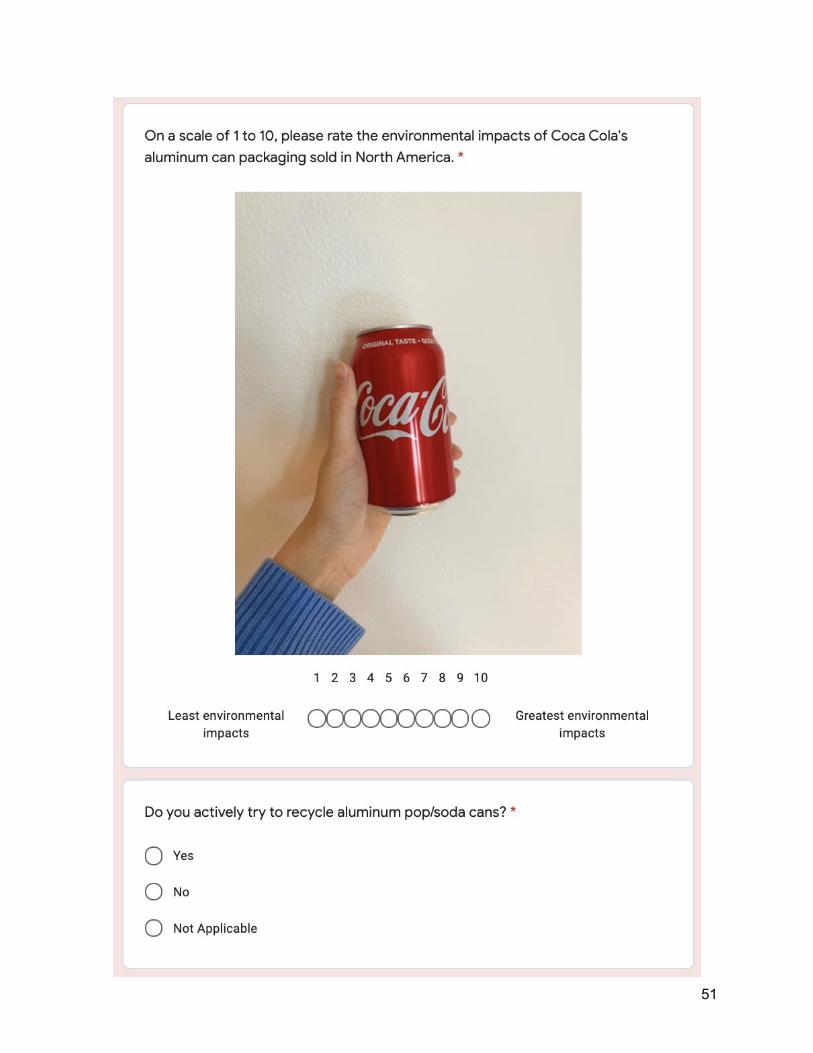
Figure 17 and Figure 18 describe the recycling habits and wash out practices of respondents who purchase aluminum cans. 86.3% of respondents actively try to recycle their aluminum cans; however, only 30% of respondents tend to rinse out their aluminum cans before recycling them. This is the lowest washout habit percentage compared to plastic bottles and glass bottles. The recycling rate of aluminum cans is slightly lower than that of plastic bottles and higher than glass bottles.
Figure 17: Chart displaying the percentage of respondents who actively try to recycle their aluminum soft drink cans
32
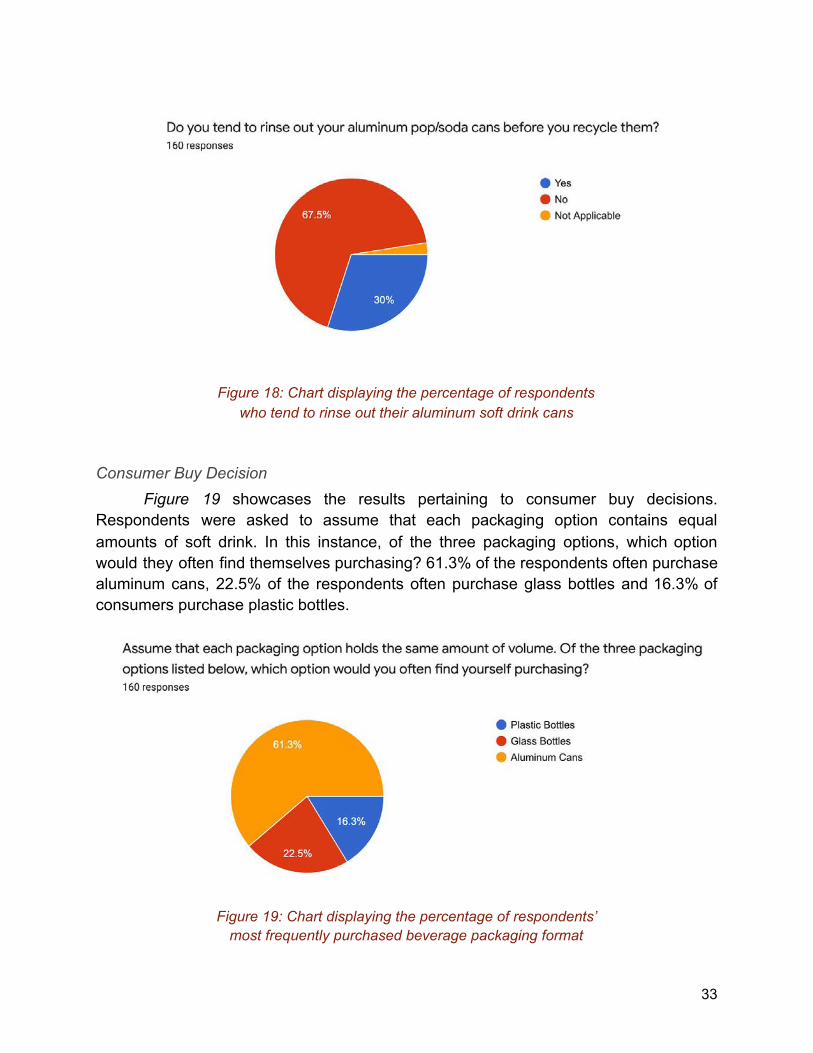
Figure 18: Chart displaying the percentage of respondents who tend to rinse out their aluminum soft drink cans
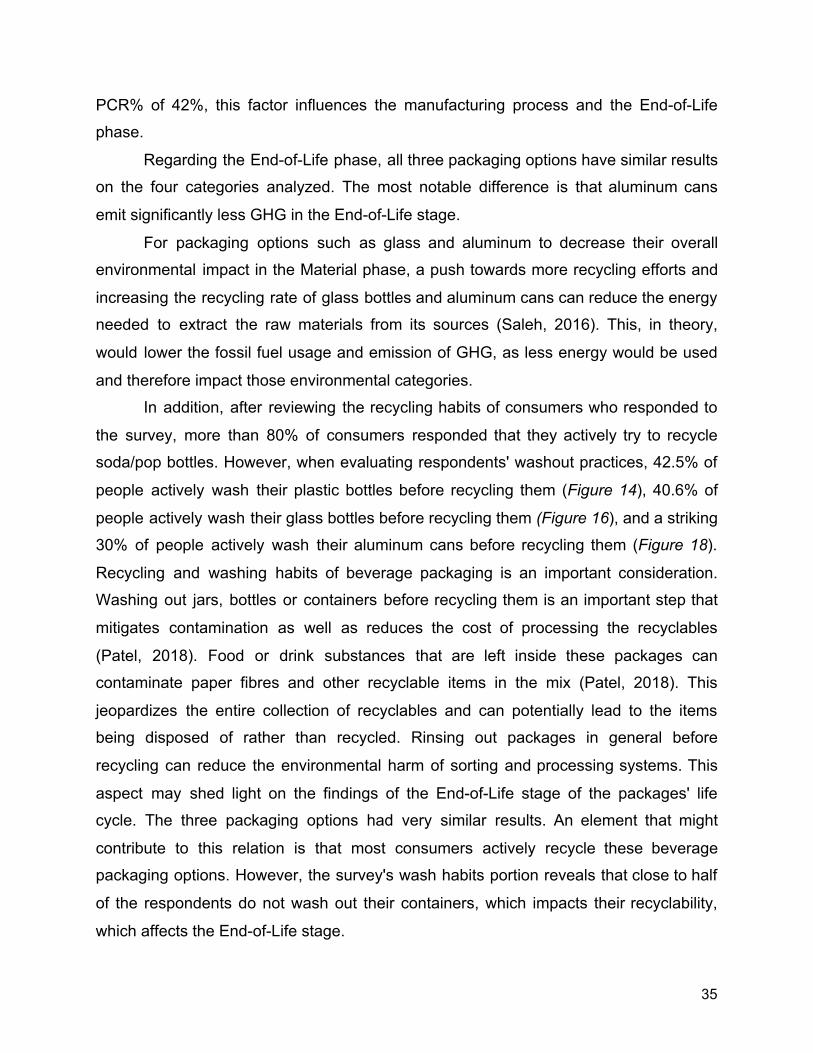
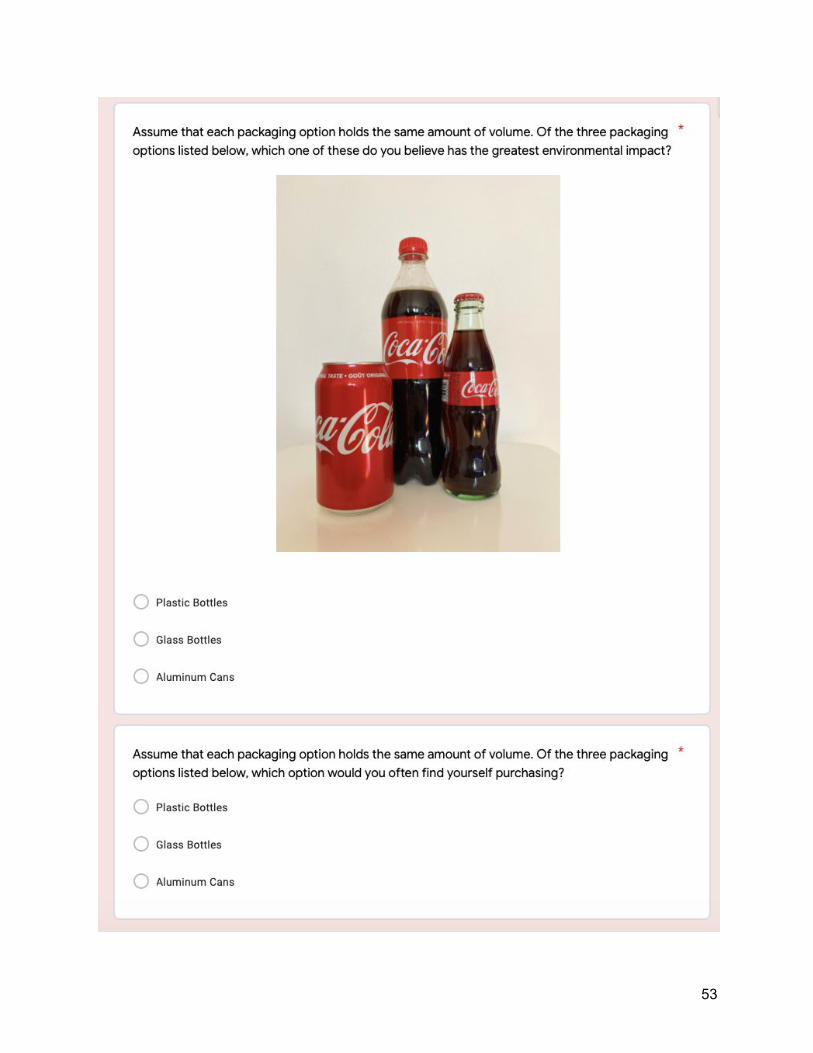
Consumer Buy Decision Figure 19 showcases the results pertaining to consumer buy decisions.
Respondents were asked to assume that each packaging option contains equal amounts of soft drink. In this instance, of the three packaging options, which option would they often find themselves purchasing? 61.3% of the respondents often purchase aluminum cans, 22.5% of the respondents often purchase glass bottles and 16.3% of consumers purchase plastic bottles.
Figure 19: Chart displaying the percentage of respondents’
most frequently purchased beverage packaging format
33
Discussion
When comparing the results from the LCA and survey, the findings are quite
polarizing. The conducted LCA concludes that overall, Coca Cola's plastic bottle
beverage packaging (with plastic wrap) has the least environmental impact of all three
packaging options. These findings contrast with the survey results that concluded that
the majority of consumers who responded to the survey believe that Coca Cola's plastic
bottle beverage packaging has the greatest environmental impact.
Concerning the LCA, although there was an overall trend of glass packaging
having a greater environmental impact than plastic packaging and aluminum packaging,
the manufacturing area of glass packaging's life cycle often had a lower environmental
impact than plastic and aluminum. Similarly, the end-of-life stage displayed similar
results between each environmental impact measured, excluding GHG emissions
where Aluminum cans emit less GHG in their end-of-life stage.
To go more into depth with this idea, the Material phase, also known as the Raw
Material Extraction phase of each package's life cycle, had the most considerable role
on the final environmental impact results. However, excluding the Material phase would
result in varying outcomes. Looking at the Manufacturing stage and end of life phase,
the manufacturing of glass bottles displayed the lowest usage of fossil fuels, GHG
emissions, use of water, and DALY impact. This is most likely due to the production of
glass and use of cullet. The recycling of glass bottles is a practice that is highly
recommended as it can result in the reduction of energy consumption in the production
of glass (Saleh, 2016). The addition of cullet into the manufacturing process of glass
adds to its efficiency (Saleh, 2016).
A similar trend can be seen with the manufacturing of aluminum cans, where this
packaging type had the second-lowest overall environmental impact across the four
categories that were analyzed. Therefore, the manufacturing of plastic bottles has the
greatest environmental impact as it uses the most fossil fuels, emits the most GHG,
uses the most water, and uses the most DALY compared to glass and aluminum
manufacturing. The PCR% of each package plays a significant role in this aspect. As
Coca Cola uses a PCR% of 47% for their glass bottles, and aluminum cans use a
34
PCR% of 42%, this factor influences the manufacturing process and the End-of-Life
phase.
Regarding the End-of-Life phase, all three packaging options have similar results
on the four categories analyzed. The most notable difference is that aluminum cans
emit significantly less GHG in the End-of-Life stage.
For packaging options such as glass and aluminum to decrease their overall
environmental impact in the Material phase, a push towards more recycling efforts and
increasing the recycling rate of glass bottles and aluminum cans can reduce the energy
needed to extract the raw materials from its sources (Saleh, 2016). This, in theory,
would lower the fossil fuel usage and emission of GHG, as less energy would be used
and therefore impact those environmental categories.
In addition, after reviewing the recycling habits of consumers who responded to
the survey, more than 80% of consumers responded that they actively try to recycle
soda/pop bottles. However, when evaluating respondents' washout practices, 42.5% of
people actively wash their plastic bottles before recycling them (Figure 14 ), 40.6% of
people actively wash their glass bottles before recycling them (Figure 16 ), and a striking
30% of people actively wash their aluminum cans before recycling them (Figure 18 ).
Recycling and washing habits of beverage packaging is an important consideration.
Washing out jars, bottles or containers before recycling them is an important step that
mitigates contamination as well as reduces the cost of processing the recyclables
(Patel, 2018). Food or drink substances that are left inside these packages can
contaminate paper fibres and other recyclable items in the mix (Patel, 2018). This
jeopardizes the entire collection of recyclables and can potentially lead to the items
being disposed of rather than recycled. Rinsing out packages in general before
recycling can reduce the environmental harm of sorting and processing systems. This
aspect may shed light on the findings of the End-of-Life stage of the packages' life
cycle. The three packaging options had very similar results. An element that might
contribute to this relation is that most consumers actively recycle these beverage
packaging options. However, the survey's wash habits portion reveals that close to half
of the respondents do not wash out their containers, which impacts their recyclability,
which affects the End-of-Life stage.
35
Although glass and aluminum beverage packaging may have resulted in higher
environmental impact numbers than plastic, there are positives to both materials that
cannot be fully captured through the LCA. For example, glass can be recycled, melted
down, and reformed without losing strength or quality without producing harmful
by-products (Emblem & Emblem, 2012).
Aluminum cans are recycled on an atomic level. They are re-melted, and the
recycled metal can be re-melted an infinite amount of times without losing its properties.
These aspects help in the Manufacturing phase of the LCA and the End-of-Life stage
(Emblem & Emblem, 2012).
To bring this all to a greater context, the contrast in scientific data versus
consumers' environmental perception is quite interesting. From the survey results, it is
clear that consumers believe that Coca Cola's plastic bottle packaging has the greatest
impact on the environment. With consumers rating plastic bottles’ environmental impact
as 7.76 (Figure 12 ). In comparison to aluminum cans’ average environmental impact
rating of 6.06 and glass bottles’ average rating of 5.03 (Figure 12 ). Some potential
reasonings that might lead to consumers considering that plastic is more
environmentally impactful than glass and aluminum beverage packaging is the shift
towards more sustainable packaging. Plastic is often presently viewed as harmful
material. The Coca Cola Company is making strides in becoming more environmentally
conscious, intending to make 100% of their packaging recyclable globally by 2025 and
to use at least 50% recycled materials in their packaging by 2030 (The Coca Cola
Company, 2019c).
This trend can also be seen in the secondary packages used. With respondents
rating the plastic shrink wrap protecting the plastic bottles, an average environmental
impact rating of 8.29 out of 10 (Figure 12 ). Whereas the paperboard carrier for the glass
packaging had an average rating of 4.31 and the paperboard packaging for the
aluminum cans had an average rating of 4.51 (Figure 12 ). There is a consensus that
overall, plastic has a greater environmental impact than any other material such as
paperboard. Thus, consumer perception of plastic does not only pertain to primary
packaging but any other forms of secondary packaging as well.
36
Also, 61.3% of respondents have revealed that they most likely find themselves
purchasing aluminum cans, 22.5% have stated that they find themselves buying glass,
and 16.3% responded by saying they often purchase plastic (Figure 19 ). These results
reveal that consumers' beliefs do, in fact, impact purchasing decisions. As most
respondents believed that plastic bottles have the highest environmental impact, many
respondents do not decide to purchase plastic packaged beverages. However, a
concerning aspect regards the wash habits of these consumers. 61.3% of respondents
choose to buy aluminum can packaging (Figure 19) ; however, only 30% of overall
consumers wash out their beverage cans (Figure 18 ). This causes an issue in the
easiness of recycling these aluminum cans as consumers themselves are not doing
their part to contribute to being more environmentally conscious.
Also, there is an immense problem with single-use plastics. Single-use plastics
are primarily made from petrochemicals and are intended to be thrown away after one
use (Lindwall, 2020).
Straws, plastic bags, takeout containers, wrappers, and plastic bottles are
examples of convenient plastic items that add to the environmental price that the planet
is currently facing. Single-use plastics devastate oceans, wildlife and impact human
health. 300 million tons of plastic are produced each year worldwide, and 50% of that is
used for single-use items (Lindwall, 2020).
With this perspective in mind, it is inferred that many respondents had this idea in
mind when answering questions about Coca Cola's plastic bottle packaging. Thus,
believing that Coca Cola's plastic bottle has the greatest environmental impact
compared to Coca Cola's glass and aluminum beverage packaging.
Recycling plastic more frequently would reduce its carbon footprint. PET is
commonly recycled and can be turned into other products such as polyester fabrics and
automotive parts. This can explain why Coca Cola's plastic bottle made of PET overall
impacts the environment the least. However, in practice, 91% of all plastic is not
recycled and ends up in landfills or in the environment (Lindwall, 2020). There is a
significant need for an increased effort in recycling and properly recycling plastic
packages.
37
Although there have been several developments in recycled PET such as Coca
Cola's plastic bottles, historical practices, and treatment of plastic products have
perpetuated the negative narrative of plastic PET bottles. This research highlights that
consumers will continue to associate plastic products with being harmful to the
environment because of single-use plastics. Single-use plastics have to be omitted to
shift consumers' minds, and the implementation and narrative of recycled plastic must
be pushed.
The Coca Cola company has currently implemented 100% recycled PET bottles
in 16 markets (The Coca Cola Company, 2019c). However, the North American market
has not yet reached that place. Using 100% recycled PET bottles would eliminate the
use of 3500 tons of virgin plastics resulting in a reduction of Co2 emission by 25% (The
Coca Cola Company, 2019c). Coca Cola has also developed a "PlantBottle" that
incorporates 30% plant-based material into its PET bottles (The Coca Cola Company,
2019c).
Shifting the North American market towards this trend would require
infrastructure to meet those recycling and manufacturing demands. However, there is
an ethical responsibility for companies to move towards sustainability and innovate to
create more sustainable packaging. Packaging will not be going away any time soon;
but there is an ethical and social responsibility for these companies to make sure that
their products impact the environment as little as possible. Not only does this pertain to
the packaging they use, but also recycling and collection of the packaging materials.
Overall, pushing the world towards a circular economy where the components of
a package can be recycled and used again in the manufacturing process or can be
manufactured into other products would be an ideal situation. Although this LCA has
shown that plastic packaging overall has the least impact on the environment, this
should not be the stopping point. Instead, it should be a motivating factor to influence
change towards better implementation of material creation, manufacturing, recycling as
well as consumer practices.
38
Conclusion To conclude, environmental consciousness and sustainability has been an
increasing factor in today’s society. With packaging being a prominent area of concern,
consumers have instilled an ethical and social responsibility for companies such as The
Coca Cola Company to innovate and create packaging that provides the least amount
of harm to the environment.
Through an LCA methodology, three primary and three secondary packages
were evaluated. These were Coca Cola’s plastic bottle with plastic shrink wrap, their
glass bottle with a paperboard carrier and their aluminum cans and a paperboard
rectangular box. The results of the LCA suggested that Coca Cola’s packaging system
for their plastic bottles overall showed the least environmental impact followed by their
aluminum cans and lastly their glass bottle packaging systems. These packages were
evaluated on four categories, fossil fuel usage, greenhouse gas emissions, water usage
and human impact. A survey was conducted to evaluate consumers’ environmental
impact perception on Coca Cola’s packaging. Respondents rated each primary and
secondary packaging based on a scale of 1 to 10, 1 being the package has the least
environmental impact, and 10 being the package has the greatest environmental
impact. The results of this survey expressed the opposite of the LCA results.
Respondents believed that overall, Coca Cola’s plastic bottle packaging and its plastic
shrink wrap has the greatest environmental impact. The recycling habits, wash out
practices, and consumer buy preferences were also surveyed.
Further analysis of the results suggests that plastic packaging has a negative
connotation due to historical malpractices and the existence of single-use plastic. For
there to be a shift in consumer perception, companies can implement more recycled
plastic into their packaging, spread awareness around this topic and enhance their
packaging designs to reflect these changes. However, there is also a need for more
efficient recycling systems, a reduction in the use and manufacturing of single-use
plastics, a movement towards creating circular economies and helping consumers
understand how to recycle packaging properly.
39
References
American Forest & Paper Association (n.d.) Paper-Based Packaging. Retrieved
November 01, 2020, from
https://www.afandpa.org/our-products/paper-based-packaging/paperboard
Dam, Y. (1996). Environmental assessment of packaging: The consumer point of view.
Environmental Management, 20(5), 607–614.
https://doi.org/10.1007/BF01204134
Del Rosso, E. (2020). Environment is King: Sustainability in the Food &
Beverage Industry. Retrieved November 01, 2020, from
https://medium.com/dashmote-snapshot/environment-is-king-sustainability-in-the
-food-beverage-industry-c0215194178c
Emblem A. & Emblem H. (2012). Packaging Technology - Fundamentals,
Materials and Processes. Elsevier. Retrieved from
https://app.knovel.com/hotlink/toc/id:kpPTFMP001/packaging-technology/packagi
ng-technology
Lindwall, C. (2020, July 30). Single-Use Plastics 101. Retrieved November 01, 2020,
from https://www.nrdc.org/stories/single-use-plastics-101
McCombes S. (2019). How to write a literature review. Retrieved from November 01,
2020, from https://www.scribbr.com/dissertation/literature-review/
Niero M., Hauschild M.Z., Hoffmeyer, S.B., & Olsen, S.I (2017). Combining
Eco-Efficiency and Eco-Effectiveness for Continuous Loop Beverage Packaging
Systems: Lessons from the Carlsberg Circular Community. 21 (3), 742-753.
doi-org.ezproxy.lib.ryerson.ca/10.1111/jiec.12554
40
North American Packaging Association. (2019). 4 Types of Paperboard. Retrieved
November 01, 2020, from https://paperbox.org/4-types-of-paperboard/
Patel, A. (2018). The biggest recycling mistakes Canadians continue to make.
Retrieved November 01, 2020, from
https://globalnews.ca/news/4153053/biggest-recycling-mistakes/
Saleh, Y. (2016). Comparative life cycle assessment of beverages packages in
Palestine. Journal of Cleaner Production. 131, 28-42.
doi:10.1016/j.jclepro.2016.05.080
Simon B, Amor M.B. & Földényi, R. (2016). Life cycle impact assessment of beverage
packaging systems: focus on the collection of post-consumer bottles. 112,
238-248.
https://doi.org/10.1016/j.jclepro.2015.06.008
The Coca Cola Company. (2019a). 2019 Q4 Earning Releases. Retrieved
November 01, 2020, from
https://d1io3yog0oux5.cloudfront.net/_70cd244d9ae19eeadf93f8c839f2a22c/coc
acolacompany/news/2020-01-30_Coca_Cola_Reports_Strong_Growth_in_Fourt
h_Quarter__981.pdf
The Coca Cola Company. (2020b). What are Coca‑Cola bottles and cans made of?
Retrieved November 01, 2020, from
https://www.coca-cola.co.uk/our-business/faqs/what-are-coca-cola-bottles-and-c
ans-made-of
41
The Coca Cola Company. (2019c). 2019 Business and Sustainability Report. Retrieved
November 01, 2020, from
https://www.coca-colacompany.com/content/dam/journey/us/en/reports/coca-cola
-business-and-sustainability-report-2019.pdf
Whelan, T., & Kronthal-Sacco, R. (2019). Research: Actually, Consumers Do Buy
Sustainable Products. Retrieved November 22, 2020, from
https://hbr.org/2019/06/research-actually-consumers-do-buy-sustainable-product
s
42
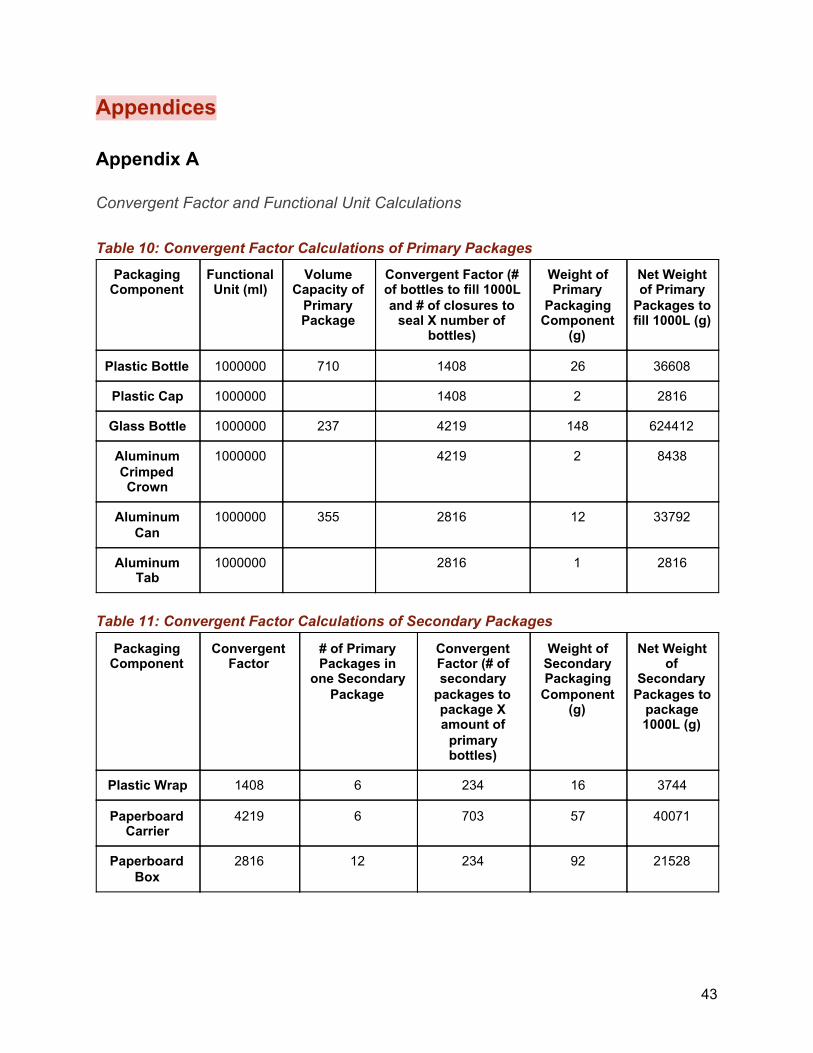
Appendices
Appendix A
Convergent Factor and Functional Unit Calculations Table 10: Convergent Factor Calculations of Primary Packages
Table 11: Convergent Factor Calculations of Secondary Packages
43
Packaging Component
Functional Unit (ml)
Volume Capacity of
Primary Package
Convergent Factor (# of bottles to fill 1000L and # of closures to
seal X number of bottles)
Weight of Primary
Packaging Component
(g)
Net Weight of Primary
Packages to fill 1000L (g)
Plastic Bottle 1000000 710 1408 26 36608
Plastic Cap 1000000 1408 2 2816
Glass Bottle 1000000 237 4219 148 624412
Aluminum Crimped Crown
1000000 4219 2 8438
Aluminum Can
1000000 355 2816 12 33792
Aluminum Tab
1000000 2816 1 2816
Packaging Component
Convergent Factor
# of Primary Packages in
one Secondary Package
Convergent Factor (# of secondary
packages to package X amount of
primary bottles)
Weight of Secondary Packaging
Component (g)
Net Weight of
Secondary Packages to
package 1000L (g)
Plastic Wrap 1408 6 234 16 3744
Paperboard Carrier
4219 6 703 57 40071
Paperboard Box
2816 12 234 92 21528
Appendix B
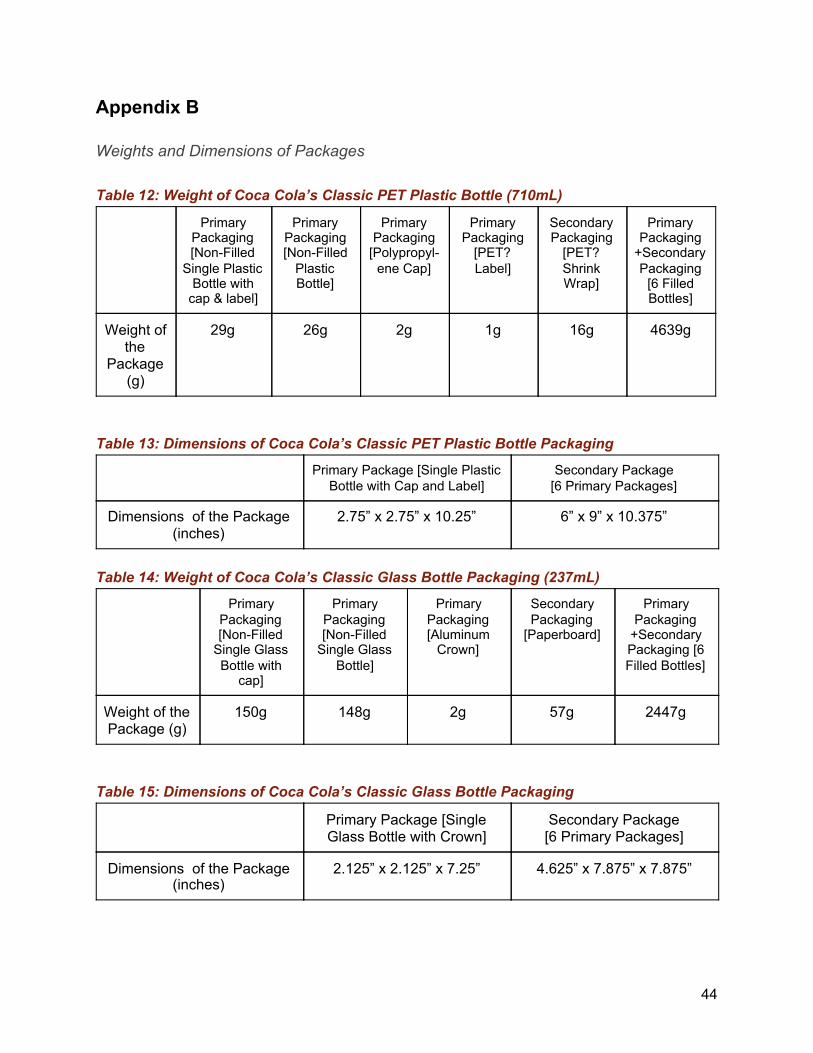
Weights and Dimensions of Packages Table 12: Weight of Coca Cola’s Classic PET Plastic Bottle (710mL)
Table 13: Dimensions of Coca Cola’s Classic PET Plastic Bottle Packaging
Table 14: Weight of Coca Cola’s Classic Glass Bottle Packaging (237mL)
Table 15: Dimensions of Coca Cola’s Classic Glass Bottle Packaging
44
Primary Packaging [Non-Filled
Single Plastic Bottle with
cap & label]
Primary Packaging [Non-Filled
Plastic Bottle]
Primary Packaging
[Polypropyl-ene Cap]
Primary Packaging
[PET? Label]
Secondary Packaging
[PET? Shrink Wrap]
Primary Packaging
+Secondary Packaging
[6 Filled Bottles]
Weight of the
Package (g)
29g 26g 2g 1g 16g 4639g
Primary Package [Single Plastic Bottle with Cap and Label]
Secondary Package [6 Primary Packages]
Dimensions of the Package (inches)
2.75” x 2.75” x 10.25” 6” x 9” x 10.375”
Primary Packaging [Non-Filled
Single Glass Bottle with
cap]
Primary Packaging [Non-Filled
Single Glass Bottle]
Primary Packaging [Aluminum
Crown]
Secondary Packaging
[Paperboard]
Primary Packaging
+Secondary Packaging [6 Filled Bottles]
Weight of the Package (g)
150g 148g 2g 57g 2447g
Primary Package [Single Glass Bottle with Crown]
Secondary Package [6 Primary Packages]
Dimensions of the Package (inches)
2.125” x 2.125” x 7.25” 4.625” x 7.875” x 7.875”
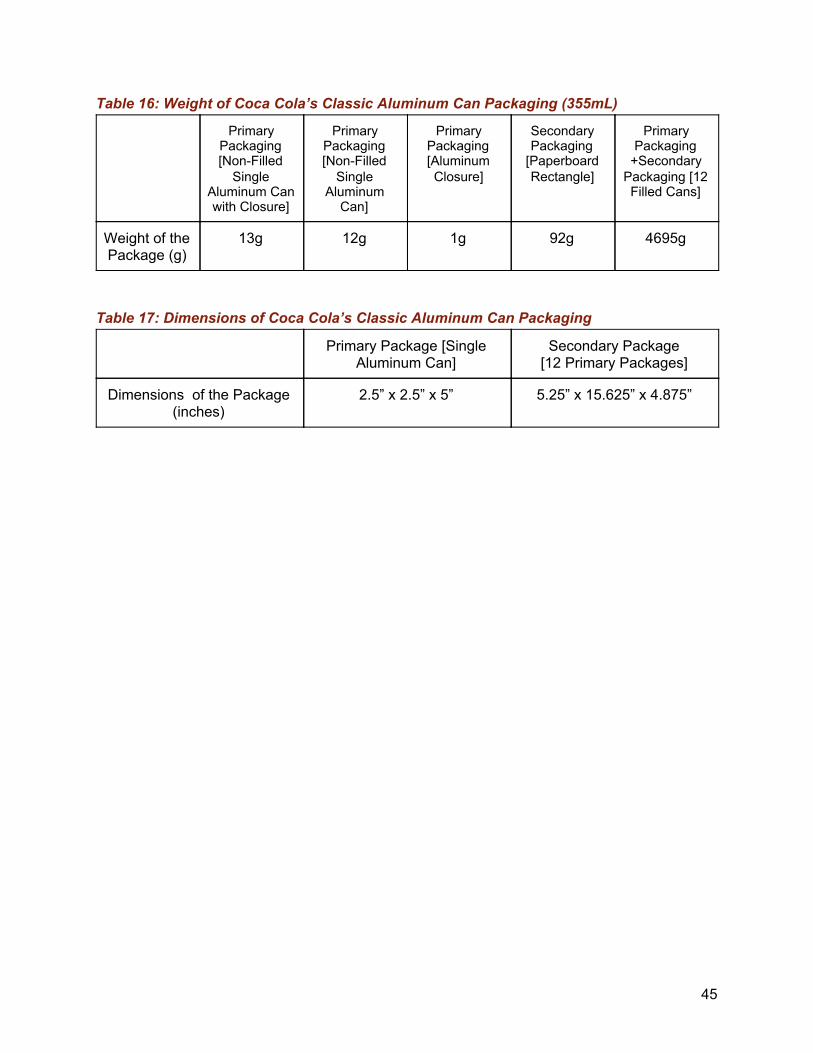
Table 16: Weight of Coca Cola’s Classic Aluminum Can Packaging (355mL)
Table 17: Dimensions of Coca Cola’s Classic Aluminum Can Packaging
45
Primary Packaging [Non-Filled
Single Aluminum Can with Closure]
Primary Packaging [Non-Filled
Single Aluminum
Can]
Primary Packaging [Aluminum Closure]
Secondary Packaging
[Paperboard Rectangle]
Primary Packaging
+Secondary Packaging [12 Filled Cans]
Weight of the Package (g)
13g 12g 1g 92g 4695g
Primary Package [Single Aluminum Can]
Secondary Package [12 Primary Packages]
Dimensions of the Package (inches)
2.5” x 2.5” x 5” 5.25” x 15.625” x 4.875”
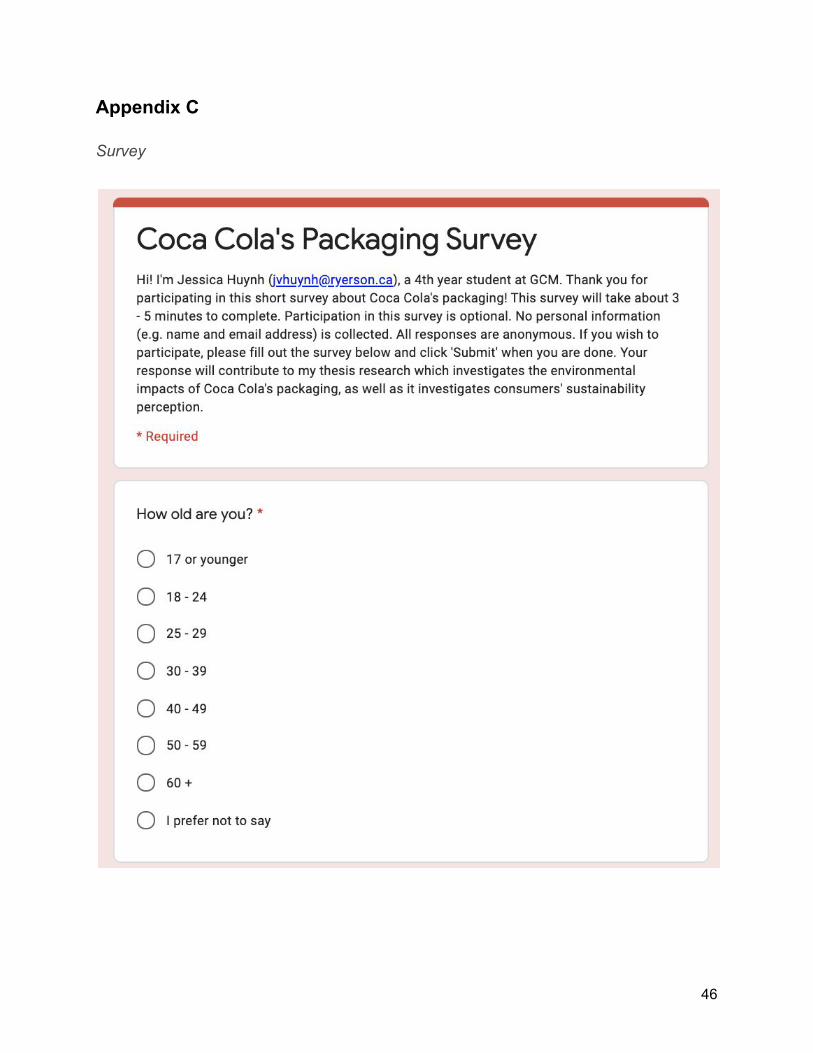
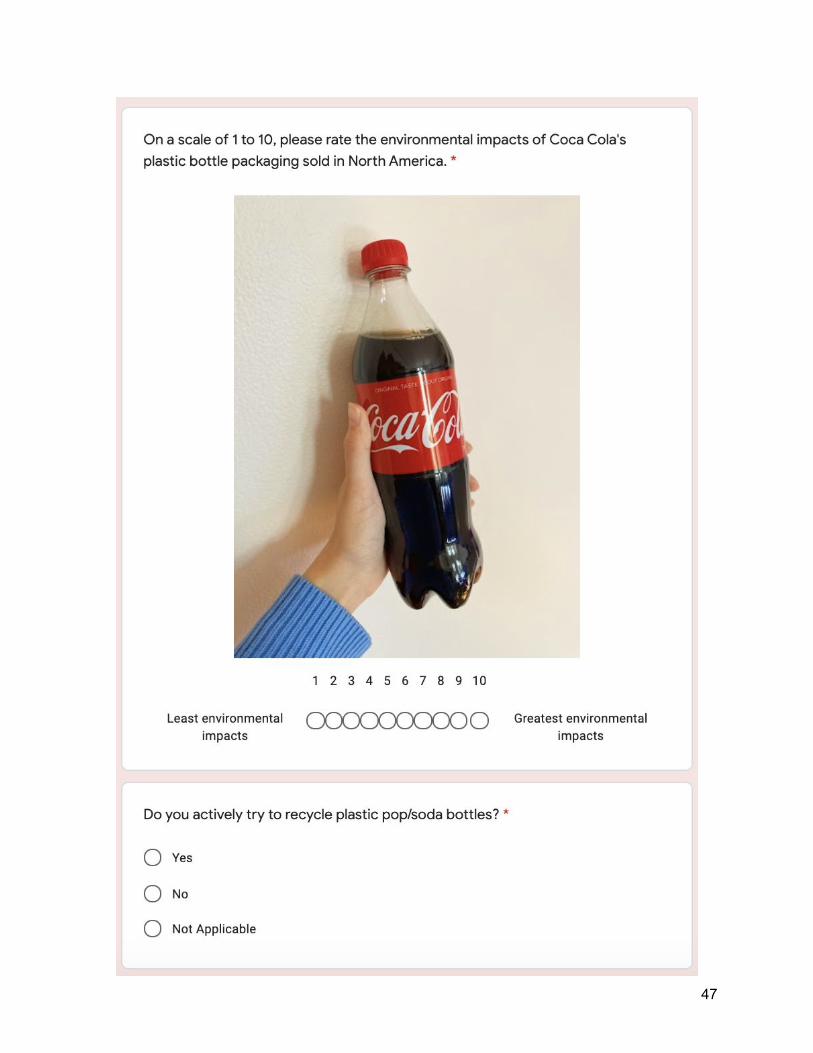
Appendix C
Survey
46
47
48
49
50
51
52
53