Embed Size (px)
Citation preview
Technological Forecasting & Social Change 114 (2017) 165–178
Contents lists available at ScienceDirect
Technological Forecasting & Social Change
An exploratory policy analysis of electric vehicle sales competitionand sensitivity to infrastructure in Europe
Gillian Harrison a,⁎, Christian Thiel b
a European Commission, Joint Research Centre, Directorate for Energy, Transport & Climate, Netherlandsb European Commission, Joint Research Centre, Directorate for Energy, Transport & Climate, Italy
Abbreviations: BEV, Battery Electric Vehicle; PHEV, PlugPlug-in Electric Vehicle–BEVandPHEV; FCV, Fuel Cell VehicFCV; HEV, Hybrid Electric Vehicle; ICEV, Internal Combust(slow) Charging Point; rCP, rapid Charging Point; PTTTransition Market Agent Model; DAFI, Directive on the DInfrastructure.⁎ Corresponding author at: P.O. Box 2, NL-1755 ZG Pett
E-mail address: [email protected] (G. Har
http://dx.doi.org/10.1016/j.techfore.2016.08.0070040-1625/© 2016 The Authors. Published by Elsevier Inc
a b s t r a c t
a r t i c l e i n f oArticle history:Received 15 March 2016Received in revised form 3 August 2016Accepted 8 August 2016Available online 26 August 2016
This research contributes to discussions about policy interventions to stimulate the transition of vehicle technol-ogy. Concentrating on passenger cars, an extensive system dynamics based market agent model of powertraintechnology transitions within the EU up to 2050 is employed. With a focus on subsidy scenarios for both infra-structure deployment and vehicle purchase, and set within the context of the EU fleet emission regulations,we find that there are important interactions between different powertrain types and with infrastructure provi-sion. For example, strong plug-in electric vehicle (PiEV) policy could inhibit thematurity of hydrogen fuel cell ve-hicles. Infrastructure provision is important for improving the utility of a PiEV, but we find that in the earlymarket it may have a weaker correlation with uptake than other policy options, until the PiEV stock share isover around 5%. Furthermore, an attempt to install a ratio of much more than one charge point per 10 PiEVmay lead to little gains and high costs. PiEV sales are relatively insensitive at target levels over 25 PiEV per chargepoint. The results of our study can help policymakers to find the right balance and timing of measures targetingthe transition towards low carbon alternative vehicles.
© 2016 The Authors. Published by Elsevier Inc. This is an open access article under the CC BY-NC-ND license(http://creativecommons.org/licenses/by-nc-nd/4.0/).
Keywords:E-mobilityAutomotive technology transitionSystem dynamics modellingCharging infrastructureEU policy
1. Introduction
Electro-mobility is seen by many to be at the core of future mobilitypatterns. Electric Vehicles (EV – comprising Plug-in Hybrid ElectricVehicle (PHEV), Battery Electric Vehicles (BEV) and Fuel Cell Vehicles(FCV)), based on an electric motor powertrain, offer a potentiallysubstantial contribution to overcoming environmental problemscreated by the widespread dependence on conventional automobiles.Conventional Internal Combustion Engine vehicles (ICEV), mainlyfuelled with petrol or diesel, have dominated mobility for the pastcentury. As the transport sector currently makes the third greatestcontribution to global carbon emissions (IEA, 2016) and accounts forhalf of daily oil consumption (IEA, 2015), a paradigm shift in mobilityis required. Within the context of climate change, this transition needsto occur within the next 30 years to avoid serious irreversible shifts inour climate (IPCC, 2013). In Europe, where transport is the second larg-est source of greenhouse gas (GHG) emissions, accounting for around a
-in Hybrid Electric Vehicle; PiEV,le; EV, Electric Vehicle–PiEVandion Engine Vehicle; pCP, publicMAM, Powertrain Technologyeployment of Alternative Fuel
en, Netherlands.rison).
. This is an open access article under
quarter (EC, 2016), the European Union (EU) is committed to reduceGHG emissions economy wide by 40% (versus 1990 levels) by 2030with road transport playing an important role towards achieving thesetargets (EC, 2014). Furthermore, the 2011 ECWhite Paper on Transportset a target of reducing road transport emissions by 60% of 1990 levelsby 2050, and within this to “halve the use of ‘conventionally fuelled’cars in urban transport by 2030 and phase them out in cities by 2050”(EU, 2011a). Here, “conventionally fuelled” is defined as those vehiclespowered by Internal Combustion Engine (ICE) only. Consequently, EVsas a zero tail-pipe emitting transportation option have arisen as a criticalenabler for a low carbon economy (EU, 2014a) as well as for improvedair quality.
Various studies have considered future EV market penetration, withboth short and long term estimates varying greatly (Pasaoglu et al.,2012), and the IEA suggesting only a 9% global light duty vehicle stockshare by 2030 and 40% by 2050 under their 2DS scenario (IEA, 2016).This seems far off EU targets, and as such regulation aimed at manufac-turers to reduce fleet emissions has been introduced (EU, 2014b; EU,2014c). Currently, only Plug-in Electric Vehicles (PiEVs – PHEV andBEV), arewidely available. However, as yet, and despite rapidly growingsales (ACEA, 2016) they have failed to capture a significant passengercar market share and continue to be dependent on support measures,such as financial incentives (Mock & Yang, 2014; Thiel et al., 2015).One significant reason for this is limited consumer acceptance, due tohigh upfront costs and the phenomenon of range anxiety (Thiel et al.,
the CC BY-NC-ND license (http://creativecommons.org/licenses/by-nc-nd/4.0/).
166 G. Harrison, C. Thiel / Technological Forecasting & Social Change 114 (2017) 165–178
2012). In recognition of the cost barrier, many countries are introducingfiscal incentives (ACEA, 2014). In addition, both costs and range anxietyare related to the current capabilities of battery technology. Batterycosts are reducing rapidly (Nykvist & Nilsson, 2015), but to alleviatethe latter concern policy makers in countries across Europe are encour-aging the development of an appropriate charging infrastructure. Thereare various factorswhichmay impact on the efficacy of infrastructure onuptake, including increasingly cheaper andmore rapid chargers, batterycapacity and private charging capabilities. This is often termed a“chicken and egg” problem, as infrastructure providers are reluctant toinvest without a substantial EV market, yet drivers are wary of enteringinto e-mobility without the confidence of a reliant, widespread, and in-teroperable charging infrastructure.
Previous research related to EV policy has focused on themostwide-spread policies currently applied, which are fiscal incentives for users(ICCT, 2011a; Brand et al., 2013; Diamond, 2009; Gass et al., 2014;Hidrue et al., 2011; ICCT, 2011b; Lane & Potter, 2007; Tran et al.,2013) and regulation of manufacturer emissions or vehicle efficiency(IEA, 2008; ITF, 2010; Walther et al., 2010; Thiel et al., 2014). Thisresearch has generally agreed that due to the high cost differentialbetween EVs and their conventional counterparts, fiscal incentives arerequired to encourage early adopters to the technology leading tosuccessful pre-mass market penetration. From a supply-side point ofview, manufacturers must be also encouraged to invest further in R&Dof low carbon technologies in order to bring increasingly affordableand efficient EV into the commercial market. For example, besidesfleet emission regulatory targets (EU, 2014b; EU, 2014c; EU, 2009a;EU, 2011b) and member state co-funded R&D projects, the ‘EuropeanGreen Vehicles Initiative’,1 has been an important public-private-partnership at EU level since 2008, funding numerous activities underthe EU framework programmes for research and innovation (e.g.Framework Programme 7, Horizon 2020). Altogether there are N300ongoing R, D & D projects with a total budget of nearly 3 billion eurosacross the EU co-funded by both the EU and member states. On theone hand these projects support technological improvements, most no-tably for energy storage and control devices, on the other hand, throughfield tests, they address customer acceptance and vehicle to grid inte-gration (Zubaryeva & Thiel, 2013).
In general, it is not controversial to suggest that policies to introducesufficient public charging infrastructure are necessary to encourage theintroduction of EVs (Bakker & Jacob Trip, 2013; OLEV, 2011). This is toovercome issues of range anxiety, identified to be one of themost signif-icant barriers to EV adoptions in many choice modelling studies (Batleyet al., 2004; Beggs et al., 1981; Brownstone et al., 1996; Dagsvik et al.,2002; Eggers & Eggers, 2011; Ewing & Sarigollu, 2000; Potoglou &Kanaroglou, 2007). However, there has been little literature empiricallyexploring the relationship between minimum charge point provisionand EV uptake, instead tending to focus (for example) on socio-economic or spatial distribution (Namdeo et al., 2014; Zubaryevaet al., 2012; Maia et al., 2015) and charging profiles (Robinson et al.,2013; Donati et al., 2015). Although these may be determinants of EVuptake, current EU policy is focused on guaranteeing a minimum ratioof charge points to EVs in order to avoid market fragmentation andensure coverage across national borders (EU, 2014a). Recharginginfrastructure has been analysed through evidence-based studies,expert elicitation and multi-criteria assessment for determining thepolicy promoters of EVs. For instance, Zubaryeva et al. (2012) identifiedthat an adequate recharging infrastructure was one of the most impor-tant parameters for the large scale deployment of PiEVs in Europe, and(Sierzchula et al., 2014) have found that countries could achieve highadoption rates by increasing their recharging infrastructure levels.Other studies suggest that collaborative schemes between private andpublic authorities combining incentives and infrastructure are required
1 http://www.egvi.eu
for success (Mock & Yang, 2014; Thiel et al., 2012; Rowney & Straw,2013; Norbech, 2013; Lane & RAC, 2011). Hence, recharging infrastruc-ture can be considered one of the critical parameters inmarket penetra-tion of EVs.
This paper takes the EC Clean Power for Transport package (EC,2013a) as a starting point and seeks to explore what impact govern-ment policy on infrastructure can have on EV uptake. In particular, wefocus on the recently adopted Directive on the Deployment of Alterna-tive Fuels Infrastructure (DAFI) 2014/94/EU (EU, 2014a), and the pro-posals therein regarding minimum coverage of PiEV charginginfrastructure by the end of 2020. We take the approach to identifywhat impact policy options may have on long term EV penetration.We analyse numerous policy scenarios, recognising that single e-mobility policies should not be considered in isolation as the interactionbetween multiple policies is highly relevant. For example, a suite of in-centives and other demand stimulating policies were employed byNorway, the most successful European country in terms of EV uptake(Mock & Yang, 2014; Norbech, 2013). Our approach seeks to under-stand how specifically supporting the infrastructural system may char-acterise uptake within the wider policy environment. For the widerpolicy environment we consider supply (e.g. fleet emission regulation)and demand stimulating policies (e.g. purchase incentives). To do this,our research employs an extensive system dynamics model of the EUautomobile market, which reflects the relevant market agents of users,manufacturers, infrastructure providers and authorities. This researchis the application of the model, which is described in detail in a Techni-cal Report (Harrison et al., 2016), andwas presented in a previous paperby the authors (Pasaoglu et al., 2016). (Pasaoglu et al., 2016) was de-signed as an introduction to the model that could then be built uponin future publications such as this, as it focused on only five generic sce-narios reflecting three market variables (learning rate, oil price andGDP) and twopolicy options (vehicle purchase subsidies andfleet emis-sion targets). The purpose of this study is to focus on the provision of in-frastructure, includingwithin the context of the previous policy options,in a timely investigation regarding the implementation of (EU, 2014a).
2. Model overview
The Powertrain Technology Transition Market Agent Model(PTTMAM) was developed at the EC Joint Research Centre (JRC) in col-laboration with Ventana Systems UK using Vensim™,2 a leading andhighly flexible software for system dynamics model building and simu-lation. The purpose and focus of themodel is to study the interaction be-tween, and influence of, the market agents on possible technologytransitions within Europe, for each of the 28 member states and acrossthe period 1995 to 2050. The use of systemdynamics to analyse possiblefuture scenarios of technology transition in the automotive sector hasbeen explored by many authors (Walther et al., 2010; Bosshardt et al.,2007; Gomez et al., 2013; Harrison & Shepherd, 2014; Janssen et al.,2006; Kohler et al., 2010; Meyer & Winebrake, 2009; Richardson et al.,1999; Rodrigues et al., 2012; Shepherd et al., 2012; Struben &Sterman, 2008; Shepherd, 2014; Leiby & Rubin, 1997; Stepp et al.,2009; Boksberger et al., 2012; Stasinopoulos et al., 2012; Diwakeret al., 2013). Recent overviews of such studies can be found inHarrison and Shepherd (2014) and Shepherd (2014). Many of thesehave a limited focus, for example on one particular powertrain or coun-try. At the other extreme, Gomez et al. (2013) focus on a simplifiedhigh-level global view. Their purpose ranges between forecastingdeployment, detailed policy analysis, manufacturer strategies andenvironmental or economic assessments. To our knowledge, themodel presented here is the first attempt to address not only the mostrelevant interacting agents within the light duty vehicle market (i.e.automotive manufacturers and suppliers, infrastructure providers,
2 http://vensim.com
167G. Harrison, C. Thiel / Technological Forecasting & Social Change 114 (2017) 165–178
policymakers, and consumers) in a European context, but also the com-petition between all current and future alternative fuel and powertraintechnologies, across all member states. A similarly broad model wasdeveloped by Walther et al. (2010) and adapted by Harrison andShepherd (2014), but this focused on the Californian case and was notas detailed or complex as the model we have developed. Some otherstudiesmay have beenmore detailed in their approach towards specificareas, e.g. Kohler et al.'s (2010) consideration of the hydrogen fuellingnetwork, Diwaker et al.'s (2013) focus on the R&D program orStasinopoulos et al. (2012) who looked at materials used, but this wasa level of detail not required in our model. Our approach allows us tocapture the complex and sometimes conflicting interests that actuallyexist in the automotive sector. It also enables us to study the impact ofinteracting policies on technology transitions in this sector. Neverthe-less, the reader should bemindful that amodel is a simplified represen-tation of reality and should therefore be viewed as a means ofcomparing “what if” scenarios, rather than providing predictive orprecise results.
The model is detailed and complex, containing over 700 simulta-neous equations and 300 constant values, within 13 causal feedbackloops. When the base elements are combined with the subscriptsemployed within the model (such as powertrain type, member stateor vehicle size), this leads to over 700,000 elements overall. Withinthe model, four conceptual market agent groups (manufacturers,users, authorities and infrastructure providers) are represented by keydecision rules and feedbacks. In its current form themodel does not cap-ture the behaviour of individuals within the system as agent basedmodelling could, such as proposed or applied by numerous authors(Wolf et al., 2015; El Banhawy et al., 2014; Shafiei et al., 2012a; vander Vooren & Brouillat, 2013; Eppstein et al., 2011; Noori & Tatari,2016). However, a certain disaggregation of the representative agentgroups is partially implemented (for example the distinction of urbanand non-urban drivers) and could be furthered, if substantiated bybehavioural data. The model inputs have been sourced fromnumerous publications and expert opinions, but importantly includingEurostat3 and TRACCS4, and for future transport/energy demands theEU 2050 Energy Trends Reference Scenario (EC, 2013b). Some key pa-rameters (such as vehicle demand) have been calibrated to historicaldata, and sensitivity tests and reality checks were carried out to ensuremodel robustness. Calibration (or optimisation) of values is a standardapproach across many fields applied to the determination of inputdata not readily available (Valipour, 2015; Valipour et al., 2015; Liet al., 2014; Lim et al., 2014). A more comprehensive overview and in-troduction to this model is presented in Pasaoglu et al. (2016) andHarrison et al. (2016). Although we urge the reader to refer to thesesources, some key elements and updates relevant to this research arepresented below.
2.1. User purchase decisions
Fundamental to the model is the ability to capture behavioural dy-namics of the users within the system. At the centre of this mechanismwithin themodel is amodified version of the highly citedWillingness toConsider (WtC) concept as developed by Struben and Sterman (2008)and adopted in numerous models since (Walther et al., 2010;Shepherd et al., 2012; Kwon, 2012; Shafiei et al., 2012b).WtC “capturesthe cognitive, emotional and social processes through which driversgain enough information about, understanding of and emotional attach-ment to a platform (powertrain) for it to enter their consideration set”.
3 http://ec.europa.eu/eurostat/web/main/home4 http://traccs.emisia.com
WtC builds up over time through social exposure to the alternativepowertrain (from marketing and interaction with both users and non-users), but can also decay as that social exposure is ‘forgotten’, until atipping point is reached when the powertrain remains within the deci-sion set.
The WtC is then combined with relative financial attractiveness(based on total cost of ownership), and perceived values and impor-tance of seven attributes that characterise each powertrain (Eq. (1)).Together these determine the overall attractiveness as a combinedutility for that powertrain, specific to a member state, powertrain, usergroup and vehicle size class. The powertrain attributes were chosen asto reflect available information on consumer choice on importance(Capgemini, 2008; Deloitte, 2011) but also simplified as developmentof future powertrains is uncertain. They are however in line withmore detailed choice modelling studies such as those cited in the Intro-duction. The attribute values evolve over time in relation to thematurityof the individual powertrain components that are themselves improvedby technology uptake and the R&D effort of the manufacturer. It wouldbe beyond the scope of this paper to go into the development of all thecriteria in detail, though it is relevant to note that convenience incorpo-rates the role of infrastructure provision in purchase behaviour (seelater). The financial attractiveness is an assessment of the total cost ofownership by the user, which includes the purchase price (as set bythe manufacturer and adjusted by authorities with subsidies andtaxes), and a proportion of the running costs.
Combined utilityPi ¼ ∑A Attribute valuePi � Attribute importanceð Þ�Willingness to considerPi� Financial attractivenessPi ð1Þ
Eq. (1): Combined utility of powertrain Pi.Attributes = choice, convenience, environment, performance,
reliability, safety, popularity.All values except attribute importance are calculated endogenously.A standard multinomial logit choice framework, Eq.(2), similar to
the approach employed by Struben and Sterman, is used for the assess-ment of the user's preferredpowertrains (and thus the indicatedmarketshare) using the calculated combined utility.
Indicated market share ¼ eCombined utilityPi−1∑P
eCombined utilityPx−1ð2Þ
Eq. (2): Indicated market share of powertrain Pi.Combined utility calculated using Eq. (1).
2.2. Infrastructure provision
The powertrain attribute convenience, which contributes to thecombined utility, represents the access to effective infrastructure forrefuelling or recharging a vehicle, as well as the provision of mainte-nance facilities (which isn't discussed in this paper). Within thePTTMAM, the conceptual infrastructure provider group decides on thetype and amount of fuelling and charging facilities to invest in, reactingto signals from the other market agents and based on a desired returnon investment (ROI).
2.2.1. Charging infrastructureThe convenience attribute for PiEV is represented by the average
population in each country with access to public (slow) or private(home/work) charging and the proportional achievement of a desiredrapid charging network. Although the presence of rapid-charging sta-tions improves the convenience for those with the requirement to re-charge on the move, it does not improve access for vehicle ownerswith no privatemeans of recharging. PHEV convenience is further influ-enced by a weighting of the relative availability of charging and
168 G. Harrison, C. Thiel / Technological Forecasting & Social Change 114 (2017) 165–178
refuelling infrastructure. The electricity charging infrastructure feed-backs within themodel focuses on the provision of public charge points(pCPs) and rapid charge points (rCPs) as private charging is consideredto be deployed in combination with the vehicle sales. The installation ofCPs relates to the expected revenue as shown in Eq. (3), though pCP andrCP are considered separately in the model. Both installation andrunning costs decrease as the number of installed CPs increases,representing a combination of learning effects and economies of scale.The required additional revenue (for desired ROI) is compared to an es-timate of additional revenue frompotential use, determined from an as-sessment of forecast visits (of forecast urban and non-urban PiEV userswith and without private access) and a presumed revenue per visit andfrequency of visits. Though early adopters of PiEV are likely to be thosewith private charging access, as penetration increases it is more likelythat some PiEV users would be making sole use of public charging net-work. Both pCP and rCP are stocks which grow over time.
Desired CP installation
¼ Forecast revenue−Current revenueRunning costsþ Installation cost� 1þ Desired ROIð Þ ð3Þ
Eq. (3): Desired installation of charging infrastructure in eachcountry.
All values are calculated endogenously, except ROI which is taken tobe 0.2.
Maximum and minimum costs are derived from (Gardien & Refa,2015; Plotz et al., 2014).
2.2.2. Hydrogen fuelling infrastructureSimilar to CPs, infrastructure providers will add hydrogen fuel to an
existing fuelling station if their forecast fuel revenue could deliver a de-sired ROI (here, a country specific calibrated value in the PTTMAM). Thenumber of desired fuelling stations to invest in is therefore determinedusing a similar calculation as Eq. (3). Forecast fuel demand is based on a3 year forecast stock of the relevant powertrain and annual fuelconsumption (based on a reference value (Edwards et al., 2014) andmodified by improvements to the powertrain as a result of R&D activitywithin themodel). Revenue is based on a fuel cost (Tremove, 2010) andcalibrated fuelmargin. Investment costs reduce over time depending onthe current installed base of hydrogen fuelling stations. In addition, fuel-ling stations may be dropped if they are no longer deemed sustainable.
2.3. Policy implementation
The PTTMAM was designed to enable to the modeller to create sce-narios related not only to market conditions but also policy strategies.There are numerous inputs related to subsidisation and taxation of vehi-cles, fuel and infrastructure that can be defined by themodeller at eithercountry or EU-wide levels. Moreover, the PTTMAM includes the mostsignificant EU regulation related to the control ofmanufacturers regard-ing new fleet emissions. Here, the model structures relevant to the pol-icy levers considered in this paper are briefly described.
Table 1Initial policy scenario levels (NB: infrastructure subsidies are all hypothetical).
Scenario level R regulatory CO2 target (g/km) P EV purch
0 - No Policy No penalties in place No subsidie1 - Current 2021: 95 2011–13: 52 - Projected 2021: 95; 2030: 70; 2050: 41 2011–13: 53 - Extended 2021: 95; 2030: 56; 2050: 27 2011–13: 54 - High n/a 2010–15: 7
2.3.1. Manufacturer emission regulationsWithin the model, the current EU light duty fleet emission regula-
tions (EU, 2014b; EU, 2014c; EU, 2011b; EU, 2009b) are captured. Aver-age tailpipe CO2 emissions of new vehicles are assessed against aspecific emission target per vehicle as defined in the regulations(Eq. (4)) and authorities chargemanufacturers penalties for those fleetswith averages above a specified threshold. This excess emission premi-um is designed to incentivise investment in low carbon vehicle technol-ogy, as Manufacturers base their R&D investment decisions on forecastfuture emission penalties from speculative demand.
Emissions target ¼ Base targetþ a� Average mass−Mo ð4Þ
Eq. (4): Emissions target (g/km) (as defined in the regulations).Base target = PC 130 g/km; 95 g/km from 2021. LCV 175 g/km;
147 g/kma = 0.457; 0.333 from 2020.Average mass = based on (Thiel et al., 2014)Mo = 1372 kg up to 2016, 3 year average thereafter.
2.3.2. Vehicle purchase subsidiesAt the EU level considered in this study, vehicle price subsidies are
entered by themodeller as a proportion of the cost differential betweenthe subsidised powertrain and the conventional ICEV powertrain. Theeffect here is an improvement in the financial attractiveness of thosepowertrains and thus a greater combined utility that leads to a highermarket share. In addition, having the subsidy in place can lead to in-creased marketing of the powertrain by manufacturers and a demandkick over and above the standard utility as users are aware of the offerbeing in place, and possibly short-lived.
2.3.3. Infrastructure subsidiesThe PTTMAM input for subsidies for infrastructure providers for the
installation of infrastructure is entered as a proportion of the costs foreach fuel and separate year of the simulation. This subsidy assists the in-frastructure provider as it reduces the installation costs making the in-vestment more attractive for achieving the desired ROI. In addition, forcharging infrastructure, for which the subsidy only covers pCPs (notrCPs) there is a default assumption of an authority desire of 10 PiEVper pCP, as per the DAFI indicative suggestion tomember states. For hy-drogen, there is no such limit.
3. Scenarios
The policy scenarios of this research have been modified and wid-ened, compared to earlier applications of the model (Pasaoglu et al.,2016). In this study a number of credible yet realistic levels for each pol-icy have been designed based on this, and an extra subsidy for infra-structure is included to reflect the focus of the study. A table ofsources for key variables for the baseline conditions, as used in thePTTMAM Technical Report (Harrison et al., 2016) is shown in theannex. In this research our interest lies in analysing the interaction ofvarious policy options: CO2 regulations on the manufacturer, EVpurchase subsidies for the user, and infrastructure subsidies for the
ase subsidy (% of ICEV cost differential) I 100% infrastructure subsidy
s in place No subsidies in place0%; 2014–15: 25% 2010–20200%; 2014–20: 25% 2010–20300%; 2014–25: 25% 2010–20505%; 2016–20: 50%; 2021–25: 25% n/a
169G. Harrison, C. Thiel / Technological Forecasting & Social Change 114 (2017) 165–178
infrastructure provider. For the CO2 regulation and infrastructure subsi-dy duration we consider four levels and for the EV purchase subsidieswe consider the same level and an additional “High” level, as detailedin Table 1. All regulation scenario levels, and the purchase subsidycurrent and high scenario levels are based on current and proposedtargets (Pasaoglu et al., 2016). The projected subsidy would seem inline with governmental intentions, for example, the UK governmenthave recently announced an extension of their plug-in car grant until
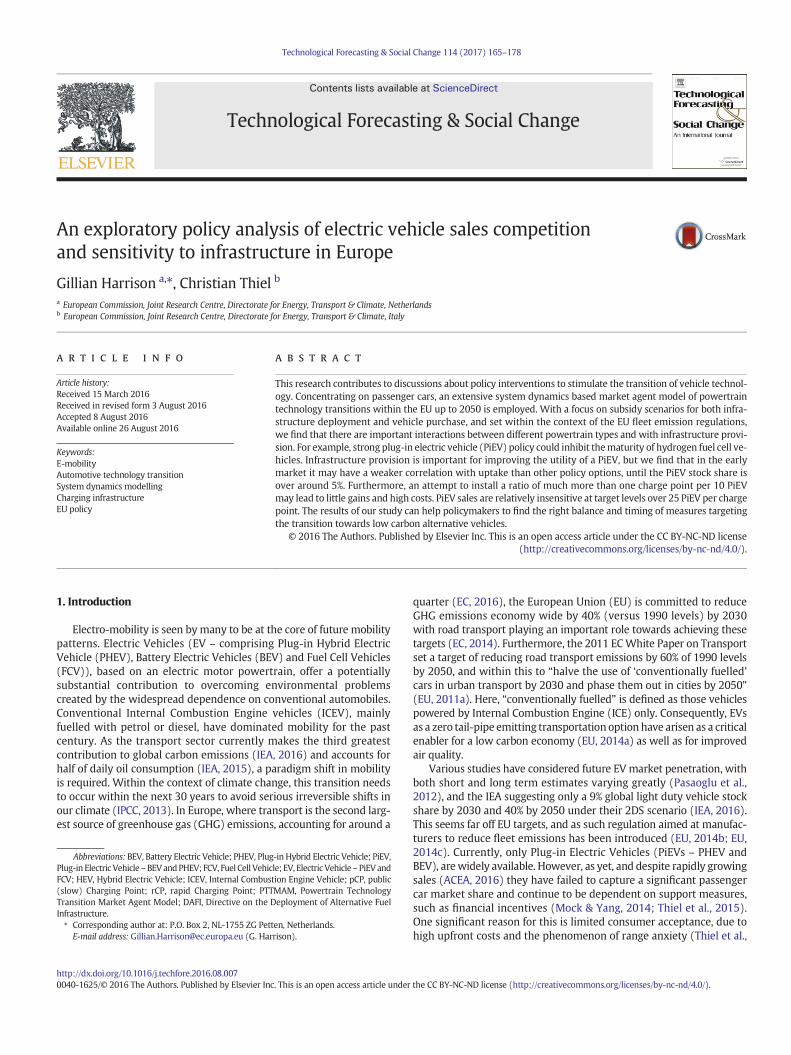
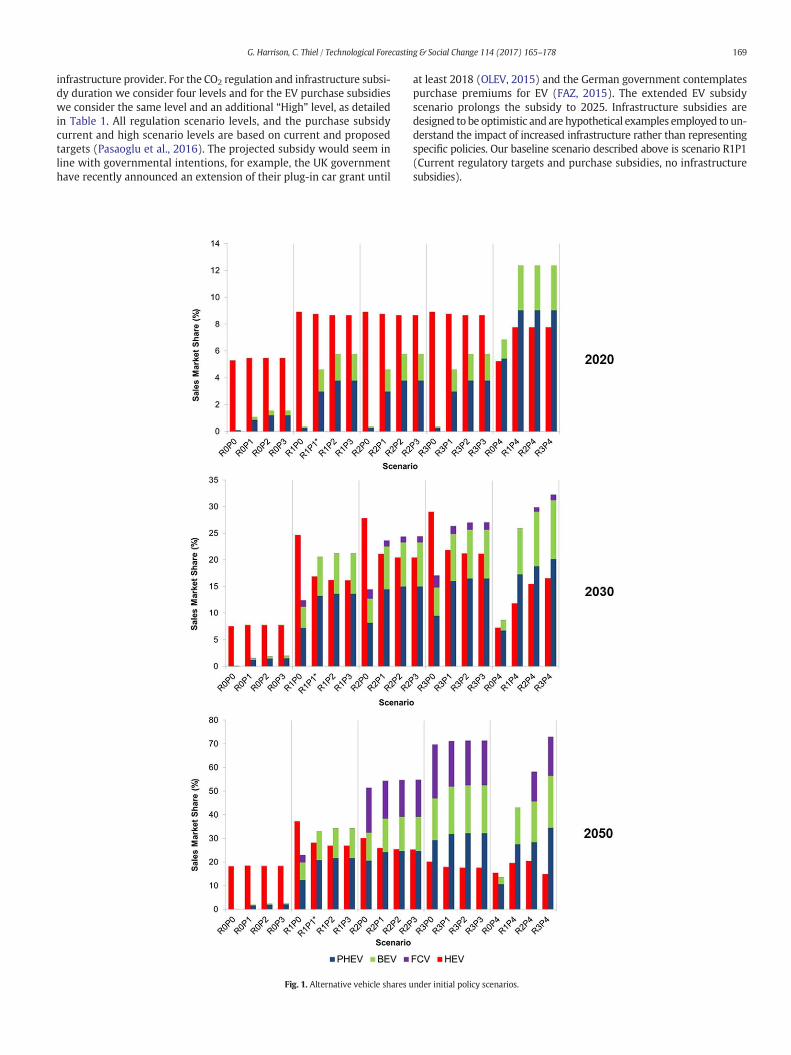
Fig. 1. Alternative vehicle shares u
at least 2018 (OLEV, 2015) and the German government contemplatespurchase premiums for EV (FAZ, 2015). The extended EV subsidyscenario prolongs the subsidy to 2025. Infrastructure subsidies aredesigned to be optimistic and are hypothetical examples employed to un-derstand the impact of increased infrastructure rather than representingspecific policies. Our baseline scenario described above is scenario R1P1(Current regulatory targets and purchase subsidies, no infrastructuresubsidies).
nder initial policy scenarios.

170 G. Harrison, C. Thiel / Technological Forecasting & Social Change 114 (2017) 165–178
4. Results of scenario runs
Fig. 1 presents the results from our model for the initial policyscenarios with no infrastructure subsidies in place. These results willbe discussed in more detail in the following sections. However it isworth noting at this point some high level observations. Unsurprisingly,stronger policies and combining policies generally leads to moresuccessful results. This aligns well with observations from previousstudies (Pasaoglu et al., 2016; Harrison & Shepherd, 2014; Stepp et al.,2009; Brand et al., 2012; Foxon et al., 2005; ITF, 2008). The “no-regula-tion” scenarios (R0) experience limited EV success by 2050, where theEV share is in fact lower than in 2020. The scenarios with a CO2 regula-tion in place (R1) witness stronger EV deployment with stricter targets.The tightest regulatory targets (R2–3) are most beneficial for all EV.Longer term emission targets (R3) have a greater impact on FCV successthan on PiEV deployment by 2050. Having purchase subsidies in placedoes make some impact, especially in 2020 and 2030 results, comparedto their no-subsidy counterparts, though the durations tested results inlittle variation. However, had there been higher purchase subsidies inplace from 2010 (P4), EV share would have beenmuchmore successfulby 2020, though this impact has diminished by 2050 in all but the noregulation scenario.
4.1. Comparison to real world data
It was felt at this time that comparison of ourmodel baseline perfor-mance to both historic and future changes would be insightful. At thetime of writing, 5 years of data have been gathered on the sales of EVby the EEA for themonitoring of the fleet emission regulation directive.This data has been further analysed in previouswork (Thiel et al., 2015),and sales shares based on this are presented and compared with ourmodel results in the table below (Table 2). Bearing in mind that weare not claiming the model to be accurate in a forecasting capacity, theresults for these first five years of data would appear to be more orless in line with the sales being witnessed in reality. Although in 2012and 2013 the model would appear to slightly over-predict sales share,2014 is similar. However, it should be also borne in mind that at salesof such low shares as at present it is not appropriate to suggest accuracyof the model, but as a reassurance that such promising similaritieswould lend credence to our later results.
Table 2:Comparison of model baseline (R1P1) to actual data, sales market shares (in %).
2010 2011 2012 2013 2014
PHEV Actual 0 0.003 0.07 0.21 0.53Model R1P1 0 0 0.12 0.45 0.62
BEV Actual 0.006 0.07 0.12 0.20 0.31Model R1P1 0.006 0.10 0.22 0.35 0.30
FCV Actual 0 0 0.0002 0.0004 0.0003Model R1P1 0 0 0 0 0
Table 3Comparison to other studies (other studies data taken from Pasaoglu et al., 2012).
HEV PHEV
Other studies Own Other studies
2020 Low 4–10 5 1–5Med/base 9–17 9 3–5High 13–18 9 2–15
2050 Low 8 19 18–25Med/base 7–25 27–37 24–35High 11 18–30 16–27
4.2. Comparison to existing studies
It is not the intention for this model to be used in a predictive capac-ity for future market shares, but to analyse the relative impact of policyoptions between different scenarios. However, for context, it is useful tosee how our model behaves in relation to studies designed to describeEV outlook. For this, in Table 3 we compare our initial policy scenarioresults to the range reported in a previous study that included a meta-analysis of EV penetration rates from 10 studies (Pasaoglu et al.,2012). This was the most recent study we could identify with all ofthis data compiled, though a 2016 BNEF study with only one scenariosuggested an approximate 5% of sales would be PiEV by 2020 and 40%by 2040 (however under their optimistic conditions BEV is costs com-petitive with ICEV by 2022 and therefore is the dominant PiEV)(BNEF, 2016). The studies included in this analysis comprised of somewith different scenarios (low-high decarbonisation) and some withbaseline/reference only. The table thus shows the ranges for low,med/base and high, against the ranges from scenario ranges R0Px,R1Px and R2–3Px respectively. These groupings would feel to be appro-priate representations of such low-high scenarios in line with the com-parisons. It would appear that although ourmodel may appear to be onthe conservative side for all but HEV, the relative shares between alter-native choices seem to be in line with these other studies. Interestinglythis also demonstrates thewide range in predictions that does exist dueto differing scenarios and assumptions employed between studies, andtherefore the lack of certainty in EV sales projections, justifying our ap-proach to concentrate on relative impacts, though some confidence inthe range of absolute numbers is provided by the previous observationscomparing to real world data.
4.3. Baseline for comparison (R1P1)
Under our baseline scenario (R1P1 – current regulation and pur-chase subsidies), there is a 5% EVmarket share of sales by 2020, and a9% HEV share. By 2030 we see that the share of conventionallyfuelled vehicles (ICEV) has been reduced by over a third from 100%in 1995 and the EV market share has grown to 20%, and FCV hasnot yet penetrated the market. ICEV is further reduced to around40% by 2050, when PiEV have captured 42% of the market, thoughFCV has still failed.
4.4. Scenarios with no CO2 target (R0Px)
In comparison to our baseline (R1P1), without any policy in place(R0P0), conventional vehicles reduce to only 95% in 2020, 92% in 2030and 81% in 2050. This technology transition arises solely fromHEV cap-turing approximately 19% of the market, and the remaining EVpowertrains are not successful. Although this first observation mayseem an obvious one, it confirms that by introducing policy conditionswithin this model we do achieve technology transition as would be ex-pected. With purchase subsidies but no fleet emission regulations(R0P1–3), EVs still never achieve a significant market share, with onlyPHEV gaining a share above 2% even by 2050.When the high level pur-chase subsidies are in place (R0S4), we seemore clearly the diminishing
BEV FCV
Own Other studies Own Other studies Own
0–1 0–2 00–4 1–3 0–20–4 3–12 0–20–2 10–14 0–1 4–5 013–22 19–25 7–12 12–25 0–321–32 24–35 12–20 19–50 16–23

171G. Harrison, C. Thiel / Technological Forecasting & Social Change 114 (2017) 165–178
impact of the subsidies from 2020 to 2050, but also that the moregenerous subsidy amount has led to EV shares 3–4 times greater thanthe comparative scenarios.
4.5. Current regulation scenarios (R1Px)
Compared to the scenarios R0, which include no regulatory tar-gets or penalties, under R1 we already see an improvement in alter-native market shares by 2020, which is more than double of thescenarios without fleet regulation (from 5 to 6 to 9–15%). This im-pact is more obvious later in the simulation. By 2030, ICEV sales area third lower than the no regulation scenarios, whereas alternativepowertrains now account for almost 40% of all sales, compared to10% in the previous scenarios. By 2050 the effect of having the regu-lation in place is a halving of ICEV sales share from the previous sce-narios under all subsidy options. However, EV sales reach around athird of the market by 2050, though only the no purchase subsidyscenario (R1P0) has any FCV sales.
By introducing EV purchase subsidies (R1P1–4), in 2020 there isnoticeable uptake of PHEV and BEV compared to R1P0 (no EV pur-chase subsidies), resulting in almost twice the PHEV and BEV sharesby 2030, though there is marginal impact from the actual duration ofthe subsidy availability. However, this additional share would appearto come not from ICEV share but from lowering HEV and FCV shares.At first, this would seem to be counter-intuitive. However, on investi-gation this phenomenon hints upon the importance of finding theright timing for supply and demand stimulating policies and analysingtheir interaction. The following two mechanisms can explain this inmore detail:
• ICEV purchase price is lowered: As purchase subsidies are introduced,and successful (as seen in the 2020 EV shares), the resultant fleetemissions are reduced thereby leading to lower predicted penaltiesfor the manufacturer or less need for CO2 improvements for theconventional vehicles than under the no purchase subsidy scenario.The price of the higher polluting conventional vehicles are alteredby the manufacturer dependent on the predicted penalties (vehicleprice is proportionally adjusted to forecast emissions and penaltiesto deter sales). As such, lower predicted penalties result in a lowerconventional vehicle price. This therefore further increases thefinancial attractiveness (and therefore utility and resultant salesmarket share) of ICEV relative to other powertrains, in comparisonto the no-subsidy scenario.
• R&D investment is lowered: Similarly, with lower penalties being pre-dicted, the manufacturer is less stimulated to invest in R&D as meet-ing emission targets is supported by subsidised EV sales. Due to this,the cost and technical performance of EV components do not improveas rapidly as in the no purchase subsidy scenario, R1P0. This results ina lower score for the alternative powertrain attributes and a higherpurchase price for them. Thus, the utility of the FCV is lower in theR0P1–4 scenarios and therefore they achieve lower sales marketshare growth. The same is true for HEV that is not supported by pur-chase subsidies. BEV and PHEV sales are boosted by the subsidies butthis favourable effect is attenuated after 2030 due to lower R&D in-vestment yielding less favourable utilities between 2030 and 2050when compared with R1P0. FCV gains no success when subsidiesare in place and this results in a severe inhibition of maturity. AsFCV is lessmature than the PiEVs at the start of the simulation, and be-comes available later than these powertrains, it is more greatly affect-ed by the lack of R&D investment. As FCV sales do not develop, neitherdoes the hydrogen infrastructure, thus further lowering the utility ofthe vehicle compared to R1P0. This then perpetuates throughout thesimulation, as predicted sales (based on current sales) are alsolower than R1P0 and accordingly the forecast profits from FCV arelower. As potential profits determine R&D spend, investment is
never as much as R1P0 and therefore components never mature tothe same level, so sales of FCV remain low.
4.6. Projected CO2 emission regulations (R2Px)
Comparing the projected regulations scenarios (R2) to the currentregulation scenarios (R1), there are no differences in 2020, as theconditions are the same. By 2030, we see a higher deployment ofalternative powertrains when the projected regulations are in place.Most noticeable is that FCV has a small market share that was notachieved in the previous scenarios. The stricter CO2 target and relatedpredicted penalties for the manufacturers drive decisions for R&Dinvestments. The manufacturers make the same investment decisionsas in the current regulation scenarios, up until 2025 (the model is setto consider known changes 5 years in advance). From this point,although investment in BEV and PHEV is marginally increased, mostR&D funds go into FCV as it has the greatest potential technology/costimprovement remaining, and therefore provides the greatest leveragefor reducing the fleet CO2 emissions and avoid penalties. The biggestimpact by 2050 of the projected emissions occurs when no subsidiesare in place (R2P0), as PiEV sales are increased compared to the R1scenarios by around 50%. In all the purchase subsidy scenarios, 2050PiEV sales are only slightly improved compared to the current regula-tions scenarios. ICEV sales are more than halved to around 20%, withthe majority of these sales attributed to FCV, now selling better thanBEV. This would suggest that more ambitious, long term fleet emissiontargets are most beneficial to FCV. In relation to the previous discussionon FCV market failure due to lack of investment, the higher targets en-courage the R&D investment in FCV required to ensure success. In futurework, a closer look at the tipping points to where this occurs may beuseful in order to better set target and penalties in future regulation.Similar to the previous discussion on current emission regulations, al-though having purchase subsidies in place in addition to regulationswould seem tomake an impact on EV uptake, particularly in the earlieryears and for PHEV, they would also seem to be marginally lessfavourable for HEV and FCV by 2050, and could result in making ICEVmore attractive to the user in later periods. Furthermore, there is littleimpact from increasing the duration of the purchase subsidies.
4.7. Extended CO2 emission regulations (R3Px)
Our final set of initial policy scenarios considered even more ambi-tious CO2 emission regulations, compared to those previously discussedin 4.6 (R2Px). Similar trends observed also persist within this categoryof scenarios. There is no difference by 2020 to the current regulations asthere is no difference in the scenario design for this time-frame. By2030, we see a slight increase in alternative market shares on theprojected regulations (around 1% point for each powertrain), despite a20% higher emissions target in 2030. Again, this lower than expected im-pact arises from a combination of investment decision dynamics andintra-powertrain competition. However, by 2050 there is a much morenoticeable impact compared to the projected emission regulation scenar-ios. ICEV shares are halved, HEV reduced by around a third, and BEV,PHEV and FCV have increased by around 40, 30 and 20% (resp.), whenpurchase subsidies are in place, and 50, 40 and 20% without. Again inthese scenarios the early addition of EV purchase subsidies can create acertain technology lock-in in favour of BEV and PHEV, penalising the cur-rently less mature FCV, though the effect is somewhat diminished by2050.
4.8. High purchase subsidy scenarios (RxP4)
As seen in Fig. 1 and in comparison to the P0–3 scenario counter-parts, high purchase subsidies can make a difference on sales, and

172 G. Harrison, C. Thiel / Technological Forecasting & Social Change 114 (2017) 165–178
have led to the greatest EV shares by 2020 of all scenarios by over 100%or 300%when no purchase subsidies are in place. By 2030, the impact isnot so great, other than in the no regulation case (R0). Here, the ICEVshare is up to 8% points lower, BEV has a 2% share where there wasnone before, and PHEV share has more than tripled to 7%.When regula-tions are in place, however, ICEV shares are similar to the previous sce-narios when high purchase subsidies are in place, though there is a 20%improvement in total EV sales shares frombeingmore competitivewithHEV, rather than ICEV. Similar observations carry through to 2050,where the subsidies have also reduced FCV sales, and ICEV share isslightly higher for similar reasons as already remarked upon. Thereforewith just these simple tests we can deduce a similar conclusion to pre-vious work that even high purchase subsidies do not appear to havelong term impact, but can stimulate the EVmarketwhen it is in its infan-cy, which may be particularly beneficial in cases of an otherwise failingmarket (Shepherd et al., 2012). Although this findingmay not be novel,it does support confidence in the integrity of the PTTMAM.
4.9. Infrastructure subsidy scenarios (RxPxI1–3)
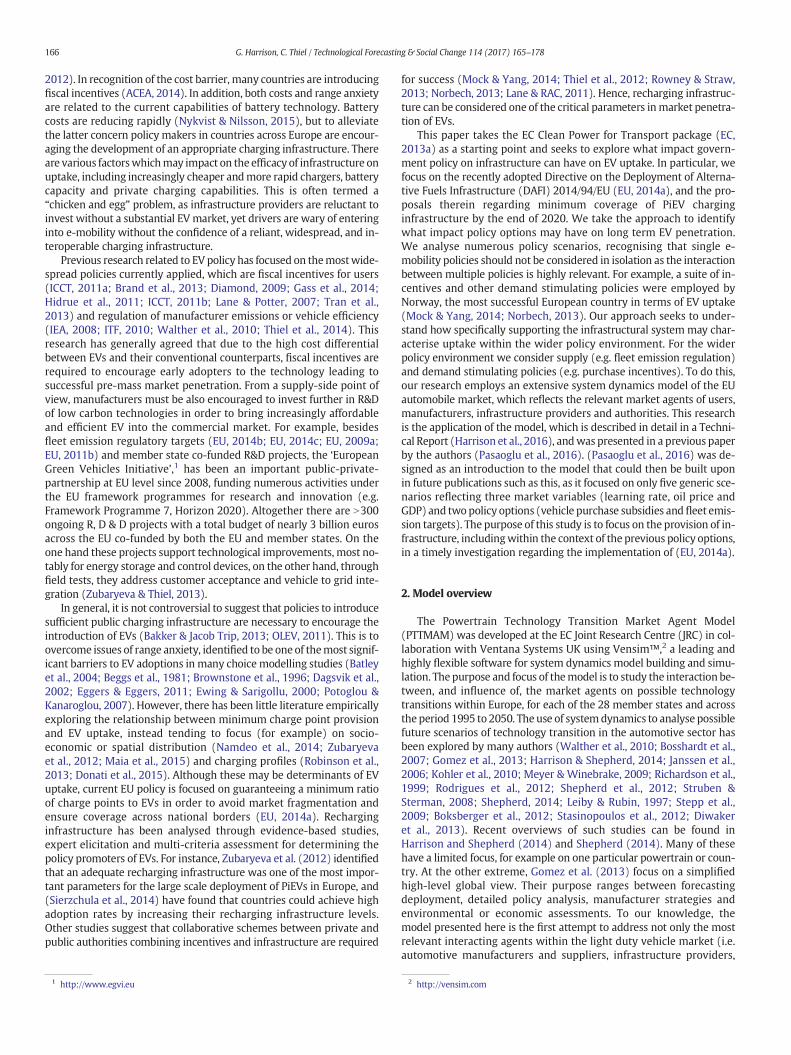
The results of the tested infrastructure scenarios are presented in Fig.2. 2020 is not shown as there is no impact by this point, despite infra-structure subsidies being in place for ten years, compared to the initialpolicy scenarios. Furthermore, as can be seen, there is little impacteven by 2050 for any duration of infrastructure subsidy. There is onlya marginal decrease in conventional vehicle share that is slightly morepronouncedwhen the longer duration subsidies are in place. Under cur-rent regulations (R1), FCV still does not achieve anymarket penetrationdespite the 100% subsidising of H2 infrastructure. This is because thepowertrain itself is never strong enough to compete with the PiEVsthat were introduced earlier in the simulation. For the projected and
Fig. 2. Infrastructure s
extended emission scenarios, R2–3, the longer duration infrastructuresubsidies have led to slightly lower FCV shares, as the subsidies aremore beneficial for the already stronger PiEV powertrains. The PiEV onthe other hand, have already profited and similar competing dynamicsas previously observed have set in to suppress the FCV market. In fact,FCV never has shares greater than the comparative scenarios withoutinfrastructure subsidies are in place, and only when based on thehighest purchase subsidy scenario (P4) does the longest durationinfrastructure subsidy achieve the highest FCV share. In this case, theincreased utility of the FCV from the increased number of hydrogenfuelling stations due to subsidies leads to the greater market shares,taking shares otherwise given to PiEV under the comparative scenarios.The reason for this would appear to be in the detail at an attribute level.Although the infrastructure subsidies have increased the convenienceattribute (relative to the base), leading to greater combined utility(and thus shares) up until around 2030, it is the popularity attribute(based on vehicle stock), causing a lower combined utility from thispoint. This is because the additional infrastructure has been favourableto the PHEV rather than BEV, where shares are lower (or at least thesame). Once this effect kicks in it begins to perpetuate as the BEV popu-larity remains consistently lower than the base scenario, causing evenlower shares. This effect has then led to lower forecasts for future BEV,and thus lower forecast infrastructure requirements. The lower invest-ment in infrastructure has then reduced the convenience for PHEVand thus lower shares for this powertrain also. In summary, it wouldseem to be that the infrastructure subsidies tested here are most bene-ficial for PHEV, butwithout strongmanufacturer regulation is not strongenough to be self-sustaining for any EV penetration.
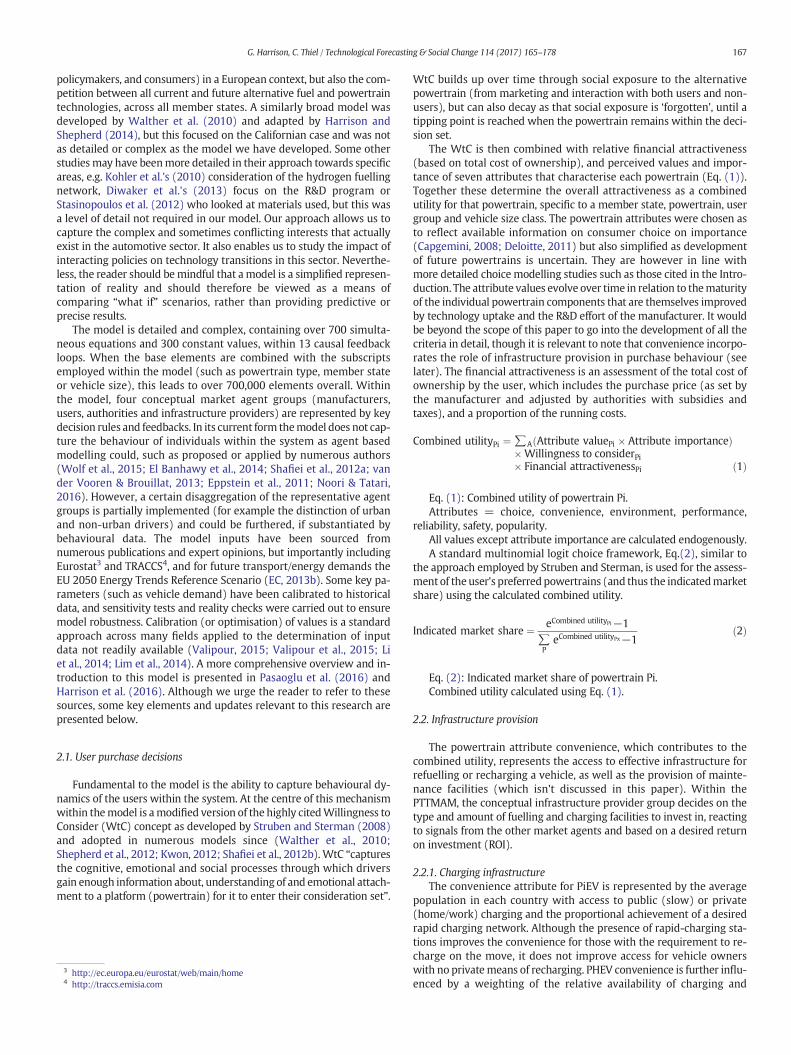
These results have to be considered in conjunction with thedeployed infrastructure. Fig. 3 shows the cumulative number of pCPsinstalled through the simulation under all scenarios. Solid lines are
cenarios results.

Fig. 3. Charging point installation.
173G. Harrison, C. Thiel / Technological Forecasting & Social Change 114 (2017) 165–178
those scenarios with no infrastructure subsidies in place. For thosebased on current vehicle purchase subsidies (P1), there is little differ-ence when the short-lived infrastructure subsidies (dotted line) are inplace. This is because the PiEV shares are only marginally higher asdiscussed above. When the infrastructure subsidies are extendedbeyond 2020 (dashed lines), the rate of installation is greater, but stillno deviation between these scenarios is seen until after 2030. Underthe most ambitious regulatory scenario (R3), there is a greater pCPinstallation without infrastructure subsidies than any duration ofsubsidies combined with the lower regulatory targets. Having thehigher purchase subsidies in place (lighter coloured lines) followssimilar trends, though the shortest-lived infrastructure subsidies doesresult in a higher initial rate of infrastructure deployment than thebase, as early PiEV shares are higher. Setting these findings within thecontext of the impact of the infrastructure subsidies on PiEV shares, itwould seem to be clear that pCP installation is disproportionate to mar-ket shares. In other words, infrastructure subsidies may be successful inincreasing pCP provision under certain conditions, but themagnitude ofthe effect does not feed back into PiEV sales success.
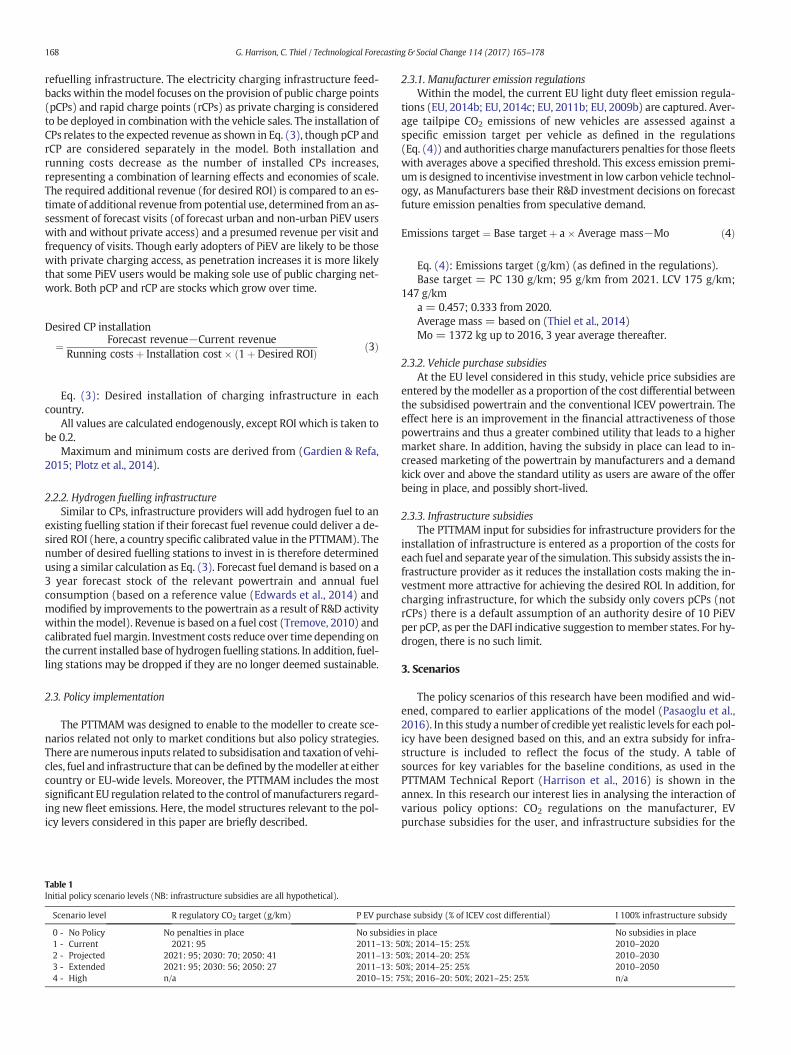
The share of fuel stations carrying hydrogen that have beendeployed under the different infrastructure subsidy levels are shownin Fig. 4. Under the current fleet regulation scenarios (blue lines), asno FCV share builds up, there is never enough stimulus to build H2 infra-structure, evenwith the longest infrastructure subsidies in place. In fact,
Fig. 4. H2 fuel stat
for all remaining scenarios, there is no infrastructure until the late-2020swhen, in ourmodel results, the FCV enters themarket with largernumbers. As such, even themid-term infrastructure subsidies only sup-port an initial small number of H2 fuelling stations. H2 coverage grows toonly amaximumof 7.5%,with the extended regulations beingmost suc-cessful. Under the projected and extended fleet emission regulations,there is only a significant H2 infrastructure installation when the infra-structure subsidies remain in place through to 2050 (longer dashedlines). Yet still, due to low FCV shares, coverage does not exceed 40%.As can be seen in Fig. 4, those scenarios with high purchase subsidies(lighter lines) have lower H2 infrastructure deployment, as the FCVshares are lower, as observed above.
The results reveal that the PiEV profit more from the infrastructuresubsidies than the FCV, and this leads to a certain technology lock-in,resulting in a reduction of deployed FCV. The lower FCV share againhas an impact on the effectiveness of the hydrogen infrastructure subsi-dies. This stresses the importance of finding the right balance, degree,and timing of policy measures in order to avoid undesirable effects.
5. Sensitivity to charge point targets
Focus now turns specifically to PiEV and their charging infrastruc-ture. As mentioned in 2.3.3, the DAFI indicates a desire for a ratio of 10PiEVs per pCP (PiEV/pCP) for member states. To understand the
ion coverage.
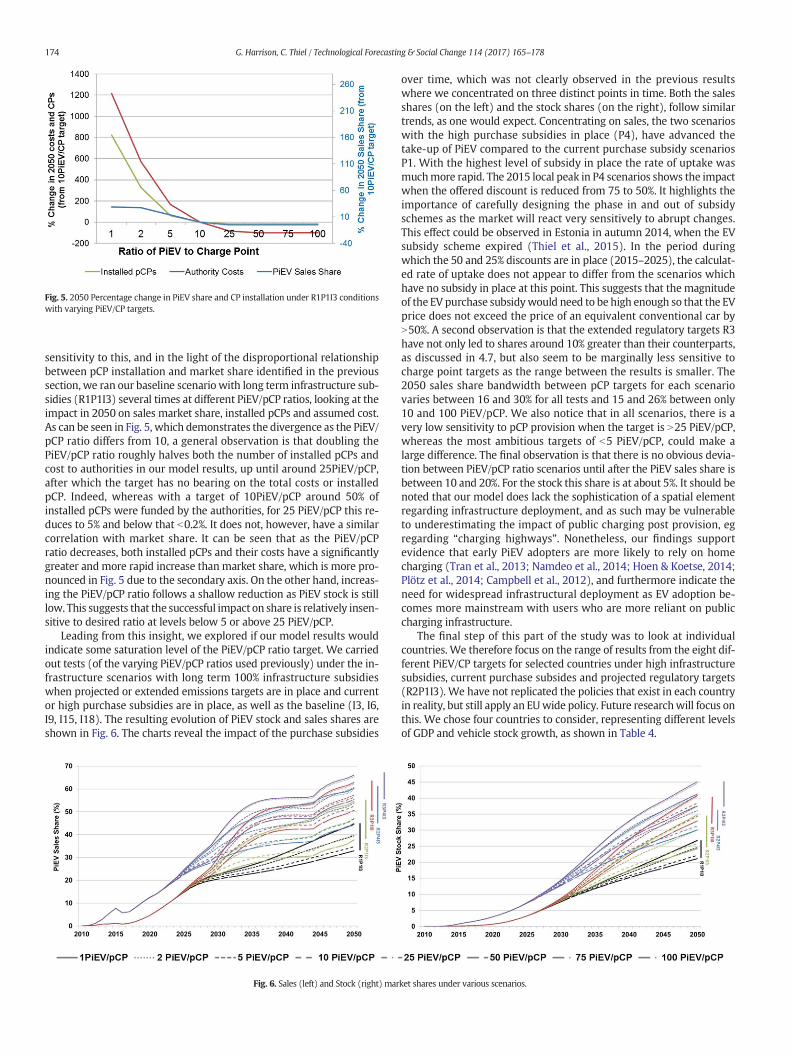
Fig. 5. 2050 Percentage change in PiEV share and CP installation under R1P1I3 conditionswith varying PiEV/CP targets.
174 G. Harrison, C. Thiel / Technological Forecasting & Social Change 114 (2017) 165–178
sensitivity to this, and in the light of the disproportional relationshipbetween pCP installation and market share identified in the previoussection, we ran our baseline scenario with long term infrastructure sub-sidies (R1P1I3) several times at different PiEV/pCP ratios, looking at theimpact in 2050 on sales market share, installed pCPs and assumed cost.As can be seen in Fig. 5, which demonstrates the divergence as the PiEV/pCP ratio differs from 10, a general observation is that doubling thePiEV/pCP ratio roughly halves both the number of installed pCPs andcost to authorities in our model results, up until around 25PiEV/pCP,after which the target has no bearing on the total costs or installedpCP. Indeed, whereas with a target of 10PiEV/pCP around 50% ofinstalled pCPs were funded by the authorities, for 25 PiEV/pCP this re-duces to 5% and below that b0.2%. It does not, however, have a similarcorrelation with market share. It can be seen that as the PiEV/pCPratio decreases, both installed pCPs and their costs have a significantlygreater and more rapid increase than market share, which is more pro-nounced in Fig. 5 due to the secondary axis. On the other hand, increas-ing the PiEV/pCP ratio follows a shallow reduction as PiEV stock is stilllow. This suggests that the successful impact on share is relatively insen-sitive to desired ratio at levels below 5 or above 25 PiEV/pCP.
Leading from this insight, we explored if our model results wouldindicate some saturation level of the PiEV/pCP ratio target. We carriedout tests (of the varying PiEV/pCP ratios used previously) under the in-frastructure scenarios with long term 100% infrastructure subsidieswhen projected or extended emissions targets are in place and currentor high purchase subsidies are in place, as well as the baseline (I3, I6,I9, I15, I18). The resulting evolution of PiEV stock and sales shares areshown in Fig. 6. The charts reveal the impact of the purchase subsidies
Fig. 6. Sales (left) and Stock (right) mar
over time, which was not clearly observed in the previous resultswhere we concentrated on three distinct points in time. Both the salesshares (on the left) and the stock shares (on the right), follow similartrends, as one would expect. Concentrating on sales, the two scenarioswith the high purchase subsidies in place (P4), have advanced thetake-up of PiEV compared to the current purchase subsidy scenariosP1. With the highest level of subsidy in place the rate of uptake wasmuchmore rapid. The 2015 local peak in P4 scenarios shows the impactwhen the offered discount is reduced from 75 to 50%. It highlights theimportance of carefully designing the phase in and out of subsidyschemes as the market will react very sensitively to abrupt changes.This effect could be observed in Estonia in autumn 2014, when the EVsubsidy scheme expired (Thiel et al., 2015). In the period duringwhich the 50 and 25% discounts are in place (2015–2025), the calculat-ed rate of uptake does not appear to differ from the scenarios whichhave no subsidy in place at this point. This suggests that the magnitudeof the EV purchase subsidywould need to be high enough so that the EVprice does not exceed the price of an equivalent conventional car byN50%. A second observation is that the extended regulatory targets R3have not only led to shares around 10% greater than their counterparts,as discussed in 4.7, but also seem to be marginally less sensitive tocharge point targets as the range between the results is smaller. The2050 sales share bandwidth between pCP targets for each scenariovaries between 16 and 30% for all tests and 15 and 26% between only10 and 100 PiEV/pCP. We also notice that in all scenarios, there is avery low sensitivity to pCP provision when the target is N25 PiEV/pCP,whereas the most ambitious targets of b5 PiEV/pCP, could make alarge difference. The final observation is that there is no obvious devia-tion between PiEV/pCP ratio scenarios until after the PiEV sales share isbetween 10 and 20%. For the stock this share is at about 5%. It should benoted that our model does lack the sophistication of a spatial elementregarding infrastructure deployment, and as such may be vulnerableto underestimating the impact of public charging post provision, egregarding “charging highways”. Nonetheless, our findings supportevidence that early PiEV adopters are more likely to rely on homecharging (Tran et al., 2013; Namdeo et al., 2014; Hoen & Koetse, 2014;Plötz et al., 2014; Campbell et al., 2012), and furthermore indicate theneed for widespread infrastructural deployment as EV adoption be-comes more mainstream with users who are more reliant on publiccharging infrastructure.
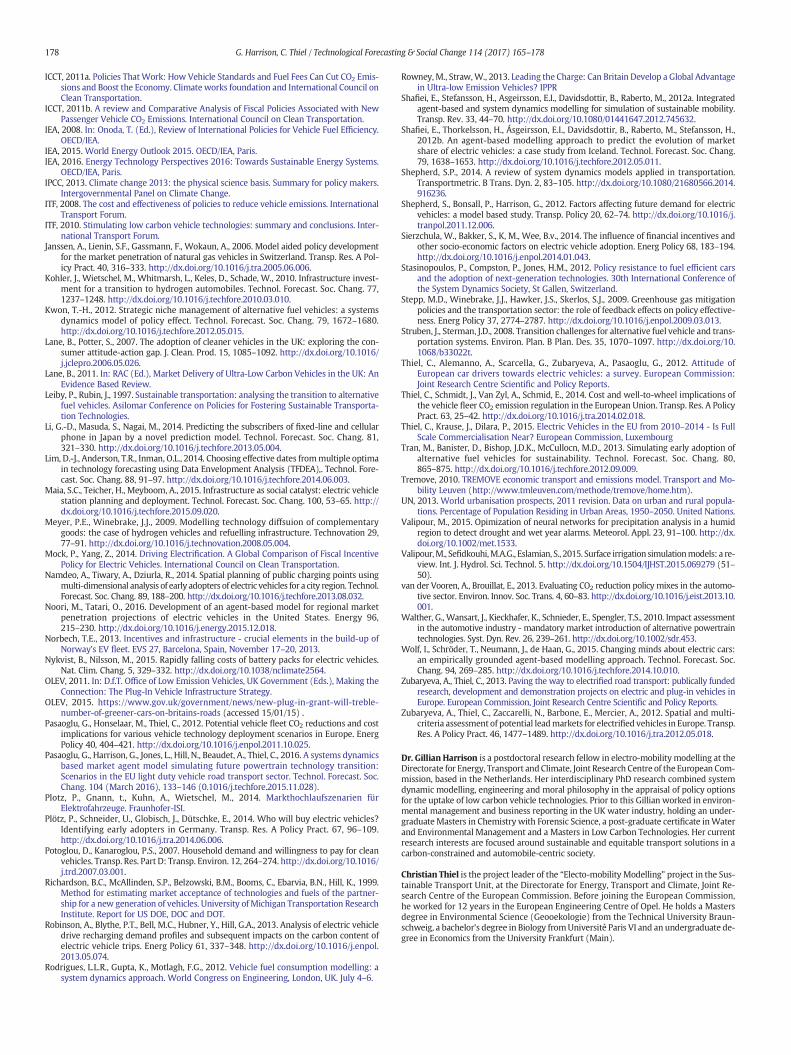
The final step of this part of the study was to look at individualcountries. We therefore focus on the range of results from the eight dif-ferent PiEV/CP targets for selected countries under high infrastructuresubsidies, current purchase subsides and projected regulatory targets(R2P1I3). We have not replicated the policies that exist in each countryin reality, but still apply an EUwide policy. Future researchwill focus onthis. We chose four countries to consider, representing different levelsof GDP and vehicle stock growth, as shown in Table 4.
ket shares under various scenarios.
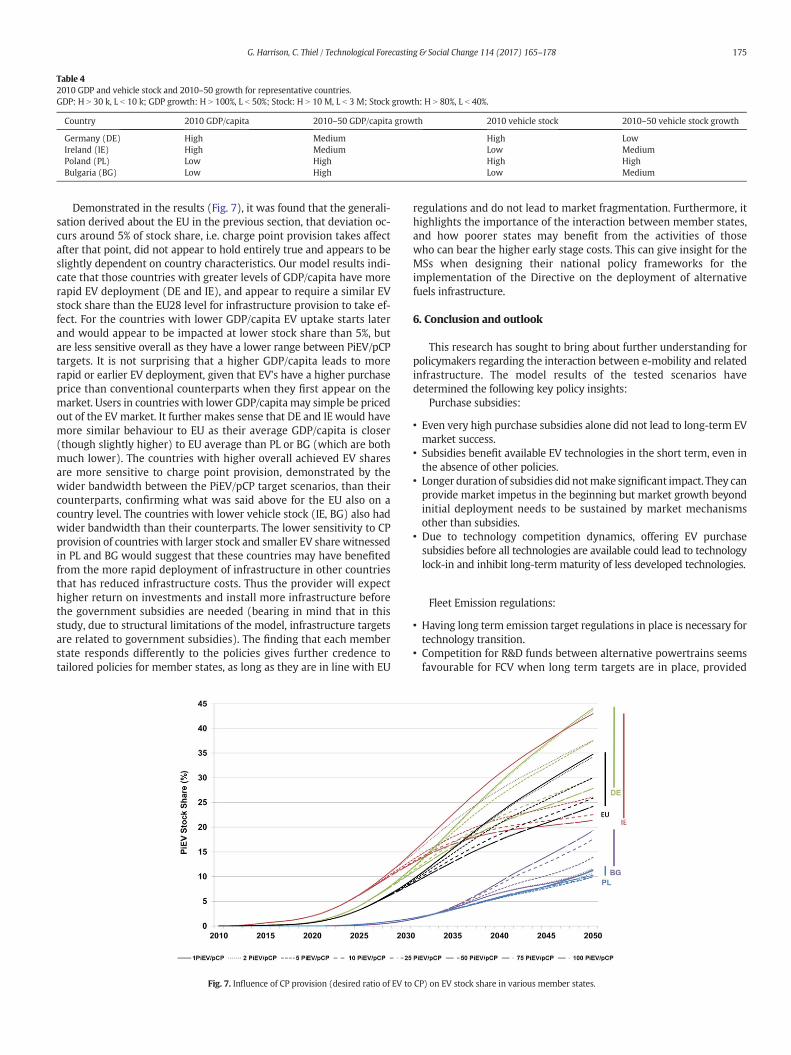
Table 42010 GDP and vehicle stock and 2010–50 growth for representative countries.GDP: H N 30 k, L b 10 k; GDP growth: H N 100%, L b 50%; Stock: H N 10 M, L b 3 M; Stock growth: H N 80%, L b 40%.
Country 2010 GDP/capita 2010–50 GDP/capita growth 2010 vehicle stock 2010–50 vehicle stock growth
Germany (DE) High Medium High LowIreland (IE) High Medium Low MediumPoland (PL) Low High High HighBulgaria (BG) Low High Low Medium
175G. Harrison, C. Thiel / Technological Forecasting & Social Change 114 (2017) 165–178
Demonstrated in the results (Fig. 7), it was found that the generali-sation derived about the EU in the previous section, that deviation oc-curs around 5% of stock share, i.e. charge point provision takes affectafter that point, did not appear to hold entirely true and appears to beslightly dependent on country characteristics. Our model results indi-cate that those countries with greater levels of GDP/capita have morerapid EV deployment (DE and IE), and appear to require a similar EVstock share than the EU28 level for infrastructure provision to take ef-fect. For the countries with lower GDP/capita EV uptake starts laterand would appear to be impacted at lower stock share than 5%, butare less sensitive overall as they have a lower range between PiEV/pCPtargets. It is not surprising that a higher GDP/capita leads to morerapid or earlier EV deployment, given that EV's have a higher purchaseprice than conventional counterparts when they first appear on themarket. Users in countries with lower GDP/capita may simple be pricedout of the EV market. It further makes sense that DE and IE would havemore similar behaviour to EU as their average GDP/capita is closer(though slightly higher) to EU average than PL or BG (which are bothmuch lower). The countries with higher overall achieved EV sharesare more sensitive to charge point provision, demonstrated by thewider bandwidth between the PiEV/pCP target scenarios, than theircounterparts, confirming what was said above for the EU also on acountry level. The countries with lower vehicle stock (IE, BG) also hadwider bandwidth than their counterparts. The lower sensitivity to CPprovision of countries with larger stock and smaller EV share witnessedin PL and BG would suggest that these countries may have benefitedfrom the more rapid deployment of infrastructure in other countriesthat has reduced infrastructure costs. Thus the provider will expecthigher return on investments and install more infrastructure beforethe government subsidies are needed (bearing in mind that in thisstudy, due to structural limitations of the model, infrastructure targetsare related to government subsidies). The finding that each memberstate responds differently to the policies gives further credence totailored policies for member states, as long as they are in line with EU
Fig. 7. Influence of CP provision (desired ratio of EV to
regulations and do not lead to market fragmentation. Furthermore, ithighlights the importance of the interaction between member states,and how poorer states may benefit from the activities of thosewho can bear the higher early stage costs. This can give insight for theMSs when designing their national policy frameworks for theimplementation of the Directive on the deployment of alternativefuels infrastructure.
6. Conclusion and outlook
This research has sought to bring about further understanding forpolicymakers regarding the interaction between e-mobility and relatedinfrastructure. The model results of the tested scenarios havedetermined the following key policy insights:
Purchase subsidies:
• Even very high purchase subsidies alone did not lead to long-term EVmarket success.
• Subsidies benefit available EV technologies in the short term, even inthe absence of other policies.
• Longer duration of subsidies did notmake significant impact. They canprovide market impetus in the beginning but market growth beyondinitial deployment needs to be sustained by market mechanismsother than subsidies.
• Due to technology competition dynamics, offering EV purchasesubsidies before all technologies are available could lead to technologylock-in and inhibit long-term maturity of less developed technologies.
Fleet Emission regulations:
• Having long term emission target regulations in place is necessary fortechnology transition.
• Competition for R&D funds between alternative powertrains seemsfavourable for FCV when long term targets are in place, provided
CP) on EV stock share in various member states.

176 G. Harrison, C. Thiel / Technological Forecasting & Social Change 114 (2017) 165–178
that hydrogen is produced via low carbon pathways.• The most ambitious long term targets benefit PHEV and BEV whensubsidies are also in place.
• Higher regulatory emission targets appear to reduce sensitivity tocharge point provision.
Infrastructure provision:
• Success of infrastructure subsidies is strongly tied in with success ofother policies and existing competition dynamics.
• Charge point provision appears to impact PiEV uptake when PiEVstock share is over 5% in the EU but would appear to be dependenton total stock volume and GDP.
• EV take-up is relatively insensitive at target levels below 5 or over 25PiEV/pCP.
We can conclude that without stringent fleet emission regulationtargets in place for automobilemanufacturers a significant transition to-wards e-mobility, as a potential enabler to meet wider transport andemission reduction targets, is unlikely to take place, regardless of sup-portive policies aimed at users. Furthermore, it would appear that FCVcould have negligible deployment in the absence of strong regulation.There are significant interactions between EV options, especially whenvehicle subsidies are in place. Whereas vehicle subsidies are favourabletowards PiEVs, this can lead to very low shares of FCVs, which can betipped back into success by H2 fuelling infrastructure subsidies andfleet CO2 emission penalties. These findings would suggest that subsi-dies are only beneficial in the earlier years of market introduction andshould cover all technologies. Nonetheless, our results would also givesome support that White Paper targets may be met.
Our findings indicate that some form of minimum infrastructuraltargets could be beneficial though further research is needed to identifythe exact saturation levels, and it is beyond the scope of this model tocomment on the impact of spatial deployment. There is a correlation be-tween EV uptake and infrastructure subsidies, but in our modelled sce-narios it appears to be weaker than vehicle purchase subsidies ormanufacturerfleet CO2 targets. Our study results support thehypothesisthat early EV adopters are less reliant on the provision of public charginginfrastructure. Greater infrastructure provision is necessary to increasethe convenience of PiEVs and thus their overall utility as perceived bythe user, but for the user to realistically consider purchasing a PiEV inthe first place, more exposure to the new powertrains is required inearly years to build awareness and enter the users' decision set.
Tipping points for regulatory targets should be considered more indepth, based on the initial observations presented here, in preparationfor future policy discussion and implementation. This could include aconsideration of upstream emissions. Finally, this study has not directly
Table 5Sources for key variables under baseline conditions for indvidual member states unless marke
Variable Historic trend
Population (Eurostat, 201Average household size EC, (2013b)GDP per capita (Eurostat, 201
Demographic breakdown World UrbaniAverage annual KM TRACCS (EMISRoad network length (Eurostat, 201Growth in oil price ExtrapolationGrowth in alternative fuel price Expert assumElectric fuel cost (Eurostat, 201ICEV fuel cost (Tremove, 201
Appendix A
considered vehicle size/segments, which could offer further insight fordiscussions. The work presented in this paper relies on a complexmodel. As described in Section 3, the model is extensive and detailed,but remains a simplified representation of the decision processes of mar-ket players. The purpose of the model is to capture system interactionsand feedbacks as concisely as possible and focus on impacts that systemchanges can make on overall outcomes, with a view of understandingthe key relationships and tipping points within the system being studied.The attraction of this is that recommendations for policy design can bemade on the basis of computer simulations avoiding costly policy exper-imentation.Many assumptions have beenmade to ensure that themodelis as simple as possible, yet representative enough to consider importantfeedback loops. Naturally, this introduces uncertainties into the confi-dence in the model results, as does any uncertainty over the decisionswithin the scenario design. However, the strength in system dynamicsmodelling lies not in a prediction or forecasting capacity, but in the un-derstanding of behaviours of variables, and the comparison of scenarios.It is important that any party drawing from the results of this study isfully informed of this limitation. Therefore, the impact of uncertaintiesof model assumptions are somewhat mitigated as they are consistentacross all scenarios, and model calibration and optimisation routineshave suggested that data deviation should have minimal impact on be-haviour. Uncertainties in scenario assumptions are less troublesome, be-cause as time goes on, even if they turn out to be not as realistic asassumed, they are still valid scenarios at this point in time, spreading be-tween minimum and maximum possibilities. Furthermore, the model isadaptable enough to be improved over time with continued learning,and availability of new data and information. Future iterations may alsoinclude other under-researched system elements such as differing busi-ness models employed by the manufacturer or modal shifts adopted bythe consumer. Going forward, much more detailed analysis, focusing onsensitivities and tipping points, will be carried out over a greater rangeof scenarios to reflect on further policy options, not just regarding charg-ing infrastructure but also wider energy and transport policy goals. Suchanalysis can be further enriched by linking with other models such asdetailed emission, GIS, power dispatch or energy system models.
Acknowledgements
Themodel used in this researchwas initially developed by one of theauthors and Guzay Pasaoglu (JRC) with Lee Jones, Andrew Hill, andAlexandre Beaudet (all Ventana UK). Additional feedback on themanuscript and previous versions was provided by Panagiota Dilara(European Commission, DG GROW) and anonymous reviewers. Theviews expressed are purely those of the authors and may not in anycircumstances be regarded as stating an official position of theEuropean Commission.
d EU (as used in (Harrison et al., 2016)).
Future projection
4a) EU Reference Scenario (EC, 2013b)
4b) Calculation based onEU Reference Scenario (EC, 2013b)
sation Prospects (UN, 2013)IA, 2013) and trend extrapolation4c; CIA, 2014) and expert assumptionfrom EU Reference Scenario (EC, 2013b)ptions based on growth in oil price4d) EU Reference Scenario (EC, 2013b)0; BCN, 2014) and expert assumptions

Table 5 (continued)
Variable Historic trend Future projection
Hydrogen fuel cost Expert assumptions based on other fuel costsElectricity CO2 intensity EU Reference Scenario (EC, 2013b)Hydrogen CO2 intensity (EU) (Pasaoglu et al., 2012)Biofuel blends (EU) EU Energy Statistics
(EC, 2012)EU Reference Scenario (EC, 2013b)
VAT TRACCS (EMISIA, 2013) and trend extrapolationCirculation taxRegistration taxFuel tax growth (Tremove, 2010)Fuel tax
177G. Harrison, C. Thiel / Technological Forecasting & Social Change 114 (2017) 165–178
References
ACEA, 2014. Overview of Purchase and Tax Incentives for Electric Vehicles in the EU, in.European Automobile Manufacturers Association, Brussels.
ACEA, 2016. Alternative Fuel Vehicle registrations: +20.0% in 2015; +21.1% in Q4. Associa-tion of European Automobile Manufacturers (http://www.acea.be/press-releases/arti-cle/alternative-fuel-vehicle-registrations-20.0-in-2015-21.1-in-q4 (accessed03/08/16)).
Bakker, S., Jacob Trip, J., 2013. Policy options to support the adoption of electric vehicles inthe urban environment. Transp. Res. Part D: Transp. Environ. 25, 18–23. http://dx.doi.org/10.1016/j.trd.2013.07.005.
Batley, R.P., Toner, J.P., Knight, M.J., 2004. A mixed logit model of UK household demandfor alternative fuel vehicles. Int. J. Trans. Econ. 31, 55–77 (http://www.jstor.org/sta-ble/42747687).
BCN, 2014. Europe's energy portal. www.energy.eu.Beggs, S., Cardell, S., Hausman, J., 1981. Assessing the potential demand for electric cars.
J. Econ. 16, 1–19. http://dx.doi.org/10.1016/0304-4076(81)90056-7.BNEF, 2016. Global EV sales outlook to 2040. Advanced Transport - Research Note.
Bloomberg New Energy Finance LP.Boksberger, B., Ulli-Beer, S., Bouza, M., Wokaun, A., 2012. Assessing threats and opportu-
nities of induced technology change: long and short cycles in the car maker industry.30th International Conferences of the System Dynamics Society, St. Gallen,Switzerland.
Bosshardt, M., Ulli-Beer, S., Gassman, F., Wokaun, A., August, 2007. Developing a DiffusionModel of Competing Alternative Drive Train Technologies (CADTmodel), in: 2007 In-ternational Conference of the Systems Dynamics Society, Boston, 29 July - 2.
Brand, C., Tan, M., Anable, J., 2012. The UK transport carbonmodel: an integrated life cycleapproach to explore low carbon futures. Energ Policy 41, 107–124. http://dx.doi.org/10.1016/j.enpol.2010.08.019.
Brand, C., Anable, J., Tran, M., 2013. Accelerating the transformation to a low carbon pas-senger transport system: the role fof car purchase taxes, feebates, road taxes andscrappage incentives in the UK. Transp. Res. A Policy Pract. 49, 132–148. http://dx.doi.org/10.1016/j.tra.2013.01.010.
Brownstone, D., Bunch, D.S., Golob, T.F., Ren, W., 1996. A transactions choice model forforecasting demand for alternative-fuel vehicles. Res. Transp. Econ. 4, 87–129.http://dx.doi.org/10.1016/S0739-8859(96)80007-2.
Campbell, A.R., Ryley, T., Thring, R., 2012. Identifying the early adopters of alternative fuelvehicles: a case study of Birmingham, United Kingdom. Transp. Res. A Policy Pract. 46,1318–1327. http://dx.doi.org/10.1016/j.tra.2012.05.004.
Capgemini, 2008. 10th Annual Global Automotive Study: Tracking Consumer BuyingBehavior in Both Mature and Emerging Markets.
CIA, 2014. The World Factbook. https://www.cia.gov/library/publications/the-world-factbook/rankorder/2085rank.html (accessed 23/09/14) .
Dagsvik, J.K., Wennemo, T., Wetterwald, D.G., Aaberge, R., 2002. Potential demand foralternative fuel vehicles. Transp. Res. Pt. B-Methodol. 36, 361–384. http://dx.doi.org/10.1016/S0965-8564(01)00013-1.
Deloitte, 2011. Unplugged: Electric vehicle realities versus consumer expectations. Deloitte.Diamond, D., 2009. The impact of government incentives for hybrid-electric vehicles: evi-
dence from US states. Energ Policy 37, 972–983. http://dx.doi.org/10.1016/j.enpol.2008.09.094.
Diwaker, V.D., Nedumthaly, S.R., Prakash, R., 2013. Objective basedmodelling and simula-tion within a context of an electric vehicle development program. EVS27, Barcelona,Spain, November 17–20 2013.
Donati, A., Dilara, P., Thiel, C., Spadaro, A., Gkatzoflias, D., Drossinos, Y., 2015. IndividualMobility: From Conventional to Electric Cars, in: JRC Science and Policy Report.Publications Office of the European Union, Luxembourg.
EC, 2012. EU energy in figures. Statistical pocketbook 2012. http://ec.europa.eu/energy/publications/doc/2012_energy_figures.pdf (accessed 24/09/2014) .
EC, 2013a. Clean Power for Transport: A European Alternative Fuels Strategy. EuropeanCommission.
EC, 2013b. Energy, Transport and GHG Emissions. Trends to 2050. Reference Scenario2013. European Commission.
EC, 2014. In: E. Commission (Ed.), Communication - A Policy Framework for Climate andEnergy in the Period From 2020 to 2030 [COM(2014)15].
EC, 2016. Communication: A European Strategy for Low-emissionMobility tCOM(2016) 501Final Available from: http://ec.europa.eu/transport/themes/strategies/news/doc/2016-07-20-decarbonisation/com(2016)501_en.pdf European Commission.
Edwards, R., Hass, H., Larive, J.-F., Lonza, L., Maas, H., Rickeard, D., 2014. Well to wheelstechnical report 4a. JEC well to wheels analysis. Well to wheels analysis of future au-tomotive fuels and powertrains in the European context. In: Godwin, S., Hamje, H.,
Krasenbrink, A., Nelson, R., Rose, K.D. (Eds.), JRC Technical Reports. European Com-mission, Joint Research Centre, Institute of Energy and Transport, Luxembourg.
Eggers, F., Eggers, F., 2011. Where have all the flowers gone? Forecasting green trends inthe automobile industry with a choice based conjoint adoption model. Technol. Fore-cast. Soc. Chang. 78, 51–62. http://dx.doi.org/10.1016/j.techfore.2010.06.014.
El Banhawy, E.Y., Dalton, R., Anumba, C., 2014. The agent based modelling of e-mobility.Transportation Electrification Conference and Expo (ITEC), IEEE, Dearborn, MI, USA.
EMISIA, 2013. TRACCS Project, in.Eppstein, M.J., Grover, D.K., Marshall, J.S., Rizzo, D.M., 2011. An agent-based model to
study market penetration of plug-in hybrid electric vehicles. Energ Policy 39,3789–3802. http://dx.doi.org/10.1016/j.enpol.2011.04.007.
EU, 2009a. Directive 2009/33/EC of the European Parliament and of the Council of 23April 2009 on the Promotion of Clean and Energy Efficient Road Transport Vehicles.European Commission.
EU, 2009b. In: European Commission (Ed.), Regulation (EC)No. 443/2009 of the EuropeanParliament and of the Council of 23 April 2009 Setting Emission Performance Stan-dards for New Passenger for New Passenger Cars as Part of the Community's Integrat-ed Approach to Reduce CO2 Emissions From Light-duty Vehicles.
EU, 2011a. White Paper 2011: Roadmap to a Single European Transport Area - Towards aCompetitive and Resource Efficient Transport System. European Commission.
EU, 2011b. Regulation 510/2011 of the European Parliament and of the Council SettingEmission Performance Standards for New Light Commercial Vehicles as Part of theUnion's Integrated Approach to Reduce CO2 Emissions From Light-duty Vehicles.European Commission.
tpdeEU, 2014a. Directive 2014/94/EU of the European Parliament and of the Council of 22October 2014 on the Deployment of Alternative Fuels Infrastructure. EuropeanCommission.
EU, 2014b. Regulation (EU) No. 333/2014 of the European Parliament and of the Council:Amending Regulation (EC) No. 443/2009 to Define the Modalities for Reaching the2020 Target to Reduce CO2 Emissions FromNEWpassenger Cars. European Commission.
EU, 2014c. Regulation (EU) No 253/2014 of the European Parliament and of the CouncilAmending Regulation (EU) No 510/2011 to Define the Modalities for Reaching the2020 Target to Reduce CO2 Emissions From New Light Commercial Vehicles.European Commission.
Eurostat, 2014a. Table demopjan - population on 1 January by age and sex. http://appsso.eurostat.ec.europa.eu/nui/show.do?dataset=demo_pjan&lang=en(accessed 28/04/14) .
Eurostat, 2014b. Table nama_GDP_c - GDP and main components - current Prices. http://appsso.eurostat.ec.europa.eu/nui/submitViewTableAction.do (accessed 29/04/14) .
Eurostat, 2014c. Table road_if_road/motorwa: length of other roads by category of roads/motorway. http://appsso.eurostat.ec.europa.eu/nui/show.do?dataset=road_eqr_carm&lang=en (accessed 18/03/14) .
Eurostat, 2014d. Table nrg_pc_204_h - Electricity - Domestic Consumers - Bi-annual Price.Ewing, G., Sarigollu, E., 2000. Assessing consumer preferences for clean-fuel vehicles: a
discrete choice experiment. J. Public Policy Market. 19, 106–118. http://dx.doi.org/10.1509/jppm.19.1.106.16946.
FAZ, 2015. http://www.faz.net/aktuell/wirtschaft/neue-mobilitaet/gabriel-plant-5000-euro-praemie-fuer-elektroauto-kaeufer-14015629.html (accessed 05/02/15) .
Foxon, T.J., Gross, R., Chase, A., Howes, J., Arnall, A., Anderson, D., 2005. UK innovation sys-tems for new and renewable energy technologies: drivers, barriers and systems fail-ures. Energ Policy 33, 2123–2137. http://dx.doi.org/10.1016/j.enpol.2004.04.011.
Gardien, L., Refa, N., 2015. EV Infrastructure andChargingData in theNetherlands. ELAADNL.Gass, V., Schmidt, J., Shmid, E., 2014. Analyis of alternative policy instruments to promote
electric vehicles in Austria. Renew. Energy 61, 96–101. http://dx.doi.org/10.1016/j.renene.2012.08.012.
Gomez, J., Jochem, O., Fichter, E.W., 2013. EV market development pathways: an applicationof system dynamics for policy simulation. EVS27, Barcelona, Spain, 17–20 November.
Harrison, G., Shepherd, S.P., 2014. An interdisciplinary study to explore impacts from pol-icies for the introduction of low carbon vehicles. Transp. Plan. Technol. 37, 98–117.http://dx.doi.org/10.1080/03081060.2013.844904.
Harrison, G., Thiel, C., Jones, L., 2016. Powertrain Technology Transition Market AgentModel (PTT-MAM): An Introduction, in: JRC Technical Report. European Commission,Luxembourg.
Hidrue, M.K., Parsons, G.R., Kempton, W., Gardner, M.P., 2011. Willingness to pay for elec-tric vehicles and their attributes. Resour. Energy Econ. 33, 686–705. http://dx.doi.org/10.1016/j.reseneeco.2011.02.002.
Hoen, A., Koetse, M.J., 2014. A choice experiment on alternative fuel vehicle preferences ofprivate car owners in the Netherlands. Transp. Res. A Policy Pract. 61, 199–215.http://dx.doi.org/10.1016/j.tra.2014.01.008.
178 G. Harrison, C. Thiel / Technological Forecasting & Social Change 114 (2017) 165–178
ICCT, 2011a. Policies ThatWork: How Vehicle Standards and Fuel Fees Can Cut CO2 Emis-sions and Boost the Economy. Climate works foundation and International Council onClean Transportation.
ICCT, 2011b. A review and Comparative Analysis of Fiscal Policies Associated with NewPassenger Vehicle CO2 Emissions. International Council on Clean Transportation.
IEA, 2008. In: Onoda, T. (Ed.), Review of International Policies for Vehicle Fuel Efficiency.OECD/IEA.
IEA, 2015. World Energy Outlook 2015. OECD/IEA, Paris.IEA, 2016. Energy Technology Perspectives 2016: Towards Sustainable Energy Systems.
OECD/IEA, Paris.IPCC, 2013. Climate change 2013: the physical science basis. Summary for policy makers.
Intergovernmental Panel on Climate Change.ITF, 2008. The cost and effectiveness of policies to reduce vehicle emissions. International
Transport Forum.ITF, 2010. Stimulating low carbon vehicle technologies: summary and conclusions. Inter-
national Transport Forum.Janssen, A., Lienin, S.F., Gassmann, F., Wokaun, A., 2006. Model aided policy development
for the market penetration of natural gas vehicles in Switzerland. Transp. Res. A Pol-icy Pract. 40, 316–333. http://dx.doi.org/10.1016/j.tra.2005.06.006.
Kohler, J., Wietschel, M., Whitmarsh, L., Keles, D., Schade, W., 2010. Infrastructure invest-ment for a transition to hydrogen automobiles. Technol. Forecast. Soc. Chang. 77,1237–1248. http://dx.doi.org/10.1016/j.techfore.2010.03.010.
Kwon, T.-H., 2012. Strategic niche management of alternative fuel vehicles: a systemsdynamics model of policy effect. Technol. Forecast. Soc. Chang. 79, 1672–1680.http://dx.doi.org/10.1016/j.techfore.2012.05.015.
Lane, B., Potter, S., 2007. The adoption of cleaner vehicles in the UK: exploring the con-sumer attitude-action gap. J. Clean. Prod. 15, 1085–1092. http://dx.doi.org/10.1016/j.jclepro.2006.05.026.
Lane, B., 2011. In: RAC (Ed.), Market Delivery of Ultra-Low Carbon Vehicles in the UK: AnEvidence Based Review.
Leiby, P., Rubin, J., 1997. Sustainable transportation: analysing the transition to alternativefuel vehicles. Asilomar Conference on Policies for Fostering Sustainable Transporta-tion Technologies.
Li, G.-D., Masuda, S., Nagai, M., 2014. Predicting the subscribers of fixed-line and cellularphone in Japan by a novel prediction model. Technol. Forecast. Soc. Chang. 81,321–330. http://dx.doi.org/10.1016/j.techfore.2013.05.004.
Lim, D.-J., Anderson, T.R., Inman, O.L., 2014. Choosing effective dates frommultiple optimain technology forecasting using Data Envelopment Analysis (TFDEA),. Technol. Fore-cast. Soc. Chang. 88, 91–97. http://dx.doi.org/10.1016/j.techfore.2014.06.003.
Maia, S.C., Teicher, H., Meyboom, A., 2015. Infrastructure as social catalyst: electric vehiclestation planning and deployment. Technol. Forecast. Soc. Chang. 100, 53–65. http://dx.doi.org/10.1016/j.techfore.2015.09.020.
Meyer, P.E., Winebrake, J.J., 2009. Modelling technology diffsuion of complementarygoods: the case of hydrogen vehicles and refuelling infrastructure. Technovation 29,77–91. http://dx.doi.org/10.1016/j.technovation.2008.05.004.
Mock, P., Yang, Z., 2014. Driving Electrification. A Global Comparison of Fiscal IncentivePolicy for Electric Vehicles. International Council on Clean Transportation.
Namdeo, A., Tiwary, A., Dziurla, R., 2014. Spatial planning of public charging points usingmulti-dimensional analysis of early adopters of electric vehicles for a city region. Technol.Forecast. Soc. Chang. 89, 188–200. http://dx.doi.org/10.1016/j.techfore.2013.08.032.
Noori, M., Tatari, O., 2016. Development of an agent-based model for regional marketpenetration projections of electric vehicles in the United States. Energy 96,215–230. http://dx.doi.org/10.1016/j.energy.2015.12.018.
Norbech, T.E., 2013. Incentives and infrastructure - crucial elements in the build-up ofNorway's EV fleet. EVS 27, Barcelona, Spain, November 17–20, 2013.
Nykvist, B., Nilsson, M., 2015. Rapidly falling costs of battery packs for electric vehicles.Nat. Clim. Chang. 5, 329–332. http://dx.doi.org/10.1038/nclimate2564.
OLEV, 2011. In: D.f.T. Office of Low Emission Vehicles, UK Government (Eds.), Making theConnection: The Plug-In Vehicle Infrastructure Strategy.
OLEV, 2015. https://www.gov.uk/government/news/new-plug-in-grant-will-treble-number-of-greener-cars-on-britains-roads (accessed 15/01/15) .
Pasaoglu, G., Honselaar, M., Thiel, C., 2012. Potential vehicle fleet CO2 reductions and costimplications for various vehicle technology deployment scenarios in Europe. EnergPolicy 40, 404–421. http://dx.doi.org/10.1016/j.enpol.2011.10.025.
Pasaoglu, G., Harrison, G., Jones, L., Hill, N., Beaudet, A., Thiel, C., 2016. A systems dynamicsbased market agent model simulating future powertrain technology transition:Scenarios in the EU light duty vehicle road transport sector. Technol. Forecast. Soc.Chang. 104 (March 2016), 133–146 (0.1016/j.techfore.2015.11.028).
Plotz, P., Gnann, t., Kuhn, A., Wietschel, M., 2014. Markthochlaufszenarien fürElektrofahrzeuge. Fraunhofer-ISI.
Plötz, P., Schneider, U., Globisch, J., Dütschke, E., 2014. Who will buy electric vehicles?Identifying early adopters in Germany. Transp. Res. A Policy Pract. 67, 96–109.http://dx.doi.org/10.1016/j.tra.2014.06.006.
Potoglou, D., Kanaroglou, P.S., 2007. Household demand and willingness to pay for cleanvehicles. Transp. Res. Part D: Transp. Environ. 12, 264–274. http://dx.doi.org/10.1016/j.trd.2007.03.001.
Richardson, B.C., McAllinden, S.P., Belzowski, B.M., Booms, C., Ebarvia, B.N., Hill, K., 1999.Method for estimating market acceptance of technologies and fuels of the partner-ship for a new generation of vehicles. University of Michigan Transportation ResearchInstitute. Report for US DOE, DOC and DOT.
Robinson, A., Blythe, P.T., Bell, M.C., Hubner, Y., Hill, G.A., 2013. Analysis of electric vehicledrive recharging demand profiles and subsequent impacts on the carbon content ofelectric vehicle trips. Energ Policy 61, 337–348. http://dx.doi.org/10.1016/j.enpol.2013.05.074.
Rodrigues, L.L.R., Gupta, K., Motlagh, F.G., 2012. Vehicle fuel consumption modelling: asystem dynamics approach. World Congress on Engineering, London, UK. July 4–6.
Rowney, M., Straw,W., 2013. Leading the Charge: Can Britain Develop a Global Advantagein Ultra-low Emission Vehicles? IPPR
Shafiei, E., Stefansson, H., Asgeirsson, E.I., Davidsdottir, B., Raberto, M., 2012a. Integratedagent-based and system dynamics modelling for simulation of sustainable mobility.Transp. Rev. 33, 44–70. http://dx.doi.org/10.1080/01441647.2012.745632.
Shafiei, E., Thorkelsson, H., Ásgeirsson, E.I., Davidsdottir, B., Raberto, M., Stefansson, H.,2012b. An agent-based modelling approach to predict the evolution of marketshare of electric vehicles: a case study from Iceland. Technol. Forecast. Soc. Chang.79, 1638–1653. http://dx.doi.org/10.1016/j.techfore.2012.05.011.
Shepherd, S.P., 2014. A review of system dynamics models applied in transportation.Transportmetric. B Trans. Dyn. 2, 83–105. http://dx.doi.org/10.1080/21680566.2014.916236.
Shepherd, S., Bonsall, P., Harrison, G., 2012. Factors affecting future demand for electricvehicles: a model based study. Transp. Policy 20, 62–74. http://dx.doi.org/10.1016/j.tranpol.2011.12.006.
Sierzchula, W., Bakker, S., K, M., Wee, B.v., 2014. The influence of financial incentives andother socio-economic factors on electric vehicle adoption. Energ Policy 68, 183–194.http://dx.doi.org/10.1016/j.enpol.2014.01.043.
Stasinopoulos, P., Compston, P., Jones, H.M., 2012. Policy resistance to fuel efficient carsand the adoption of next-generation technologies. 30th International Conference ofthe System Dynamics Society, St Gallen, Switzerland.
Stepp, M.D., Winebrake, J.J., Hawker, J.S., Skerlos, S.J., 2009. Greenhouse gas mitigationpolicies and the transportation sector: the role of feedback effects on policy effective-ness. Energ Policy 37, 2774–2787. http://dx.doi.org/10.1016/j.enpol.2009.03.013.
Struben, J., Sterman, J.D., 2008. Transition challenges for alternative fuel vehicle and trans-portation systems. Environ. Plan. B Plan. Des. 35, 1070–1097. http://dx.doi.org/10.1068/b33022t.
Thiel, C., Alemanno, A., Scarcella, G., Zubaryeva, A., Pasaoglu, G., 2012. Attitude ofEuropean car drivers towards electric vehicles: a survey. European Commission:Joint Research Centre Scientific and Policy Reports.
Thiel, C., Schmidt, J., Van Zyl, A., Schmid, E., 2014. Cost and well-to-wheel implications ofthe vehicle fleer CO2 emission regulation in the European Union. Transp. Res. A PolicyPract. 63, 25–42. http://dx.doi.org/10.1016/j.tra.2014.02.018.
Thiel, C., Krause, J., Dilara, P., 2015. Electric Vehicles in the EU from 2010–2014 - Is FullScale Commercialisation Near? European Commission, Luxembourg
Tran, M., Banister, D., Bishop, J.D.K., McCullocn, M.D., 2013. Simulating early adoption ofalternative fuel vehicles for sustainability. Technol. Forecast. Soc. Chang. 80,865–875. http://dx.doi.org/10.1016/j.techfore.2012.09.009.
Tremove, 2010. TREMOVE economic transport and emissions model. Transport and Mo-bility Leuven (http://www.tmleuven.com/methode/tremove/home.htm).
UN, 2013. World urbanisation prospects, 2011 revision. Data on urban and rural popula-tions. Percentage of Population Residing in Urban Areas, 1950–2050. United Nations.
Valipour, M., 2015. Opimization of neural networks for precipitation analysis in a humidregion to detect drought and wet year alarms. Meteorol. Appl. 23, 91–100. http://dx.doi.org/10.1002/met.1533.
Valipour,M., Sefidkouhi,M.A.G., Eslamian, S., 2015. Surface irrigation simulationmodels: a re-view. Int. J. Hydrol. Sci. Technol. 5. http://dx.doi.org/10.1504/IJHST.2015.069279 (51–50).
van der Vooren, A., Brouillat, E., 2013. Evaluating CO2 reduction policy mixes in the automo-tive sector. Environ. Innov. Soc. Trans. 4, 60–83. http://dx.doi.org/10.1016/j.eist.2013.10.001.
Walther, G., Wansart, J., Kieckhafer, K., Schnieder, E., Spengler, T.S., 2010. Impact assessmentin the automotive industry - mandatory market introduction of alternative powertraintechnologies. Syst. Dyn. Rev. 26, 239–261. http://dx.doi.org/10.1002/sdr.453.
Wolf, I., Schröder, T., Neumann, J., de Haan, G., 2015. Changing minds about electric cars:an empirically grounded agent-based modelling approach. Technol. Forecast. Soc.Chang. 94, 269–285. http://dx.doi.org/10.1016/j.techfore.2014.10.010.
Zubaryeva, A., Thiel, C., 2013. Paving the way to electrified road transport: publically fundedresearch, development and demonstration projects on electric and plug-in vehicles inEurope. European Commission, Joint Research Centre Scientific and Policy Reports.
Zubaryeva, A., Thiel, C., Zaccarelli, N., Barbone, E., Mercier, A., 2012. Spatial and multi-criteria assessment of potential leadmarkets for electrified vehicles in Europe. Transp.Res. A Policy Pract. 46, 1477–1489. http://dx.doi.org/10.1016/j.tra.2012.05.018.
Dr. Gillian Harrison is a postdoctoral research fellow in electro-mobility modelling at theDirectorate for Energy, Transport andClimate, Joint Research Centre of the European Com-mission, based in the Netherlands. Her interdisciplinary PhD research combined systemdynamic modelling, engineering and moral philosophy in the appraisal of policy optionsfor the uptake of low carbon vehicle technologies. Prior to this Gillian worked in environ-mental management and business reporting in the UK water industry, holding an under-graduate Masters in Chemistry with Forensic Science, a post-graduate certificate inWaterand Environmental Management and a Masters in Low Carbon Technologies. Her currentresearch interests are focused around sustainable and equitable transport solutions in acarbon-constrained and automobile-centric society.
Christian Thiel is the project leader of the “Electo-mobility Modelling” project in the Sus-tainable Transport Unit, at the Directorate for Energy, Transport and Climate, Joint Re-search Centre of the European Commission. Before joining the European Commission,he worked for 12 years in the European Engineering Centre of Opel. He holds a Mastersdegree in Environmental Science (Geooekologie) from the Technical University Braun-schweig, a bachelor's degree in Biology fromUniversité Paris VI and an undergraduate de-gree in Economics from the University Frankfurt (Main).