Embed Size (px)
Citation preview

i
An ICT strategic management framework for rapid technological evolution of a
state-owned company
KE Tshipani
22031448
Mini-dissertation submitted in partial fulfilment of the requirements for the degree Master in Business Administration
at the Potchefstroom Campus of the North-West University
Supervisor: Mr JC Coetzee
May 2015

ii
Abstract
This study was conducted to look into state-owned ICT institutions. The emphasis was on
devising a strategic management framework that would be robust and agile, thereby enabling
government companies within the ICT sector to rapidly respond to changes in the market and to
also enable them to forecast and plan for the future in respect of technology.
The main objective of the study was to derive an ICT strategic management framework for the
rapid technological evolution of state-owned companies. Further, the study aimed to provide a
critical exposition of the factors that affect company ICT strategies; assess the impact of
technological changes on company ICT strategies; and propose guidelines on keeping
companies‘ ICT strategies responsive to rapid technological changes.
Through the literature review as well as an empirical study, common variables and factors that
affect a company‘s ICT strategy and its response to technology changes were explored and
guidelines were compiled into a framework that will assist SOEs (state-owned enterprises).
Through a literature study of available material on the world‘s telecommunication trends and
developments in developed nations, some key observations were recorded such as the concept
of convergence, which in the main is driven by consumers‘ need for mobility and flexibility, as
well as applications with high capacity demands on the one hand and the need for companies
and telecommunications operators to be more efficient on the other. Convergence delivers this
benefit of efficiency within the market and stimulates competition. Innovation and creativity
continue to be the driving force behind the technological evolutions in the ICT sector.
The study also considered how both the PEST model and Porter‘s five forces affect these
companies. Issues such as the legislative and policy framework of the ICT industry in South
Africa were looked at, with emphasis on how they affect ICT parastatals. The study ended with
key recommendations and guidelines summed up into a comprehensive framework.
Key words: ICT strategy, innovation, agility and responsiveness, legislation, drivers and enablers
of strategy, broadband.

iii
Acknowledgements
I would like to extend my sincere gratitude to my Lord and Saviour Jesus Christ for seeing me
through this challenge.
There are many people who have contributed towards the achievement of not only this thesis but
my MBA qualification as a whole. My sincere thanks go to my study leader, Mnr J Coetzee
together with the NWU team. I truly appreciate your support and understanding.
Special thanks to the volunteer in chief, Vusi Goodman Nkuna, together with the statistical and
proofing team comprised of Mari Van Reenen, Celeste Du Preez and Jennifer Renton.
I also thank heartily my mentors Manasseh Netshisaulu and Chris Luvhani for the counsel and
for telling me it is all possible.
Last but not least, to my parents (Mr and Mrs A.J Tshipani), my wife Daisy and children (Olayinka
and Pfadzanimihuvho), sisters and my entire family who have through all the years and
throughout my studies been my pillar of strength, resilience and support. Thank you all for your
patience, prayers and understanding.
To God be all Glory and Honour.

iv
Table of Contents
Abstract ..................................................................................................................................... ii
Acknowledgements .................................................................................................................. iii
List of abbreviations ................................................................................................................. vii
List of Figures ......................................................................................................................... viii
List of Tables .......................................................................................................................... viii
List of Equations ....................................................................................................................... ix
1 CHAPTER 1: NATURE AND SCOPE OF THE STUDY ..................................................... 1
1.1 Introduction ....................................................................................................................... 1
1.2 Problem statement ............................................................................................................ 3
1.3 Objectives of the study ...................................................................................................... 7
1.3.1 Primary objective ........................................................................................................ 7
1.3.2 Secondary objectives ................................................................................................. 7
1.4 Importance of the study ..................................................................................................... 7
1.5 Research methodology ...................................................................................................... 8
1.5.1 Literature/theoretical study ......................................................................................... 8
1.5.2 Empirical study ........................................................................................................... 8
1.5.2.1 Data collection ..................................................................................................... 8
1.5.2.2 Sampling ............................................................................................................. 8
1.6 Limitations of the study ...................................................................................................... 8
1.7 Layout of the study ............................................................................................................ 9
1.8 Conclusions ..................................................................................................................... 10
1.9 Summary ......................................................................................................................... 10
2 CHAPTER 2: LITERATURE REVIEW ............................................................................. 11
2.1 Introduction ..................................................................................................................... 11
2.2 History of ICT and technological evolution ....................................................................... 12
2.2.1 Telecommunication .................................................................................................. 12
2.2.1.1 The South African telecommunications market .................................................. 14
2.2.2 Information Technology and computers .................................................................... 16
2.3 Theory of strategy formulation and strategic management frameworks ........................... 18
2.3.1 What is strategy? ...................................................................................................... 18
2.3.2 Strategy formulation process .................................................................................... 19
2.3.3 The role of strategy .................................................................................................. 21
2.4 ICT strategic pillars .......................................................................................................... 22
2.4.1 People ...................................................................................................................... 22
2.4.1.1 Forms of company structure .............................................................................. 23
2.4.2 Processes and systems ............................................................................................ 24
2.4.3 Technology ............................................................................................................... 24
2.5 Convergence ................................................................................................................... 26

v
2.5.1 Technical and market convergence .......................................................................... 26
2.6 Legislative environment ................................................................................................... 27
2.6.1 PFMA ....................................................................................................................... 27
2.6.1.1 Challenges of PFMA ......................................................................................... 27
2.6.2 Policy Framework ..................................................................................................... 29
2.7 Future trends ................................................................................................................... 30
2.7.1 Quantum computers ................................................................................................. 30
2.7.2 Future networks ........................................................................................................ 31
2.7.3 Future Internet connectivity ...................................................................................... 33
2.7.4 Telecommunications ................................................................................................ 35
2.8 Conclusions ..................................................................................................................... 36
2.9 Summary ......................................................................................................................... 36
3 CHAPTER 3: EMPIRICAL STUDY .................................................................................. 38
3.1 Introduction ..................................................................................................................... 38
3.2 The research design and method .................................................................................... 38
3.2.1 Selection of population group ................................................................................... 40
3.2.2 Sampling method ..................................................................................................... 40
3.2.3 Survey instrument .................................................................................................... 41
3.2.4 Data collection .......................................................................................................... 42
3.2.5 Limitations ................................................................................................................ 42
3.3 Results and discussion .................................................................................................... 43
3.3.1 Validity of Questionnaire ........................................................................................... 43
3.3.1.1 Reliability ................................................................................................................. 44
3.3.2 Biographical information ................................................................................................ 46
3.3.2.1 Gender .................................................................................................................... 47
3.3.2.2 Age ......................................................................................................................... 47
3.3.2.3 Sector of employment within ICT ............................................................................. 48
3.3.2.4 Level of Employment ............................................................................................... 49
3.3.2.5 Years of working experience in ICT ......................................................................... 49
3.3.2.6 Highest qualification ................................................................................................ 50
3.3.3 Analysis of Section A of the questionnaire ................................................................ 51
3.3.4 Analysis of Section B of the questionnaire ................................................................ 52
3.3.5 Analysis of Section C of the questionnaire ................................................................ 53
3.3.6 Exploratory Analysis ................................................................................................. 55
3.3.6.1.1 Correlations ....................................................................................................... 55
3.3.6.1.2 Interpretation of correlations .............................................................................. 55
3.4 Conclusion ...................................................................................................................... 60
3.5 Summary ......................................................................................................................... 61
4 CHAPTER 4: CONCLUSIONS AND RECOMMENDATIONS .......................................... 62
vi
4.1 Introduction ..................................................................................................................... 62
4.2 Conclusions ..................................................................................................................... 62
4.2.1 Legal and regulatory framework ............................................................................... 62
4.2.2 ICT strategic drivers ................................................................................................. 63
4.2.3 Other ........................................................................................................................ 63
4.3 Recommendations .......................................................................................................... 64
4.4 Achievement of study objectives ..................................................................................... 66
4.4.1 Success in terms of the primary objective ................................................................. 66
4.4.2 Success in terms of secondary objectives ................................................................ 66
4.5 The ICT Strategic Management Framework .................................................................... 66
4.5.1 How the framework works ........................................................................................ 69
4.6 Recommendations for future studies ............................................................................... 70
4.7 Summary ......................................................................................................................... 70
REFERENCES .......................................................................................................................... 71
Annexure A: Questionnaire ........................................................................................................ 75
Annexure B: Cover Letter ........................................................................................................... 78
Annexure C: Pearson‘s Correlations .......................................................................................... 79
Annexure D: Frequency Tables .................................................................................................. 85

vii
List of abbreviations
DOL – Department of Labour
ICT – Information Communications Technologies
IT – Information Technology
NWU – North-West University
PEST - Political Economic Socio-cultural Technology
PFMA – Public Finance Management Act
SOE – State-Owned Enterprise
GSM – Global System for Mobile
BEE – Black Economic Empowerment
FFC – Financial and Fiscal Committee
NCOP – National Council of Provinces
MTEF – Medium-Term Expenditure Framework
IFRS – International Financial Reporting Standard
MTEF – Medium Term Expenditure Framework
ICASA – Independent Communications Authority of South Africa
WEF – World Economic Forum
ITU – International Telecoms Union
DOC – Department of Communication
Broadband Infraco – Broadband Infraco (SOC) Ltd.
SITA – State Information Technology Agency
SABC – South African Broadcasting Corporation
NEMISA – National Electronic Media Institute of South Africa
MDDA – Media Development and Diversity Agency
USAASA – Universal Access Agency of South Africa
.ZADNA – Domain Name South Africa (SOC) Ltd.

viii
List of Figures
Figure 1.1: Strategic shift of a company structure and its pillars 12
Figure 1.2: Porter‘s five forces model 13
Figure 1.3: PEST Model 14
Figure 2.1: Strategy as a link between the company and its environment 29
Figure 2.2: Strategy formulation process 30
Figure 2.3: Strategic shift of company structure and its pillars 29
Figure 3.1: Sample of private and public organisations 49
Figure 3.2: Gender split of respondents 54
Figure 3.3: Age distribution of respondents 55
Figure 3.4: Respondents‘ sector of employment 55
Figure 3.5: Respondents‘ level of employment 56
Figure 3.6: Respondents‘ years of experience in ICT 57
Figure 3.7: Respondents‘ highest qualification 57
Figure 4.1: ICT Strategy pyramid 63
Figure 4.2: Strategic ICT management framework 65
List of Tables
Table 2.1: Evolution of telecommunications 21
Table 2.2: Comparing operating versus innovating companies 34
Table 2.3: Convergence and integration 36
Table 2.4 Future requirements of converged networks for both the access
And core network services 42
Table 3.1: Common errors of questionnaires and surveys 49
Table 3.2: Reliability statistics for Section A of Questionnaire 43
Table 3.3: Reliability statistics for Section B of Questionnaire 44
Table 3.4: Reliability statistics for Section C of Questionnaire 44
Table 3.5: Correlation findings and analysis 62
Table 3.6: Statistical results for Section B of the questionnaire 59
Table 3.7: Statistical results for section C of the questionnaire 60
Table 3.8: Correlation findings and analysis 62

ix
List of Equations
Equation 1: Cronbach‘s Alpha Coefficient 44

1
1 CHAPTER 1: NATURE AND SCOPE OF THE STUDY
1.1 Introduction
―Industry evolution poses a huge challenge to managers: strategy and structure must adapt to
keep pace with the rate of change in the external environment. The faster the pace of industry
evolution, the more daunting is the challenge of organisational change‖ (Grant, 2008:275).
In general, companies are supposed to have a corporate strategy that directs how they are run.
Similarly, Information Communication and Technology (ICT) companies are supposed to have an
ICT strategy. This study therefore looked at creating a strategic framework for state-owned ICT
companies. In order to realise this, the framework aimed to create a standard set of parameters
that could then be adapted to the individual company‘s needs. The emphasis of this framework
was on facilitating rapid deployment of ICT resources and agility in strategy formulation. Through
this framework, SOEs will remain competitive and sustainable when conducting their business.
One of the main aims of this study was to examine the factors that drive a company‘s ICT
strategy and establish which ones tend to evolve along with changes in technology.
Our world has now been dubbed the ‗cyber age‘, where technology is the underlying driver and
enabler of business. Technology, by nature, is evolutionary. This evolution happens quite fast
and often companies have to rapidly change their strategies in order to cope with the ever
changing environment. This assertion is further strengthened by Moore‘s Law, which states that
―processor speeds, or overall processing power for computers will double every two years‖
(Mollick, 2006). This is an important law, which has for over the past 40 years and more been
held true. It is imperative to note that processing power doubles every two years for both OEM
and network operators and companies in the ICT industry in general. Therefore there is a need
for continuous improvement from the operator side to cater for ever increasing data and
bandwidth demand, due to the ever increasing processing power of computers, cell phones and
electronic gadgets.
Strategy by its own nature is supposed to be fluid to a great extent. This implies that those
charged with devising strategies are supposed to continuously scan the market for any evidence
or trends of change, as well as eminent changes, in order for them to react accordingly. This
argument is supported by Grant (2008:85), who stated that in any market critical relationships
exist in the form of competition, and accordingly every company must know its market and be

2
able to demarcate it. These boundaries are defined by substitutability of the product or service,
both from the demand side and the supply side.
Taking into account the pace at which technological evolution happens, the challenge is how
quick, responsive and agile a company should be. Private companies with generally deeper
financial reserves and assets are often able to employ their resources to respond accordingly. By
contrast, government and state-owned institutions often have financial and human capital
resource constraints and lack the financial capacity to react to changes as rapidly as the market
demands.
Related to the challenges stated above is the issue of scarcity and affordability of human capital
in the field of ICT at both junior and managerial level (Department of Labour, 2008:13). Many
SOEs lack human resources who possess the required ICT skills and experience. They often
have to outsource certain aspects of their operations or call for the services of consultants. This
skills shortage can be attributed to inadequate financial resources as stated above. Due to this
lack of financial resources the SOEs are unlikely to attract and retain the necessary skills. For the
same reason, many of them are still unable to outsource this function to cope with the pace of the
changes in technology.
In addition to the challenges stated above, SOEs are constrained by legislation such as the
Public Finance Management Act (PFMA) and other statutory regulations like Treasury
Regulations, which govern their financial and operational affairs. These governmental regulations
and laws contribute to delays in procurement and an inability to procure competent service
providers and technology due to the laborious processes they have to follow. The bureaucracy
created by the requirements of the laws mentioned above introduces delays. A government
department or SOE that needs to enter into procurement of minor goods and services must go
through the process of getting at least three quotations, which are then evaluated and the best
service provider (usually the cheapest) is appointed. Contrary to this, the private sector enjoys a
quick turnaround due to their autonomous supply chain management mechanisms. Private
companies can normally make quick decisions to appoint service providers and to procure
services directly in the market. For an example, private companies like Sasol have an automated
supply chain that has an extranet, through which its service providers can interact directly with
the company. This difference in the way public and private institutions do business culminates in
widening the gap between private companies and SOEs in as far as their respective responses
to technological innovations go.

3
The future of the ICT industry is set to be interesting and adorned with revolutionary
technological advancements. Almost all applications will move to wireless and high speed, real
time applications. Coupled with entrenched convergence of IT and telecommunications, the
government and its parastatals will need to be prepared, or at the very least have a strategy that
is robust and agile enough, to react to all these changes. Every day there are technological
breakthroughs and advancements and new discoveries, however the trick is in identifying the
technologies that have potential to disrupt the status quo, therefore business must understand
which technologies will matter and affect them and then prepare accordingly. For these reasons,
managers and leaders of business and industry must keep their strategies resilient, adaptive and
agile in the face of continually evolving technologies, therefore it is important for ICT companies
to be forward looking (Manyika, Chui, Bughin, Dobbs, Bisson & Marrs, 2013).
One of the biggest pieces of the strategic puzzle is people. Millmore, Lewis, Saunders, Thornhill,
and Morrow (2007:160) recognised that people are the organisation‘s most important asset.
SOEs and organisations in general cannot achieve anything without the input of human capital,
therefore employees need to be trained and well versed in technological shifts.
1.2 Problem statement
According to Booyse (2011:12), company strategy is dependent on a structure, which in turn is
built on four broad pillars, namely:
Architecture
Technology
Processes
People
Figure 1.1 depicts the shift between a current company scenario (strategy) and a future scenario
that is informed by changes in the operating environment. The changes are very often driven by
market forces.

4
Figure 1.1: Strategic shift of a company structure and its pillars
Current Scenario Future Scenario
Source: Adapted from Booyse (2011:12)
With this model in figure 1.1, Booyse (2011:12) depicted that for every change in the ICT
Company‘s environment, the company also needs to change its structure and component four
pillars. Organisations are often trapped in different ways, one of which is through the long term
contracts that organisations enter into, which in turn hinder them from adopting new strategies or
buying new products and services. This study will look at ways and means to keep such traps to
a minimum for SOEs in the ICT sector.
Booyse (2011:13) suggested that the environment changes due to many reasons, such as
technology, culture or expectations. The premise of this study is based on the fact that
technology changes (or is affected) faster than any of the other factors, followed by people. The
nature and form of an organisational structure has a link to company strategy and is therefore an
important part of it (Millmore et al., 2007:162).
Almost all, if not all, of the changes that occur in a company‘s operating environment are subject
to market forces, and therefore very little control is left to the company itself. This is supported by
Porter‘s five forces model that states that any industry is subject to five forces (Learn Marketing,
2013), as depicted in the diagram (Figure 1.2) below:
Environment Environment
Strategy Strategy
Structure:
Architecture
Processes
People
Contracts
Structure:
Architecture
Processes
People
Contracts

5
Figure 1.2: Porter’s five forces model
Source: Learn Marketing (2013)
All the five forces as depicted in figure 1.2 acts on the organisation. It is management‘s duty and
responsibility to continuously look out for and scan the market for these forces, and to diagnose
and analyse how they affect their organisations or how they might be affected, and to create
strategies to mitigate any adverse impact on the operations and sustainability of the firm.
As discussed previously, a government‘s legislative framework has a huge impact on the service
delivery of state-owned enterprises, and has a direct bearing on the speed with which these
entities react to market changes. The most important question, which is the core reason for this
study, is ‗Are government-owned companies ready for future technologies?‘ Are our state-owned
companies geared up to react timeously to rapid technological changes?
Related to the dynamics elucidated in Porter‘s five forces above are Political Economic Socio-
cultural Technology (PEST) factors. Figure 1.3 below depicts that any company (including SOEs)
is subject to and driven by the forces of politics, economics, social and cultural issues as well as
technological issues.

6
Figure 1.3: PEST Model
Source: Proven Models (2012)
Organisations do not operate in silos but within markets and in countries within which they
operate. In some cases companies have operations in several countries. Equally, within the
South African context the parastatals within the ICT sector are subject to forces of politics. For
example, government‘s programmes and initiatives are informed by policies of the ruling and
governing party and often the policies of such parastatals and government are affected and have
to be in alignment.
Technological forces are also at play, which by nature are disruptive and often have the power to
alter how people socialise and therefore affects the social force. A good example is the way
social media has revolutionised and totally transformed how people interact; people tend to
communicate more and keep in touch more through the use of social platforms.
South Africa is a democratic state and therefore subject to a free market economic system. In
this system the market forces of supply and demand take effect. As has been seen in the
telecommunication sector, the consumers have benefitted from huge price cuts in the cost of
communication due to the fierce competition among the three big players in the mobile market. It
is therefore imperative that ICT companies look at and analyse the environment on a continuous
basis as part of their strategic planning efforts, to try to devise plans to counter the possible

7
effects (positive or negative) of changes that may be brought about by the forces shown in figure
1.3.
1.3 Objectives of the study
1.3.1 Primary objective
The primary objective of this study was to develop an ICT strategic management framework for
the management of rapid technological evolution of state-owned companies.
1.3.2 Secondary objectives
The secondary objectives of this study will be:
to provide a critical exposition of the factors that affect company ICT
strategies;
to assess the impact of technological changes on company ICT strategies;
and
to propose guidelines on keeping companies‘ ICT strategies responsive to
rapid technological changes.
1.4 Importance of the study
The reality of the current situation in South Africa is that most of the state-owned companies are
not performing optimally. This has often resulted in opposition parties calling for the privatisation
of these entities. Society has also joined the chorus, together with the union movement, for the
revamp of these institutions and for the efficient management of these national assets.
In developing the envisaged framework, this study will contribute to the body of knowledge in
ICT. It is the view of the writer that there is a need for a study that puts emphasis on helping
these government organisations deal with strategic issues, which will enhance their agility in
responding to the challenges posed by the external environment in relation to internal challenges.
This study will make a positive contribution to society by addressing one of the critical areas of
strategic management. This study zooms into the area of technology to see how best state-
owned enterprises can be optimally geared and ready for future technological advancements,
and how they will navigate their way with minimal disruptions and without compromising the
profitability and sustainability of the institutions concerned. The findings of this study will also

8
raise awareness, as the writer is of the opinion that often the state-owned companies are years
behind in terms of technology, systems and governance.
1.5 Research methodology
1.5.1 Literature/theoretical study
The report drew its literature from recently published articles, academic books, technical journals,
magazine articles, as well as publications on the Internet. The researcher also looked at
applicable government legislation and ICT policy documents. The emphasis was on looking at
topics related to the research topic.
1.5.2 Empirical study
1.5.2.1 Data collection
The study collected both primary and secondary data. Primary data was collected using a self-
administered questionnaire, which was designed using close ended questions to enable
consistency of responses and smooth analysis. Secondary data was collected from companies‘
annual reports and other documents.
1.5.2.2 Sampling
The population sample comprised of state-owned companies in the ICT cluster; the full sampling
procedure will be discussed in detail in the appropriate chapter. The research applied non-
probability sampling techniques, however for the sake of representation; a stratified sample was
drawn from a pool of SOEs.
1.6 Limitations of the study
The study only focuses on state-owned ICT companies, of which there are 11 in SA.
Upon finalisation of the sampling technique and the data collection methods, the report was in a
position to provide substantial information on the limitations of the study. The self-administered
questionnaire was completed online; however the author knew that it was likely to result in a low
response rate which would potentially affect the generalisation of the findings. In addition, dealing
with a self-administered questionnaire also posed a risk of getting information supplied by
another respondent on delegation from the intended respondent. This could have resulted in the
distortion of the findings, thereby posing a reliability risk.
9
To mitigate the above, the study also consulted secondary data in the form of annual reports and
papers presented by SOEs to cross-examine sentiment against reality. In this way, the report
could safely generalise its findings.
1.7 Layout of the study
Chapter 1
This introductory chapter provides a background to the study and highlights what the research is
about. In this chapter, the context of the problem statement is provided and the causal factors
briefly discussed. This chapter further examines the importance of the research and its basis,
and secondary to this, the benefit and need for the research.
Chapter 2
Under this chapter a thorough literature review will be laid out. This part of the study will go into
the theories of strategy and strategic management frameworks. A brief history and evolution of
technology will also be shared. Chapter 2 will seek to dissect ICT company strategy in terms of
what its component parts are, as well as what the generic factors and drivers are that affect ICT
strategy for parastatals.
Chapter 3
Chapter 3 deals with the empirical study and gives a detailed outline of the process and
methodology used in gathering data. A short overview of the research philosophy and
methodology are also provided. The design of the survey instrument is discussed as well as the
sample design and process of analysis and evaluation of data. The detailed results from the
survey questionnaires are presented in relation to the literature study.
Chapter 4
Chapter 4 will present a summation of the findings based on both the empirical research and
literature review. A comprehensive and well versed strategic management framework for ICT
state-owned entities will then be devised and presented in this chapter. All lessons captured and
learned throughout the research will be given in detail and opportunities for future research will
be deduced. Finally, an attempt to measure success in addressing the research problem
statement will be made.
10
1.8 Conclusions
All companies and organisations (both public and private) are subject to changing environmental
conditions. The changes in the ICT sector are inherently rapid due to the high levels of innovation
and technological advancement in this sector.
The use of a company ICT strategy to drive business is commonly applied, however there is a
need for SOEs in particular to be geared up to these rapid changes, as they often have to
compete with private entities on the same platform within industries such as telecommunications
and aviation. A strategic framework with emphasis on SOEs is thus of paramount importance.
The framework seeks to put together a comprehensive set of strategy parameters and variables
that different SOEs in the ICT sector could utilise to enable them to devise ICT strategies that are
responsive and agile, and can match up the evolution of technology within their respective
environments.
1.9 Summary
This chapter covered the nature and scope of this study. The main objective of the study was to
derive an ICT strategic management framework for the rapid technological evolution of state-
owned companies. Further, the study aimed to:
provide a critical exposition of the factors that affect company ICT
strategies;
assess the impact of technological changes on company ICT strategies;
and
propose guidelines on keeping companies‘ ICT strategies responsive to
rapid technological changes.
Variables and factors that affect a company‘s ICT strategy and their responses to technology
changes were explored and guidelines were compiled into a framework that will assist SOEs.
An in-depth look into the relevant and related literature will be undertaken in Chapter 2.

11
2 CHAPTER 2: LITERATURE REVIEW
2.1 Introduction
This chapter focuses on unravelling the research topic by examining what other authors have
written on the subject. In fulfilling this objective, the chapter looks at the background of ICT, the
theory of strategy, and all aspects deemed relevant to creating an ICT strategic management
framework.
The primary goal of this study is to come up with an ICT strategic framework for ICT companies
that are partly or wholly owned by the government. For this reason, this part of the study will also
seek to find a broad range of factors that affect the ICT company strategies of parastatals. These
factors will be classified into four broad pillars of company strategy, namely, Systems,
Architecture, Structure and Technology. The main asset of any organisation is its people,
therefore the research will also study how people must be arranged, organised and prepared for
the ever changing ICT industry.
―Strategy is the great work of the organisation. In situations of life or death, it is the Tao of
survival or extinction. Its study cannot be neglected‖ (Clearly, 1988:41). In the same manner,
corporate strategy is imperative for business survival and sustainability. The same holds true for
parastatals or government-owned companies. Both these terms will be used interchangeably to
mean a company that is wholly or partially owned by the government of the Republic of South
Africa. These companies exist within South Africa‘s free market system and are therefore subject
to economic forces just like any other public or private company.
Corporate strategy and business strategy are mechanisms that institutions use to scan the
market for changes and developments, and are also tools that chart the pathway of an
organisation for the medium to long term. Through strategy, matters such as the company‘s
threats and opportunities are analysed. Further focus on matters such as who the company‘s
target market and clients are, is also determined through strategic analysis.
This chapter will seek to study the theory of strategy as applied in a modern day business
environment and with specific emphasis on ICT and technology companies in general. The
chapter will also look at the history and evolution of ICT industries over the years. Through the
analysis and study of history, the author hoped to pick up on certain trends and factors that have
contributed to shaping the ICT industry to what it currently is.

12
Government laws such as the Public Finance Management Act (PFMA) and numerous other
statutes have a direct bearing on how fast government entities can respond to not only
challenges or changes in the market, but also to their normal daily operations. As part of
analysing the operating environment of the government companies, the government legislation
applicable to companies in the ICT cluster is also examined in this chapter. Features of the law
that impede rapid deployment and response of government-owned companies are identified and
ways and means to minimise their impact will be explored.
Another major challenge for technology based industries is that things happen too fast.
Technology, especially ICT technology, inherently changes quickly, therefore a portion of the
literature study will also look at how government-owned ICT companies can best position
themselves to be responsive to, pre-empt, predict or be aware of future trends that will likely
define the market. To satisfy this aspect the literature review will also touch on future
technologies that are bound to redefine the way companies do business, and how the ICT
industry will be shaped in future. Technologies such as quantum and super computers, future
data and transmission networks, to name a few, are also explored.
2.2 History of ICT and technological evolution
Mankind has for centuries strived to improve ways of life. Communication is a basic need in
man‘s day-to-day life and interactions. The ICT industry has revolutionised the way and means
through which humans communicate via the use of technology. As the years have gone by, great
discoveries and inventions have been the order of the day. This section covers the evolution and
major milestones of the ICT industry and is meant to provide an outlook and background to the
ICT sector, both locally and internationally.
2.2.1 Telecommunication
Telecommunication can be defined as the ―communication over a distance by circuits using
cable, fibre optics, satellites, radio etc.‖ (Oxford Dictionary of Current English, 1998:937). Over
the years the medium of transmission of communication as well as the content thereof has
changed significantly. In the past, telecommunication was purely voice, however currently this
includes pictures, videos, graphics, etc. Although telecommunication is an invention that was
created more than a century ago, it has been an enabler for several recent ICT technologies
such as the internet and email.

13
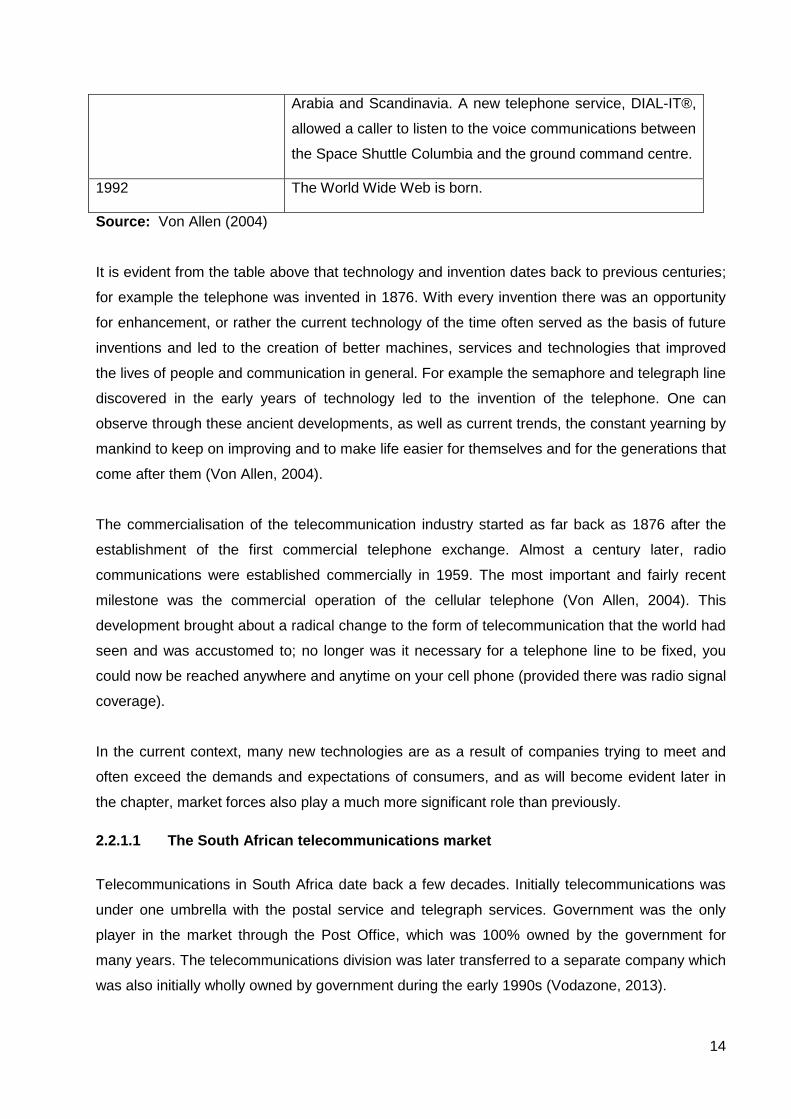
Table 2.1 below provides a snapshot of the telecommunications developments through the years.
Table 2.1: Evolution of telecommunications
Year Discovery / Invention
1840
Congress was requested to provide funding for a semaphore
system running from NYC to New Orleans.
1844 Morse's first telegraph line between Washington and
Baltimore opened in May.
1847 Birth of Alexander Graham Bell, Edinburgh, Scotland.
1851 There are 51 telegraph companies in operation
1865
Maxwell mathematically predicts the propagation of
electromagnetic waves through space.
1866 First transatlantic telegraph line successfully laid. Prior to the
cable, sending messages between the United States and
Europe took 11 days.
1867 The first Atlantic cable, promoted by Cyrus Field, was laid on
July 27th.
1876 Alexander Graham Bell invents the telephone.
1878 The first telephone directory, in New Haven, CT, had 21
listings.
1878 (January 28) The first commercial telephone exchange in the world opened
in New Haven, Conn.
1896 Marconi patents wireless telegraph.
1901 Marconi transmits first trans-Atlantic radio message.
1915 (January 25) Opening of the first trans-continental telephone line, New York
to San Francisco, spans 3600 miles.
1915 (October 21) First transmission of speech across the Atlantic by
radiotelephone, Arlington, Va., to Paris.
1959 AT&T introduces the TH-1 1860-channel microwave system.
The FCC's Above 890 MHz Decision allowed private
microwave systems.
1981 The first cellular mobile telephone service is offered, in Saudi
14
Arabia and Scandinavia. A new telephone service, DIAL-IT®,
allowed a caller to listen to the voice communications between
the Space Shuttle Columbia and the ground command centre.
1992 The World Wide Web is born.
Source: Von Allen (2004)
It is evident from the table above that technology and invention dates back to previous centuries;
for example the telephone was invented in 1876. With every invention there was an opportunity
for enhancement, or rather the current technology of the time often served as the basis of future
inventions and led to the creation of better machines, services and technologies that improved
the lives of people and communication in general. For example the semaphore and telegraph line
discovered in the early years of technology led to the invention of the telephone. One can
observe through these ancient developments, as well as current trends, the constant yearning by
mankind to keep on improving and to make life easier for themselves and for the generations that
come after them (Von Allen, 2004).
The commercialisation of the telecommunication industry started as far back as 1876 after the
establishment of the first commercial telephone exchange. Almost a century later, radio
communications were established commercially in 1959. The most important and fairly recent
milestone was the commercial operation of the cellular telephone (Von Allen, 2004). This
development brought about a radical change to the form of telecommunication that the world had
seen and was accustomed to; no longer was it necessary for a telephone line to be fixed, you
could now be reached anywhere and anytime on your cell phone (provided there was radio signal
coverage).
In the current context, many new technologies are as a result of companies trying to meet and
often exceed the demands and expectations of consumers, and as will become evident later in
the chapter, market forces also play a much more significant role than previously.
2.2.1.1 The South African telecommunications market
Telecommunications in South Africa date back a few decades. Initially telecommunications was
under one umbrella with the postal service and telegraph services. Government was the only
player in the market through the Post Office, which was 100% owned by the government for
many years. The telecommunications division was later transferred to a separate company which
was also initially wholly owned by government during the early 1990s (Vodazone, 2013).

15
Major political changes in South Africa ushered in a new era of regulatory reforms, as well as the
internationalisation of the telecommunications industry through market liberalisation. This was
achieved through the partial privatisation of Telkom by the Government and by the further
enactment of the Telecommunications Act of 1996 (Taka, 2001:5).
Around 1993, further efforts to liberalise and privatise the market saw two new entrants -
Vodacom and MTN. Both companies introduced GSM (Global System for Mobile) wireless
cellular telephone technology (Vodazone, 2013).
Telkom, in its annual report for 2000 (cited by Taka, 2001:7), stated that the partial privatisation
brought about a much needed cash injection into the economy. Apart from the financial injection,
further benefits were realised such as upgrading of telecommunications infrastructure and
services, including digitisation; technologies such as digital enhanced cordless
telecommunications (DECT); and moving to packet-switching technologies that saw the
digitisation of the network (Taka, 2001:7).
The telecommunication market has since grown tremendously, with the cellular phone market
sitting on 76% usage in 2010. Other technologies in the South African telecommunications
market include fixed line, mobile, satellite and broadband (SA info reporter, 2012).
In recent years, connectivity and mediums of communication have been diversified through the
undersea cables that have now landed on the east and west coasts of South Africa. Thousands
of kilometres have also been laid across the country by the government through its company,
Broadband Infraco (SA info reporter, 2012).
The South African telecommunications market is the largest in Africa in terms of fixed lines,
mobile subscribers, data service users, financial revenues, investment, technological capability
and local design and manufacturing capabilities. Several milestones enabled the growth of the
market, such as the Telecommunications Act of 1996 which made way for a second network
operator (SNO) to compete with Telkom, and the awarding of the third cell phone license in 2001
(Mbendi Information Services, 2013).
South Africa employs the latest technology in the market with a network that is 99.9% digital and
includes the latest in wireless and satellite communication. The local IT industry is characterised
by technology leadership, particularly in the field of mobile software and electronic banking
services. This puts South Africa as the country that has the most developed telecoms network in
Africa (SA info reporter, 2012).

16
2.2.2 Information Technology and computers
The Oxford Dictionary of Current English (1998:171) defined a computer as ―an electronic device
that is used for processing and storing data with capability to make calculations and control other
devices‖.
Computers have - like many other machines - gone through a series of advancements, and have
evolved to be one of the most utilised devices in the world - similar to cars and telephones. One
of the strengths of computers is the ability to do complex and arithmetical computations and
calculations at very high speeds.
According table 2.2, the computer is now an old invention, with over 30 years of commercial
existence. However this technology has revolutionised the way mankind works and how
companies go about their daily operations. Companies now use computers to communicate, to
process information and data and to control systems and machines.
It is also interesting to note that a technology like email was first tried and used in the early
1970s; however its prevalence and adoption came many years later.
Computers have greatly increased productivity and improved efficiency; today computers are
indispensable tools that almost every employee uses in one way or another to discharge their
duties.
Evolution of computers
1960 - AT&T designed its Dataphone, the first commercial modem, specifically for
converting digital computer data to analogue signals for transmission across its long
distance network. Outside manufacturers incorporated Bell Laboratories´ digital data sets
into commercial products. The development of equalisation techniques and bandwidth-
conserving modulation systems improved transmission efficiency in national and global
systems.
1971 - The Kenbak-1, the first personal computer, was advertised for $750 in Scientific
American. Designed by John V. Blankenbaker using standard medium-scale and small-
scale integrated circuits, the Kenbak-1 relied on switches for input and lights for output
from its 256-byte memory. In 1973, after selling only 40 machines, Kenbak Corp. closed
its doors. The first e-mail is sent. Ray Tomlinson of the research firm Bolt, Beranek and
Newman sent the first e-mail when he was supposed to be working on a different project.

17
Tomlinson, who is credited with being the one to decide on the "@" sign for use in e-mail,
sent his message over a military network called ARPANET. When asked to describe the
contents of the first email, Tomlinson said it was ―something like "QWERTYUIOP"‖
1981 - IBM introduced its PC, igniting a fast growth of the personal computer market. The
first PC ran on a 4.77 MHz Intel 8088 microprocessor and used Microsoft´s MS-DOS
operating system.
1984 - Apple Computer launched the Macintosh, the first successful mouse-driven
computer with a graphic user interface, with a single $1.5 million commercial during the
1984 Super Bowl. Based on the Motorola 68000 microprocessor, the Macintosh included
many of the Lisa´s features at a much more affordable price: $2,500.
Apple´s commercial played on the theme of George Orwell´s "1984" and featured the
destruction of Big Brother with the power of personal computing found in a Macintosh.
Applications that came as part of the package included MacPaint, which made use of the
mouse, and MacWrite, which demonstrated WYSIWYG (What You See Is What You Get)
word processing.
1985 - The modern Internet gained support when the National Science foundation formed
the NSFNET, linking five supercomputer centres at Princeton University, Pittsburgh,
University of California at San Diego, University of Illinois at Urbana-Champaign, and
Cornell University. Soon, several regional networks developed; eventually, the
government reassigned pieces of the ARPANET to the NSFNET. The NSF allowed
commercial use of the Internet for the first time in 1991, and in 1995, it decommissioned
the backbone. The NSFNET initially transferred data at 56 kilobits per second, an
improvement on the overloaded ARPANET. Traffic continued to increase, though, and in
1987, ARPA awarded Merit Network Inc., IBM, and MCI a contract to expand the Internet
by providing access points around the country to a network with a bandwidth of 1.5
megabits per second. In 1992, the network upgraded to T-3 lines, which transmit
information at about 45 megabits per second.
1990 - The World Wide Web was born when Tim Berners-Lee, a researcher at CERN, the
high-energy physics laboratory in Geneva, developed HyperText Markup Language.
HTML, as it is commonly known, allowed the Internet to expand into the World Wide Web,
using specifications he developed such as URL (Uniform Resource Locator) and HTTP
(HyperText Transfer Protocol). A browser, such as Netscape or Microsoft Internet
Explorer, follows links and sends a query to a server, allowing a user to view a site.
Berners-Lee based the World Wide Web on Enquire, a hypertext system he had
developed for himself, with the aim of allowing people to work together by combining their
knowledge in a global web of hypertext documents. With this idea in mind, Berners-Lee

18
designed the first World Wide Web server and browser — available to the general public
in 1991. Berners-Lee founded the W3 Consortium, which coordinates World Wide Web
development.
Source: Computer History Museum (2006)
2.3 Theory of strategy formulation and strategic management frameworks
2.3.1 What is strategy?
There are different ways of defining strategy as there many types of strategies. According to
Grant (2008:14), strategy ―is the overall plan for deploying resources to establish a favourable
position‖.
Defined differently, a company‘s strategy ―is management‘s action plan for running the business
and conducting operations. The crafting of a strategy represents a managerial commitment to
pursue a particular set of actions in growing the business, attracting and pleasing customers,
competing successfully, conducting operations, and improving the company‘s financial and
market performance‖ (Thompson, Strickland & Gamble, 2010:4).
Strategy serves a number of purposes in organisations. One of them is to enable management to
make conscious decisions on how the company wants to be positioned in a particular market,
which its clients will be and how favourable its position will be in respect of its competitors.
Grant (2008:19) defined two main levels of strategy as:
Corporate strategy – this portion of strategy seeks to define the scope of
the company in terms of the industry and markets in which the company
competes.
Business strategy – is concerned with how a company should compete
within a specific industry.
A third level of strategy can be defined as the functional (internal unit) strategy which relates to
the operational or functional tasks within an individual business unit or firm (Boojihawon & Segal-
Horn, 2006:32).
This study will focus on the strategy of a government-owned company in the ICT industry;
therefore the main emphasis will be on business strategy, and to a lesser extent, corporate and
functional strategy.

19
At the centre of competition in any industry are resources. Companies compete for resources
such as human resources; finances; locations (sites and buildings); levels of ICT capacity and
capability; ideas and innovation; suppliers; governmental, regulatory, community and media
support; and goodwill (Boojihawon & Segal-Horn, 2006:20).
Figure 2.1: Strategy as a link between the company and its environment
Source: Grant (2006:12)
Strategy is a link between a company and its environment. The company deploys its limited
resources through the use of its capabilities and is supported by its structure and systems to
achieve pre-defined goals, objectives and values. The strategy serves as a bridge for the
company to channel all the endeavours cited in the prior statement to offer its customers a
service that is superior to that of its competitors, through the help of its suppliers (Grant,
2006:12).
2.3.2 Strategy formulation process
A logical and analytical process precedes a detailed and comprehensive strategy. The strategic
process is therefore an iterative process that involves cycles of continuous review.
THE FIRM
Goals and
values
Resources
and
capabilities
Structure
and systems
THE INDUSTRY ENVIRONMENT
Competitors
Customers
Suppliers
STRATEGY
Technology
People

20
Figure 2.2: Strategy formulation process
Source: Adapted from Boojihawon and Segal-Horn (2006:6)
Figure 2.2 indicates the three main process areas of strategy formulation:
Analysis – This involves an objective assessment of the organisation and
its environment.
Choosing – The formulation and selection of activities and objectives that
ensure maximum return for the organisation.
Implementation - Execution of the chosen plan, path and pattern of
activities.
Strategy is therefore a tool that assists companies to best understand the environments within
which they operate. Further to this, it is a decisive way of choosing a path for the organisation,
thereby making conscious decisions that ensure that its objectives and mandate are achieved.
This assertion is further strengthened by Grant (2008:4), who said that strategy is not a detailed
plan or programme of instructions; it is a unifying theme that gives coherence and direction to the
actions and decisions of an individual or an organisation.
Successful strategies inherently possess the following four main characteristics and attributes:
Goals that are simple, consistent, and long term.
Profound understanding of the environment.
Objective appraisal of resources.
Effective implementation.
Analysing
Choosing Implementing

21
The unifying thread for a successful strategy that in turn ensures a successful company,
therefore, lies in the implementation of all strategic endeavours. Effective marshalling of
resources and capabilities, as well as quick responses to changes in competitive environment, is
therefore important.
It is thus critical for companies to be agile and responsive; hence the main thread of this study is
to devise a framework that will allow ICT parastatals to rapidly adapt to changes in technology
and the environment.
Segal-Horn (2004:41) further stressed that companies must continuously benchmark to achieve
best practice, claiming that positioning is no longer the mainstay of strategy as it is deemed to be
too static for today‘s dynamic markets and changing technologies.
2.3.3 The role of strategy
Grant (2008:26) identified three main goals of strategy, namely:
Decision support – strategy improves decision making by:
o limiting the range of ideas and alternatives
o integrating or pooling different knowledge and skills
o making use of analytical tools, frameworks and techniques
Coordinating device – the great challenge of coordinating different
resources and stakeholders of varying degrees of influence and interest
can be made easy through the use of strategy in the following ways:
o Strategy can be used as a communication tool by senior and
executive management.
o Through the strategic planning process, buy-in from different
stakeholders can be created
o Implementation of goals and targets set as a result of strategy
formulation
Target – strategy in its basic form is forward looking and therefore helps
companies to focus and to set targets.
o Target motivated employees and all stakeholders to achieve
defined goals

22
2.4 ICT strategic pillars
According to Booyse (2011:12), company strategy is dependent on a structure, which in turn is
built on four broad pillars as depicted in Figure 2.1, namely:
o People
o Processes
o Technology
o Architecture
The following sections examine these pillars individually to see how they affect a company‘s
strategy, and also how they tend to shift in reaction to the changes in both the company‘s internal
and external environments.
2.4.1 People
What is company structure?
Generally speaking, the shape and form of a body or structure follows the pattern of its primary
underlying formation, for example the human body takes and follows the form and shape of its
skeleton. The same analogy can be adopted for companies. The organisational form or structure
can be taken as the skeleton, while the different divisions within the company are comparable to
the different systems in a human body, like the respiratory or nervous system.
Whittington (2003) (cited by Boojihawon, 2006:9) defined organisational structure as the way in
which a company‘s activities and members work together to achieve its goals. It tells you who
has a particular level of authority, who reports to whom, who holds which resources, who liaises
with whom, what the limits of authority are, what career paths are available, and how knowledge
flows within the organisation.
The structure and form of an organisation has strategic importance as it determines and affects
the scope to interact with its environment and fulfil its strategic purpose, as well its ability to
operationalize (Millmore et al., 2007).
The design of the organisation‘s structure and management thereof are key components of
strategy implementation, therefore it follows that strategy design cannot be separated from its
implementation. Although there are differing theories about whether strategy follows structure or

23
vice versa, it has been concluded that both structure and strategy are closely related and
dependent on each other (Grant, 2008:170).
2.4.1.1 Forms of company structure
Throughout the years, different company structures have been formulated and evolved.
Increased scope and complexity led to the creation of matrix company structures that organise
their human resources around products, functions, geographical area, etc. (Grant, 2008:174).
There are three basic organisational forms:
o Functional structure
o Multi-divisional structure
o Matrix structure
Common among all structural forms are bureaucracy and reporting or approval lines. In pursuit of
flexibility and responsiveness, the modern company then resorted to delayering hierarchies. This
in turn created responsiveness through alliances, networks and outsourcing partnerships. The
structure of a company arranges how employees interact, control and perform their duties. This
arrangement of people into a structure is therefore critical, which is why it does not matter how
great the specialist skills possessed by individuals are; unless their efforts are coordinated, no
production can occur (Grant, 2008:176).
In determining how to group employees in a company, there are four major factors to consider as
the basis for such a grouping or association (Grant 2008:184):
o Common tasks
o Products
o Geography
o Process
In order to choose which criteria to use in grouping human resources, a determination should be
made that the individuals whose tasks require the most intensive coordination should work within
the same organisational unit.

24
2.4.2 Processes and systems
Management systems and organisational structures have close and interlinked relationships, like
the skeleton and systems of the body. In this analogy the structure is the skeleton, whereas the
management systems are similar to the body‘s systems, such as the respiratory system, nervous
system, etc.
Grant (2008:192) described four categories of management systems in organisations as:
o Information systems
o Strategic planning systems
o Financial systems
o Human resource systems.
According to Boojihawon (2006:37), company systems can be further classified into two broad
categories as either:
o Operational systems – the mechanisms and working practices and
routines that direct the efficient use and deployment of resources
and capabilities.
o Control systems – those mechanisms that monitor the achievement
of strategic goals.
2.4.3 Technology
The ICT industry is one of the industries wherein new technologies and the application thereof
are sources of competitive advantage. New technologies and practices are a result of innovation
and creativity.
Innovation plays a major role in transforming an industry as it changes the way that business is
done or how customers interact or perform certain ways. This happens because once a product
or service has been innovated, it is then diffused both on the demand side (customers buying the
good or service) and supply side, where competitors copy the product. It is important to note that
innovation does not always lead to profitability. The latter depends on the value created by the
innovation and the share of that value that the innovator is able to appropriate (Grant, 2008:291).

25
Table 2.2: Comparing operating versus innovating companies
Operating Company Innovating Company
Structure Bureaucratic. Specialisation
and division of labour.
Hierarchical control. Defined
organisational boundaries.
Flat organisation without
hierarchical control. Task
oriented project teams.
Fuzzy organisational
boundaries.
Processes Emphasis on eliminating
variation (e.g. six-sigma).
Top-down control. Tight
financial controls.
Emphasis on enhancing
variation. Loose controls to
foster idea generation.
Flexible strategic planning
and financial control.
Rewards systems Financial compensation,
promotion up the hierarchy,
power, and status symbols.
Autonomy, recognition,
equity participation in new
ventures.
People Recruitment and selection
based on the needs of the
organisation structure for
specific skills: functional and
staff specialists, general
managers, and operatives.
Key need is for idea
generators that combine
required technical
knowledge with creative
personality traits. Managers
must act as sponsors and
orchestrators.
Source: Grant (2008:313)
Table 2.3 provides a contrast between operating companies and innovating companies. The
significant differences are notably that:
Innovating companies have a flat structure that takes away much of the
bureaucracy found in traditional operating companies.
The innovative culture is fostered in the way the processes are designed.
Compensation of traditional operating companies is the sole method of
reward.
Innovating companies look out for individuals with the capacity and drive to
innovate.

26
2.5 Convergence
ITU (cited by Gillmore, 2003:16) defined convergence as ―technological, market or
legal/regulatory capability to integrate across previously separated technologies, markets or
politically defined industry structures. Convergence also involves an important international
component, as many services and information sources that were traditionally controlled on a
domestic level are being provided on a global basis".
2.5.1 Technical and market convergence
The concept of convergence in ICT has been driven by technological revolutions such as
digitisation and market forces. Convergence can be technology or market-related. The other
concept driving this digitisation of information and the transmission thereof across
combinations of audio, visual and data platforms, is that of efficiency (Gillmore, 2003:16).
Convergence brings about the integration of networks, services and content through
digitisation, which make the transmission of content from historically distinct platforms
possible. The main challenge to convergence is the adaptability of the various platforms.
(Gillmore, 2003:17)
One of the main benefits of convergence is that various services can be transmitted more
efficiently across a variety of networks. This, in turn, has had the effect of stimulating and
enhancing further competition.
Similarly, in South Africa the promulgation of the Electronic Communications Act No. 36 of
2005 (ECA) gave rise to convergence-based IT and telecommunications services being
offered in the market, and more recently fixed mobile convergence based solutions
(Department of Communication, 2012:16).
Table 2.3: Convergence and integration
IT Telecom Broadcasting Other media
Content/service Software
based
content
Telecom based
services and
content
Broadcast
programmes
Film, music,
newspapers, etc.
Transport/
software
Generic
software
Network services Transmission Cinemas, video
rentals, etc.

27
Equipment/
hardware
Hardware
Telecom
equipment
Broadcast
equipment
Reproduction of
films, printing, etc.
Source: Gillmore (2006:17)
Table 2.4 shows the vertical as well as the horizontal integration of markets. A good example
of horizontal integration is the mobile Internet services that are transmitted on traditional
telecoms carrier networks. Multi-media videos are also now broadcast via telecom networks.
2.6 Legislative environment
South Africa is a democratic country. As such, it has a Constitution that governs all affairs within
the boundaries of the country. The government departments (all three tiers), public institutions
and bureaucratic institutions are subject to the laws of the country. The Constitution provides
guidelines on the regulation of public funds in sections 213 and 215 to 219 (Madue, 2007:307).
Several key pieces of legislation have been developed to bring into existence some of the
government agencies and public institutions, as all parastatals are subject to the laws of
government. One such law that is applicable to all public institutions is the PFMA (Public Finance
Management Act).
2.6.1 PFMA
The objective of the Public Finance Management Act (1 of 1999) is to regulate financial
management in the national government and provincial governments; to ensure that all revenue,
expenditure, assets and liabilities of those governments are managed efficiently and effectively;
to provide for the responsibilities of persons entrusted with financial management in those
governments; and to provide for connected matters.
The PFMA was meant to bring in a standard approach to financial management and control of
public funds. In complying with the PFMA, government departments and public institutions in turn
have to comply with International Financial Reporting Standards (IFRS) (Madue, 2007:317).
2.6.1.1 Challenges of PFMA
In order to bring effect to the Act, regulations for the PFMA have been set up which give specific
guidelines on how it must be implemented. In addition, a financial management regulatory
vehicle was created in the form of Treasury Regulations, which were promulgated and came into
effect in June 2000. These regulations cover aspects such as internal control measures,
28
planning, budgeting, asset management, cash management, accounting and reporting (Madue,
2007:317).
The PFMA stipulates several requirements in the areas of preferential procurement, Black
Economic Empowerment (BEE) and supply chain management in general. These regulations
often constrain public institutions in terms of approvals that they need to get should they deviate
from the normal standards set out. These approvals from treasury are long, drawn out processes,
which limit the speed of these institutions to deploy resources or to react to market changes.
Often the challenges that the PFMA brings affect service delivery directly. In its submission in
2012 to the National Council of Provinces (NCOP), the Financial and Fiscal Commission (FFC)
raised the following shortcomings of the PFMA as well as recommendations (cited by Nhlabathi,
2012):
The Constitution and the PFMA are not explicit in prescribing interventions
necessary to maintain national and minimum service delivery standards.
Some problems are because the revenue resources cannot be stretched to
meet the expenditures mandated by the Constitution and demanded by the
people, while others are related to inefficient use and inappropriate
allocation of resources.
In resolving the dire state in which provinces are in, the commission
recommended the introduction of an early warning system, making the
PFMA more explicit by setting out criteria to determine serious financial
problems - with clear measurable factors of what leads to departments'
inability to executive financial obligations.
The commission said that at present, politicians and bureaucrats could not
be easily held responsible for their deeds and that lines of accountability
were blurred across the three spheres of government.
It also suggested the setting of clear norms and standards for the
performance of provincial treasuries in order to reinforce authority to
exercise their functions without undue interference when implementing
provincial budgets.
In order for parastatals to discharge their mandate with minimal delay and hindrance due to
observing the PFMA and treasury regulations, it is recommended that the parastatals employ
compliance strategies and plan in advance. This will ensure that all processes such as
procurement of goods and services will be done in time and will also be properly budgeted for.

29
Madue (2007:311) suggested that strategic plans covering a period of three years should be
developed in line with the Medium-Term Expenditure Framework (MTEF), and should indicate
measurable objectives, well-defined outcomes and key performance measures and indicators.
The compliance strategy must be done in line with the requirements of the PFMA and other
related legislation for the respective parastatals. There are different levels of autonomy that are
stipulated in the PFMA, for example Schedule 2 - which covers the major public entities - confers
maximum autonomy to these entities, while Schedule 3 - which covers all the other public entities
- confers lesser degrees of autonomy (Treasury, 2013).
2.6.2 Policy Framework
The South African Telecoms and ICT market is well developed. Statutory control and oversight is
exercised through the Department of Communications (DoC) and government agencies such as
the Independent Communications Authority of South Africa (ICASA).
The objective and mandate of ICASA, as spelled out in its entirety in the Electronic
Communications Act, is to license and regulate the electronic communications and broadcasting
services, and by the Postal Services Act for the regulation of the postal sector (ICASA, 2013).
According to the 2013 Global Information Technology Report, South Africa is ranked as one of
the countries with the best regulatory and legal framework for ICT. In the report South Africa was
ranked 21st out of the 144 countries that were surveyed. While this is good for South Africa,
much work still needs to be done in the area of ICT infrastructure, where the country ranks only
70th. Further work also needs to be done to promote ICT within government and in the country
as a whole. Numerous opportunities lie in the provision of ICT services to government; South
Africa ranked poorly at 102nd for government‘s usage and promotion of its ICT policy in the
country (World Economic Forum, 2013:261).
Much as the country‘s regulatory frameworks are in place, there are serious challenges on the
implementation side due to a lack of a national ICT policy. Government is failing to provide the
leadership required to promote and implement a national ICT policy (Business Tech, 2013), and
the unfortunate result of this lack of policy has many unwanted and dire consequences. These
include:

30
The absence of a national policy has led to sectorial or departmental
initiatives being created.
South Africa has dropped in the rankings from being in the thirties about 10
years ago.
There is no direction on how technology should be deployed and a lack of
alignment.
South Africa is now lagging behind Kenya, Ghana, and Nigeria in terms of
attracting investment and industry with technology.
(Tullet, 2012)
Against the backdrop of the above, a policy colloquium was hosted by the DoC in collaboration
with all industry stakeholders in April 2012. Subsequently, the DoC, in a recent presentation to
parliament, listed the following five priorities for its ministry as broadband, broadcasting digital
migration, e-skills, the successful launch of Postbank, and an information and communications
technology (ICT) policy review (Fairweather, 2013). This process was followed by an ICT Policy
Review Framing paper which was launched by the DoC in April 2013 In order to bring effect to
the policy review, the former Minister of Communications (Ms Pule) announced that a panel had
already been appointed and is currently reviewing the ICT policy, which will yield a white paper
by the end of the 2014/15 financial year (SA News, 2013).
2.7 Future trends
2.7.1 Quantum computers
As late as 2010, quantum computers were still being conceived as technology that was only
expected to be available around 2015. In his article, Rouse (2010) defined a quantum computer
as a hypothetical computer that performs calculations based on the behaviour of particles at the
sub-atomic level. This ‗super computer‘ was expected to have exponentially greater processing
capability, and that this growth in processing power was attributable to the fact that the data units
in a quantum computer, unlike those in a binary computer, can exist in more than one state at a
time. In a sense, the machine "thinks" several "thoughts" simultaneously; each "thought" being
independent of the others even though they all arise from the same set of particles (Rouse,
2010).

31
Quantum theory was initially presented in the early 1900s by Max Planck to the German Physical
Society. Further developments through the years were relatively slow, but greater momentum
was fuelled by the work of Paul Benioff at Argonne National Labs in 1981, and later by David
Deutsch of Oxford University, who provided the critical impetus for quantum computing research
in 1984 (Rouse & Pawliw, 2010:2).
Computer speed and processing power is ever increasing. Moore's Law states that the number of
transistors on a microprocessor doubles every 18 months. With this in mind, it is predicted that by
the year 2020 or 2030 the circuits on a microprocessor will be measured on an atomic scale.
Hence the logical next step will be to create quantum computers, which will harness the power of
atoms and molecules to perform memory and processing tasks (Bonsor & Strickland, 2013:1).
Quantum computers are no longer imagined hypothetical future technologies; they exist and
Google as well as Lockheed Martin have bought quantum computers that have been
manufactured by D-wave (Metz, 2013:1).
In June 2013, the British Broadcasting Corporation (BBC) revealed that according to the Linpack
benchmark, Tianhe-2 - meaning Milky Way-2 - operates at 33.86 petaflop/sec, the equivalent of
33,860 trillion calculations per second. This leaves the Tiane as the world‘s fastest computer,
ranked number one on the list of the 500 fastest computers. This is incredibly fast and
sophisticated, and it is also worth noting that such a machine was only expected to be made
available after 2015. The leading countries in the top 500 machines are China, America, Japan
and Germany (BBC, 2013).
2.7.2 Future networks
Currently, network operators have built their own autonomous network infrastructure throughout
South Africa; the mix of both wireless and fixed line types of networks adorns the landscape of
our telecommunications sector in South Africa. Following market liberalisation the country has
also seen a trend towards self-provisioning, with the mobile operators joining forces to build their
own fibre optic network that is expected to be approximately 5000km (Muller, 2009).
The current broadband network business model is based on network operators supplying their
physical infrastructure to service providers and end users at a fee (Miyajima, 2005:203).
The need for speed and high capacity is inevitable in South Africa; as more and more users
subscribe to broadband services, network providers will have to make provision for more

32
capacity. The user applications also require high speed and high capacity. As a result of
convergence, networks now carry voice, data, video and other media on a single physical
medium and platform. This brings new requirements for converged networks that are different
from the traditional networks. The requirements are listed in Table 2.5.
Table 2.4 Future requirements of converged networks for both the access and core
network services
Access network trends Core network trends
More bandwidth in access network
Shift from ADSL to FTTH
Ease of installation
Rapid deployment
IP based telephone services
Traffic increase in metro/core area
Systems of at least 40 Gbps capacity
Optical path control systems (GMPLS)
Source: Miyajima (2005:210)
The access networks will need more capacity, for example the government has to comply with an
international deadline to move to Digital Terrestrial Television (DTT) (Jones, 2010). This means
that in future, operators will need video streaming capabilities and capacity.
There is also a drive to improve tele-density in rural areas by 2015; countries with a mobile rural
population coverage of over 90% include the Comoros, Kenya, Malawi, Mauritius, Seychelles,
South Africa and Uganda, which should meet the WSIS target of village connectivity ahead of
schedule (ITU, 2007:8).
South Africa is ranked 4th in terms of both fixed line and mobile penetration (ITU, 2007:9). It is
also noteworthy that South Africa is ranked 6th in terms of internet penetration (ITU, 2007:12).
From these statistics and in comparison with trends in the rest of Africa and the world, it is clear
that South Africa is set for yet more rapid growth of the ICT sector, particularly in the area of
mobile broadband.
According to Tingye (2011:5), telecommunications traffic was dominated by data traffic from 2008
to 2010. This trend is set to continue, and given that the South African trends follow those of the
rest of the world, one can expect demand for data to grow in South Africa in the coming years.
33
Below are some of the trends:
Internet traffic continues to dominate (~50-70% annual growth)
Streaming video traffic becomes significant
New global (non-telecom) enterprises appear (e.g. Google, YouTube, etc.)
Aggressive competition from non-traditional and new players
Revenue from traditional telecom services continues to decline
Wireless business expands and thrives
Carriers build broadband access (FTTX) networks
Carriers must upgrade their networks to accommodate the large and
growing traffic demand (e.g. YouTube traffic on a typical day is
greater than 1,100 TB, averaging to >100 GB/s)
Carriers must seek new services to boost their revenue stream
2.7.3 Future Internet connectivity
Communication methods and means have evolved and changed drastically in the new
millennium. The increase in demand for mobile devices, as well the influx of smart phones and
devices, has revolutionised the way people communicate and interact. All of this was made
possible in the main by the internet, which forms the basis of connectivity embedded in the
physical infrastructure (in most cases fibre optic cables).
According to the Ericsson White Paper on Preparing for the Future of Communication
(2012:2), the rapid transformation and innovation poses a potent challenge for telecom
operators, because these developments threaten to weaken their relationships with consumers
and diminish the revenue generated by their legacy telephony businesses. The report further
asserted that the telecommunications industry is being fundamentally disrupted by services that
have quickly adopted and adapted to new internet technologies, and as a result the following
broad business areas will be affected:
Consumer
o An open technology will ensure innovation and rapid growth. Open
technology is one with the ability for constant improvement and
evolution through community-based involvement and knowledge
sharing, such as open source software.

34
o Through the use of the many different applications, consumers can
have multiple digital personas depending on the motive and context
of the communication.
o Power is shifted to the user due to the interactive nature of
applications.
Enterprise
o The change in ways of communicating presents a business
opportunity. While the demand for pure telephony services is on a
decline, there is a high demand for IP-based communication. There
is further opportunity in disruption, because as a result of all the
new services on offer, consumers are now spending more money
on telecoms.
o The ability to charge for consumer-oriented communication
services is likely to decline gradually over time, and as a result the
consumer will place a high premium on communications
infrastructure and systems that are low cost, easy to use and the
bundling of access offerings.
o Equipment providers and telecom operators will have to collaborate
in future with enterprise clients and Small and Medium Enterprises
(SMEs) to tailor make communications solutions.
o Innovation will drive business.
o Current and future trends indicate that the line between work and
personal communication has become blurred and this can be
attributed partly to the massive uptake of – and love for –
smartphones.
In-line
o Growth areas will be beyond the traditional communications
markets.
o Operators will need to look at utilities, agriculture and health care
for growth opportunities.
o Simplicity, speed and performance will be the key aspects of the
value proposition.

35
2.7.4 Telecommunications
The telecommunication landscape in general has been through a series of revolutions. The most
disruptive has been the introduction and commercialisation of cellular phone services into the
industry. The IBM Telco 2015 Report (2010:1) affirmed that the telecommunications industry has
experienced more change in the last ten years than during any other era in its entire history of
more than a century. In 1999, only 15% of the world‘s population had access to a telephone; by
2009, nearly 70% of the population had mobile phones. However despite the rapid growth in the
mobile communications, there has been a sharp decline in voice revenues at traditional Public
Switched Telecommunication Networks (PSTN).
The IBM Telco 2015 Report (2010:2) predicted that the following four scenarios, together with
their characteristics, are likely to portray the telecoms landscape in early 2015:
Survivor Consolidation – due to revenue stagnation, especially in developed markets,
companies will tend to consolidate in order to compensate for their cash flow crisis. If
telecommunications companies need to survive then they must diversify and consider new
growth markets - either vertically or horizontally.
Market Shakeout – investors tend to force companies to disaggregate and split
telecommunications companies into different units, which offer contrasting services that have
varied degrees of return. This would normally turn out as a result of a prolonged lack of income
during an economic downturn. Government in this case can play a vital role, specifically by
focusing on the grey areas of the market, such as rural and underserviced areas, while the
private sector - in pursuit of better profits - will focus on the densely populated urban areas.
Clash of Giants – in this scenario, greater financial muscle can be realised through collaboration
amongst traditional operators in order to fight OTT (over the top) providers such as VOIP (voice
over Internet Protocol).
Generative Bazaar – the line between OTT and network providers gets blurred as regulation,
technology and competition drive open access. As a result, infrastructure providers will tend to
integrate horizontally to form a limited number of network co-operatives that provide pervasive,
affordable and unrestricted open connectivity to any person, device or object, including a rapidly
expanding class of innovative, asset-light service providers. This is the likeliest and most wanted
scenario that can ensure greater return to the investor and long term sustainability of the sector
as a whole.

36
2.8 Conclusions
Although the legislative and policy framework in South Africa is ranked among the best in the
world, much needs to be done to bring the National ICT policy to fruition. This policy will bring
much needed direction and alignment to the various government departments and the private
sector at large. The current multiple projects by the various departments are symptoms of a
system that is failing, and have resulted in inefficiencies in government. A good example is the
delay in the roll out of DTT.
Apart from the legislative framework, there is also the commercial and business side of the ICT
sector. The shape and form of the ICT sector can be attributed to market forces that have played
out in South Africa‘s free market system. Market liberalisation, for example, was a result of a
global trend to privatise public utilities and legacy telecoms networks, and was also fuelled by a
drive to bring in efficiencies by making use of existing facilities such as the national power grid for
communications. The political changes led to the adoption of policies and legislation that
advocated for universal access to ICT services, the unbundling of Telkom and the introduction of
mobile telecommunications into the market.
As a business tool which is used to craft a way forward to ensure a company‘s sustainability,
profitability and favourable market position, strategy can never be cast in stone. A continuous
assessment and analysis of the environment is essential; the analysis must take into account
Porter‘s five forces and the political, economic, social and technological factors. The main focus
of this study and this chapter was to focus on the technological aspect and all related variables.
The author concludes that the telecommunications and ICT industry in general is generic, due to
deeply entrenched standardisation through organisations such as ITU. Generally, Africa and the
developing nations tend to follow the developed nations‘ trends, however they must be adopted
with due consideration of the local socio-economic, socio-political, economic and regulatory
factors.
2.9 Summary
The aim of this chapter was to look into the theory of strategy formulation and implementation in
the ICT sector. Further, the chapter sought to look into all factors and variables that determine a
successful and responsive ICT strategy. In doing so, aspects relating to the legislative framework
of South Africa were looked at, and in addition, future trends in IT and telecommunications were
explored. Through a literature study of available material on the world‘s telecommunication

37
trends and developments in developed nations, a framework will be developed that is specific
and unique to the South African state-owned company‘s landscape.
The common and underlying thread in the modern day ICT environment is the concept of
convergence. Almost all ICT mediums and platforms are now interoperable and the trend is
growing towards even greater integration of the various technologies. The main driver for such is
the market demand by consumers who need mobility and flexibility, as well as applications with
high capacity demands on the one hand and the need for companies and telecommunications
operators to be more efficient on the other. Convergence delivers this benefit of efficiency within
the market and stimulates competition. Innovation and creativity continue to be the driving force
behind the technological evolutions in the ICT sector.

38
3 CHAPTER 3: EMPIRICAL STUDY
3.1 Introduction
The main objective of this study was to create a comprehensive ICT strategic framework for
parastatals. In this chapter, the study will focus on obtaining key information via a questionnaire
from the relevant professionals in the ICT sector, ranging from executives to management and
lower level employees. This chapter will assist in reaching firm conclusions regarding the factors
and drivers that have a direct bearing on strategy in the ICT sector, as well as the mechanisms
for the adoption of strategy to rapid changes in technology and the ICT landscape.
This chapter will also discuss the scientific approach that was used to identify the population
group, as well as the methodology employed to gather data. The academic basis for all the
approaches and decisions taken in putting together this report is also discussed.
The chapter concludes with a detailed discussion of the findings from the questionnaires.
3.2 The research design and method
Hofstee (2010:120) enlisted numerous approaches to conduct research, such as extended
literature reviews, case studies, comparative analyses, survey based research, etc. This study is
a combination of a literature review and survey based research. This chapter focuses on the
latter, whereas chapter 2 focused on the literature review. The survey was done by means of a
questionnaire.
The table below lists possible errors that may occur with surveys and questionnaires. The author
paid careful attention to the aspects listed below and due consideration of these was given during
construction of the questionnaire.
Table 3.1 Common errors of questionnaires and surveys
Common errors Elaboration
No piloting or pre-testing It is important to pilot and test the survey
or research instrument. For the purpose
of this research no pilot was conducted
due to financial as well as time

39
constraints.
Ambiguous or vague items The survey questionnaires must not
contain vague aspects or
words/statements.
Careful consideration was made in this
research to make use of close-ended
questions. Open-ended questions were
however used as well in order to extract
more information, especially with regard
to suggestions from respondents.
Double-barrelled questions Research questions must not contain
questions that contain more than one
question.
For this research such questions were
avoided, i.e. single straightforward
questions were used to extract a precise
answer or piece of information.
Leading questions The questionnaire must not ask leading
questions.
Such questions were totally avoided in
this research.
Layout and length of instruments The layout of the questionnaire or
research instruments used must be
simple and not confusing and it must
also not be too long.
This research used a simple layout that
just required respondents to click on the
most appropriate answer. The length of
the questionnaire was also limited to 10
minutes‘ response time.
Sensitive or threatening questions Sensitive or threatening questions are
those that infringe on the personal
space and privacy of respondents.
These questions may lead to refusal to
participate.
The questionnaire shied away

40
completely from such personal
questions and focused mainly on the
core subject of ICT strategy.
Mono-operational bias. This entails
measuring constructs or phenomenon
using only single item or question.
It is advisable to have a scale or index
as a measuring tool where possible.
In this research answers were provided
on a scale where respondents gave
answers that were most appropriate or
were given the chance to strongly agree
or disagree.
Source: Mouton (2011:103).
3.2.1 Selection of population group
The study focused on companies that are wholly or partially owned by government and operate
in the ICT sector; therefore the surveys were conducted among the government‘s ICT
companies. According to the Department of Communications (2012:4), there are 11 government
agencies charged with an ICT mandate. The companies are:
Broadband Infraco
Sentech
SITA
ICASA
SABC
NEMISA
MDDA
Post Office
Post bank
USAASA
.ZADNA
3.2.2 Sampling method
It is impractical and uneconomical to involve all members of a population in research (Welman,
Kruger & Mitchell, 2005:55) - mainly due to the size of the population.
For similar reasons, this study selected a sample from the population of parastatals listed above.
In order for the study to arrive at strong conclusions, private sector companies in ICT were also

41
sampled and surveyed. The chosen samples for both parastatals and private companies are as
tabulated below:
Table 3.2 Sample of private and public organisations
Public sector Private sector
Broadband Infraco DFA
SITA E-TV
SABC MTN
Sentech IS
From each company a sample of 25 respondents was identified and the email with the link sent
to these respondents. The email request was sent to managers in the relevant departments and
where no manager contact was available; acquaintances were used to contact the relevant
authority. This put our total sample at two hundred. A total of ninety-eight (98) completed surveys
were received. This meant that the response rate was 49%.
3.2.3 Survey instrument
The study used an electronic survey questionnaire as an instrument to collect data from the
respondents. The questionnaire was developed from the literature. There were certain factors
and aspects that were spotted and deemed important in the literature review and these were then
selected for testing. The electronic online survey method was chosen because it requires less
effort from the respondent and is user friendly.
Questionnaires are a great tool for eliciting information from respondents who are deemed to
have the information required for research, however responses from a questionnaire can be
biased (Hofstee, 2010:132). Hofstee (2010:132) suggested that interviews can take one of the
following three forms:
1. Structured interview – this type of interview asks all respondents the same
questions and also gives them the same set of options for responses.
2. Unstructured interviews – these types of interviews ask different questions
of different interviewees and give respondents the freedom to answer as
they see fit.
3. Semi – structured interviews – digression in either the questions or
answers is allowed.

42
However, due to the limited time to conduct this study interviews were not conducted. However
as part of the questionnaire open ended questions were asked. This also prevented the
researcher from leading the respondents and ensured that the responses and information
gathered were as broad and unbiased as possible.
3.2.4 Data collection
The information was collected using an electronic survey tool called Fluid Surveys; emails were
sent to respondents with a link that took them to the questionnaire. The researcher assumed that
since all respondents had email addresses, they had fair and equal opportunity to access the
Internet. The respondents put their responses in and returned the feedback. A printed
questionnaire method may have been deemed by people in ICT as old-fashioned, as numerous
organisations are moving towards a paperless society. This method was therefore also in line
with companies‘ efforts to go green as there was no need to print papers.
The online system also allowed respondents to go back and finish the survey in case they left out
some questions. This feature gave the respondents control and also allowed them to respond in
their own time and from anywhere. There was no login required and therefore the identity of the
person was completely anonymous.
3.2.5 Limitations
The limitations identified for this study, which were in line with the methods employed, are as
tabulated below:
Respondents may not have given honest and objective answers.
Answers might have been biased.
The respondents needed access to the internet to have an email address
in order to receive the link.
The survey needed an internet connection and a computer in order to use
it.
It may have been difficult to get executives to make time in their busy
schedules to complete the questionnaire.

43
3.3 Results and discussion
3.3.1 Validity of Questionnaire
There are two common methods of deducing validity, namely:
Construct validity
o Exploratory factor analysis – this is an unsupervised method used to identify
underlying themes. No prior information is used to group questions into themes
o Confirmatory factor analysis – In this method one would have to include only
questions that are deemed to form one factor and then test if indeed only one
factor is extracted using exploratory factor analysis
Reliability
o Not a separate method, but complementary to the above. The method looks at the
scale on which a factor is measured.
Factor analysis is about taking the responses to individual question obtained through this
research and reducing it to a set of factors or underlying dimensions that is useful or important
(Field, 2009).
The main objective of factor analysis is to understand whether different questions are driven by a
common factor, and has three advantages (Field, 2009):
Understanding the structure of a set of variables (or questions)
Construct a questionnaire to measure an underlying variable
Reduce a dataset to a much more manageable size but keeping as much of the original
information as possible.
However as this study was exploratory in nature, the researcher felt that it would be
advantageous to retain as much information as possible. Furthermore, no prior information
regarding underlying dimensions was available. This implied that exploratory factor analysis
would be required for which the study did not produce a sufficient sample size.

44
3.3.1.1 Reliability
Questionnaires are used to measure certain data, opinion or constructs. These measurements
need to be verified and checked for consistency and validity. The method used is called reliability
testing. Reliability checks ensure that the questionnaire consistently reflects the construct that it
is measuring. Therefore all things being equal, a person should get the same score on the same
questionnaire even when taken on different occasions (Field, 2009:673). The measure in
statistical terms that is used to measure reliability is the Cronbach‘s Coefficient (Alpha). The
general rule is that the value of Alpha should be between 0.7 and 0.8, and any value that is lower
indicates an unreliable scale (Field, 2009:674).
However Alpha can be below 0.7, and according to Kline (cited in Field 2009:674) values of 0.8
are appropriate for cognitive tests such as intelligence tests, and for ability tests a reliable Alpha
drops to about 0.7. However for psychological constructs, values below 0.7 should realistically be
expected due to the diverse nature of the constructs being measured (Field, 2009:675).
The value of Alpha can also be a negative value. The reason for such an occurrence is that
certain questions can be negatively phrased, which means they are phrased in contrast to the
rest of the questions in a particular section. Such questions are necessary to limit response bias
because they force the respondent to read the questions if they are phrased differently from the
rest of the questions. The result is that such questions introduce a negative factor loading and
thus alpha becomes negative (Field, 2009:675). The calculation of Cronbach‘s Coefficient is
shown below:
Equation 1: Cronbach’s Coefficient
α = N²COV________________
∑S²item + ∑Cov item
Source: Field (2009:674)
Where n = number of questions and α is the Cronbach‘s Alpha Coefficient.
The top half of the equation is simply the number of items (N) squared, multiplied by the average
covariance between items (the average of the off diagonal elements in the aforementioned

45
variance–covariance matrix). The bottom half is the sum of all the item variances and item
covariances (i.e. the sum of everything in the variance–covariance matrix).
Table 3.3: Reliability Statistics for Section A of Questionnaire
Section A measured or tested factors related to technology and strategy. The Cronbach‘s Alpha
coefficient for section A was 0.69. This shows that this section of the questionnaire can be
deemed to be consistently measuring the constructs in question and therefore the section has
high reliability.
Table 3.4: Reliability Statistics for Section B of Questionnaire
Cronbach's Alpha
Cronbach's Alpha Based on
Standardized Items N of Items
.679 .699 10
Q9_1 Q9_2 Q9_3 Q9_4 Q9_5 Q9_6 Q9_7 Q9_8 Q9_9 Q9_10
Q9_1 1.000 .758 .692 .418 .192 .469 .321 -.129 -.143 .235
Q9_2 .758 1.000 .747 .440 .209 .444 .334 -.222 -.197 .322
Q9_3 .692 .747 1.000 .351 .250 .383 .304 -.055 -.038 .286
Q9_4 .418 .440 .351 1.000 .378 .484 .302 -.029 -.071 .172
Q9_5 .192 .209 .250 .378 1.000 .325 .096 .009 -.062 .082
Q9_6 .469 .444 .383 .484 .325 1.000 .321 -.093 -.117 .155
Q9_7 .321 .334 .304 .302 .096 .321 1.000 -.206 -.176 .422
Q9_8 -.129 -.222 -.055 -.029 .009 -.093 -.206 1.000 .706 -.303
Q9_9 -.143 -.197 -.038 -.071 -.062 -.117 -.176 .706 1.000 -.280
Q9_10 .235 .322 .286 .172 .082 .155 .422 -.303 -.280 1.000
Inter-Item Correlation Matrix
Reliability Statistics
Cronbach's Alpha
Cronbach's Alpha Based on
Standardized Items N of Items
.654 .667 4
Q10_1 Q10_2 Q10_3 Q10_4
Q10_1 1.000 .292 .405 .283
Q10_2 .292 1.000 .270 .228
Q10_3 .405 .270 1.000 .523
Q10_4 .283 .228 .523 1.000
Inter-Item Correlation Matrix
Reliability Statistics

46
Section B tested factors related to which sector they worked in. The Cronbach‘s Alpha coefficient
for section B was 0.67. This shows that this section of the questionnaire can be deemed to be
consistently measuring the constructs in question and therefore the section has high reliability.
Table 3.5: Reliability Statistics for Section C of Questionnaire
Section A measured or tested the legislative as well as human resource related factors. The
Cronbach‘s Alpha coefficient for section C was 0.661. This shows that this section of the
questionnaire can be deemed to be consistently measuring the constructs in question and
therefore the section has high reliability.
Given the exploratory nature of this study, the questionnaire was also structured in a manner that
sought a broad range of factors and issues that related to the formulation and execution of ICT
strategy in companies. As a result, the Cronbach‘s Alpha Coefficient of nearly 0.7 for all three
sections of the questionnaire is deemed high enough for the questionnaire to be deemed reliable.
3.3.2 Biographical information
Section A of the questionnaire covered the biographical information of the respondents. The
detailed biographical questions are found in the questionnaire in Appendix A.
Cronbach's Alpha
Cronbach's Alpha Based on
Standardized Items N of Items
.663 .661 9
Q11_1 Q11_2 Q11_3 Q11_4 Q11_5 Q11_6 Q11_7 Q11_8 Q11_9
Q11_1 1.000 .473 .209 .249 .222 .095 .071 -.109 .075
Q11_2 .473 1.000 .196 .108 .179 .193 .081 .024 .088
Q11_3 .209 .196 1.000 .038 .127 .075 .160 .001 -.062
Q11_4 .249 .108 .038 1.000 .479 .126 .205 -.022 .110
Q11_5 .222 .179 .127 .479 1.000 .444 .348 .388 .262
Q11_6 .095 .193 .075 .126 .444 1.000 .509 .413 .202
Q11_7 .071 .081 .160 .205 .348 .509 1.000 .453 -.087
Q11_8 -.109 .024 .001 -.022 .388 .413 .453 1.000 .093
Q11_9 .075 .088 -.062 .110 .262 .202 -.087 .093 1.000
Reliability Statistics
Inter-Item Correlation Matrix

47
3.3.2.1 Gender
Figure 3.2 depicts the gender split of respondents.
Figure 3.2: Gender split of respondents
There were more females that responded to this questionnaire. 53% (51) of respondents were
female whereas 41% (40) were male. The remainder of the 6% (7) of the respondents either
entered ‗gay‘ or ‗lesbian‘, however these were not captured as they are not official genders.
3.3.2.2 Age
The findings of respondents with regard to their age distribution are shown in Figure 3.3.
Figure 3.3: Age distribution of respondents
53%
41% Male
Female

48
The average age of respondents was 38 years (Standard Deviation (SD) = 8.51). The majority of
the respondents were between the age of 30 and 50 years (80%, 78 respondents). This
represents a fairly young workforce of between the middle to older age groups.
3.3.2.3 Sector of employment within ICT
Figure 3.4 below indicates the different sectors of employment of the respondents within ICT.
Figure 3.4: Respondents’ sector of employment
The majority of respondents were from the broadcast and media representing 37.9% (39),
followed by telecommunication sector at 36.8% (36). The IT sector was third, represented by
23.2% (23) of respondents working in this sector.
23.2
36.8
37.9
2.1
IT
Telecoms
Broadcast and Media
Other

49
3.3.2.4 Level of Employment
The questionnaire also sought to find the level of employment of the respondents. These results
are captured in Figure 3.5 below:
Figure 3.5: Respondents’ level of employment
The majority of respondents (27.4%, 26) were technical specialists. Managers were the second
highest category of respondents, whereas a small number of respondents (5.3%, 5) were in
executive leadership positions. This low turnout at executive level was expected as few people
occupy executive positions, and also by the nature of those positions, the executives are fairly
busy. The rest of the respondents were split between supervisors and team leaders. The majority
of the respondents to this questionnaire were from senior level to management staff,
representing (57.9%, 56).
3.3.2.5 Years of working experience in ICT
The number of years‘ working experience in ICT sector was also asked in section A. The results
are as shown in Figure 3.6 below.
5.3 10.5
24.2
5.3
12.6
27.4
14.7
Executive
Snr Manager
Manger
Supervisor
Team Leader
Technical Specialist
Other

50
Figure 3.6: Respondents’ years of experience in ICT
The histogram above shows the number of years‘ experience of respondents in ICT. The
average number of years‘ experience in ICT was 11 years (SD = 7.207). From this it can be
concluded that the respondents had a fair number of years‘ experience within their respective
sectors in ICT in order to form an opinion about the sector as required by the questionnaire.
There was one respondent who had a remarkably high number of years‘ experience at 42 years.
3.3.2.6 Highest qualification
Figure 3.7 below shows the level of education of the respondents.
Figure 3.7: Respondents’ highest qualification
8.4
52.6
33.7
5.3
Matric
Graduate
Post Graduate
Othe

51
The majority of respondents (52.6%, 51) were in possession of at least a Bachelor‘s degree; this
was regardless of years of experience. Respondents who had higher or post graduate
qualifications accounted for 33.7% (33). It was also interesting to note that in a technical sector
such as ICT, there was still a small portion that were only in possession of a matric certificate.
This number was fairly low at 5.3% (5). The remaining 8.4% (8) had other qualifications that were
not listed as options.
3.3.3 Analysis of Section A of the questionnaire
Table 3.6: Statistical results for Section A of the questionnaire
Number Question Strongly Agree (%) Agree (%) Disagree (%) Strongly Disagree (%) Number Missing Mean Std. Dev.
9.1
I use the latest version of software on my
work computer41.5 48.9 8.5 1.1 1.0 1.69 .672
9.2 Software is regularly updated in my company 35.1 43.6 20.2 1.1 1.0 1.87 .765
9.3 My company changes computers regularly 27.7 42.6 26.6 3.2 1.0 2.05 .821
9.4
I have easy internet access outside the office
(eg. Wifi)41.5 39.4 16.0 3.2 1.0 1.81 .820
9.5 I would like to own a smart phone 67.0 24.5 4.3 4.3 1.0 1.46 .771
9.6 I can easily access work emails from my 46.8 34.0 14.9 4.3 1.0 1.77 .860
9.7 Our company's ICT strategy is revised 19.1 37.2 29.8 13.8 1.0 2.38 .952
9.8
My company cannot keep up to new
technology and changes9.6 27.7 38.3 24.5 1.0 2.78 .929
9.9
My company cannot keep up to new
technology and changes in the market due to
long term outsource agreements
6.4 23.4 43.6 26.6 1.0 2.90 .868
9.10 Our company competes well within the 20.2 52.1 24.5 3.2 1.0 2.11 .754
The questions under ‗Section A‘ sought to unearth the typical factors that drive ICT strategy and
excellence. Factors such as ‗making use of latest technology and software‘ as well as
‗continuous improvement and revision of ICT strategy‘ were looked at in this section. These
factors and questions were developed or formulated from the literature review and the
questionnaire sought to validate these questions and factors as direct drivers of ICT strategy. In
most of the cases the respondents agreed to use of the latest software versions (48.9%, 47).
Many respondents also agreed that that software is regularly updated (43.6%, 42), but 20.2%
(19) did not agree. The majority of respondents also agreed that their computers at work are
changed regularly (42.6%, 41), while 26.6% (26) disagreed.
The majority of the respondents also strongly agreed that they would like to own a smartphone
(67%, 65). This is an interesting trend to note.
The majority of respondents agreed (80.9%, 79) that they had easy access to the Internet and
they can easily access their work emails on their phone (80.8%, 79). This shows that companies
have now come to the realisation that employees need to have access to their emails and work-
related material everywhere. The nature of most jobs in this era demand mobility, especially
among people who are in sales and other client facing disciplines and jobs that involve travelling,

52
such as in project management and field engineers. It is also follows from the above that the
majority of employees use cell phones that have highly advanced technological ability.
52.1% of respondents also felt that their companies were competing well within their markets.
The majority of the respondents disagreed (70.2%, 68) that their company‘s inability to keep up
with technological trends is linked to outsource agreements that their companies have entered
into with suppliers. Respondents‘ further agreed (56.3%, 55) that their company‘s ICT strategy is
revised frequently. The author therefore assumed that it might be for this reason that the majority
of the respondents said that their companies are doing well in their respective markets.
3.3.4 Analysis of Section B of the questionnaire
Section B of the questionnaire asked respondents questions on whether they possess a
smartphone, how easily they can connect to the Internet, and whether they work for a private or
government company. Table 3.7 presents the results.
Table 3.7: Statistical results for Section B of the questionnaire
Question Yes No Number Missing
10.1 I own a smart phone 71.7 28.3 3
10.2 I work for a private company 28.3 71.7 3
10.3 I have easy access to a computer at home 84.6 15.4 4
10.4 I have easy access to the internet at home 82.4 17.6 4
The majority of respondents (71.7%) owned a smartphone. This is quite a high figure and is in
support of the literature review findings in chapter 2 regarding future trends. The majority of
respondents worked for parastatals (government-owned companies). This was good because
this study was meant for parastatals, and was intended to formulate an opinion or framework
relevant for parastatals. It was also interesting to note that an overwhelming majority of the
respondents had access to a computer at home and also had internet access at home, at 84.6%
and 82.4% respectively. The future trend is that more and more people will have access to a
computer at home and the line between work and home is slowly fading, because employees can
now access work emails and other work applications on their phones and home computers.

53
3.3.5 Analysis of Section C of the questionnaire
Table 3.8: Statistical results for section C of the questionnaire
The questions on ‗Section C‘ could be grouped into three categories; the first category of
questions were those that sought to establish the link to legislation or factors that affect ICT
strategy and service delivery from a legal perspective, secondly the questions sought to unearth
human resource related factors that are linked to or affect ICT strategy based on the knowledge
that human resources form an integral part of any business strategy and service delivery. The
last set of questions looked at the ability of companies to stay abreast of technology and which
always revised the company strategy.
The study also found that 33.7% of respondents felt that their companies can to some extent
avert the effects (positive or negative) that the legislative framework places on their companies,
while 13% felt that this was, to a large extent, possible. It was also noteworthy that 32% did not
have an opinion on this matter. The author is of the opinion that this is a result of the fact that law
and legal matters are generally regarded as specialised and technical people put less emphasis
on them, or it might also be indicative of some level of ignorance regarding legal matters,
especially given that the majority of respondents are in management or leadership positions.
Over 70% of the respondents felt that the legislative framework in the ICT sector enhances
service delivery (split between 28.3 % who said ‗to some extent‘, 22.8% who said ‗to a large
extent‘ and 7.6% who said ‗all the time‘). This can be interpreted to mean respondents are
confident that the rule of law is sound and that the laws and legislative requirements enable their
companies to conduct business better and quicker.
Some respondents felt that the political environment always affects them (41%), while 13% felt
that politics affect their business to some extent and 32% felt that political environment affects
them to a large extent. According to these results one can see that the political environment
Question Not at All
To some
extent
TO a
large
extent
All the
time
Don’t
Know
11.1 We can avert the effect(s) of legislation 17.4 33.7 13.0 3.3 32.6
11.2 The legislative framework in our industry enhance service delivery 16.3 28.3 22.8 7.6 25.0
11.3 Political environment affect our company strategy 5.4 13.0 32.6 41.3 7.6
11.4 I know about knowledge management programmes at my company 9.8 32.6 25.0 5.4 27.2
11.5 There is skills retention in my company 28.3 28.3 18.5 8.7 16.3
11.6 My company has reward programmes for high achievers 44.6 25.0 20.7 2.2 7.6
11.7 Training and development is encouraged 14.1 42.4 27.2 13.0 3.3
11.8 My company stays abreast of technolgical changes 5.4 48.9 23.9 17.4 4.3
11.9 The company I work for has an ICT strategy 3.3 29.3 22.8 20.7 23.9
54
plays a significant role in business. This is further affirmed by the PEST model that was
discussed in chapter 2.
It was also noted that 32% of the respondents knew to some extent about knowledge
management programmes in their companies, while 25% knew about these programmes to a
large extent and 27.2% did not know about such programmes. Although the study did not
research the reason for respondents not knowing about such programmes in their companies,
the author could only assume that possible reasons might be that the employer did communicate
to the employees about the different knowledge management programmes or perhaps the
employees are ignorant or either such programmes and initiatives are none existent in their
companies.
Some respondents felt that there was no skills retention in their companies (this group accounted
for 28.3%), while other respondents felt that to some extent there was (28.3%). 18.5% felt that to
a great extent there was skills retention and 16.3% did not know about any skills retention
initiatives in their companies.
44.6% of respondents to the questionnaire felt that their companies did not reward high
performers and good achievements. The remaining 25% felt that to some extent their companies
rewarded high performance, while only 20.7% of the respondents believed that there were
performance rewards for high achievers in their companies.
Only 14.1% agreed that their companies encourage training and development, whereas 42.4%
knew of training and development initiatives to some extent and 20.7% to a large extent. The ICT
industry is fast paced; organisations that want to stay ahead must keep abreast of technology
which means they must train and up skill their employees continuously. It is therefore desirable
for ICT companies to encourage training and development.
Some respondents felt that their companies to a large extent (23.9%) stayed abreast of
technological changes, and 48.9% felt to some extent that their companies stayed abreast of
technological changes. The majority felt that their companies were not staying abreast of
technological changes. It would be interesting to delve deeper during future studies and find out
the reasons why almost 50% of the respondents felt that their companies were not staying
abreast of technological changes.

55
23.9% of the participants did not know about their company‘s strategy, while 29.3% of
respondents knew to some extent whether their company had an ICT strategy, 22.8% knew to a
large extent that their company had an ICT strategy, and 20.7% of the respondents said their
companies always had an ICT strategy.
3.3.6 Exploratory Analysis
3.3.6.1.1 Correlations
The correlation technique is a statistical procedure used to determine the relationship between
two variables. This measure tests both the strength and direction of a linear relationship between
two variables (Ellis & Steyn, 2003).
In order to achieve this two measures of significance are employed, namely:
o Statistical significance – This technique is used to generalise a sample to a population.
This method is therefore suitable for perfectly random samples and thus did not receive
much attention in this research.
o Practical significance – this technique is used to measure if an effect or relationship is
visible or significant in practice
3.3.6.1.2 Interpretation of correlations
The practical significance was measured using the Pearson‘s Product Moment Correlation
Coefficient (r). This coefficient only takes values between -1 and +1, where a negative sign
indicates negative correlation (meaning as one variable increases then the other variable
decreases and vice versa) and a positive sign indicates a positive correlation (when one variable
increases then the other also increases and vice versa) (Ellis & Steyn, 2003:126).
The size of the correlation coefficient (absolute value, disregarding the sign) indicates the
strength of the relationship between the two variables.
r=.10 to .29 or r=–.10 to –.29 small
r=.30 to .49 or r=–.30 to –.4.9 medium
r=.50 to 1.0 or r=–.50 to –1.0 large

56
Lastly, a perfect correlation of 1 or -1 indicates that the value of one variable can be determined
by knowing the value of the other variable (Ellis & Steyn, 2003:126).
Correlation findings and analysis (Refer to Annexure C for further info)
Note: All don’t know options were excluded during this analysis.
There was a statistically significant and practically significant positive correlation between
Q11_4 and Q11_5. The respondents, who knew about knowledge management in their
companies, also knew about the skills retention initiatives of their companies.
There was a statistically significant and practically significant positive correlation between
Q11_4 and Q11_6. The respondents, who to a large extent knew about knowledge
management in their companies, also knew to a about the reward programmes of their
companies.
There was a statistically significant and practically significant positive correlation between
Q11_4 and Q11_7. The respondents, who knew about knowledge management in their
companies, also agreed that training and development is encouraged in their companies.
There was a statistically significant and practically visible positive correlation between Q11_4
and Q11_8. The respondents, who knew about knowledge management in their companies,
also agreed that their companies stayed abreast of technological changes.
There was a statistically significant and practically significant positive correlation between
Q11_5 and Q11_6. The respondents, who agreed that there is skills retention in their
companies, also agreed that their companies had reward programmes for high achievers.
There was a statistically significant and practically significant positive correlation between
Q11_5 and Q11_7. The respondents, who agreed that there is skills retention in their
companies, also agreed that their companies encouraged training and development.
There was a statistically significant and practically significant positive correlation between
Q11_5 and Q11_8. The respondents, who to a large extent knew about knowledge
management in their companies, also agreed that to a large extent their companies stayed
abreast of technological changes.

57
There was a statistically significant and practically significant positive association between
Q11_6 and Q11_7.Respondents who felt their company rewarded high achievers also felt that
their company encourages training and development
There was a statistically significant and practically significant positive association between
Q11_6 and Q11_8.Respondents who felt their company rewarded high achievers also agreed
that their companies stayed abreast of technological changes.
There was a statistically significant and practically visible positive association between Q11_7
and Q11_8. Respondents whose companies encouraged training and development also
agreed that their companies stayed abreast of technological changes.
There was a statistical significant and practically significant positive correlation between
questions Q9_1 and Q9_2. Respondents who tended to agree to using the latest version of
computer software also agreed that their company regularly updates software.
There was a statistical significant and practically significant positive correlation between
questions Q9_1 and Q9_3. Respondents who tended to agree to using the latest version of
computer software also tended to agree that their company changes computers regularly.
There was a statistical significant and practically significant positive correlation between
questions Q9_1 and Q9_4. Respondents who tended to agree to using the latest version of
computer software also tended to agree to having easy internet access outside of the office.
There was a statistical significant and practically significant positive correlation between
questions Q9_1 and Q9_6. Respondents who tended to agree to using the latest version of
computer software also tended to agree to have easy access to work emails on their cell
phones.
There was a statistical significant and practically visible positive correlation between questions
Q9_1 and Q9_7. Respondents who tended to agree to using the latest version of computer
software also tended to agree that their company‘s ICT strategy is revised frequently.
There was a statistical significant and practically visible negative correlation between questions
Q9_1 and Bio2. There is a relationship between response to Question 9_1 and the age of the
respondents.
There was a statistical significant and practically visible negative correlation between questions
Q9_1 and Bio4. There is a relationship between response to Question 9_1 and the number of

58
years‘ experience that the respondents had.
There was a practically significant and statistically significant positive correlation between
questions Q9_2 and Q9_3. Respondents who tend to agree to using the latest version of
computer software also tend to agree that their companies changes computers regularly.
There was a practically visible and statistically positive correlation between questions Q9_2
and Q9_4. Respondents who tend to agree to using the latest version of computer software
also tend to agree that they have easy internet access outside their offices.
There was a practically visible and statistically significant positive correlation between
questions Q9_2 and Q9_6. Respondents who tend to agree to using the latest version of
computer software also tend to agree to be able to access their work emails from their cell
phones.
There was a practically visible and statistically significant positive correlation between
questions Q9_2 and Q9_7. The respondents who tended to agree to using the latest version of
computer software also tended to agree that their company‘s ICT strategy is revised regularly.
There was a practically visible and statistically significant positive correlation between
questions Q9_2 and Q9_10. The respondents who tended to agree to using the latest version
of computer software also tended to agree that their company performed well in the respective
markets they operate in.
There was a practically visible and statistically significant positive correlation between
questions Q9_3 and Q9_4. The respondents who tended to agree that their company‘s change
computers regularly also tended to agree to have easy Internet access outside of the office.
There was a practically visible and statistically significant positive correlation between
questions Q9_3 and Q9_6. The respondents who tended to agree that their companies change
computers regularly also tended to agree to have easy access to work emails on their cell
phones.
There was a practically visible and statistically significant positive correlation between
questions Q9_3 and Q9_7. The respondents who tended to agree that their companies change
computers regularly also tended to agree that their company‘s ICT strategy is revised regularly.
There was a practically visible and statistically significant positive correlation between
questions Q9_4 and Q9_5. The respondents who tended to agree to have easy Internet

59
access outside the office also tended to like owning a smartphone.
There was a practically visible and statistically significant positive correlation between
questions Q9_4 and Q9_6. The respondents who tended to agree to have easy Internet
access outside the office also tended to agree to have easy access to their work emails on
their cell phones.
There was a practically visible and statistically significant positive correlation between
questions Q9_4 and Q9_7. The respondents who tended to agree to having easy Internet
access outside the office also tended to agree that their company‘s ICT strategy is frequently
revised.
There was a practically visible and statistically significant positive correlation between
questions Q9_5 and Q9_6, thus respondents who liked to own a smartphone also tended to
agree that they have easy access to work emails on their cell phones.
There was a practically visible and statistically significant positive correlation between
questions Q9_6 and Q9_7, thus respondents who tended to agree that they have easy access
to work emails from their cell phones also tended to agree that their company‘s ICT strategy is
revised frequently.
There was a practically visible and statistically significant positive correlation between
questions Q9_7 and Q9_10, thus respondents who tended to agree that their company‘s ICT
strategy is revised frequently, also tended to agree that their companies perform well in their
respective markets.
There was a practically significant and statistically significant positive correlation between
questions Q9_8 and Q9_9. Respondents who tended agree that their companies cannot keep
up to new technological changes also tended to agree that their companies cannot keep with
technological changes due to long term outsource agreements.
There was a practically visible and statistically significant negative correlation between
questions Q9_8 and Q9_10. Respondents who tended agree that their companies cannot keep
up to new technological changes tended to disagree that their companies are performing well
within their respective markets.

60
There was a practically significant and statistically significant positive correlation between
questions Bio2 and Bio4. The higher the respondent‘s age tended to be linked to the higher the
number of year‘s ICT working experience.
3.4 Conclusion
The questionnaire was use to validate the factors and drivers that were identified during the
literature review. The rate of response to the questionnaire was just over 50%. The majority of
the respondents were from supervisory to management level and a small percentage (about
5.3%) from the executive level. The respondents were both from private companies and
parastatals within the ICT sector.
The majority of respondents were female and most of the respondents came from the broadcast
and media field as well as telecommunications, followed by IT.
Most respondents overwhelmingly agreed that there is a need for smart phone usage and in fact
over 70% of the respondents had smart phones. It was also evident that most respondents have
internet and computer access in their homes and can also access work emails on their smart cell
phones. The majority of respondents also were using the latest version of computers and
software and agreed that their companies regularly updated and changed these.
There was a link between the use of latest technology to the outsource agreements within ICT.
There was some evidence from the empirical study to support the researcher‘s assumption that
long term outsource agreements hinder rapid technological advancement and upgrades. The
majority of respondents believe that their companies cannot stay abreast of technological
advancement due to long term outsource agreements.
It was also proven through the empirical study that companies that have a ICT strategy and also
revise it frequently do well within the markets they operate. Several other tacit correlations where
identified during the statistical analysis.
Companies that do well in the industry also have knowledge and talent management initiatives;
they further encourage training and development and also reward high achievers.
61
3.5 Summary
Chapter 3 covered the empirical study of this mini dissertation. The chapter sought to unravel the
factors as established in the literature review under chapter 2. These factors and drivers of ICT
strategy and trends were tested using a questionnaire. An electronic questionnaire was
developed which was also distributed electronically, and was made to be completely anonymous
to encourage participation. The responses were thus automatically posted to the NWU server
anonymously.
The sample was derived from both state-owned and private companies in the ICT industry, in the
IT, broadcast and media, as well as telecommunications industries. The same number of
companies from similar industries from both the private and public sector were selected. This
was done in order to compare ‗apples with apples‘ and for a deeper understanding of any
differences and similarities between the public and private sector, as well as to reach strong
conclusions and to not generalise or make assumptions.
The findings of the questionnaire responses and empirical study were also thoroughly discussed
in this chapter. A statistical analysis was conducted to reveal other salient factors, as well as
correlations among and between the different factors.
A closer and more comprehensive look at further recommendations and conclusions about the
whole study follows in chapter 4.

62
4 CHAPTER 4: CONCLUSIONS AND RECOMMENDATIONS
4.1 Introduction
This chapter focuses on drawing conclusions based on both the literature review and the
empirical study. The chapter also summarises the key issues and drivers that affect ICT strategy,
its rollout and the continuous management thereof, in parastatals.
Some of the objectives of this study - apart from the primary objective of deriving a
comprehensive ICT strategic framework for parastatals – were to:
provide a critical exposition of the factors that affect company ICT
strategies;
assess the impact of technological changes on company ICT strategies;
and
propose guidelines on keeping companies‘ ICT strategies responsive to
the rapid technological changes.
An assessment is carried out to check if the objectives as listed above were indeed achieved or
not achieved and the reasons therefore. In the latter part of this chapter, recommendations are
made to senior managers and executives in the technical cluster within the ICT industry -
specifically in government entities.
4.2 Conclusions
4.2.1 Legal and regulatory framework
The legislative framework and policy positions in any economy are key fundamentals that ensure
that industries can thrive under a free market system and further entrench certainty within the
market. South Africa has a sound legal and regulatory framework. The missing link seems to be
policy direction due to the absence of a national ICT policy. A draft policy colloquium document
has, however, recently been published by the DoC (Fairweather, 2013).
Part of the problem with the absence of a policy is the current manifestation of so many
uncoordinated projects amongst the various state departments and parastatals. It is the writer‘s

63
view that government-owned companies and departments are constrained to a large extent by
the legislative and policy framework within which they must function.
4.2.2 ICT strategic drivers
Strategy is concerned with crafting a direction and way forward for an organisation or commercial
entity that ensures that it keeps or attains a favourable position within the market that it operates.
The strategic drivers and factors that affect a company‘s ICT strategy were thoroughly explored
during the literature review. To a great extent, an ICT organisation‘s strategies are influenced and
driven by four main components:
Architecture
Technology
Processes
People
4.2.3 Other
Several other factors in the ICT industry play a role and have a direct or indirect effect on the ICT
market. Chief amongst these are that owing to the generic nature of telecommunications and ICT
industries, several market changes came about as a result of the wave of change and
advancement globally. An example was the market liberalisation of the early 2000s and the more
recent shift to mobile data services. The ICT industry is also governed to a large extent by
various international standards and trends.
One of the greatest drivers of ICT is the technical convergence of various technologies across
the media, broadcasting, telecoms and IT industries. Due to this phenomenon, traditionally
separate industries and mediums now share common infrastructure, such as the use of
telecommunications infrastructure to transmit television or video signals.
Innovation has always been the underlying driver of the ICT industry, as in other industries. This
also led to the invention of Moore‘s Law, which states that the number of transistors on a
microprocessor will double every 18 months, i.e. computer speed and processing power is
constantly growing. The researcher has observed that technology or any invention is the result of
acute and thorough analysis of the world and systems that surround us. Often the answers and
sources of such wisdom lie in nature.

64
4.3 Recommendations
Continuous analysis and engagement – the ICT market, like any other, is
fluid and dynamic, therefore continuous scanning of the market for
changes and opportunities for growth is crucial.
o Continuous and regular checks on:
Porter‘s five forces model;
PEST forces model
People – the most important asset that a company can possess is its
people. Companies are encouraged to empower their workforce through
training and continuous up skilling and development. This can be achieved
through inculcating a culture of learning and development, and
encouraging innovativeness and continuous process and product
improvement. Winning ICT companies must:
o Promote a culture of creativity
o Promote a culture of excellence
o Reward performance
Stakeholder management – through active engagement in public forums
(such as policy colloquiums, ICASA public hearings, etc.), government ICT
companies can ensure that they have a voice, register their professional
opinions, advocate for conditions favourable to them or advance
arguments that ensure that they are given the space to exercise their
mandates. This proactive approach is also recommended in that it can
assist the parastatals to influence policy direction and industry legislation.
Legislation – most, if not all, government agencies in the ICT sector were
established through an Act of parliament and therefore have specific
mandates. It is thus critical for these parastatals to be sober and to have a
thorough and in-depth knowledge and understanding of what they need to
achieve as per their mandate. In order to thrive strategically, they must
exhaust and leverage their exclusivity and exploit their privileges which are
enshrined in the enabling legislation.

65
Innovation – ICT companies must shift their strategic focus and direction
from an operating one to an innovating one. Some of the major benefits of
an innovating company are:
o People centric
o Reward systems that promote autonomy and recognition
o Optimised business processes
o Flat structure which equates to less bureaucracy
Visionary – a successful ICT strategy is one that visionary and has an
underlying pioneering and forward-looking spirit. ICT companies that win
are those that actively scan the environment for eminent trends and strive
to be ahead and never caught by surprise.
Compliance – the ICT sector is governed predominantly by standards, and
it is critical for companies to adhere to these. This becomes more
important when dealing with multiple systems and platforms, because
adherence to standards can ensure seamless integration and inter-
operability (both in IT and telecoms).
Outsource agreements – the IT industry is one of the fields wherein
outsource agreements are most prevalent. Much as these agreements are
meant to bring about efficiency by taking out services that are deemed not
core to the business, they can also make running the company a challenge
if not well managed. Companies must therefore ensure that outsource
agreements cater for, and are geared to, rapid technological and market
changes.
Sound Corporate Strategy – parastatals must have a sound corporate
strategy. The ICT strategy must plug into the ‗bigger picture‘ and must be
an enabler for the company to achieve its objectives. The ICT strategy as
well as the corporate strategy must be revised regularly because the ICT
market changes rapidly.
Future trends – Successful strategies in ICT must look at future trends. For
example the ICT market is going to be driven by mobility and demand for
high speed applications and high volume data requirements.
Collaborations – As a result of the declining revenue from traditional
service offerings such as voice, ICT companies will need to look at
collaborations across ICT sectors as the market is going into further
vertical and horizontal integration.

66
4.4 Achievement of study objectives
4.4.1 Success in terms of the primary objective
The primary goal of this study was to put together a comprehensive framework that will serve as
a guideline to parastatals operating within the ICT space. This objective was achieved because a
framework was developed, a template of which can be found in section 4.5 of this chapter.
4.4.2 Success in terms of secondary objectives
The secondary objectives of this study were achieved. The first objective was to unearth the
major drivers of an ICT strategy; in this regard the literature review in chapter 2 as well as the
empirical study in chapter 3 unravelled the factors that affect ICT strategy. Secondly, the
research also managed to reveal the effects and impact of technological changes on an ICT
strategy and its core drivers.
The third and last objective was to provide guidelines to keep the ICT strategy of parastatals as
responsive and agile as possible. This was achieved in part in chapter 2.
4.5 The ICT Strategic Management Framework
Figure 4.1: ICT Strategy Pyramid
Source: World Bank, 2005.
According to the e-strategies monitoring and evaluation toolkit, the process of deriving an ICT
strategy and monitoring the relationship between policy, strategy and its implementation can be
summed up by the ICT strategy pyramid. The strategy at the highest level is driven by the policy
direction of the institution concerned. The policy details the goals which are then translated to

67
strategic priorities. These priorities are realised or achieved through certain initiatives or projects
and subsequently action plans at the lowest level. In this context the three components answer
different questions as follows:
Policy - ‗Why?‘
Strategy – ‗What?‘
Implementation/Action – ‗How?‘
The pyramid also shows the indicators that can be used to measure the progress and impact or
success of the strategy execution at the different layers of the pyramid (World Bank, 2005:6).
In line with the above theory, Farah (2012:8) listed the following components of strategy
development:
Assessment
Consultation plan
Strategic plan
Action plan for implementation
Institutional mechanisms for implementation and supervision
Monitoring and evaluation mechanisms
Figure 4.2 depicts the framework developed by the researcher with comprehensive pointers and
factors that must be considered and addressed while developing or revising a company‘s
strategy. The researcher also recommends that the process highlighted above be followed in
order to assess the current environment and then consult as widely as possible before a
comprehensive strategic plan is developed. The strategy action plans can then be developed and
implemented. The key to strategy is to keep in mind that it is not a constant, but changes and
must continuously be updated accordingly.

68
Figure 4.2: Strategic ICT Management Framework
People
Company structure
o Flat
o Task oriented
o Low or no bureaucracy
Innovation
Training and development
Recognition and reward
Other
Legal and regulatory
Policy framework
PEST analysis
Customer focus
Future trends
Compliance
Outsourcing and enabling
contracts (collaborations)
Processes
Automated
Fit for the company structure
Operational and control
systems
o Information systems
o Strategic planning
systems
o Financial systems
o Human resource systems.
Technology & Architecture
Emphasis on agility
Source of competitive advantage
Innovative
Enabler
Technically Converged
Flexible
Customer focused
Strategy
Relevant
Agile
Regularly updated
Goals that are simple, consistent, and long
term.
Profound understanding of the
environment.
Objective appraisal of resources.
Effective implementation.
ICT Strategic Management Framework

69
4.5.1 How the framework works
The framework as developed by the researcher is a culmination of both the literature and
empirical studies. Factors that affect the ICT strategy of an organisation where identified through
the literature review and then tested through the empirical study.
It is recommended to deal with the four main components of the strategic framework in a clock-
wise direction. The ICT strategy should be designed to be an enabler for the organisation. The
ICT strategy must be developed in view and consideration of the company strategy.
The four main components:
1. People – The company structure is closely related to strategy. As a result the company
structure must follow the resultant strategy of the organisation. Therefore as part of
devising the ICT strategy, the senior managers and executives in consultation with their
Human Resources counterparts must ensure that their divisional structure aligns to
company objectives and performance requirements. It is also important to consider
whether the team is correctly structured and whether the team is correctly resourced and
capacitated and that the workforce possesses the relevant skills. It is also important to
consider what services and skills will be kept in house and which will be outsourced. The
key is to keep the core business expertise in-house and outsource auxiliary and
complementary services and products.
2. Technology and architecture – It is of strategic importance for the network architecture
(both IT and Telecommunications) to be optimally designed to suit the needs of the
organisation. The emphasis should be on deploying network infrastructure that is of latest
technology and scalable. The network and its component systems must be such that it
gives the organisation a competitive advantage over its rivals in the market. The
emphasis of successful strategies should be customer focus. Thus future ICT strategies
must make use of technology and build networks and infrastructure that is converged.
3. Processes – successful companies work smarter and faster. The underlying thread for
ICT services and products are convenience, efficiency, excellence and innovation. As
such business process for the ICT division and the whole enterprise must be optimally
designed. Careful consideration must be made on how processes flow and which actions
and processes are grouped together and what level of bureaucracy is acceptable.
4. Other (factors and considerations) – The business environment is ever changing and
depending on location and industry the business rules and requirements are different. All
strategies must be designed within the applicable legal framework. Equally, when crafting
the company‘s ICT strategy care must be taken to ensure that all legal requirements are

70
met. Care must also be taken to consider applicable industry policies, standards and
norms. It is also advisable to consider market trends both at a local and international
level, taking care to compare with similar industries or countries.
This framework must not be used in isolation; it is advisable to ensure that the ICT strategy must
be in perfect alignment with the company‘s corporate strategy. Numerous other factors that may
be unique to the operating environment need to be taken into account when using this
framework. The framework however gives key pointers and major aspects that should at the very
least form part of a comprehensive ICT strategy for any organisation.
4.6 Recommendations for future studies
The author believes that there is still much room to explore this subject with emphasis on
improving the service delivery capability of state-owned companies. A suggested topic would be
to establish the link between good strategy and service delivery and also the use of ICT to
enhance service delivery in South Africa. It would be also interesting to explore the reasons why
respondents felt that their companies are not staying abreast of technological changes.
In addition, the perceived strength and better performance of private companies versus the
parastatals needs to be tested. The result of such analysis can then be added to the framework
in section 4.5 to include strategies and any other factors that make private companies perform
better.
4.7 Summary
The main objective of this study was to develop a comprehensive ICT strategic framework for
parastatals. Through this chapter, the study focused on obtaining key information from relevant
professionals in the ICT sector, ranging from executives to management and lower level
employees. The study administered a questionnaire as a research instrument.
This chapter discussed the scientific approach that was taken to identify the population group as
well as the methodology employed to gather data. The academic basis for all the approaches
and decisions taken in putting together this report was also discussed.
The study concluded with a detailed discussion of the findings from the questionnaires and
interviews.

71
REFERENCES
BBC. 2013. China's Tianhe-2 retakes fastest supercomputer crown. http://www.bbc.co.uk/news/technology- 22936989?app_data={"pi":"39060_1371543653_82551937","pt":"twitter"} Date of access: 10 Jul. Bonsor, K., and Strickland, J. 2013. How quantum computers work. http://www.howstuffworks.com/quantum-computer.htm Date of access: 14 Jul 2013. Boojihawon, D.K., and Segal-Horn, S. Introduction: What is Strategy?. United Kingdom: OU, Milton Keynes. Boojihawon, D.K. 2006. Strategy implementation: Structure, Systems, Culture and Change. United Kingdom: OU, Milton Keynes.
Booyse, J.J. 2011. Managing outsource agreements between client organisations and suppliers. Potchefstroom: NWU. (Dissertation – MBA). BusinessTech. 2013. Government failing ICT in SA. http://businesstech.co.za/news/government/35542/government-failing-ict-in-sa/ Date of access: 10 July 2013. Clearly, T. 1988. The Art of War. Massachusetts, MA: Shambhala. Coldwell, D and Herbst, F. J. 2004. Business Research. Cape Town: Juta and Company Ltd Computer History Museum. 2006. Timeline of computer history. http://www.computerhistory.org/timeline/?category=cmptr Date of access: 19 June 2013. Department of Education. See South Africa. Department of Education. Department of Labour. See South Africa. Department of Labour. Department of Communication see South Africa. Department of Communication.
Ellis, S.M. & Steyn, H.S. 2003. Practical significance (effect sizes) versus or in combination with statistical significance (p-values), Management Dynamics, 12(4): 51-53.
Ericsson. 2012. Preparing for the future of communications. http://www.ericsson.com/res/docs/whitepapers/FutureOfCommunication.pdf Date of access: 21 June 2013.

72
Fairweather, A., 2013. Government's ICT policy is slowly strangling SA. http://mg.co.za/article/2013-03-25-governments-ict-policy-is-slowly-strangling-sa Date of access: 20 July 2013. Farah, M., 2012. Framework for Development of ICT strategies using ICT indicators. http://www.itu.int/ITU-D/arb/ARO/2012/ICTIndicators/Presentations/s3/S3-03-Framework-ICT-MFarah.pptx Date of access: 29 August 2013.
Field, A. 2009. Discovering statistics using SPSS. (3rd ed.). London: Sage Publications..
Gillmore, A. 2003. National Convergence Policy in a Globalised World: Preparing South Africa for Next Generation Networks, Services and Regulation. http://link.wits.ac.za/research/ag20030707.html Date of Access: 12 July 2013. Grant, R.M. 2008. Contemporary Strategy Analysis (6th ed.). Cornwall: Blackwell Publishing. Hofstee, E. 2010. Constructing a Good Dissertation: A practical guide to finishing a Master‘s, MBA or PhD on schedule. Johannesburg: EPE Publishers. IBM. 2010. Telco 2015: Five telling years, four future scenarios. http://www-935.ibm.com/services/ru/cio/c-suite/Telco_2015-Five_telling_years_four_future_scenarios-Executive_Summary_ru_s6.pdf Date of access: 30 June 2013. ICASA. 2013. www.ICASA.org.za Date of access: 01 July 2013. ITU. 2007. Telecommunication/ICT market and trends in Africa 2007. http://www.itu.int/ITU-D/ict/statistics/material/af_report07.pdf Date of access: 27 Jun 2013. Jones, C., Lawson, J. 2010. DOC stands firm on DTT deadline. http://www.itweb.co.za/index.php?option=com_content&view=article&id=31974 Date of access: 10 Jul 2013. Learn marketing, 2013. http://www.learnmarketing.net/porters.htm Date of access: 12 June 2013 Madue, S.M. 2007. Public Finance Management Act , 1 of 1999 - a compliance strategy. Politeia, 26(3):306-318. Manyika, J., Chui, M., Bughin, J., Dobbs, R., Bisson, P. & Marrs, A. 2013. Disruptive technologies: Advances that will transform life, business, and the global economy. http://www.mckinsey.com/insights/business_technology/disruptive_technologies Date of access: 10 October 2013. Mbendi Information Services 2013. Telecommunications in South Africa. http://www.mbendi.com/indy/cotl/tlcm/af/sa/p0030.htm Date of access: 04 Jul 2013. Metz, C. 2013. Wired, 28 June. Google‘s Quantum Computer Proven To Be Real Thing (Almost). http://www.wired.com/wiredenterprise/2013/06/d-wave-quantum-computer-usc/ Date of access: 14 Jul 2013. Millmore, M., Lewis, P., Saunders, M., Thornhill, A., and Morrow, T., 2007. Strategic Human Resource Management: contemporary issues. Edinburgh: Pearson Education. Miyajima, Y. 2005. Trends in Telecommunications Technology. Sumitomo Electric Industries LTD, 2005. http://www.icf.at/fileadmin/reports/2005/13.Miyajima.pdf Date of Access: 08 Jul 2013.

73
Mollick, E. 2006. Establishing Moore‘s Law. Mollick,E. 2006. http://www.computer.org/csdl/mags/an/2006/03/man2006030062-abs.html Date of Access: 09 October 2013. Mouton, J. 2002. How to succeed in your Master‘s and Doctoral studies: A South African guide and resource book. Pretoria: Van Schaik Publishers Muller, R. 2009. Vodacom joins Neotel – MTN fibre project. MyBroadband, 4 March 2009. http://mybroadband.co.za/news/telecoms/7163-vodacom-joins-neotel-mtn-fibre-project.html. Date of access 10 July 2013. Nhlabathi, H. 2012. Financial distress of provinces hits service delivery. Sowetan, 13 July. http://www.sowetanlive.co.za/news/2012/07/13/financial-distress-of-provinces-hits-service-delivery---commission Date of access: 10 July 2013. Oxford Dictionary of Current English. 1998. New York, NY: Oxford University Press. Proven models, 2013. http://provenmodels.com/32/pest-analysis/ Date of access: 14 June 2013 Rouse, M. 2010. Quantum computers. Techtarget,, June 2010. http://whatis.techtarget.com/definition/quantum-computer Date of access: 07 Jul 2013. Rouse, M. & Pawliw, B. 2010. Quantum computing. Techtarget, June 2010. http://whatis.techtarget.com/definition/quantum-computing Date of access: 07 Jul 2013.
SANews. 2013. ICT Policy Review Framing paper launched. SANews, 25 April. http://www.sanews.gov.za/south-africa/ict-policy-review-framing-paper-launched Date of access: 11 July 2013. Segal-Horn, S. 2004. The strategy reader. (2nd ed.). United Kingdom, UK: Blackwell Publishing. South African Department of Communication. 2012. ICT Policy colloquium discussion document. Pretoria. SA info Reporter 2012. http://www.southafrica.info/business/economy/infrastructure/telecoms.htm#.UdHpKKoaIeE Date of access:02 Jul. 2013. South African Department of Labour. 2008. National Scarce Skills List 2008. Pretoria South African Government, 2013, www.gov.za Date of access: 13 June 2013 South African Department of Communications. 2012. ICT policy colloquium discussion document. Pretoria. Taka, M. 2001. The internationalization of the South African Telecommunications sector. http://www.tips.org.za/files/The_Internationalization_Of_The_South_African_Telecommunications_Sector.pdf Date of access: 28 June 2013. Thompson, A.A., Strickland, A.J. & Gamble, J.E 2010. Crafting and Executing Strategy. (17th ed.). New York, NY: McGraw-Hill.

74
Tingye, L. 2011. Evolution of Lightwave Communications: Demand, Business and Technologies. AT&T BELL Laboratories. Treasury. 2013. Legislation - Public Finance Management Act – PFMA. http://www.treasury.gov.za/legislation/pfma/default.aspx Date of access: 09 July 2013. Tullett, J. 2012. SA national ICT policy on the brink. ITWEB, 17 April. http://www.itweb.co.za/index.php?option=com_content&view=article&id=53579 Date of access: 10 Jul 2013. Von Allen, W. 2004. Bill's 200-Year Condensed History of Telecommunications. http://www.telephonetribute.com/timeline.html Date of access: 17 Jun. 2013. Vodazone. 2013. http://www.vodazone.co.za/history Date of access: 02 Jul. 2013. World Bank. 2005. e-strategies monitoring and evaluation toolkit. http://siteresources.worldbank.org/INTEDEVELOPMENT/Resources/estrategiesToolkit_Jan2005.pdf Date of access: 30 August 2013. World Economic Forum. 2013. The Global Information Technology Report 2013. http://www3.weforum.org/docs/WEF_GITR_Report_2013.pdf Date of access: 14 July 2013. Welman, C., Kruger, F., and Mitchell, B. 2005. Research methodology. (3rd ed.). Cape Town: Oxford University Press.

75
Annexure A: Questionnaire
Section 1 – Biographical Information
Age Group
Gender
o M or F
Ethnicity
o A
o W
o C
o I
Number of years of ICT experience
o 0-5
o 6-10
o 11-15
o 16-20
o 20+
Level of Employment
o Executive
o Senior Management
o Management
o Supervisor
o Team Leader
o Technical Specialist
o Other
Which division or sector within ICT do they work
o IT
o Telecommunications
o Broadcasting and Media
Section 2 – ICT and Technology Strategic Drivers
What is the latest version of software they are using?
How often do they upgrade software?
How often do they change computers?

76
When technology changes, how quick do the organisation change?
Do they scan the market for new technology?
Do they own personal computers?
Do they have access to the internet at home and outside the office?
How many cellphones to they have?
Do they have smartphones?
Do they access their work emails from their phones?
Does the company have an ICT strategy?
Is there a technology/network master plan that informs company decisions
on technology?
How often is strategy revisited or altered/changed?
What is their projection window (3, 5, 7 10+ years)
Section 3 – Legislative and commercial drivers
Do they have any outsource agreements?
In which divisions or aspects of the business within ICT are the outsource
agreements?
How long are the outsource agreements?
Does outsource agreements enhance their business?
Does the legislative framework enhance or impede service delivery?
How does it affect them?
Which legislative or statutory restrictions affect their business in particular?
Are there any coping mechanisms to avert the effect of legislation?
Do they compete well within the market compared to the private sector
counterparts?
What other factors limit their performance (financial, HR etc.)
Dos the political environment affect their strategy? And how?
Section 4 – Skills and organisational development
Do you have knowledge management in your organisation?
Skills retention and succession planning?
Staff retention mechanism?

77
Reward programmes?
What level of education and skills do you possess?
Does the job and company environment allow for training?
Is training and development encouraged?
Are there financial or other (bureaucratic) constraints that prevent training?

78
Annexure B: Cover Letter
Dear Respondent
I am currently busy conducting a research project for the partial fulfilment of the requirements for
the degree Master of Business Administration at the North West University.
The research topic is ‗An ICT strategic management framework for rapid technological evolution
of a state-owned company‘. The main focus of this study is to establish the factors and drivers
that affect ICT company strategy. The outcome will then be a compilation of a comprehensive
framework that is intended for use by any state owned company. The emphasis is on creating a
framework that will enable the companies to be agile and responsive to rapid technological
changes in ICT.
I request your participation in this research by completing a short web based questionnaire as
indicated below. Participation is voluntary and you may withdraw without reason or consequence
and all responses are completely anonymous. By completing this questionnaire you give
permission that your feedback may be included in this study. This questionnaire takes
approximately 10 minutes to complete and your response will be kept fully confidential and
anonymous. The survey will be open till noon on the 23th of August 2013.
Please note that you will require internet access as the questionnaire is fully automated and
accessible via the following link: http://fluidsurveys.com/surveys/nwu-puk/khuthi-tshipani/
I truly value your input and participation and would like to thank you in advance for taking the
time to assist me in my research. The results of this study will be made available on request once
it is finalised. Ethical clearance number: NWU-00067-09-A4 has been obtained from the North-
West University.
Kind regards,
Khuthalani Eugene Tshipani (084 777 1501 or [email protected] )
Study Leader – Johan Coetzee (018 299 4012 or [email protected] )

79
Annexure C: Pearson’s Correlations
Pearson Correlation 1 Q11_2_no5
Pearson Correlation 7 Q11_4_no5
Q9_10 Pearson Correlation .136
Q9_2 Pearson Correlation -.312
*
Sig. (2-tailed) .317
Sig. (2-tailed) .010
N 56
N 67
Pearson Correlation 2 Q11_3_no5
Pearson Correlation 8 Q11_4_no5
Q9_5 Pearson Correlation -.358
**
Q9_9 Pearson Correlation .332
**
Sig. (2-tailed) .001
Sig. (2-tailed) .006
N 85
N 67
Pearson Correlation 3 Q11_4_no5
Pearson Correlation 9 Q11_5_no5
Q11_5_no5 Pearson Correlation .683
**
Q11_6_no5 Pearson Correlation .632
**
Sig. (2-tailed) .000
Sig. (2-tailed) .000
N 64
N 74
Pearson Correlation 4 Q11_4_no5
Pearson Correlation 10 Q11_5_no5
Q11_6_no5 Pearson Correlation .527
**
Q11_7_no5 Pearson Correlation .529
**
Sig. (2-tailed) .000
Sig. (2-tailed) .000
N 64
N 77
Pearson Correlation 5 Q11_4_no5
Pearson Correlation 11 Q11_5_no5
Q11_7_no5 Pearson Correlation .502
**
Q11_8_no5 Pearson Correlation .660
**
Sig. (2-tailed) .000
Sig. (2-tailed) .000
N 67
N 75
Pearson Correlation 12 Q11_5_no5
Pearson Correlation 6 Q11_4_no5
Q9_2 Pearson Correlation -.302
**

80
Q11_8_no5 Pearson Correlation .406
**
Sig. (2-tailed) .008
Sig. (2-tailed) .001
N 77
N 64
Pearson Correlation 13 Q11_5_no5
Pearson Correlation 19 Q11_8_no5
Q9_3 Pearson Correlation -.303
**
Q9_8 Pearson Correlation .344
**
Sig. (2-tailed) .007
Sig. (2-tailed) .001
N 77
N 88
Pearson Correlation 14 Q11_6_no5
Pearson Correlation 20 Q11_8_no5
Q11_7_no5 Pearson Correlation .561
**
Q9_10 Pearson Correlation -.336
**
Sig. (2-tailed) .000
Sig. (2-tailed) .001
N 84
N 88
Pearson Correlation 15 Q11_6_no5
Pearson Correlation 21 Q9_1
Q11_8_no5 Pearson Correlation .602
**
Q9_2 Pearson Correlation .758
**
Sig. (2-tailed) .000
Sig. (2-tailed) .000
N 82
N 94
Pearson Correlation 16 Q11_7_no5
Pearson Correlation 22 Q9_1
Q11_8_no5 Pearson Correlation .462
**
Q9_3 Pearson Correlation .692
**
Sig. (2-tailed) .000
Sig. (2-tailed) .000
N 86
N 94
Pearson Correlation 17 Q11_8_no5
Pearson Correlation 23 Q9_1
Q11_9_no5 Pearson Correlation .420
**
Q9_4 Pearson Correlation .418
**
Sig. (2-tailed) .000
Sig. (2-tailed) .000
N 69
N 94
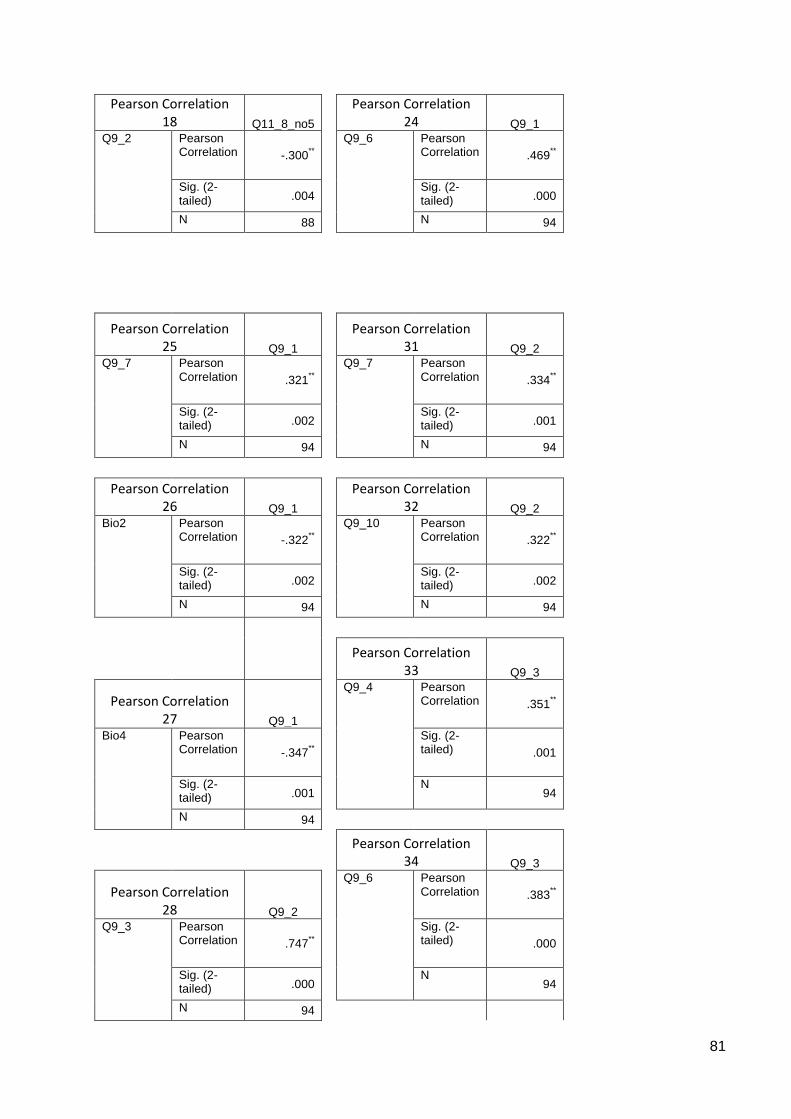
81
Pearson Correlation 18 Q11_8_no5
Pearson Correlation 24 Q9_1
Q9_2 Pearson Correlation -.300
**
Q9_6 Pearson Correlation .469
**
Sig. (2-tailed) .004
Sig. (2-tailed) .000
N 88
N 94
Pearson Correlation 25 Q9_1
Pearson Correlation 31 Q9_2
Q9_7 Pearson Correlation .321
**
Q9_7 Pearson Correlation .334
**
Sig. (2-tailed) .002
Sig. (2-tailed) .001
N 94
N 94
Pearson Correlation 26 Q9_1
Pearson Correlation 32 Q9_2
Bio2 Pearson Correlation -.322
**
Q9_10 Pearson Correlation .322
**
Sig. (2-tailed) .002
Sig. (2-tailed) .002
N 94
N 94
Pearson Correlation 33 Q9_3
Pearson Correlation 27 Q9_1
Q9_4 Pearson Correlation .351
**
Bio4 Pearson Correlation -.347
**
Sig. (2-tailed) .001
Sig. (2-tailed) .001
N 94
N 94
Pearson Correlation 34 Q9_3
Pearson Correlation 28 Q9_2
Q9_6 Pearson Correlation .383
**
Q9_3 Pearson Correlation .747
**
Sig. (2-tailed) .000
Sig. (2-tailed) .000
N 94
N 94

82
Pearson Correlation 35 Q9_3
Pearson Correlation 29 Q9_2
Q9_7 Pearson Correlation .304
**
Q9_4 Pearson Correlation .440
**
Sig. (2-tailed) .003
Sig. (2-tailed) .000
N 94
N 94
Pearson Correlation 36 Q9_4
Pearson Correlation 30 Q9_2
Q9_5 Pearson Correlation .378
**
Q9_6 Pearson Correlation .444
**
Sig. (2-tailed) .000
Sig. (2-tailed) .000
N 94
N 94
Pearson Correlation 37 Q9_4
Pearson Correlation 43 Q9_8
Q9_6 Pearson Correlation .484
**
Q9_9 Pearson Correlation .706
**
Sig. (2-tailed) .000
Sig. (2-tailed) .000
N 94
N 94
Pearson Correlation 38 Q9_4
Pearson Correlation 44 Q9_8
Q9_7 Pearson Correlation .302
**
Q9_10 Pearson Correlation -.303
**
Sig. (2-tailed) .003
Sig. (2-tailed) .003
N 94
N 94
Pearson Correlation 39 Q9_5
Pearson Correlation 45 Bio2
Q9_6 Pearson Correlation .325
**
Bio4 Pearson Correlation .765
**
Sig. (2-tailed) .001
Sig. (2-tailed) .000
N 94
N 95

83
Pearson Correlation 40 Q9_6
Q9_7 Pearson Correlation .321
**
Sig. (2-tailed) .002
N 94
Pearson Correlation 41 Q9_7
Q9_10 Pearson Correlation .422
**
Sig. (2-tailed) .000
N 94
Pearson Correlation 42 Q9_7
Bio4 Pearson Correlation -.309
**
Sig. (2-tailed) .002
N 94

84
CORRELATIONS
/VARIABLES=Q9_1 Q9_2 Q9_3 Q9_4 Q9_5 Q9_6 Q9_7 Q9_8 Q9_9 Q9_10 Q10_1 Q10_2 Q10_3 Q10_4 Q11_1 Q11_2 Q11_3 Q11_4 Q11_5 Q11_6 Q11_7 Q11_8 Q11_9 Bio2 Bio4
/PRINT=TWOTAIL NOSIG
/MISSING=PAIRWISE.
Correlations
17-SEP-2013 12:46:41
Data C:\Users\12791733\Documents\Q
Backup\Tshipani_Khuthi_Aug13\KTDa
taFinal.sav
Active Dataset DataSet2
Filter <none>
Weight <none>
Split File <none>
N of Rows in Working Data
File95
Definition of Missing User-defined missing values are
treated as missing.
Cases Used Statistics for each pair of variables are
based on all the cases with valid data
for that pair.
CORRELATIONS
/VARIABLES=Q9_1 Q9_2 Q9_3 Q9_4
Q9_5 Q9_6 Q9_7 Q9_8 Q9_9 Q9_10
Q10_1 Q10_2 Q10_3 Q10_4 Q11_1
Q11_2 Q11_3 Q11_4 Q11_5 Q11_6
Q11_7 Q11_8 Q11_9 Bio2 Bio4
/PRINT=TWOTAIL NOSIG
/MISSING=PAIRWISE.
Processor Time 00:00:00.05
Elapsed Time 00:00:00.04
[DataSet2] C:\Users\12791733\Documents\Q Backup\Tshipani_Khuthi_Aug13\KTDataFinal.sav
Q9_1 Q9_2 Q9_3 Q9_4 Q9_5 Q9_6 Q9_7 Q9_8 Q9_9 Q9_10 Q10_1 Q10_2 Q10_3 Q10_4 Q11_1 Q11_2 Q11_3 Q11_4 Q11_5 Q11_6 Q11_7 Q11_8 Q11_9 Bio2 Bio4
Pearson Correlation 1 .758**
.692**
.418** .192 .469
**.321
** -.129 -.143 .235* .007 .208
* .104 .296** -.063 -.079 -.042 -.104 -.249
* -.163 -.256* -.162 .046 -.322
**-.347
**
Sig. (2-tailed) .000 .000 .000 .064 .000 .002 .216 .169 .023 .947 .047 .326 .004 .552 .454 .692 .323 .017 .121 .014 .122 .665 .002 .001
N 94 94 94 94 94 94 94 94 94 94 92 92 91 91 92 92 92 92 92 92 92 92 92 94 94
Pearson Correlation .758** 1 .747
**.440
**.209
*.444
**.334
**-.222
* -.197 .322** .044 .333
** .151 .191 -.055 -.054 .056 -.094 -.264* -.197 -.229
*-.307
** .045 -.174 -.268**
Sig. (2-tailed) .000 .000 .000 .043 .000 .001 .032 .058 .002 .679 .001 .152 .070 .602 .611 .593 .371 .011 .060 .028 .003 .667 .094 .009
N 94 94 94 94 94 94 94 94 94 94 92 92 91 91 92 92 92 92 92 92 92 92 92 94 94
Pearson Correlation .692**
.747** 1 .351
**.250
*.383
**.304
** -.055 -.038 .286** -.012 .304
** .119 .143 .000 -.008 .045 -.013 -.308** -.178 -.125 -.289
** -.050 -.186 -.188
Sig. (2-tailed) .000 .000 .001 .015 .000 .003 .600 .716 .005 .909 .003 .263 .175 1.000 .941 .668 .899 .003 .089 .235 .005 .635 .072 .069
N 94 94 94 94 94 94 94 94 94 94 92 92 91 91 92 92 92 92 92 92 92 92 92 94 94
Pearson Correlation .418**
.440**
.351** 1 .378
**.484
**.302
** -.029 -.071 .172 .149 .144 .318**
.455** -.103 .218
* -.029 .081 -.064 .139 -.188 -.164 .194 -.117 -.258*
Sig. (2-tailed) .000 .000 .001 .000 .000 .003 .785 .495 .097 .156 .171 .002 .000 .329 .037 .786 .442 .543 .186 .072 .118 .064 .263 .012
N 94 94 94 94 94 94 94 94 94 94 92 92 91 91 92 92 92 92 92 92 92 92 92 94 94
Pearson Correlation .192 .209*
.250*
.378** 1 .325
** .096 .009 -.062 .082 .263* .081 .381
** .141 -.046 .103 -.336** -.032 -.052 -.004 -.142 -.046 .077 .076 .025
Sig. (2-tailed) .064 .043 .015 .000 .001 .359 .931 .551 .433 .011 .443 .000 .181 .665 .330 .001 .760 .622 .970 .175 .661 .467 .465 .809
N 94 94 94 94 94 94 94 94 94 94 92 92 91 91 92 92 92 92 92 92 92 92 92 94 94
Pearson Correlation .469**
.444**
.383**
.484**
.325** 1 .321
** -.093 -.117 .155 .257* .189 .329
**.394
** -.025 .082 .041 -.105 -.220* -.161 -.281
**-.213
* -.029 -.017 -.198
Sig. (2-tailed) .000 .000 .000 .000 .001 .002 .373 .263 .137 .013 .071 .001 .000 .817 .435 .700 .321 .035 .125 .007 .042 .782 .870 .056
N 94 94 94 94 94 94 94 94 94 94 92 92 91 91 92 92 92 92 92 92 92 92 92 94 94
Pearson Correlation .321**
.334**
.304**
.302** .096 .321
** 1 -.206* -.176 .422
** .122 .282** .042 .045 .222
* .058 .131 .186 .070 -.040 -.110 -.163 .143 -.224*
-.309**
Sig. (2-tailed) .002 .001 .003 .003 .359 .002 .046 .089 .000 .247 .006 .693 .669 .034 .586 .214 .076 .506 .706 .297 .121 .175 .030 .002
N 94 94 94 94 94 94 94 94 94 94 92 92 91 91 92 92 92 92 92 92 92 92 92 94 94
Pearson Correlation -.129 -.222* -.055 -.029 .009 -.093 -.206
* 1 .706**
-.303** .095 -.017 .030 -.113 -.091 .094 .054 -.030 .136 .153 .103 .401
** .043 .155 .177
Sig. (2-tailed) .216 .032 .600 .785 .931 .373 .046 .000 .003 .369 .873 .777 .285 .388 .375 .610 .778 .196 .145 .328 .000 .681 .136 .088
N 94 94 94 94 94 94 94 94 94 94 92 92 91 91 92 92 92 92 92 92 92 92 92 94 94
Pearson Correlation -.143 -.197 -.038 -.071 -.062 -.117 -.176 .706** 1 -.280
** .035 -.091 -.062 -.185 .073 .289** .110 .098 .255
* .192 .137 .223* .089 .049 .106
Sig. (2-tailed) .169 .058 .716 .495 .551 .263 .089 .000 .006 .740 .390 .561 .079 .488 .005 .296 .355 .014 .067 .191 .032 .401 .641 .311
N 94 94 94 94 94 94 94 94 94 94 92 92 91 91 92 92 92 92 92 92 92 92 92 94 94
Pearson Correlation .235*
.322**
.286** .172 .082 .155 .422
**-.303
**-.280
** 1 .069 .249* .012 -.036 -.084 -.118 -.018 .087 -.089 -.016 .088 -.216
* .020 -.199 -.170
Sig. (2-tailed) .023 .002 .005 .097 .433 .137 .000 .003 .006 .512 .017 .907 .736 .427 .263 .861 .411 .401 .880 .404 .038 .846 .055 .101
N 94 94 94 94 94 94 94 94 94 94 92 92 91 91 92 92 92 92 92 92 92 92 92 94 94
Pearson Correlation .007 .044 -.012 .149 .263*
.257* .122 .095 .035 .069 1 .287
**.405
**.283
** .204 .117 .062 .000 .126 .084 .080 .118 .169 .276** .106
Sig. (2-tailed) .947 .679 .909 .156 .011 .013 .247 .369 .740 .512 .006 .000 .007 .051 .268 .556 .997 .232 .426 .450 .261 .107 .008 .315
N 92 92 92 92 92 92 92 92 92 92 92 92 91 91 92 92 92 92 92 92 92 92 92 92 92
Pearson Correlation .208*
.333**
.304** .144 .081 .189 .282
** -.017 -.091 .249*
.287** 1 .270
**.228
* .063 .020 .086 .124 -.109 -.246* -.080 -.243
*.208
* -.075 -.189
Sig. (2-tailed) .047 .001 .003 .171 .443 .071 .006 .873 .390 .017 .006 .010 .030 .552 .853 .416 .240 .303 .018 .450 .020 .047 .479 .071
N 92 92 92 92 92 92 92 92 92 92 92 92 91 91 92 92 92 92 92 92 92 92 92 92 92
Pearson Correlation .104 .151 .119 .318**
.381**
.329** .042 .030 -.062 .012 .405
**.270
** 1 .523** -.042 .157 -.081 .036 -.047 -.092 -.028 -.075 .168 .253
* -.056
Sig. (2-tailed) .326 .152 .263 .002 .000 .001 .693 .777 .561 .907 .000 .010 .000 .689 .138 .446 .732 .659 .385 .791 .482 .111 .015 .600
N 91 91 91 91 91 91 91 91 91 91 91 91 91 91 91 91 91 91 91 91 91 91 91 91 91
Pearson Correlation .296** .191 .143 .455
** .141 .394** .045 -.113 -.185 -.036 .283
**.228
*.523
** 1 -.059 .068 -.037 .030 -.068 .104 .003 -.022 .002 -.009 -.237*
Sig. (2-tailed) .004 .070 .175 .000 .181 .000 .669 .285 .079 .736 .007 .030 .000 .576 .522 .725 .776 .519 .327 .981 .840 .986 .929 .024
N 91 91 91 91 91 91 91 91 91 91 91 91 91 91 91 91 91 91 91 91 91 91 91 91 91
Pearson Correlation -.063 -.055 .000 -.103 -.046 -.025 .222* -.091 .073 -.084 .204 .063 -.042 -.059 1 .473
**.209
*.249
*.222
* .095 .071 -.109 .075 -.153 -.176
Sig. (2-tailed) .552 .602 1.000 .329 .665 .817 .034 .388 .488 .427 .051 .552 .689 .576 .000 .045 .017 .034 .369 .501 .300 .475 .144 .093
N 92 92 92 92 92 92 92 92 92 92 92 92 91 91 92 92 92 92 92 92 92 92 92 92 92
Pearson Correlation -.079 -.054 -.008 .218* .103 .082 .058 .094 .289
** -.118 .117 .020 .157 .068 .473** 1 .196 .108 .179 .193 .081 .024 .088 -.104 -.130
Sig. (2-tailed) .454 .611 .941 .037 .330 .435 .586 .375 .005 .263 .268 .853 .138 .522 .000 .062 .304 .088 .065 .444 .823 .404 .325 .217
N 92 92 92 92 92 92 92 92 92 92 92 92 91 91 92 92 92 92 92 92 92 92 92 92 92
Pearson Correlation -.042 .056 .045 -.029 -.336** .041 .131 .054 .110 -.018 .062 .086 -.081 -.037 .209
* .196 1 .038 .127 .075 .160 .001 -.062 .071 .020
Sig. (2-tailed) .692 .593 .668 .786 .001 .700 .214 .610 .296 .861 .556 .416 .446 .725 .045 .062 .716 .227 .479 .128 .991 .558 .503 .853
N 92 92 92 92 92 92 92 92 92 92 92 92 91 91 92 92 92 92 92 92 92 92 92 92 92
Pearson Correlation -.104 -.094 -.013 .081 -.032 -.105 .186 -.030 .098 .087 .000 .124 .036 .030 .249* .108 .038 1 .479
** .126 .205* -.022 .110 -.128 -.165
Sig. (2-tailed) .323 .371 .899 .442 .760 .321 .076 .778 .355 .411 .997 .240 .732 .776 .017 .304 .716 .000 .233 .050 .837 .298 .225 .115
N 92 92 92 92 92 92 92 92 92 92 92 92 91 91 92 92 92 92 92 92 92 92 92 92 92
Pearson Correlation -.249*
-.264*
-.308** -.064 -.052 -.220
* .070 .136 .255* -.089 .126 -.109 -.047 -.068 .222
* .179 .127 .479** 1 .444
**.348
**.388
**.262
* -.002 .003
Sig. (2-tailed) .017 .011 .003 .543 .622 .035 .506 .196 .014 .401 .232 .303 .659 .519 .034 .088 .227 .000 .000 .001 .000 .012 .984 .979
N 92 92 92 92 92 92 92 92 92 92 92 92 91 91 92 92 92 92 92 92 92 92 92 92 92
Pearson Correlation -.163 -.197 -.178 .139 -.004 -.161 -.040 .153 .192 -.016 .084 -.246* -.092 .104 .095 .193 .075 .126 .444
** 1 .509**
.413** .202 -.042 -.037
Sig. (2-tailed) .121 .060 .089 .186 .970 .125 .706 .145 .067 .880 .426 .018 .385 .327 .369 .065 .479 .233 .000 .000 .000 .053 .694 .728
N 92 92 92 92 92 92 92 92 92 92 92 92 91 91 92 92 92 92 92 92 92 92 92 92 92
Pearson Correlation -.256*
-.229* -.125 -.188 -.142 -.281
** -.110 .103 .137 .088 .080 -.080 -.028 .003 .071 .081 .160 .205*
.348**
.509** 1 .453
** -.087 .011 .049
Sig. (2-tailed) .014 .028 .235 .072 .175 .007 .297 .328 .191 .404 .450 .450 .791 .981 .501 .444 .128 .050 .001 .000 .000 .410 .915 .640
N 92 92 92 92 92 92 92 92 92 92 92 92 91 91 92 92 92 92 92 92 92 92 92 92 92
Pearson Correlation -.162 -.307**
-.289** -.164 -.046 -.213
* -.163 .401**
.223*
-.216* .118 -.243
* -.075 -.022 -.109 .024 .001 -.022 .388**
.413**
.453** 1 .093 .055 .170
Sig. (2-tailed) .122 .003 .005 .118 .661 .042 .121 .000 .032 .038 .261 .020 .482 .840 .300 .823 .991 .837 .000 .000 .000 .377 .600 .105
N 92 92 92 92 92 92 92 92 92 92 92 92 91 91 92 92 92 92 92 92 92 92 92 92 92
Pearson Correlation .046 .045 -.050 .194 .077 -.029 .143 .043 .089 .020 .169 .208* .168 .002 .075 .088 -.062 .110 .262
* .202 -.087 .093 1 -.157 -.140
Sig. (2-tailed) .665 .667 .635 .064 .467 .782 .175 .681 .401 .846 .107 .047 .111 .986 .475 .404 .558 .298 .012 .053 .410 .377 .134 .185
N 92 92 92 92 92 92 92 92 92 92 92 92 91 91 92 92 92 92 92 92 92 92 92 92 92
Pearson Correlation -.322** -.174 -.186 -.117 .076 -.017 -.224
* .155 .049 -.199 .276** -.075 .253
* -.009 -.153 -.104 .071 -.128 -.002 -.042 .011 .055 -.157 1 .765**
Sig. (2-tailed) .002 .094 .072 .263 .465 .870 .030 .136 .641 .055 .008 .479 .015 .929 .144 .325 .503 .225 .984 .694 .915 .600 .134 .000
N 94 94 94 94 94 94 94 94 94 94 92 92 91 91 92 92 92 92 92 92 92 92 92 95 95
Pearson Correlation -.347**
-.268** -.188 -.258
* .025 -.198 -.309** .177 .106 -.170 .106 -.189 -.056 -.237
* -.176 -.130 .020 -.165 .003 -.037 .049 .170 -.140 .765** 1
Sig. (2-tailed) .001 .009 .069 .012 .809 .056 .002 .088 .311 .101 .315 .071 .600 .024 .093 .217 .853 .115 .979 .728 .640 .105 .185 .000
N 94 94 94 94 94 94 94 94 94 94 92 92 91 91 92 92 92 92 92 92 92 92 92 95 95
*. Correlation is significant at the 0.05 level (2-tailed).
Q11_8
Q11_9
Bio2
Bio4
**. Correlation is significant at the 0.01 level (2-tailed).
Q11_3
Q11_4
Q11_5
Q11_6
Q11_7
Q10_2
Q10_3
Q10_4
Q11_1
Q11_2
Q9_7
Q9_8
Q9_9
Q9_10
Q10_1
Q9_2
Q9_3
Q9_4
Q9_5
Q9_6
Syntax
Resources
Correlations
Q9_1
Notes
Output Created
Comments
Input
Missing Value Handling

85
Annexure D: Frequency Tables
Frequency Percent Valid Percent
Cumulative
Percent
1 53 55.8 56.4 56.4
2 41 43.2 43.6 100.0
Total 94 98.9 100.0
Missing System 1 1.1
95 100.0
Frequency Percent Valid Percent
Cumulative
Percent
1 9 9.5 9.5 9.5
2 14 14.7 14.7 24.2
3 6 14.7 6.3 30.5
4 8 14.7 8.4 38.9
5 7 14.7 7.4 46.3
6 4 14.7 4.2 50.5
7 3 14.7 3.2 53.7
8 16 14.7 16.8 70.5
9 9 14.7 9.5 80.0
10 7 14.7 7.4 87.4
11 12 14.7 12.6 100.0
Total 95 14.7 100.0
Frequency Percent Valid Percent
Cumulative
Percent
1 5 5.3 5.3 5.3
2 10 10.5 10.5 15.8
3 23 24.2 24.2 40.0
4 5 5.3 5.3 45.3
5 12 12.6 12.6 57.9
6 26 27.4 27.4 85.3
7 14 14.7 14.7 100.0
Total 95 100.0 100.0
Valid
Total
Bio3
Valid
Bio5
Bio1
Valid

86
Frequency Percent Valid Percent
Cumulative
Percent
1.0 22 23.2 23.2 23.2
2.0 35 36.8 36.8 60.0
3.0 36 37.9 37.9 97.9
4.0 2 2.1 2.1 100.0
Total 95 100.0 100.0
Frequency Percent Valid Percent
Cumulative
Percent
1 58 61.1 61.1 61.1
2 30 31.6 31.6 92.6
3 6 6.3 6.3 98.9
10 1 1.1 1.1 100.0
Total 95 100.0 100.0
Bio7
Valid
Bio6
Valid
Frequency Percent Valid Percent
Cumulative
Percent
1.0 8 8.4 8.4 8.4
2.0 50 52.6 52.6 61.1
3.0 32 33.7 33.7 94.7
4.0 5 5.3 5.3 100.0
Total 95 100.0 100.0
Frequency Percent Valid Percent
Cumulative
Percent
1 39 41.1 41.5 41.5
2 46 48.4 48.9 90.4
3 8 8.4 8.5 98.9
4 1 1.1 1.1 100.0
Total 94 98.9 100.0
Missing System 1 1.1
95 100.0
Frequency Percent Valid Percent
Cumulative
Percent
1 33 34.7 35.1 35.1
2 41 43.2 43.6 78.7
3 19 20.0 20.2 98.9
4 1 1.1 1.1 100.0
Total 94 98.9 100.0
Missing System 1 1.1
95 100.0
Q9_2
Valid
Total
Valid
Q9_1
Valid
Total
Bio8

87
Frequency Percent Valid Percent
Cumulative
Percent
1 26 27.4 27.7 27.7
2 40 42.1 42.6 70.2
3 25 26.3 26.6 96.8
4 3 3.2 3.2 100.0
Total 94 98.9 100.0
Missing System 1 1.1
95 100.0
Frequency Percent Valid Percent
Cumulative
Percent
1 39 41.1 41.5 41.5
2 37 38.9 39.4 80.9
3 15 15.8 16.0 96.8
4 3 3.2 3.2 100.0
Total 94 98.9 100.0
Missing System 1 1.1
95 100.0
Frequency Percent Valid Percent
Cumulative
Percent
1 63 66.3 67.0 67.0
2 23 24.2 24.5 91.5
3 4 4.2 4.3 95.7
4 4 4.2 4.3 100.0
Total 94 98.9 100.0
Missing System 1 1.1
95 100.0Total
Valid
Total
Q9_5
Valid
Valid
Total
Q9_4
Q9_3

88
Frequency Percent Valid Percent
Cumulative
Percent
1 44 46.3 46.8 46.8
2 32 33.7 34.0 80.9
3 14 14.7 14.9 95.7
4 4 4.2 4.3 100.0
Total 94 98.9 100.0
Missing System 1 1.1
95 100.0
Frequency Percent Valid Percent
Cumulative
Percent
1 18 18.9 19.1 19.1
2 35 36.8 37.2 56.4
3 28 29.5 29.8 86.2
4 13 13.7 13.8 100.0
Total 94 98.9 100.0
Missing System 1 1.1
95 100.0
Frequency Percent Valid Percent
Cumulative
Percent
1 9 9.5 9.6 9.6
2 26 27.4 27.7 37.2
3 36 37.9 38.3 75.5
4 23 24.2 24.5 100.0
Total 94 98.9 100.0
Missing System 1 1.1
95 100.0
Valid
Total
Q9_7
Valid
Total
Q9_8
Q9_6
Valid
Total

89
Frequency Percent Valid Percent
Cumulative
Percent
1 6 6.3 6.4 6.4
2 22 23.2 23.4 29.8
3 41 43.2 43.6 73.4
4 25 26.3 26.6 100.0
Total 94 98.9 100.0
Missing System 1 1.1
95 100.0
Frequency Percent Valid Percent
Cumulative
Percent
1 19 20.0 20.2 20.2
2 49 51.6 52.1 72.3
3 23 24.2 24.5 96.8
4 3 3.2 3.2 100.0
Total 94 98.9 100.0
Missing System 1 1.1
95 100.0
Frequency Percent Valid Percent
Cumulative
Percent
1 66 69.5 71.7 71.7
2 26 27.4 28.3 100.0
Total 92 96.8 100.0
Missing System 3 3.2
95 100.0
Total
Q10_1
Valid
Total
Valid
Total
Q9_10
Valid
Q9_9

90
Frequency Percent Valid Percent
Cumulative
Percent
1 26 27.4 28.3 28.3
2 66 69.5 71.7 100.0
Total 92 96.8 100.0
Missing System 3 3.2
95 100.0
Frequency Percent Valid Percent
Cumulative
Percent
1 77 81.1 84.6 84.6
2 14 14.7 15.4 100.0
Total 91 95.8 100.0
Missing System 4 4.2
95 100.0
Frequency Percent Valid Percent
Cumulative
Percent
1 75 78.9 82.4 82.4
2 16 16.8 17.6 100.0
Total 91 95.8 100.0
Missing System 4 4.2
95 100.0
Valid
Total
Valid
Total
Q10_4
Q10_2
Valid
Total
Q10_3
Frequency Percent Valid Percent
Cumulative
Percent
1 16 16.8 17.4 17.4
2 31 32.6 33.7 51.1
3 12 12.6 13.0 64.1
4 3 3.2 3.3 67.4
5 30 31.6 32.6 100.0
Total 92 96.8 100.0
Missing System 3 3.2
95 100.0
Frequency Percent Valid Percent
Cumulative
Percent
1 15 15.8 16.3 16.3
2 26 27.4 28.3 44.6
3 21 22.1 22.8 67.4
4 7 7.4 7.6 75.0
5 23 24.2 25.0 100.0
Total 92 96.8 100.0
Missing System 3 3.2
95 100.0
Total
Q11_2
Valid
Total
Q11_1
Valid

91
Frequency Percent Valid Percent
Cumulative
Percent
1 5 5.3 5.4 5.4
2 12 12.6 13.0 18.5
3 30 31.6 32.6 51.1
4 38 40.0 41.3 92.4
5 7 7.4 7.6 100.0
Total 92 96.8 100.0
Missing System 3 3.2
95 100.0
Frequency Percent Valid Percent
Cumulative
Percent
1 9 9.5 9.8 9.8
2 30 31.6 32.6 42.4
3 23 24.2 25.0 67.4
4 5 5.3 5.4 72.8
5 25 26.3 27.2 100.0
Total 92 96.8 100.0
Missing System 3 3.2
95 100.0
Valid
Total
Q11_3
Valid
Total
Q11_4
Frequency Percent Valid Percent
Cumulative
Percent
1 26 27.4 28.3 28.3
2 26 27.4 28.3 56.5
3 17 17.9 18.5 75.0
4 8 8.4 8.7 83.7
5 15 15.8 16.3 100.0
Total 92 96.8 100.0
Missing System 3 3.2
95 100.0
Frequency Percent Valid Percent
Cumulative
Percent
1 41 43.2 44.6 44.6
2 23 24.2 25.0 69.6
3 19 20.0 20.7 90.2
4 2 2.1 2.2 92.4
5 7 7.4 7.6 100.0
Total 92 96.8 100.0
Missing System 3 3.2
95 100.0Total
Valid
Total
Q11_6
Valid
Q11_5

92
Frequency Percent Valid Percent
Cumulative
Percent
1 13 13.7 14.1 14.1
2 39 41.1 42.4 56.5
3 25 26.3 27.2 83.7
4 12 12.6 13.0 96.7
5 3 3.2 3.3 100.0
Total 92 96.8 100.0
Missing System 3 3.2
95 100.0
Frequency Percent Valid Percent
Cumulative
Percent
1 5 5.3 5.4 5.4
2 45 47.4 48.9 54.3
3 22 23.2 23.9 78.3
4 16 16.8 17.4 95.7
5 4 4.2 4.3 100.0
Total 92 96.8 100.0
Missing System 3 3.2
95 100.0
Q11_8
Valid
Total
Q11_7
Valid
Total
Frequency Percent Valid Percent
Cumulative
Percent
1 3 3.2 3.3 3.3
2 27 28.4 29.3 32.6
3 21 22.1 22.8 55.4
4 19 20.0 20.7 76.1
5 22 23.2 23.9 100.0
Total 92 96.8 100.0
Missing System 3 3.2
95 100.0
Valid
Total
Q11_9