Embed Size (px)
Citation preview
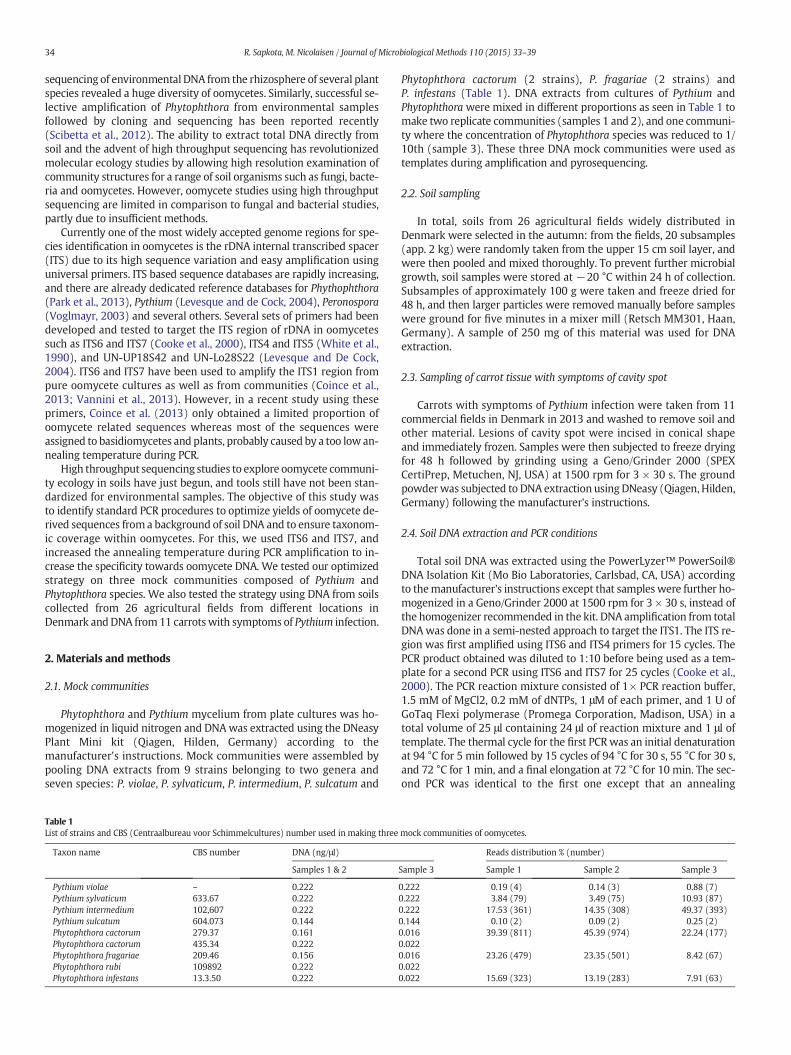
Journal of Microbiological Methods 110 (2015) 33–39
Contents lists available at ScienceDirect
Journal of Microbiological Methods
j ourna l homepage: www.e lsev ie r .com/ locate / jmicmeth
An improved high throughput sequencing method for studyingoomycete communities
Rumakanta Sapkota, Mogens Nicolaisen ⁎Aarhus University, Faculty of Science and Technology, Department of Agroecology, Forsøgsvej 1, DK-4200 Slagelse, Denmark
⁎ Corresponding author.E-mail address: [email protected] (M. Nicolaisen).
http://dx.doi.org/10.1016/j.mimet.2015.01.0130167-7012/© 2015 Published by Elsevier B.V.
a b s t r a c t
a r t i c l e i n f oArticle history:Received 22 December 2014Received in revised form 16 January 2015Accepted 16 January 2015Available online 17 January 2015
Keywords:OomyceteNext generation sequencingITSSoil communityCavity spot
Culture-independent studies using next generation sequencing have revolutionizedmicrobial ecology, however,oomycete ecology in soils is severely lagging behind. The aim of this study was to improve and validate standardtechniques for using high throughput sequencing as a tool for studying oomycete communities. The well-knownprimer sets ITS4, ITS6 and ITS7were used in the study in a semi-nested PCR approach to target the internal tran-scribed spacer (ITS) 1 of ribosomal DNA in a next generation sequencing protocol. These primers have been usedin similar studies before, butwith limited success.Wewere able to increase the proportion of retrieved oomycetesequences dramaticallymainly by increasing the annealing temperature during PCR. The optimized protocol wasvalidated using three mock communities and the method was further evaluated using total DNA from 26 soilsamples collected from different agricultural fields in Denmark, and 11 samples from carrot tissue with symp-toms of Pythium infection. Sequence data from the Pythium and Phytophthora mock communities showed thatour strategy successfully detected all included species. Taxonomic assignments of OTUs from 26 soil sampleshowed that 95% of the sequences could be assigned to oomycetes including Pythium, Aphanomyces, Peronospora,Saprolegnia and Phytophthora. A highproportion of oomycete readswas consistently present in all 26 soil samplesshowing the versatility of the strategy. A large diversity of Pythium species including pathogenic and saprophyticspecies were dominating in cultivated soil. Finally, we analyzed amplicons from carrots with symptoms of cavityspot. This resulted in 94% of the reads belonging to oomycetes with a dominance of species of Pythium that areknown to be involved in causing cavity spot, thus demonstrating the usefulness of the method not only in soilDNA but also in a plant DNA background. In conclusion, we demonstrate a successful approach for pyrosequenc-ing of oomycete communities using ITS1 as the barcode sequence with well-known primers for oomycete DNAamplification.
© 2015 Published by Elsevier B.V.
1. Introduction
The oomycota are fungal-like microorganisms that are currentlyclassified under Stramenopiles. Although oomycetes are similar tofungi in relation to their mode of nutrition and growth, they are differ-ent in terms of cytology as well as biochemical pathways (Beakeset al., 2012). Phylogenetic studies have revealed that oomycetes areclosely related to diatoms and seaweeds, and probably linked to thema-rine environment during evolution (Thines, 2014). Oomycetes arefound in a wide range of ecosystems and can be found in terrestrialand aquatic environments. Important oomycetes include Saprolegnia,Achlya and Lagenidium which are mainly infecting animals, andPhytophthora, Pythium, Aphanomyces and Peronospora that are impor-tant plant pathogens (Thines, 2014). Many of these are soil-borne andinfect through roots or seedlings (Kamoun, 2003). In the absence ofsuitable host plants or other substrates for saprophytic growth theymay survive in the soil for long periods of time as thick-walled sexual
oospores. Sporangia are asexual structures that may germinate to pro-duce a germ tube or that may produce motile zoospores that are ableto infect plants through roots or seedlings. Despite the economic impor-tance of oomycetes, relatively few ecological studies have been con-ducted on this group of organisms. To date, most studies have focusedon individual or a fewpathogenic species, and there are only few studiesthat aim to understand interactions and dynamics in oomycete commu-nities in soil (Cooke, 2007; Coince et al., 2013). Many of the plant dis-eases that are caused by oomycetes involve a complex of severalspecies emphasizing the need to not only study single pathogens butalso use a community approach in studies of disease. For instance, cavityspot in carrot is caused by a number of species within Pythium such asPythium violae, Pythium intermedium, P. sulcatum, Pythium sylvaticumand others (Hermansen et al., 2007).
Molecular ecological studies of microbial communities in terrestrialhabitats such as soils have revealed a huge diversity of previously un-known and non-culturable organisms (van Elsas and Boersma, 2011).Very few of these studies have included oomycetes, and efficient strate-gies for studying the diversity of oomycetes in the environment arenon-existing. A study by Arcate et al. (2006) using cloning and
34 R. Sapkota, M. Nicolaisen / Journal of Microbiological Methods 110 (2015) 33–39
sequencing of environmental DNA from the rhizosphere of several plantspecies revealed a huge diversity of oomycetes. Similarly, successful se-lective amplification of Phytophthora from environmental samplesfollowed by cloning and sequencing has been reported recently(Scibetta et al., 2012). The ability to extract total DNA directly fromsoil and the advent of high throughput sequencing has revolutionizedmolecular ecology studies by allowing high resolution examination ofcommunity structures for a range of soil organisms such as fungi, bacte-ria and oomycetes. However, oomycete studies using high throughputsequencing are limited in comparison to fungal and bacterial studies,partly due to insufficient methods.
Currently one of the most widely accepted genome regions for spe-cies identification in oomycetes is the rDNA internal transcribed spacer(ITS) due to its high sequence variation and easy amplification usinguniversal primers. ITS based sequence databases are rapidly increasing,and there are already dedicated reference databases for Phythophthora(Park et al., 2013), Pythium (Levesque and de Cock, 2004), Peronospora(Voglmayr, 2003) and several others. Several sets of primers had beendeveloped and tested to target the ITS region of rDNA in oomycetessuch as ITS6 and ITS7 (Cooke et al., 2000), ITS4 and ITS5 (White et al.,1990), and UN-UP18S42 and UN-Lo28S22 (Levesque and De Cock,2004). ITS6 and ITS7 have been used to amplify the ITS1 region frompure oomycete cultures as well as from communities (Coince et al.,2013; Vannini et al., 2013). However, in a recent study using theseprimers, Coince et al. (2013) only obtained a limited proportion ofoomycete related sequences whereas most of the sequences wereassigned to basidiomycetes and plants, probably caused by a too lowan-nealing temperature during PCR.
High throughput sequencing studies to explore oomycete communi-ty ecology in soils have just begun, and tools still have not been stan-dardized for environmental samples. The objective of this study wasto identify standard PCR procedures to optimize yields of oomycete de-rived sequences from a background of soil DNA and to ensure taxonom-ic coverage within oomycetes. For this, we used ITS6 and ITS7, andincreased the annealing temperature during PCR amplification to in-crease the specificity towards oomycete DNA. We tested our optimizedstrategy on three mock communities composed of Pythium andPhytophthora species. We also tested the strategy using DNA from soilscollected from 26 agricultural fields from different locations inDenmark andDNA from 11 carrots with symptoms of Pythium infection.
2. Materials and methods
2.1. Mock communities
Phytophthora and Pythium mycelium from plate cultures was ho-mogenized in liquid nitrogen and DNAwas extracted using the DNeasyPlant Mini kit (Qiagen, Hilden, Germany) according to themanufacturer's instructions. Mock communities were assembled bypooling DNA extracts from 9 strains belonging to two genera andseven species: P. violae, P. sylvaticum, P. intermedium, P. sulcatum and
Table 1List of strains and CBS (Centraalbureau voor Schimmelcultures) number used in making three
Taxon name CBS number DNA (ng/μl)
Samples 1 & 2
Pythium violae – 0.222Pythium sylvaticum 633.67 0.222Pythium intermedium 102,607 0.222Pythium sulcatum 604.073 0.144Phytophthora cactorum 279.37 0.161Phytophthora cactorum 435.34 0.222Phytophthora fragariae 209.46 0.156Phytophthora rubi 109892 0.222Phytophthora infestans 13.3.50 0.222
Phytophthora cactorum (2 strains), P. fragariae (2 strains) andP. infestans (Table 1). DNA extracts from cultures of Pythium andPhytophthora were mixed in different proportions as seen in Table 1 tomake two replicate communities (samples 1 and 2), and one communi-ty where the concentration of Phytophthora species was reduced to 1/10th (sample 3). These three DNA mock communities were used astemplates during amplification and pyrosequencing.
2.2. Soil sampling
In total, soils from 26 agricultural fields widely distributed inDenmark were selected in the autumn: from the fields, 20 subsamples(app. 2 kg) were randomly taken from the upper 15 cm soil layer, andwere then pooled and mixed thoroughly. To prevent further microbialgrowth, soil samples were stored at −20 °C within 24 h of collection.Subsamples of approximately 100 g were taken and freeze dried for48 h, and then larger particles were removed manually before sampleswere ground for five minutes in a mixer mill (Retsch MM301, Haan,Germany). A sample of 250 mg of this material was used for DNAextraction.
2.3. Sampling of carrot tissue with symptoms of cavity spot
Carrots with symptoms of Pythium infection were taken from 11commercial fields in Denmark in 2013 and washed to remove soil andother material. Lesions of cavity spot were incised in conical shapeand immediately frozen. Samples were then subjected to freeze dryingfor 48 h followed by grinding using a Geno/Grinder 2000 (SPEXCertiPrep, Metuchen, NJ, USA) at 1500 rpm for 3 × 30 s. The groundpowderwas subjected to DNA extraction using DNeasy (Qiagen, Hilden,Germany) following the manufacturer's instructions.
2.4. Soil DNA extraction and PCR conditions
Total soil DNA was extracted using the PowerLyzer™ PowerSoil®DNA Isolation Kit (Mo Bio Laboratories, Carlsbad, CA, USA) accordingto themanufacturer's instructions except that samples were further ho-mogenized in a Geno/Grinder 2000 at 1500 rpm for 3 × 30 s, instead ofthe homogenizer recommended in the kit. DNA amplification from totalDNAwas done in a semi-nested approach to target the ITS1. The ITS re-gion was first amplified using ITS6 and ITS4 primers for 15 cycles. ThePCR product obtained was diluted to 1:10 before being used as a tem-plate for a second PCR using ITS6 and ITS7 for 25 cycles (Cooke et al.,2000). The PCR reaction mixture consisted of 1× PCR reaction buffer,1.5 mM of MgCl2, 0.2 mM of dNTPs, 1 μM of each primer, and 1 U ofGoTaq Flexi polymerase (Promega Corporation, Madison, USA) in atotal volume of 25 μl containing 24 μl of reaction mixture and 1 μl oftemplate. The thermal cycle for the first PCRwas an initial denaturationat 94 °C for 5 min followed by 15 cycles of 94 °C for 30 s, 55 °C for 30 s,and 72 °C for 1 min, and a final elongation at 72 °C for 10 min. The sec-ond PCR was identical to the first one except that an annealing
mock communities of oomycetes.
Reads distribution % (number)
Sample 3 Sample 1 Sample 2 Sample 3
0.222 0.19 (4) 0.14 (3) 0.88 (7)0.222 3.84 (79) 3.49 (75) 10.93 (87)0.222 17.53 (361) 14.35 (308) 49.37 (393)0.144 0.10 (2) 0.09 (2) 0.25 (2)0.016 39.39 (811) 45.39 (974) 22.24 (177)0.0220.016 23.26 (479) 23.35 (501) 8.42 (67)0.0220.022 15.69 (323) 13.19 (283) 7.91 (63)
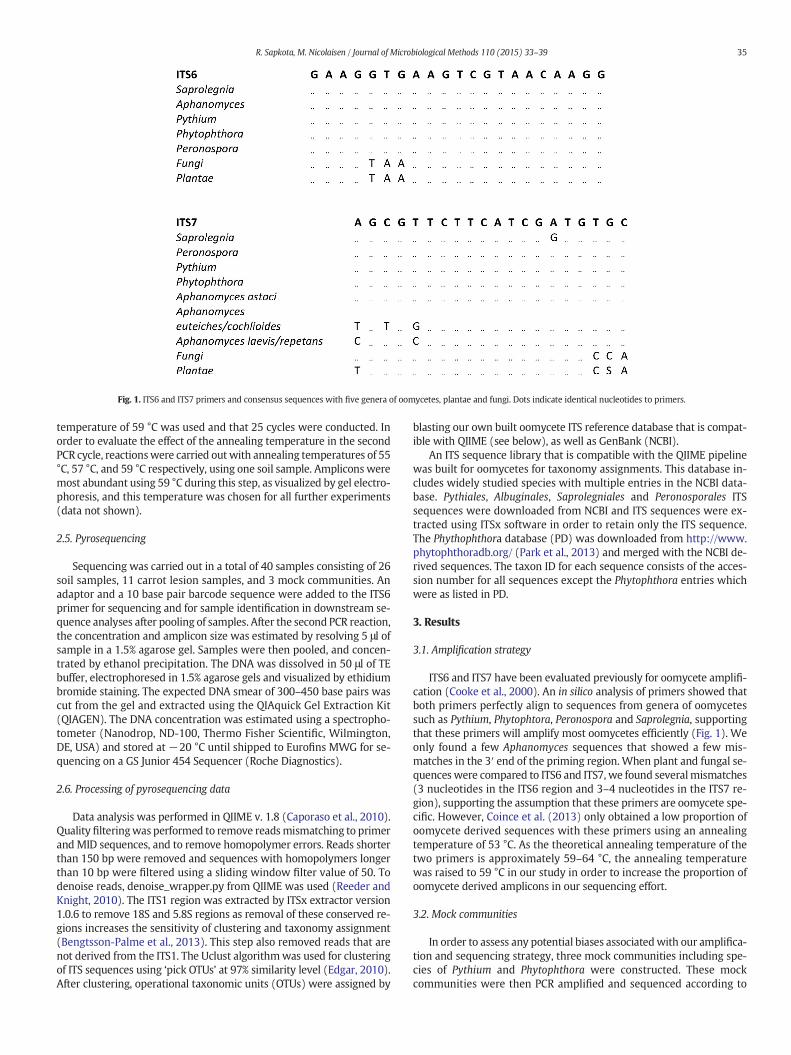
Fig. 1. ITS6 and ITS7 primers and consensus sequences with five genera of oomycetes, plantae and fungi. Dots indicate identical nucleotides to primers.
35R. Sapkota, M. Nicolaisen / Journal of Microbiological Methods 110 (2015) 33–39
temperature of 59 °C was used and that 25 cycles were conducted. Inorder to evaluate the effect of the annealing temperature in the secondPCR cycle, reactionswere carried out with annealing temperatures of 55°C, 57 °C, and 59 °C respectively, using one soil sample. Amplicons weremost abundant using 59 °C during this step, as visualized by gel electro-phoresis, and this temperature was chosen for all further experiments(data not shown).
2.5. Pyrosequencing
Sequencing was carried out in a total of 40 samples consisting of 26soil samples, 11 carrot lesion samples, and 3 mock communities. Anadaptor and a 10 base pair barcode sequence were added to the ITS6primer for sequencing and for sample identification in downstream se-quence analyses after pooling of samples. After the second PCR reaction,the concentration and amplicon size was estimated by resolving 5 μl ofsample in a 1.5% agarose gel. Samples were then pooled, and concen-trated by ethanol precipitation. The DNA was dissolved in 50 μl of TEbuffer, electrophoresed in 1.5% agarose gels and visualized by ethidiumbromide staining. The expected DNA smear of 300–450 base pairs wascut from the gel and extracted using the QIAquick Gel Extraction Kit(QIAGEN). The DNA concentration was estimated using a spectropho-tometer (Nanodrop, ND-100, Thermo Fisher Scientific, Wilmington,DE, USA) and stored at −20 °C until shipped to Eurofins MWG for se-quencing on a GS Junior 454 Sequencer (Roche Diagnostics).
2.6. Processing of pyrosequencing data
Data analysis was performed in QIIME v. 1.8 (Caporaso et al., 2010).Quality filteringwas performed to remove readsmismatching to primerandMID sequences, and to remove homopolymer errors. Reads shorterthan 150 bp were removed and sequences with homopolymers longerthan 10 bp were filtered using a sliding window filter value of 50. Todenoise reads, denoise_wrapper.py from QIIME was used (Reeder andKnight, 2010). The ITS1 region was extracted by ITSx extractor version1.0.6 to remove 18S and 5.8S regions as removal of these conserved re-gions increases the sensitivity of clustering and taxonomy assignment(Bengtsson-Palme et al., 2013). This step also removed reads that arenot derived from the ITS1. The Uclust algorithmwas used for clusteringof ITS sequences using ‘pick OTUs’ at 97% similarity level (Edgar, 2010).After clustering, operational taxonomic units (OTUs) were assigned by
blasting our own built oomycete ITS reference database that is compat-ible with QIIME (see below), as well as GenBank (NCBI).
An ITS sequence library that is compatible with the QIIME pipelinewas built for oomycetes for taxonomy assignments. This database in-cludes widely studied species with multiple entries in the NCBI data-base. Pythiales, Albuginales, Saprolegniales and Peronosporales ITSsequences were downloaded from NCBI and ITS sequences were ex-tracted using ITSx software in order to retain only the ITS sequence.The Phythophthora database (PD) was downloaded from http://www.phytophthoradb.org/ (Park et al., 2013) and merged with the NCBI de-rived sequences. The taxon ID for each sequence consists of the acces-sion number for all sequences except the Phytophthora entries whichwere as listed in PD.
3. Results
3.1. Amplification strategy
ITS6 and ITS7 have been evaluated previously for oomycete amplifi-cation (Cooke et al., 2000). An in silico analysis of primers showed thatboth primers perfectly align to sequences from genera of oomycetessuch as Pythium, Phytophtora, Peronospora and Saprolegnia, supportingthat these primers will amplify most oomycetes efficiently (Fig. 1). Weonly found a few Aphanomyces sequences that showed a few mis-matches in the 3′ end of the priming region. When plant and fungal se-quences were compared to ITS6 and ITS7, we found severalmismatches(3 nucleotides in the ITS6 region and 3–4 nucleotides in the ITS7 re-gion), supporting the assumption that these primers are oomycete spe-cific. However, Coince et al. (2013) only obtained a low proportion ofoomycete derived sequences with these primers using an annealingtemperature of 53 °C. As the theoretical annealing temperature of thetwo primers is approximately 59–64 °C, the annealing temperaturewas raised to 59 °C in our study in order to increase the proportion ofoomycete derived amplicons in our sequencing effort.
3.2. Mock communities
In order to assess any potential biases associatedwith our amplifica-tion and sequencing strategy, three mock communities including spe-cies of Pythium and Phytophthora were constructed. These mockcommunities were then PCR amplified and sequenced according to
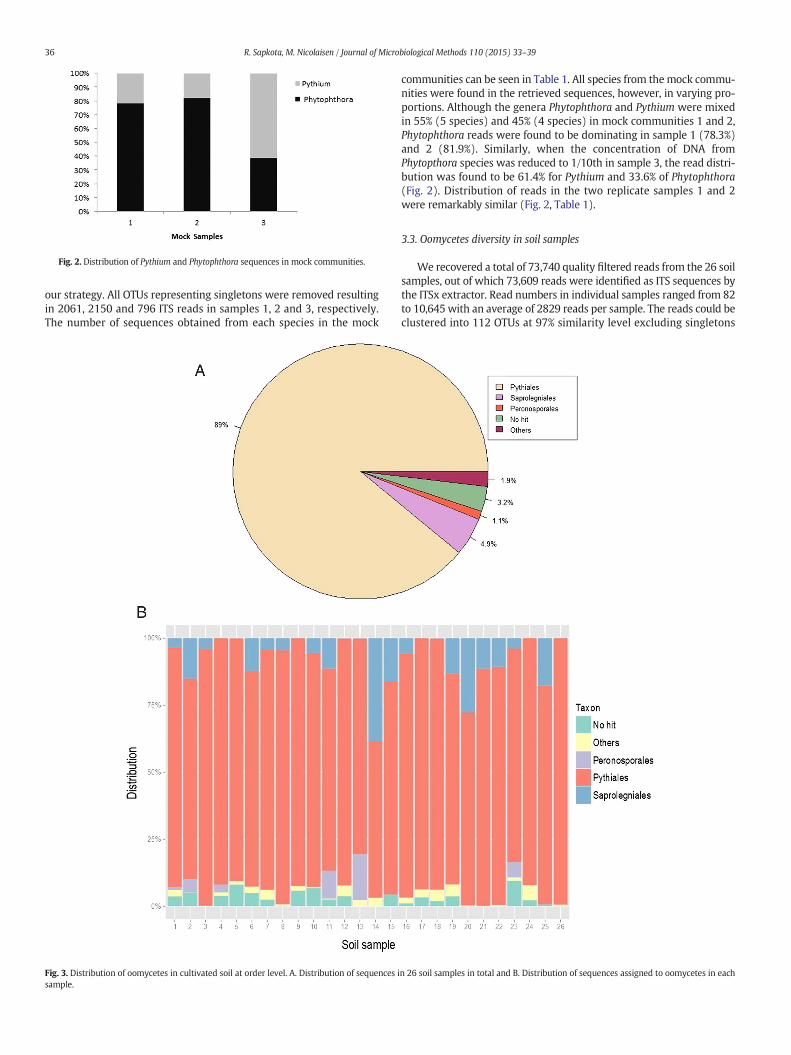
Fig. 2. Distribution of Pythium and Phytophthora sequences in mock communities.
36 R. Sapkota, M. Nicolaisen / Journal of Microbiological Methods 110 (2015) 33–39
our strategy. All OTUs representing singletons were removed resultingin 2061, 2150 and 796 ITS reads in samples 1, 2 and 3, respectively.The number of sequences obtained from each species in the mock
Fig. 3. Distribution of oomycetes in cultivated soil at order level. A. Distribution of sequences isample.
communities can be seen in Table 1. All species from themock commu-nities were found in the retrieved sequences, however, in varying pro-portions. Although the genera Phytophthora and Pythium were mixedin 55% (5 species) and 45% (4 species) in mock communities 1 and 2,Phytophthora reads were found to be dominating in sample 1 (78.3%)and 2 (81.9%). Similarly, when the concentration of DNA fromPhytopthora species was reduced to 1/10th in sample 3, the read distri-bution was found to be 61.4% for Pythium and 33.6% of Phytophthora(Fig. 2). Distribution of reads in the two replicate samples 1 and 2were remarkably similar (Fig. 2, Table 1).
3.3. Oomycetes diversity in soil samples
We recovered a total of 73,740 quality filtered reads from the 26 soilsamples, out of which 73,609 reads were identified as ITS sequences bythe ITSx extractor. Read numbers in individual samples ranged from 82to 10,645 with an average of 2829 reads per sample. The reads could beclustered into 112 OTUs at 97% similarity level excluding singletons
n 26 soil samples in total and B. Distribution of sequences assigned to oomycetes in each
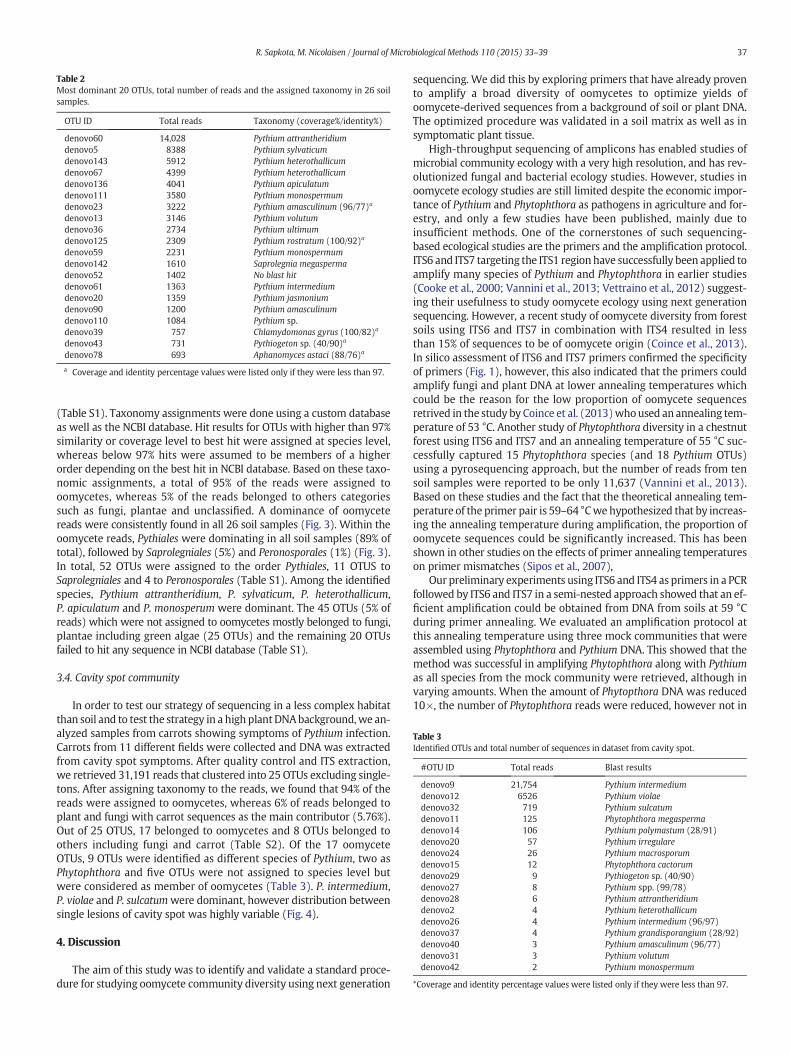
Table 3Identified OTUs and total number of sequences in dataset from cavity spot.
#OTU ID Total reads Blast results
denovo9 21,754 Pythium intermediumdenovo12 6526 Pythium violaedenovo32 719 Pythium sulcatumdenovo11 125 Phytophthora megaspermadenovo14 106 Pythium polymastum (28/91)denovo20 57 Pythium irregularedenovo24 26 Pythium macrosporumdenovo15 12 Phytophthora cactorumdenovo29 9 Pythiogeton sp. (40/90)denovo27 8 Pythium spp. (99/78)denovo28 6 Pythium attrantheridiumdenovo2 4 Pythium heterothallicumdenovo26 4 Pythium intermedium (96/97)denovo37 4 Pythium grandisporangium (28/92)denovo40 3 Pythium amasculinum (96/77)denovo31 3 Pythium volutumdenovo42 2 Pythium monospermum
*Coverage and identity percentage values were listed only if they were less than 97.
Table 2Most dominant 20 OTUs, total number of reads and the assigned taxonomy in 26 soilsamples.
OTU ID Total reads Taxonomy (coverage%/identity%)
denovo60 14,028 Pythium attrantheridiumdenovo5 8388 Pythium sylvaticumdenovo143 5912 Pythium heterothallicumdenovo67 4399 Pythium heterothallicumdenovo136 4041 Pythium apiculatumdenovo111 3580 Pythium monospermumdenovo23 3222 Pythium amasculinum (96/77)a
denovo13 3146 Pythium volutumdenovo36 2734 Pythium ultimumdenovo125 2309 Pythium rostratum (100/92)a
denovo59 2231 Pythium monospermumdenovo142 1610 Saprolegnia megaspermadenovo52 1402 No blast hitdenovo61 1363 Pythium intermediumdenovo20 1359 Pythium jasmoniumdenovo90 1200 Pythium amasculinumdenovo110 1084 Pythium sp.denovo39 757 Chlamydomonas gyrus (100/82)a
denovo43 731 Pythiogeton sp. (40/90)a
denovo78 693 Aphanomyces astaci (88/76)a
a Coverage and identity percentage values were listed only if they were less than 97.
37R. Sapkota, M. Nicolaisen / Journal of Microbiological Methods 110 (2015) 33–39
(Table S1). Taxonomy assignments were done using a custom databaseas well as the NCBI database. Hit results for OTUs with higher than 97%similarity or coverage level to best hit were assigned at species level,whereas below 97% hits were assumed to be members of a higherorder depending on the best hit in NCBI database. Based on these taxo-nomic assignments, a total of 95% of the reads were assigned tooomycetes, whereas 5% of the reads belonged to others categoriessuch as fungi, plantae and unclassified. A dominance of oomycetereads were consistently found in all 26 soil samples (Fig. 3). Within theoomycete reads, Pythiales were dominating in all soil samples (89% oftotal), followed by Saprolegniales (5%) and Peronosporales (1%) (Fig. 3).In total, 52 OTUs were assigned to the order Pythiales, 11 OTUS toSaprolegniales and 4 to Peronosporales (Table S1). Among the identifiedspecies, Pythium attrantheridium, P. sylvaticum, P. heterothallicum,P. apiculatum and P. monosperum were dominant. The 45 OTUs (5% ofreads) which were not assigned to oomycetes mostly belonged to fungi,plantae including green algae (25 OTUs) and the remaining 20 OTUsfailed to hit any sequence in NCBI database (Table S1).
3.4. Cavity spot community
In order to test our strategy of sequencing in a less complex habitatthan soil and to test the strategy in a high plantDNAbackground,we an-alyzed samples from carrots showing symptoms of Pythium infection.Carrots from 11 different fields were collected and DNA was extractedfrom cavity spot symptoms. After quality control and ITS extraction,we retrieved 31,191 reads that clustered into 25 OTUs excluding single-tons. After assigning taxonomy to the reads, we found that 94% of thereads were assigned to oomycetes, whereas 6% of reads belonged toplant and fungi with carrot sequences as the main contributor (5.76%).Out of 25 OTUS, 17 belonged to oomycetes and 8 OTUs belonged toothers including fungi and carrot (Table S2). Of the 17 oomyceteOTUs, 9 OTUs were identified as different species of Pythium, two asPhytophthora and five OTUs were not assigned to species level butwere considered as member of oomycetes (Table 3). P. intermedium,P. violae and P. sulcatumwere dominant, however distribution betweensingle lesions of cavity spot was highly variable (Fig. 4).
4. Discussion
The aim of this study was to identify and validate a standard proce-dure for studying oomycete community diversity using next generation
sequencing. We did this by exploring primers that have already provento amplify a broad diversity of oomycetes to optimize yields ofoomycete-derived sequences from a background of soil or plant DNA.The optimized procedure was validated in a soil matrix as well as insymptomatic plant tissue.
High-throughput sequencing of amplicons has enabled studies ofmicrobial community ecology with a very high resolution, and has rev-olutionized fungal and bacterial ecology studies. However, studies inoomycete ecology studies are still limited despite the economic impor-tance of Pythium and Phytophthora as pathogens in agriculture and for-estry, and only a few studies have been published, mainly due toinsufficient methods. One of the cornerstones of such sequencing-based ecological studies are the primers and the amplification protocol.ITS6 and ITS7 targeting the ITS1 regionhave successfully been applied toamplify many species of Pythium and Phytophthora in earlier studies(Cooke et al., 2000; Vannini et al., 2013; Vettraino et al., 2012) suggest-ing their usefulness to study oomycete ecology using next generationsequencing. However, a recent study of oomycete diversity from forestsoils using ITS6 and ITS7 in combination with ITS4 resulted in lessthan 15% of sequences to be of oomycete origin (Coince et al., 2013).In silico assessment of ITS6 and ITS7 primers confirmed the specificityof primers (Fig. 1), however, this also indicated that the primers couldamplify fungi and plant DNA at lower annealing temperatures whichcould be the reason for the low proportion of oomycete sequencesretrived in the study by Coince et al. (2013)whoused an annealing tem-perature of 53 °C. Another study of Phytophthora diversity in a chestnutforest using ITS6 and ITS7 and an annealing temperature of 55 °C suc-cessfully captured 15 Phytophthora species (and 18 Pythium OTUs)using a pyrosequencing approach, but the number of reads from tensoil samples were reported to be only 11,637 (Vannini et al., 2013).Based on these studies and the fact that the theoretical annealing tem-perature of the primer pair is 59–64 °Cwe hypothesized that by increas-ing the annealing temperature during amplification, the proportion ofoomycete sequences could be significantly increased. This has beenshown in other studies on the effects of primer annealing temperatureson primer mismatches (Sipos et al., 2007),
Our preliminary experiments using ITS6 and ITS4 as primers in a PCRfollowed by ITS6 and ITS7 in a semi-nested approach showed that an ef-ficient amplification could be obtained from DNA from soils at 59 °Cduring primer annealing. We evaluated an amplification protocol atthis annealing temperature using three mock communities that wereassembled using Phytophthora and Pythium DNA. This showed that themethod was successful in amplifying Phytophthora along with Pythiumas all species from the mock community were retrieved, although invarying amounts. When the amount of Phytopthora DNA was reduced10×, the number of Phytophthora reads were reduced, however not in
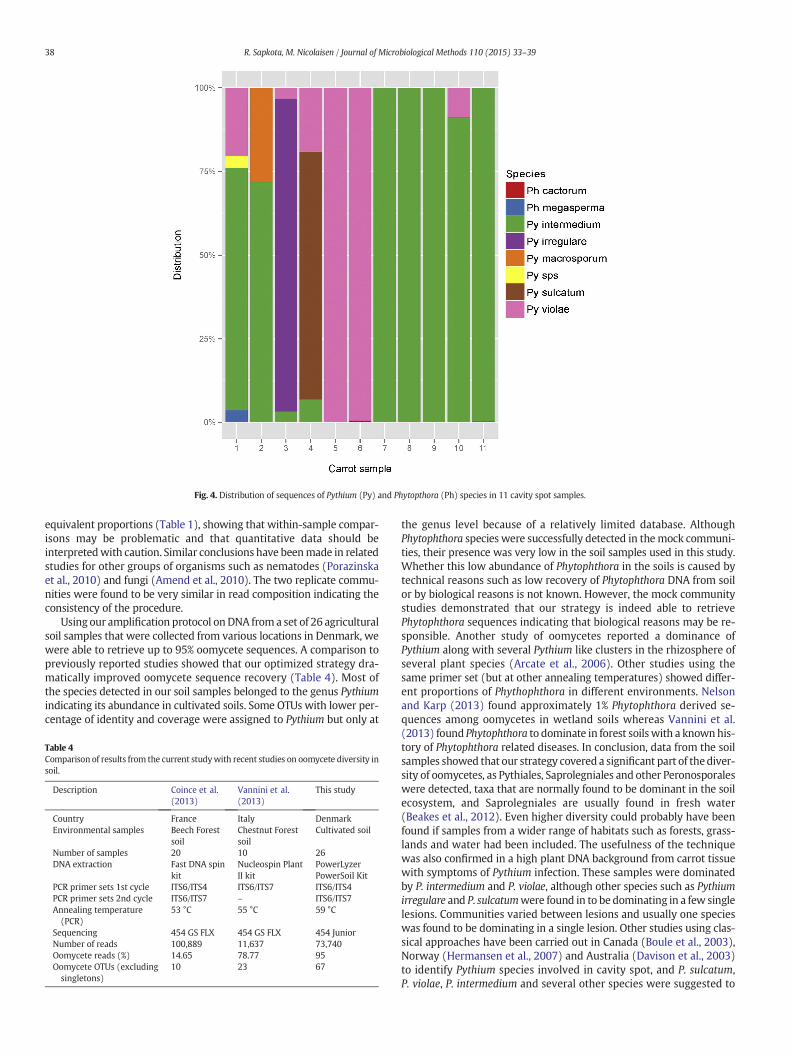
Fig. 4. Distribution of sequences of Pythium (Py) and Phytopthora (Ph) species in 11 cavity spot samples.
38 R. Sapkota, M. Nicolaisen / Journal of Microbiological Methods 110 (2015) 33–39
equivalent proportions (Table 1), showing that within-sample compar-isons may be problematic and that quantitative data should beinterpretedwith caution. Similar conclusions have beenmade in relatedstudies for other groups of organisms such as nematodes (Porazinskaet al., 2010) and fungi (Amend et al., 2010). The two replicate commu-nities were found to be very similar in read composition indicating theconsistency of the procedure.
Using our amplification protocol onDNA from a set of 26 agriculturalsoil samples that were collected from various locations in Denmark, wewere able to retrieve up to 95% oomycete sequences. A comparison topreviously reported studies showed that our optimized strategy dra-matically improved oomycete sequence recovery (Table 4). Most ofthe species detected in our soil samples belonged to the genus Pythiumindicating its abundance in cultivated soils. Some OTUs with lower per-centage of identity and coverage were assigned to Pythium but only at
Table 4Comparison of results from the current studywith recent studies on oomycete diversity insoil.
Description Coince et al.(2013)
Vannini et al.(2013)
This study
Country France Italy DenmarkEnvironmental samples Beech Forest
soilChestnut Forestsoil
Cultivated soil
Number of samples 20 10 26DNA extraction Fast DNA spin
kitNucleospin PlantII kit
PowerLyzerPowerSoil Kit
PCR primer sets 1st cycle ITS6/ITS4 ITS6/ITS7 ITS6/ITS4PCR primer sets 2nd cycle ITS6/ITS7 – ITS6/ITS7Annealing temperature(PCR)
53 °C 55 °C 59 °C
Sequencing 454 GS FLX 454 GS FLX 454 JuniorNumber of reads 100,889 11,637 73,740Oomycete reads (%) 14.65 78.77 95Oomycete OTUs (excludingsingletons)
10 23 67
the genus level because of a relatively limited database. AlthoughPhytophthora species were successfully detected in themock communi-ties, their presence was very low in the soil samples used in this study.Whether this low abundance of Phytophthora in the soils is caused bytechnical reasons such as low recovery of Phytophthora DNA from soilor by biological reasons is not known. However, the mock communitystudies demonstrated that our strategy is indeed able to retrievePhytophthora sequences indicating that biological reasons may be re-sponsible. Another study of oomycetes reported a dominance ofPythium along with several Pythium like clusters in the rhizosphere ofseveral plant species (Arcate et al., 2006). Other studies using thesame primer set (but at other annealing temperatures) showed differ-ent proportions of Phythophthora in different environments. Nelsonand Karp (2013) found approximately 1% Phytophthora derived se-quences among oomycetes in wetland soils whereas Vannini et al.(2013) found Phytophthora to dominate in forest soilswith a knownhis-tory of Phytophthora related diseases. In conclusion, data from the soilsamples showed that our strategy covered a significant part of thediver-sity of oomycetes, as Pythiales, Saprolegniales and other Peronosporaleswere detected, taxa that are normally found to be dominant in the soilecosystem, and Saprolegniales are usually found in fresh water(Beakes et al., 2012). Even higher diversity could probably have beenfound if samples from a wider range of habitats such as forests, grass-lands and water had been included. The usefulness of the techniquewas also confirmed in a high plant DNA background from carrot tissuewith symptoms of Pythium infection. These samples were dominatedby P. intermedium and P. violae, although other species such as Pythiumirregulare and P. sulcatumwere found in to be dominating in a few singlelesions. Communities varied between lesions and usually one specieswas found to be dominating in a single lesion. Other studies using clas-sical approaches have been carried out in Canada (Boule et al., 2003),Norway (Hermansen et al., 2007) and Australia (Davison et al., 2003)to identify Pythium species involved in cavity spot, and P. sulcatum,P. violae, P. intermedium and several other species were suggested to
39R. Sapkota, M. Nicolaisen / Journal of Microbiological Methods 110 (2015) 33–39
be involved in cavity spot, supporting our results. P. intermedium hasfurther been reported to cause ring rot in carrot in combination withPhytopthora megasperma (Hermansen et al., 2007), a species that wasalso found in this study, although in low abundance. Our assay thus suc-cessfully captured the diversity of Pythium species in the symptomaticlesions and further demonstrated that each lesion has its own profileof Pythium species.
We used the highly variable ITS1 which has been increasingly usedas a barcode for species identification, also for oomycetes (Robideauet al., 2011). Moreover, extraction of the ITS1 region by removing con-served regions in both ends of reads was carried out in order to increasethe sensitivity of clustering and successful identification of species(Bengtsson-Palme et al., 2013). In recent years, a large number of ITS se-quences have been continuously deposited in reference databasesresulting in a higher accuracy of taxonomic assignments. To overcomethe risk of low quality sequences or taxonomic error associated withpublic DNA repositories, expert annotated and tested databases suchas UNITE for fungal ITS, SILVA for small subunit (16S/18S, SSU) andlarge subunit (23S/28S, LSU) ribosomal DNA sequences are preferable.For oomycetes, a curated database for Phytophthora has already beendeveloped (Park et al., 2013) whichwas used for taxonomy assignmentin this study. The development of a curated ITS and perhaps also a cyto-chrome oxidase I (COI) database that includes also oomycetes will beuseful for reliable taxonomy assignments in the future (Robideauet al., 2011).
In this study, we have improved and optimized a strategy for study-ing oomycete community ecology in soil using 454 pyrosequencing. Theprocedure developed in this study is simple, fast and reliable and givesuseful insights into oomycete ecology, and it could be valuable as atool to understand many soil-borne oomycete-related plant diseases,for example cavity spot in carrot as demonstrated here.
Supplementary data to this article can be found online at http://dx.doi.org/10.1016/j.mimet.2015.01.013.
Acknowledgments
Wewould like to thank Lars Møller, Denmark who collected the soilsamples. We acknowledge financial support from GUDP (J.nr: 3405-11-0364) and Aarhus University.
References
Amend, A.S., Seifert, K.A., Bruns, T.D., 2010. Quantifying microbial communities with 454pyrosequencing: does read abundance count? Mol. Ecol. 19, 5555–5565.
Arcate, J.M., Karp, M.A., Nelson, E.B., 2006. Diversity of Peronosporomycete (oomycete)communities associated with the rhizosphere of different plant species. Microb.Ecol. 51, 36–50.
Beakes, G.W., Glockling, S.L., Sekimoto, S., 2012. The evolutionary phylogeny of theoomycete “fungi”. Protoplasma 249, 3–19.
Bengtsson-Palme, J., Ryberg, M., Hartmann, M., Branco, S., Wang, Z., Godhe, A., De Wit, P.,Sanchez-Garcia, M., Ebersberger, I., de Sousa, F., Amend, A.S., Jumpponen, A.,Unterseher, M., Kristiansson, E., Abarenkov, K., Bertrand, Y.J.K., Sanli, K., Eriksson,K.M., Vik, U., Veldre, V., Nilsson, R.H., 2013. Improved software detection and extrac-tion of ITS1 and ITS2 from ribosomal ITS sequences of fungi and other eukaryotes foranalysis of environmental sequencing data. Methods Ecol. Evol. 4, 914–919.
Boule, N.A., Tweddell, R.J., Martinez, C., Belanger, R.R., Levesque, C.A., 2003. Pythium spe-cies associated with cavity spot lesions on carrots produced in Quebec city area. Phy-topathology 93, S132.
Caporaso, J.G., Kuczynski, J., Stombaugh, J., Bittinger, K., Bushman, F.D., Costello, E.K.,Fierer, N., Pena, A.G., Goodrich, J.K., Gordon, J.I., Huttley, G.A., Kelley, S.T., Knights,D., Koenig, J.E., Ley, R.E., Lozupone, C.A., McDonald, D., Muegge, B.D., Pirrung, M.,Reeder, J., Sevinsky, J.R., Tumbaugh, P.J., Walters, W.A., Widmann, J., Yatsunenko, T.,Zaneveld, J., Knight, R., 2010. QIIME allows analysis of high-throughput communitysequencing data. Nat. Methods 7, 335–336.
Coince, A., Cael, O., Bach, C., Lengelle, J., Cruaud, C., Gavory, F., Morin, E., Murat, C., Marcais,B., Buee, M., 2013. Below-ground fine-scale distribution and soil versus fine root de-tection of fungal and soil oomycete communities in a French beech forest. FungalEcol. 6, 223–235.
Cooke, D.E.L., 2007. Tracking the sudden oak death pathogen. Mol. Ecol. 16, 3735–3736.Cooke, D.E.L., Drenth, A., Duncan, J.M., Wagels, G., Brasier, C.M., 2000. A molecular phylog-
eny of Phytophthora and related oomycetes. Fungal Genet. Biol. 30, 17–32.Davison, E.M., MacNish, G.C., Murphy, P.A., McKay, A.G., 2003. Pythium spp. from cavity
spot and other root diseases of Australian carrots. Australas. Plant Pathol. 32,455–464.
Edgar, R.C., 2010. Search and clustering orders of magnitude faster than BLAST. Bioinfor-matics 26, 2460–2461.
Hermansen, A., Herrero, M.L., Gauslaa, E., Razzaghian, J., Naerstad, R., Klemsdal, S.S., 2007.Pythium species associated with cavity spot on carrots in Norway. Ann. Appl. Biol.150, 115–121.
Kamoun, S., 2003. Molecular genetics of pathogenic oomycetes. Eukaryot. Cell 2, 191–199.Levesque, C.A., De Cock, A.W., 2004. Molecular phylogeny and taxonomy of the genus
Pythium. Mycol. Res. 108, 1363–1383.Nelson, E.B., Karp, M.A., 2013. Soil pathogen communities associatedwith native and non‐
native Phragmites australis populations in freshwater wetlands. Ecol. Evol. 3 (5254-5n267).
Park, B., Martin, F., Geiser, D.M., Kim, H.S., Mansfield, M.A., Nikolaeva, E., Park, S.Y., Coffey,M.D., Russo, J., Kim, S.H., Balci, Y., Abad, G., Burgess, T., Grunwald, N.J., Cheong, K.,Choi, J., Lee, Y.H., Kang, S., 2013. Phytophthora database 2.0: update and future direc-tion. Phytopathology 103, 1204–1208.
Porazinska, D.L., Sung, W., Giblin-Davis, R.M., Kelley Thomas, W., 2010. Reproducibility ofread numbers in high-throughput sequencing analysis of nematode community com-position and structure. Mol. Ecol. Res. 10, 666–676.
Reeder, J., Knight, R., 2010. Rapidly denoising pyrosequencing amplicon reads byexploiting rank-abundance distributions. Nat. Methods 7, 668–669.
Robideau, G.P., de Cock, A.W.A.M., Coffey, M.D., Voglmayr, H., Brouwer, H., Bala, K., et al.,2011. DNA barcoding of oomycetes with cytochrome c oxidase subunit I and internaltranscribed spacer. Mol. Ecol. Res. 11, 1002–1011.
Scibetta, S., Schena, L., Chimento, A., Cacciola, S.O., Cooke, D.E.L., 2012. A molecular meth-od to assess Phytophthora diversity in environmental samples. J. Microbiol. Meth. 88,356–368.
Sipos, R., Székely, A.J., Palatinszky, M., Révész, S., Márialigeti, K., Nikolausz, M., 2007. Effectof primer mismatch, annealing temperature and PCR cycle number on 16S rRNAgene-targetting bacterial community analysis. FEMS Microbiol. Ecol. 60, 341–350.
Thines, M., 2014. Phylogeny and evolution of plant pathogenic oomycetes — a globaloverview. Eur. J. Plant Pathol. 138, 431–447.
van Elsas, J.D., Boersma, F.G.H., 2011. A review of molecular methods to study the micro-biota of soil and the mycosphere. Eur. J. Soil Biol. 47, 77–87.
Vannini, A., Bruni, N., Tomassini, A., Franceschini, S., Vettraino, A.M., 2013. Pyrosequencingof environmental soil samples reveals biodiversity of the Phytophthora resident com-munity in chestnut forests. FEMS Microbiol. Ecol. 85, 433–442.
Vettraino, A.M., Bonants, P., Tomassini, A., Bruni, N., Vannini, A., 2012. Pyrosequencing as atool for the detection of Phytophthora species: error rate and risk of false MolecularOperational Taxonomic Units. Lett. Appl. Microbiol. 55, 390–396.
Voglmayr, H., 2003. Phylogenetic relationships of Peronospora and related genera basedon nuclear ribosomal ITS sequences. Mycol. Res. 107, 1132–1142.
White, T.J., Bruns, T., Lee, S., Taylor, J., 1990. Amplification and direct sequencing of fungalribosomal RNA genes for phylogenetics. In: Innis, M.A., Gelfand, D.H., Sninsky, J.J.,White, T.J. (Eds.), PCR Protocols: A Guide to Methods and Applications 18. AcademicPress, San Diego, pp. 315–322.