Embed Size (px)
Citation preview
United StatesDepartment ofAgriculture
Animal andPlant HealthInspection Service
VeterinaryServices
NationalAnimal HealthMonitoringSystem
February 2012
An In-depth Studyof Small-scale U.S.Livestock Operations,2011
The U.S. Department of Agriculture (USDA) prohibits
discrimination in all its programs and activities on the
basis of race, color, national origin, age, disability, and
where applicable, sex, marital status, familial status,
parental status, religion, sexual orientation, genetic
information, political beliefs, reprisal, or because all or
part of an individual’s income is derived from any public
assistance program. (Not all prohibited bases apply to
all programs.) Persons with disabilities who require
alternative means for communication of program
information (Braille, large print, audiotape, etc.) should
contact USDA’s TARGET Center at (202) 720-2600
(voice and TDD).
To file a complaint of discrimination, write to USDA
Director, Office of Civil Rights, 1400 Independence
Avenue, S.W., Washington, D.C. 20250-9410, or call
(800) 795-3272 (voice) or (202) 720-6382 (TDD).
USDA is an equal opportunity provider and employer.
Mention of companies or commercial products does not
imply recommendation or endorsement by the USDA
over others not mentioned. USDA neither guarantees
nor warrants the standard of any product mentioned.
Product names are mentioned solely to report factually
on available data and to provide specific information.
USDA:APHIS:VS:CEAH
NRRC Building B, M.S. 2E7
2150 Centre Avenue
Fort Collins, CO 80526-8117
(970) 494-7000
http://nahms.aphis.usda.gov
#618.0212
Cover photographs of beef with windmill, dairy cows, and sheep
courtesy of Judy Rodriguez; cover photograph of goats courtesy of
Anson Eaglin; cover photograph of chickens courtesty of Frank T.
Jones; cover photograph of pigs courtesy of U.S. Pork Board
USDA APHIS VS / i
Items of NoteItems of NoteItems of NoteItems of NoteItems of Note
Operationand operatorcharacteristics
Biosecurity
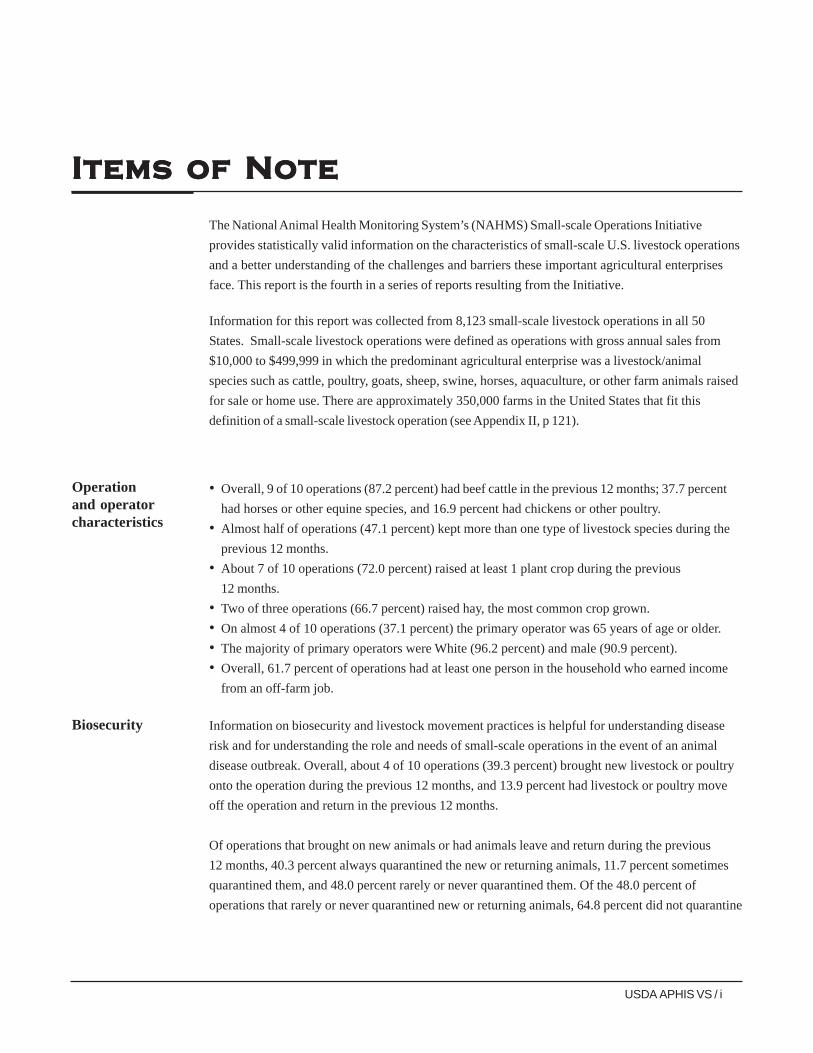
The National Animal Health Monitoring System’s (NAHMS) Small-scale Operations Initiative
provides statistically valid information on the characteristics of small-scale U.S. livestock operations
and a better understanding of the challenges and barriers these important agricultural enterprises
face. This report is the fourth in a series of reports resulting from the Initiative.
Information for this report was collected from 8,123 small-scale livestock operations in all 50
States. Small-scale livestock operations were defined as operations with gross annual sales from
$10,000 to $499,999 in which the predominant agricultural enterprise was a livestock/animal
species such as cattle, poultry, goats, sheep, swine, horses, aquaculture, or other farm animals raised
for sale or home use. There are approximately 350,000 farms in the United States that fit this
definition of a small-scale livestock operation (see Appendix II, p 121).
• Overall, 9 of 10 operations (87.2 percent) had beef cattle in the previous 12 months; 37.7 percent
had horses or other equine species, and 16.9 percent had chickens or other poultry.
• Almost half of operations (47.1 percent) kept more than one type of livestock species during the
previous 12 months.
• About 7 of 10 operations (72.0 percent) raised at least 1 plant crop during the previous
12 months.
• Two of three operations (66.7 percent) raised hay, the most common crop grown.
• On almost 4 of 10 operations (37.1 percent) the primary operator was 65 years of age or older.
• The majority of primary operators were White (96.2 percent) and male (90.9 percent).
• Overall, 61.7 percent of operations had at least one person in the household who earned income
from an off-farm job.
Information on biosecurity and livestock movement practices is helpful for understanding disease
risk and for understanding the role and needs of small-scale operations in the event of an animal
disease outbreak. Overall, about 4 of 10 operations (39.3 percent) brought new livestock or poultry
onto the operation during the previous 12 months, and 13.9 percent had livestock or poultry move
off the operation and return in the previous 12 months.
Of operations that brought on new animals or had animals leave and return during the previous
12 months, 40.3 percent always quarantined the new or returning animals, 11.7 percent sometimes
quarantined them, and 48.0 percent rarely or never quarantined them. Of the 48.0 percent of
operations that rarely or never quarantined new or returning animals, 64.8 percent did not quarantine
ii / Small-scale U.S. Livestock Operations 2011
Livestockdisease outbreaks
Availabilityand use ofveterinarians
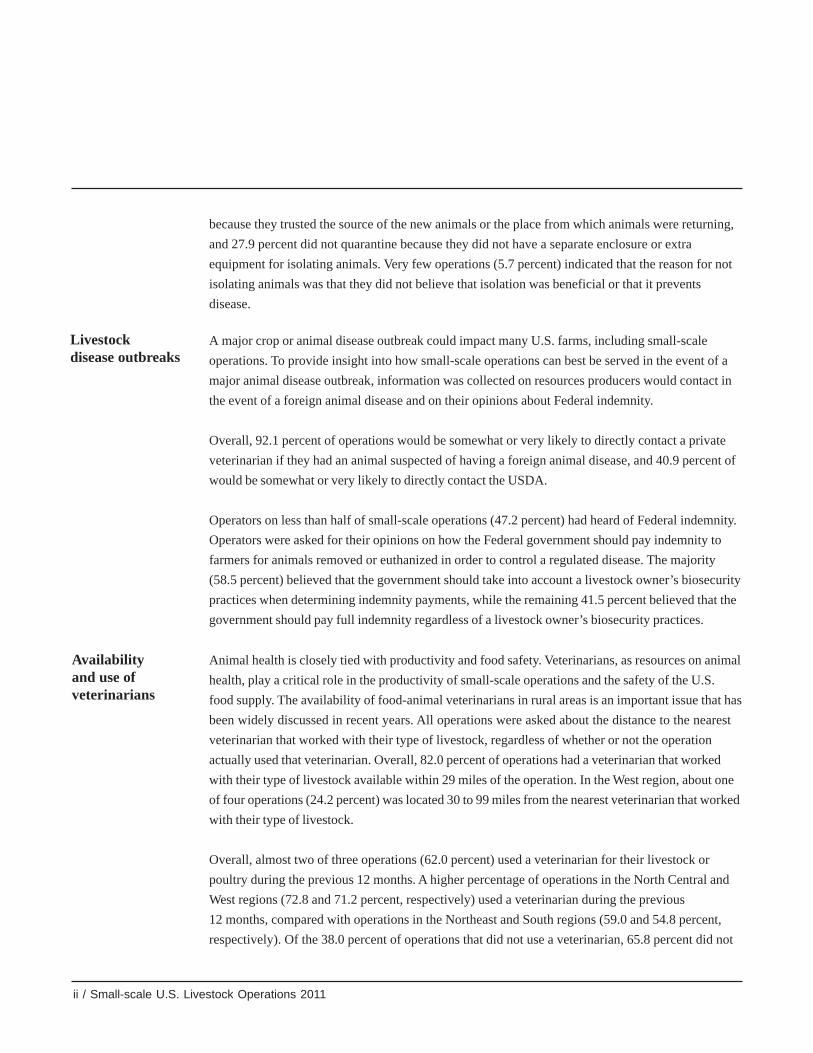
because they trusted the source of the new animals or the place from which animals were returning,
and 27.9 percent did not quarantine because they did not have a separate enclosure or extra
equipment for isolating animals. Very few operations (5.7 percent) indicated that the reason for not
isolating animals was that they did not believe that isolation was beneficial or that it prevents
disease.
A major crop or animal disease outbreak could impact many U.S. farms, including small-scale
operations. To provide insight into how small-scale operations can best be served in the event of a
major animal disease outbreak, information was collected on resources producers would contact in
the event of a foreign animal disease and on their opinions about Federal indemnity.
Overall, 92.1 percent of operations would be somewhat or very likely to directly contact a private
veterinarian if they had an animal suspected of having a foreign animal disease, and 40.9 percent of
would be somewhat or very likely to directly contact the USDA.
Operators on less than half of small-scale operations (47.2 percent) had heard of Federal indemnity.
Operators were asked for their opinions on how the Federal government should pay indemnity to
farmers for animals removed or euthanized in order to control a regulated disease. The majority
(58.5 percent) believed that the government should take into account a livestock owner’s biosecurity
practices when determining indemnity payments, while the remaining 41.5 percent believed that the
government should pay full indemnity regardless of a livestock owner’s biosecurity practices.
Animal health is closely tied with productivity and food safety. Veterinarians, as resources on animal
health, play a critical role in the productivity of small-scale operations and the safety of the U.S.
food supply. The availability of food-animal veterinarians in rural areas is an important issue that has
been widely discussed in recent years. All operations were asked about the distance to the nearest
veterinarian that worked with their type of livestock, regardless of whether or not the operation
actually used that veterinarian. Overall, 82.0 percent of operations had a veterinarian that worked
with their type of livestock available within 29 miles of the operation. In the West region, about one
of four operations (24.2 percent) was located 30 to 99 miles from the nearest veterinarian that worked
with their type of livestock.
Overall, almost two of three operations (62.0 percent) used a veterinarian for their livestock or
poultry during the previous 12 months. A higher percentage of operations in the North Central and
West regions (72.8 and 71.2 percent, respectively) used a veterinarian during the previous
12 months, compared with operations in the Northeast and South regions (59.0 and 54.8 percent,
respectively). Of the 38.0 percent of operations that did not use a veterinarian, 65.8 percent did not
USDA APHIS VS / iii
Marketingpractices
Mobile slaughterfacilities
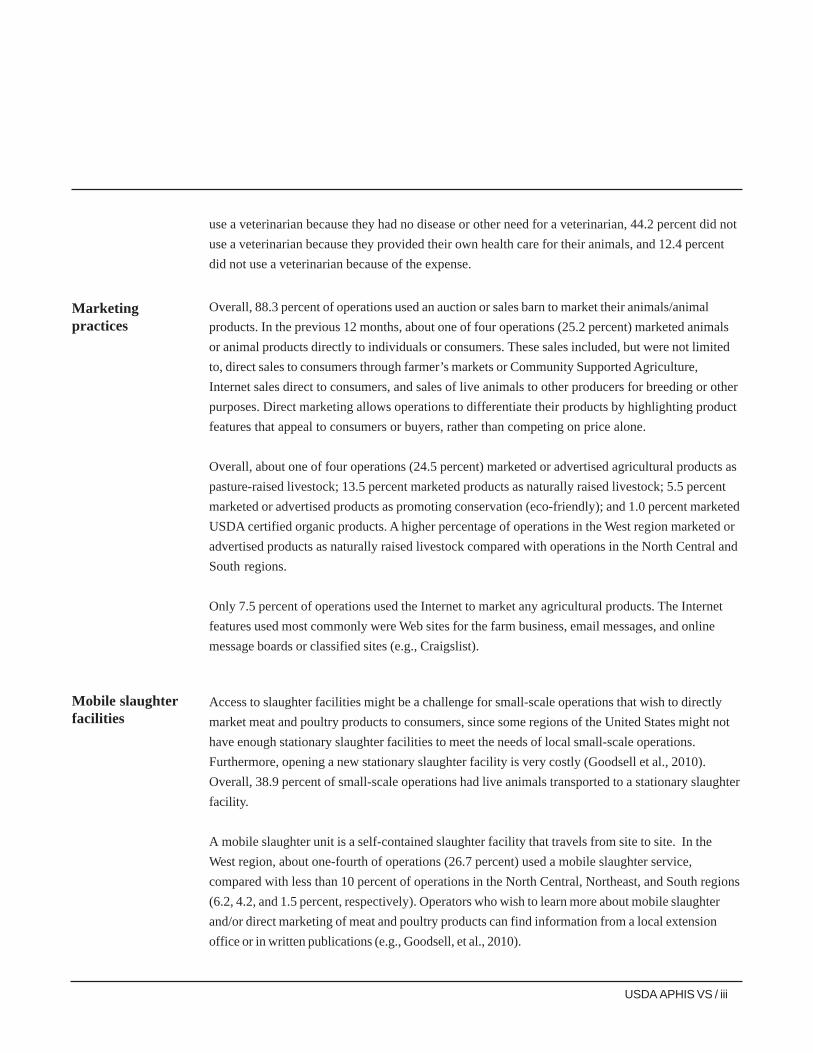
use a veterinarian because they had no disease or other need for a veterinarian, 44.2 percent did not
use a veterinarian because they provided their own health care for their animals, and 12.4 percent
did not use a veterinarian because of the expense.
Overall, 88.3 percent of operations used an auction or sales barn to market their animals/animal
products. In the previous 12 months, about one of four operations (25.2 percent) marketed animals
or animal products directly to individuals or consumers. These sales included, but were not limited
to, direct sales to consumers through farmer’s markets or Community Supported Agriculture,
Internet sales direct to consumers, and sales of live animals to other producers for breeding or other
purposes. Direct marketing allows operations to differentiate their products by highlighting product
features that appeal to consumers or buyers, rather than competing on price alone.
Overall, about one of four operations (24.5 percent) marketed or advertised agricultural products as
pasture-raised livestock; 13.5 percent marketed products as naturally raised livestock; 5.5 percent
marketed or advertised products as promoting conservation (eco-friendly); and 1.0 percent marketed
USDA certified organic products. A higher percentage of operations in the West region marketed or
advertised products as naturally raised livestock compared with operations in the North Central and
South regions.
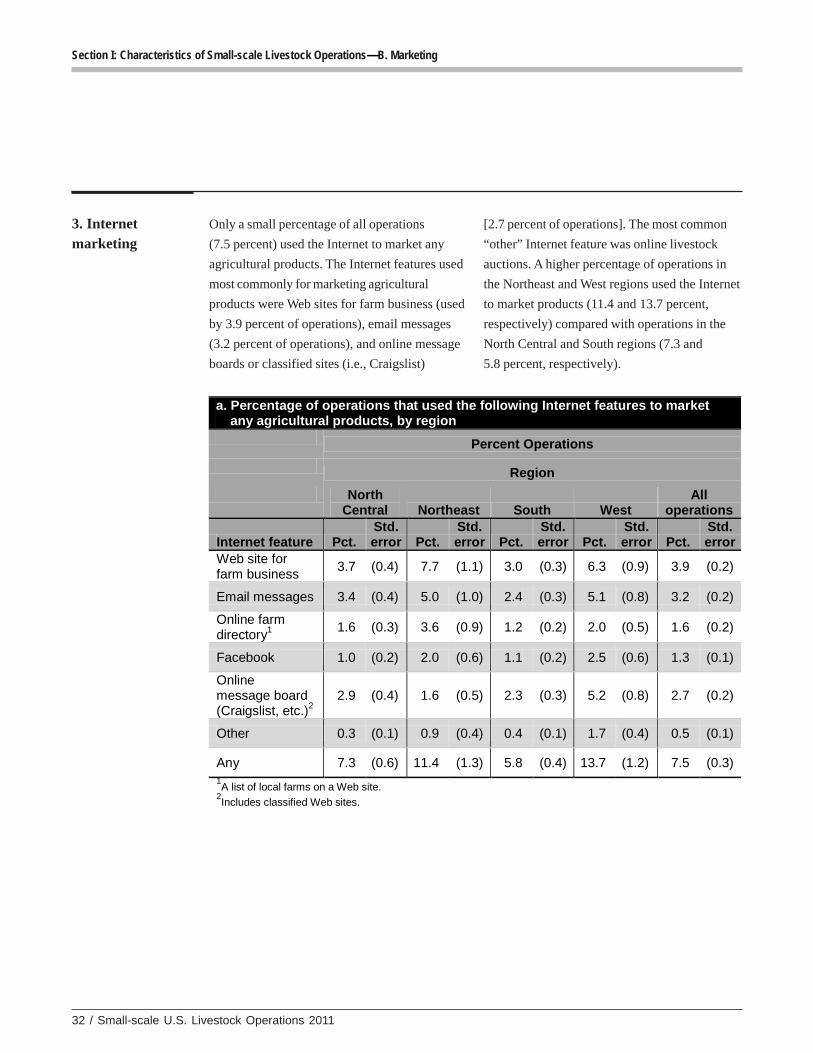
Only 7.5 percent of operations used the Internet to market any agricultural products. The Internet
features used most commonly were Web sites for the farm business, email messages, and online
message boards or classified sites (e.g., Craigslist).
Access to slaughter facilities might be a challenge for small-scale operations that wish to directly
market meat and poultry products to consumers, since some regions of the United States might not
have enough stationary slaughter facilities to meet the needs of local small-scale operations.
Furthermore, opening a new stationary slaughter facility is very costly (Goodsell et al., 2010).
Overall, 38.9 percent of small-scale operations had live animals transported to a stationary slaughter
facility.
A mobile slaughter unit is a self-contained slaughter facility that travels from site to site. In the
West region, about one-fourth of operations (26.7 percent) used a mobile slaughter service,
compared with less than 10 percent of operations in the North Central, Northeast, and South regions
(6.2, 4.2, and 1.5 percent, respectively). Operators who wish to learn more about mobile slaughter
and/or direct marketing of meat and poultry products can find information from a local extension
office or in written publications (e.g., Goodsell, et al., 2010).
iv / Small-scale U.S. Livestock Operations 2011
Information andtraining needs
Universities and Federal agencies provide relevant training and informational resources to assist
small-scale operations. In this study, operators of small-scale operations were asked to identify the
topics that they wanted more training in as well as their preferences for receiving that training.
Operators on over two-thirds of operations indicated that additional training in animal health/
diseases, infectious disease management practices, how to transfer the farm to the next generation,
tax-related issues, or government programs and regulations would be somewhat or very useful.
Operators on about half of operations (51.3 percent) felt that additional training about rules
governing interstate or international movement of animals and products would be somewhat or very
useful.
For the delivery of training materials, the channels preferred by operators on the highest percentage
of operations were a local extension office (56.0 percent of operations) or a written publication
(49.4 percent). Operators on a lower percentage of operations preferred to receive training on the
Internet (29.9 percent), through a presentation by an expert (24.9 percent), or through a livestock
association or club (21.8 percent).
Factors in thedecision tocontinue farming
Overall, operators on 89.4 percent of operations expected to continue farming over the next 5 years.
The top three factors contributing to the decision to continue farming were improved farm product
prices, stability of farm expenses, and stability of prices for farm products (ranked very necessary
factors by 62.8, 58.6, and 57.3 percent of operations, respectively). Half of medium-sales operations
($100,000 to $249,999 gross annual sales) and high-sales operations ($250,000 to $499,999 gross
annual sales) considered access to operating loans very necessary to their decision to continue
farming (46.1 and 54.2 percent, respectively). The ability to find off-farm employment to
supplement income was very necessary to the decision to continue farming for 38.0 percent of low-
sales operations (less than $100,000 gross annual sales), compared with 20.7 percent of medium-
sales operations and 14.3 percent of high-sales operations.
For the 10.6 percent of operations in which the operator expected to leave farming in the next
5 years, retiring was the reason the operator gave for leaving on the majority of operations
(83.8 percent), while on about one of seven operations (14.2 percent) the operator was leaving to
pursue a different job or career.
USDA APHIS VS / v
AAAAAcccccknoknoknoknoknowwwwwledgledgledgledgledgementsementsementsementsements
Larry M. Granger
Director
Centers for Epidemiology and Animal Health
This report was a cooperative effort between two U.S. Department of Agriculture (USDA)
Agencies: the National Agricultural Statistics Service (NASS) and the Animal and Plant Health
Inspection Service (APHIS).
We would like to thank to the NASS telephone enumerators who contacted small-scale producers
and collected the data. Their hard work and dedication were invaluable. Thanks also goes to the
personnel at the USDA–APHIS–Veterinary Services’ Centers for Epidemiology and Animal Health
for their efforts in generating and distributing this report.
All participants are to be commended, particularly the producers whose voluntary efforts made the
Small-scale U.S. Livestock Operations 2011 study possible.
vi / Small-scale U.S. Livestock Operations 2011
Suggested bibliographic citation for this report:
USDA. 2012. An In-depth Study of Small-scale U.S. Livestock Operaitons, 2011
USDA–APHIS–VS–CEAH–NAHMS. Fort Collins, CO
#618.0212
Contacts for further information:
Questions or comments on data analysis: Dr. Andrea Beam (970) 494–7000
Information on reprints or other reports: Ms. Abby Fienhold (970) 494–7000
Feedback:
Feedback, comments, and suggestions regarding this report are welcomed. You may submit feedback via online survey at:
http://nahms.aphis.usda.gov (Click on “FEEDBACK on NAHMS reports.”)
USDA APHIS VS / vii
TTTTTable of Contable of Contable of Contable of Contable of Contentsentsentsentsents
Introduction 1Terms Used in This Report 2
Section I: Characteristics of Small-scale Livestock Operations 7A. Diverse Products 71. Types of livestock species 8
2. Crops raised on operation 16
B. Marketing 231. Specialty products 24
2. Marketing channels 28
3. Internet marketing 32
C. Reasons for Farming 35
D. Future Plans 391. Operations in which the operator expected to continue farming for the next 5 years 39
2. Factors in the decision to continue farming 40
E. Farm Exits 441. Operations in which the operator expected to leave farming in the next 5 years 44
2. Plans after leaving farming 46
3. Reasons for farm exits 49
Section II. Animal Health Practices 51A. Biosecurity 511. Livestock movement and quarantine 51
2. Barriers to implementing quarantine 59
3. Contact with animals from other operations 61
B. Use of Alternative Treatments 66
viii / Small-scale U.S. Livestock Operations 2011
Section III: Challenges for Small-scale Livestock Operations 67A. Access to Veterinarians 671. Distance to nearest veterinarian 67
2. Use of veterinarians 70
3. Reasons for not using a veterinarian 72
B. Access to Business Resources 741. Proximity to urban areas 74
2. Slaughter facilities used 77
3. Distance to slaughter facility 80
4. Transporting products to markets 82
5. Livestock feed sources 87
6. Distances feed is transported 90
7. Off-farm employment 92
8. Distance to off-farm employment 94
C. Paperwork for Government Regulations 96
Section IV: Opportunities to Assist Small-scale LivestockOperations 99A. Livestock Disease Outbreaks 991. Resources contacted in the event of a disease outbreak 99
2. Awareness of Federal indemnity 103
3. Operators’ opinions about Federal indemnity 104
B. Information and Training Needs 108
Methodology 115A. Study Purpose 115
B. Sampling and Estimation 1151. Operation selection 115
2. Population inferences 115
USDA APHIS VS / ix
C. Data Collection 116
D. Data Analysis 116
E. Sample Evaluation 116Appendix I. Sample Profile 118
Appendix II: Small-scale U.S. Livestock Operations 121
Appendix III: U.S. Counties by Rural-urban Continuum Code, 2003 123
Appendix IV: References 124
USDA APHIS VS / 1
Introduction
IntrIntrIntrIntrIntroductionoductionoductionoductionoduction
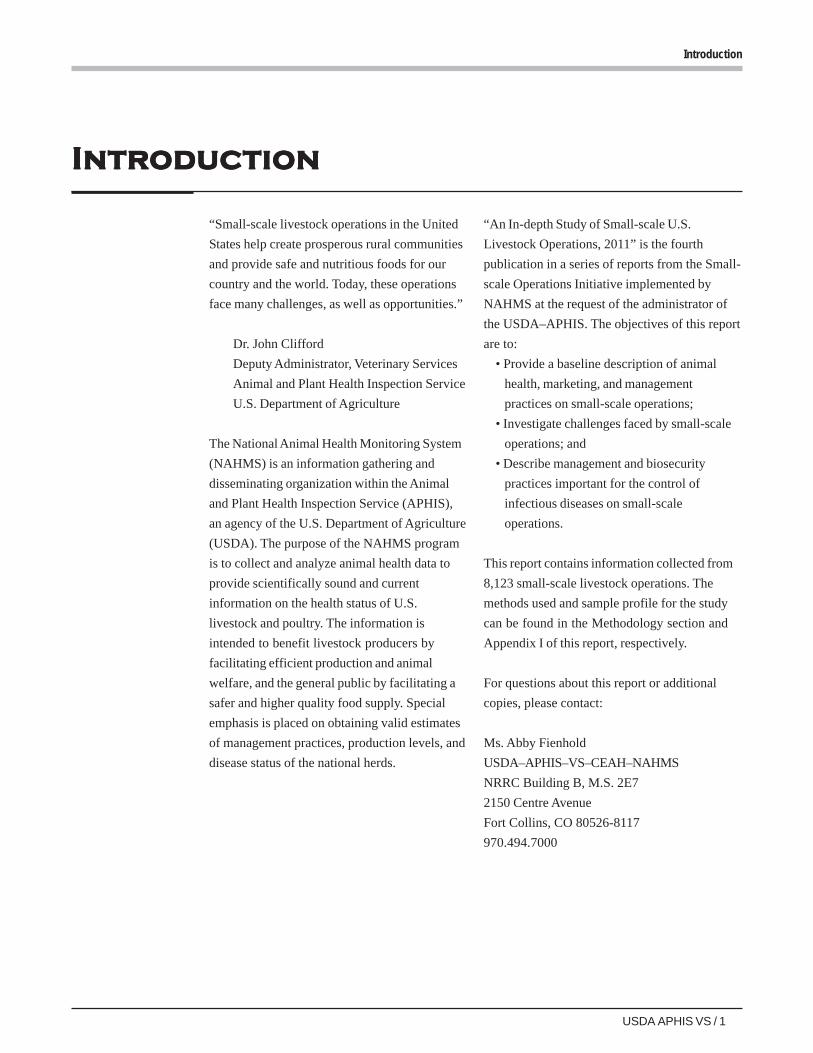
“Small-scale livestock operations in the United
States help create prosperous rural communities
and provide safe and nutritious foods for our
country and the world. Today, these operations
face many challenges, as well as opportunities.”
Dr. John Clifford
Deputy Administrator, Veterinary Services
Animal and Plant Health Inspection Service
U.S. Department of Agriculture
The National Animal Health Monitoring System
(NAHMS) is an information gathering and
disseminating organization within the Animal
and Plant Health Inspection Service (APHIS),
an agency of the U.S. Department of Agriculture
(USDA). The purpose of the NAHMS program
is to collect and analyze animal health data to
provide scientifically sound and current
information on the health status of U.S.
livestock and poultry. The information is
intended to benefit livestock producers by
facilitating efficient production and animal
welfare, and the general public by facilitating a
safer and higher quality food supply. Special
emphasis is placed on obtaining valid estimates
of management practices, production levels, and
disease status of the national herds.
“An In-depth Study of Small-scale U.S.
Livestock Operations, 2011” is the fourth
publication in a series of reports from the Small-
scale Operations Initiative implemented by
NAHMS at the request of the administrator of
the USDA–APHIS. The objectives of this report
are to:
• Provide a baseline description of animal
health, marketing, and management
practices on small-scale operations;
• Investigate challenges faced by small-scale
operations; and
• Describe management and biosecurity
practices important for the control of
infectious diseases on small-scale
operations.
This report contains information collected from
8,123 small-scale livestock operations. The
methods used and sample profile for the study
can be found in the Methodology section and
Appendix I of this report, respectively.
For questions about this report or additional
copies, please contact:
Ms. Abby Fienhold
USDA–APHIS–VS–CEAH–NAHMS
NRRC Building B, M.S. 2E7
2150 Centre Avenue
Fort Collins, CO 80526-8117
970.494.7000
2 / Small-scale U.S. Livestock Operations 2011
Introduction
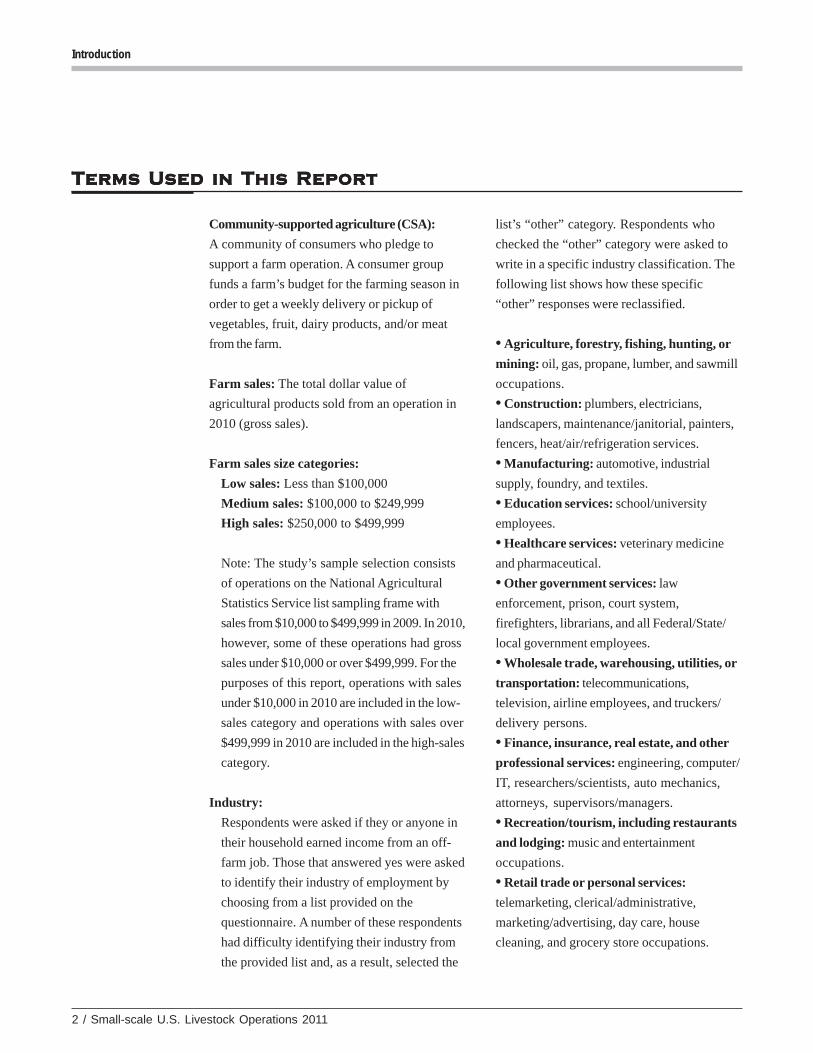
Terms Used in This ReportTerms Used in This ReportTerms Used in This ReportTerms Used in This ReportTerms Used in This Report
Community-supported agriculture (CSA):
A community of consumers who pledge to
support a farm operation. A consumer group
funds a farm’s budget for the farming season in
order to get a weekly delivery or pickup of
vegetables, fruit, dairy products, and/or meat
from the farm.
Farm sales: The total dollar value of
agricultural products sold from an operation in
2010 (gross sales).
Farm sales size categories:
Low sales: Less than $100,000
Medium sales: $100,000 to $249,999
High sales: $250,000 to $499,999
Note: The study’s sample selection consists
of operations on the National Agricultural
Statistics Service list sampling frame with
sales from $10,000 to $499,999 in 2009. In 2010,
however, some of these operations had gross
sales under $10,000 or over $499,999. For the
purposes of this report, operations with sales
under $10,000 in 2010 are included in the low-
sales category and operations with sales over
$499,999 in 2010 are included in the high-sales
category.
Industry:
Respondents were asked if they or anyone in
their household earned income from an off-
farm job. Those that answered yes were asked
to identify their industry of employment by
choosing from a list provided on the
questionnaire. A number of these respondents
had difficulty identifying their industry from
the provided list and, as a result, selected the
list’s “other” category. Respondents who
checked the “other” category were asked to
write in a specific industry classification. The
following list shows how these specific
“other” responses were reclassified.
• Agriculture, forestry, fishing, hunting, or
mining: oil, gas, propane, lumber, and sawmill
occupations.
• Construction: plumbers, electricians,
landscapers, maintenance/janitorial, painters,
fencers, heat/air/refrigeration services.
• Manufacturing: automotive, industrial
supply, foundry, and textiles.
• Education services: school/university
employees.
• Healthcare services: veterinary medicine
and pharmaceutical.
• Other government services: law
enforcement, prison, court system,
firefighters, librarians, and all Federal/State/
local government employees.
• Wholesale trade, warehousing, utilities, or
transportation: telecommunications,
television, airline employees, and truckers/
delivery persons.
• Finance, insurance, real estate, and other
professional services: engineering, computer/
IT, researchers/scientists, auto mechanics,
attorneys, supervisors/managers.
• Recreation/tourism, including restaurants
and lodging: music and entertainment
occupations.
• Retail trade or personal services:
telemarketing, clerical/administrative,
marketing/advertising, day care, house
cleaning, and grocery store occupations.
USDA APHIS VS / 3
Introduction
Isolate: To prevent nose-to-nose contact and to
prevent the sharing of feed, drinking water, and
equipment with other animals of the same
species already present on the operation.
Livestock: Cattle, poultry, goats, sheep, swine,
horses, other equids, aquaculture, and all other
farm animals raised for sale or home use.
Operation average: The average value for all
operations; a single value for each operation is
summed over all operations reporting divided by
the number of operations reporting. For
example, operation average number days
animals were isolated (see p 57) is calculated by
summing the average number of days reported
by each operation and dividing this by the
number of operations.
Population estimates: The estimates in this
report make inference to all small-scale U.S.
livestock operations (see Methodology, p 115).
Data from the operations responding to the
survey are weighted to reflect their probability
of selection during sampling and to account for
survey nonresponse.
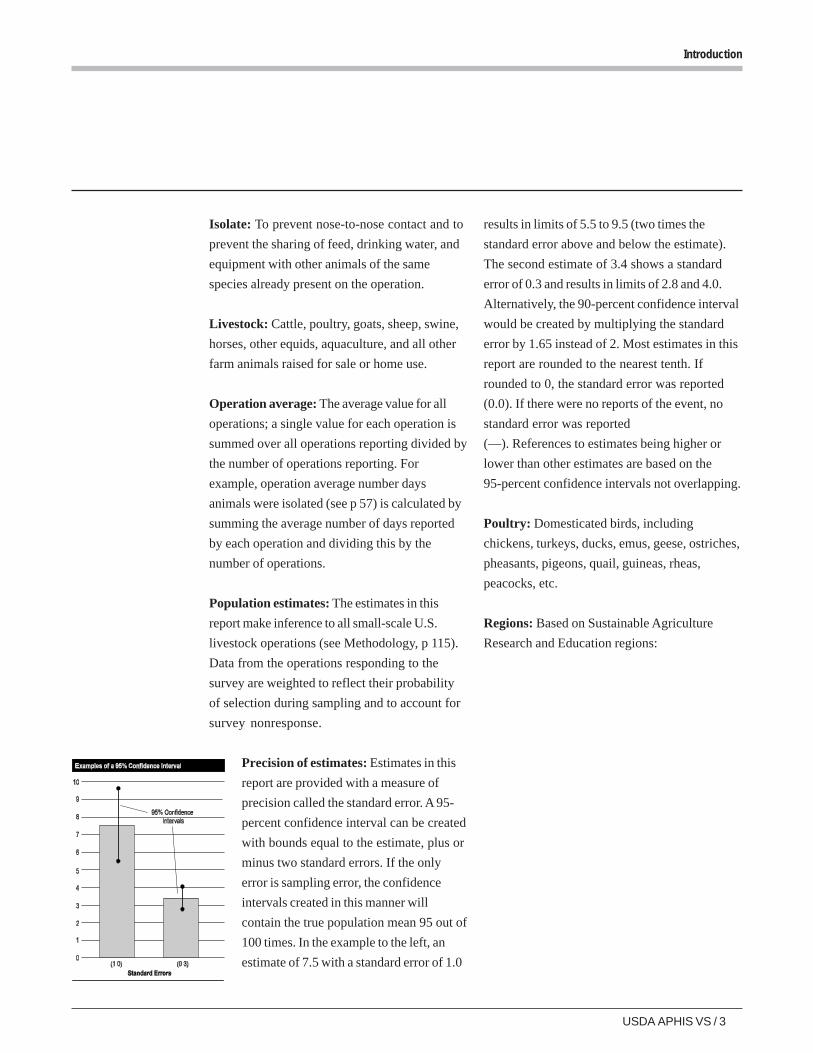
Precision of estimates: Estimates in this
report are provided with a measure of
precision called the standard error. A 95-
percent confidence interval can be created
with bounds equal to the estimate, plus or
minus two standard errors. If the only
error is sampling error, the confidence
intervals created in this manner will
contain the true population mean 95 out of
100 times. In the example to the left, an
estimate of 7.5 with a standard error of 1.0
results in limits of 5.5 to 9.5 (two times the
standard error above and below the estimate).
The second estimate of 3.4 shows a standard
error of 0.3 and results in limits of 2.8 and 4.0.
Alternatively, the 90-percent confidence interval
would be created by multiplying the standard
error by 1.65 instead of 2. Most estimates in this
report are rounded to the nearest tenth. If
rounded to 0, the standard error was reported
(0.0). If there were no reports of the event, no
standard error was reported
(—). References to estimates being higher or
lower than other estimates are based on the
95-percent confidence intervals not overlapping.
Poultry: Domesticated birds, including
chickens, turkeys, ducks, emus, geese, ostriches,
pheasants, pigeons, quail, guineas, rheas,
peacocks, etc.
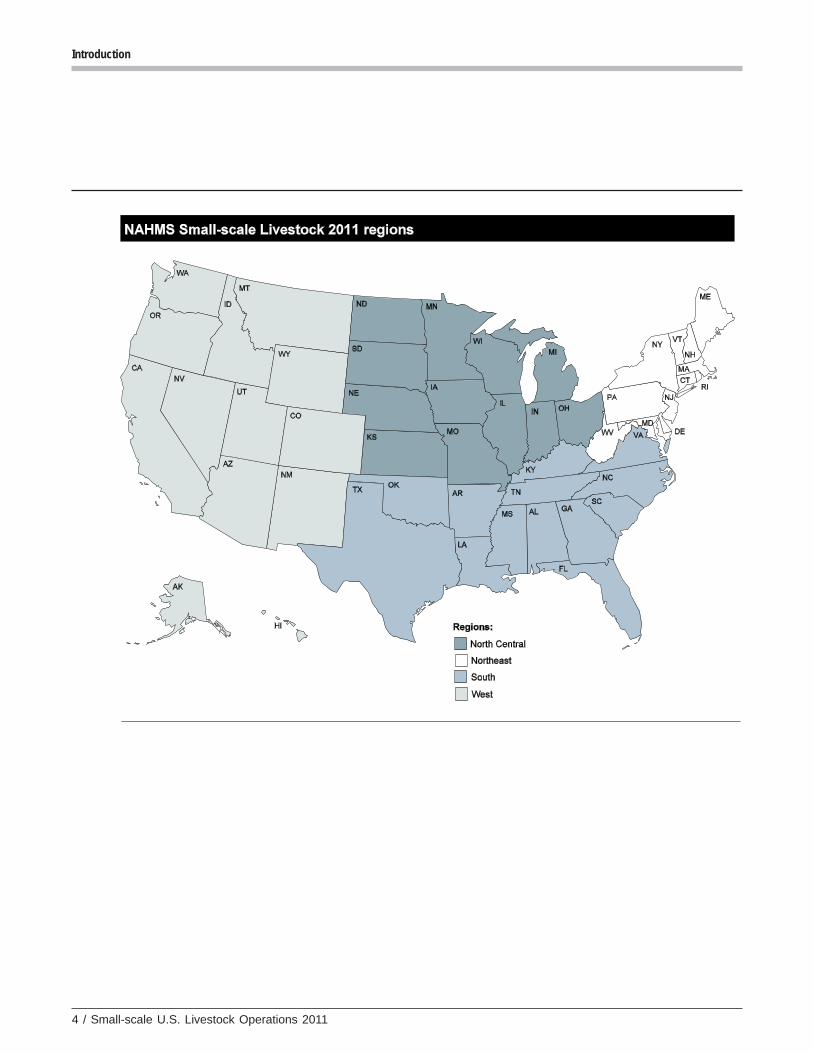
Regions: Based on Sustainable Agriculture
Research and Education regions:
4 / Small-scale U.S. Livestock Operations 2011
Introduction
USDA APHIS VS / 5
Introduction
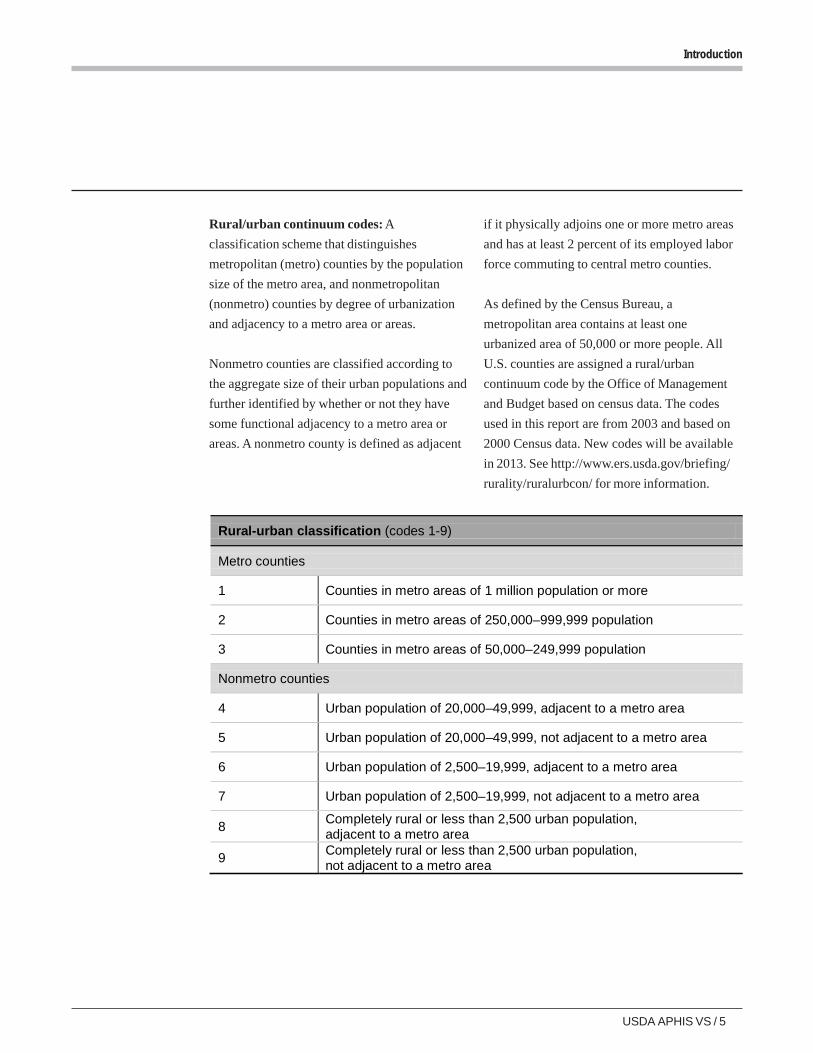
Rural/urban continuum codes: A
classification scheme that distinguishes
metropolitan (metro) counties by the population
size of the metro area, and nonmetropolitan
(nonmetro) counties by degree of urbanization
and adjacency to a metro area or areas.
Nonmetro counties are classified according to
the aggregate size of their urban populations and
further identified by whether or not they have
some functional adjacency to a metro area or
areas. A nonmetro county is defined as adjacent
if it physically adjoins one or more metro areas
and has at least 2 percent of its employed labor
force commuting to central metro counties.
As defined by the Census Bureau, a
metropolitan area contains at least one
urbanized area of 50,000 or more people. All
U.S. counties are assigned a rural/urban
continuum code by the Office of Management
and Budget based on census data. The codes
used in this report are from 2003 and based on
2000 Census data. New codes will be available
in 2013. See http://www.ers.usda.gov/briefing/
rurality/ruralurbcon/ for more information.
Rural-urban classification (codes 1-9)
Metro counties
1 Counties in metro areas of 1 million population or more
2 Counties in metro areas of 250,000–999,999 population
3 Counties in metro areas of 50,000–249,999 population
Nonmetro counties
4 Urban population of 20,000–49,999, adjacent to a metro area
5 Urban population of 20,000–49,999, not adjacent to a metro area
6 Urban population of 2,500–19,999, adjacent to a metro area
7 Urban population of 2,500–19,999, not adjacent to a metro area
8 Completely rural or less than 2,500 urban population, adjacent to a metro area
9 Completely rural or less than 2,500 urban population, not adjacent to a metro area
6 / Small-scale U.S. Livestock Operations 2011
Introduction
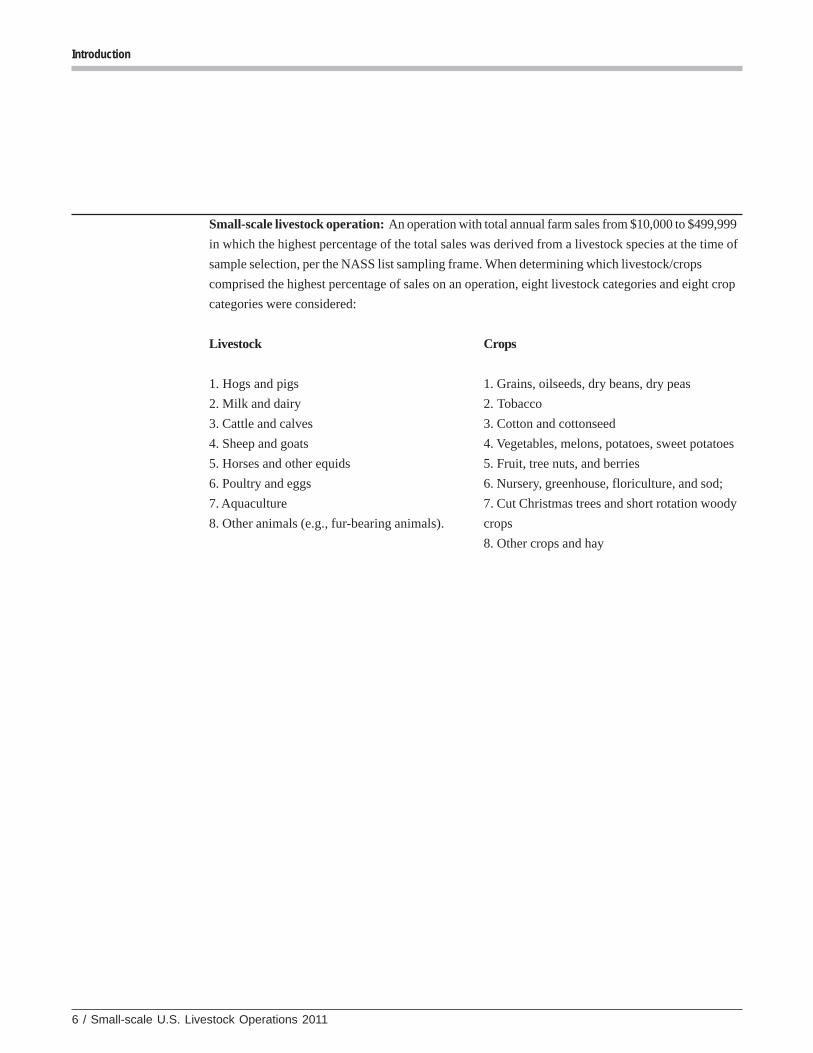
Small-scale livestock operation: An operation with total annual farm sales from $10,000 to $499,999
in which the highest percentage of the total sales was derived from a livestock species at the time of
sample selection, per the NASS list sampling frame. When determining which livestock/crops
comprised the highest percentage of sales on an operation, eight livestock categories and eight crop
categories were considered:
Crops
1. Grains, oilseeds, dry beans, dry peas
2. Tobacco
3. Cotton and cottonseed
4. Vegetables, melons, potatoes, sweet potatoes
5. Fruit, tree nuts, and berries
6. Nursery, greenhouse, floriculture, and sod;
7. Cut Christmas trees and short rotation woody
crops
8. Other crops and hay
Livestock
1. Hogs and pigs
2. Milk and dairy
3. Cattle and calves
4. Sheep and goats
5. Horses and other equids
6. Poultry and eggs
7. Aquaculture
8. Other animals (e.g., fur-bearing animals).
USDA APHIS VS / 7
Section I: Characteristics of Small-scale Livestock Operations—A. Diverse Products
Section I: CharSection I: CharSection I: CharSection I: CharSection I: Charactactactactacterererererisisisisistics oftics oftics oftics oftics ofSmall-scale LivSmall-scale LivSmall-scale LivSmall-scale LivSmall-scale Livesesesesestttttococococock Operk Operk Operk Operk Operationsationsationsationsations
A. Diverse ProductsA. Diverse ProductsA. Diverse ProductsA. Diverse ProductsA. Diverse Products
The target population for this study was small-
scale operations in which the predominant
agricultural enterprise was a livestock species,
such as cattle, poultry, goats, sheep, swine,
horses, aquaculture, or other farm animals raised
for sale or home use. Small-scale operations
were defined as operations with annual gross
sales of agricultural products from $10,000 to
$499,999 at the time of sample selection. There
are approximately 350,000 farms in the United
States that fit this definition of small-scale
livestock operations (see Appendix II, p 121).
Some small-scale operations diversify to reduce
economic risk by raising multiple livestock
species or agricultural commodities. Operations
that diversify might be less vulnerable to
difficult market or weather conditions; a better
year in one commodity could balance a bad year
in another commodity. Diversification may also
have environmental benefits; for example,
successfully managed crop diversification can
reduce soil erosion and the need for fertilizers,
and mitigate weed and/or pest problems
(SARE, 2004). It should be noted, however, that
the relationship between diversification and
economic success is complex. For some
operations, specialization may be preferable
(raising only one or two species/commodities).
For example, poultry operations often specialize
because production contract arrangements with
poultry companies are a method for managing
economic risk. Also, the increased labor and
equipment costs required for diversification can
make diversification economically unfeasible
for some operations (ERS, 1999b).
Beyond the economic aspects of diversification,
the presence of multiple livestock species on an
operation can also have implications for disease
transmission. For instance, several important
domestic and foreign animal diseases can infect
multiple ruminant species, and some influenza
virus strains might be able to cross over between
swine and avian species.
8 / Small-scale U.S. Livestock Operations 2011
Section I: Characteristics of Small-scale Livestock Operations—A. Diverse Products
1. Types oflivestock species
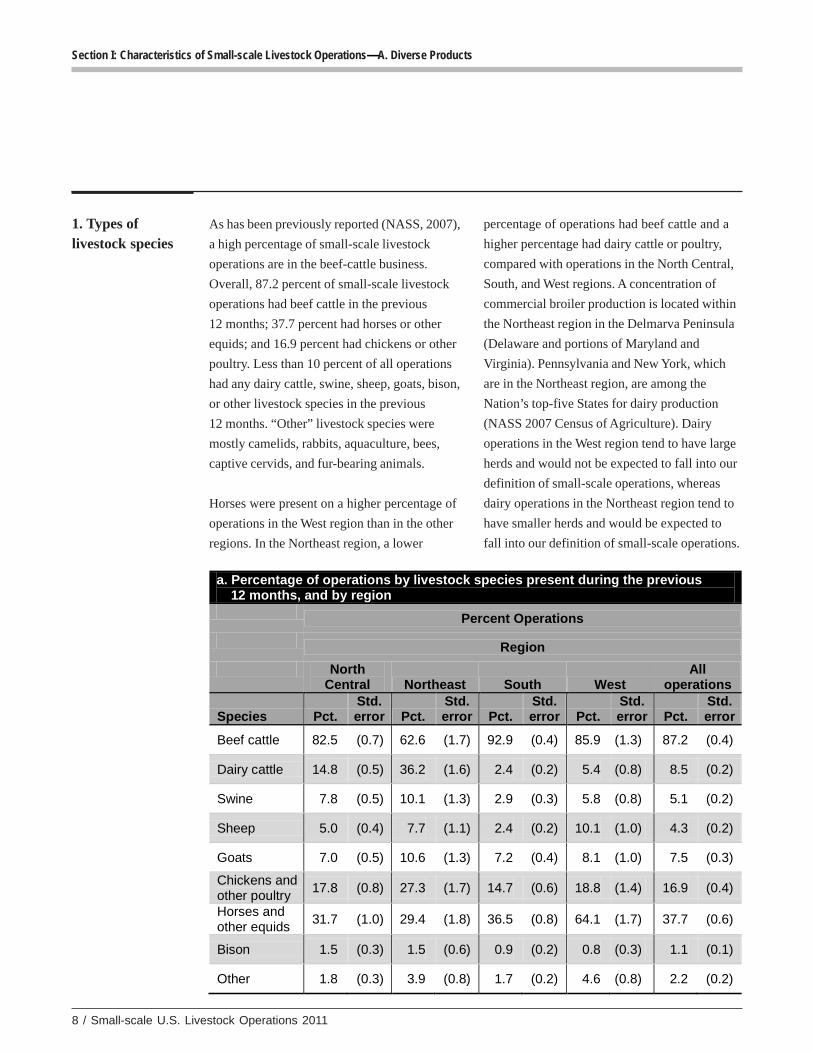
As has been previously reported (NASS, 2007),
a high percentage of small-scale livestock
operations are in the beef-cattle business.
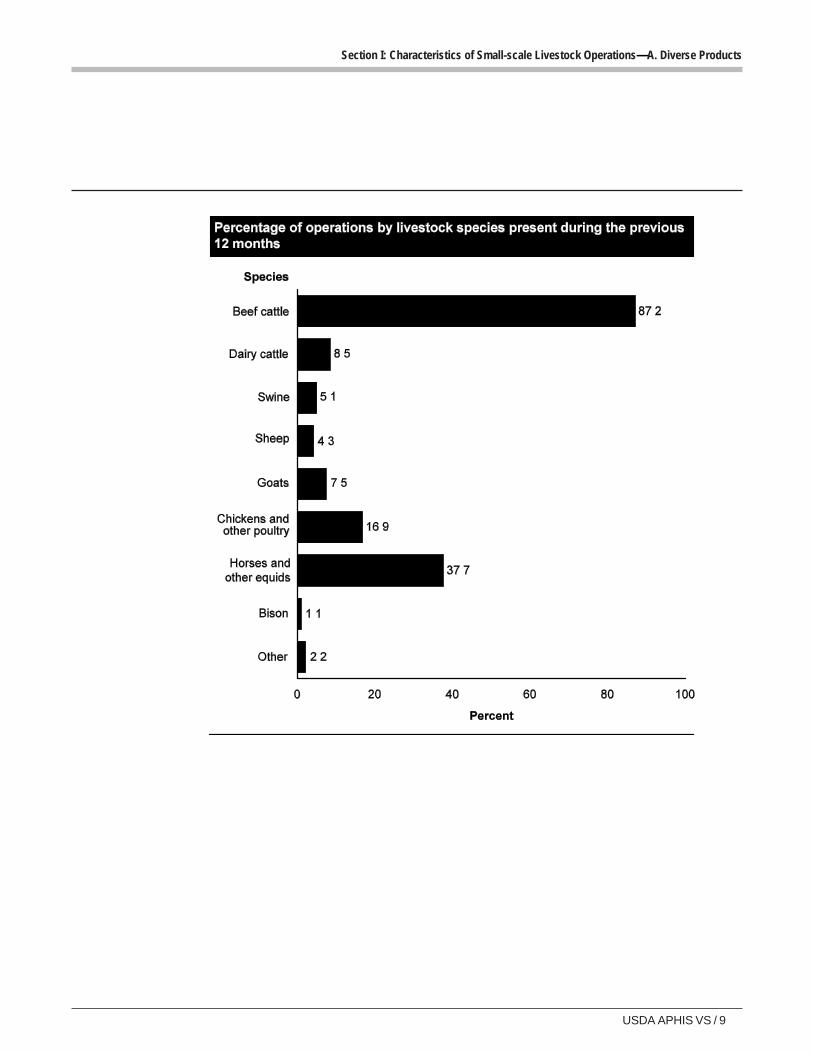
Overall, 87.2 percent of small-scale livestock
operations had beef cattle in the previous
12 months; 37.7 percent had horses or other
equids; and 16.9 percent had chickens or other
poultry. Less than 10 percent of all operations
had any dairy cattle, swine, sheep, goats, bison,
or other livestock species in the previous
12 months. “Other” livestock species were
mostly camelids, rabbits, aquaculture, bees,
captive cervids, and fur-bearing animals.
Horses were present on a higher percentage of
operations in the West region than in the other
regions. In the Northeast region, a lower
percentage of operations had beef cattle and a
higher percentage had dairy cattle or poultry,
compared with operations in the North Central,
South, and West regions. A concentration of
commercial broiler production is located within
the Northeast region in the Delmarva Peninsula
(Delaware and portions of Maryland and
Virginia). Pennsylvania and New York, which
are in the Northeast region, are among the
Nation’s top-five States for dairy production
(NASS 2007 Census of Agriculture). Dairy
operations in the West region tend to have large
herds and would not be expected to fall into our
definition of small-scale operations, whereas
dairy operations in the Northeast region tend to
have smaller herds and would be expected to
fall into our definition of small-scale operations.
a. Percentage of operations by livestock species present during the previous 12 months, and by region Percent Operations
Region
North Central Northeast South West
All operations
Species Pct. Std. error Pct.
Std. error Pct.
Std. error Pct.
Std. error Pct.
Std. error
Beef cattle 82.5 (0.7) 62.6 (1.7) 92.9 (0.4) 85.9 (1.3) 87.2 (0.4)
Dairy cattle 14.8 (0.5) 36.2 (1.6) 2.4 (0.2) 5.4 (0.8) 8.5 (0.2)
Swine 7.8 (0.5) 10.1 (1.3) 2.9 (0.3) 5.8 (0.8) 5.1 (0.2)
Sheep 5.0 (0.4) 7.7 (1.1) 2.4 (0.2) 10.1 (1.0) 4.3 (0.2)
Goats 7.0 (0.5) 10.6 (1.3) 7.2 (0.4) 8.1 (1.0) 7.5 (0.3)
Chickens and other poultry
17.8 (0.8) 27.3 (1.7) 14.7 (0.6) 18.8 (1.4) 16.9 (0.4)
Horses and other equids
31.7 (1.0) 29.4 (1.8) 36.5 (0.8) 64.1 (1.7) 37.7 (0.6)
Bison 1.5 (0.3) 1.5 (0.6) 0.9 (0.2) 0.8 (0.3) 1.1 (0.1)
Other 1.8 (0.3) 3.9 (0.8) 1.7 (0.2) 4.6 (0.8) 2.2 (0.2)
USDA APHIS VS / 9
Section I: Characteristics of Small-scale Livestock Operations—A. Diverse Products
10 / Small-scale U.S. Livestock Operations 2011
Section I: Characteristics of Small-scale Livestock Operations—A. Diverse Products
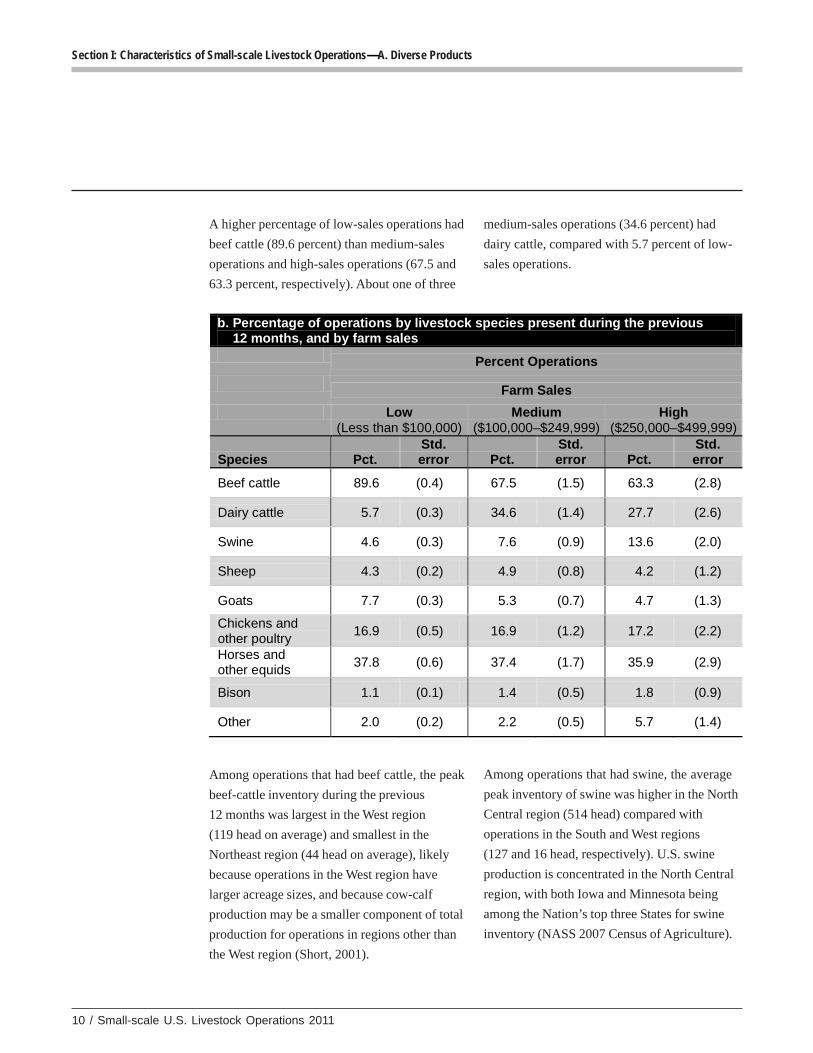
A higher percentage of low-sales operations had
beef cattle (89.6 percent) than medium-sales
operations and high-sales operations (67.5 and
63.3 percent, respectively). About one of three
b. Percentage of operations by livestock species present during the previous 12 months, and by farm sales
Percent Operations
Farm Sales
Low (Less than $100,000)
Medium ($100,000–$249,999)
High ($250,000–$499,999)
Species Pct. Std. error Pct.
Std. error Pct.
Std. error
Beef cattle 89.6 (0.4) 67.5 (1.5) 63.3 (2.8)
Dairy cattle 5.7 (0.3) 34.6 (1.4) 27.7 (2.6)
Swine 4.6 (0.3) 7.6 (0.9) 13.6 (2.0)
Sheep 4.3 (0.2) 4.9 (0.8) 4.2 (1.2)
Goats 7.7 (0.3) 5.3 (0.7) 4.7 (1.3)
Chickens and other poultry
16.9 (0.5) 16.9 (1.2) 17.2 (2.2)
Horses and other equids
37.8 (0.6) 37.4 (1.7) 35.9 (2.9)
Bison 1.1 (0.1) 1.4 (0.5) 1.8 (0.9)
Other 2.0 (0.2) 2.2 (0.5) 5.7 (1.4)
medium-sales operations (34.6 percent) had
dairy cattle, compared with 5.7 percent of low-
sales operations.
Among operations that had beef cattle, the peak
beef-cattle inventory during the previous
12 months was largest in the West region
(119 head on average) and smallest in the
Northeast region (44 head on average), likely
because operations in the West region have
larger acreage sizes, and because cow-calf
production may be a smaller component of total
production for operations in regions other than
the West region (Short, 2001).
Among operations that had swine, the average
peak inventory of swine was higher in the North
Central region (514 head) compared with
operations in the South and West regions
(127 and 16 head, respectively). U.S. swine
production is concentrated in the North Central
region, with both Iowa and Minnesota being
among the Nation’s top three States for swine
inventory (NASS 2007 Census of Agriculture).
USDA APHIS VS / 11
Section I: Characteristics of Small-scale Livestock Operations—A. Diverse Products
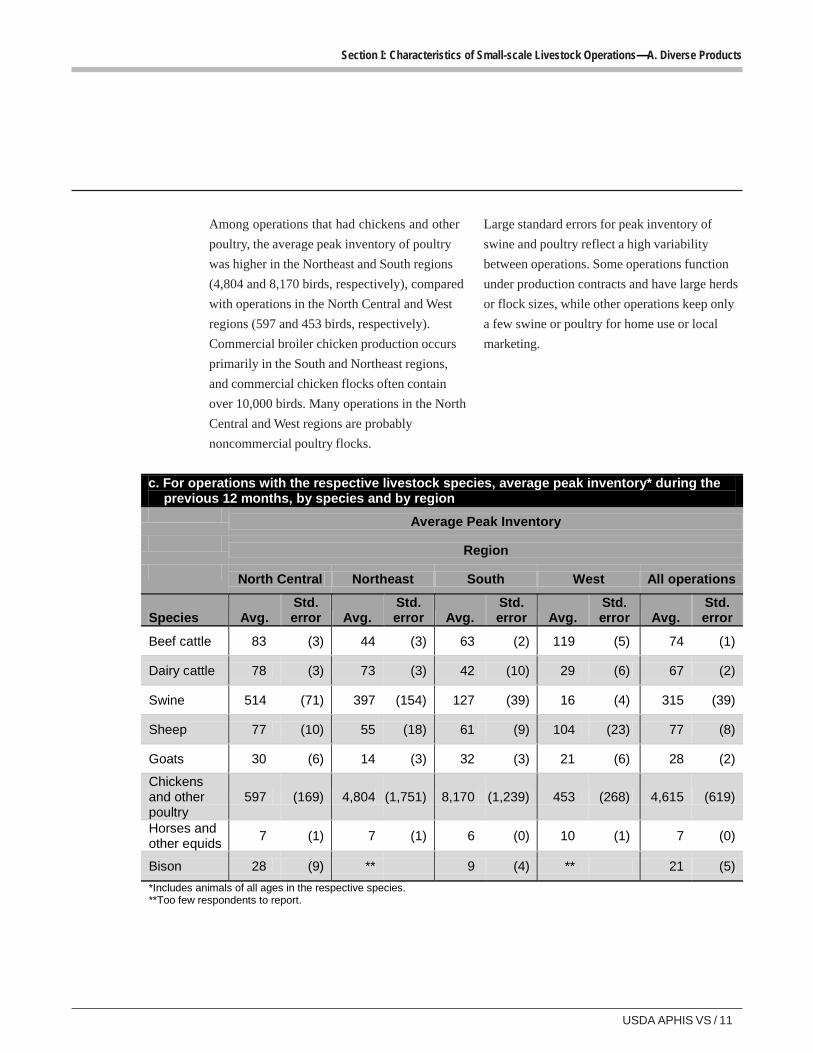
Among operations that had chickens and other
poultry, the average peak inventory of poultry
was higher in the Northeast and South regions
(4,804 and 8,170 birds, respectively), compared
with operations in the North Central and West
regions (597 and 453 birds, respectively).
Commercial broiler chicken production occurs
primarily in the South and Northeast regions,
and commercial chicken flocks often contain
over 10,000 birds. Many operations in the North
Central and West regions are probably
noncommercial poultry flocks.
Large standard errors for peak inventory of
swine and poultry reflect a high variability
between operations. Some operations function
under production contracts and have large herds
or flock sizes, while other operations keep only
a few swine or poultry for home use or local
marketing.
c. For operations with the respective livestock species, average peak inventory* during the previous 12 months, by species and by region
Average Peak Inventory
Region
North Central Northeast South West All operations
Species Avg. Std. error Avg.
Std. error Avg.
Std. error Avg.
Std. error Avg.
Std. error
Beef cattle 83 (3) 44 (3) 63 (2) 119 (5) 74 (1)
Dairy cattle 78 (3) 73 (3) 42 (10) 29 (6) 67 (2)
Swine 514 (71) 397 (154) 127 (39) 16 (4) 315 (39)
Sheep 77 (10) 55 (18) 61 (9) 104 (23) 77 (8)
Goats 30 (6) 14 (3) 32 (3) 21 (6) 28 (2)
Chickens and other poultry
597 (169) 4,804 (1,751) 8,170 (1,239) 453 (268) 4,615 (619)
Horses and other equids
7 (1) 7 (1) 6 (0) 10 (1) 7 (0)
Bison 28 (9) ** 9 (4) ** 21 (5)
*Includes animals of all ages in the respective species. **Too few respondents to report.
12 / Small-scale U.S. Livestock Operations 2011
Section I: Characteristics of Small-scale Livestock Operations—A. Diverse Products
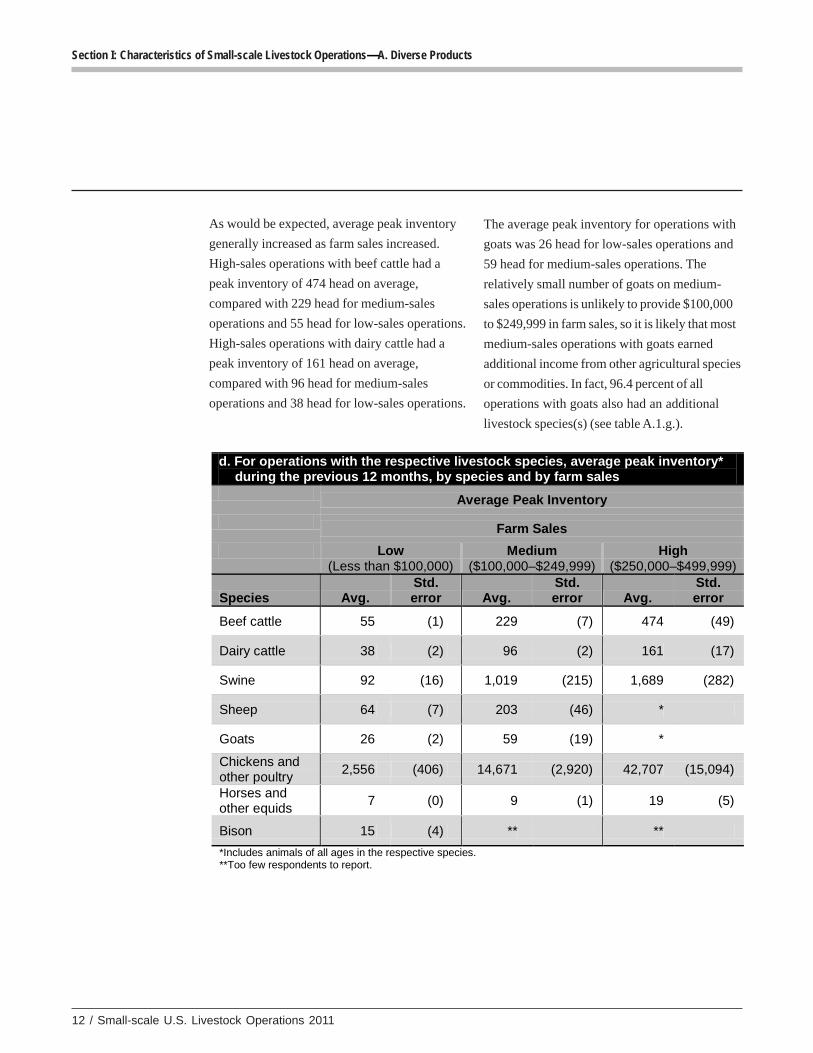
As would be expected, average peak inventory
generally increased as farm sales increased.
High-sales operations with beef cattle had a
peak inventory of 474 head on average,
compared with 229 head for medium-sales
operations and 55 head for low-sales operations.
High-sales operations with dairy cattle had a
peak inventory of 161 head on average,
compared with 96 head for medium-sales
operations and 38 head for low-sales operations.
The average peak inventory for operations with
goats was 26 head for low-sales operations and
59 head for medium-sales operations. The
relatively small number of goats on medium-
sales operations is unlikely to provide $100,000
to $249,999 in farm sales, so it is likely that most
medium-sales operations with goats earned
additional income from other agricultural species
or commodities. In fact, 96.4 percent of all
operations with goats also had an additional
livestock species(s) (see table A.1.g.).
d. For operations with the respective livestock species, average peak inventory* during the previous 12 months, by species and by farm sales Average Peak Inventory
Farm Sales
Low (Less than $100,000)
Medium ($100,000–$249,999)
High ($250,000–$499,999)
Species Avg. Std. error Avg.
Std. error Avg.
Std. error
Beef cattle 55 (1) 229 (7) 474 (49)
Dairy cattle 38 (2) 96 (2) 161 (17)
Swine 92 (16) 1,019 (215) 1,689 (282)
Sheep 64 (7) 203 (46) *
Goats 26 (2) 59 (19) *
Chickens and other poultry
2,556 (406) 14,671 (2,920) 42,707 (15,094)
Horses and other equids
7 (0) 9 (1) 19 (5)
Bison 15 (4) ** **
*Includes animals of all ages in the respective species. **Too few respondents to report.
USDA APHIS VS / 13
Section I: Characteristics of Small-scale Livestock Operations—A. Diverse Products
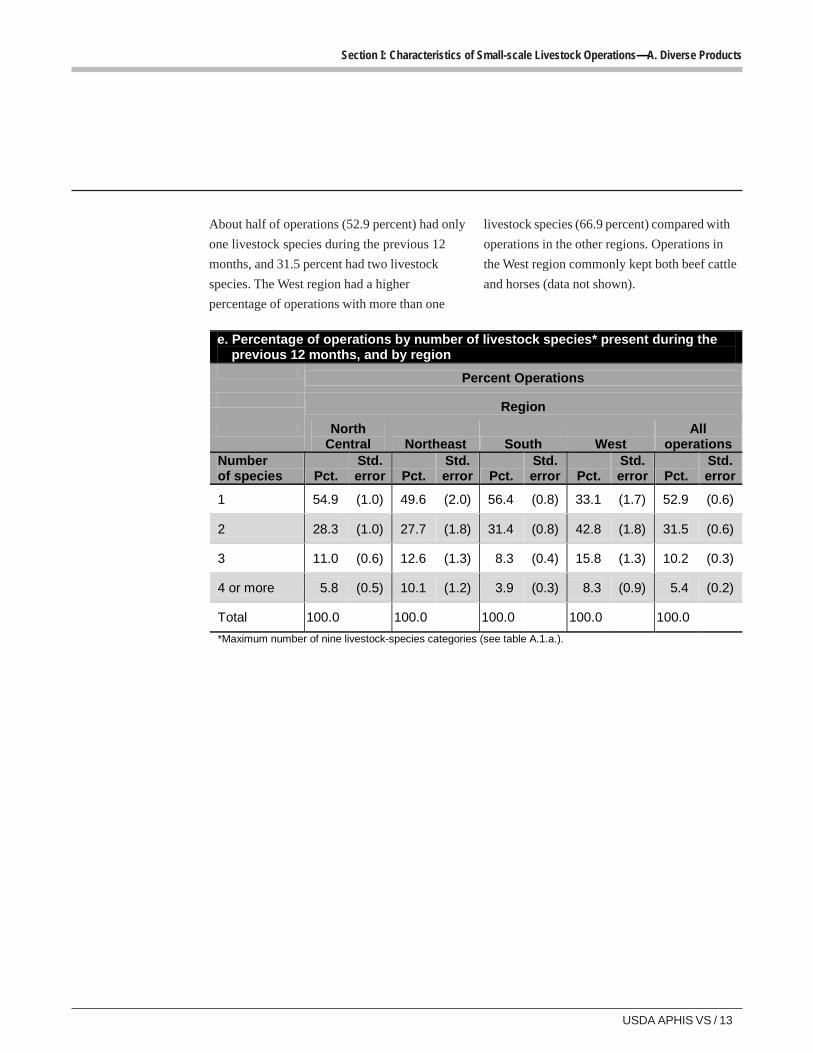
About half of operations (52.9 percent) had only
one livestock species during the previous 12
months, and 31.5 percent had two livestock
species. The West region had a higher
percentage of operations with more than one
livestock species (66.9 percent) compared with
operations in the other regions. Operations in
the West region commonly kept both beef cattle
and horses (data not shown).
e. Percentage of operations by number of livestock species* present during the previous 12 months, and by region
Percent Operations
Region
North Central Northeast South West
All operations
Number of species Pct.
Std. error Pct.
Std. error Pct.
Std. error Pct.
Std. error Pct.
Std. error
1 54.9 (1.0) 49.6 (2.0) 56.4 (0.8) 33.1 (1.7) 52.9 (0.6)
2 28.3 (1.0) 27.7 (1.8) 31.4 (0.8) 42.8 (1.8) 31.5 (0.6)
3 11.0 (0.6) 12.6 (1.3) 8.3 (0.4) 15.8 (1.3) 10.2 (0.3)
4 or more 5.8 (0.5) 10.1 (1.2) 3.9 (0.3) 8.3 (0.9) 5.4 (0.2)
Total 100.0 100.0 100.0 100.0 100.0
*Maximum number of nine livestock-species categories (see table A.1.a.).
14 / Small-scale U.S. Livestock Operations 2011
Section I: Characteristics of Small-scale Livestock Operations—A. Diverse Products
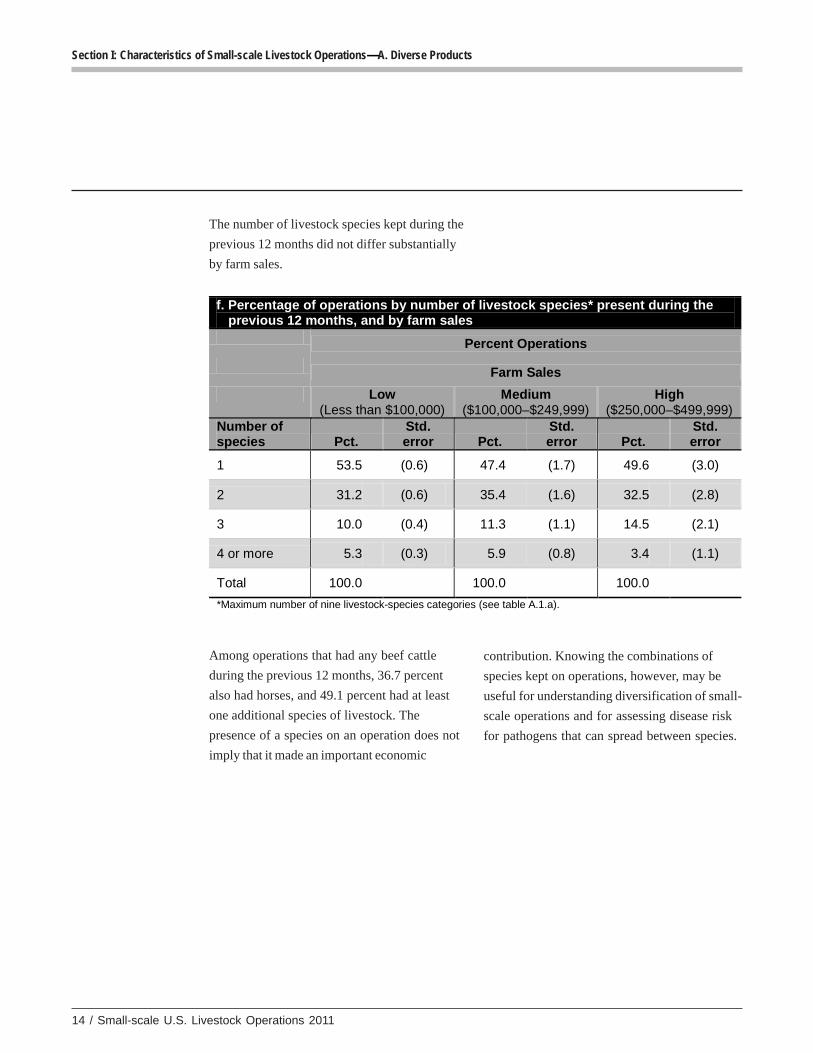
The number of livestock species kept during the
previous 12 months did not differ substantially
by farm sales.
f. Percentage of operations by number of livestock species* present during the previous 12 months, and by farm sales Percent Operations
Farm Sales
Low (Less than $100,000)
Medium ($100,000–$249,999)
High ($250,000–$499,999)
Number of species Pct.
Std. error Pct.
Std. error Pct.
Std. error
1 53.5 (0.6) 47.4 (1.7) 49.6 (3.0)
2 31.2 (0.6) 35.4 (1.6) 32.5 (2.8)
3 10.0 (0.4) 11.3 (1.1) 14.5 (2.1)
4 or more 5.3 (0.3) 5.9 (0.8) 3.4 (1.1)
Total 100.0 100.0 100.0
*Maximum number of nine livestock-species categories (see table A.1.a).
Among operations that had any beef cattle
during the previous 12 months, 36.7 percent
also had horses, and 49.1 percent had at least
one additional species of livestock. The
presence of a species on an operation does not
imply that it made an important economic
contribution. Knowing the combinations of
species kept on operations, however, may be
useful for understanding diversification of small-
scale operations and for assessing disease risk
for pathogens that can spread between species.
USDA APHIS VS / 15
Section I: Characteristics of Small-scale Livestock Operations—A. Diverse Products
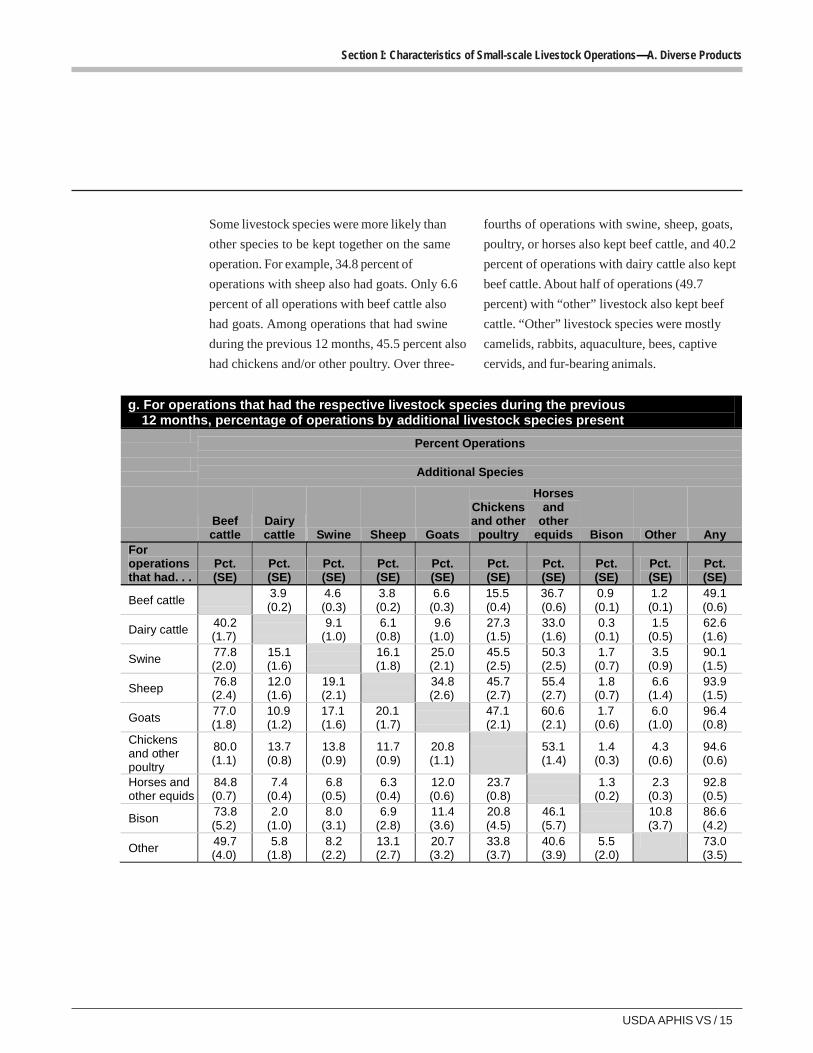
Some livestock species were more likely than
other species to be kept together on the same
operation. For example, 34.8 percent of
operations with sheep also had goats. Only 6.6
percent of all operations with beef cattle also
had goats. Among operations that had swine
during the previous 12 months, 45.5 percent also
had chickens and/or other poultry. Over three-
fourths of operations with swine, sheep, goats,
poultry, or horses also kept beef cattle, and 40.2
percent of operations with dairy cattle also kept
beef cattle. About half of operations (49.7
percent) with “other” livestock also kept beef
cattle. “Other” livestock species were mostly
camelids, rabbits, aquaculture, bees, captive
cervids, and fur-bearing animals.
g. For operations that had the respective livestock species during the previous 12 months, percentage of operations by additional livestock species present
Percent Operations
Additional Species
Beef cattle
Dairy cattle Swine Sheep Goats
Chickens and other
poultry
Horses and
other equids Bison Other Any
For operations that had. . .
Pct. (SE)
Pct. (SE)
Pct. (SE)
Pct. (SE)
Pct. (SE)
Pct. (SE)
Pct. (SE)
Pct. (SE)
Pct. (SE)
Pct. (SE)
Beef cattle 3.9 (0.2)
4.6 (0.3)
3.8 (0.2)
6.6 (0.3)
15.5 (0.4)
36.7 (0.6)
0.9 (0.1)
1.2 (0.1)
49.1 (0.6)
Dairy cattle 40.2 (1.7)
9.1
(1.0) 6.1
(0.8) 9.6
(1.0) 27.3 (1.5)
33.0 (1.6)
0.3 (0.1)
1.5 (0.5)
62.6 (1.6)
Swine 77.8 (2.0)
15.1 (1.6)
16.1 (1.8)
25.0 (2.1)
45.5 (2.5)
50.3 (2.5)
1.7 (0.7)
3.5 (0.9)
90.1 (1.5)
Sheep 76.8 (2.4)
12.0 (1.6)
19.1 (2.1)
34.8 (2.6)
45.7 (2.7)
55.4 (2.7)
1.8 (0.7)
6.6 (1.4)
93.9 (1.5)
Goats 77.0 (1.8)
10.9 (1.2)
17.1 (1.6)
20.1 (1.7)
47.1 (2.1)
60.6 (2.1)
1.7 (0.6)
6.0 (1.0)
96.4 (0.8)
Chickens and other poultry
80.0 (1.1)
13.7 (0.8)
13.8 (0.9)
11.7 (0.9)
20.8 (1.1)
53.1 (1.4)
1.4 (0.3)
4.3 (0.6)
94.6 (0.6)
Horses and other equids
84.8 (0.7)
7.4 (0.4)
6.8 (0.5)
6.3 (0.4)
12.0 (0.6)
23.7 (0.8)
1.3
(0.2) 2.3
(0.3) 92.8 (0.5)
Bison 73.8 (5.2)
2.0 (1.0)
8.0 (3.1)
6.9 (2.8)
11.4 (3.6)
20.8 (4.5)
46.1 (5.7)
10.8 (3.7)
86.6 (4.2)
Other 49.7 (4.0)
5.8 (1.8)
8.2 (2.2)
13.1 (2.7)
20.7 (3.2)
33.8 (3.7)
40.6 (3.9)
5.5 (2.0)
73.0 (3.5)
16 / Small-scale U.S. Livestock Operations 2011
Section I: Characteristics of Small-scale Livestock Operations—A. Diverse Products
2. Crops raisedon operation
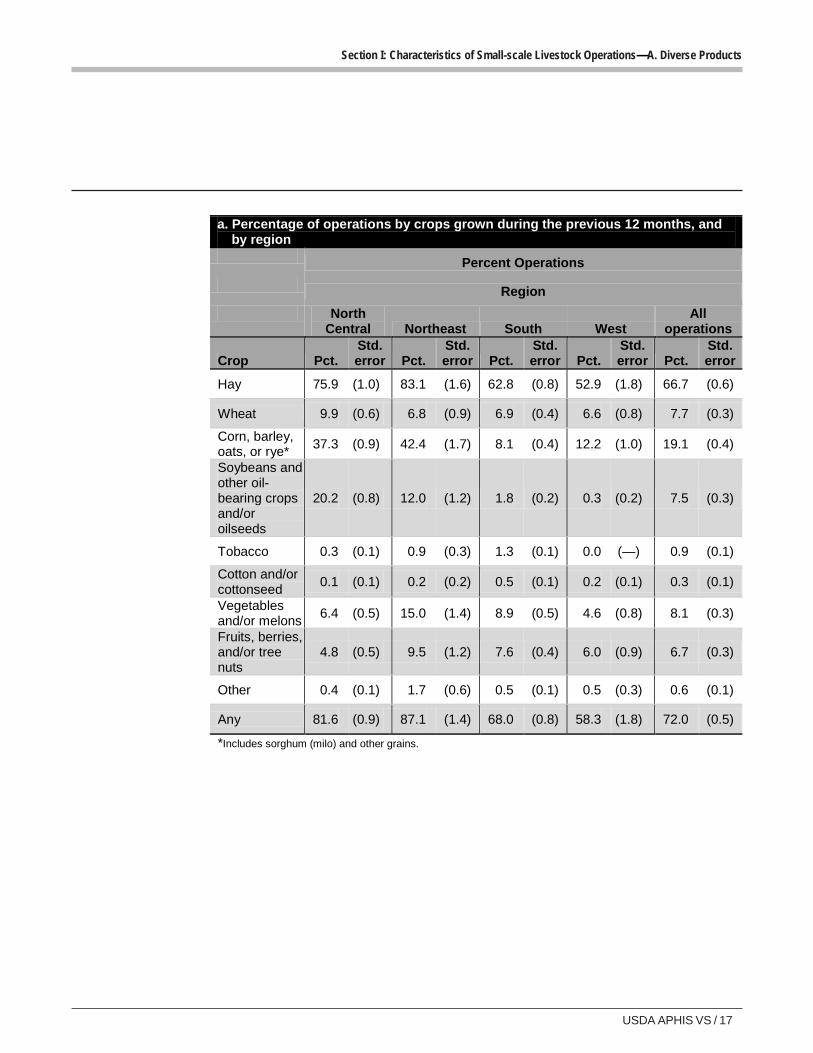
About 7 of 10 operations in this study
(72.0 percent) grew some type of plant crop in
addition to raising livestock. Almost 9 of 10
operations in the Northeast region (87.1 percent)
had grown some type of crop during the
previous 12 months, compared with about 8 of
10 operations in the North Central region
(81.6 percent), 7 of 10 operations in the South
region (68.0 percent), and 6 of 10 operations in
the West region (58.3 percent).
Overall, two of three operations (66.7 percent)
grew hay during the previous 12 months. About
4 of 10 operations in the Northeast and North
Central regions (42.4 and 37.3 percent,
respectively) grew corn, barley, oats, or rye,
compared with about 1 of 10 operations in the
South and West regions (8.1 and 12.2 percent,
respectively). Soybeans/oil bearing crops/
oilseeds were grown on about 2 of 10 operations
in the North Central region (20.2 percent) but
were on very few operations in the South and
West regions (1.8 and 0.3 percent of operations,
respectively). A higher percentage of operations
in the Northeast region than in the other regions
grew vegetables and/or melons. “Other” crops
were primarily peanuts, maple syrup, and beans.
USDA APHIS VS / 17
Section I: Characteristics of Small-scale Livestock Operations—A. Diverse Products
a. Percentage of operations by crops grown during the previous 12 months, and by region
Percent Operations
Region
North Central Northeast South West
All operations
Crop Pct. Std. error Pct.
Std. error Pct.
Std. error Pct.
Std. error Pct.
Std. error
Hay 75.9 (1.0) 83.1 (1.6) 62.8 (0.8) 52.9 (1.8) 66.7 (0.6)
Wheat 9.9 (0.6) 6.8 (0.9) 6.9 (0.4) 6.6 (0.8) 7.7 (0.3)
Corn, barley, oats, or rye*
37.3 (0.9) 42.4 (1.7) 8.1 (0.4) 12.2 (1.0) 19.1 (0.4)
Soybeans and other oil-bearing crops and/or oilseeds
20.2 (0.8) 12.0 (1.2) 1.8 (0.2) 0.3 (0.2) 7.5 (0.3)
Tobacco 0.3 (0.1) 0.9 (0.3) 1.3 (0.1) 0.0 (—) 0.9 (0.1)
Cotton and/or cottonseed
0.1 (0.1) 0.2 (0.2) 0.5 (0.1) 0.2 (0.1) 0.3 (0.1)
Vegetables and/or melons
6.4 (0.5) 15.0 (1.4) 8.9 (0.5) 4.6 (0.8) 8.1 (0.3)
Fruits, berries, and/or tree nuts
4.8 (0.5) 9.5 (1.2) 7.6 (0.4) 6.0 (0.9) 6.7 (0.3)
Other 0.4 (0.1) 1.7 (0.6) 0.5 (0.1) 0.5 (0.3) 0.6 (0.1)
Any 81.6 (0.9) 87.1 (1.4) 68.0 (0.8) 58.3 (1.8) 72.0 (0.5)
*Includes sorghum (milo) and other grains.

18 / Small-scale U.S. Livestock Operations 2011
Section I: Characteristics of Small-scale Livestock Operations—A. Diverse Products
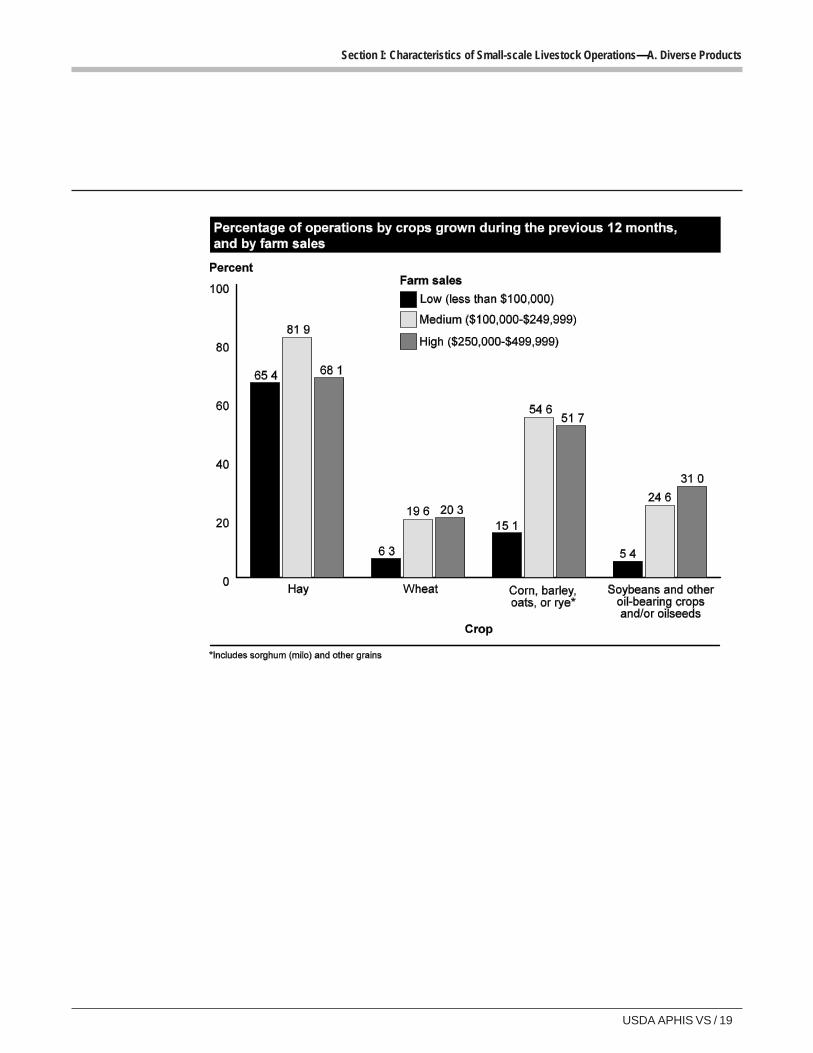
About 8 of 10 medium-sales operations
(81.9 percent) had grown hay during the
previous 12 months compared with about 2 of 3
low- and high-sales operations (65.4 and
68.1 percent, respectively). About half of
medium- and high-sales operations grew corn,
barley, oats, or rye (54.6 and 51.7 percent,
respectively). Medium- and high-sales
operations were more likely than low-sales
operations to grow wheat, corn, barley, oats, or
rye; or soybeans/oil-bearing crops/oilseeds.
These crops generally require more equipment
and acreage for cost-effective production.
b. Percentage of operations by crops grown during the previous 12 months, and by farm sales
Percent Operations
Farm Sales
Low (Less than $100,000)
Medium ($100,000–$249,999)
High ($250,000–$499,999)
Crop Pct. Std. error Pct.
Std. error Pct.
Std. error
Hay 65.4 (0.6) 81.9 (1.3) 68.1 (2.9)
Wheat 6.3 (0.3) 19.6 (1.4) 20.3 (2.4)
Corn, barley, oats, or rye*
15.1 (0.4) 54.6 (1.6) 51.7 (2.9)
Soybeans and other oil-bearing crops and/or oilseeds
5.4 (0.3) 24.6 (1.4) 31.0 (2.7)
Tobacco 0.8 (0.1) 1.6 (0.4) 1.6 (0.8)
Cotton and/or cottonseed
0.3 (0.1) 1.2 (0.4) 0.5 (0.5)
Vegetables and/or melons
8.4 (0.4) 6.2 (0.8) 5.0 (1.3)
Fruits, berries, and/or tree nuts
7.0 (0.3) 4.2 (0.7) 3.6 (1.1)
Other 0.5 (0.1) 0.8 (0.3) 1.2 (0.6)
Any 70.7 (0.6) 86.2 (1.2) 77.7 (2.6)
*Includes sorghum (milo) and other grains.
USDA APHIS VS / 19
Section I: Characteristics of Small-scale Livestock Operations—A. Diverse Products
20 / Small-scale U.S. Livestock Operations 2011
Section I: Characteristics of Small-scale Livestock Operations—A. Diverse Products
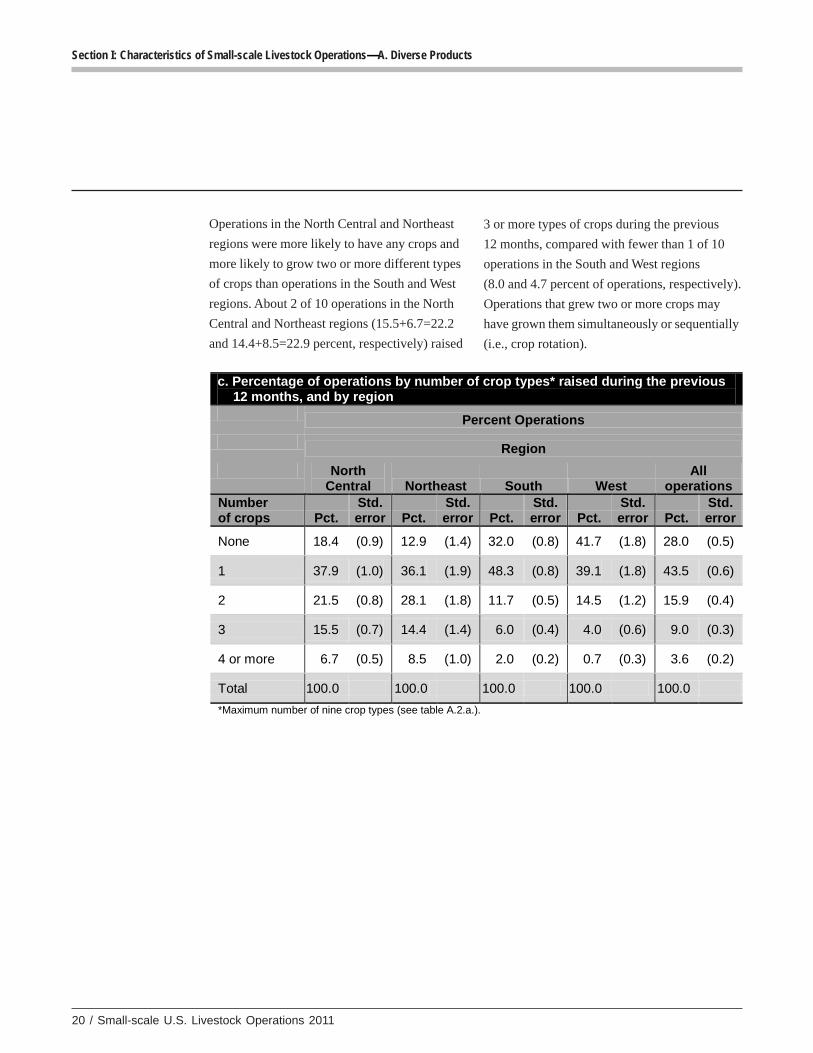
Operations in the North Central and Northeast
regions were more likely to have any crops and
more likely to grow two or more different types
of crops than operations in the South and West
regions. About 2 of 10 operations in the North
Central and Northeast regions (15.5+6.7=22.2
and 14.4+8.5=22.9 percent, respectively) raised
3 or more types of crops during the previous
12 months, compared with fewer than 1 of 10
operations in the South and West regions
(8.0 and 4.7 percent of operations, respectively).
Operations that grew two or more crops may
have grown them simultaneously or sequentially
(i.e., crop rotation).
c. Percentage of operations by number of crop types* raised during the previous 12 months, and by region
Percent Operations
Region
North Central Northeast South West
All operations
Number of crops Pct.
Std. error Pct.
Std. error Pct.
Std. error Pct.
Std. error Pct.
Std. error
None 18.4 (0.9) 12.9 (1.4) 32.0 (0.8) 41.7 (1.8) 28.0 (0.5)
1 37.9 (1.0) 36.1 (1.9) 48.3 (0.8) 39.1 (1.8) 43.5 (0.6)
2 21.5 (0.8) 28.1 (1.8) 11.7 (0.5) 14.5 (1.2) 15.9 (0.4)
3 15.5 (0.7) 14.4 (1.4) 6.0 (0.4) 4.0 (0.6) 9.0 (0.3)
4 or more 6.7 (0.5) 8.5 (1.0) 2.0 (0.2) 0.7 (0.3) 3.6 (0.2)
Total 100.0 100.0 100.0 100.0 100.0
*Maximum number of nine crop types (see table A.2.a.).
USDA APHIS VS / 21
Section I: Characteristics of Small-scale Livestock Operations—A. Diverse Products
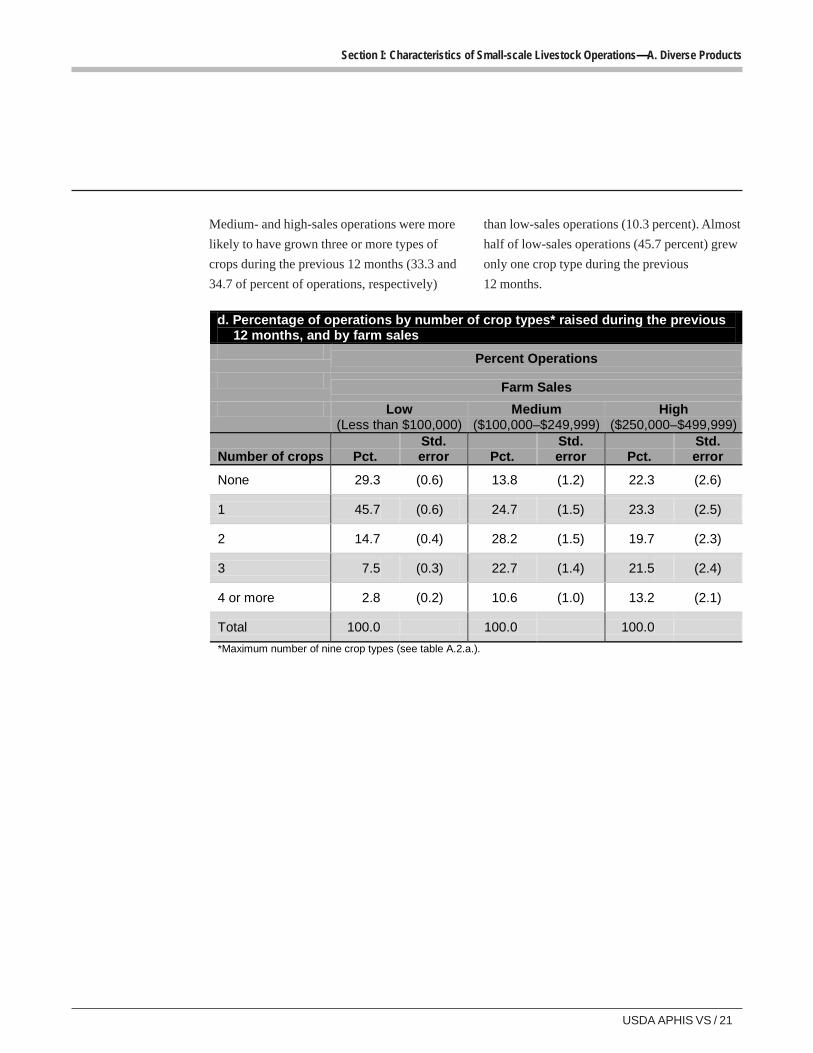
Medium- and high-sales operations were more
likely to have grown three or more types of
crops during the previous 12 months (33.3 and
34.7 of percent of operations, respectively)
than low-sales operations (10.3 percent). Almost
half of low-sales operations (45.7 percent) grew
only one crop type during the previous
12 months.
d. Percentage of operations by number of crop types* raised during the previous 12 months, and by farm sales
Percent Operations
Farm Sales
Low (Less than $100,000)
Medium ($100,000–$249,999)
High ($250,000–$499,999)
Number of crops Pct. Std. error Pct.
Std. error Pct.
Std. error
None 29.3 (0.6) 13.8 (1.2) 22.3 (2.6)
1 45.7 (0.6) 24.7 (1.5) 23.3 (2.5)
2 14.7 (0.4) 28.2 (1.5) 19.7 (2.3)
3 7.5 (0.3) 22.7 (1.4) 21.5 (2.4)
4 or more 2.8 (0.2) 10.6 (1.0) 13.2 (2.1)
Total 100.0 100.0 100.0
*Maximum number of nine crop types (see table A.2.a.).
22 / Small-scale U.S. Livestock Operations 2011
Section I: Characteristics of Small-scale Livestock Operations—A. Diverse Products
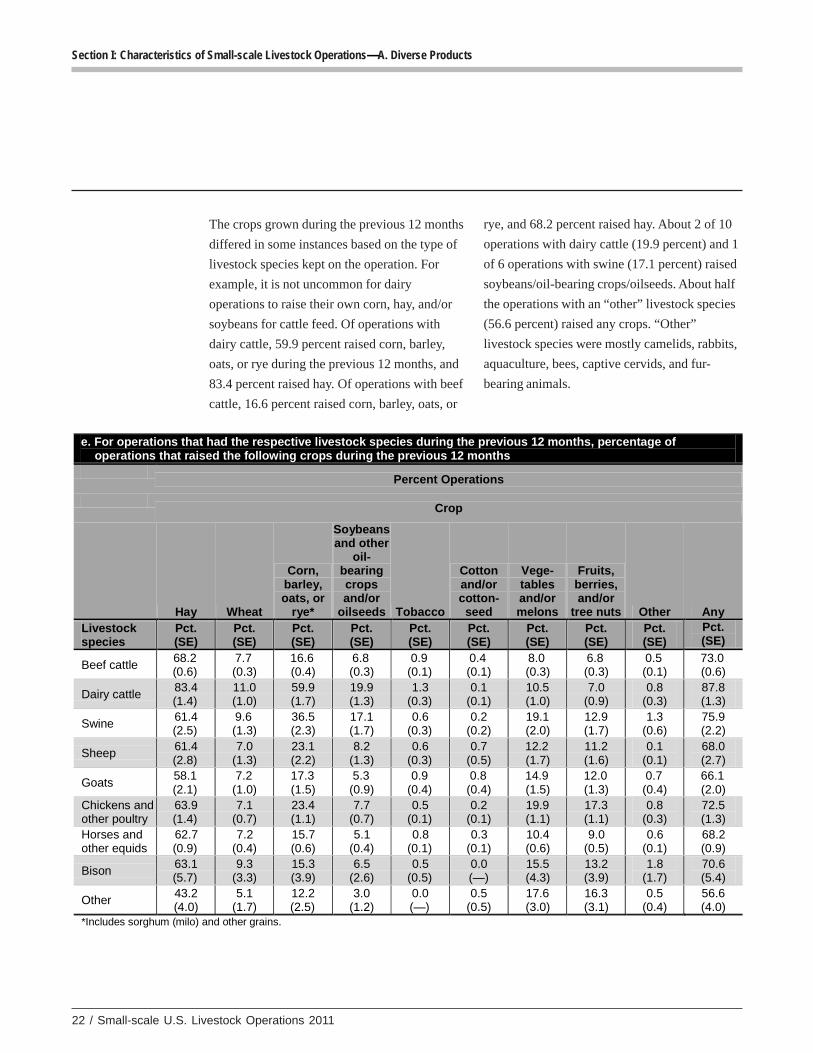
The crops grown during the previous 12 months
differed in some instances based on the type of
livestock species kept on the operation. For
example, it is not uncommon for dairy
operations to raise their own corn, hay, and/or
soybeans for cattle feed. Of operations with
dairy cattle, 59.9 percent raised corn, barley,
oats, or rye during the previous 12 months, and
83.4 percent raised hay. Of operations with beef
cattle, 16.6 percent raised corn, barley, oats, or
rye, and 68.2 percent raised hay. About 2 of 10
operations with dairy cattle (19.9 percent) and 1
of 6 operations with swine (17.1 percent) raised
soybeans/oil-bearing crops/oilseeds. About half
the operations with an “other” livestock species
(56.6 percent) raised any crops. “Other”
livestock species were mostly camelids, rabbits,
aquaculture, bees, captive cervids, and fur-
bearing animals.
e. For operations that had the respective livestock species during the previous 12 months, percentage of operations that raised the following crops during the previous 12 months
Percent Operations
Crop
Hay Wheat
Corn, barley, oats, or
rye*
Soybeans and other
oil-bearing crops and/or
oilseeds Tobacco
Cotton and/or cotton-seed
Vege-tables and/or melons
Fruits, berries, and/or
tree nuts Other Any Livestock species
Pct. (SE)
Pct. (SE)
Pct. (SE)
Pct. (SE)
Pct. (SE)
Pct. (SE)
Pct. (SE)
Pct. (SE)
Pct. (SE)
Pct. (SE)
Beef cattle 68.2 (0.6)
7.7 (0.3)
16.6 (0.4)
6.8 (0.3)
0.9 (0.1)
0.4 (0.1)
8.0 (0.3)
6.8 (0.3)
0.5 (0.1)
73.0 (0.6)
Dairy cattle 83.4 (1.4)
11.0 (1.0)
59.9 (1.7)
19.9 (1.3)
1.3 (0.3)
0.1 (0.1)
10.5 (1.0)
7.0 (0.9)
0.8 (0.3)
87.8 (1.3)
Swine 61.4 (2.5)
9.6 (1.3)
36.5 (2.3)
17.1 (1.7)
0.6 (0.3)
0.2 (0.2)
19.1 (2.0)
12.9 (1.7)
1.3 (0.6)
75.9 (2.2)
Sheep 61.4 (2.8)
7.0 (1.3)
23.1 (2.2)
8.2 (1.3)
0.6 (0.3)
0.7 (0.5)
12.2 (1.7)
11.2 (1.6)
0.1 (0.1)
68.0 (2.7)
Goats 58.1 (2.1)
7.2 (1.0)
17.3 (1.5)
5.3 (0.9)
0.9 (0.4)
0.8 (0.4)
14.9 (1.5)
12.0 (1.3)
0.7 (0.4)
66.1 (2.0)
Chickens and other poultry
63.9 (1.4)
7.1 (0.7)
23.4 (1.1)
7.7 (0.7)
0.5 (0.1)
0.2 (0.1)
19.9 (1.1)
17.3 (1.1)
0.8 (0.3)
72.5 (1.3)
Horses and other equids
62.7 (0.9)
7.2 (0.4)
15.7 (0.6)
5.1 (0.4)
0.8 (0.1)
0.3 (0.1)
10.4 (0.6)
9.0 (0.5)
0.6 (0.1)
68.2 (0.9)
Bison 63.1 (5.7)
9.3 (3.3)
15.3 (3.9)
6.5 (2.6)
0.5 (0.5)
0.0 (—)
15.5 (4.3)
13.2 (3.9)
1.8 (1.7)
70.6 (5.4)
Other 43.2 (4.0)
5.1 (1.7)
12.2 (2.5)
3.0 (1.2)
0.0 (—)
0.5 (0.5)
17.6 (3.0)
16.3 (3.1)
0.5 (0.4)
56.6 (4.0)
*Includes sorghum (milo) and other grains.
USDA APHIS VS / 23
Section I: Characteristics of Small-scale Livestock Operations—B. Marketing
B. MarketingB. MarketingB. MarketingB. MarketingB. Marketing
Small-scale operations can retain a higher share
of their dollars by using direct-marketing
strategies and by marketing specialty products.
Examples of direct marketing include: sales
through farmer-owned cooperatives; sales to
consumers through farmer’s markets, the
Internet, or Community Supported Agriculture
(CSA); and direct sales to specialty food stores,
restaurants, and schools.
Specialty products are one way that small-scale
operations can differentiate their products.
Specialty products usually carry a label or
description about how the product was
produced. Examples of specialty products
include natural, organic, grass fed, pasture
raised, cage free, certified humane, and eco-
friendly.
24 / Small-scale U.S. Livestock Operations 2011
Section I: Characteristics of Small-scale Livestock Operations—B. Marketing
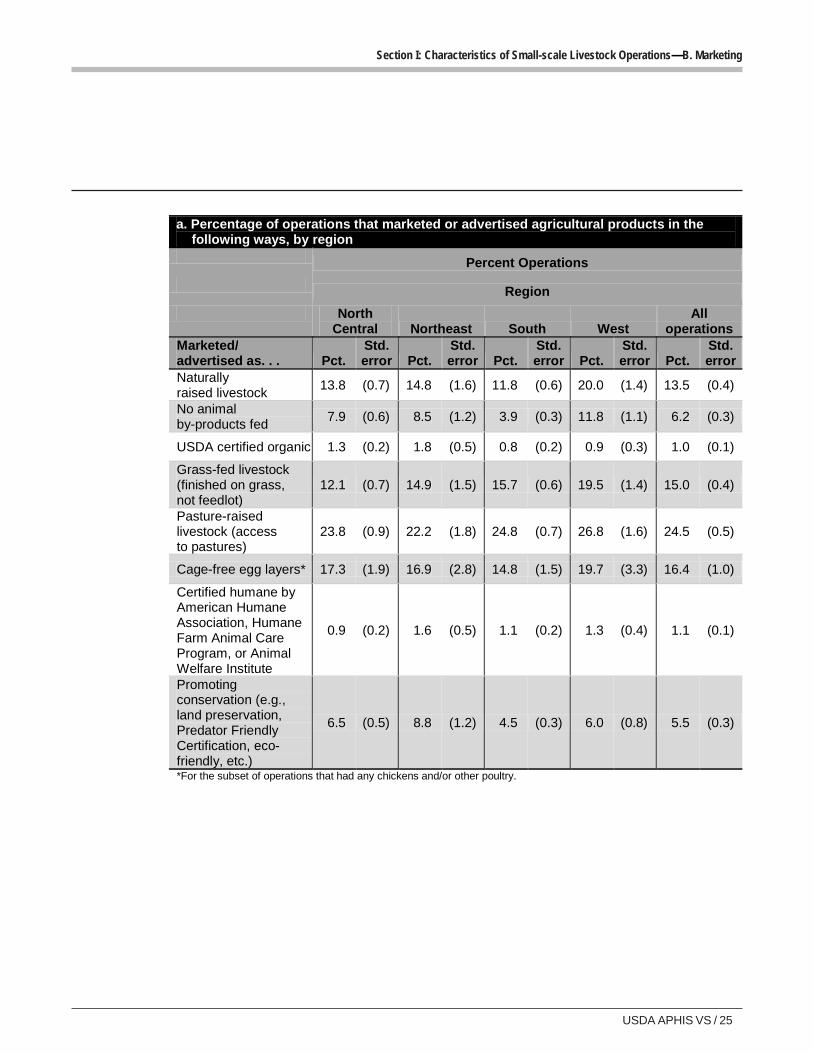
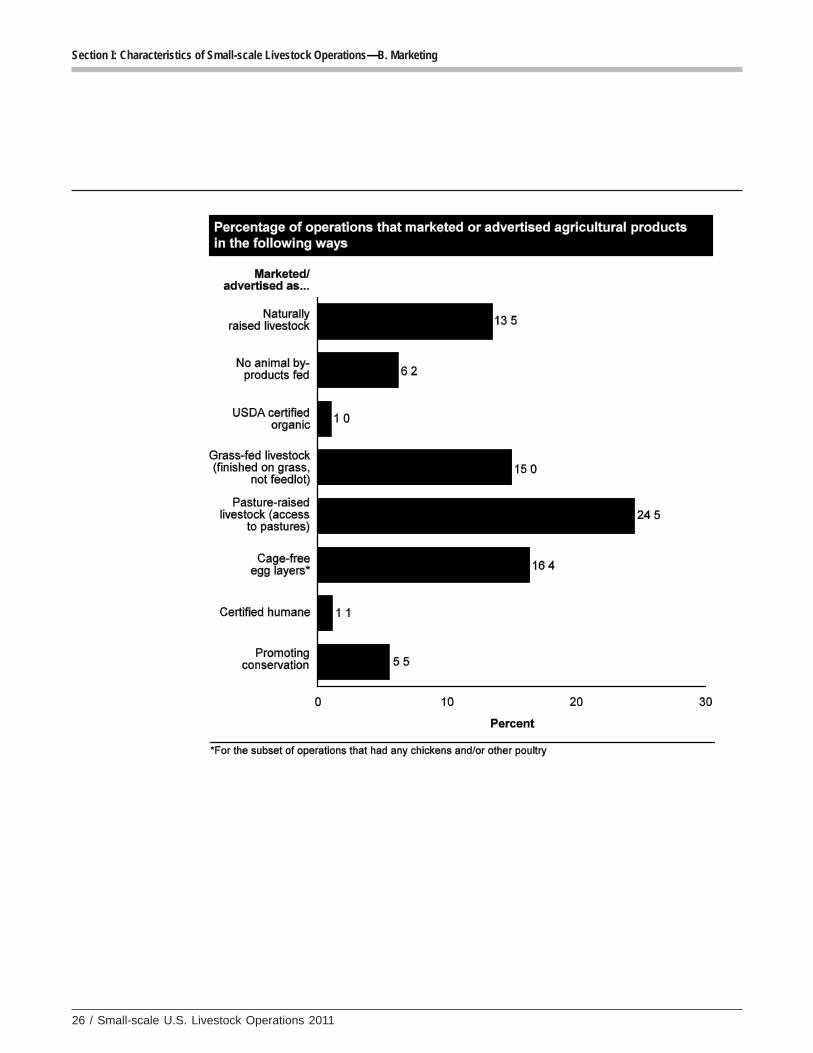
1. Specialtyproducts
Overall, less than 25 percent of all operations
used any of the marketing labels or claims in the
following table. About one of four operations
(24.5 percent) marketed or advertised
agricultural products as pasture-raised livestock.
Of operations that had chickens and/or other
poultry, about one of six operations
(16.4 percent) marketed or advertised
agricultural products as produced by cage-free
egg layers. Across regions, less than 10 percent
of operations marketed or advertised products as
USDA certified organic, certified humane, or
promoting conservation. A higher percentage of
operations in the West region (20.0 percent)
than in the North Central or South regions
(13.8 and 11.8 percent, respectively) marketed
or advertised products as naturally raised
livestock. The term “naturally raised livestock”
was based on individual producer’s definition
of “natural,” which may vary among different
producers.
USDA APHIS VS / 25
Section I: Characteristics of Small-scale Livestock Operations—B. Marketing
a. Percentage of operations that marketed or advertised agricultural products in the following ways, by region
Percent Operations
Region
North Central Northeast South West
All operations
Marketed/ advertised as. . . Pct.
Std. error Pct.
Std. error Pct.
Std. error Pct.
Std. error Pct.
Std. error
Naturally raised livestock
13.8 (0.7) 14.8 (1.6) 11.8 (0.6) 20.0 (1.4) 13.5 (0.4)
No animal by-products fed
7.9 (0.6) 8.5 (1.2) 3.9 (0.3) 11.8 (1.1) 6.2 (0.3)
USDA certified organic 1.3 (0.2) 1.8 (0.5) 0.8 (0.2) 0.9 (0.3) 1.0 (0.1)
Grass-fed livestock (finished on grass, not feedlot)
12.1 (0.7) 14.9 (1.5) 15.7 (0.6) 19.5 (1.4) 15.0 (0.4)
Pasture-raised livestock (access to pastures)
23.8 (0.9) 22.2 (1.8) 24.8 (0.7) 26.8 (1.6) 24.5 (0.5)
Cage-free egg layers* 17.3 (1.9) 16.9 (2.8) 14.8 (1.5) 19.7 (3.3) 16.4 (1.0)
Certified humane by American Humane Association, Humane Farm Animal Care Program, or Animal Welfare Institute
0.9 (0.2) 1.6 (0.5) 1.1 (0.2) 1.3 (0.4) 1.1 (0.1)
Promoting conservation (e.g., land preservation, Predator Friendly Certification, eco-friendly, etc.)
6.5 (0.5) 8.8 (1.2) 4.5 (0.3) 6.0 (0.8) 5.5 (0.3)
*For the subset of operations that had any chickens and/or other poultry.
26 / Small-scale U.S. Livestock Operations 2011
Section I: Characteristics of Small-scale Livestock Operations—B. Marketing
USDA APHIS VS / 27
Section I: Characteristics of Small-scale Livestock Operations—B. Marketing
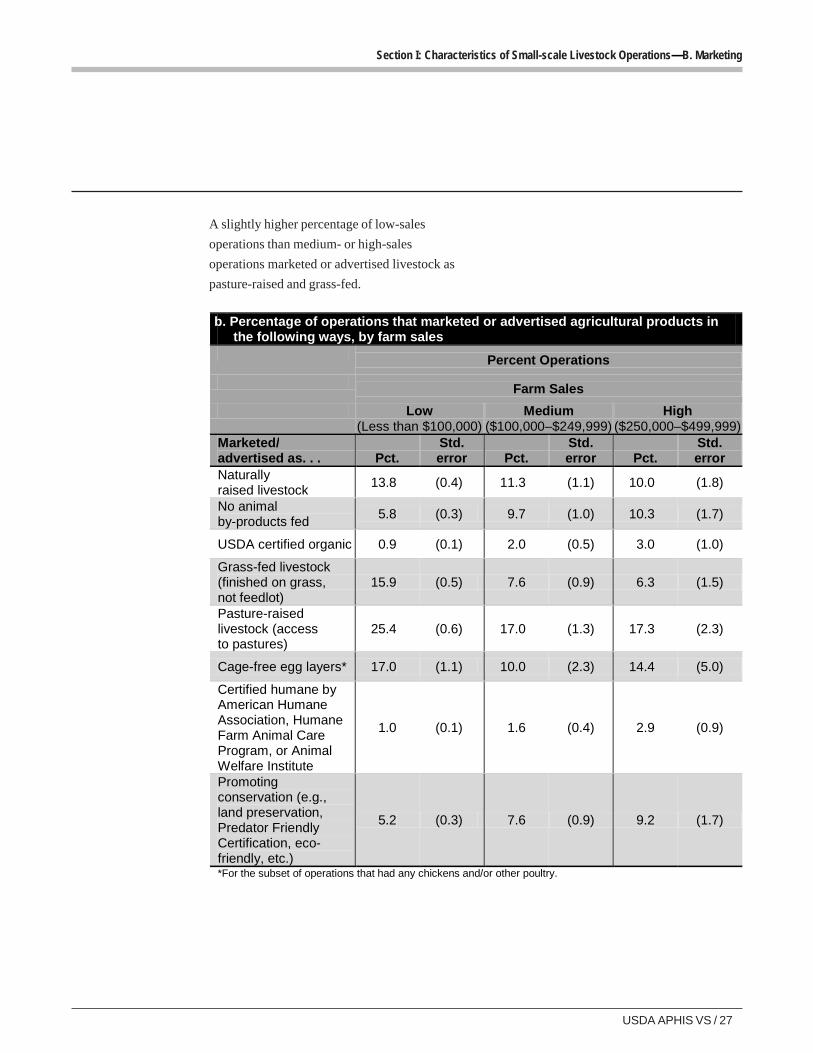
A slightly higher percentage of low-sales
operations than medium- or high-sales
operations marketed or advertised livestock as
pasture-raised and grass-fed.
b. Percentage of operations that marketed or advertised agricultural products in the following ways, by farm sales
Percent Operations
Farm Sales
Low (Less than $100,000)
Medium ($100,000–$249,999)
High ($250,000–$499,999)
Marketed/ advertised as. . . Pct.
Std. error Pct.
Std. error Pct.
Std. error
Naturally raised livestock
13.8 (0.4) 11.3 (1.1) 10.0 (1.8)
No animal by-products fed
5.8 (0.3) 9.7 (1.0) 10.3 (1.7)
USDA certified organic 0.9 (0.1) 2.0 (0.5) 3.0 (1.0)
Grass-fed livestock (finished on grass, not feedlot)
15.9 (0.5) 7.6 (0.9) 6.3 (1.5)
Pasture-raised livestock (access to pastures)
25.4 (0.6) 17.0 (1.3) 17.3 (2.3)
Cage-free egg layers* 17.0 (1.1) 10.0 (2.3) 14.4 (5.0)
Certified humane by American Humane Association, Humane Farm Animal Care Program, or Animal Welfare Institute
1.0 (0.1) 1.6 (0.4) 2.9 (0.9)
Promoting conservation (e.g., land preservation, Predator Friendly Certification, eco-friendly, etc.)
5.2 (0.3) 7.6 (0.9) 9.2 (1.7)
*For the subset of operations that had any chickens and/or other poultry.
28 / Small-scale U.S. Livestock Operations 2011
Section I: Characteristics of Small-scale Livestock Operations—B. Marketing
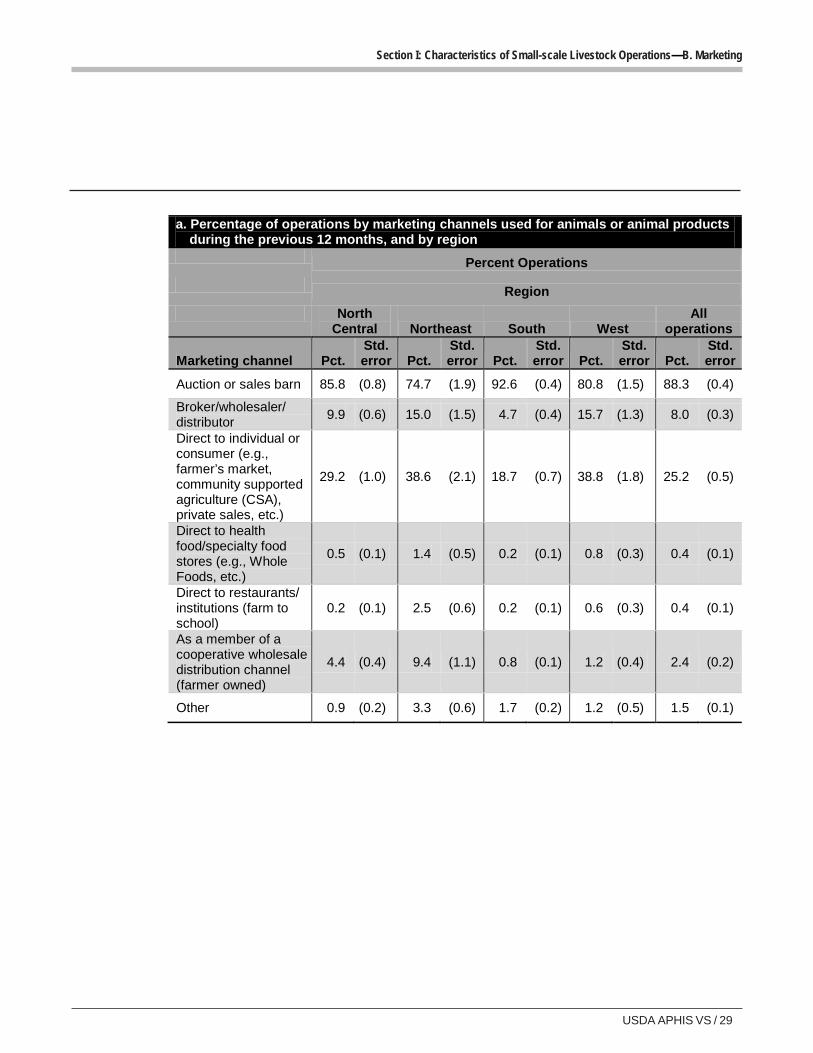
2. Marketingchannels
Small-scale operations used a variety of
channels for marketing animals and animal
products. Overall, almost 9 of 10 operations
(88.3 percent) marketed at least some animals
through an auction or sales barn during the
previous 12 months. This high percentage is
likely related to the high percentage of
operations with beef cattle, since calves from
cow-calf beef operations are commonly
marketed via auction. Culled cows from dairy
operations are also frequently marketed through
auctions.
About one of four operations (25.2 percent)
marketed animals or animal products directly to
individuals or consumers in the previous
12 months. These sales include, but are not
limited to, direct sales to consumers through
farmer’s markets or CSAs, Internet sales direct
to consumers, and sales of live animals to other
producers for breeding or other purposes.
A small percentage of operations marketed any
animals or animal products directly to
restaurants/institutions, directly to health food
stores, or through a farmer-owned cooperative
wholesale distribution channel (0.4, 0.4, and
2.4 percent of operations, respectively). The
Northeast region had the highest percentage of
operations that marketed as a member of a
cooperative distribution channel. This finding
might be related to the high percentage of
operations with dairy cattle in the Northeast
region (see Table A.1.a.), since dairy producers
often use cooperative distribution channels to
sell milk.
It appears that some dairy operations
inadvertently excluded the marketing channels
they used for milk and reported marketing
channels used for animals only. Data inspection
revealed that 6.6 percent of all operations and
32.4 percent of operations in the Northeast
region had 10 or more dairy cattle during the
previous 12 months. Of these operations with 10
or more dairy cattle, 41.3 percent reported only
marketing through an auction or sales barn
during the previous 12 months. Therefore, the
percentage of operations that used direct
marketing, marketed products as a member of a
cooperative distribution channel, or marketed
through a wholesaler/distributor might be higher
than reported in the following table, particularly
for the Northeast region.
“Other” marketing channels were mostly
contract arrangements for vertically integrated
poultry or swine operations.
USDA APHIS VS / 29
Section I: Characteristics of Small-scale Livestock Operations—B. Marketing
a. Percentage of operations by marketing channels used for animals or animal products during the previous 12 months, and by region
Percent Operations
Region
North Central Northeast South West
All operations
Marketing channel Pct. Std. error Pct.
Std. error Pct.
Std. error Pct.
Std. error Pct.
Std. error
Auction or sales barn 85.8 (0.8) 74.7 (1.9) 92.6 (0.4) 80.8 (1.5) 88.3 (0.4)
Broker/wholesaler/ distributor
9.9 (0.6) 15.0 (1.5) 4.7 (0.4) 15.7 (1.3) 8.0 (0.3)
Direct to individual or consumer (e.g., farmer’s market, community supported agriculture (CSA), private sales, etc.)
29.2 (1.0) 38.6 (2.1) 18.7 (0.7) 38.8 (1.8) 25.2 (0.5)
Direct to health food/specialty food stores (e.g., Whole Foods, etc.)
0.5 (0.1) 1.4 (0.5) 0.2 (0.1) 0.8 (0.3) 0.4 (0.1)
Direct to restaurants/ institutions (farm to school)
0.2 (0.1) 2.5 (0.6) 0.2 (0.1) 0.6 (0.3) 0.4 (0.1)
As a member of a cooperative wholesale distribution channel (farmer owned)
4.4 (0.4) 9.4 (1.1) 0.8 (0.1) 1.2 (0.4) 2.4 (0.2)
Other 0.9 (0.2) 3.3 (0.6) 1.7 (0.2) 1.2 (0.5) 1.5 (0.1)
30 / Small-scale U.S. Livestock Operations 2011
Section I: Characteristics of Small-scale Livestock Operations—B. Marketing
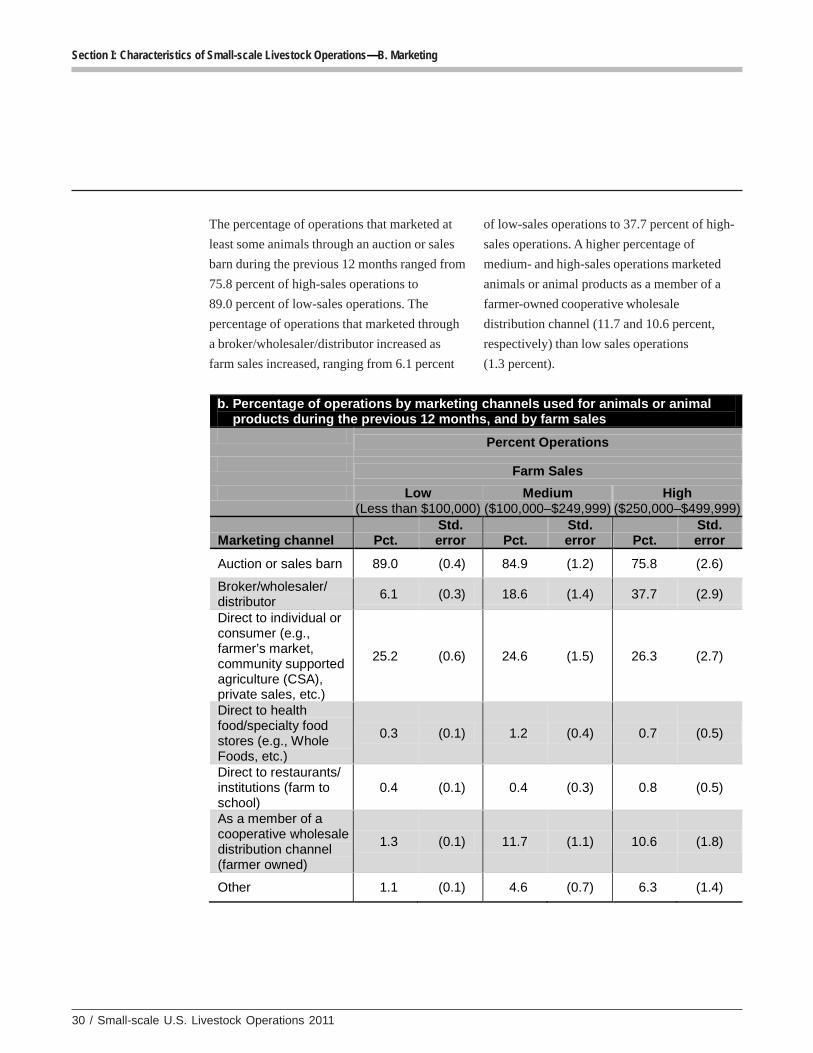
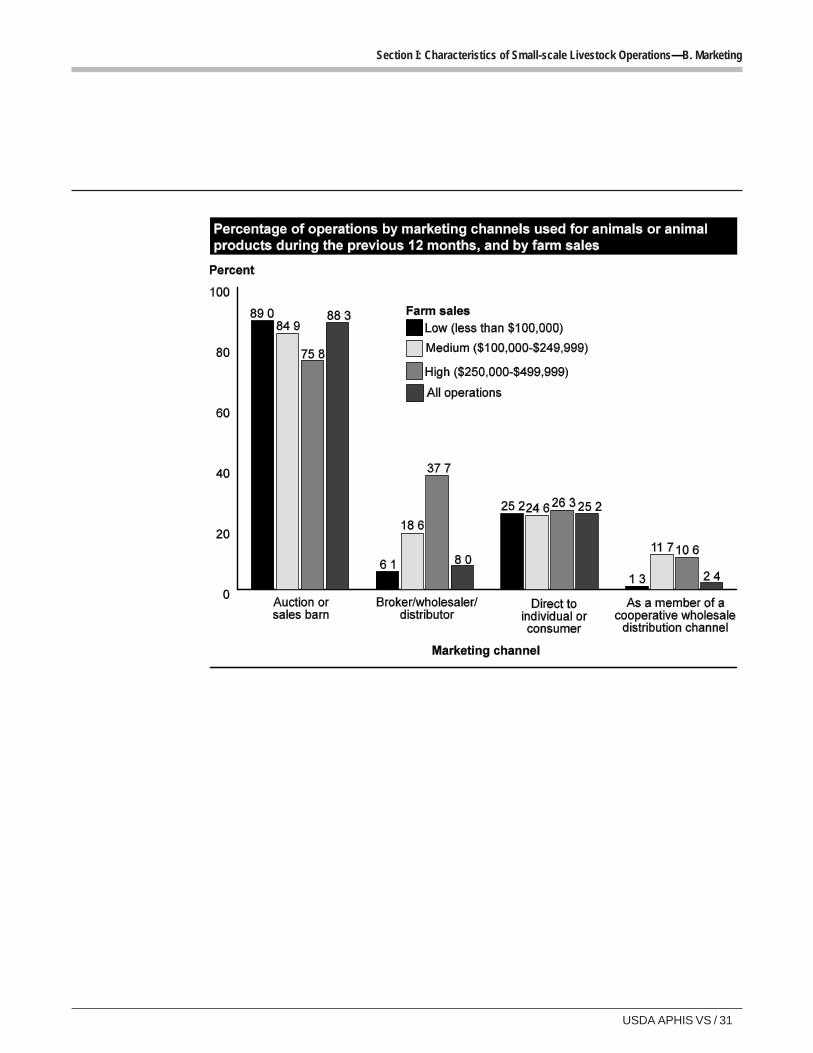
The percentage of operations that marketed at
least some animals through an auction or sales
barn during the previous 12 months ranged from
75.8 percent of high-sales operations to
89.0 percent of low-sales operations. The
percentage of operations that marketed through
a broker/wholesaler/distributor increased as
farm sales increased, ranging from 6.1 percent
of low-sales operations to 37.7 percent of high-
sales operations. A higher percentage of
medium- and high-sales operations marketed
animals or animal products as a member of a
farmer-owned cooperative wholesale
distribution channel (11.7 and 10.6 percent,
respectively) than low sales operations
(1.3 percent).
b. Percentage of operations by marketing channels used for animals or animal products during the previous 12 months, and by farm sales
Percent Operations
Farm Sales
Low (Less than $100,000)
Medium ($100,000–$249,999)
High ($250,000–$499,999)
Marketing channel Pct. Std. error Pct.
Std. error Pct.
Std. error
Auction or sales barn 89.0 (0.4) 84.9 (1.2) 75.8 (2.6)
Broker/wholesaler/ distributor
6.1 (0.3) 18.6 (1.4) 37.7 (2.9)
Direct to individual or consumer (e.g., farmer’s market, community supported agriculture (CSA), private sales, etc.)
25.2 (0.6) 24.6 (1.5) 26.3 (2.7)
Direct to health food/specialty food stores (e.g., Whole Foods, etc.)
0.3 (0.1) 1.2 (0.4) 0.7 (0.5)
Direct to restaurants/ institutions (farm to school)
0.4 (0.1) 0.4 (0.3) 0.8 (0.5)
As a member of a cooperative wholesale distribution channel (farmer owned)
1.3 (0.1) 11.7 (1.1) 10.6 (1.8)
Other 1.1 (0.1) 4.6 (0.7) 6.3 (1.4)
USDA APHIS VS / 31
Section I: Characteristics of Small-scale Livestock Operations—B. Marketing
32 / Small-scale U.S. Livestock Operations 2011
Section I: Characteristics of Small-scale Livestock Operations—B. Marketing
3. Internetmarketing
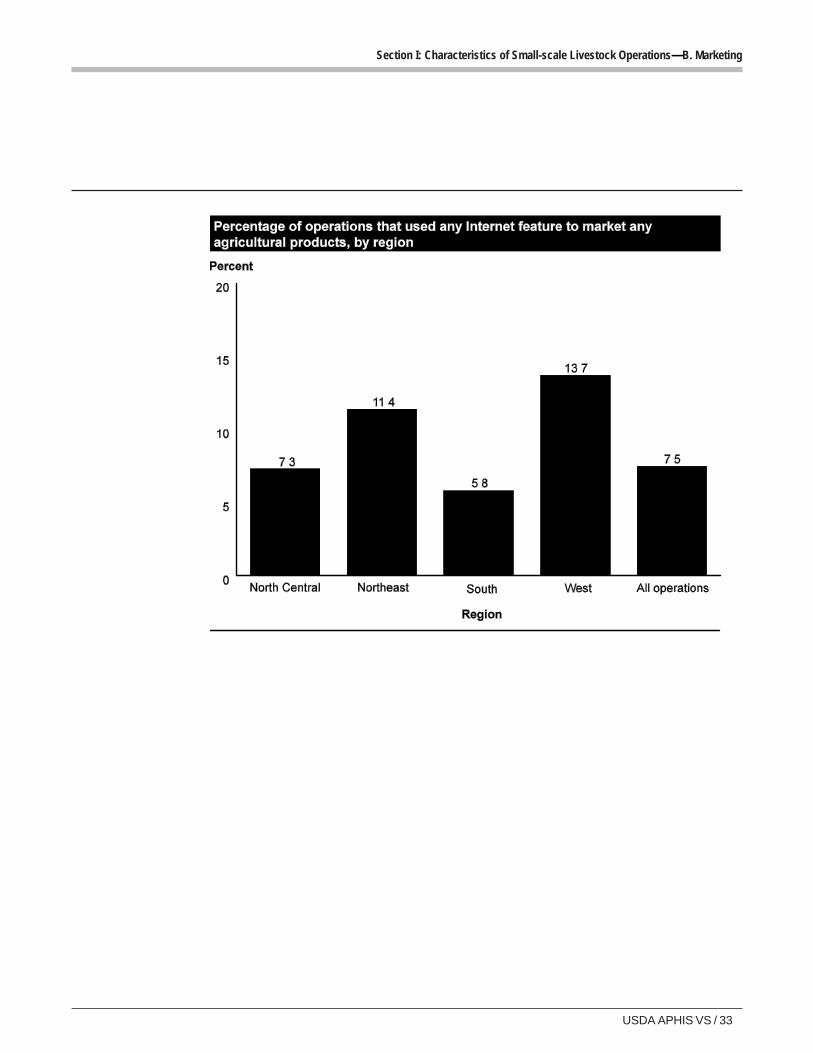
Only a small percentage of all operations
(7.5 percent) used the Internet to market any
agricultural products. The Internet features used
most commonly for marketing agricultural
products were Web sites for farm business (used
by 3.9 percent of operations), email messages
(3.2 percent of operations), and online message
boards or classified sites (i.e., Craigslist)
[2.7 percent of operations]. The most common
“other” Internet feature was online livestock
auctions. A higher percentage of operations in
the Northeast and West regions used the Internet
to market products (11.4 and 13.7 percent,
respectively) compared with operations in the
North Central and South regions (7.3 and
5.8 percent, respectively).
a. Percentage of operations that used the following Internet features to market any agricultural products, by region
Percent Operations
Region
North Central Northeast South West
All operations
Internet feature Pct. Std. error Pct.
Std. error Pct.
Std. error Pct.
Std. error Pct.
Std. error
Web site for farm business
3.7 (0.4) 7.7 (1.1) 3.0 (0.3) 6.3 (0.9) 3.9 (0.2)
Email messages 3.4 (0.4) 5.0 (1.0) 2.4 (0.3) 5.1 (0.8) 3.2 (0.2)
Online farm directory1
1.6 (0.3) 3.6 (0.9) 1.2 (0.2) 2.0 (0.5) 1.6 (0.2)
Facebook 1.0 (0.2) 2.0 (0.6) 1.1 (0.2) 2.5 (0.6) 1.3 (0.1)
Online message board (Craigslist, etc.)2
2.9 (0.4) 1.6 (0.5) 2.3 (0.3) 5.2 (0.8) 2.7 (0.2)
Other 0.3 (0.1) 0.9 (0.4) 0.4 (0.1) 1.7 (0.4) 0.5 (0.1)
Any 7.3 (0.6) 11.4 (1.3) 5.8 (0.4) 13.7 (1.2) 7.5 (0.3) 1A list of local farms on a Web site.
2Includes classified Web sites.
USDA APHIS VS / 33
Section I: Characteristics of Small-scale Livestock Operations—B. Marketing
34 / Small-scale U.S. Livestock Operations 2011
Section I: Characteristics of Small-scale Livestock Operations—B. Marketing
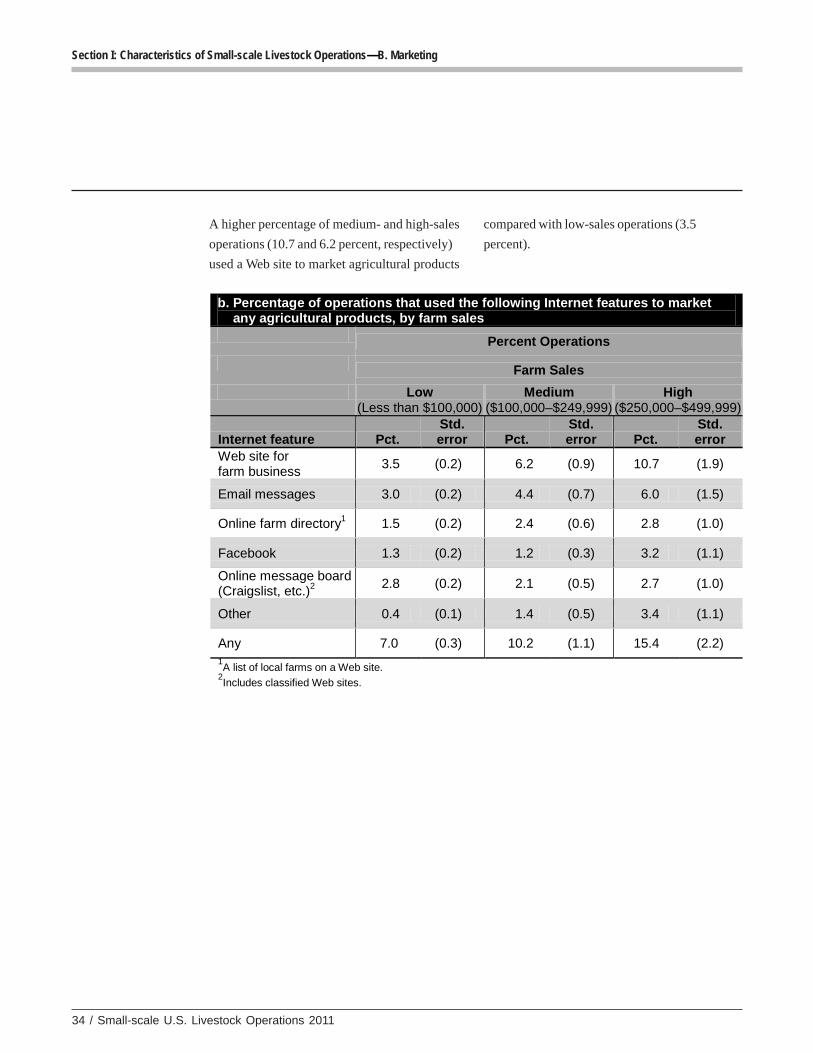
A higher percentage of medium- and high-sales
operations (10.7 and 6.2 percent, respectively)
used a Web site to market agricultural products
compared with low-sales operations (3.5
percent).
b. Percentage of operations that used the following Internet features to market any agricultural products, by farm sales
Percent Operations
Farm Sales
Low (Less than $100,000)
Medium ($100,000–$249,999)
High ($250,000–$499,999)
Internet feature Pct. Std. error Pct.
Std. error Pct.
Std. error
Web site for farm business
3.5 (0.2) 6.2 (0.9) 10.7 (1.9)
Email messages 3.0 (0.2) 4.4 (0.7) 6.0 (1.5)
Online farm directory1 1.5 (0.2) 2.4 (0.6) 2.8 (1.0)
Facebook 1.3 (0.2) 1.2 (0.3) 3.2 (1.1)
Online message board (Craigslist, etc.)2
2.8 (0.2) 2.1 (0.5) 2.7 (1.0)
Other 0.4 (0.1) 1.4 (0.5) 3.4 (1.1)
Any 7.0 (0.3) 10.2 (1.1) 15.4 (2.2) 1A list of local farms on a Web site.
2Includes classified Web sites.
USDA APHIS VS / 35
Section I: Characteristics of Small-scale Livestock Operations—C. Reasons for Farming
C. RC. RC. RC. RC. Reasons feasons feasons feasons feasons for For For For For Farararararmingmingmingmingming
Although income is an important reason for
farming, many small-scale operators consider
other reasons, such as enjoyment of the farming
or ranching lifestyle, to be equally or more
important. For example, the USDA’s
Agricultural Resource Management Study
(ARMS) found that, for certain types of small-
scale farms, “operation provides a rural lifestyle”
was more important to operators as a measure of
success than “operation provides adequate
income” (ERS, 1999a).
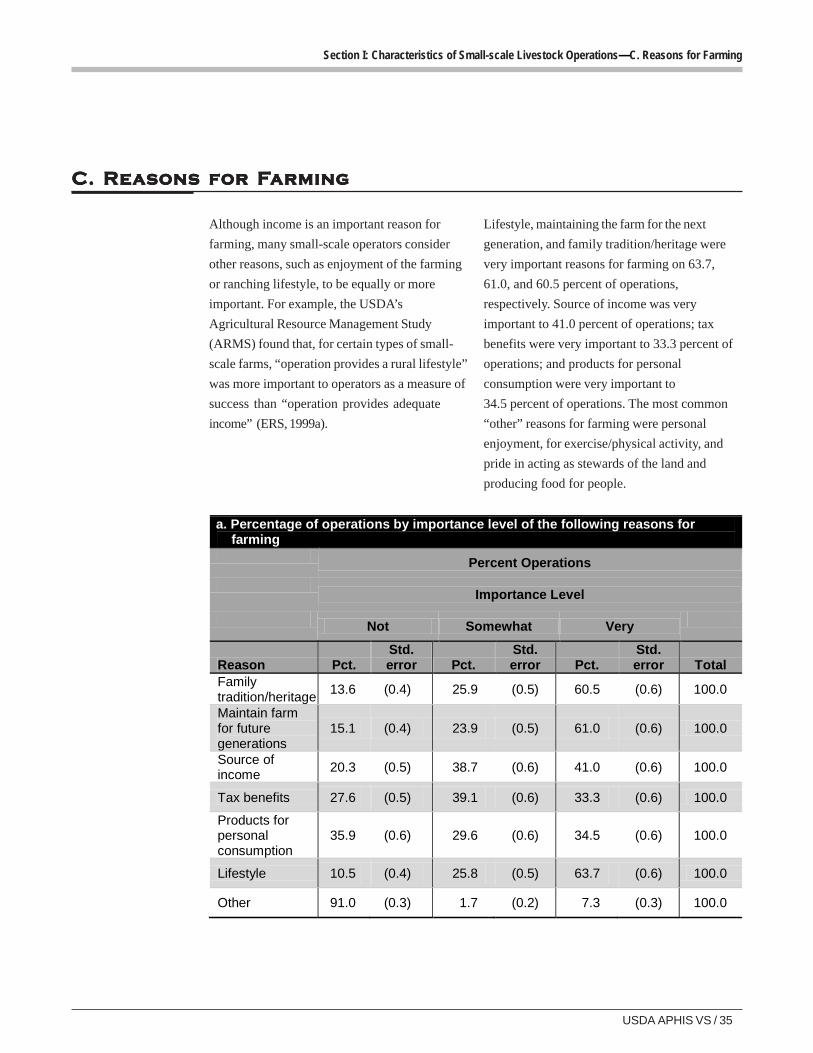
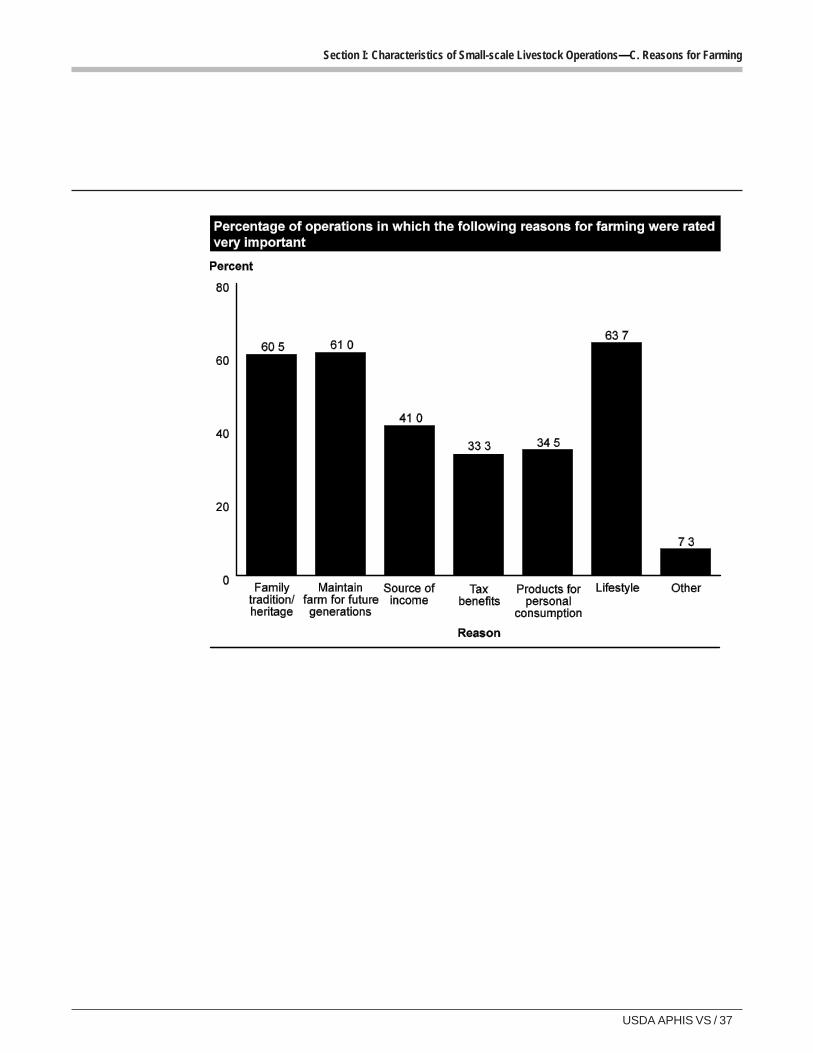
Lifestyle, maintaining the farm for the next
generation, and family tradition/heritage were
very important reasons for farming on 63.7,
61.0, and 60.5 percent of operations,
respectively. Source of income was very
important to 41.0 percent of operations; tax
benefits were very important to 33.3 percent of
operations; and products for personal
consumption were very important to
34.5 percent of operations. The most common
“other” reasons for farming were personal
enjoyment, for exercise/physical activity, and
pride in acting as stewards of the land and
producing food for people.
a. Percentage of operations by importance level of the following reasons for farming
Percent Operations
Importance Level
Not Somewhat Very
Reason Pct. Std. error Pct.
Std. error Pct.
Std. error Total
Family tradition/heritage
13.6 (0.4) 25.9 (0.5) 60.5 (0.6) 100.0
Maintain farm for future generations
15.1 (0.4) 23.9 (0.5) 61.0 (0.6) 100.0
Source of income
20.3 (0.5) 38.7 (0.6) 41.0 (0.6) 100.0
Tax benefits 27.6 (0.5) 39.1 (0.6) 33.3 (0.6) 100.0
Products for personal consumption
35.9 (0.6) 29.6 (0.6) 34.5 (0.6) 100.0
Lifestyle 10.5 (0.4) 25.8 (0.5) 63.7 (0.6) 100.0
Other 91.0 (0.3) 1.7 (0.2) 7.3 (0.3) 100.0
36 / Small-scale U.S. Livestock Operations 2011
Section I: Characteristics of Small-scale Livestock Operations—C. Reasons for Farming
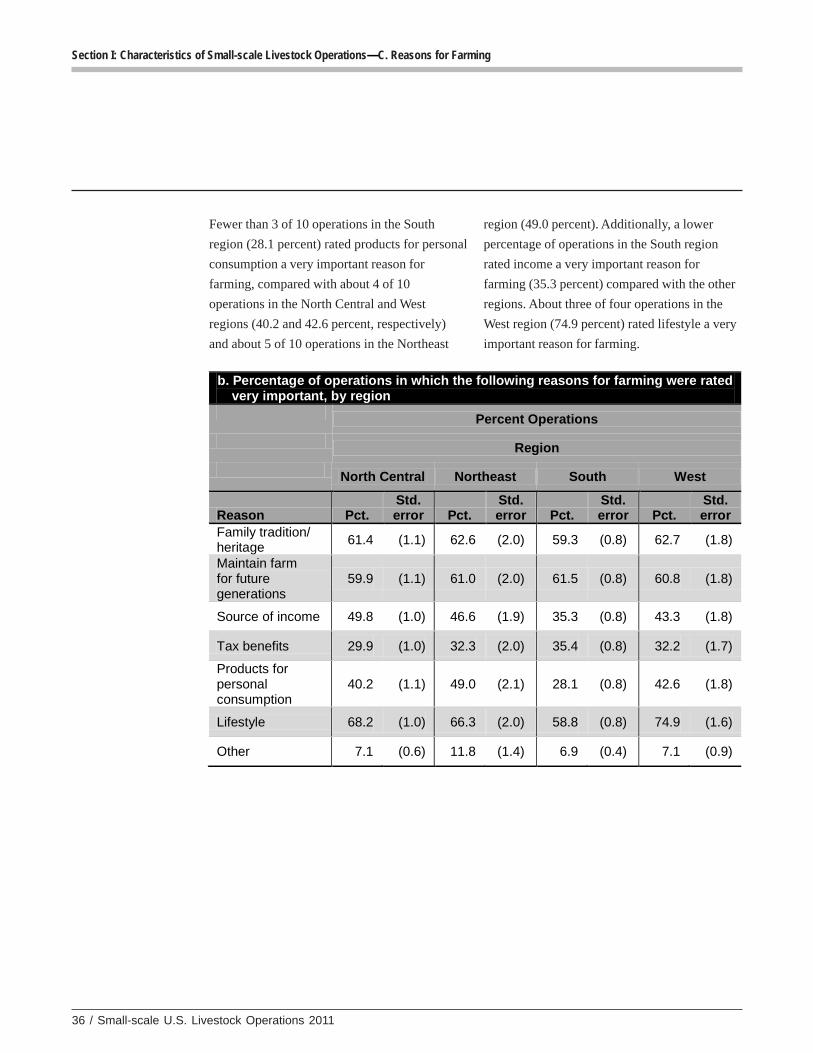
Fewer than 3 of 10 operations in the South
region (28.1 percent) rated products for personal
consumption a very important reason for
farming, compared with about 4 of 10
operations in the North Central and West
regions (40.2 and 42.6 percent, respectively)
and about 5 of 10 operations in the Northeast
region (49.0 percent). Additionally, a lower
percentage of operations in the South region
rated income a very important reason for
farming (35.3 percent) compared with the other
regions. About three of four operations in the
West region (74.9 percent) rated lifestyle a very
important reason for farming.
b. Percentage of operations in which the following reasons for farming were rated very important, by region
Percent Operations
Region
North Central Northeast South West
Reason Pct. Std. error Pct.
Std. error Pct.
Std. error Pct.
Std. error
Family tradition/ heritage
61.4 (1.1) 62.6 (2.0) 59.3 (0.8) 62.7 (1.8)
Maintain farm for future generations
59.9 (1.1) 61.0 (2.0) 61.5 (0.8) 60.8 (1.8)
Source of income 49.8 (1.0) 46.6 (1.9) 35.3 (0.8) 43.3 (1.8)
Tax benefits 29.9 (1.0) 32.3 (2.0) 35.4 (0.8) 32.2 (1.7)
Products for personal consumption
40.2 (1.1) 49.0 (2.1) 28.1 (0.8) 42.6 (1.8)
Lifestyle 68.2 (1.0) 66.3 (2.0) 58.8 (0.8) 74.9 (1.6)
Other 7.1 (0.6) 11.8 (1.4) 6.9 (0.4) 7.1 (0.9)
USDA APHIS VS / 37
Section I: Characteristics of Small-scale Livestock Operations—C. Reasons for Farming
38 / Small-scale U.S. Livestock Operations 2011
Section I: Characteristics of Small-scale Livestock Operations—C. Reasons for Farming
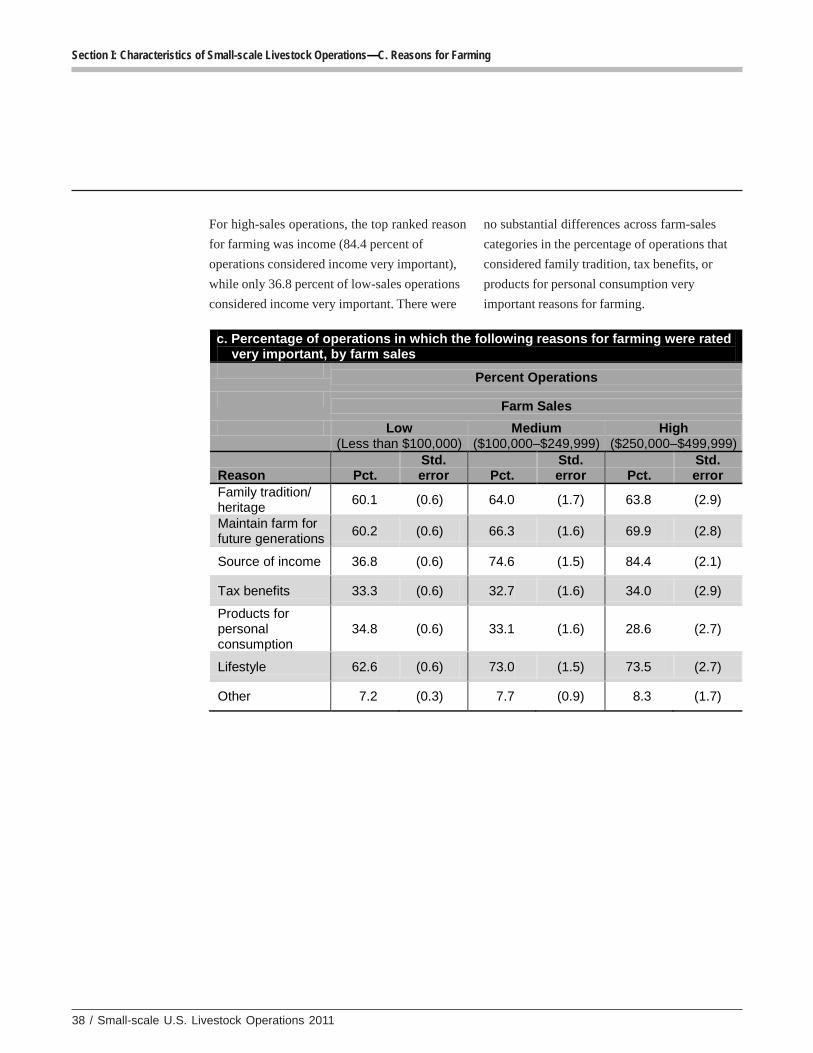
For high-sales operations, the top ranked reason
for farming was income (84.4 percent of
operations considered income very important),
while only 36.8 percent of low-sales operations
considered income very important. There were
no substantial differences across farm-sales
categories in the percentage of operations that
considered family tradition, tax benefits, or
products for personal consumption very
important reasons for farming.
c. Percentage of operations in which the following reasons for farming were rated very important, by farm sales
Percent Operations
Farm Sales
Low (Less than $100,000)
Medium ($100,000–$249,999)
High ($250,000–$499,999)
Reason Pct. Std. error Pct.
Std. error Pct.
Std. error
Family tradition/ heritage
60.1 (0.6) 64.0 (1.7) 63.8 (2.9)
Maintain farm for future generations
60.2 (0.6) 66.3 (1.6) 69.9 (2.8)
Source of income 36.8 (0.6) 74.6 (1.5) 84.4 (2.1)
Tax benefits 33.3 (0.6) 32.7 (1.6) 34.0 (2.9)
Products for personal consumption
34.8 (0.6) 33.1 (1.6) 28.6 (2.7)
Lifestyle 62.6 (0.6) 73.0 (1.5) 73.5 (2.7)
Other 7.2 (0.3) 7.7 (0.9) 8.3 (1.7)
USDA APHIS VS / 39
Section I: Characteristics of Small-scale Livestock Operations—D. Future Plans
D. Future PlansD. Future PlansD. Future PlansD. Future PlansD. Future Plans
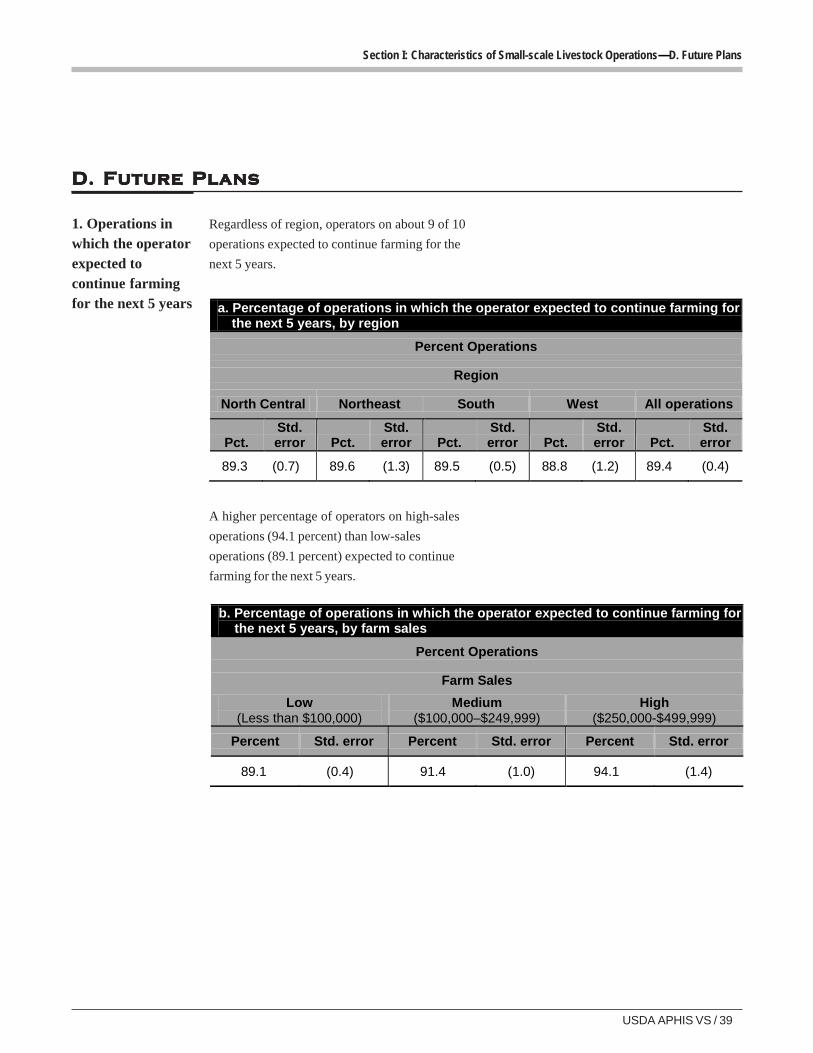
1. Operations inwhich the operatorexpected tocontinue farmingfor the next 5 years
Regardless of region, operators on about 9 of 10
operations expected to continue farming for the
next 5 years.
a. Percentage of operations in which the operator expected to continue farming for the next 5 years, by region
Percent Operations
Region
North Central Northeast South West All operations
Pct. Std. error Pct.
Std. error Pct.
Std. error Pct.
Std. error Pct.
Std. error
89.3 (0.7) 89.6 (1.3) 89.5 (0.5) 88.8 (1.2) 89.4 (0.4)
A higher percentage of operators on high-sales
operations (94.1 percent) than low-sales
operations (89.1 percent) expected to continue
farming for the next 5 years.
b. Percentage of operations in which the operator expected to continue farming for the next 5 years, by farm sales
Percent Operations
Farm Sales
Low (Less than $100,000)
Medium ($100,000–$249,999)
High ($250,000-$499,999)
Percent Std. error Percent Std. error Percent Std. error
89.1 (0.4) 91.4 (1.0) 94.1 (1.4)
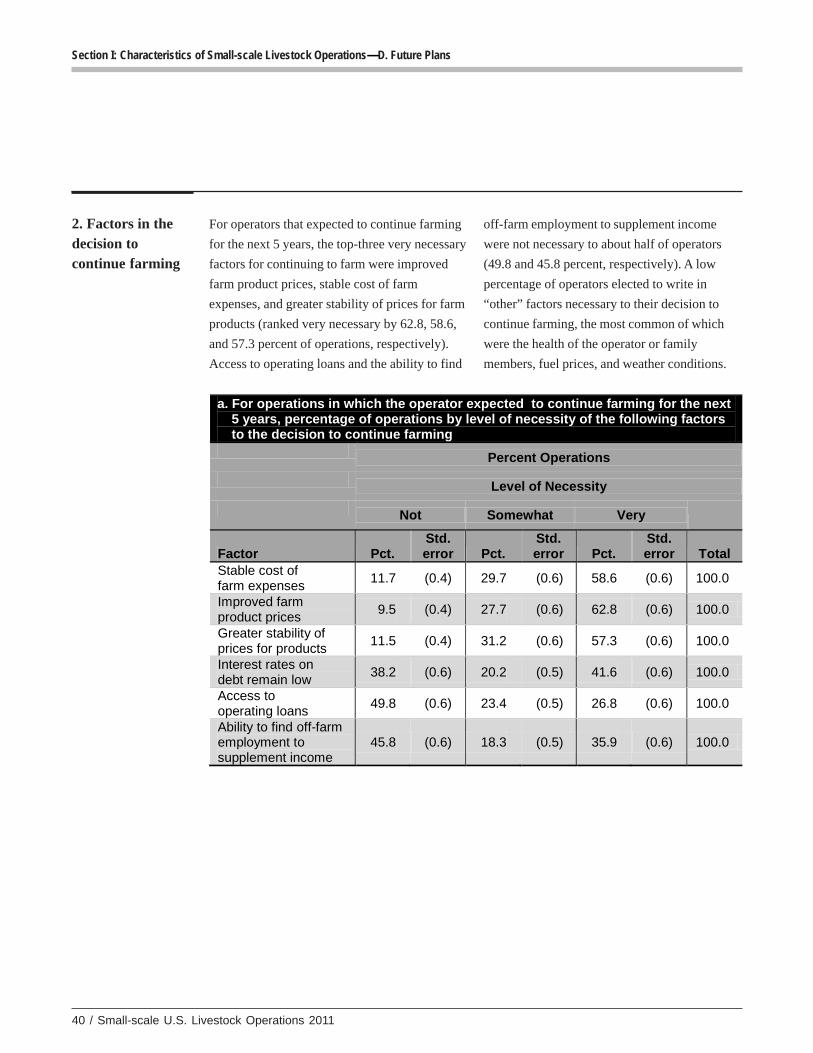
40 / Small-scale U.S. Livestock Operations 2011
Section I: Characteristics of Small-scale Livestock Operations—D. Future Plans
2. Factors in thedecision tocontinue farming
For operators that expected to continue farming
for the next 5 years, the top-three very necessary
factors for continuing to farm were improved
farm product prices, stable cost of farm
expenses, and greater stability of prices for farm
products (ranked very necessary by 62.8, 58.6,
and 57.3 percent of operations, respectively).
Access to operating loans and the ability to find
off-farm employment to supplement income
were not necessary to about half of operators
(49.8 and 45.8 percent, respectively). A low
percentage of operators elected to write in
“other” factors necessary to their decision to
continue farming, the most common of which
were the health of the operator or family
members, fuel prices, and weather conditions.
a. For operations in which the operator expected to continue farming for the next 5 years, percentage of operations by level of necessity of the following factors to the decision to continue farming
Percent Operations
Level of Necessity
Not Somewhat Very
Factor Pct. Std. error Pct.
Std. error Pct.
Std. error Total
Stable cost of farm expenses
11.7 (0.4) 29.7 (0.6) 58.6 (0.6) 100.0
Improved farm product prices
9.5 (0.4) 27.7 (0.6) 62.8 (0.6) 100.0
Greater stability of prices for products
11.5 (0.4) 31.2 (0.6) 57.3 (0.6) 100.0
Interest rates on debt remain low
38.2 (0.6) 20.2 (0.5) 41.6 (0.6) 100.0
Access to operating loans
49.8 (0.6) 23.4 (0.5) 26.8 (0.6) 100.0
Ability to find off-farm employment to supplement income
45.8 (0.6) 18.3 (0.5) 35.9 (0.6) 100.0
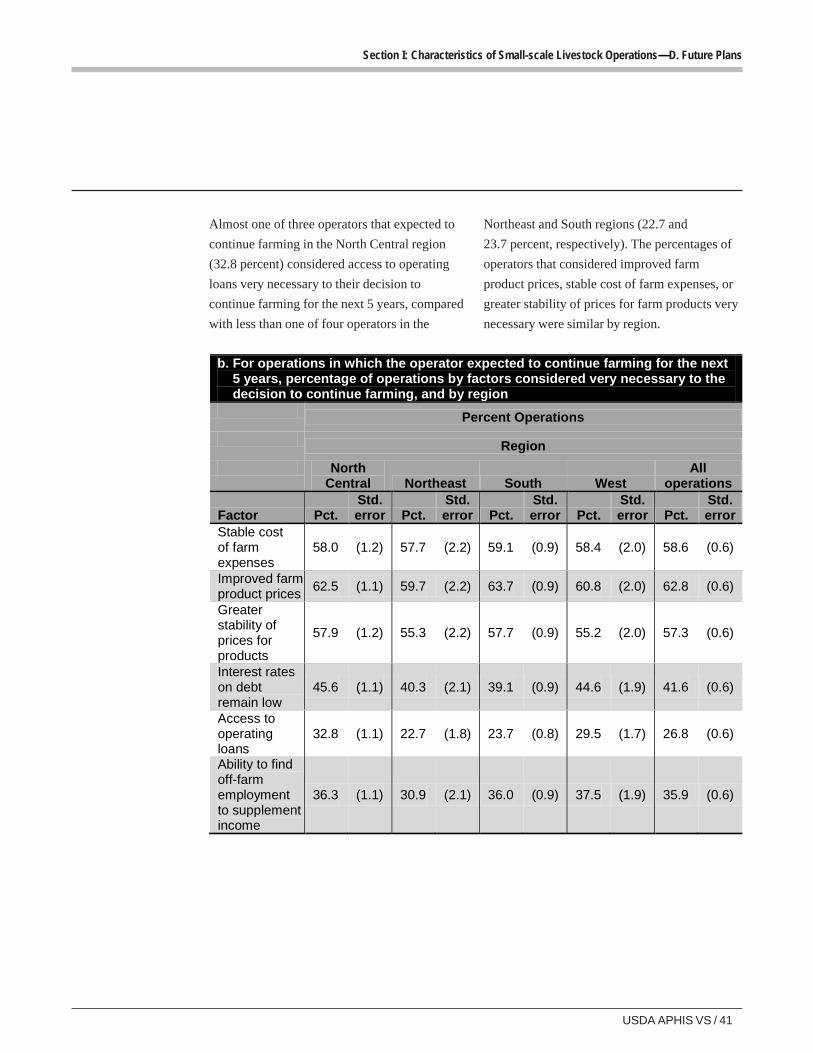
USDA APHIS VS / 41
Section I: Characteristics of Small-scale Livestock Operations—D. Future Plans
Almost one of three operators that expected to
continue farming in the North Central region
(32.8 percent) considered access to operating
loans very necessary to their decision to
continue farming for the next 5 years, compared
with less than one of four operators in the
Northeast and South regions (22.7 and
23.7 percent, respectively). The percentages of
operators that considered improved farm
product prices, stable cost of farm expenses, or
greater stability of prices for farm products very
necessary were similar by region.
b. For operations in which the operator expected to continue farming for the next 5 years, percentage of operations by factors considered very necessary to the decision to continue farming, and by region
Percent Operations
Region
North Central Northeast South West
All operations
Factor Pct. Std. error Pct.
Std. error Pct.
Std. error Pct.
Std. error Pct.
Std. error
Stable cost of farm expenses
58.0 (1.2) 57.7 (2.2) 59.1 (0.9) 58.4 (2.0) 58.6 (0.6)
Improved farm product prices
62.5 (1.1) 59.7 (2.2) 63.7 (0.9) 60.8 (2.0) 62.8 (0.6)
Greater stability of prices for products
57.9 (1.2) 55.3 (2.2) 57.7 (0.9) 55.2 (2.0) 57.3 (0.6)
Interest rates on debt remain low
45.6 (1.1) 40.3 (2.1) 39.1 (0.9) 44.6 (1.9) 41.6 (0.6)
Access to operating loans
32.8 (1.1) 22.7 (1.8) 23.7 (0.8) 29.5 (1.7) 26.8 (0.6)
Ability to find off-farm employment to supplement income
36.3 (1.1) 30.9 (2.1) 36.0 (0.9) 37.5 (1.9) 35.9 (0.6)
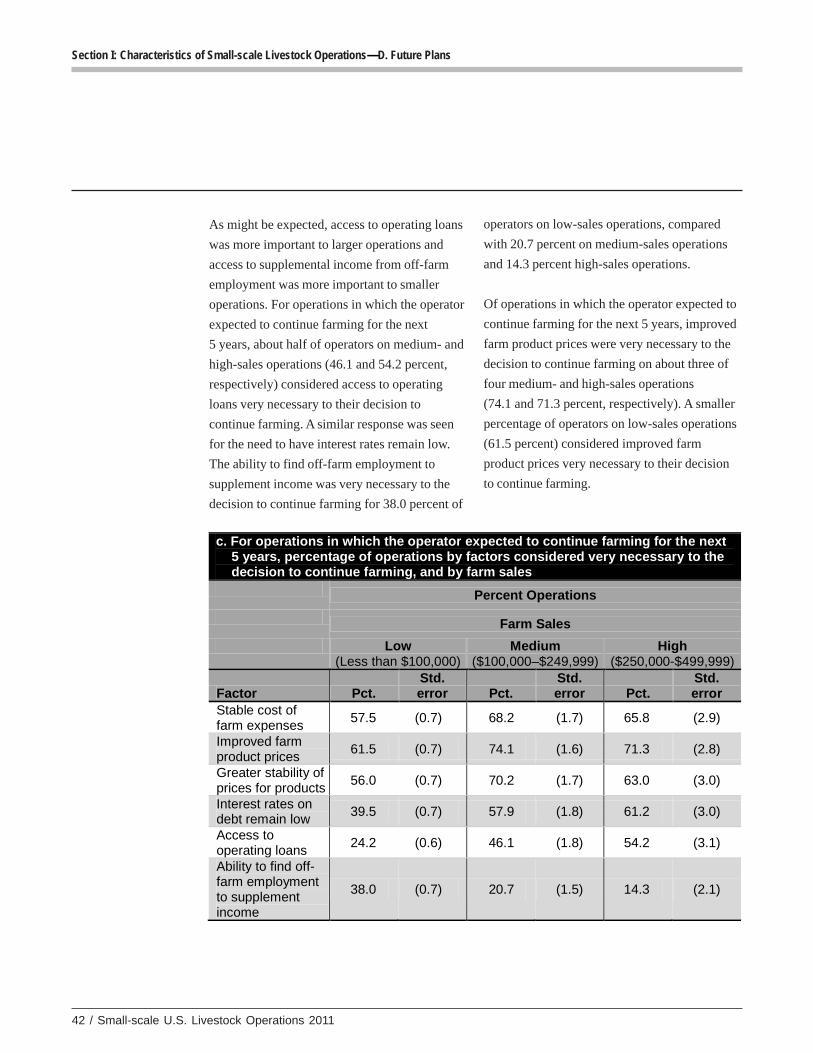
42 / Small-scale U.S. Livestock Operations 2011
Section I: Characteristics of Small-scale Livestock Operations—D. Future Plans
As might be expected, access to operating loans
was more important to larger operations and
access to supplemental income from off-farm
employment was more important to smaller
operations. For operations in which the operator
expected to continue farming for the next
5 years, about half of operators on medium- and
high-sales operations (46.1 and 54.2 percent,
respectively) considered access to operating
loans very necessary to their decision to
continue farming. A similar response was seen
for the need to have interest rates remain low.
The ability to find off-farm employment to
supplement income was very necessary to the
decision to continue farming for 38.0 percent of
operators on low-sales operations, compared
with 20.7 percent on medium-sales operations
and 14.3 percent high-sales operations.
Of operations in which the operator expected to
continue farming for the next 5 years, improved
farm product prices were very necessary to the
decision to continue farming on about three of
four medium- and high-sales operations
(74.1 and 71.3 percent, respectively). A smaller
percentage of operators on low-sales operations
(61.5 percent) considered improved farm
product prices very necessary to their decision
to continue farming.
c. For operations in which the operator expected to continue farming for the next 5 years, percentage of operations by factors considered very necessary to the decision to continue farming, and by farm sales
Percent Operations
Farm Sales
Low (Less than $100,000)
Medium ($100,000–$249,999)
High ($250,000-$499,999)
Factor Pct. Std. error Pct.
Std. error Pct.
Std. error
Stable cost of farm expenses
57.5 (0.7) 68.2 (1.7) 65.8 (2.9)
Improved farm product prices
61.5 (0.7) 74.1 (1.6) 71.3 (2.8)
Greater stability of prices for products
56.0 (0.7) 70.2 (1.7) 63.0 (3.0)
Interest rates on debt remain low
39.5 (0.7) 57.9 (1.8) 61.2 (3.0)
Access to operating loans
24.2 (0.6) 46.1 (1.8) 54.2 (3.1)
Ability to find off-farm employment to supplement income
38.0 (0.7) 20.7 (1.5) 14.3 (2.1)
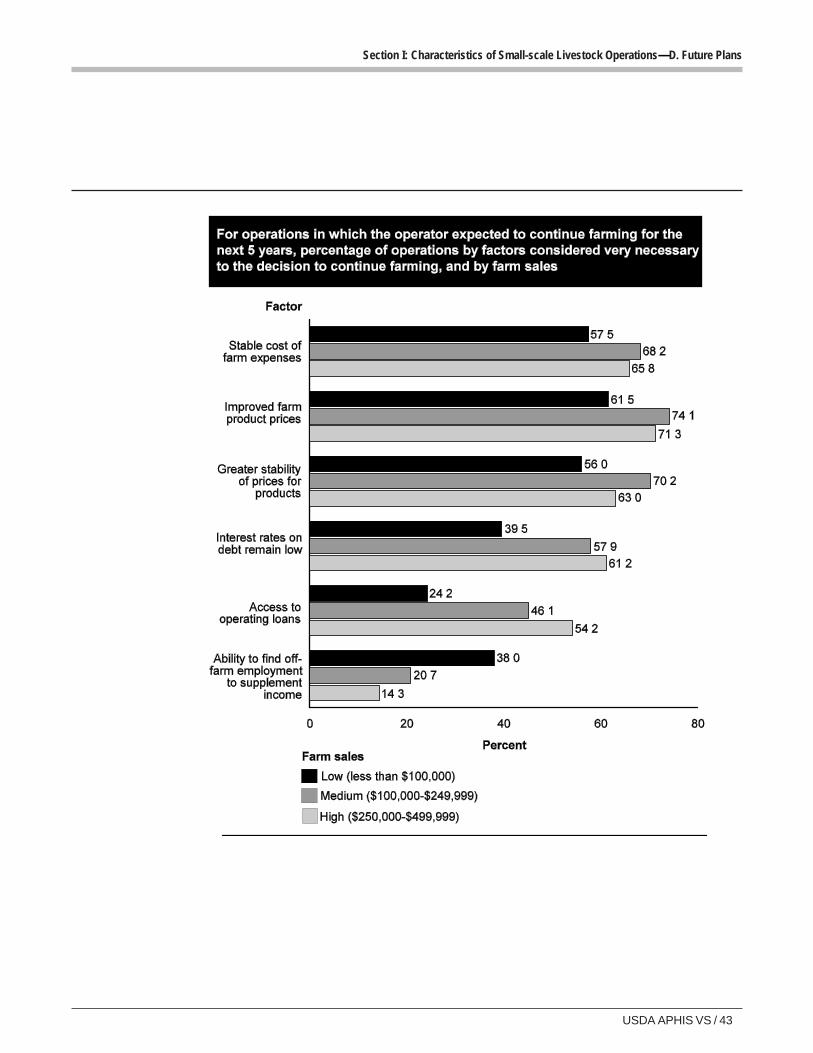
USDA APHIS VS / 43
Section I: Characteristics of Small-scale Livestock Operations—D. Future Plans
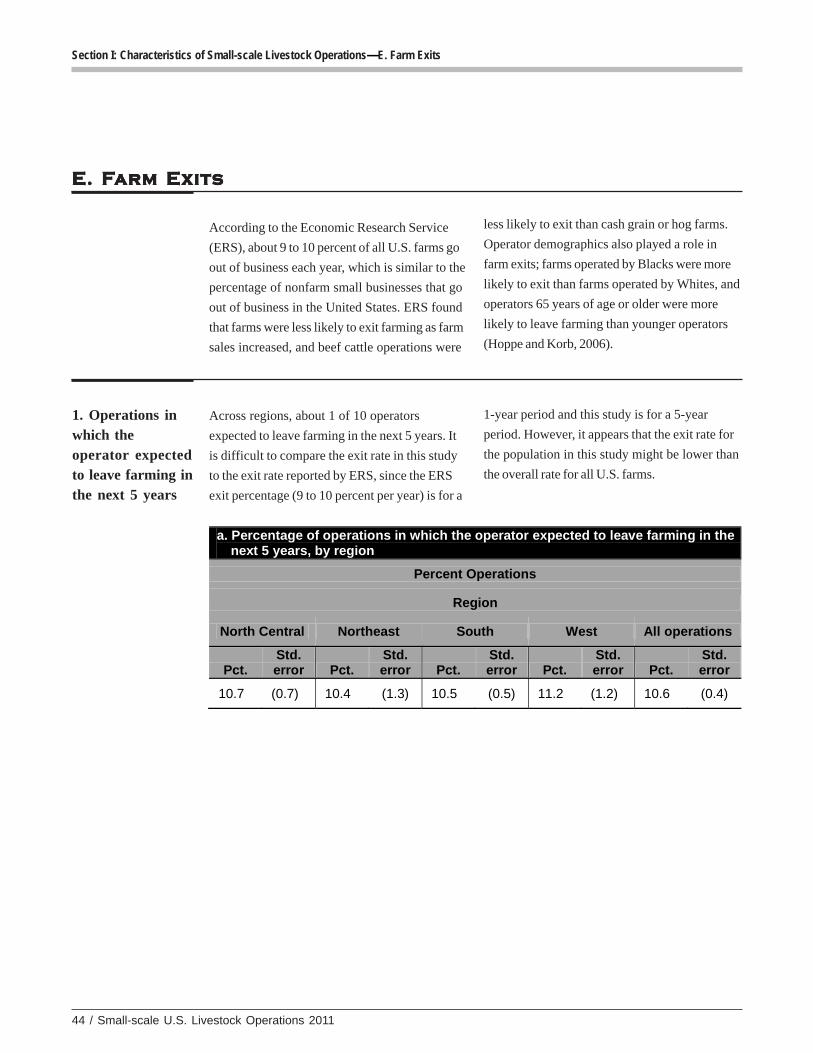
44 / Small-scale U.S. Livestock Operations 2011
Section I: Characteristics of Small-scale Livestock Operations—E. Farm Exits
E. FE. FE. FE. FE. Farararararm Exitsm Exitsm Exitsm Exitsm Exits
According to the Economic Research Service
(ERS), about 9 to 10 percent of all U.S. farms go
out of business each year, which is similar to the
percentage of nonfarm small businesses that go
out of business in the United States. ERS found
that farms were less likely to exit farming as farm
sales increased, and beef cattle operations were
less likely to exit than cash grain or hog farms.
Operator demographics also played a role in
farm exits; farms operated by Blacks were more
likely to exit than farms operated by Whites, and
operators 65 years of age or older were more
likely to leave farming than younger operators
(Hoppe and Korb, 2006).
1. Operations inwhich theoperator expectedto leave farming inthe next 5 years
Across regions, about 1 of 10 operators
expected to leave farming in the next 5 years. It
is difficult to compare the exit rate in this study
to the exit rate reported by ERS, since the ERS
exit percentage (9 to 10 percent per year) is for a
1-year period and this study is for a 5-year
period. However, it appears that the exit rate for
the population in this study might be lower than
the overall rate for all U.S. farms.
a. Percentage of operations in which the operator expected to leave farming in the next 5 years, by region
Percent Operations
Region
North Central Northeast South West All operations
Pct. Std. error Pct.
Std. error Pct.
Std. error Pct.
Std. error Pct.
Std. error
10.7 (0.7) 10.4 (1.3) 10.5 (0.5) 11.2 (1.2) 10.6 (0.4)
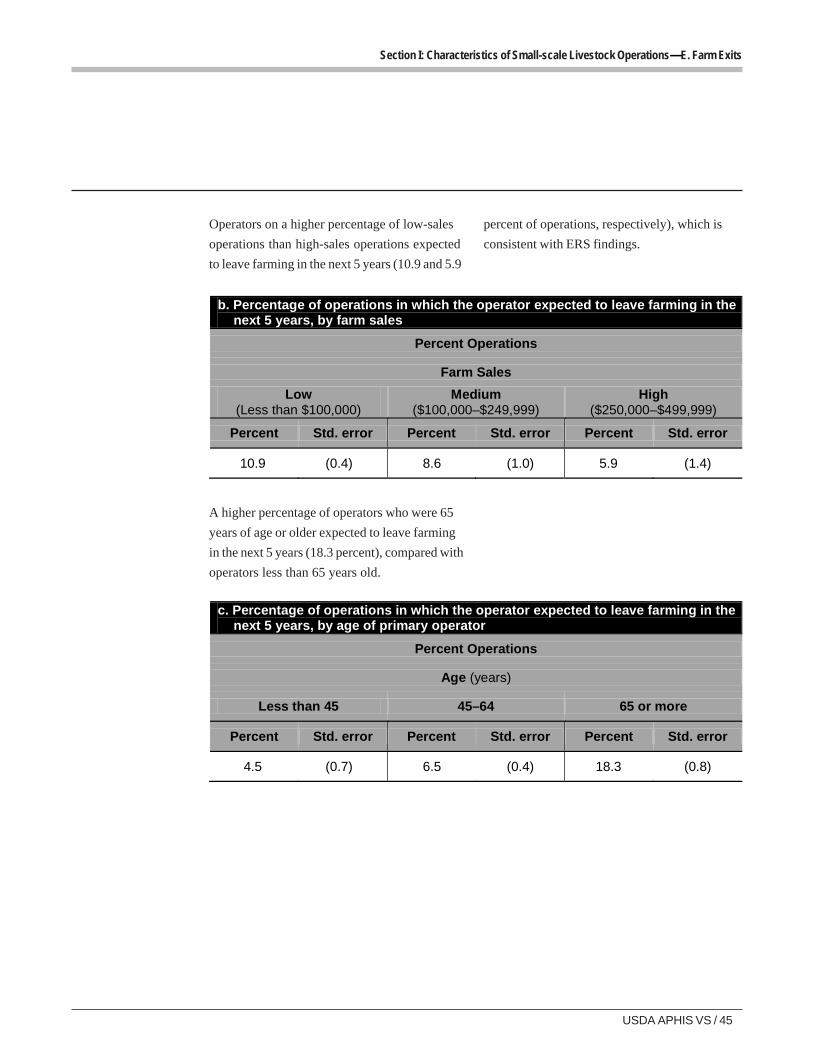
USDA APHIS VS / 45
Section I: Characteristics of Small-scale Livestock Operations—E. Farm Exits
Operators on a higher percentage of low-sales
operations than high-sales operations expected
to leave farming in the next 5 years (10.9 and 5.9
percent of operations, respectively), which is
consistent with ERS findings.
b. Percentage of operations in which the operator expected to leave farming in the next 5 years, by farm sales
Percent Operations
Farm Sales
Low (Less than $100,000)
Medium ($100,000–$249,999)
High ($250,000–$499,999)
Percent Std. error Percent Std. error Percent Std. error
10.9 (0.4) 8.6 (1.0) 5.9 (1.4)
A higher percentage of operators who were 65
years of age or older expected to leave farming
in the next 5 years (18.3 percent), compared with
operators less than 65 years old.
c. Percentage of operations in which the operator expected to leave farming in the next 5 years, by age of primary operator
Percent Operations
Age (years)
Less than 45 45–64 65 or more
Percent Std. error Percent Std. error Percent Std. error
4.5 (0.7) 6.5 (0.4) 18.3 (0.8)
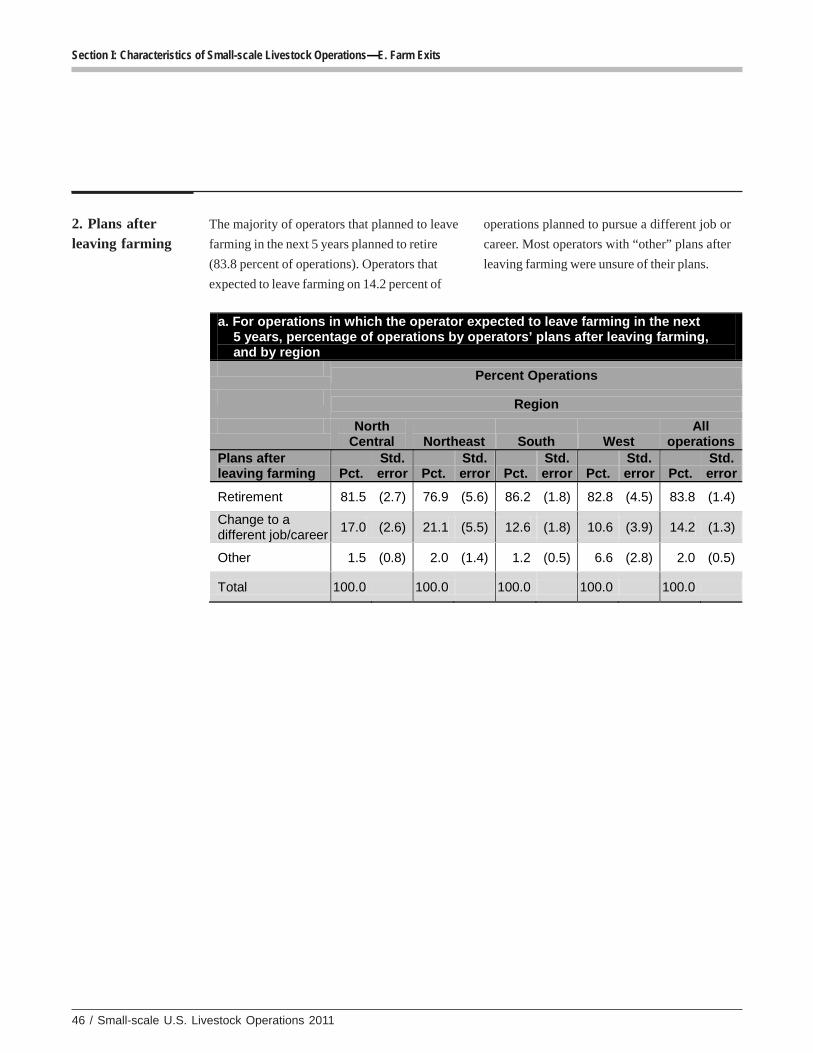
46 / Small-scale U.S. Livestock Operations 2011
Section I: Characteristics of Small-scale Livestock Operations—E. Farm Exits
2. Plans afterleaving farming
The majority of operators that planned to leave
farming in the next 5 years planned to retire
(83.8 percent of operations). Operators that
expected to leave farming on 14.2 percent of
operations planned to pursue a different job or
career. Most operators with “other” plans after
leaving farming were unsure of their plans.
a. For operations in which the operator expected to leave farming in the next 5 years, percentage of operations by operators’ plans after leaving farming, and by region
Percent Operations
Region
North Central Northeast South West
All operations
Plans after leaving farming Pct.
Std. error Pct.
Std. error Pct.
Std. error Pct.
Std. error Pct.
Std. error
Retirement 81.5 (2.7) 76.9 (5.6) 86.2 (1.8) 82.8 (4.5) 83.8 (1.4)
Change to a different job/career
17.0 (2.6) 21.1 (5.5) 12.6 (1.8) 10.6 (3.9) 14.2 (1.3)
Other 1.5 (0.8) 2.0 (1.4) 1.2 (0.5) 6.6 (2.8) 2.0 (0.5)
Total 100.0 100.0 100.0 100.0 100.0
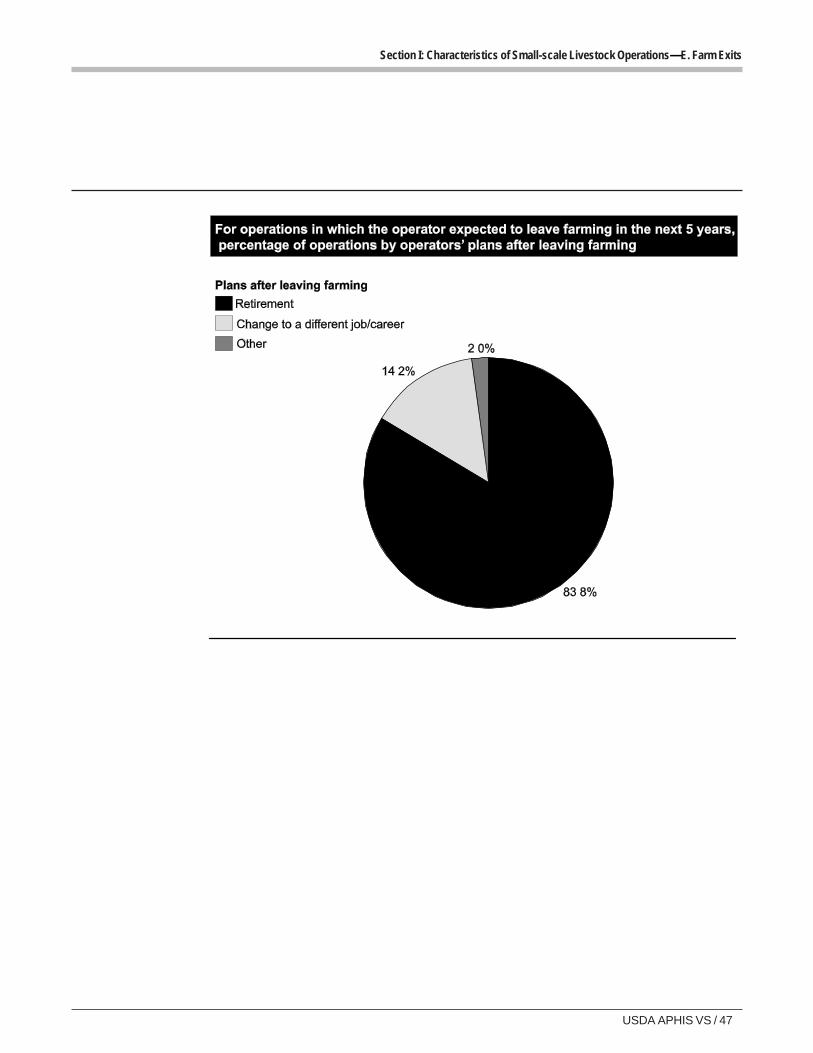
USDA APHIS VS / 47
Section I: Characteristics of Small-scale Livestock Operations—E. Farm Exits
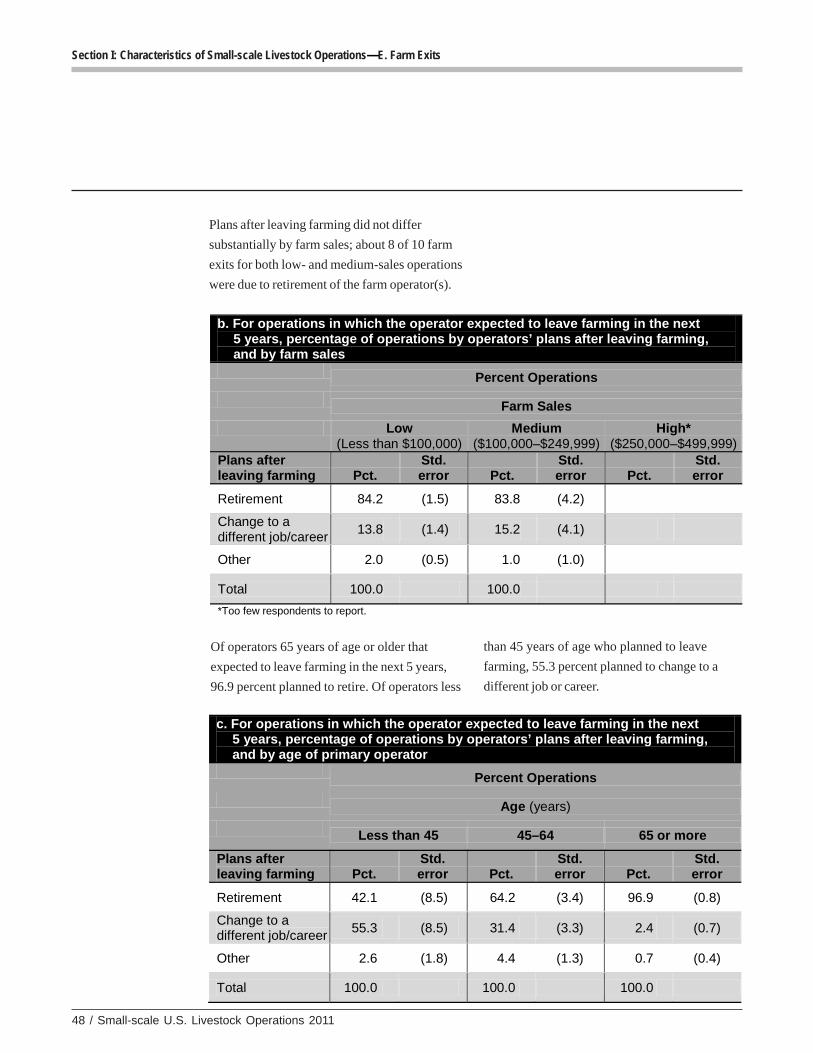
48 / Small-scale U.S. Livestock Operations 2011
Section I: Characteristics of Small-scale Livestock Operations—E. Farm Exits
Plans after leaving farming did not differ
substantially by farm sales; about 8 of 10 farm
exits for both low- and medium-sales operations
were due to retirement of the farm operator(s).
Of operators 65 years of age or older that
expected to leave farming in the next 5 years,
96.9 percent planned to retire. Of operators less
than 45 years of age who planned to leave
farming, 55.3 percent planned to change to a
different job or career.
b. For operations in which the operator expected to leave farming in the next 5 years, percentage of operations by operators’ plans after leaving farming, and by farm sales
Percent Operations
Farm Sales
Low (Less than $100,000)
Medium ($100,000–$249,999)
High* ($250,000–$499,999)
Plans after leaving farming Pct.
Std. error Pct.
Std. error Pct.
Std. error
Retirement 84.2 (1.5) 83.8 (4.2)
Change to a different job/career
13.8 (1.4) 15.2 (4.1)
Other 2.0 (0.5) 1.0 (1.0)
Total 100.0 100.0
*Too few respondents to report.
c. For operations in which the operator expected to leave farming in the next 5 years, percentage of operations by operators’ plans after leaving farming, and by age of primary operator
Percent Operations
Age (years)
Less than 45 45–64 65 or more
Plans after leaving farming Pct.
Std. error Pct.
Std. error Pct.
Std. error
Retirement 42.1 (8.5) 64.2 (3.4) 96.9 (0.8)
Change to a different job/career
55.3 (8.5) 31.4 (3.3) 2.4 (0.7)
Other 2.6 (1.8) 4.4 (1.3) 0.7 (0.4)
Total 100.0 100.0 100.0
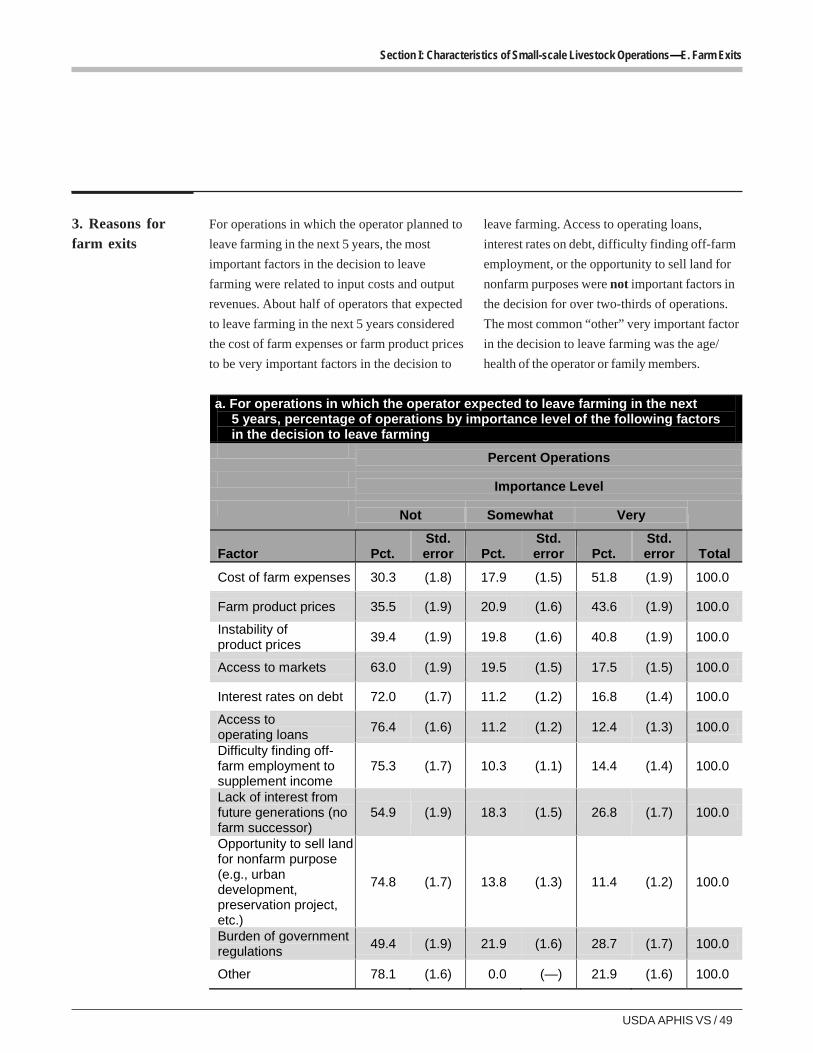
USDA APHIS VS / 49
Section I: Characteristics of Small-scale Livestock Operations—E. Farm Exits
3. Reasons forfarm exits
For operations in which the operator planned to
leave farming in the next 5 years, the most
important factors in the decision to leave
farming were related to input costs and output
revenues. About half of operators that expected
to leave farming in the next 5 years considered
the cost of farm expenses or farm product prices
to be very important factors in the decision to
leave farming. Access to operating loans,
interest rates on debt, difficulty finding off-farm
employment, or the opportunity to sell land for
nonfarm purposes were not important factors in
the decision for over two-thirds of operations.
The most common “other” very important factor
in the decision to leave farming was the age/
health of the operator or family members.
a. For operations in which the operator expected to leave farming in the next 5 years, percentage of operations by importance level of the following factors in the decision to leave farming
Percent Operations
Importance Level
Not Somewhat Very
Factor Pct. Std. error Pct.
Std. error Pct.
Std. error Total
Cost of farm expenses 30.3 (1.8) 17.9 (1.5) 51.8 (1.9) 100.0
Farm product prices 35.5 (1.9) 20.9 (1.6) 43.6 (1.9) 100.0
Instability of product prices
39.4 (1.9) 19.8 (1.6) 40.8 (1.9) 100.0
Access to markets 63.0 (1.9) 19.5 (1.5) 17.5 (1.5) 100.0
Interest rates on debt 72.0 (1.7) 11.2 (1.2) 16.8 (1.4) 100.0
Access to operating loans
76.4 (1.6) 11.2 (1.2) 12.4 (1.3) 100.0
Difficulty finding off-farm employment to supplement income
75.3 (1.7) 10.3 (1.1) 14.4 (1.4) 100.0
Lack of interest from future generations (no farm successor)
54.9 (1.9) 18.3 (1.5) 26.8 (1.7) 100.0
Opportunity to sell land for nonfarm purpose (e.g., urban development, preservation project, etc.)
74.8 (1.7) 13.8 (1.3) 11.4 (1.2) 100.0
Burden of government regulations
49.4 (1.9) 21.9 (1.6) 28.7 (1.7) 100.0
Other 78.1 (1.6) 0.0 (—) 21.9 (1.6) 100.0
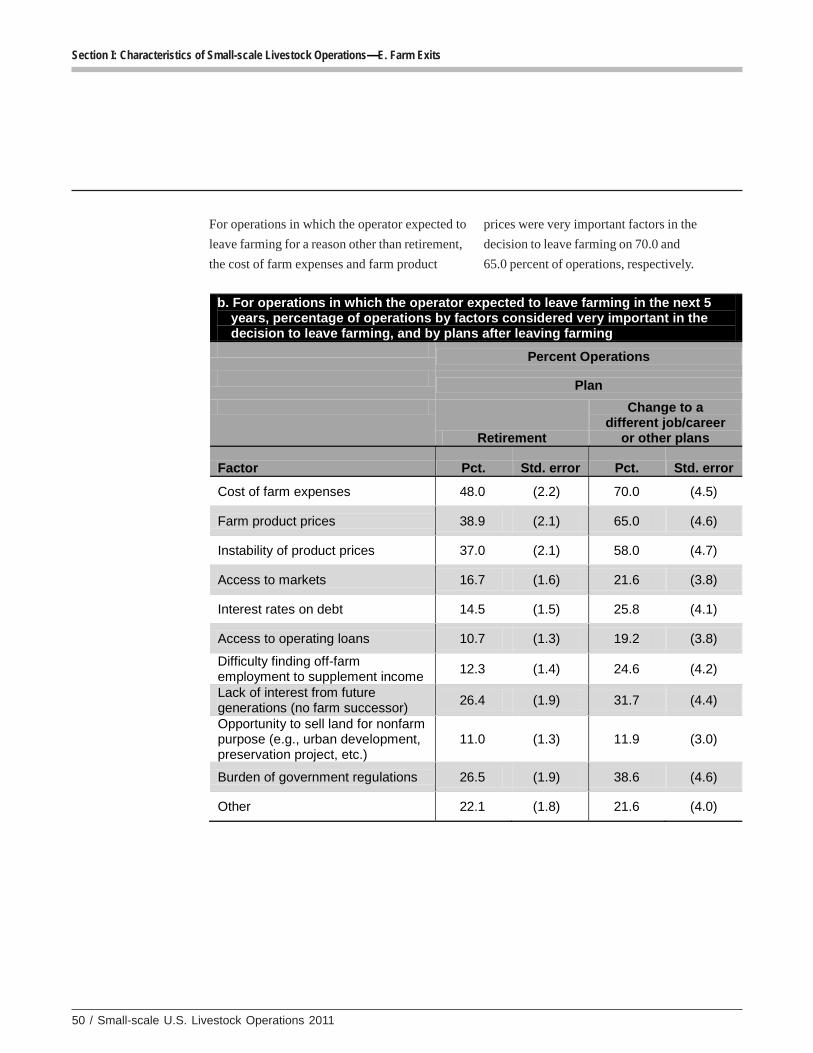
50 / Small-scale U.S. Livestock Operations 2011
Section I: Characteristics of Small-scale Livestock Operations—E. Farm Exits
For operations in which the operator expected to
leave farming for a reason other than retirement,
the cost of farm expenses and farm product
prices were very important factors in the
decision to leave farming on 70.0 and
65.0 percent of operations, respectively.
b. For operations in which the operator expected to leave farming in the next 5 years, percentage of operations by factors considered very important in the decision to leave farming, and by plans after leaving farming
Percent Operations
Plan
Retirement
Change to a different job/career
or other plans
Factor Pct. Std. error Pct. Std. error
Cost of farm expenses 48.0 (2.2) 70.0 (4.5)
Farm product prices 38.9 (2.1) 65.0 (4.6)
Instability of product prices 37.0 (2.1) 58.0 (4.7)
Access to markets 16.7 (1.6) 21.6 (3.8)
Interest rates on debt 14.5 (1.5) 25.8 (4.1)
Access to operating loans 10.7 (1.3) 19.2 (3.8)
Difficulty finding off-farm employment to supplement income
12.3 (1.4) 24.6 (4.2)
Lack of interest from future generations (no farm successor)
26.4 (1.9) 31.7 (4.4)
Opportunity to sell land for nonfarm purpose (e.g., urban development, preservation project, etc.)
11.0 (1.3) 11.9 (3.0)
Burden of government regulations 26.5 (1.9) 38.6 (4.6)
Other 22.1 (1.8) 21.6 (4.0)
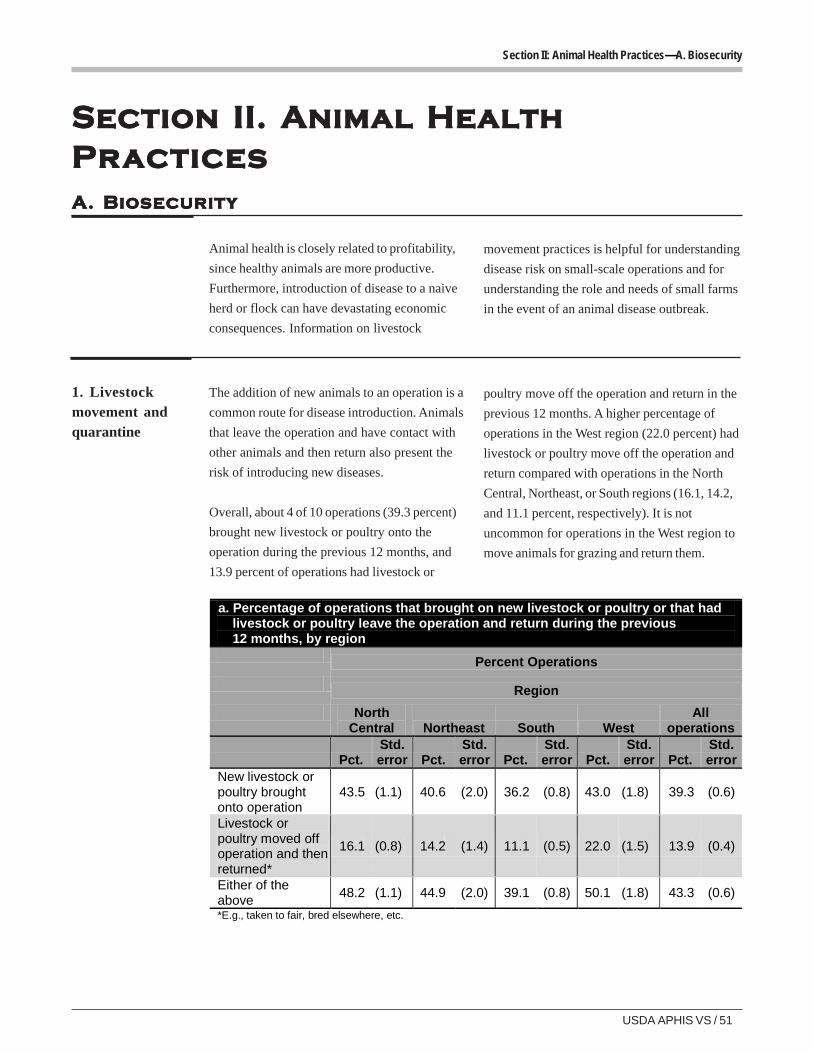
USDA APHIS VS / 51
Section II: Animal Health Practices—A. Biosecurity
Section II. Animal HealthSection II. Animal HealthSection II. Animal HealthSection II. Animal HealthSection II. Animal HealthPrPrPrPrPracticesacticesacticesacticesacticesA. BiosecurityA. BiosecurityA. BiosecurityA. BiosecurityA. Biosecurity
Animal health is closely related to profitability,
since healthy animals are more productive.
Furthermore, introduction of disease to a naive
herd or flock can have devastating economic
consequences. Information on livestock
movement practices is helpful for understanding
disease risk on small-scale operations and for
understanding the role and needs of small farms
in the event of an animal disease outbreak.
1. Livestockmovement andquarantine
The addition of new animals to an operation is a
common route for disease introduction. Animals
that leave the operation and have contact with
other animals and then return also present the
risk of introducing new diseases.
Overall, about 4 of 10 operations (39.3 percent)
brought new livestock or poultry onto the
operation during the previous 12 months, and
13.9 percent of operations had livestock or
poultry move off the operation and return in the
previous 12 months. A higher percentage of
operations in the West region (22.0 percent) had
livestock or poultry move off the operation and
return compared with operations in the North
Central, Northeast, or South regions (16.1, 14.2,
and 11.1 percent, respectively). It is not
uncommon for operations in the West region to
move animals for grazing and return them.
a. Percentage of operations that brought on new livestock or poultry or that had livestock or poultry leave the operation and return during the previous 12 months, by region
Percent Operations
Region
North Central Northeast South West
All operations
Pct. Std. error Pct.
Std. error Pct.
Std. error Pct.
Std. error Pct.
Std. error
New livestock or poultry brought onto operation
43.5 (1.1) 40.6 (2.0) 36.2 (0.8) 43.0 (1.8) 39.3 (0.6)
Livestock or poultry moved off operation and then returned*
16.1 (0.8) 14.2 (1.4) 11.1 (0.5) 22.0 (1.5) 13.9 (0.4)
Either of the above
48.2 (1.1) 44.9 (2.0) 39.1 (0.8) 50.1 (1.8) 43.3 (0.6)
*E.g., taken to fair, bred elsewhere, etc.
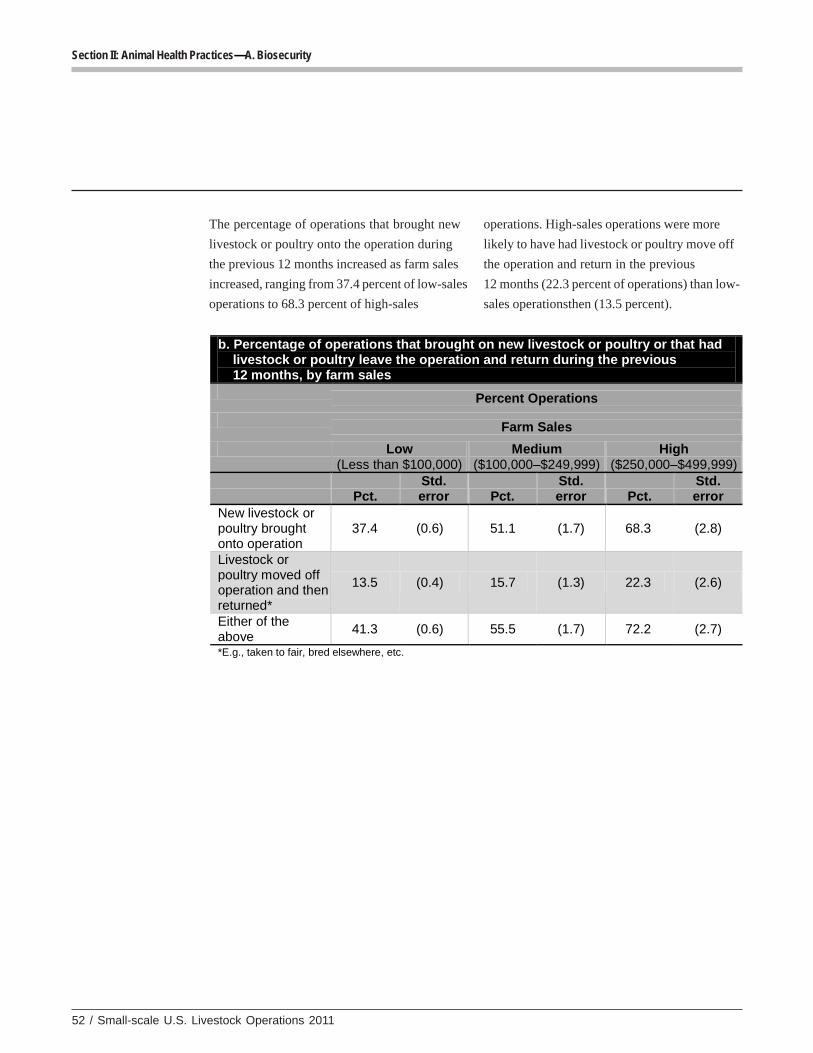
52 / Small-scale U.S. Livestock Operations 2011
Section II: Animal Health Practices—A. Biosecurity
The percentage of operations that brought new
livestock or poultry onto the operation during
the previous 12 months increased as farm sales
increased, ranging from 37.4 percent of low-sales
operations to 68.3 percent of high-sales
operations. High-sales operations were more
likely to have had livestock or poultry move off
the operation and return in the previous
12 months (22.3 percent of operations) than low-
sales operationsthen (13.5 percent).
b. Percentage of operations that brought on new livestock or poultry or that had livestock or poultry leave the operation and return during the previous 12 months, by farm sales
Percent Operations
Farm Sales
Low (Less than $100,000)
Medium ($100,000–$249,999)
High ($250,000–$499,999)
Pct. Std. error Pct.
Std. error Pct.
Std. error
New livestock or poultry brought onto operation
37.4 (0.6) 51.1 (1.7) 68.3 (2.8)
Livestock or poultry moved off operation and then returned*
13.5 (0.4) 15.7 (1.3) 22.3 (2.6)
Either of the above
41.3 (0.6) 55.5 (1.7) 72.2 (2.7)
*E.g., taken to fair, bred elsewhere, etc.
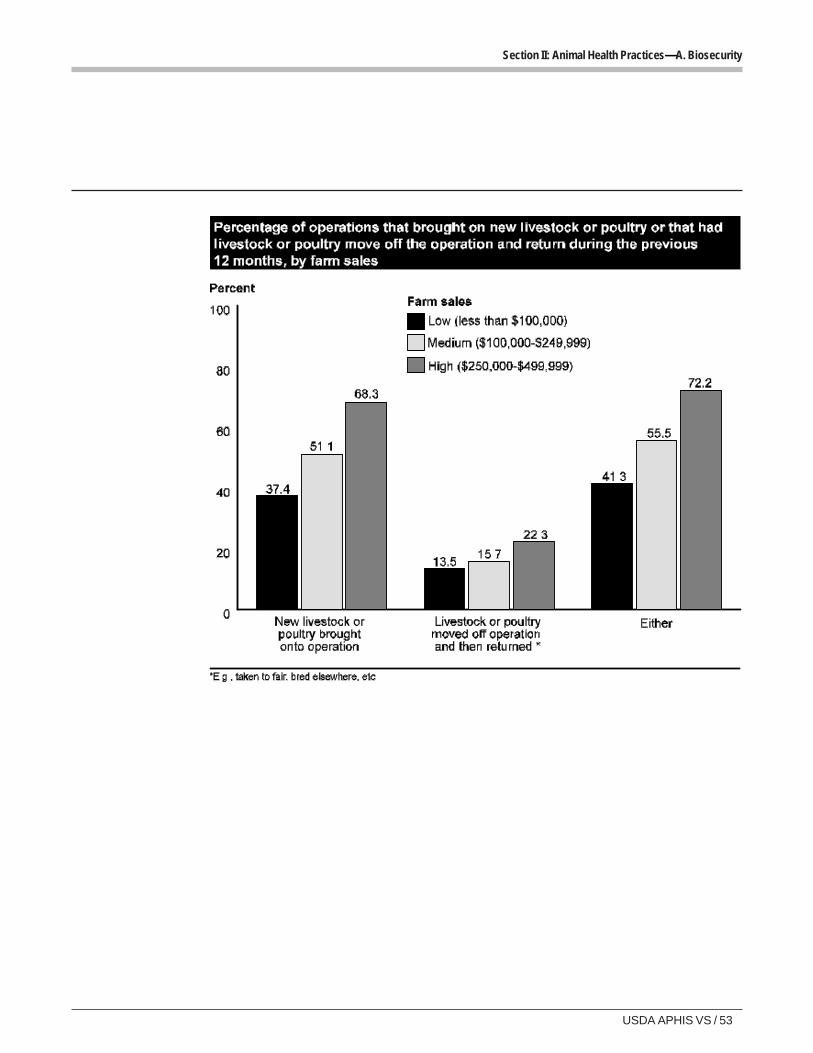
USDA APHIS VS / 53
Section II: Animal Health Practices—A. Biosecurity
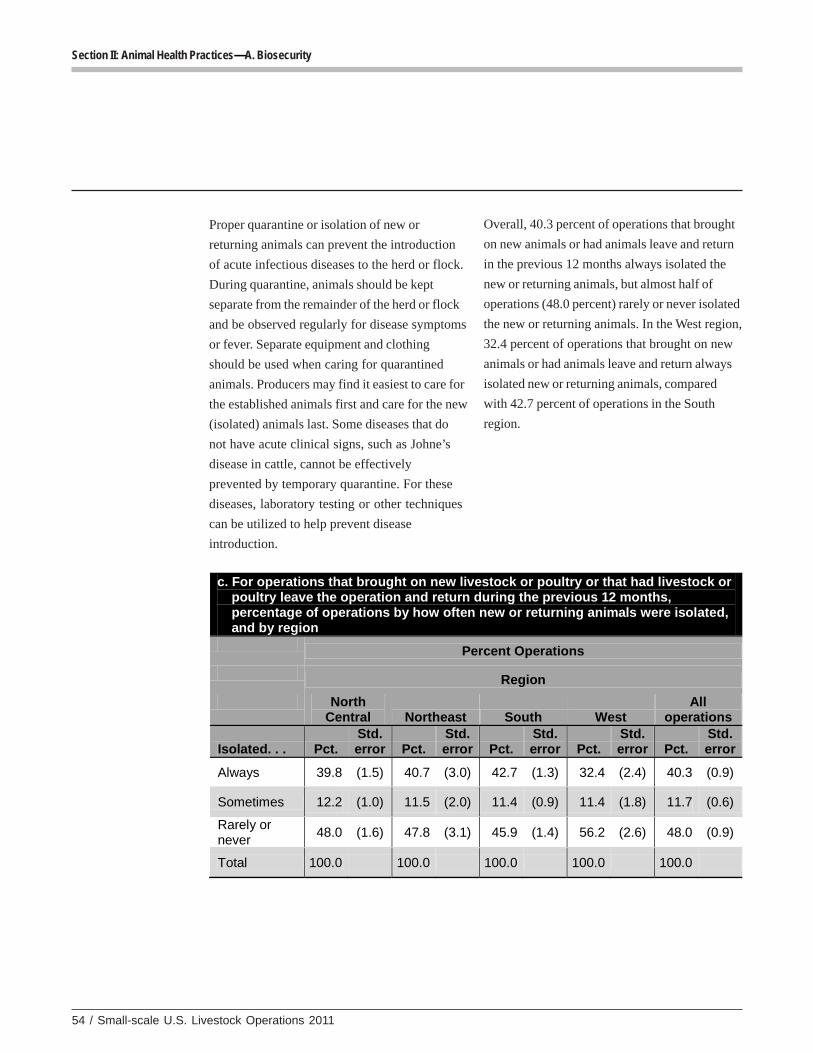
54 / Small-scale U.S. Livestock Operations 2011
Section II: Animal Health Practices—A. Biosecurity
Proper quarantine or isolation of new or
returning animals can prevent the introduction
of acute infectious diseases to the herd or flock.
During quarantine, animals should be kept
separate from the remainder of the herd or flock
and be observed regularly for disease symptoms
or fever. Separate equipment and clothing
should be used when caring for quarantined
animals. Producers may find it easiest to care for
the established animals first and care for the new
(isolated) animals last. Some diseases that do
not have acute clinical signs, such as Johne’s
disease in cattle, cannot be effectively
prevented by temporary quarantine. For these
diseases, laboratory testing or other techniques
can be utilized to help prevent disease
introduction.
Overall, 40.3 percent of operations that brought
on new animals or had animals leave and return
in the previous 12 months always isolated the
new or returning animals, but almost half of
operations (48.0 percent) rarely or never isolated
the new or returning animals. In the West region,
32.4 percent of operations that brought on new
animals or had animals leave and return always
isolated new or returning animals, compared
with 42.7 percent of operations in the South
region.
c. For operations that brought on new livestock or poultry or that had livestock or poultry leave the operation and return during the previous 12 months, percentage of operations by how often new or returning animals were isolated, and by region
Percent Operations
Region
North Central Northeast South West
All operations
Isolated. . . Pct. Std. error Pct.
Std. error Pct.
Std. error Pct.
Std. error Pct.
Std. error
Always 39.8 (1.5) 40.7 (3.0) 42.7 (1.3) 32.4 (2.4) 40.3 (0.9)
Sometimes 12.2 (1.0) 11.5 (2.0) 11.4 (0.9) 11.4 (1.8) 11.7 (0.6)
Rarely or never
48.0 (1.6) 47.8 (3.1) 45.9 (1.4) 56.2 (2.6) 48.0 (0.9)
Total 100.0 100.0 100.0 100.0 100.0
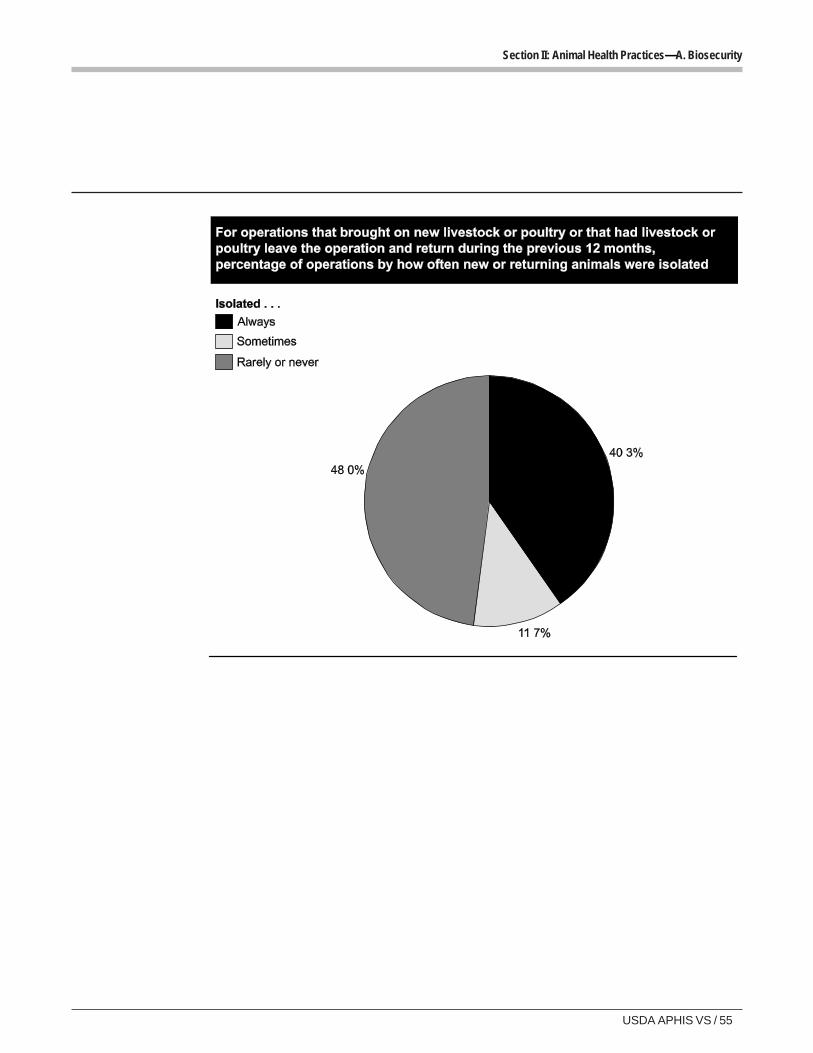
USDA APHIS VS / 55
Section II: Animal Health Practices—A. Biosecurity
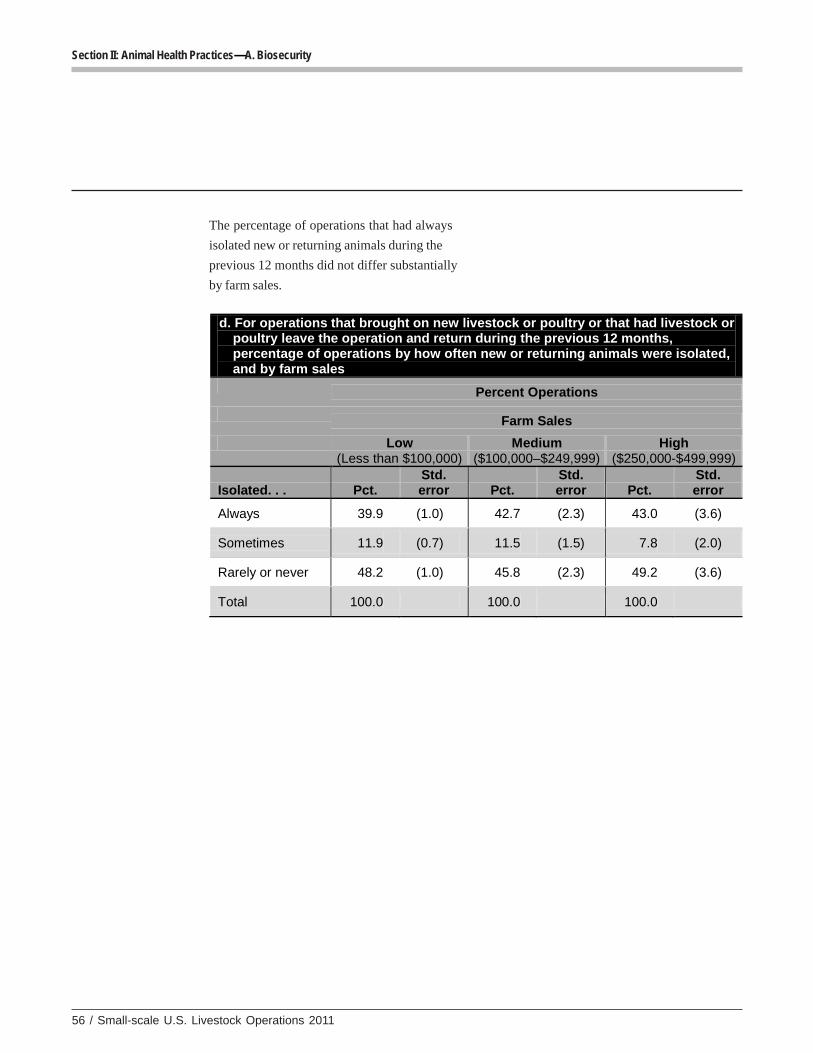
56 / Small-scale U.S. Livestock Operations 2011
Section II: Animal Health Practices—A. Biosecurity
The percentage of operations that had always
isolated new or returning animals during the
previous 12 months did not differ substantially
by farm sales.
d. For operations that brought on new livestock or poultry or that had livestock or poultry leave the operation and return during the previous 12 months, percentage of operations by how often new or returning animals were isolated, and by farm sales
Percent Operations
Farm Sales
Low (Less than $100,000)
Medium ($100,000–$249,999)
High ($250,000-$499,999)
Isolated. . . Pct. Std. error Pct.
Std. error Pct.
Std. error
Always 39.9 (1.0) 42.7 (2.3) 43.0 (3.6)
Sometimes 11.9 (0.7) 11.5 (1.5) 7.8 (2.0)
Rarely or never 48.2 (1.0) 45.8 (2.3) 49.2 (3.6)
Total 100.0 100.0 100.0
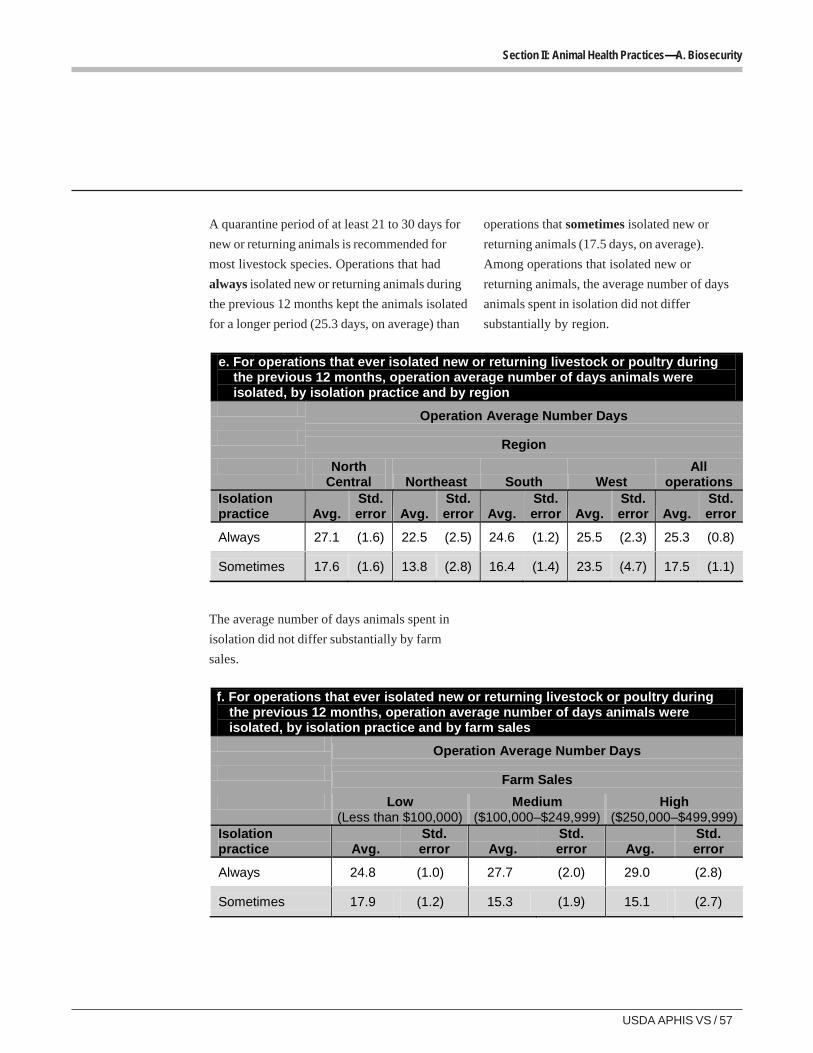
USDA APHIS VS / 57
Section II: Animal Health Practices—A. Biosecurity
A quarantine period of at least 21 to 30 days for
new or returning animals is recommended for
most livestock species. Operations that had
always isolated new or returning animals during
the previous 12 months kept the animals isolated
for a longer period (25.3 days, on average) than
operations that sometimes isolated new or
returning animals (17.5 days, on average).
Among operations that isolated new or
returning animals, the average number of days
animals spent in isolation did not differ
substantially by region.
The average number of days animals spent in
isolation did not differ substantially by farm
sales.
e. For operations that ever isolated new or returning livestock or poultry during the previous 12 months, operation average number of days animals were isolated, by isolation practice and by region
Operation Average Number Days
Region
North Central Northeast South West
All operations
Isolation practice Avg.
Std. error Avg.
Std. error Avg.
Std. error Avg.
Std. error Avg.
Std. error
Always 27.1 (1.6) 22.5 (2.5) 24.6 (1.2) 25.5 (2.3) 25.3 (0.8)
Sometimes 17.6 (1.6) 13.8 (2.8) 16.4 (1.4) 23.5 (4.7) 17.5 (1.1)
f. For operations that ever isolated new or returning livestock or poultry during the previous 12 months, operation average number of days animals were isolated, by isolation practice and by farm sales
Operation Average Number Days
Farm Sales
Low (Less than $100,000)
Medium ($100,000–$249,999)
High ($250,000–$499,999)
Isolation practice Avg.
Std. error Avg.
Std. error Avg.
Std. error
Always 24.8 (1.0) 27.7 (2.0) 29.0 (2.8)
Sometimes 17.9 (1.2) 15.3 (1.9) 15.1 (2.7)
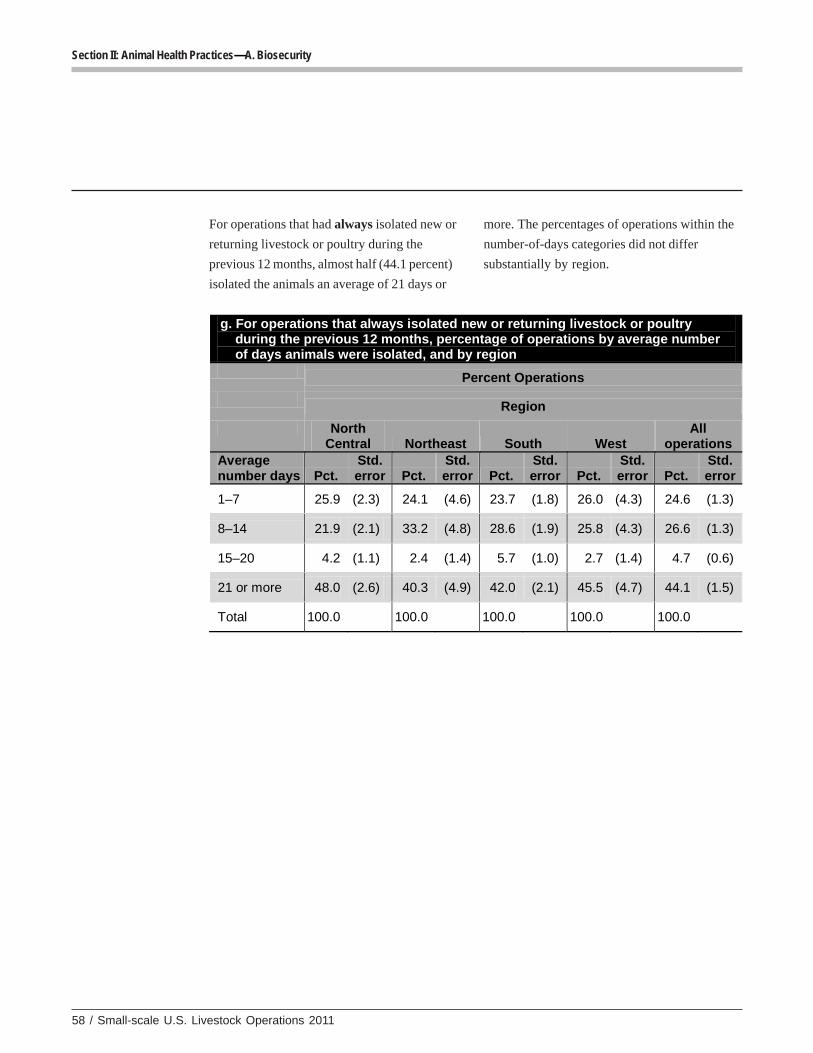
58 / Small-scale U.S. Livestock Operations 2011
Section II: Animal Health Practices—A. Biosecurity
For operations that had always isolated new or
returning livestock or poultry during the
previous 12 months, almost half (44.1 percent)
isolated the animals an average of 21 days or
more. The percentages of operations within the
number-of-days categories did not differ
substantially by region.
g. For operations that always isolated new or returning livestock or poultry during the previous 12 months, percentage of operations by average number of days animals were isolated, and by region
Percent Operations
Region
North Central Northeast South West
All operations
Average number days Pct.
Std. error Pct.
Std. error Pct.
Std. error Pct.
Std. error Pct.
Std. error
1–7 25.9 (2.3) 24.1 (4.6) 23.7 (1.8) 26.0 (4.3) 24.6 (1.3)
8–14 21.9 (2.1) 33.2 (4.8) 28.6 (1.9) 25.8 (4.3) 26.6 (1.3)
15–20 4.2 (1.1) 2.4 (1.4) 5.7 (1.0) 2.7 (1.4) 4.7 (0.6)
21 or more 48.0 (2.6) 40.3 (4.9) 42.0 (2.1) 45.5 (4.7) 44.1 (1.5)
Total 100.0 100.0 100.0 100.0 100.0
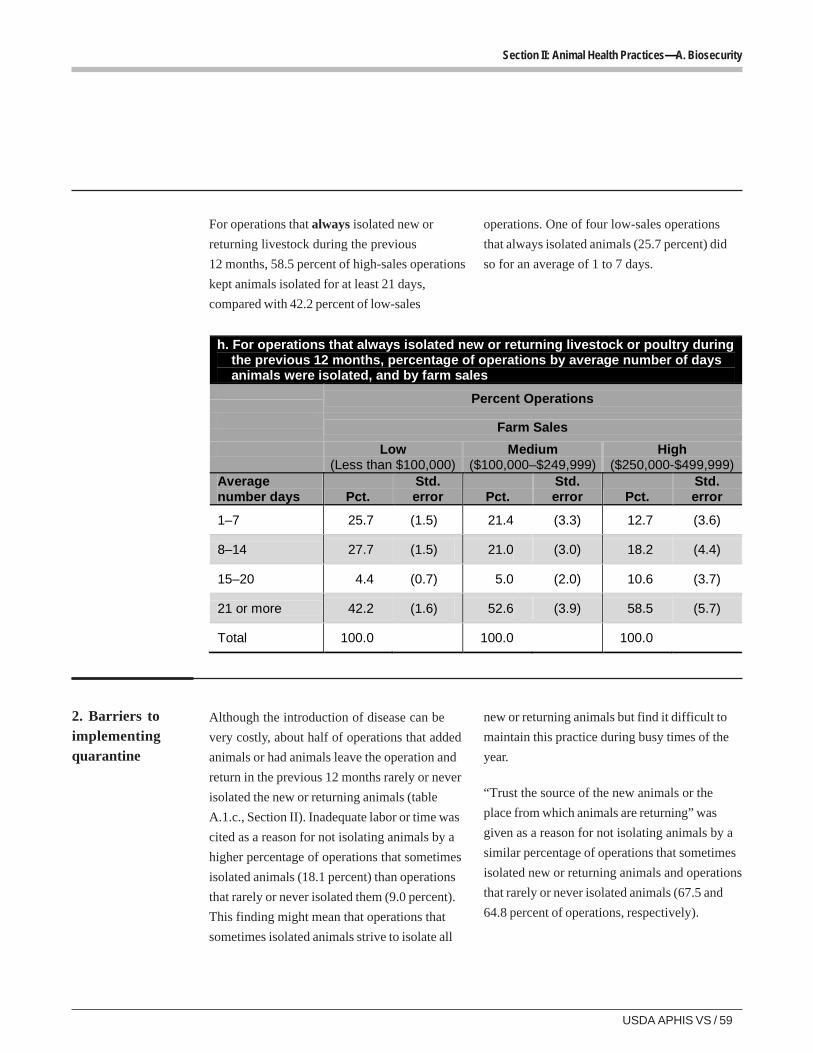
USDA APHIS VS / 59
Section II: Animal Health Practices—A. Biosecurity
For operations that always isolated new or
returning livestock during the previous
12 months, 58.5 percent of high-sales operations
kept animals isolated for at least 21 days,
compared with 42.2 percent of low-sales
operations. One of four low-sales operations
that always isolated animals (25.7 percent) did
so for an average of 1 to 7 days.
2. Barriers toimplementingquarantine
Although the introduction of disease can be
very costly, about half of operations that added
animals or had animals leave the operation and
return in the previous 12 months rarely or never
isolated the new or returning animals (table
A.1.c., Section II). Inadequate labor or time was
cited as a reason for not isolating animals by a
higher percentage of operations that sometimes
isolated animals (18.1 percent) than operations
that rarely or never isolated them (9.0 percent).
This finding might mean that operations that
sometimes isolated animals strive to isolate all
new or returning animals but find it difficult to
maintain this practice during busy times of the
year.
“Trust the source of the new animals or the
place from which animals are returning” was
given as a reason for not isolating animals by a
similar percentage of operations that sometimes
isolated new or returning animals and operations
that rarely or never isolated animals (67.5 and
64.8 percent of operations, respectively).
h. For operations that always isolated new or returning livestock or poultry during the previous 12 months, percentage of operations by average number of days animals were isolated, and by farm sales
Percent Operations
Farm Sales
Low (Less than $100,000)
Medium ($100,000–$249,999)
High ($250,000-$499,999)
Average number days Pct.
Std. error Pct.
Std. error Pct.
Std. error
1–7 25.7 (1.5) 21.4 (3.3) 12.7 (3.6)
8–14 27.7 (1.5) 21.0 (3.0) 18.2 (4.4)
15–20 4.4 (0.7) 5.0 (2.0) 10.6 (3.7)
21 or more 42.2 (1.6) 52.6 (3.9) 58.5 (5.7)
Total 100.0 100.0 100.0
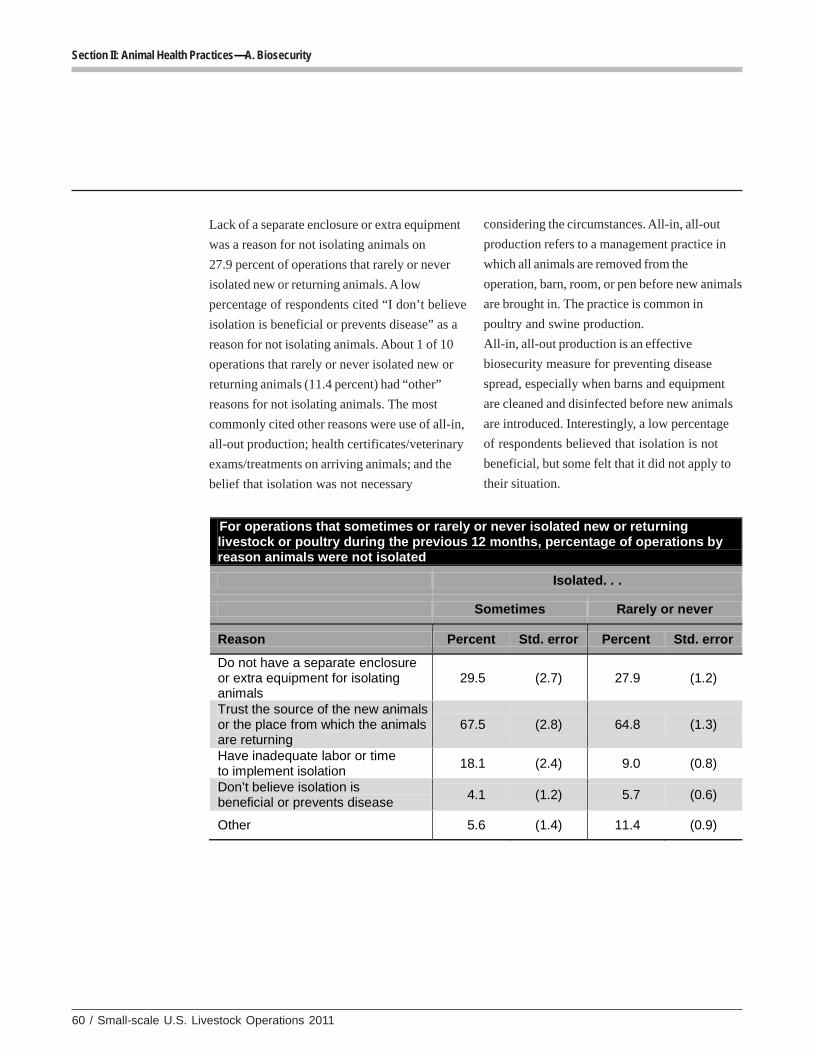
60 / Small-scale U.S. Livestock Operations 2011
Section II: Animal Health Practices—A. Biosecurity
Lack of a separate enclosure or extra equipment
was a reason for not isolating animals on
27.9 percent of operations that rarely or never
isolated new or returning animals. A low
percentage of respondents cited “I don’t believe
isolation is beneficial or prevents disease” as a
reason for not isolating animals. About 1 of 10
operations that rarely or never isolated new or
returning animals (11.4 percent) had “other”
reasons for not isolating animals. The most
commonly cited other reasons were use of all-in,
all-out production; health certificates/veterinary
exams/treatments on arriving animals; and the
belief that isolation was not necessary
considering the circumstances. All-in, all-out
production refers to a management practice in
which all animals are removed from the
operation, barn, room, or pen before new animals
are brought in. The practice is common in
poultry and swine production.
All-in, all-out production is an effective
biosecurity measure for preventing disease
spread, especially when barns and equipment
are cleaned and disinfected before new animals
are introduced. Interestingly, a low percentage
of respondents believed that isolation is not
beneficial, but some felt that it did not apply to
their situation.
For operations that sometimes or rarely or never isolated new or returning livestock or poultry during the previous 12 months, percentage of operations by reason animals were not isolated
Isolated. . .
Sometimes Rarely or never
Reason Percent Std. error Percent Std. error
Do not have a separate enclosure or extra equipment for isolating animals
29.5 (2.7) 27.9 (1.2)
Trust the source of the new animals or the place from which the animals are returning
67.5 (2.8) 64.8 (1.3)
Have inadequate labor or time to implement isolation
18.1 (2.4) 9.0 (0.8)
Don’t believe isolation is beneficial or prevents disease
4.1 (1.2) 5.7 (0.6)
Other 5.6 (1.4) 11.4 (0.9)
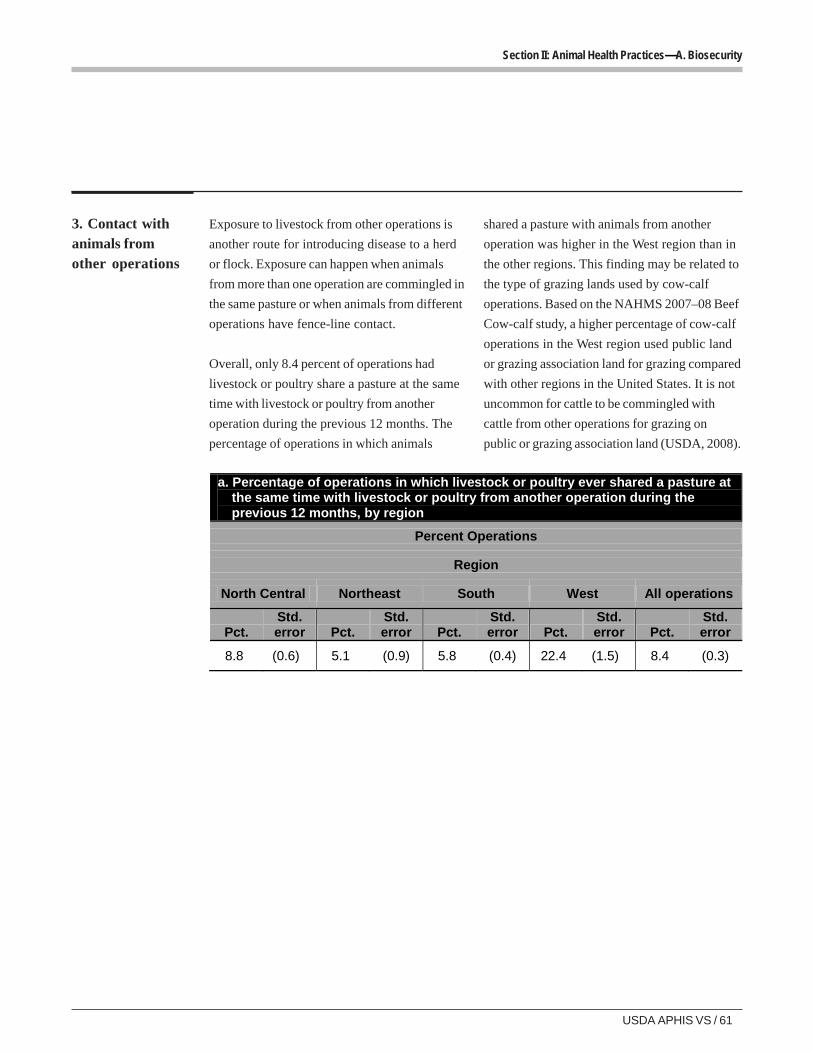
USDA APHIS VS / 61
Section II: Animal Health Practices—A. Biosecurity
3. Contact withanimals fromother operations
Exposure to livestock from other operations is
another route for introducing disease to a herd
or flock. Exposure can happen when animals
from more than one operation are commingled in
the same pasture or when animals from different
operations have fence-line contact.
Overall, only 8.4 percent of operations had
livestock or poultry share a pasture at the same
time with livestock or poultry from another
operation during the previous 12 months. The
percentage of operations in which animals
shared a pasture with animals from another
operation was higher in the West region than in
the other regions. This finding may be related to
the type of grazing lands used by cow-calf
operations. Based on the NAHMS 2007–08 Beef
Cow-calf study, a higher percentage of cow-calf
operations in the West region used public land
or grazing association land for grazing compared
with other regions in the United States. It is not
uncommon for cattle to be commingled with
cattle from other operations for grazing on
public or grazing association land (USDA, 2008).
a. Percentage of operations in which livestock or poultry ever shared a pasture at the same time with livestock or poultry from another operation during the previous 12 months, by region
Percent Operations
Region
North Central Northeast South West All operations
Pct. Std. error Pct.
Std. error Pct.
Std. error Pct.
Std. error Pct.
Std. error
8.8 (0.6) 5.1 (0.9) 5.8 (0.4) 22.4 (1.5) 8.4 (0.3)
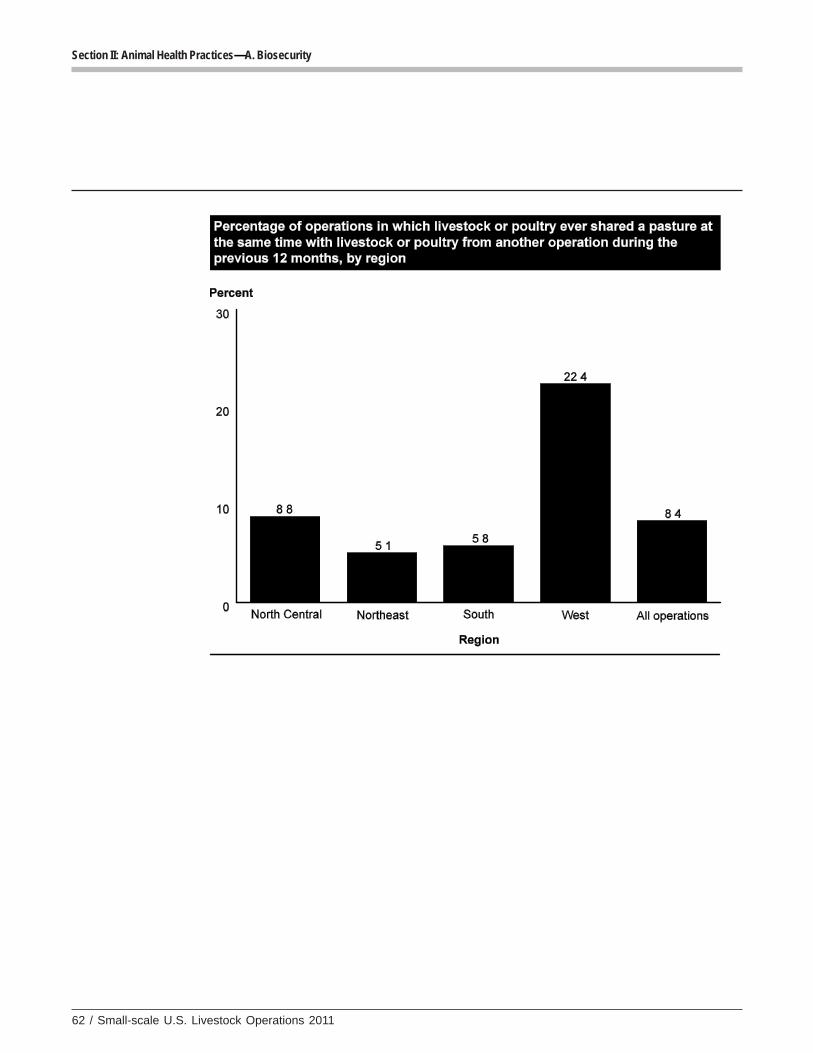
62 / Small-scale U.S. Livestock Operations 2011
Section II: Animal Health Practices—A. Biosecurity
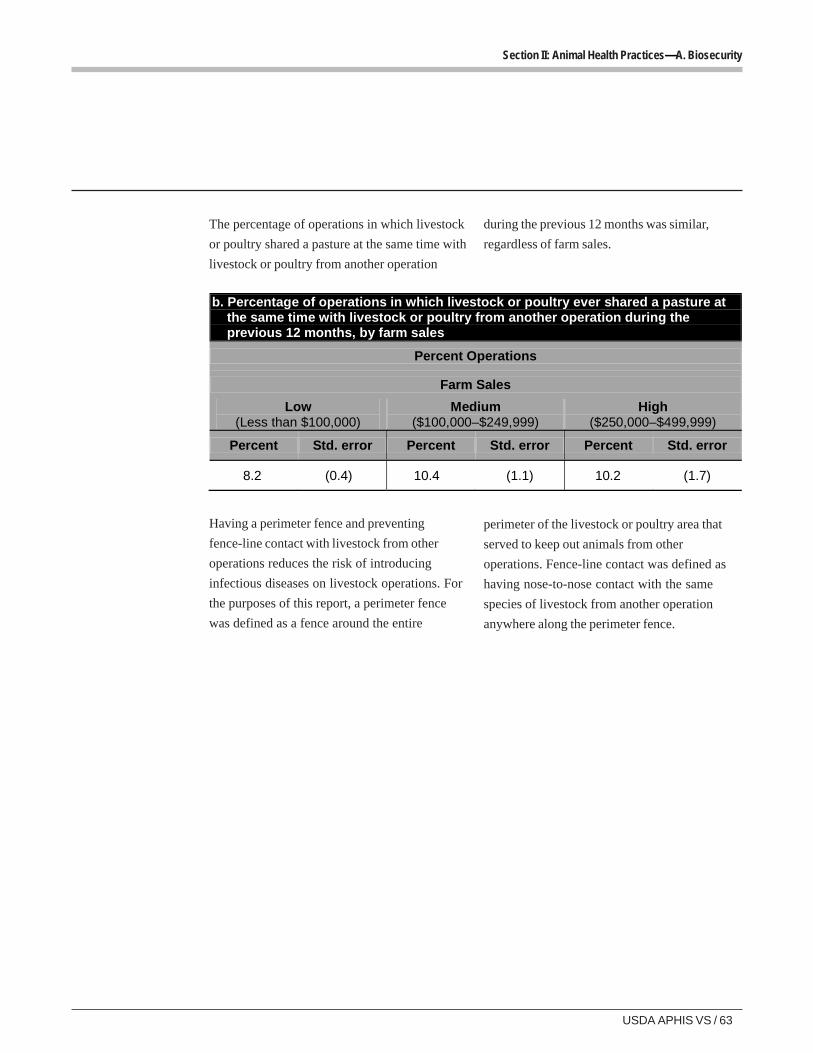
USDA APHIS VS / 63
Section II: Animal Health Practices—A. Biosecurity
The percentage of operations in which livestock
or poultry shared a pasture at the same time with
livestock or poultry from another operation
during the previous 12 months was similar,
regardless of farm sales.
b. Percentage of operations in which livestock or poultry ever shared a pasture at the same time with livestock or poultry from another operation during the previous 12 months, by farm sales
Percent Operations
Farm Sales
Low (Less than $100,000)
Medium ($100,000–$249,999)
High ($250,000–$499,999)
Percent Std. error Percent Std. error Percent Std. error
8.2 (0.4) 10.4 (1.1) 10.2 (1.7)
Having a perimeter fence and preventing
fence-line contact with livestock from other
operations reduces the risk of introducing
infectious diseases on livestock operations. For
the purposes of this report, a perimeter fence
was defined as a fence around the entire
perimeter of the livestock or poultry area that
served to keep out animals from other
operations. Fence-line contact was defined as
having nose-to-nose contact with the same
species of livestock from another operation
anywhere along the perimeter fence.
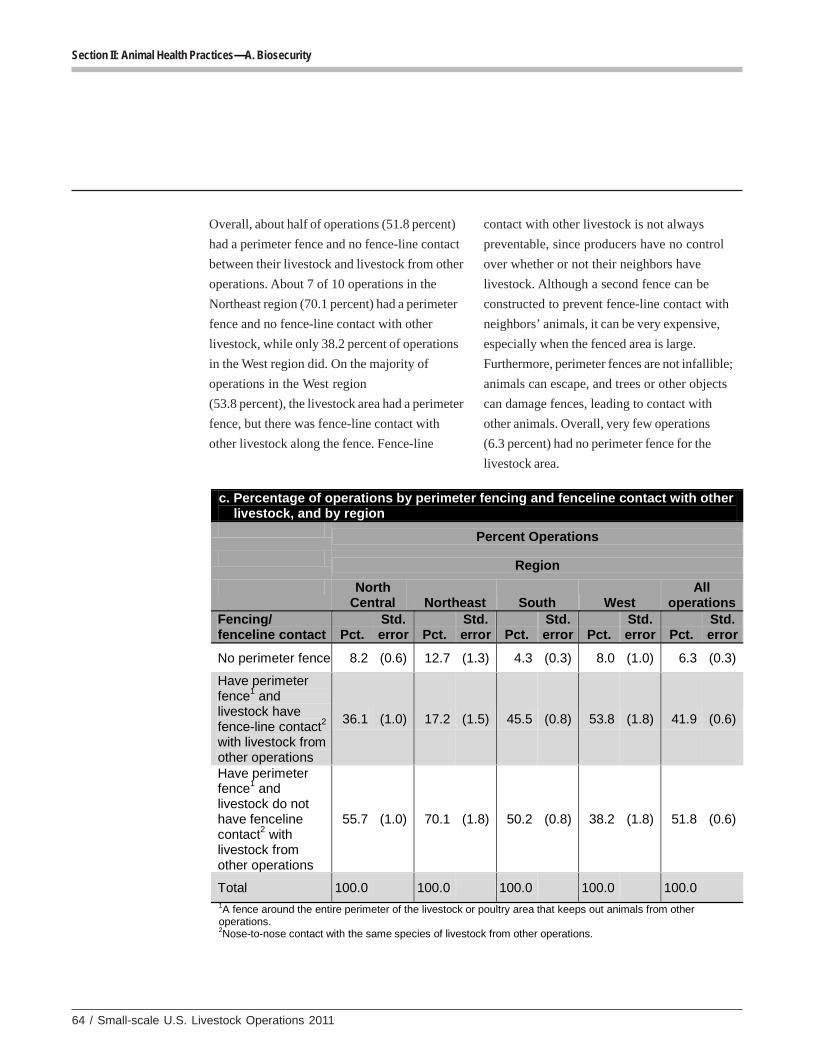
64 / Small-scale U.S. Livestock Operations 2011
Section II: Animal Health Practices—A. Biosecurity
Overall, about half of operations (51.8 percent)
had a perimeter fence and no fence-line contact
between their livestock and livestock from other
operations. About 7 of 10 operations in the
Northeast region (70.1 percent) had a perimeter
fence and no fence-line contact with other
livestock, while only 38.2 percent of operations
in the West region did. On the majority of
operations in the West region
(53.8 percent), the livestock area had a perimeter
fence, but there was fence-line contact with
other livestock along the fence. Fence-line
contact with other livestock is not always
preventable, since producers have no control
over whether or not their neighbors have
livestock. Although a second fence can be
constructed to prevent fence-line contact with
neighbors’ animals, it can be very expensive,
especially when the fenced area is large.
Furthermore, perimeter fences are not infallible;
animals can escape, and trees or other objects
can damage fences, leading to contact with
other animals. Overall, very few operations
(6.3 percent) had no perimeter fence for the
livestock area.
c. Percentage of operations by perimeter fencing and fenceline contact with other livestock, and by region
Percent Operations
Region
North Central Northeast South West
All operations
Fencing/ fenceline contact Pct.
Std. error Pct.
Std. error Pct.
Std. error Pct.
Std. error Pct.
Std. error
No perimeter fence 8.2 (0.6) 12.7 (1.3) 4.3 (0.3) 8.0 (1.0) 6.3 (0.3)
Have perimeter fence1 and livestock have fence-line contact2 with livestock from other operations
36.1 (1.0) 17.2 (1.5) 45.5 (0.8) 53.8 (1.8) 41.9 (0.6)
Have perimeter fence1 and livestock do not have fenceline contact2 with livestock from other operations
55.7 (1.0) 70.1 (1.8) 50.2 (0.8) 38.2 (1.8) 51.8 (0.6)
Total 100.0 100.0 100.0 100.0 100.0 1A fence around the entire perimeter of the livestock or poultry area that keeps out animals from other operations. 2Nose-to-nose contact with the same species of livestock from other operations.
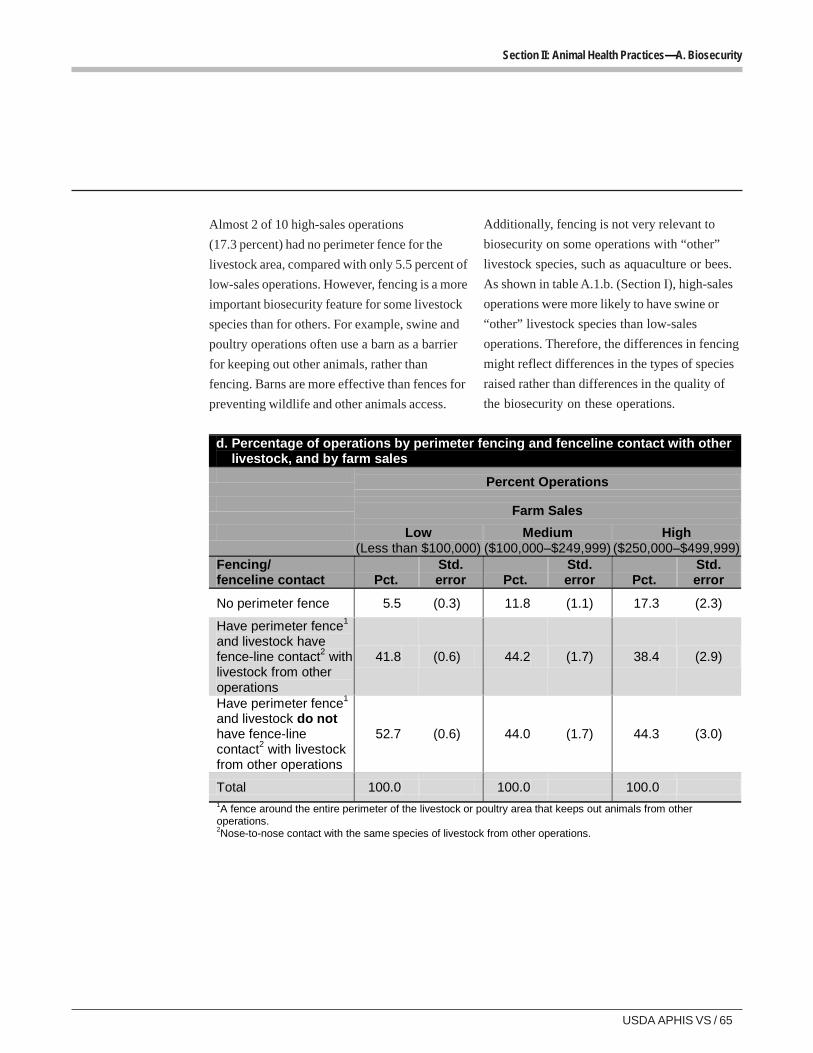
USDA APHIS VS / 65
Section II: Animal Health Practices—A. Biosecurity
Almost 2 of 10 high-sales operations
(17.3 percent) had no perimeter fence for the
livestock area, compared with only 5.5 percent of
low-sales operations. However, fencing is a more
important biosecurity feature for some livestock
species than for others. For example, swine and
poultry operations often use a barn as a barrier
for keeping out other animals, rather than
fencing. Barns are more effective than fences for
preventing wildlife and other animals access.
Additionally, fencing is not very relevant to
biosecurity on some operations with “other”
livestock species, such as aquaculture or bees.
As shown in table A.1.b. (Section I), high-sales
operations were more likely to have swine or
“other” livestock species than low-sales
operations. Therefore, the differences in fencing
might reflect differences in the types of species
raised rather than differences in the quality of
the biosecurity on these operations.
d. Percentage of operations by perimeter fencing and fenceline contact with other livestock, and by farm sales
Percent Operations
Farm Sales
Low (Less than $100,000)
Medium ($100,000–$249,999)
High ($250,000–$499,999)
Fencing/ fenceline contact Pct.
Std. error Pct.
Std. error Pct.
Std. error
No perimeter fence 5.5 (0.3) 11.8 (1.1) 17.3 (2.3)
Have perimeter fence1 and livestock have fence-line contact2 with livestock from other operations
41.8 (0.6) 44.2 (1.7) 38.4 (2.9)
Have perimeter fence1 and livestock do not have fence-line contact2 with livestock from other operations
52.7 (0.6) 44.0 (1.7) 44.3 (3.0)
Total 100.0 100.0 100.0 1A fence around the entire perimeter of the livestock or poultry area that keeps out animals from other operations. 2Nose-to-nose contact with the same species of livestock from other operations.
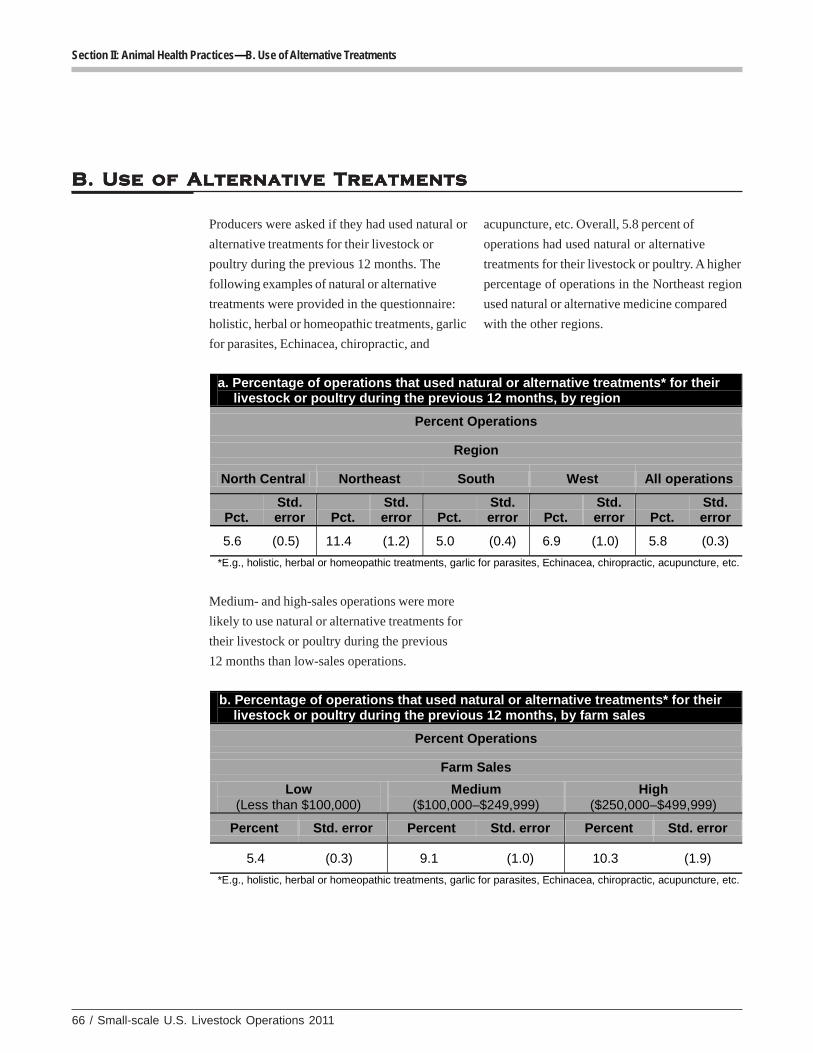
66 / Small-scale U.S. Livestock Operations 2011
Section II: Animal Health Practices—B. Use of Alternative Treatments
B. Use of Alternative TreatmentsB. Use of Alternative TreatmentsB. Use of Alternative TreatmentsB. Use of Alternative TreatmentsB. Use of Alternative Treatments
Producers were asked if they had used natural or
alternative treatments for their livestock or
poultry during the previous 12 months. The
following examples of natural or alternative
treatments were provided in the questionnaire:
holistic, herbal or homeopathic treatments, garlic
for parasites, Echinacea, chiropractic, and
acupuncture, etc. Overall, 5.8 percent of
operations had used natural or alternative
treatments for their livestock or poultry. A higher
percentage of operations in the Northeast region
used natural or alternative medicine compared
with the other regions.
a. Percentage of operations that used natural or alternative treatments* for their livestock or poultry during the previous 12 months, by region
Percent Operations
Region
North Central Northeast South West All operations
Pct. Std. error Pct.
Std. error Pct.
Std. error Pct.
Std. error Pct.
Std. error
5.6 (0.5) 11.4 (1.2) 5.0 (0.4) 6.9 (1.0) 5.8 (0.3)
*E.g., holistic, herbal or homeopathic treatments, garlic for parasites, Echinacea, chiropractic, acupuncture, etc.
Medium- and high-sales operations were more
likely to use natural or alternative treatments for
their livestock or poultry during the previous
12 months than low-sales operations.
b. Percentage of operations that used natural or alternative treatments* for their livestock or poultry during the previous 12 months, by farm sales
Percent Operations
Farm Sales
Low (Less than $100,000)
Medium ($100,000–$249,999)
High ($250,000–$499,999)
Percent Std. error Percent Std. error Percent Std. error
5.4 (0.3) 9.1 (1.0) 10.3 (1.9)
*E.g., holistic, herbal or homeopathic treatments, garlic for parasites, Echinacea, chiropractic, acupuncture, etc.
USDA APHIS VS / 67
Section III: Challenges for Small-scale Livestock Operations—A. Access to Veterinarians
Section III: Challenges for Small-Section III: Challenges for Small-Section III: Challenges for Small-Section III: Challenges for Small-Section III: Challenges for Small-scale Livscale Livscale Livscale Livscale Livesesesesestttttococococock Operk Operk Operk Operk Operationsationsationsationsations
AAAAA. A. A. A. A. Access tccess tccess tccess tccess to Vo Vo Vo Vo Veeeeettttterererererinarinarinarinarinariansiansiansiansians
Animal health is closely tied with productivity
and food safety. Veterinarians, as resources for
animal health, play a critical role in the
productivity of small-scale operations and the
safety of the U.S. food supply. A shortage of
food-animal veterinarians in rural areas is an
important issue that has been discussed in
recent years. In 2010, the USDA implemented a
plan to address veterinary shortages in rural
areas by repaying the student loans of some
veterinarians who practice food-animal medicine
in underserved areas.
1. Distance tonearestveterinarian
All operators were asked about the distance to
the nearest veterinarian that worked with their
type of livestock, regardless of whether or not
the operation actually used that veterinarian.
Overall, 82.0 percent of operations had a
veterinarian that worked with their type of
livestock available within 29 miles of the
operation. In the West region, about one of four
operations (24.2 percent) was located 30 to 99
miles from the nearest veterinarian that worked
with their type of livestock. For 0.9 percent of
operations, no veterinarian was available or the
nearest veterinarian was 300 or more miles away
from the operation. Considering that there are
about 350,000 small-scale livestock operations in
the United States (see Appendix II), this means
that about 3,150 operations (0.9 percent x
350,000) either have no access to a livestock
veterinarian or would have to travel 300 or more
miles to reach one. Of the operations that
reported no veterinarian was available for their
livestock, 25 percent raised “other” livestock
species, such as aquaculture, fur-bearing
animals, or bees (data not shown).
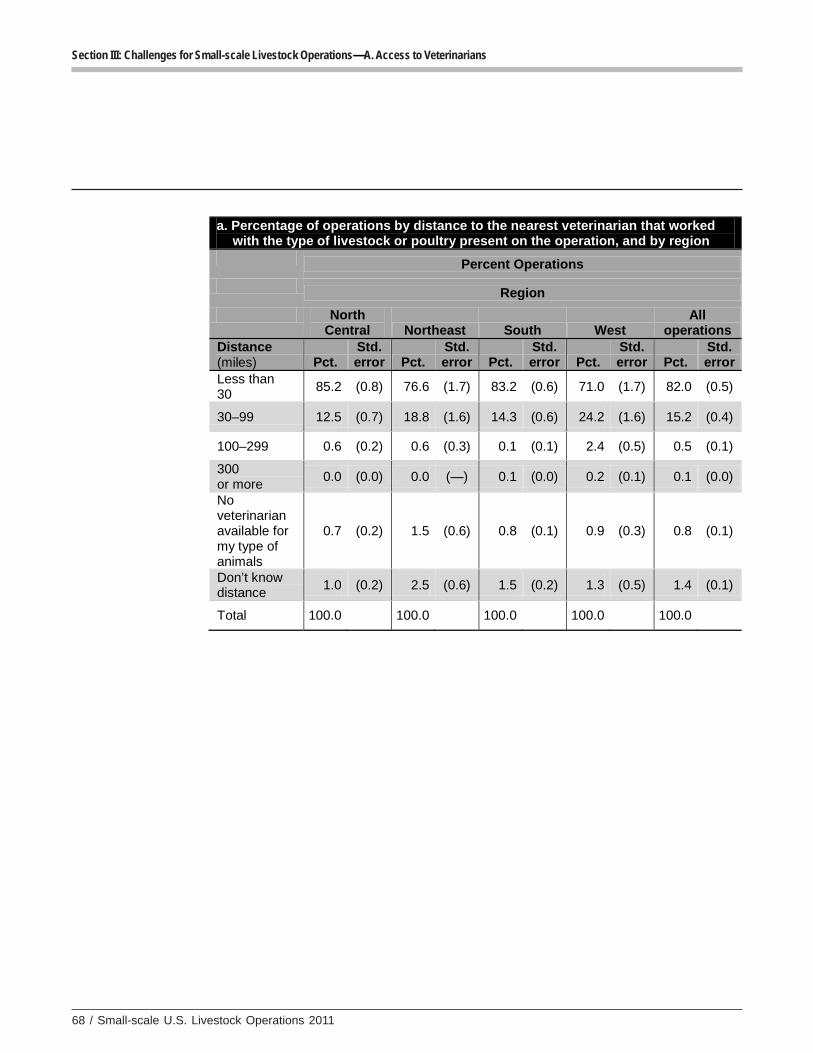
68 / Small-scale U.S. Livestock Operations 2011
Section III: Challenges for Small-scale Livestock Operations—A. Access to Veterinarians
a. Percentage of operations by distance to the nearest veterinarian that worked with the type of livestock or poultry present on the operation, and by region
Percent Operations
Region
North Central Northeast South West
All operations
Distance (miles) Pct.
Std. error Pct.
Std. error Pct.
Std. error Pct.
Std. error Pct.
Std. error
Less than 30
85.2 (0.8) 76.6 (1.7) 83.2 (0.6) 71.0 (1.7) 82.0 (0.5)
30–99 12.5 (0.7) 18.8 (1.6) 14.3 (0.6) 24.2 (1.6) 15.2 (0.4)
100–299 0.6 (0.2) 0.6 (0.3) 0.1 (0.1) 2.4 (0.5) 0.5 (0.1)
300 or more
0.0 (0.0) 0.0 (—) 0.1 (0.0) 0.2 (0.1) 0.1 (0.0)
No veterinarian available for my type of animals
0.7 (0.2) 1.5 (0.6) 0.8 (0.1) 0.9 (0.3) 0.8 (0.1)
Don’t know distance
1.0 (0.2) 2.5 (0.6) 1.5 (0.2) 1.3 (0.5) 1.4 (0.1)
Total 100.0 100.0 100.0 100.0 100.0
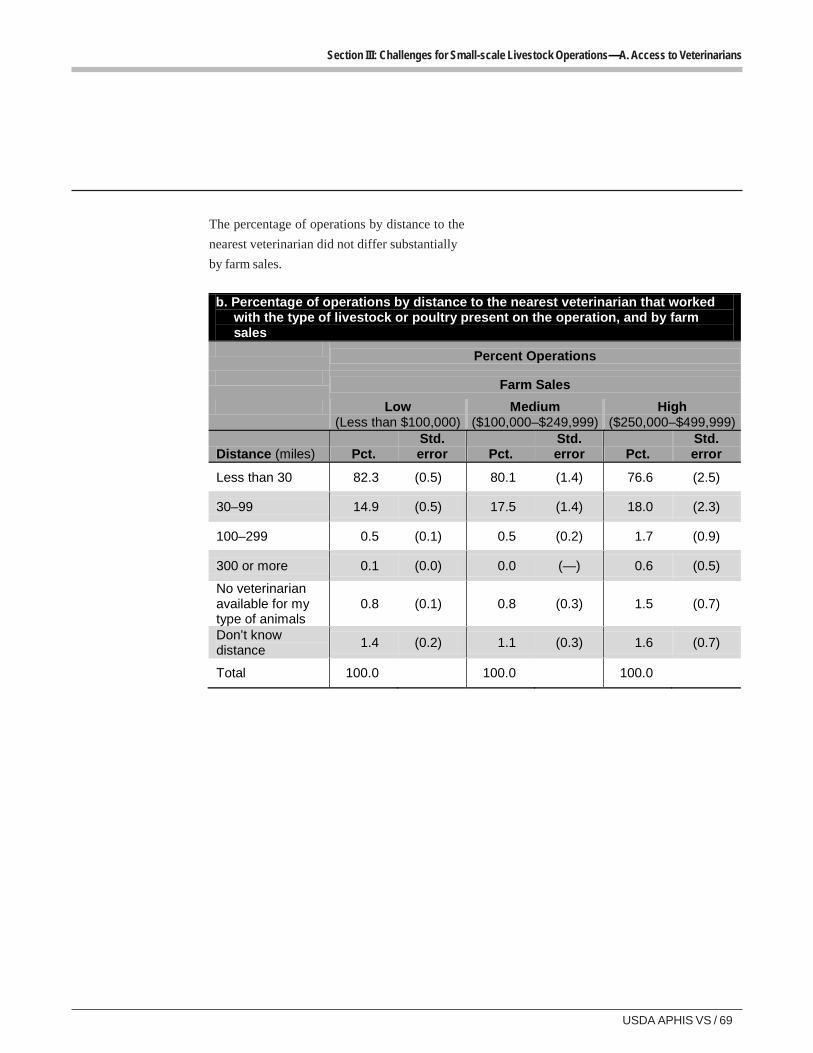
USDA APHIS VS / 69
Section III: Challenges for Small-scale Livestock Operations—A. Access to Veterinarians
The percentage of operations by distance to the
nearest veterinarian did not differ substantially
by farm sales.
b. Percentage of operations by distance to the nearest veterinarian that worked with the type of livestock or poultry present on the operation, and by farm sales
Percent Operations
Farm Sales
Low (Less than $100,000)
Medium ($100,000–$249,999)
High ($250,000–$499,999)
Distance (miles) Pct. Std. error Pct.
Std. error Pct.
Std. error
Less than 30 82.3 (0.5) 80.1 (1.4) 76.6 (2.5)
30–99 14.9 (0.5) 17.5 (1.4) 18.0 (2.3)
100–299 0.5 (0.1) 0.5 (0.2) 1.7 (0.9)
300 or more 0.1 (0.0) 0.0 (—) 0.6 (0.5)
No veterinarian available for my type of animals
0.8 (0.1) 0.8 (0.3) 1.5 (0.7)
Don’t know distance
1.4 (0.2) 1.1 (0.3) 1.6 (0.7)
Total 100.0 100.0 100.0
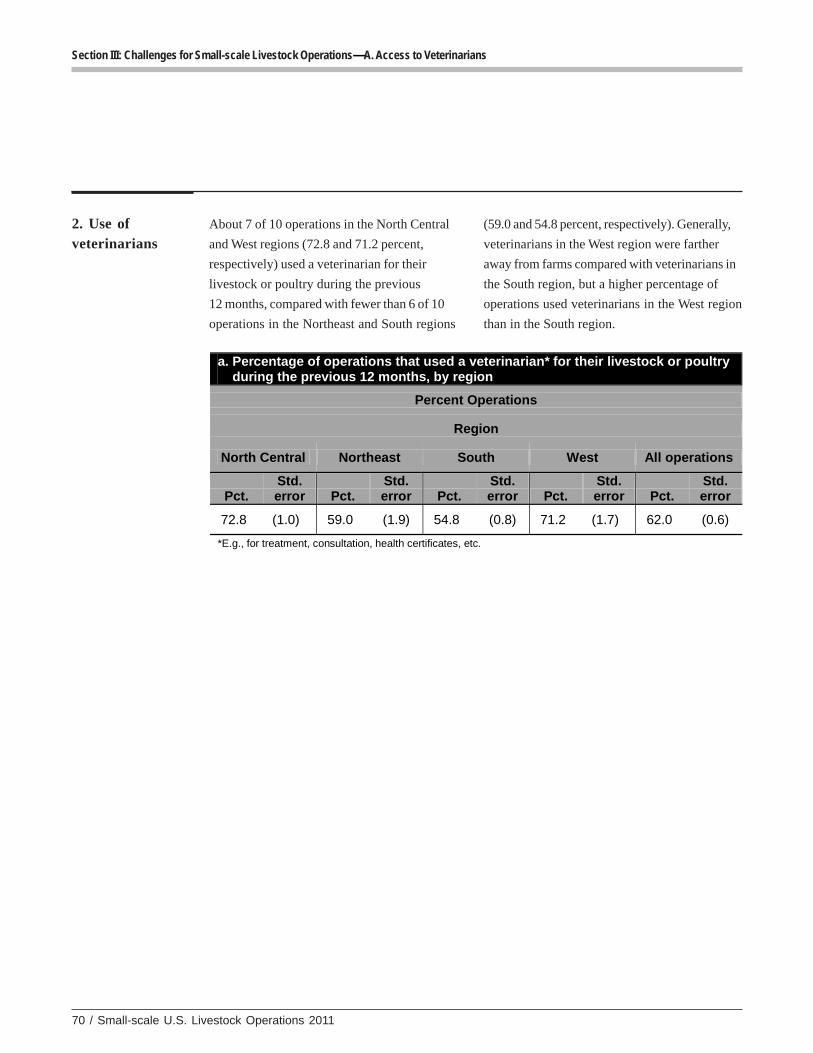
70 / Small-scale U.S. Livestock Operations 2011
Section III: Challenges for Small-scale Livestock Operations—A. Access to Veterinarians
2. Use ofveterinarians
About 7 of 10 operations in the North Central
and West regions (72.8 and 71.2 percent,
respectively) used a veterinarian for their
livestock or poultry during the previous
12 months, compared with fewer than 6 of 10
operations in the Northeast and South regions
(59.0 and 54.8 percent, respectively). Generally,
veterinarians in the West region were farther
away from farms compared with veterinarians in
the South region, but a higher percentage of
operations used veterinarians in the West region
than in the South region.
a. Percentage of operations that used a veterinarian* for their livestock or poultry during the previous 12 months, by region
Percent Operations
Region
North Central Northeast South West All operations
Pct. Std. error Pct.
Std. error Pct.
Std. error Pct.
Std. error Pct.
Std. error
72.8 (1.0) 59.0 (1.9) 54.8 (0.8) 71.2 (1.7) 62.0 (0.6)
*E.g., for treatment, consultation, health certificates, etc.
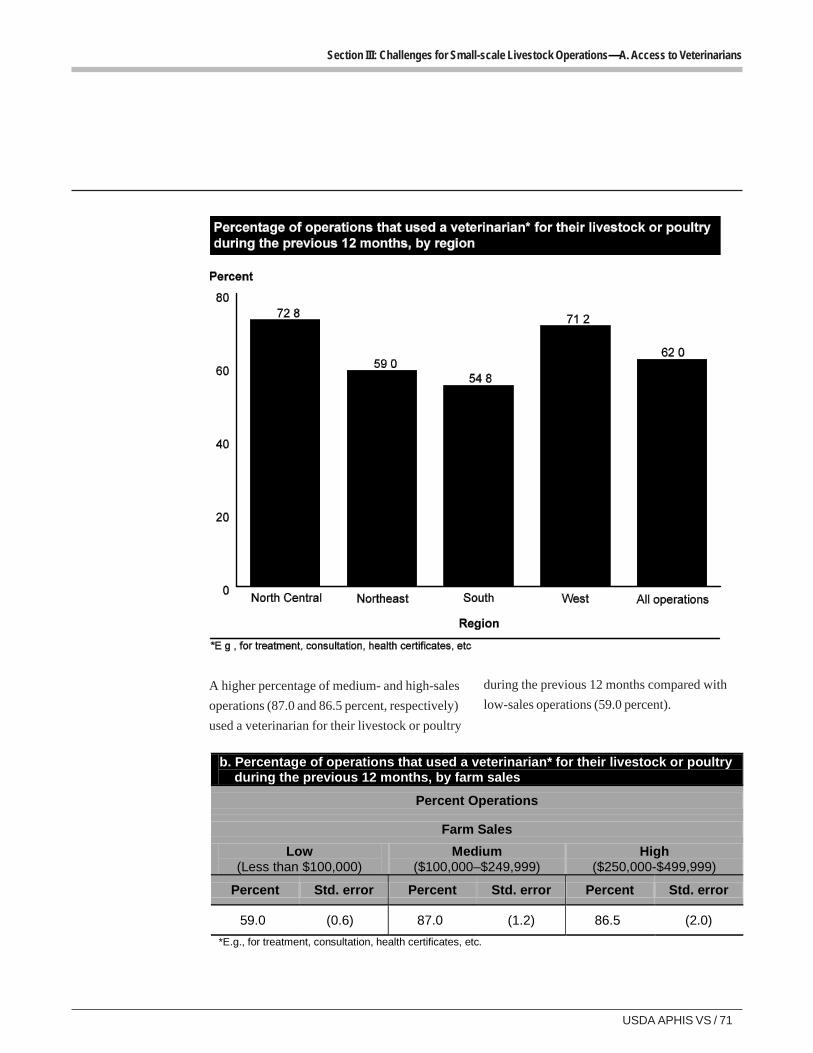
USDA APHIS VS / 71
Section III: Challenges for Small-scale Livestock Operations—A. Access to Veterinarians
A higher percentage of medium- and high-sales
operations (87.0 and 86.5 percent, respectively)
used a veterinarian for their livestock or poultry
during the previous 12 months compared with
low-sales operations (59.0 percent).
b. Percentage of operations that used a veterinarian* for their livestock or poultry during the previous 12 months, by farm sales
Percent Operations
Farm Sales
Low (Less than $100,000)
Medium ($100,000–$249,999)
High ($250,000-$499,999)
Percent Std. error Percent Std. error Percent Std. error
59.0 (0.6) 87.0 (1.2) 86.5 (2.0)
*E.g., for treatment, consultation, health certificates, etc.
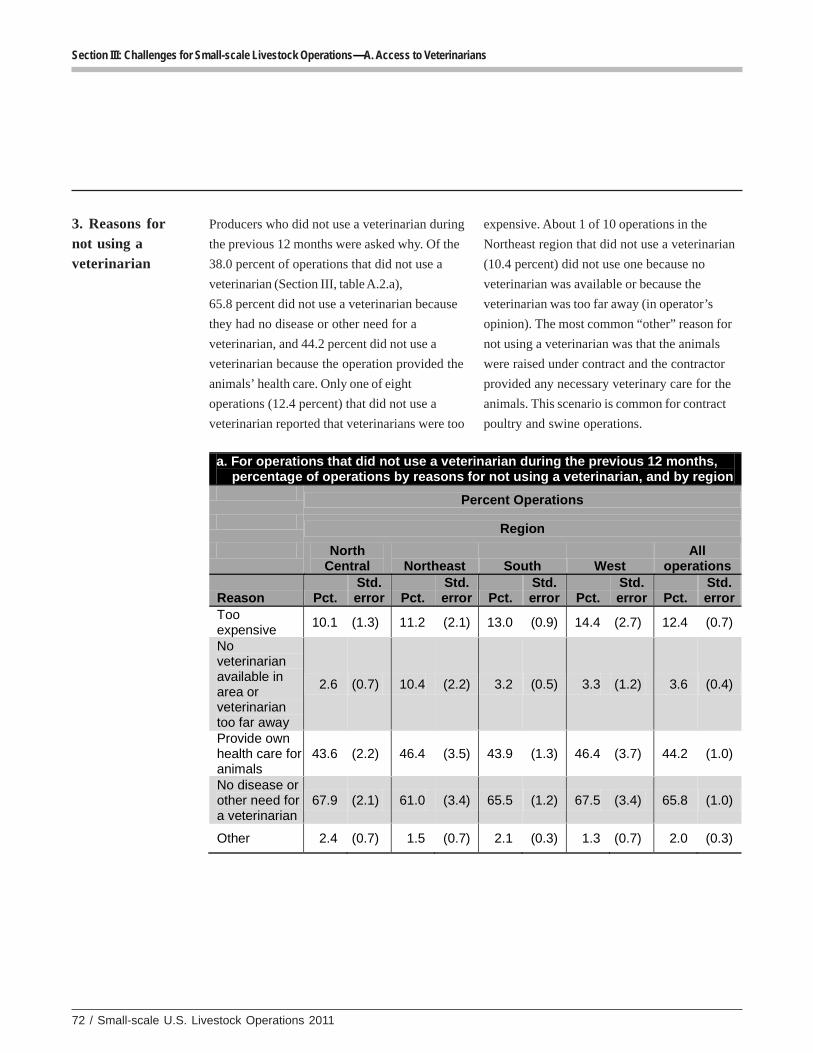
72 / Small-scale U.S. Livestock Operations 2011
Section III: Challenges for Small-scale Livestock Operations—A. Access to Veterinarians
3. Reasons fornot using aveterinarian
Producers who did not use a veterinarian during
the previous 12 months were asked why. Of the
38.0 percent of operations that did not use a
veterinarian (Section III, table A.2.a),
65.8 percent did not use a veterinarian because
they had no disease or other need for a
veterinarian, and 44.2 percent did not use a
veterinarian because the operation provided the
animals’ health care. Only one of eight
operations (12.4 percent) that did not use a
veterinarian reported that veterinarians were too
expensive. About 1 of 10 operations in the
Northeast region that did not use a veterinarian
(10.4 percent) did not use one because no
veterinarian was available or because the
veterinarian was too far away (in operator’s
opinion). The most common “other” reason for
not using a veterinarian was that the animals
were raised under contract and the contractor
provided any necessary veterinary care for the
animals. This scenario is common for contract
poultry and swine operations.
a. For operations that did not use a veterinarian during the previous 12 months, percentage of operations by reasons for not using a veterinarian, and by region
Percent Operations
Region
North Central Northeast South West
All operations
Reason Pct. Std. error Pct.
Std. error Pct.
Std. error Pct.
Std. error Pct.
Std. error
Too expensive
10.1 (1.3) 11.2 (2.1) 13.0 (0.9) 14.4 (2.7) 12.4 (0.7)
No veterinarian available in area or veterinarian too far away
2.6 (0.7) 10.4 (2.2) 3.2 (0.5) 3.3 (1.2) 3.6 (0.4)
Provide own health care for animals
43.6 (2.2) 46.4 (3.5) 43.9 (1.3) 46.4 (3.7) 44.2 (1.0)
No disease or other need for a veterinarian
67.9 (2.1) 61.0 (3.4) 65.5 (1.2) 67.5 (3.4) 65.8 (1.0)
Other 2.4 (0.7) 1.5 (0.7) 2.1 (0.3) 1.3 (0.7) 2.0 (0.3)
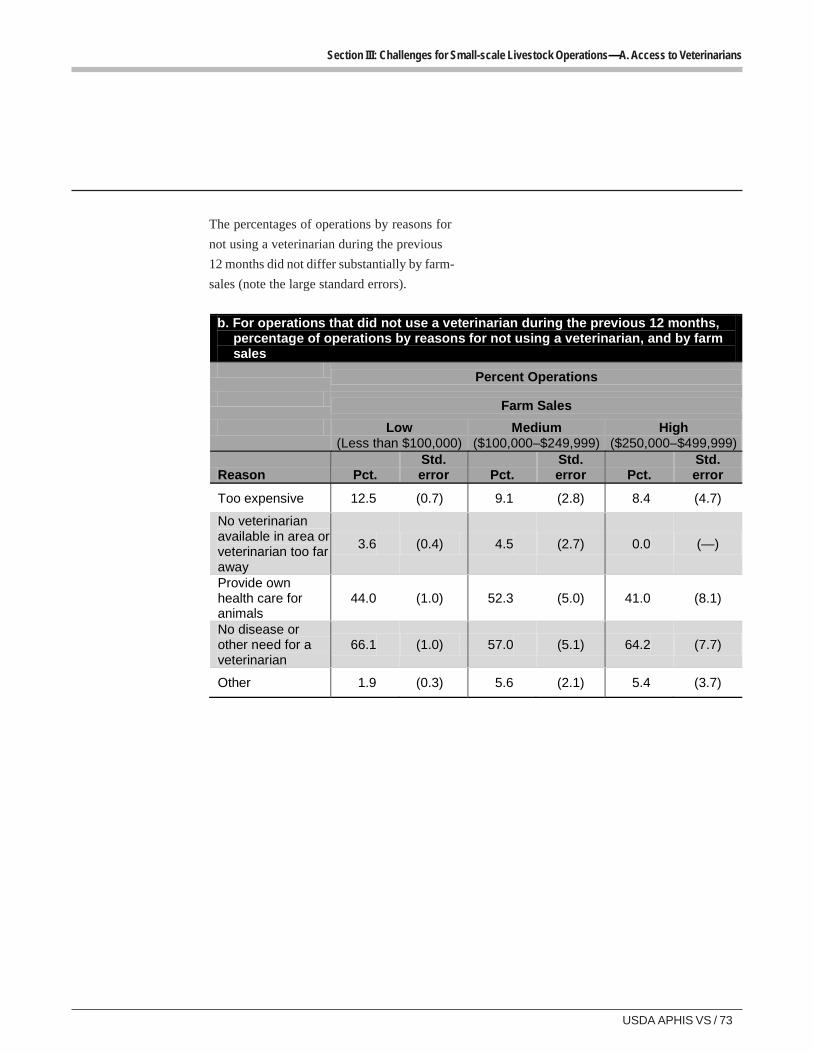
USDA APHIS VS / 73
Section III: Challenges for Small-scale Livestock Operations—A. Access to Veterinarians
The percentages of operations by reasons for
not using a veterinarian during the previous
12 months did not differ substantially by farm-
sales (note the large standard errors).
b. For operations that did not use a veterinarian during the previous 12 months, percentage of operations by reasons for not using a veterinarian, and by farm sales
Percent Operations
Farm Sales
Low (Less than $100,000)
Medium ($100,000–$249,999)
High ($250,000–$499,999)
Reason Pct. Std. error Pct.
Std. error Pct.
Std. error
Too expensive 12.5 (0.7) 9.1 (2.8) 8.4 (4.7)
No veterinarian available in area or veterinarian too far away
3.6 (0.4) 4.5 (2.7) 0.0 (—)
Provide own health care for animals
44.0 (1.0) 52.3 (5.0) 41.0 (8.1)
No disease or other need for a veterinarian
66.1 (1.0) 57.0 (5.1) 64.2 (7.7)
Other 1.9 (0.3) 5.6 (2.1) 5.4 (3.7)
74 / Small-scale U.S. Livestock Operations 2011
Section III: Challenges for Small-scale Livestock Operations—B. Access to Business Resources
B. AB. AB. AB. AB. Access tccess tccess tccess tccess to Business Ro Business Ro Business Ro Business Ro Business Resouresouresouresouresourcescescescesces
1. Proximity tourban areas
Rural urban continuum codes are assigned to
each U.S. county based on Census data and are
intended to reflect a county’s level of
urbanization and proximity to urban areas. Some
business resources for small-scale livestock
operations might be more readily available near
urban areas. For example, opportunities for
direct marketing to consumers through farmer’s
markets or Community Supported Agriculture
might be more prevalent for operations in close
proximity to moderately sized urban areas. See
Terms Used in this Report, p 2 for more
information on rural urban continuum codes.
Overall, one of four operations (23.4 percent)
were located in counties with an urban
population of 2,500 to 19,999 and were adjacent
to a metropolitan area (rural-urban classification
code 6). About 4 of 10 operations (39.2 percent)
were located in metropolitan counties (rural-
urban classification code 1, 2, or 3). The South
region had the highest percentage of operations
located in metropolitan counties with a
population of 1 million or more (rural-urban
classification code 1).
The West and North Central regions had a
higher percentage of operations in completely
rural counties (rural-urban classification code 9;
fewer than 2,500 urban population and not
adjacent to a metropolitan area), compared with
the South and Northeast regions. The
percentage of operations located in completely
rural counties (rural-urban classification code 9)
ranged from 2.3 percent of operations in the
Northeast region to 13.3 percent of operations in
the North Central region. This finding might be
related to the findings in Section I, table B.2.a.,
in which a higher percentage of operations in
the Northeast region than in the North Central
region marketed animals or animal products
directly to individuals/consumers, or directly to
restaurants/institutions. These marketing
opportunities may not be as readily available to
operations in highly rural counties. Further data
exploration (not shown in table) confirmed that a
higher percentage of operations in metro
counties (code 1, 2, or 3) than in rural counties
(code 8 or 9) used direct marketing (29.3 and
23.0 percent of operations, respectively) to
consumers, health food/specialty stores, or
restaurants/institutions.
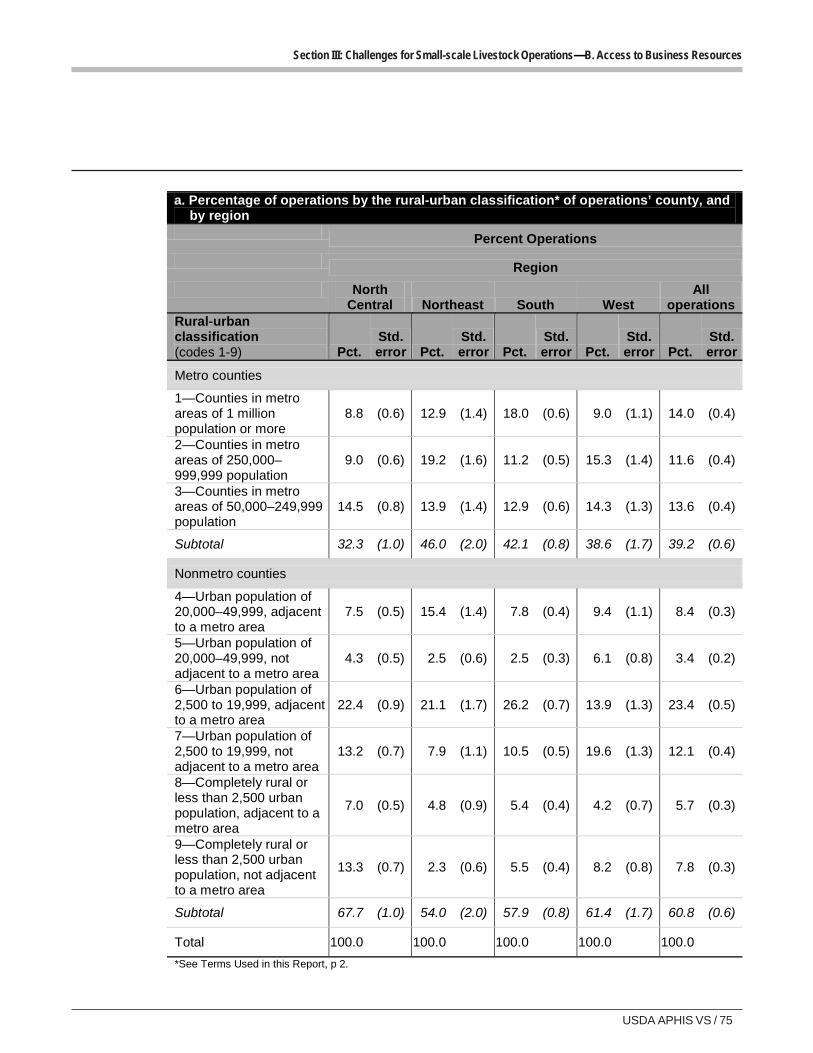
USDA APHIS VS / 75
Section III: Challenges for Small-scale Livestock Operations—B. Access to Business Resources
a. Percentage of operations by the rural-urban classification* of operations’ county, and by region
Percent Operations
Region
North Central Northeast South West
All operations
Rural-urban classification (codes 1-9) Pct.
Std. error Pct.
Std. error Pct.
Std. error Pct.
Std. error Pct.
Std. error
Metro counties
1—Counties in metro areas of 1 million population or more
8.8 (0.6) 12.9 (1.4) 18.0 (0.6) 9.0 (1.1) 14.0 (0.4)
2—Counties in metro areas of 250,000– 999,999 population
9.0 (0.6) 19.2 (1.6) 11.2 (0.5) 15.3 (1.4) 11.6 (0.4)
3—Counties in metro areas of 50,000–249,999 population
14.5 (0.8) 13.9 (1.4) 12.9 (0.6) 14.3 (1.3) 13.6 (0.4)
Subtotal 32.3 (1.0) 46.0 (2.0) 42.1 (0.8) 38.6 (1.7) 39.2 (0.6)
Nonmetro counties
4—Urban population of 20,000–49,999, adjacent to a metro area
7.5 (0.5) 15.4 (1.4) 7.8 (0.4) 9.4 (1.1) 8.4 (0.3)
5—Urban population of 20,000–49,999, not adjacent to a metro area
4.3 (0.5) 2.5 (0.6) 2.5 (0.3) 6.1 (0.8) 3.4 (0.2)
6—Urban population of 2,500 to 19,999, adjacent to a metro area
22.4 (0.9) 21.1 (1.7) 26.2 (0.7) 13.9 (1.3) 23.4 (0.5)
7—Urban population of 2,500 to 19,999, not adjacent to a metro area
13.2 (0.7) 7.9 (1.1) 10.5 (0.5) 19.6 (1.3) 12.1 (0.4)
8—Completely rural or less than 2,500 urban population, adjacent to a metro area
7.0 (0.5) 4.8 (0.9) 5.4 (0.4) 4.2 (0.7) 5.7 (0.3)
9—Completely rural or less than 2,500 urban population, not adjacent to a metro area
13.3 (0.7) 2.3 (0.6) 5.5 (0.4) 8.2 (0.8) 7.8 (0.3)
Subtotal 67.7 (1.0) 54.0 (2.0) 57.9 (0.8) 61.4 (1.7) 60.8 (0.6)
Total 100.0 100.0 100.0 100.0 100.0
*See Terms Used in this Report, p 2.
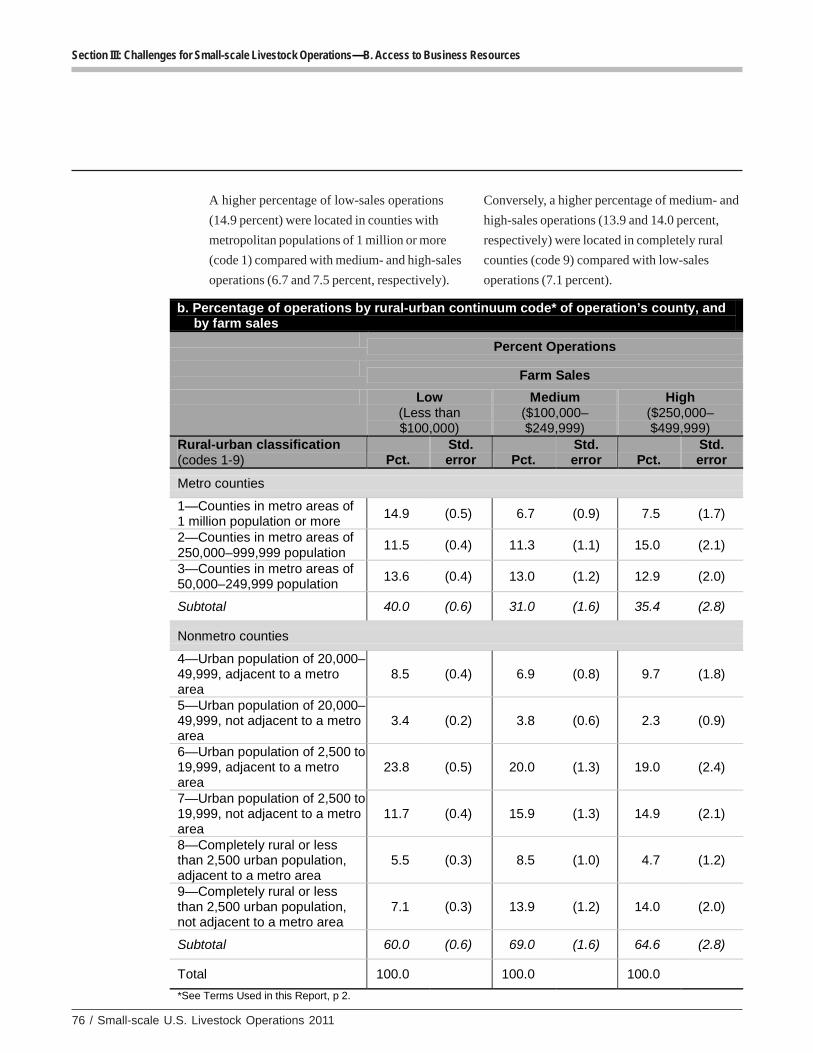
76 / Small-scale U.S. Livestock Operations 2011
Section III: Challenges for Small-scale Livestock Operations—B. Access to Business Resources
A higher percentage of low-sales operations
(14.9 percent) were located in counties with
metropolitan populations of 1 million or more
(code 1) compared with medium- and high-sales
operations (6.7 and 7.5 percent, respectively).
Conversely, a higher percentage of medium- and
high-sales operations (13.9 and 14.0 percent,
respectively) were located in completely rural
counties (code 9) compared with low-sales
operations (7.1 percent).
b. Percentage of operations by rural-urban continuum code* of operation’s county, and by farm sales
Percent Operations
Farm Sales
Low (Less than $100,000)
Medium ($100,000–$249,999)
High ($250,000–$499,999)
Rural-urban classification (codes 1-9) Pct.
Std. error Pct.
Std. error Pct.
Std. error
Metro counties
1—Counties in metro areas of 1 million population or more
14.9 (0.5) 6.7 (0.9) 7.5 (1.7)
2—Counties in metro areas of 250,000–999,999 population
11.5 (0.4) 11.3 (1.1) 15.0 (2.1)
3—Counties in metro areas of 50,000–249,999 population
13.6 (0.4) 13.0 (1.2) 12.9 (2.0)
Subtotal 40.0 (0.6) 31.0 (1.6) 35.4 (2.8)
Nonmetro counties
4—Urban population of 20,000–49,999, adjacent to a metro area
8.5 (0.4) 6.9 (0.8) 9.7 (1.8)
5—Urban population of 20,000–49,999, not adjacent to a metro area
3.4 (0.2) 3.8 (0.6) 2.3 (0.9)
6—Urban population of 2,500 to 19,999, adjacent to a metro area
23.8 (0.5) 20.0 (1.3) 19.0 (2.4)
7—Urban population of 2,500 to 19,999, not adjacent to a metro area
11.7 (0.4) 15.9 (1.3) 14.9 (2.1)
8—Completely rural or less than 2,500 urban population, adjacent to a metro area
5.5 (0.3) 8.5 (1.0) 4.7 (1.2)
9—Completely rural or less than 2,500 urban population, not adjacent to a metro area
7.1 (0.3) 13.9 (1.2) 14.0 (2.0)
Subtotal 60.0 (0.6) 69.0 (1.6) 64.6 (2.8)
Total 100.0 100.0 100.0
*See Terms Used in this Report, p 2.
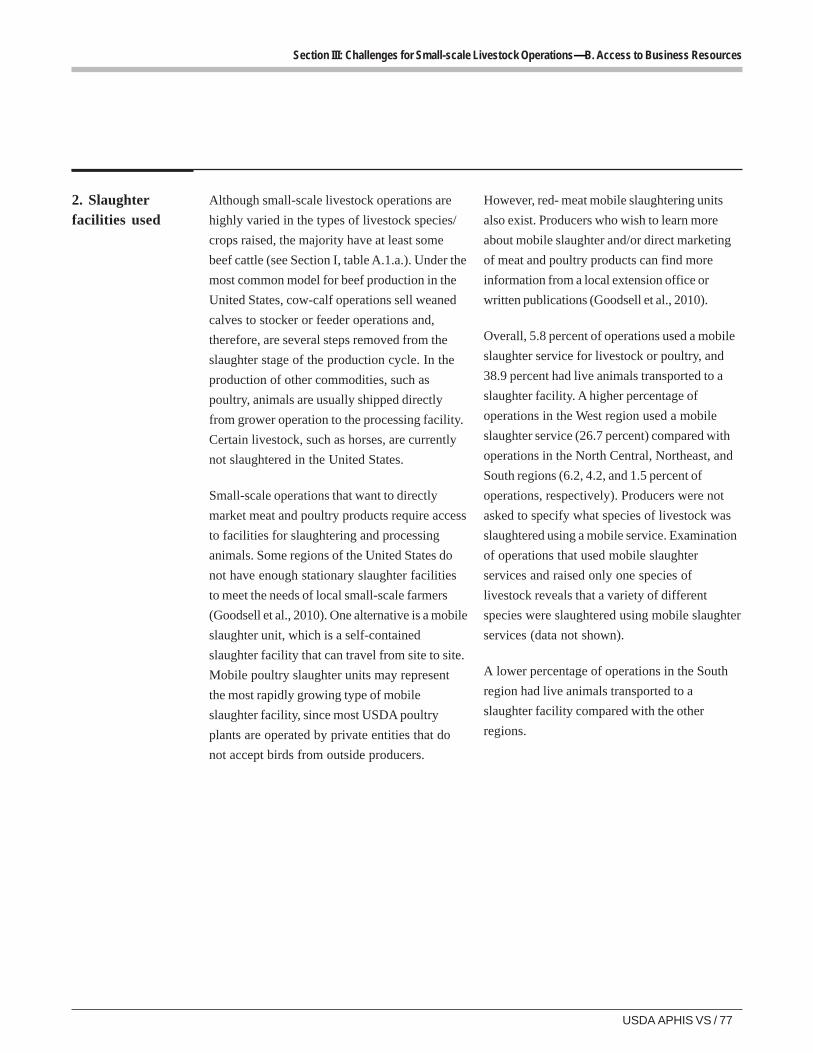
USDA APHIS VS / 77
Section III: Challenges for Small-scale Livestock Operations—B. Access to Business Resources
2. Slaughterfacilities used
Although small-scale livestock operations are
highly varied in the types of livestock species/
crops raised, the majority have at least some
beef cattle (see Section I, table A.1.a.). Under the
most common model for beef production in the
United States, cow-calf operations sell weaned
calves to stocker or feeder operations and,
therefore, are several steps removed from the
slaughter stage of the production cycle. In the
production of other commodities, such as
poultry, animals are usually shipped directly
from grower operation to the processing facility.
Certain livestock, such as horses, are currently
not slaughtered in the United States.
Small-scale operations that want to directly
market meat and poultry products require access
to facilities for slaughtering and processing
animals. Some regions of the United States do
not have enough stationary slaughter facilities
to meet the needs of local small-scale farmers
(Goodsell et al., 2010). One alternative is a mobile
slaughter unit, which is a self-contained
slaughter facility that can travel from site to site.
Mobile poultry slaughter units may represent
the most rapidly growing type of mobile
slaughter facility, since most USDA poultry
plants are operated by private entities that do
not accept birds from outside producers.
However, red- meat mobile slaughtering units
also exist. Producers who wish to learn more
about mobile slaughter and/or direct marketing
of meat and poultry products can find more
information from a local extension office or
written publications (Goodsell et al., 2010).
Overall, 5.8 percent of operations used a mobile
slaughter service for livestock or poultry, and
38.9 percent had live animals transported to a
slaughter facility. A higher percentage of
operations in the West region used a mobile
slaughter service (26.7 percent) compared with
operations in the North Central, Northeast, and
South regions (6.2, 4.2, and 1.5 percent of
operations, respectively). Producers were not
asked to specify what species of livestock was
slaughtered using a mobile service. Examination
of operations that used mobile slaughter
services and raised only one species of
livestock reveals that a variety of different
species were slaughtered using mobile slaughter
services (data not shown).
A lower percentage of operations in the South
region had live animals transported to a
slaughter facility compared with the other
regions.
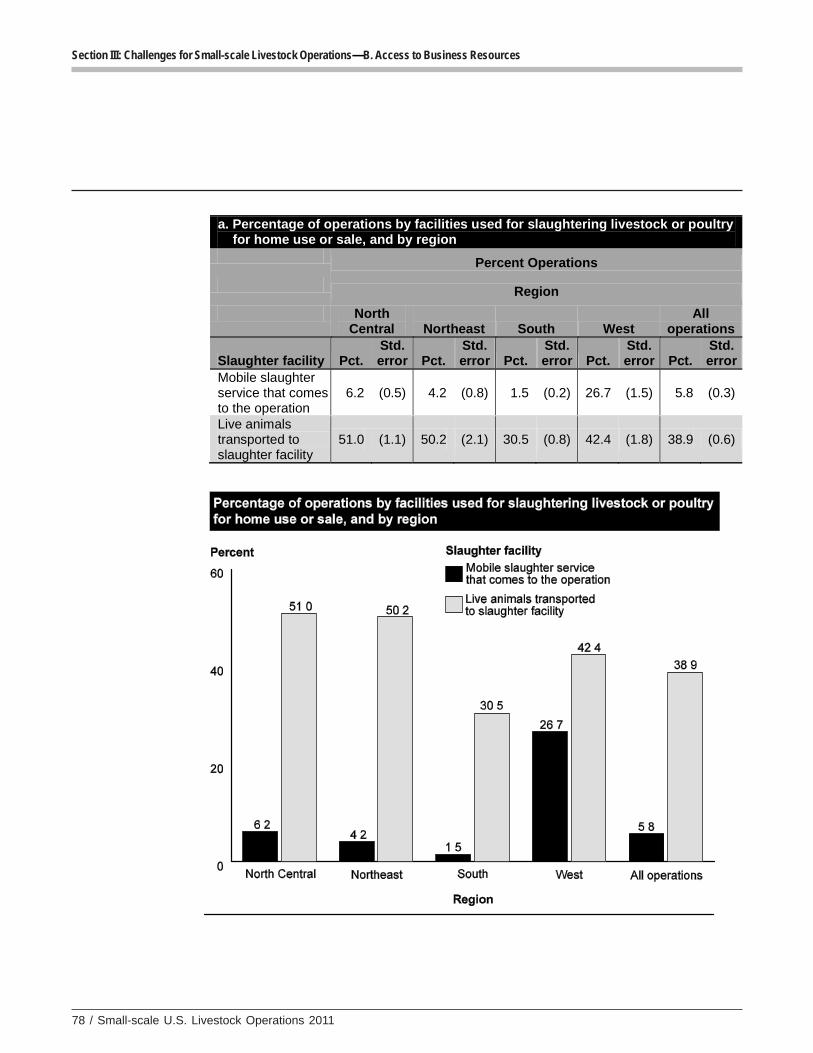
78 / Small-scale U.S. Livestock Operations 2011
Section III: Challenges for Small-scale Livestock Operations—B. Access to Business Resources
a. Percentage of operations by facilities used for slaughtering livestock or poultry for home use or sale, and by region
Percent Operations
Region
North Central Northeast South West
All operations
Slaughter facility Pct. Std. error Pct.
Std. error Pct.
Std. error Pct.
Std. error Pct.
Std. error
Mobile slaughter service that comes to the operation
6.2 (0.5) 4.2 (0.8) 1.5 (0.2) 26.7 (1.5) 5.8 (0.3)
Live animals transported to slaughter facility
51.0 (1.1) 50.2 (2.1) 30.5 (0.8) 42.4 (1.8) 38.9 (0.6)
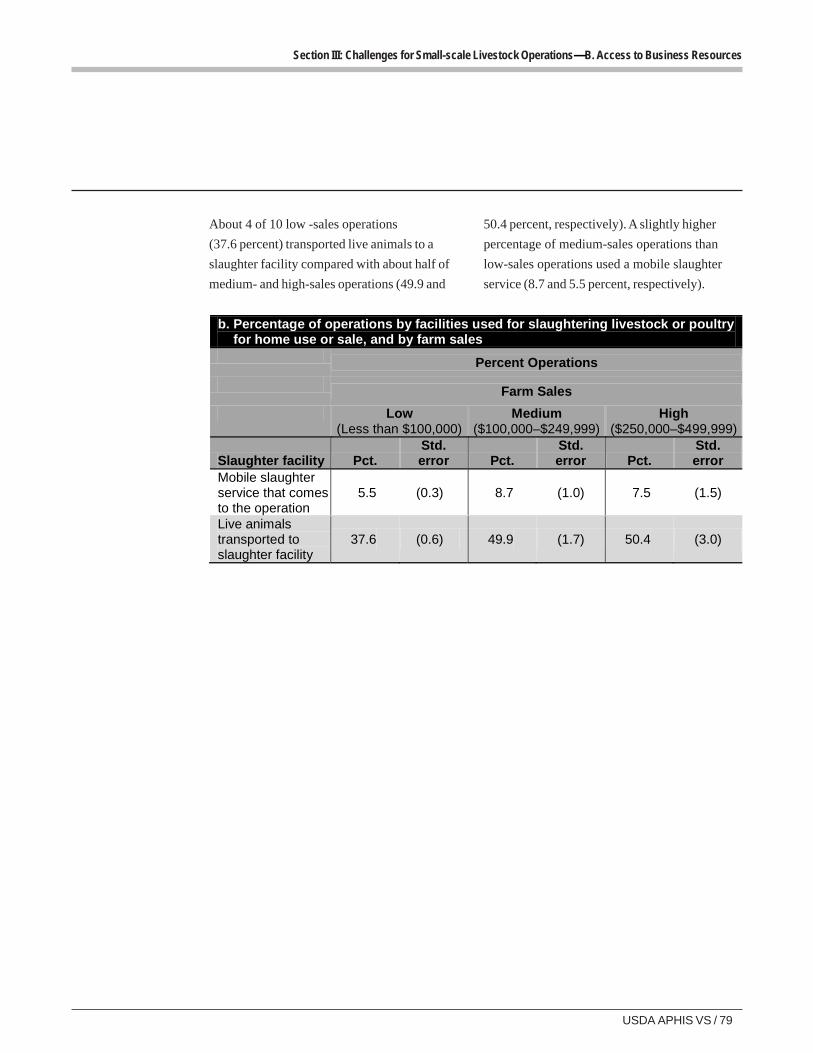
USDA APHIS VS / 79
Section III: Challenges for Small-scale Livestock Operations—B. Access to Business Resources
About 4 of 10 low -sales operations
(37.6 percent) transported live animals to a
slaughter facility compared with about half of
medium- and high-sales operations (49.9 and
50.4 percent, respectively). A slightly higher
percentage of medium-sales operations than
low-sales operations used a mobile slaughter
service (8.7 and 5.5 percent, respectively).
b. Percentage of operations by facilities used for slaughtering livestock or poultry for home use or sale, and by farm sales
Percent Operations
Farm Sales
Low (Less than $100,000)
Medium ($100,000–$249,999)
High ($250,000–$499,999)
Slaughter facility Pct. Std. error Pct.
Std. error Pct.
Std. error
Mobile slaughter service that comes to the operation
5.5 (0.3) 8.7 (1.0) 7.5 (1.5)
Live animals transported to slaughter facility
37.6 (0.6) 49.9 (1.7) 50.4 (3.0)
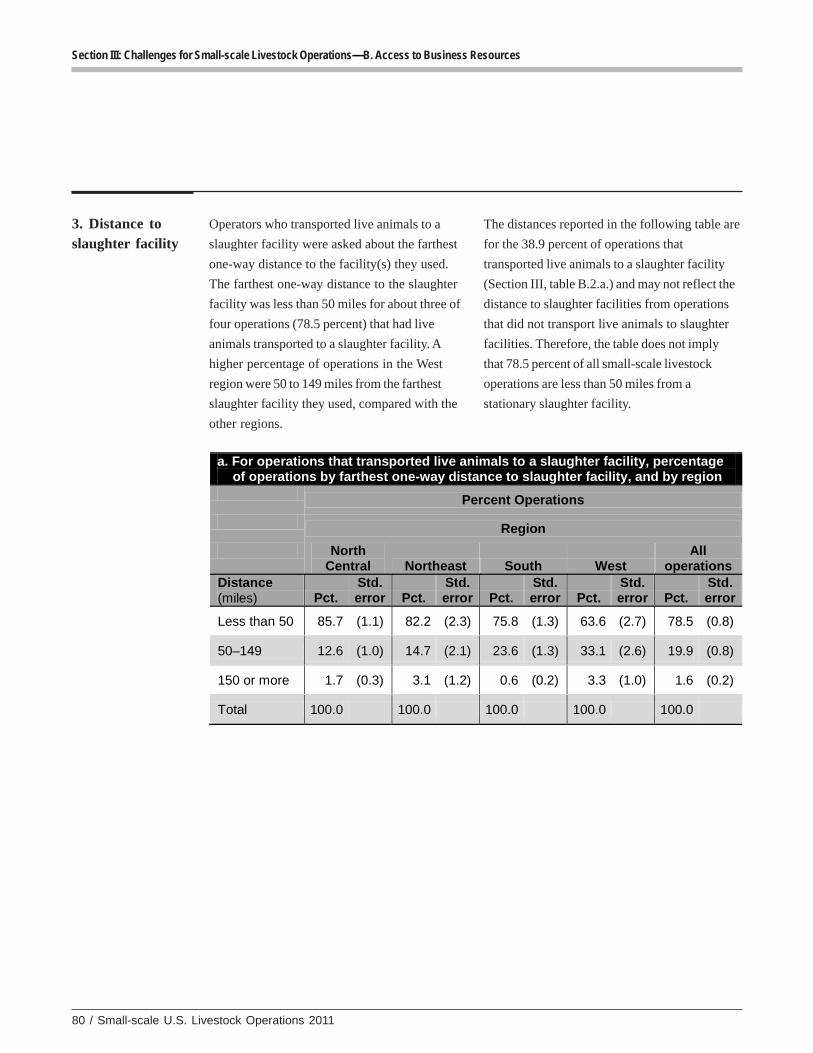
80 / Small-scale U.S. Livestock Operations 2011
Section III: Challenges for Small-scale Livestock Operations—B. Access to Business Resources
3. Distance toslaughter facility
Operators who transported live animals to a
slaughter facility were asked about the farthest
one-way distance to the facility(s) they used.
The farthest one-way distance to the slaughter
facility was less than 50 miles for about three of
four operations (78.5 percent) that had live
animals transported to a slaughter facility. A
higher percentage of operations in the West
region were 50 to 149 miles from the farthest
slaughter facility they used, compared with the
other regions.
The distances reported in the following table are
for the 38.9 percent of operations that
transported live animals to a slaughter facility
(Section III, table B.2.a.) and may not reflect the
distance to slaughter facilities from operations
that did not transport live animals to slaughter
facilities. Therefore, the table does not imply
that 78.5 percent of all small-scale livestock
operations are less than 50 miles from a
stationary slaughter facility.
a. For operations that transported live animals to a slaughter facility, percentage of operations by farthest one-way distance to slaughter facility, and by region
Percent Operations
Region
North Central Northeast South West
All operations
Distance (miles) Pct.
Std. error Pct.
Std. error Pct.
Std. error Pct.
Std. error Pct.
Std. error
Less than 50 85.7 (1.1) 82.2 (2.3) 75.8 (1.3) 63.6 (2.7) 78.5 (0.8)
50–149 12.6 (1.0) 14.7 (2.1) 23.6 (1.3) 33.1 (2.6) 19.9 (0.8)
150 or more 1.7 (0.3) 3.1 (1.2) 0.6 (0.2) 3.3 (1.0) 1.6 (0.2)
Total 100.0 100.0 100.0 100.0 100.0
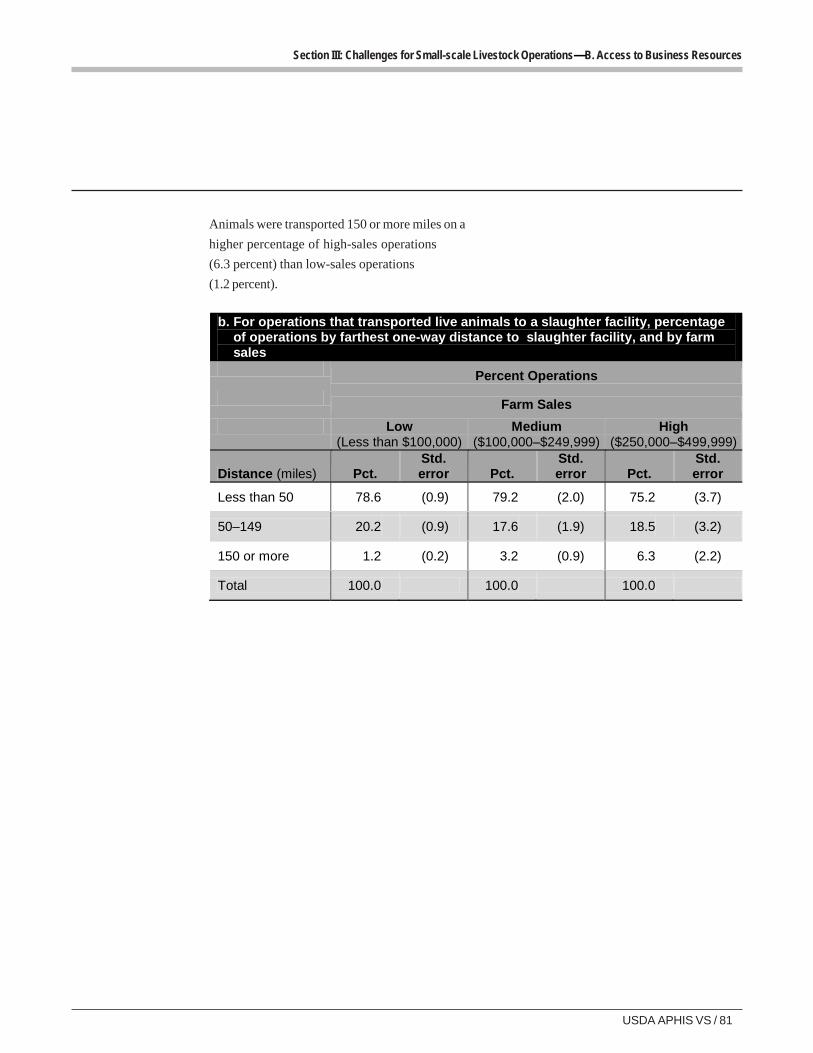
USDA APHIS VS / 81
Section III: Challenges for Small-scale Livestock Operations—B. Access to Business Resources
Animals were transported 150 or more miles on a
higher percentage of high-sales operations
(6.3 percent) than low-sales operations
(1.2 percent).
b. For operations that transported live animals to a slaughter facility, percentage of operations by farthest one-way distance to slaughter facility, and by farm sales
Percent Operations
Farm Sales
Low (Less than $100,000)
Medium ($100,000–$249,999)
High ($250,000–$499,999)
Distance (miles) Pct. Std. error Pct.
Std. error Pct.
Std. error
Less than 50 78.6 (0.9) 79.2 (2.0) 75.2 (3.7)
50–149 20.2 (0.9) 17.6 (1.9) 18.5 (3.2)
150 or more 1.2 (0.2) 3.2 (0.9) 6.3 (2.2)
Total 100.0 100.0 100.0
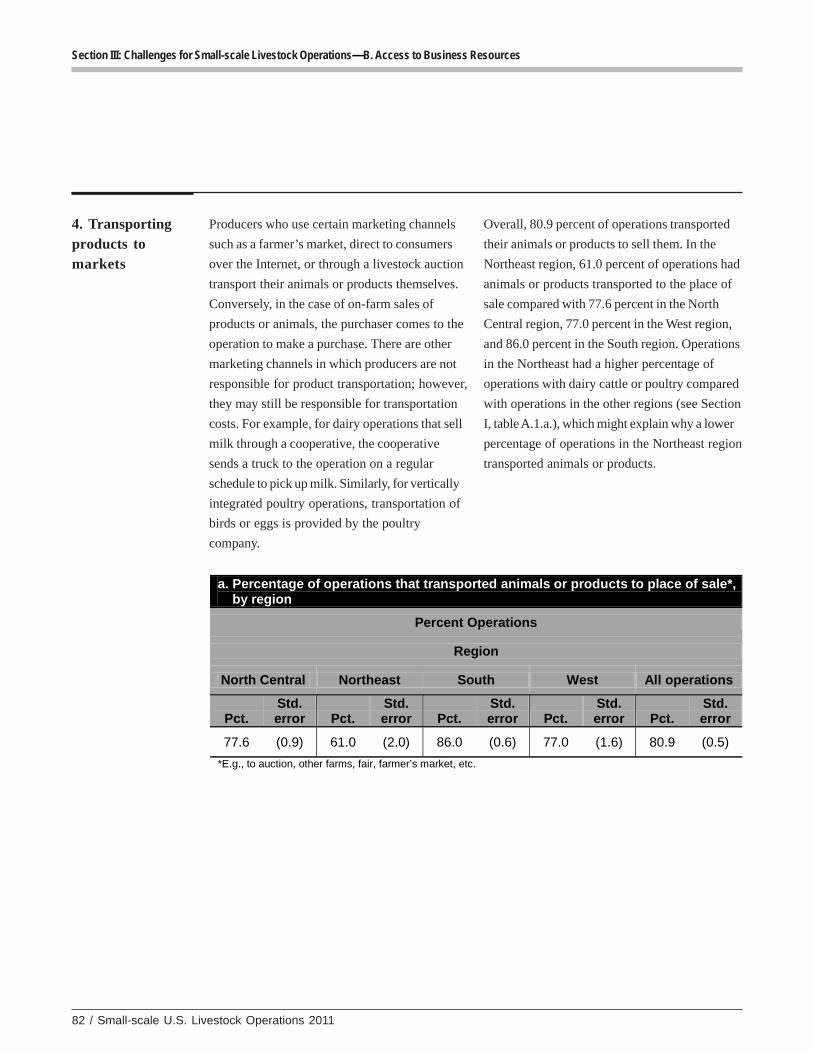
82 / Small-scale U.S. Livestock Operations 2011
Section III: Challenges for Small-scale Livestock Operations—B. Access to Business Resources
4. Transportingproducts tomarkets
Producers who use certain marketing channels
such as a farmer’s market, direct to consumers
over the Internet, or through a livestock auction
transport their animals or products themselves.
Conversely, in the case of on-farm sales of
products or animals, the purchaser comes to the
operation to make a purchase. There are other
marketing channels in which producers are not
responsible for product transportation; however,
they may still be responsible for transportation
costs. For example, for dairy operations that sell
milk through a cooperative, the cooperative
sends a truck to the operation on a regular
schedule to pick up milk. Similarly, for vertically
integrated poultry operations, transportation of
birds or eggs is provided by the poultry
company.
Overall, 80.9 percent of operations transported
their animals or products to sell them. In the
Northeast region, 61.0 percent of operations had
animals or products transported to the place of
sale compared with 77.6 percent in the North
Central region, 77.0 percent in the West region,
and 86.0 percent in the South region. Operations
in the Northeast had a higher percentage of
operations with dairy cattle or poultry compared
with operations in the other regions (see Section
I, table A.1.a.), which might explain why a lower
percentage of operations in the Northeast region
transported animals or products.
a. Percentage of operations that transported animals or products to place of sale*, by region
Percent Operations
Region
North Central Northeast South West All operations
Pct. Std. error Pct.
Std. error Pct.
Std. error Pct.
Std. error Pct.
Std. error
77.6 (0.9) 61.0 (2.0) 86.0 (0.6) 77.0 (1.6) 80.9 (0.5)
*E.g., to auction, other farms, fair, farmer’s market, etc.
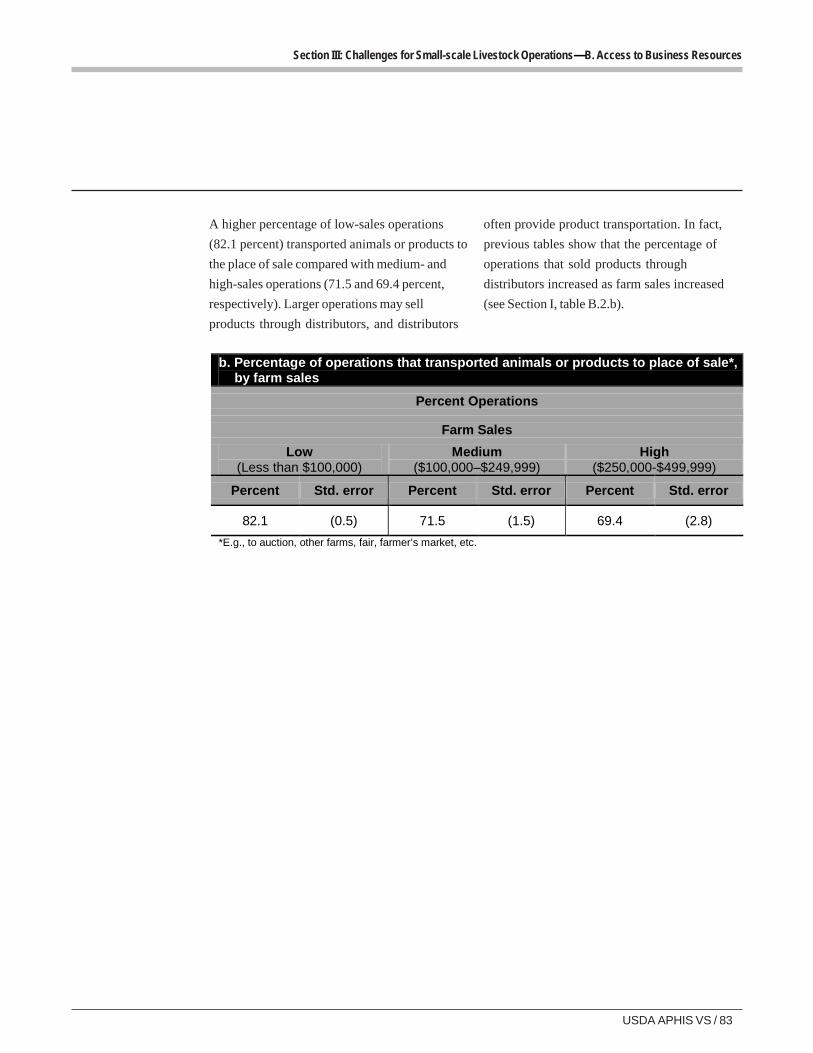
USDA APHIS VS / 83
Section III: Challenges for Small-scale Livestock Operations—B. Access to Business Resources
A higher percentage of low-sales operations
(82.1 percent) transported animals or products to
the place of sale compared with medium- and
high-sales operations (71.5 and 69.4 percent,
respectively). Larger operations may sell
products through distributors, and distributors
often provide product transportation. In fact,
previous tables show that the percentage of
operations that sold products through
distributors increased as farm sales increased
(see Section I, table B.2.b).
b. Percentage of operations that transported animals or products to place of sale*, by farm sales
Percent Operations
Farm Sales
Low (Less than $100,000)
Medium ($100,000–$249,999)
High ($250,000-$499,999)
Percent Std. error Percent Std. error Percent Std. error
82.1 (0.5) 71.5 (1.5) 69.4 (2.8)
*E.g., to auction, other farms, fair, farmer’s market, etc.
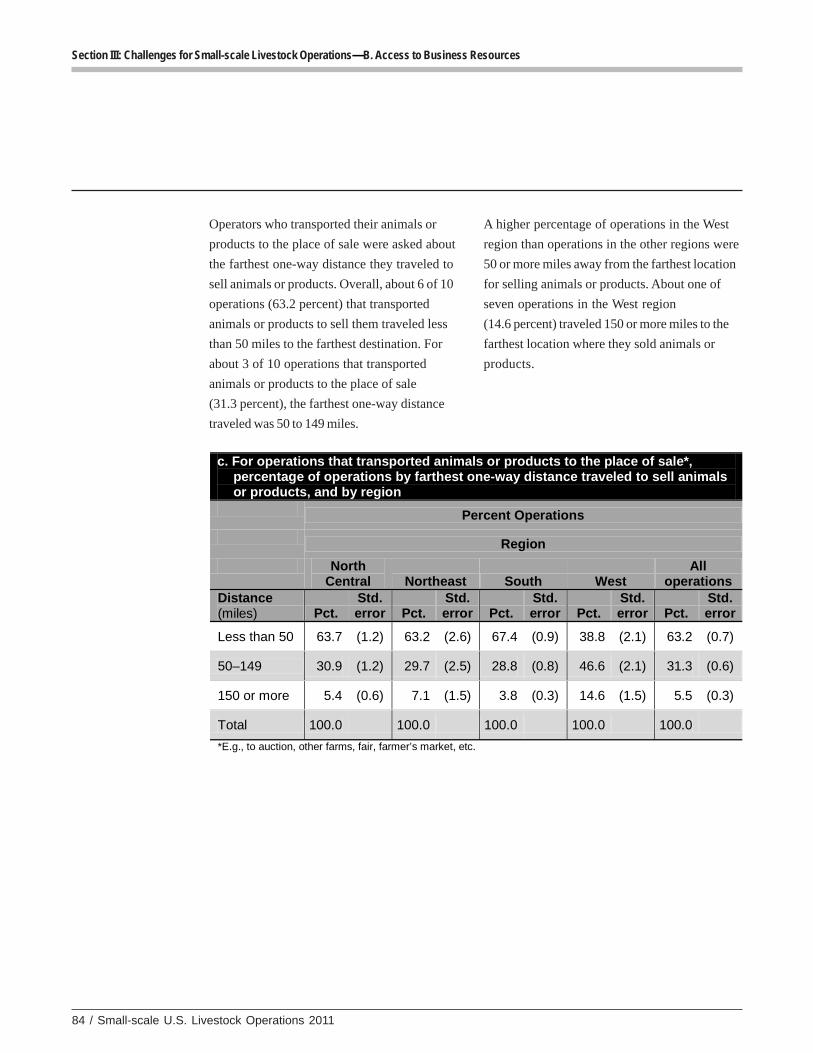
84 / Small-scale U.S. Livestock Operations 2011
Section III: Challenges for Small-scale Livestock Operations—B. Access to Business Resources
Operators who transported their animals or
products to the place of sale were asked about
the farthest one-way distance they traveled to
sell animals or products. Overall, about 6 of 10
operations (63.2 percent) that transported
animals or products to sell them traveled less
than 50 miles to the farthest destination. For
about 3 of 10 operations that transported
animals or products to the place of sale
(31.3 percent), the farthest one-way distance
traveled was 50 to 149 miles.
A higher percentage of operations in the West
region than operations in the other regions were
50 or more miles away from the farthest location
for selling animals or products. About one of
seven operations in the West region
(14.6 percent) traveled 150 or more miles to the
farthest location where they sold animals or
products.
c. For operations that transported animals or products to the place of sale*, percentage of operations by farthest one-way distance traveled to sell animals or products, and by region
Percent Operations
Region
North Central Northeast South West
All operations
Distance (miles) Pct.
Std. error Pct.
Std. error Pct.
Std. error Pct.
Std. error Pct.
Std. error
Less than 50 63.7 (1.2) 63.2 (2.6) 67.4 (0.9) 38.8 (2.1) 63.2 (0.7)
50–149 30.9 (1.2) 29.7 (2.5) 28.8 (0.8) 46.6 (2.1) 31.3 (0.6)
150 or more 5.4 (0.6) 7.1 (1.5) 3.8 (0.3) 14.6 (1.5) 5.5 (0.3)
Total 100.0 100.0 100.0 100.0 100.0
*E.g., to auction, other farms, fair, farmer’s market, etc.
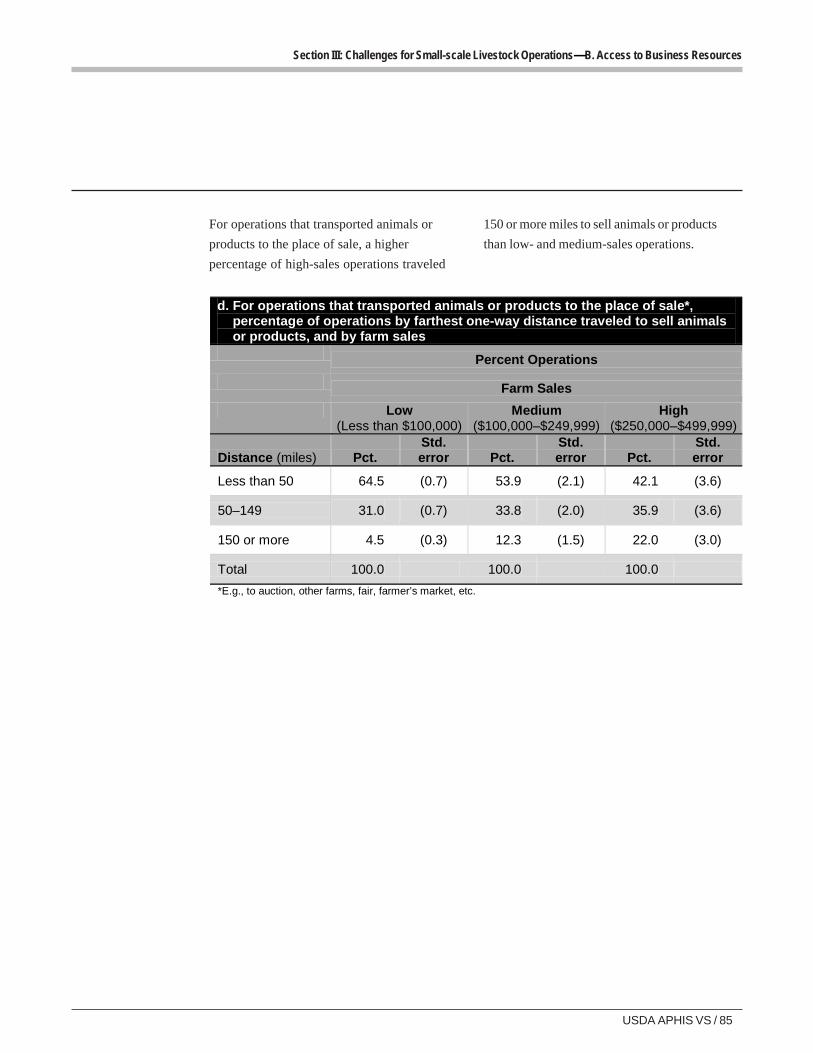
USDA APHIS VS / 85
Section III: Challenges for Small-scale Livestock Operations—B. Access to Business Resources
For operations that transported animals or
products to the place of sale, a higher
percentage of high-sales operations traveled
150 or more miles to sell animals or products
than low- and medium-sales operations.
d. For operations that transported animals or products to the place of sale*, percentage of operations by farthest one-way distance traveled to sell animals or products, and by farm sales
Percent Operations
Farm Sales
Low (Less than $100,000)
Medium ($100,000–$249,999)
High ($250,000–$499,999)
Distance (miles) Pct. Std. error Pct.
Std. error Pct.
Std. error
Less than 50 64.5 (0.7) 53.9 (2.1) 42.1 (3.6)
50–149 31.0 (0.7) 33.8 (2.0) 35.9 (3.6)
150 or more 4.5 (0.3) 12.3 (1.5) 22.0 (3.0)
Total 100.0 100.0 100.0
*E.g., to auction, other farms, fair, farmer’s market, etc.
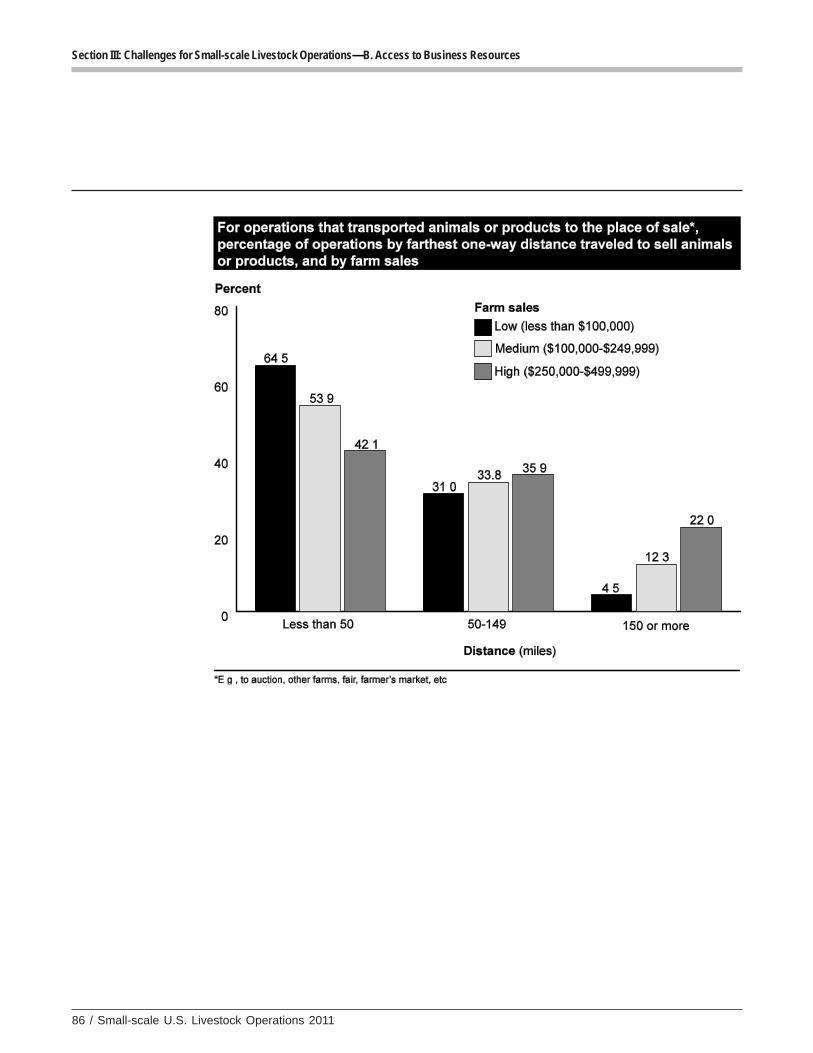
86 / Small-scale U.S. Livestock Operations 2011
Section III: Challenges for Small-scale Livestock Operations—B. Access to Business Resources
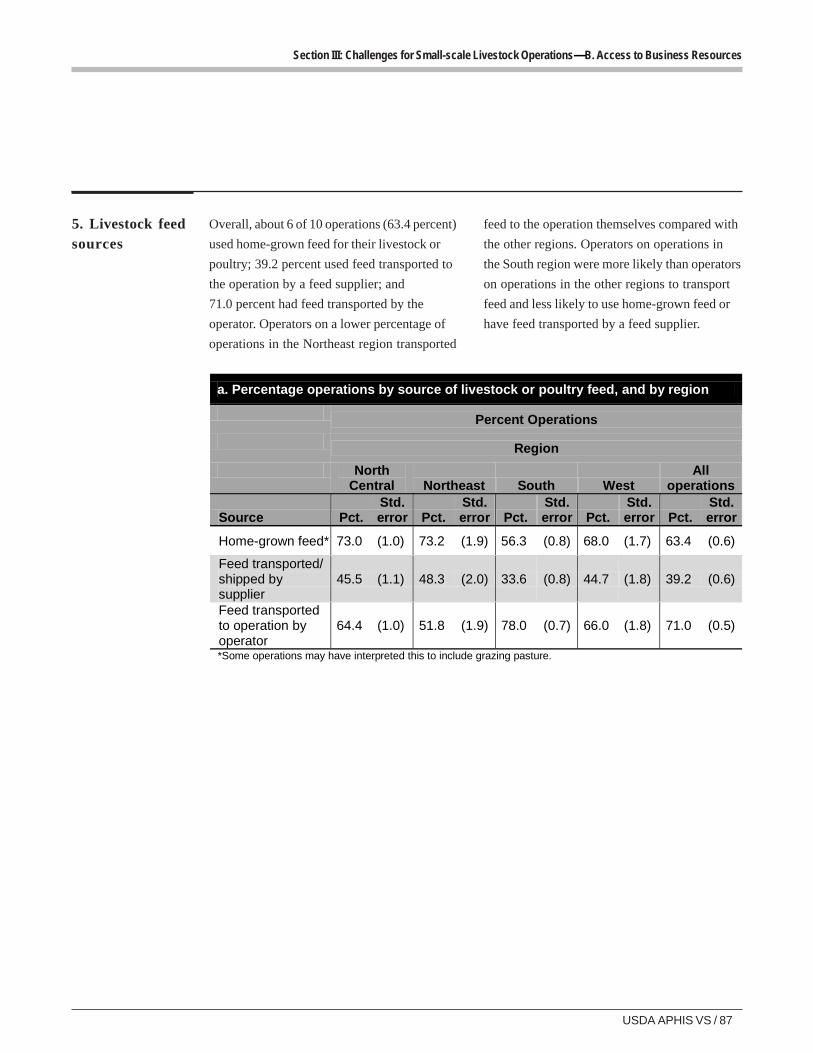
USDA APHIS VS / 87
Section III: Challenges for Small-scale Livestock Operations—B. Access to Business Resources
5. Livestock feedsources
Overall, about 6 of 10 operations (63.4 percent)
used home-grown feed for their livestock or
poultry; 39.2 percent used feed transported to
the operation by a feed supplier; and
71.0 percent had feed transported by the
operator. Operators on a lower percentage of
operations in the Northeast region transported
feed to the operation themselves compared with
the other regions. Operators on operations in
the South region were more likely than operators
on operations in the other regions to transport
feed and less likely to use home-grown feed or
have feed transported by a feed supplier.
a. Percentage operations by source of livestock or poultry feed, and by region
Percent Operations
Region
North Central Northeast South West
All operations
Source Pct. Std. error Pct.
Std. error Pct.
Std. error Pct.
Std. error Pct.
Std. error
Home-grown feed* 73.0 (1.0) 73.2 (1.9) 56.3 (0.8) 68.0 (1.7) 63.4 (0.6)
Feed transported/ shipped by supplier
45.5 (1.1) 48.3 (2.0) 33.6 (0.8) 44.7 (1.8) 39.2 (0.6)
Feed transported to operation by operator
64.4 (1.0) 51.8 (1.9) 78.0 (0.7) 66.0 (1.8) 71.0 (0.5)
*Some operations may have interpreted this to include grazing pasture.
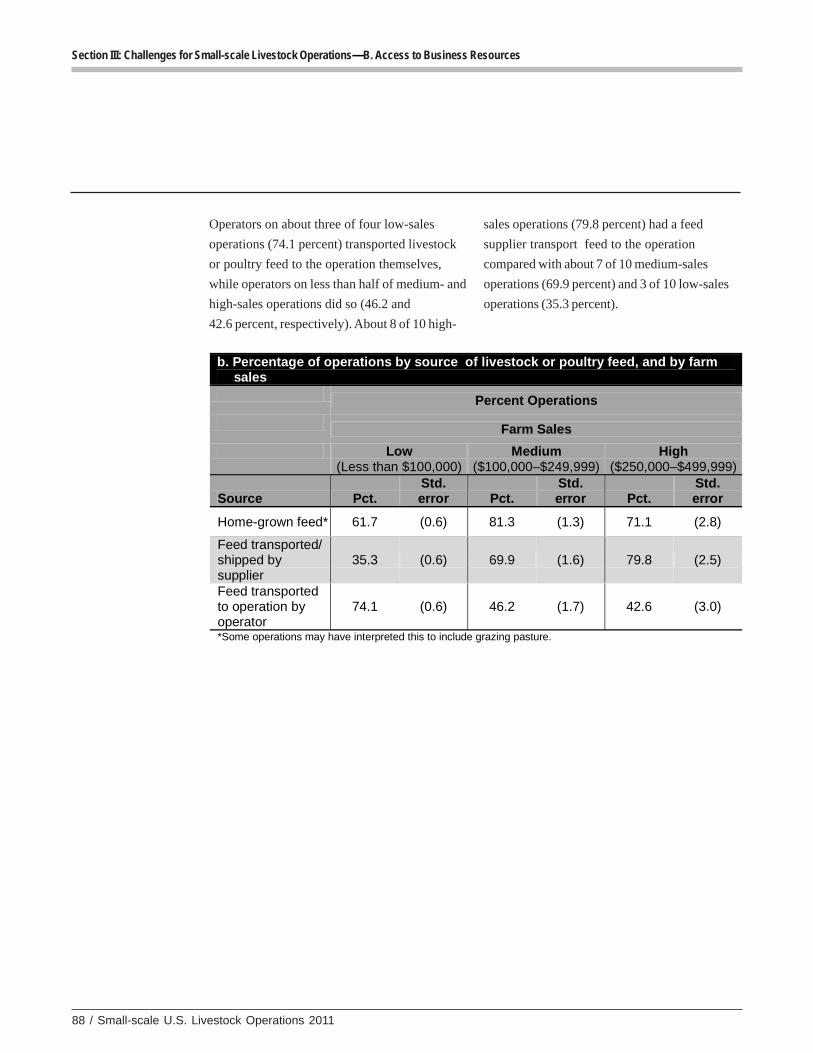
88 / Small-scale U.S. Livestock Operations 2011
Section III: Challenges for Small-scale Livestock Operations—B. Access to Business Resources
Operators on about three of four low-sales
operations (74.1 percent) transported livestock
or poultry feed to the operation themselves,
while operators on less than half of medium- and
high-sales operations did so (46.2 and
42.6 percent, respectively). About 8 of 10 high-
sales operations (79.8 percent) had a feed
supplier transport feed to the operation
compared with about 7 of 10 medium-sales
operations (69.9 percent) and 3 of 10 low-sales
operations (35.3 percent).
b. Percentage of operations by source of livestock or poultry feed, and by farm sales
Percent Operations
Farm Sales
Low (Less than $100,000)
Medium ($100,000–$249,999)
High ($250,000–$499,999)
Source Pct. Std. error Pct.
Std. error Pct.
Std. error
Home-grown feed* 61.7 (0.6) 81.3 (1.3) 71.1 (2.8)
Feed transported/ shipped by supplier
35.3 (0.6) 69.9 (1.6) 79.8 (2.5)
Feed transported to operation by operator
74.1 (0.6) 46.2 (1.7) 42.6 (3.0)
*Some operations may have interpreted this to include grazing pasture.
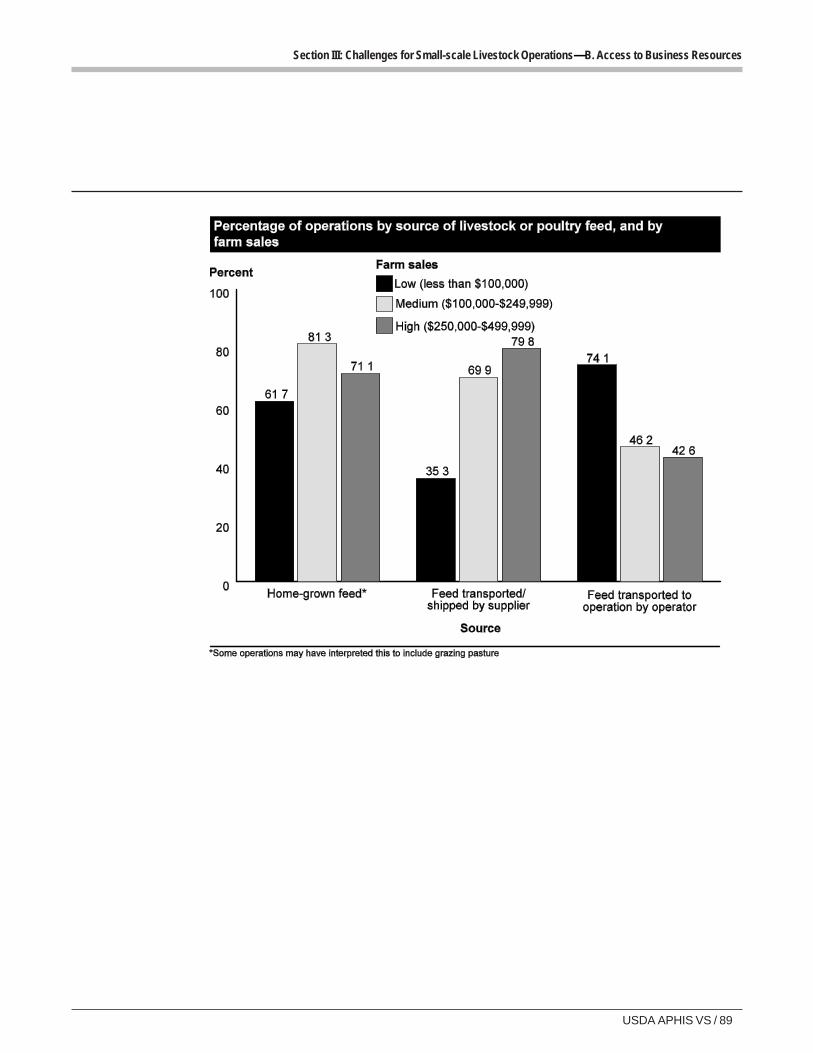
USDA APHIS VS / 89
Section III: Challenges for Small-scale Livestock Operations—B. Access to Business Resources
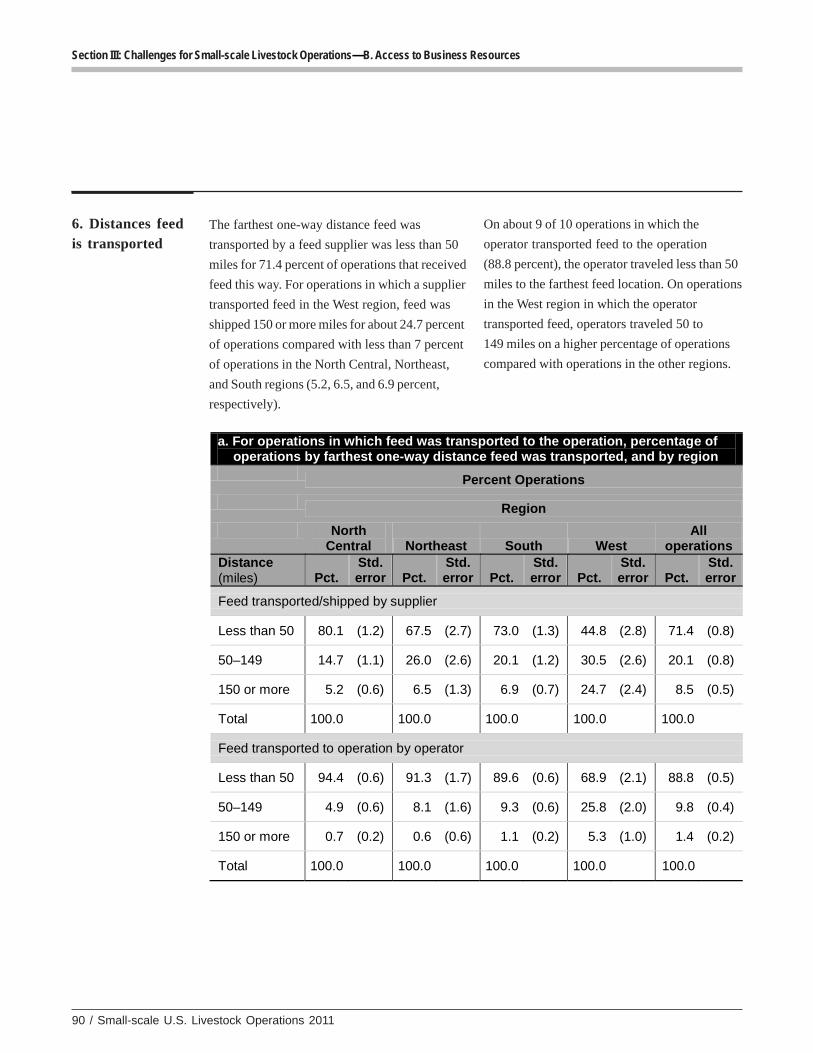
90 / Small-scale U.S. Livestock Operations 2011
Section III: Challenges for Small-scale Livestock Operations—B. Access to Business Resources
6. Distances feedis transported
The farthest one-way distance feed was
transported by a feed supplier was less than 50
miles for 71.4 percent of operations that received
feed this way. For operations in which a supplier
transported feed in the West region, feed was
shipped 150 or more miles for about 24.7 percent
of operations compared with less than 7 percent
of operations in the North Central, Northeast,
and South regions (5.2, 6.5, and 6.9 percent,
respectively).
On about 9 of 10 operations in which the
operator transported feed to the operation
(88.8 percent), the operator traveled less than 50
miles to the farthest feed location. On operations
in the West region in which the operator
transported feed, operators traveled 50 to
149 miles on a higher percentage of operations
compared with operations in the other regions.
a. For operations in which feed was transported to the operation, percentage of operations by farthest one-way distance feed was transported, and by region
Percent Operations
Region
North Central Northeast South West
All operations
Distance (miles) Pct.
Std. error Pct.
Std. error Pct.
Std. error Pct.
Std. error Pct.
Std. error
Feed transported/shipped by supplier
Less than 50 80.1 (1.2) 67.5 (2.7) 73.0 (1.3) 44.8 (2.8) 71.4 (0.8)
50–149 14.7 (1.1) 26.0 (2.6) 20.1 (1.2) 30.5 (2.6) 20.1 (0.8)
150 or more 5.2 (0.6) 6.5 (1.3) 6.9 (0.7) 24.7 (2.4) 8.5 (0.5)
Total 100.0 100.0 100.0 100.0 100.0
Feed transported to operation by operator
Less than 50 94.4 (0.6) 91.3 (1.7) 89.6 (0.6) 68.9 (2.1) 88.8 (0.5)
50–149 4.9 (0.6) 8.1 (1.6) 9.3 (0.6) 25.8 (2.0) 9.8 (0.4)
150 or more 0.7 (0.2) 0.6 (0.6) 1.1 (0.2) 5.3 (1.0) 1.4 (0.2)
Total 100.0 100.0 100.0 100.0 100.0
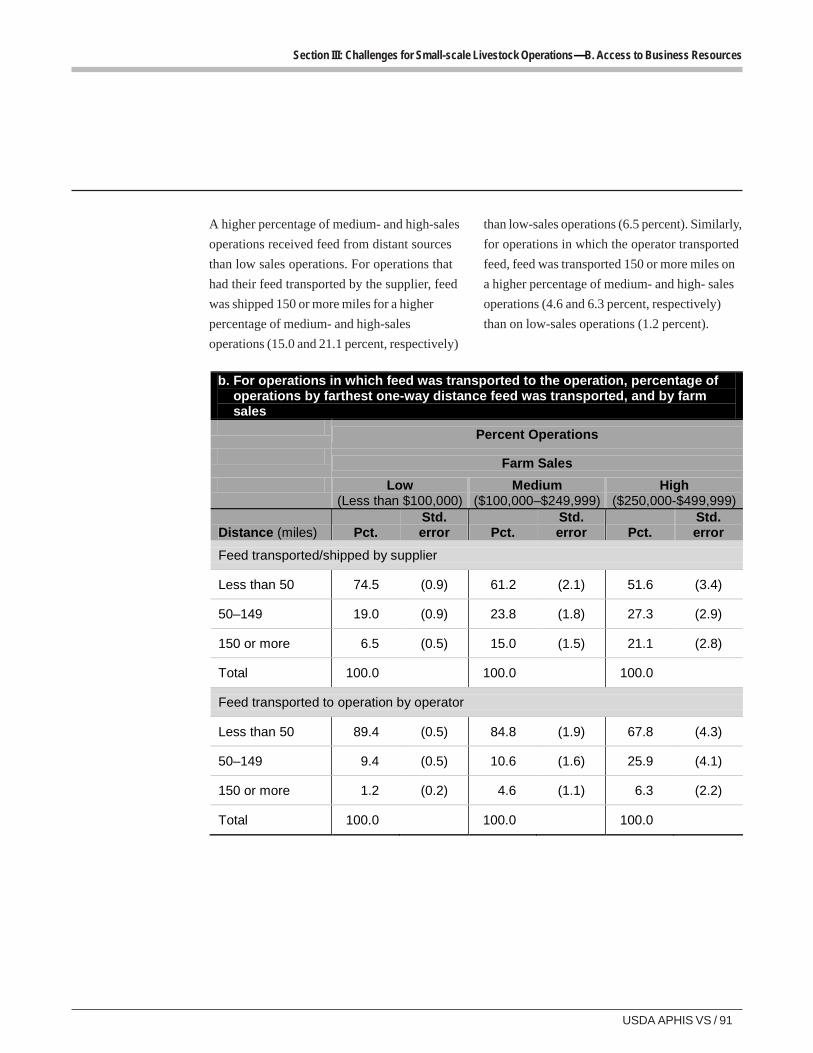
USDA APHIS VS / 91
Section III: Challenges for Small-scale Livestock Operations—B. Access to Business Resources
A higher percentage of medium- and high-sales
operations received feed from distant sources
than low sales operations. For operations that
had their feed transported by the supplier, feed
was shipped 150 or more miles for a higher
percentage of medium- and high-sales
operations (15.0 and 21.1 percent, respectively)
than low-sales operations (6.5 percent). Similarly,
for operations in which the operator transported
feed, feed was transported 150 or more miles on
a higher percentage of medium- and high- sales
operations (4.6 and 6.3 percent, respectively)
than on low-sales operations (1.2 percent).
b. For operations in which feed was transported to the operation, percentage of operations by farthest one-way distance feed was transported, and by farm sales
Percent Operations
Farm Sales
Low (Less than $100,000)
Medium ($100,000–$249,999)
High ($250,000-$499,999)
Distance (miles) Pct. Std. error Pct.
Std. error Pct.
Std. error
Feed transported/shipped by supplier
Less than 50 74.5 (0.9) 61.2 (2.1) 51.6 (3.4)
50–149 19.0 (0.9) 23.8 (1.8) 27.3 (2.9)
150 or more 6.5 (0.5) 15.0 (1.5) 21.1 (2.8)
Total 100.0 100.0 100.0
Feed transported to operation by operator
Less than 50 89.4 (0.5) 84.8 (1.9) 67.8 (4.3)
50–149 9.4 (0.5) 10.6 (1.6) 25.9 (4.1)
150 or more 1.2 (0.2) 4.6 (1.1) 6.3 (2.2)
Total 100.0 100.0 100.0
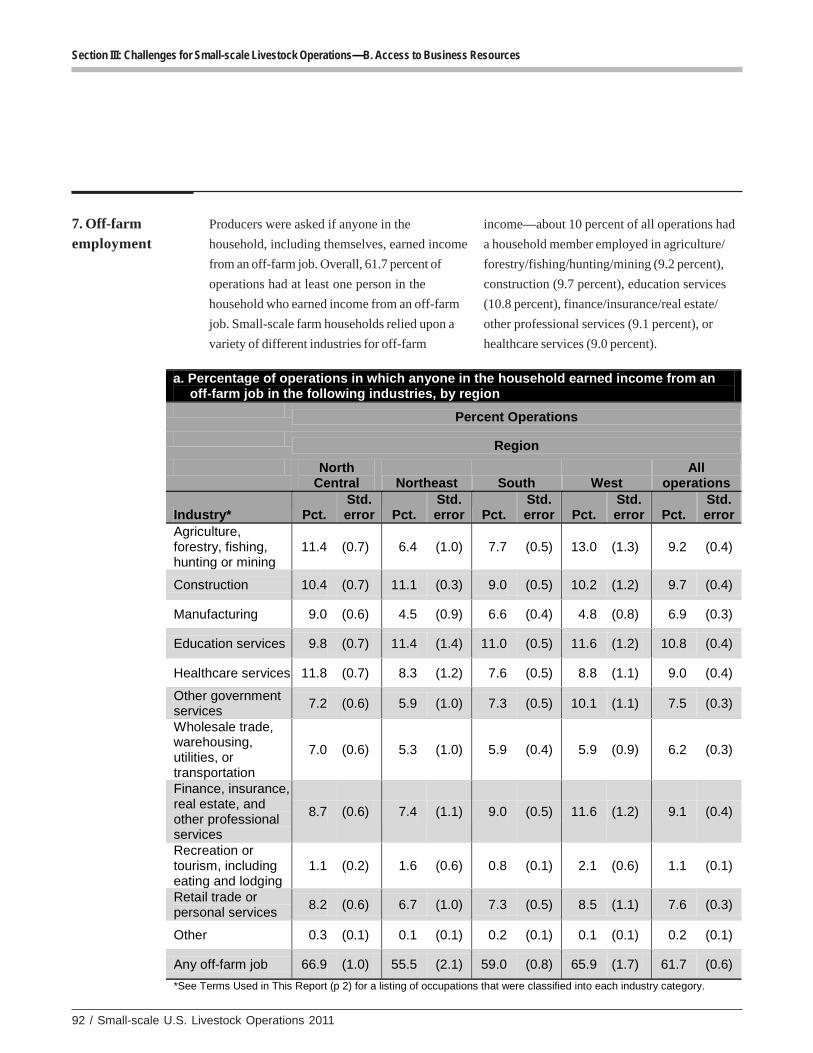
92 / Small-scale U.S. Livestock Operations 2011
Section III: Challenges for Small-scale Livestock Operations—B. Access to Business Resources
7. Off-farmemployment
Producers were asked if anyone in the
household, including themselves, earned income
from an off-farm job. Overall, 61.7 percent of
operations had at least one person in the
household who earned income from an off-farm
job. Small-scale farm households relied upon a
variety of different industries for off-farm
income—about 10 percent of all operations had
a household member employed in agriculture/
forestry/fishing/hunting/mining (9.2 percent),
construction (9.7 percent), education services
(10.8 percent), finance/insurance/real estate/
other professional services (9.1 percent), or
healthcare services (9.0 percent).
a. Percentage of operations in which anyone in the household earned income from an off-farm job in the following industries, by region
Percent Operations
Region
North Central Northeast South West
All operations
Industry* Pct. Std. error Pct.
Std. error Pct.
Std. error Pct.
Std. error Pct.
Std. error
Agriculture, forestry, fishing, hunting or mining
11.4 (0.7) 6.4 (1.0) 7.7 (0.5) 13.0 (1.3) 9.2 (0.4)
Construction 10.4 (0.7) 11.1 (0.3) 9.0 (0.5) 10.2 (1.2) 9.7 (0.4)
Manufacturing 9.0 (0.6) 4.5 (0.9) 6.6 (0.4) 4.8 (0.8) 6.9 (0.3)
Education services 9.8 (0.7) 11.4 (1.4) 11.0 (0.5) 11.6 (1.2) 10.8 (0.4)
Healthcare services 11.8 (0.7) 8.3 (1.2) 7.6 (0.5) 8.8 (1.1) 9.0 (0.4)
Other government services
7.2 (0.6) 5.9 (1.0) 7.3 (0.5) 10.1 (1.1) 7.5 (0.3)
Wholesale trade, warehousing, utilities, or transportation
7.0 (0.6) 5.3 (1.0) 5.9 (0.4) 5.9 (0.9) 6.2 (0.3)
Finance, insurance, real estate, and other professional services
8.7 (0.6) 7.4 (1.1) 9.0 (0.5) 11.6 (1.2) 9.1 (0.4)
Recreation or tourism, including eating and lodging
1.1 (0.2) 1.6 (0.6) 0.8 (0.1) 2.1 (0.6) 1.1 (0.1)
Retail trade or personal services
8.2 (0.6) 6.7 (1.0) 7.3 (0.5) 8.5 (1.1) 7.6 (0.3)
Other 0.3 (0.1) 0.1 (0.1) 0.2 (0.1) 0.1 (0.1) 0.2 (0.1)
Any off-farm job 66.9 (1.0) 55.5 (2.1) 59.0 (0.8) 65.9 (1.7) 61.7 (0.6)
*See Terms Used in This Report (p 2) for a listing of occupations that were classified into each industry category.
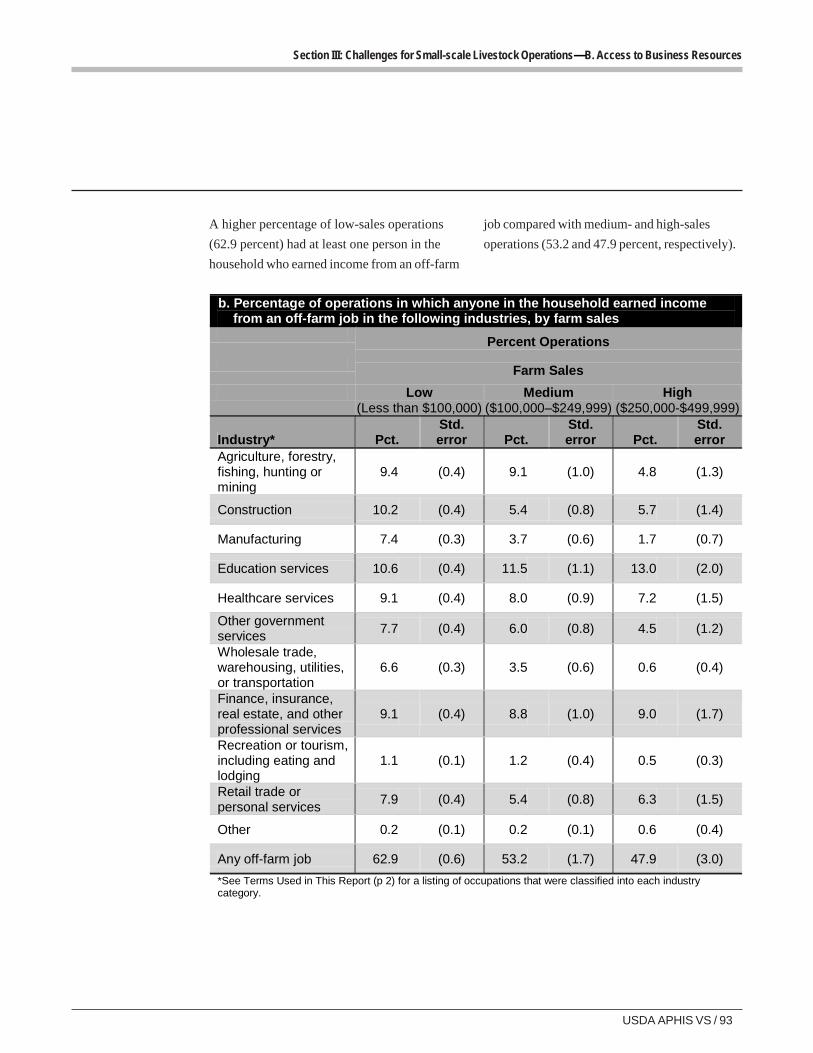
USDA APHIS VS / 93
Section III: Challenges for Small-scale Livestock Operations—B. Access to Business Resources
A higher percentage of low-sales operations
(62.9 percent) had at least one person in the
household who earned income from an off-farm
job compared with medium- and high-sales
operations (53.2 and 47.9 percent, respectively).
b. Percentage of operations in which anyone in the household earned income from an off-farm job in the following industries, by farm sales
Percent Operations
Farm Sales
Low (Less than $100,000)
Medium ($100,000–$249,999)
High ($250,000-$499,999)
Industry* Pct. Std. error Pct.
Std. error Pct.
Std. error
Agriculture, forestry, fishing, hunting or mining
9.4 (0.4) 9.1 (1.0) 4.8 (1.3)
Construction 10.2 (0.4) 5.4 (0.8) 5.7 (1.4)
Manufacturing 7.4 (0.3) 3.7 (0.6) 1.7 (0.7)
Education services 10.6 (0.4) 11.5 (1.1) 13.0 (2.0)
Healthcare services 9.1 (0.4) 8.0 (0.9) 7.2 (1.5)
Other government services
7.7 (0.4) 6.0 (0.8) 4.5 (1.2)
Wholesale trade, warehousing, utilities, or transportation
6.6 (0.3) 3.5 (0.6) 0.6 (0.4)
Finance, insurance, real estate, and other professional services
9.1 (0.4) 8.8 (1.0) 9.0 (1.7)
Recreation or tourism, including eating and lodging
1.1 (0.1) 1.2 (0.4) 0.5 (0.3)
Retail trade or personal services
7.9 (0.4) 5.4 (0.8) 6.3 (1.5)
Other 0.2 (0.1) 0.2 (0.1) 0.6 (0.4)
Any off-farm job 62.9 (0.6) 53.2 (1.7) 47.9 (3.0)
*See Terms Used in This Report (p 2) for a listing of occupations that were classified into each industry category.
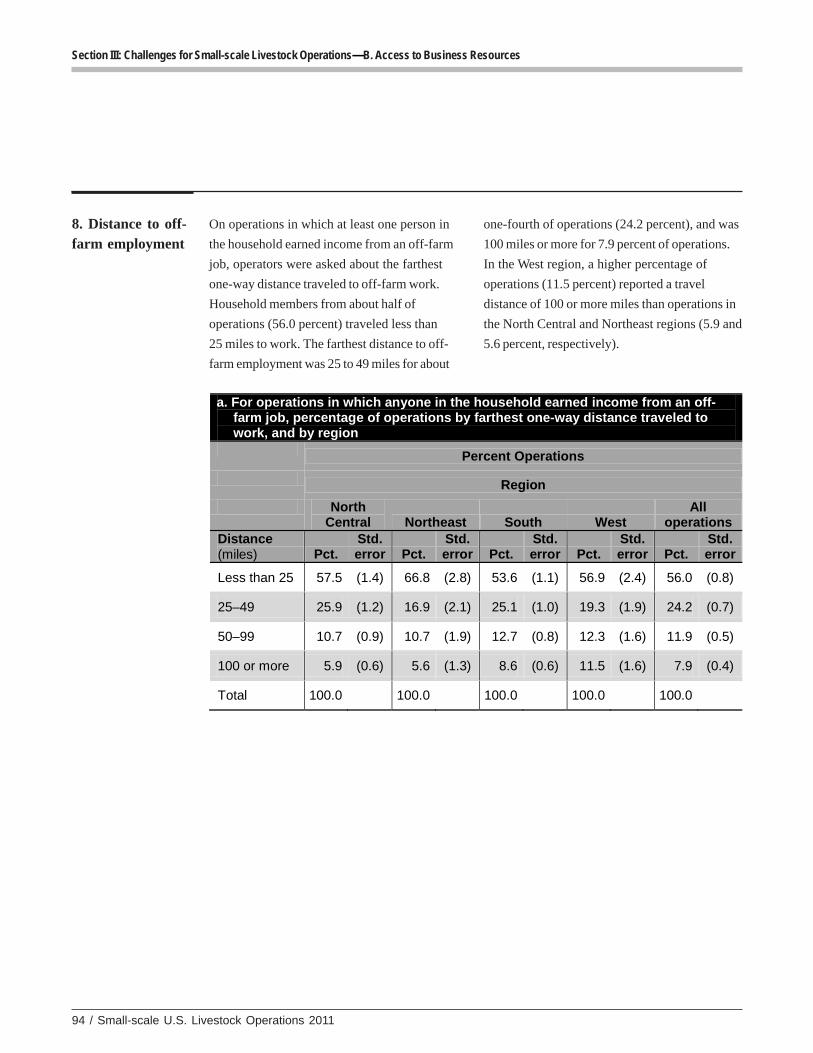
94 / Small-scale U.S. Livestock Operations 2011
Section III: Challenges for Small-scale Livestock Operations—B. Access to Business Resources
8. Distance to off-farm employment
On operations in which at least one person in
the household earned income from an off-farm
job, operators were asked about the farthest
one-way distance traveled to off-farm work.
Household members from about half of
operations (56.0 percent) traveled less than
25 miles to work. The farthest distance to off-
farm employment was 25 to 49 miles for about
one-fourth of operations (24.2 percent), and was
100 miles or more for 7.9 percent of operations.
In the West region, a higher percentage of
operations (11.5 percent) reported a travel
distance of 100 or more miles than operations in
the North Central and Northeast regions (5.9 and
5.6 percent, respectively).
a. For operations in which anyone in the household earned income from an off-farm job, percentage of operations by farthest one-way distance traveled to work, and by region
Percent Operations
Region
North Central Northeast South West
All operations
Distance (miles) Pct.
Std. error Pct.
Std. error Pct.
Std. error Pct.
Std. error Pct.
Std. error
Less than 25 57.5 (1.4) 66.8 (2.8) 53.6 (1.1) 56.9 (2.4) 56.0 (0.8)
25–49 25.9 (1.2) 16.9 (2.1) 25.1 (1.0) 19.3 (1.9) 24.2 (0.7)
50–99 10.7 (0.9) 10.7 (1.9) 12.7 (0.8) 12.3 (1.6) 11.9 (0.5)
100 or more 5.9 (0.6) 5.6 (1.3) 8.6 (0.6) 11.5 (1.6) 7.9 (0.4)
Total 100.0 100.0 100.0 100.0 100.0
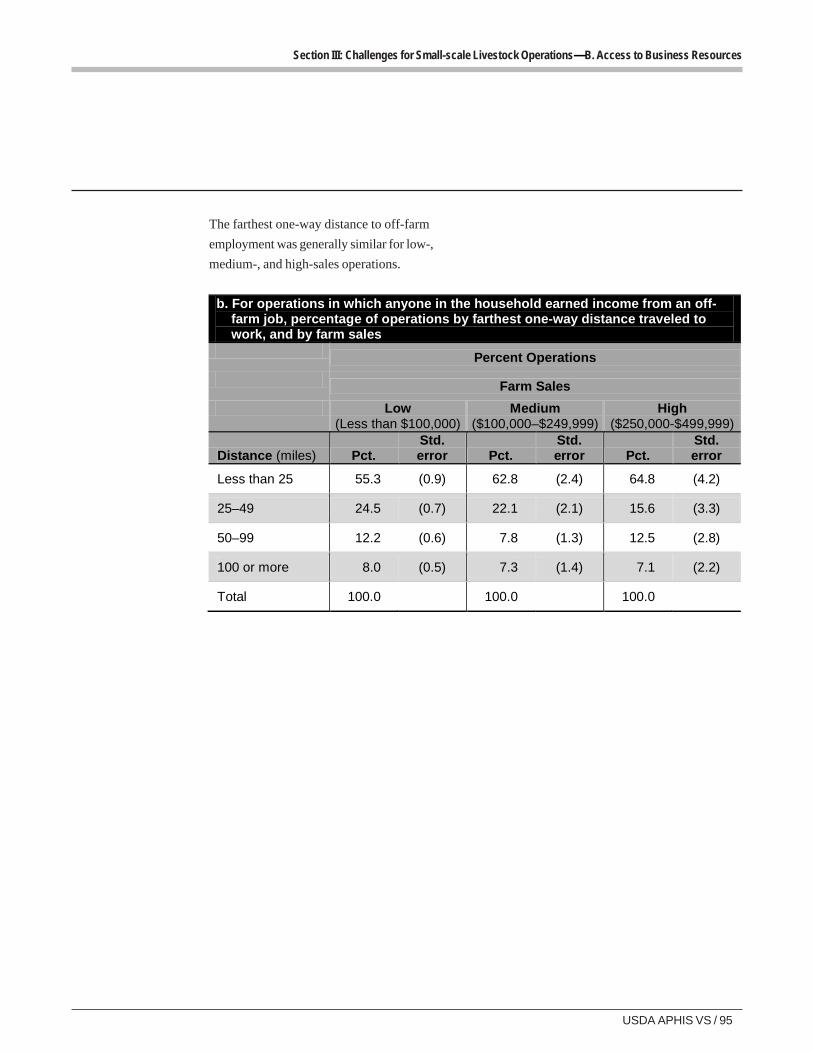
USDA APHIS VS / 95
Section III: Challenges for Small-scale Livestock Operations—B. Access to Business Resources
The farthest one-way distance to off-farm
employment was generally similar for low-,
medium-, and high-sales operations.
b. For operations in which anyone in the household earned income from an off-farm job, percentage of operations by farthest one-way distance traveled to work, and by farm sales
Percent Operations
Farm Sales
Low (Less than $100,000)
Medium ($100,000–$249,999)
High ($250,000-$499,999)
Distance (miles) Pct. Std. error Pct.
Std. error Pct.
Std. error
Less than 25 55.3 (0.9) 62.8 (2.4) 64.8 (4.2)
25–49 24.5 (0.7) 22.1 (2.1) 15.6 (3.3)
50–99 12.2 (0.6) 7.8 (1.3) 12.5 (2.8)
100 or more 8.0 (0.5) 7.3 (1.4) 7.1 (2.2)
Total 100.0 100.0 100.0
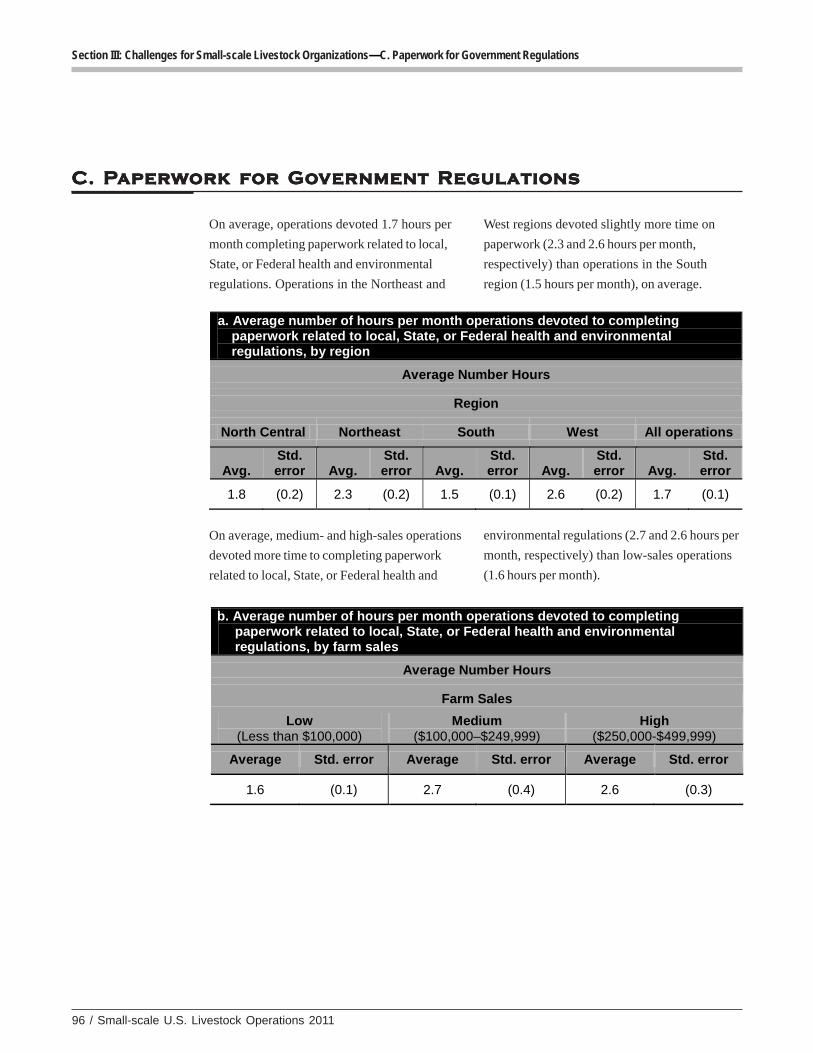
96 / Small-scale U.S. Livestock Operations 2011
Section III: Challenges for Small-scale Livestock Organizations—C. Paperwork for Government Regulations
C. PC. PC. PC. PC. Paperaperaperaperaperwwwwwororororork fk fk fk fk for Goor Goor Goor Goor Govvvvvererererernment Rnment Rnment Rnment Rnment Regulationsegulationsegulationsegulationsegulations
On average, operations devoted 1.7 hours per
month completing paperwork related to local,
State, or Federal health and environmental
regulations. Operations in the Northeast and
West regions devoted slightly more time on
paperwork (2.3 and 2.6 hours per month,
respectively) than operations in the South
region (1.5 hours per month), on average.
a. Average number of hours per month operations devoted to completing paperwork related to local, State, or Federal health and environmental regulations, by region
Average Number Hours
Region
North Central Northeast South West All operations
Avg. Std. error Avg.
Std. error Avg.
Std. error Avg.
Std. error Avg.
Std. error
1.8 (0.2) 2.3 (0.2) 1.5 (0.1) 2.6 (0.2) 1.7 (0.1)
On average, medium- and high-sales operations
devoted more time to completing paperwork
related to local, State, or Federal health and
environmental regulations (2.7 and 2.6 hours per
month, respectively) than low-sales operations
(1.6 hours per month).
b. Average number of hours per month operations devoted to completing paperwork related to local, State, or Federal health and environmental regulations, by farm sales
Average Number Hours
Farm Sales
Low (Less than $100,000)
Medium ($100,000–$249,999)
High ($250,000-$499,999)
Average Std. error Average Std. error Average Std. error
1.6 (0.1) 2.7 (0.4) 2.6 (0.3)
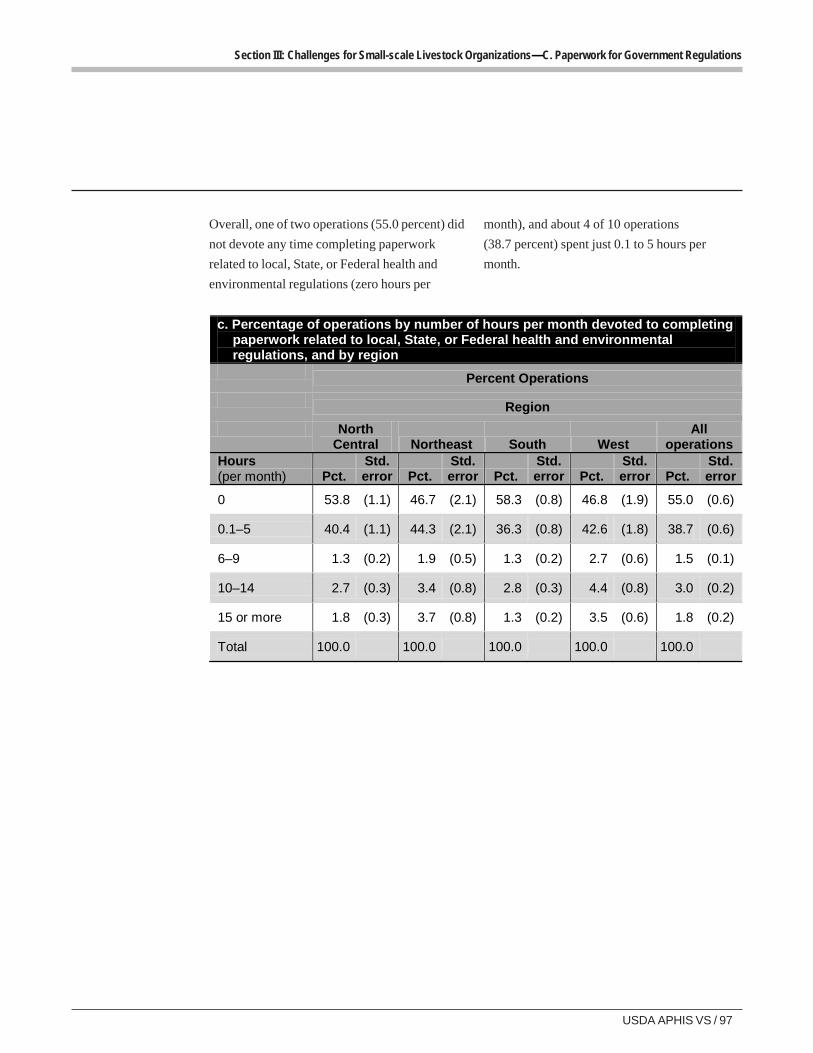
USDA APHIS VS / 97
Section III: Challenges for Small-scale Livestock Organizations—C. Paperwork for Government Regulations
Overall, one of two operations (55.0 percent) did
not devote any time completing paperwork
related to local, State, or Federal health and
environmental regulations (zero hours per
month), and about 4 of 10 operations
(38.7 percent) spent just 0.1 to 5 hours per
month.
c. Percentage of operations by number of hours per month devoted to completing paperwork related to local, State, or Federal health and environmental regulations, and by region
Percent Operations
Region
North Central Northeast South West
All operations
Hours (per month) Pct.
Std. error Pct.
Std. error Pct.
Std. error Pct.
Std. error Pct.
Std. error
0 53.8 (1.1) 46.7 (2.1) 58.3 (0.8) 46.8 (1.9) 55.0 (0.6)
0.1–5 40.4 (1.1) 44.3 (2.1) 36.3 (0.8) 42.6 (1.8) 38.7 (0.6)
6–9 1.3 (0.2) 1.9 (0.5) 1.3 (0.2) 2.7 (0.6) 1.5 (0.1)
10–14 2.7 (0.3) 3.4 (0.8) 2.8 (0.3) 4.4 (0.8) 3.0 (0.2)
15 or more 1.8 (0.3) 3.7 (0.8) 1.3 (0.2) 3.5 (0.6) 1.8 (0.2)
Total 100.0 100.0 100.0 100.0 100.0
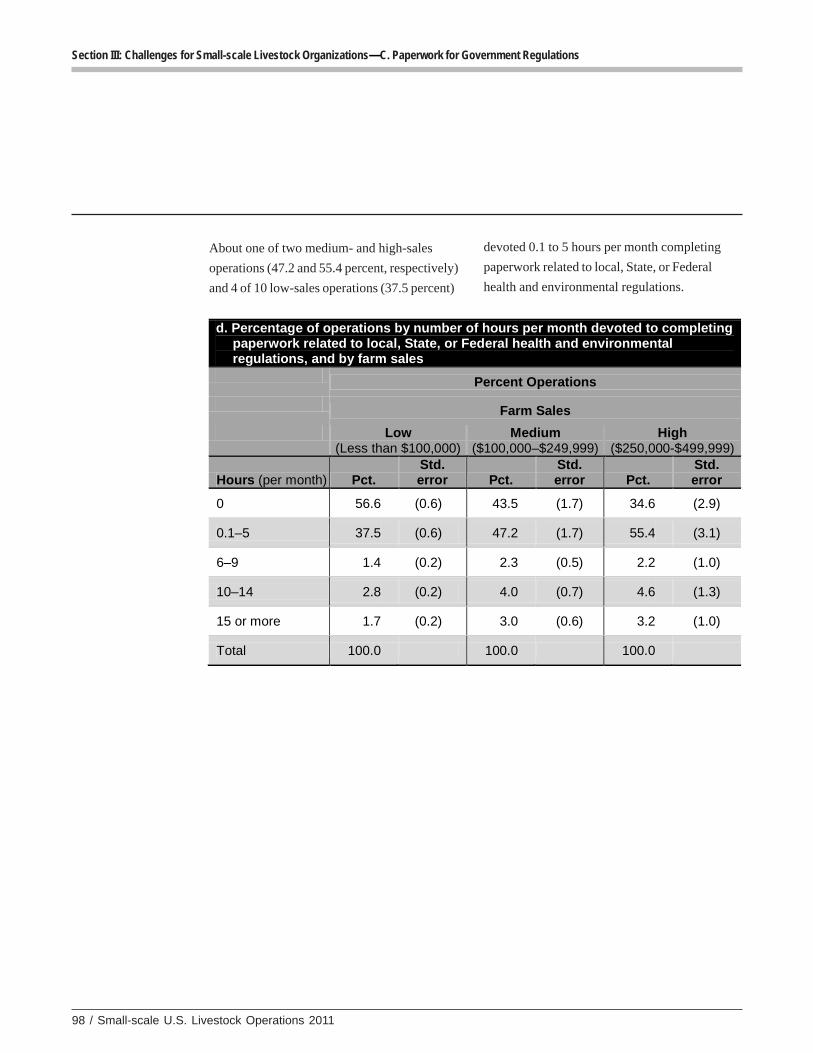
98 / Small-scale U.S. Livestock Operations 2011
Section III: Challenges for Small-scale Livestock Organizations—C. Paperwork for Government Regulations
About one of two medium- and high-sales
operations (47.2 and 55.4 percent, respectively)
and 4 of 10 low-sales operations (37.5 percent)
devoted 0.1 to 5 hours per month completing
paperwork related to local, State, or Federal
health and environmental regulations.
d. Percentage of operations by number of hours per month devoted to completing paperwork related to local, State, or Federal health and environmental regulations, and by farm sales
Percent Operations
Farm Sales
Low (Less than $100,000)
Medium ($100,000–$249,999)
High ($250,000-$499,999)
Hours (per month) Pct. Std. error Pct.
Std. error Pct.
Std. error
0 56.6 (0.6) 43.5 (1.7) 34.6 (2.9)
0.1–5 37.5 (0.6) 47.2 (1.7) 55.4 (3.1)
6–9 1.4 (0.2) 2.3 (0.5) 2.2 (1.0)
10–14 2.8 (0.2) 4.0 (0.7) 4.6 (1.3)
15 or more 1.7 (0.2) 3.0 (0.6) 3.2 (1.0)
Total 100.0 100.0 100.0
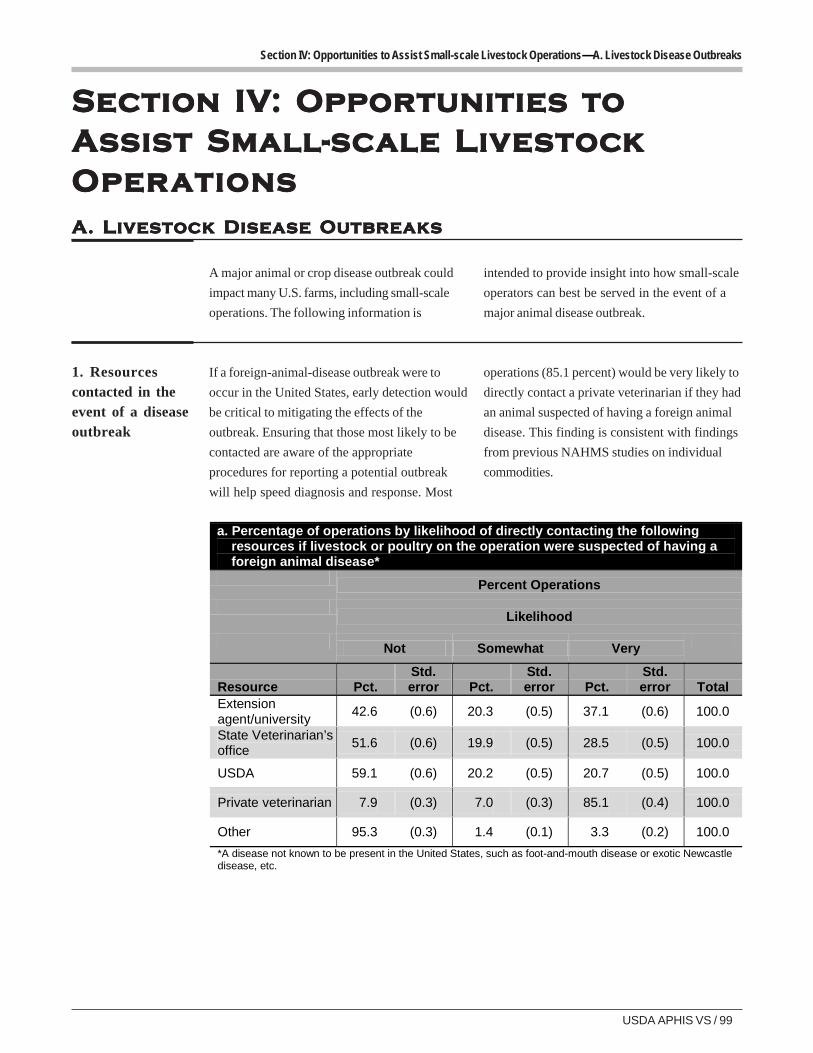
USDA APHIS VS / 99
Section IV: Opportunities to Assist Small-scale Livestock Operations—A. Livestock Disease Outbreaks
Section IVSection IVSection IVSection IVSection IV: Oppor: Oppor: Oppor: Oppor: Opportunities ttunities ttunities ttunities ttunities toooooAssisAssisAssisAssisAssist Small-scale Livt Small-scale Livt Small-scale Livt Small-scale Livt Small-scale LivesesesesestttttococococockkkkkOperOperOperOperOperationsationsationsationsationsA. Livestock Disease OutbreaksA. Livestock Disease OutbreaksA. Livestock Disease OutbreaksA. Livestock Disease OutbreaksA. Livestock Disease Outbreaks
A major animal or crop disease outbreak could
impact many U.S. farms, including small-scale
operations. The following information is
intended to provide insight into how small-scale
operators can best be served in the event of a
major animal disease outbreak.
1. Resourcescontacted in theevent of a diseaseoutbreak
If a foreign-animal-disease outbreak were to
occur in the United States, early detection would
be critical to mitigating the effects of the
outbreak. Ensuring that those most likely to be
contacted are aware of the appropriate
procedures for reporting a potential outbreak
will help speed diagnosis and response. Most
operations (85.1 percent) would be very likely to
directly contact a private veterinarian if they had
an animal suspected of having a foreign animal
disease. This finding is consistent with findings
from previous NAHMS studies on individual
commodities.
a. Percentage of operations by likelihood of directly contacting the following resources if livestock or poultry on the operation were suspected of having a foreign animal disease*
Percent Operations
Likelihood
Not Somewhat Very
Resource Pct. Std. error Pct.
Std. error Pct.
Std. error Total
Extension agent/university
42.6 (0.6) 20.3 (0.5) 37.1 (0.6) 100.0
State Veterinarian’s office
51.6 (0.6) 19.9 (0.5) 28.5 (0.5) 100.0
USDA 59.1 (0.6) 20.2 (0.5) 20.7 (0.5) 100.0
Private veterinarian 7.9 (0.3) 7.0 (0.3) 85.1 (0.4) 100.0
Other 95.3 (0.3) 1.4 (0.1) 3.3 (0.2) 100.0
*A disease not known to be present in the United States, such as foot-and-mouth disease or exotic Newcastle disease, etc.
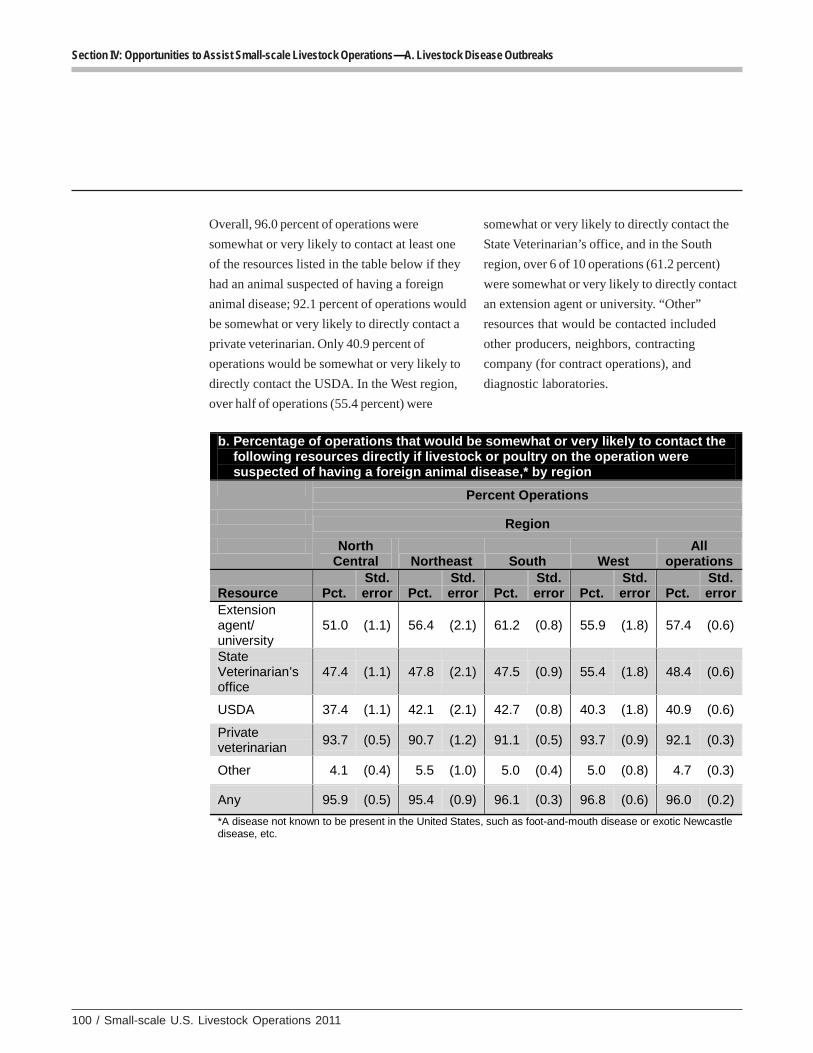
100 / Small-scale U.S. Livestock Operations 2011
Section IV: Opportunities to Assist Small-scale Livestock Operations—A. Livestock Disease Outbreaks
Overall, 96.0 percent of operations were
somewhat or very likely to contact at least one
of the resources listed in the table below if they
had an animal suspected of having a foreign
animal disease; 92.1 percent of operations would
be somewhat or very likely to directly contact a
private veterinarian. Only 40.9 percent of
operations would be somewhat or very likely to
directly contact the USDA. In the West region,
over half of operations (55.4 percent) were
somewhat or very likely to directly contact the
State Veterinarian’s office, and in the South
region, over 6 of 10 operations (61.2 percent)
were somewhat or very likely to directly contact
an extension agent or university. “Other”
resources that would be contacted included
other producers, neighbors, contracting
company (for contract operations), and
diagnostic laboratories.
b. Percentage of operations that would be somewhat or very likely to contact the following resources directly if livestock or poultry on the operation were suspected of having a foreign animal disease,* by region
Percent Operations
Region
North Central Northeast South West
All operations
Resource Pct. Std. error Pct.
Std. error Pct.
Std. error Pct.
Std. error Pct.
Std. error
Extension agent/ university
51.0 (1.1) 56.4 (2.1) 61.2 (0.8) 55.9 (1.8) 57.4 (0.6)
State Veterinarian’s office
47.4 (1.1) 47.8 (2.1) 47.5 (0.9) 55.4 (1.8) 48.4 (0.6)
USDA 37.4 (1.1) 42.1 (2.1) 42.7 (0.8) 40.3 (1.8) 40.9 (0.6)
Private veterinarian
93.7 (0.5) 90.7 (1.2) 91.1 (0.5) 93.7 (0.9) 92.1 (0.3)
Other 4.1 (0.4) 5.5 (1.0) 5.0 (0.4) 5.0 (0.8) 4.7 (0.3)
Any 95.9 (0.5) 95.4 (0.9) 96.1 (0.3) 96.8 (0.6) 96.0 (0.2)
*A disease not known to be present in the United States, such as foot-and-mouth disease or exotic Newcastle disease, etc.
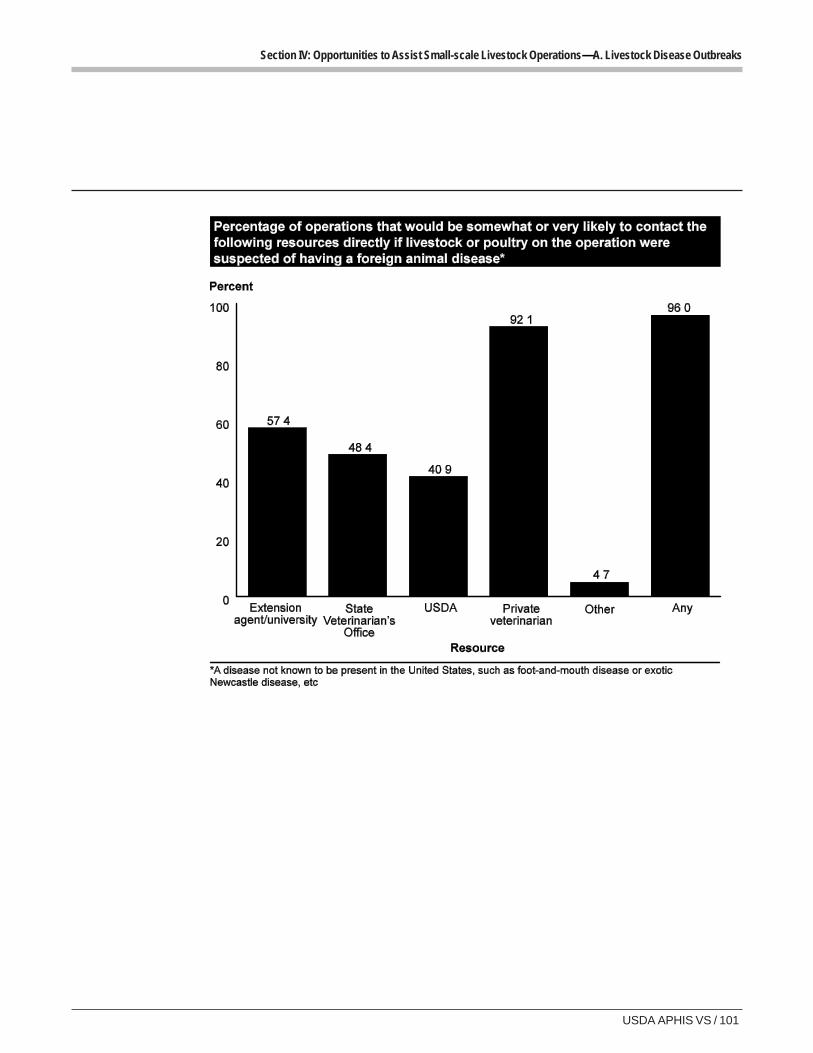
USDA APHIS VS / 101
Section IV: Opportunities to Assist Small-scale Livestock Operations—A. Livestock Disease Outbreaks
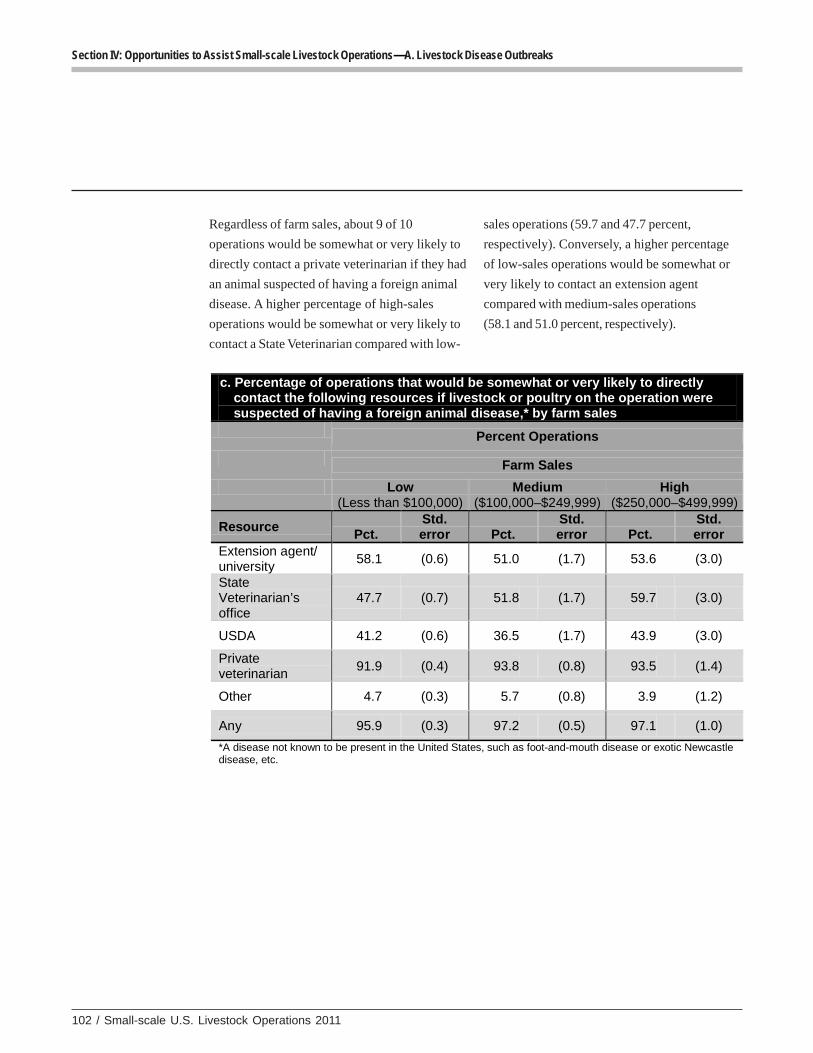
102 / Small-scale U.S. Livestock Operations 2011
Section IV: Opportunities to Assist Small-scale Livestock Operations—A. Livestock Disease Outbreaks
Regardless of farm sales, about 9 of 10
operations would be somewhat or very likely to
directly contact a private veterinarian if they had
an animal suspected of having a foreign animal
disease. A higher percentage of high-sales
operations would be somewhat or very likely to
contact a State Veterinarian compared with low-
sales operations (59.7 and 47.7 percent,
respectively). Conversely, a higher percentage
of low-sales operations would be somewhat or
very likely to contact an extension agent
compared with medium-sales operations
(58.1 and 51.0 percent, respectively).
c. Percentage of operations that would be somewhat or very likely to directly contact the following resources if livestock or poultry on the operation were suspected of having a foreign animal disease,* by farm sales
Percent Operations
Farm Sales
Low (Less than $100,000)
Medium ($100,000–$249,999)
High ($250,000–$499,999)
Resource Pct.
Std. error Pct.
Std. error Pct.
Std. error
Extension agent/ university
58.1 (0.6) 51.0 (1.7) 53.6 (3.0)
State Veterinarian’s office
47.7 (0.7) 51.8 (1.7) 59.7 (3.0)
USDA 41.2 (0.6) 36.5 (1.7) 43.9 (3.0)
Private veterinarian
91.9 (0.4) 93.8 (0.8) 93.5 (1.4)
Other 4.7 (0.3) 5.7 (0.8) 3.9 (1.2)
Any 95.9 (0.3) 97.2 (0.5) 97.1 (1.0)
*A disease not known to be present in the United States, such as foot-and-mouth disease or exotic Newcastle disease, etc.
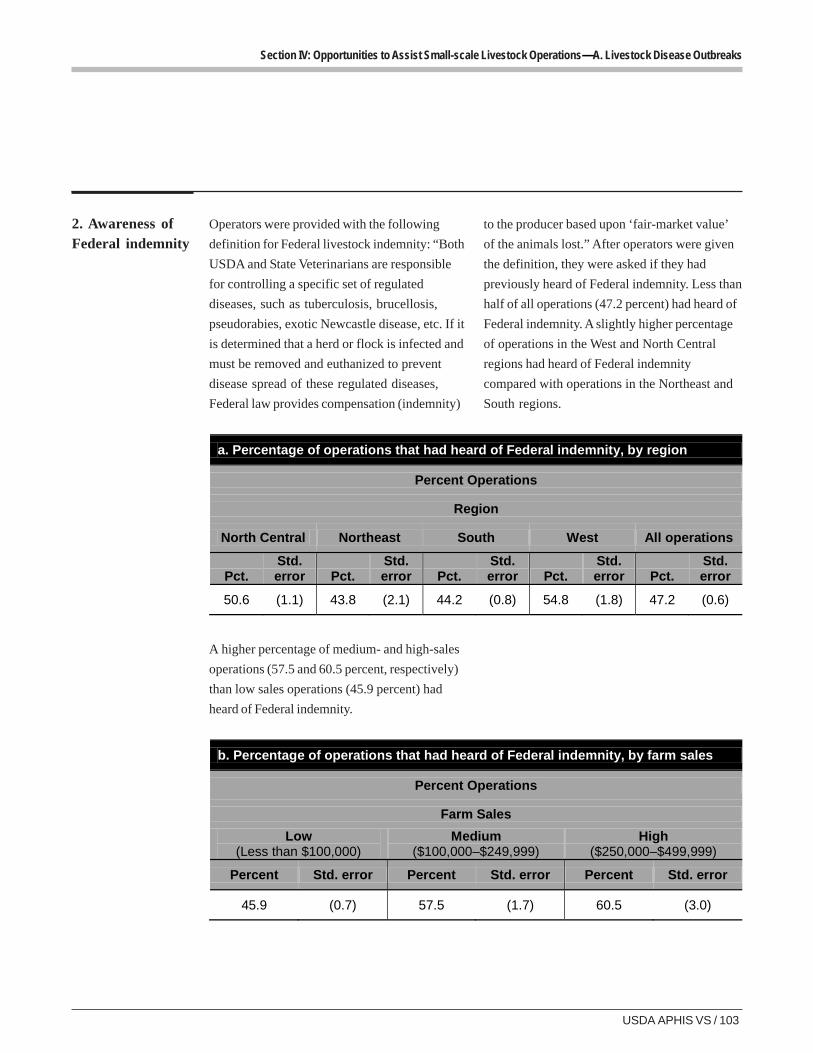
USDA APHIS VS / 103
Section IV: Opportunities to Assist Small-scale Livestock Operations—A. Livestock Disease Outbreaks
2. Awareness ofFederal indemnity
Operators were provided with the following
definition for Federal livestock indemnity: “Both
USDA and State Veterinarians are responsible
for controlling a specific set of regulated
diseases, such as tuberculosis, brucellosis,
pseudorabies, exotic Newcastle disease, etc. If it
is determined that a herd or flock is infected and
must be removed and euthanized to prevent
disease spread of these regulated diseases,
Federal law provides compensation (indemnity)
to the producer based upon ‘fair-market value’
of the animals lost.” After operators were given
the definition, they were asked if they had
previously heard of Federal indemnity. Less than
half of all operations (47.2 percent) had heard of
Federal indemnity. A slightly higher percentage
of operations in the West and North Central
regions had heard of Federal indemnity
compared with operations in the Northeast and
South regions.
a. Percentage of operations that had heard of Federal indemnity, by region
Percent Operations
Region
North Central Northeast South West All operations
Pct. Std. error Pct.
Std. error Pct.
Std. error Pct.
Std. error Pct.
Std. error
50.6 (1.1) 43.8 (2.1) 44.2 (0.8) 54.8 (1.8) 47.2 (0.6)
A higher percentage of medium- and high-sales
operations (57.5 and 60.5 percent, respectively)
than low sales operations (45.9 percent) had
heard of Federal indemnity.
b. Percentage of operations that had heard of Federal indemnity, by farm sales
Percent Operations
Farm Sales
Low (Less than $100,000)
Medium ($100,000–$249,999)
High ($250,000–$499,999)
Percent Std. error Percent Std. error Percent Std. error
45.9 (0.7) 57.5 (1.7) 60.5 (3.0)
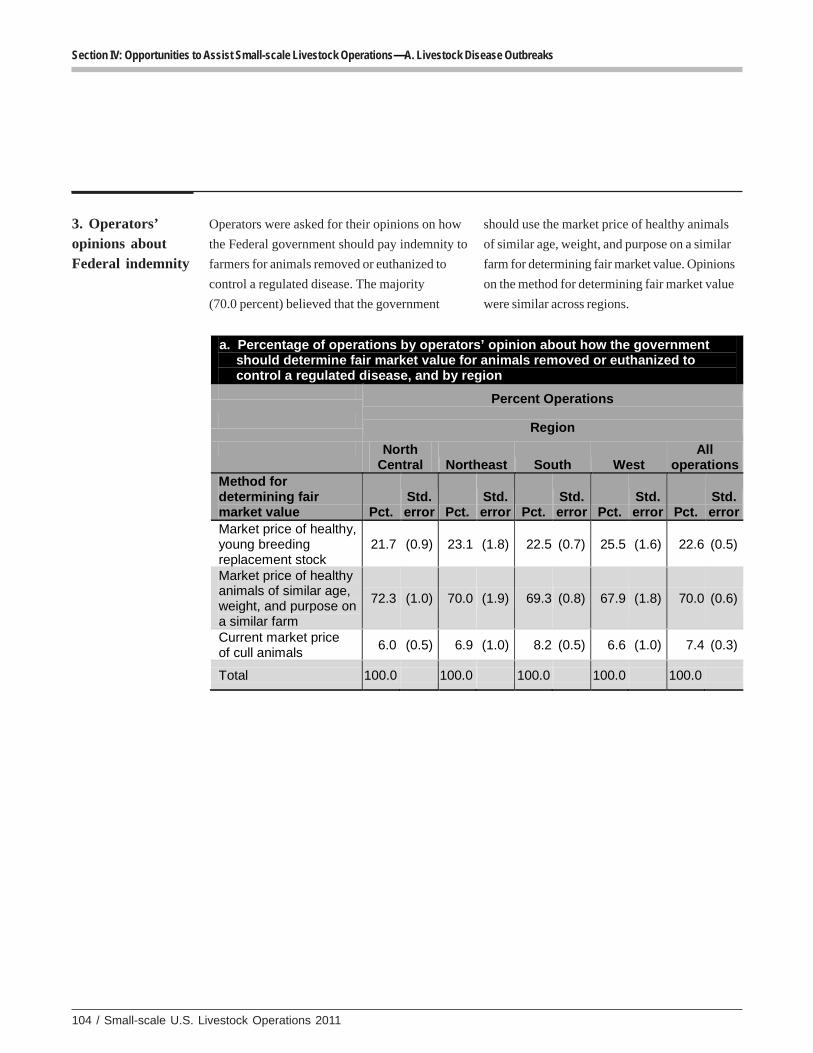
104 / Small-scale U.S. Livestock Operations 2011
Section IV: Opportunities to Assist Small-scale Livestock Operations—A. Livestock Disease Outbreaks
3. Operators’opinions aboutFederal indemnity
Operators were asked for their opinions on how
the Federal government should pay indemnity to
farmers for animals removed or euthanized to
control a regulated disease. The majority
(70.0 percent) believed that the government
should use the market price of healthy animals
of similar age, weight, and purpose on a similar
farm for determining fair market value. Opinions
on the method for determining fair market value
were similar across regions.
a. Percentage of operations by operators’ opinion about how the government should determine fair market value for animals removed or euthanized to control a regulated disease, and by region
Percent Operations
Region
North Central Northeast South West
All operations
Method for determining fair market value Pct.
Std. error Pct.
Std. error Pct.
Std. error Pct.
Std. error Pct.
Std. error
Market price of healthy, young breeding replacement stock
21.7 (0.9) 23.1 (1.8) 22.5 (0.7) 25.5 (1.6) 22.6 (0.5)
Market price of healthy animals of similar age, weight, and purpose on a similar farm
72.3 (1.0) 70.0 (1.9) 69.3 (0.8) 67.9 (1.8) 70.0 (0.6)
Current market price of cull animals
6.0 (0.5) 6.9 (1.0) 8.2 (0.5) 6.6 (1.0) 7.4 (0.3)
Total 100.0 100.0 100.0 100.0 100.0
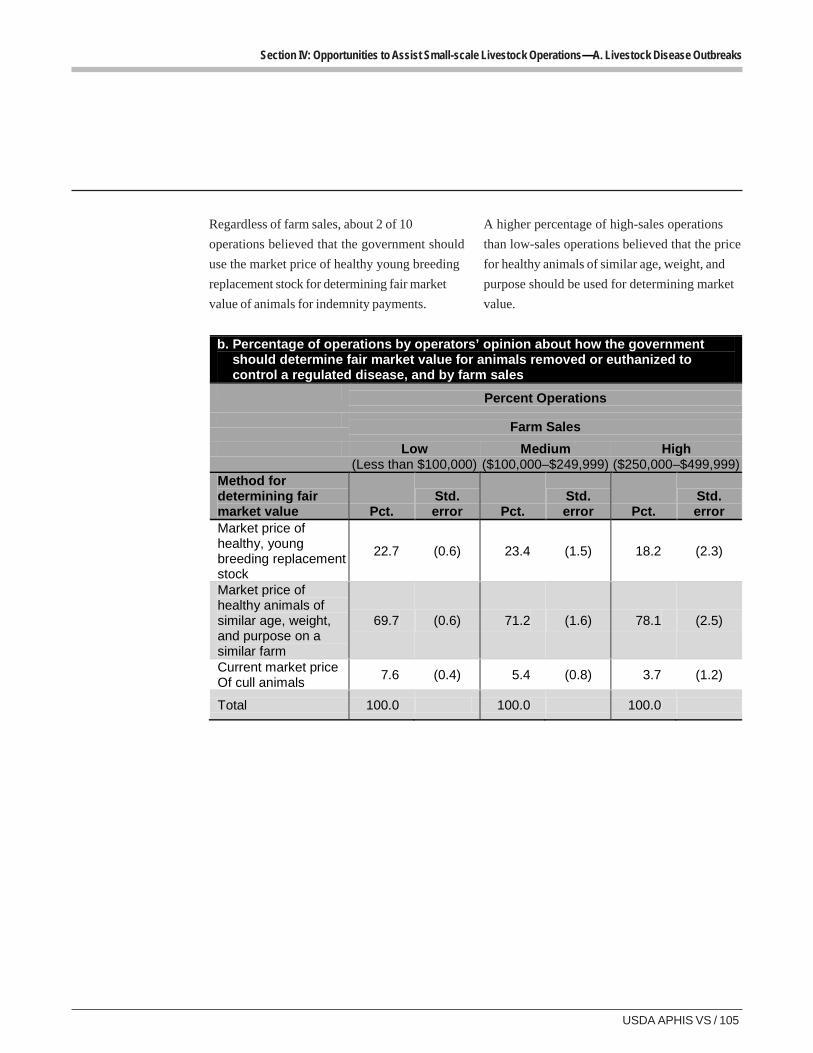
USDA APHIS VS / 105
Section IV: Opportunities to Assist Small-scale Livestock Operations—A. Livestock Disease Outbreaks
Regardless of farm sales, about 2 of 10
operations believed that the government should
use the market price of healthy young breeding
replacement stock for determining fair market
value of animals for indemnity payments.
A higher percentage of high-sales operations
than low-sales operations believed that the price
for healthy animals of similar age, weight, and
purpose should be used for determining market
value.
b. Percentage of operations by operators’ opinion about how the government should determine fair market value for animals removed or euthanized to control a regulated disease, and by farm sales
Percent Operations
Farm Sales
Low (Less than $100,000)
Medium ($100,000–$249,999)
High ($250,000–$499,999)
Method for determining fair market value Pct.
Std. error Pct.
Std. error Pct.
Std. error
Market price of healthy, young breeding replacement stock
22.7 (0.6) 23.4 (1.5) 18.2 (2.3)
Market price of healthy animals of similar age, weight, and purpose on a similar farm
69.7 (0.6) 71.2 (1.6) 78.1 (2.5)
Current market price Of cull animals
7.6 (0.4) 5.4 (0.8) 3.7 (1.2)
Total 100.0 100.0 100.0
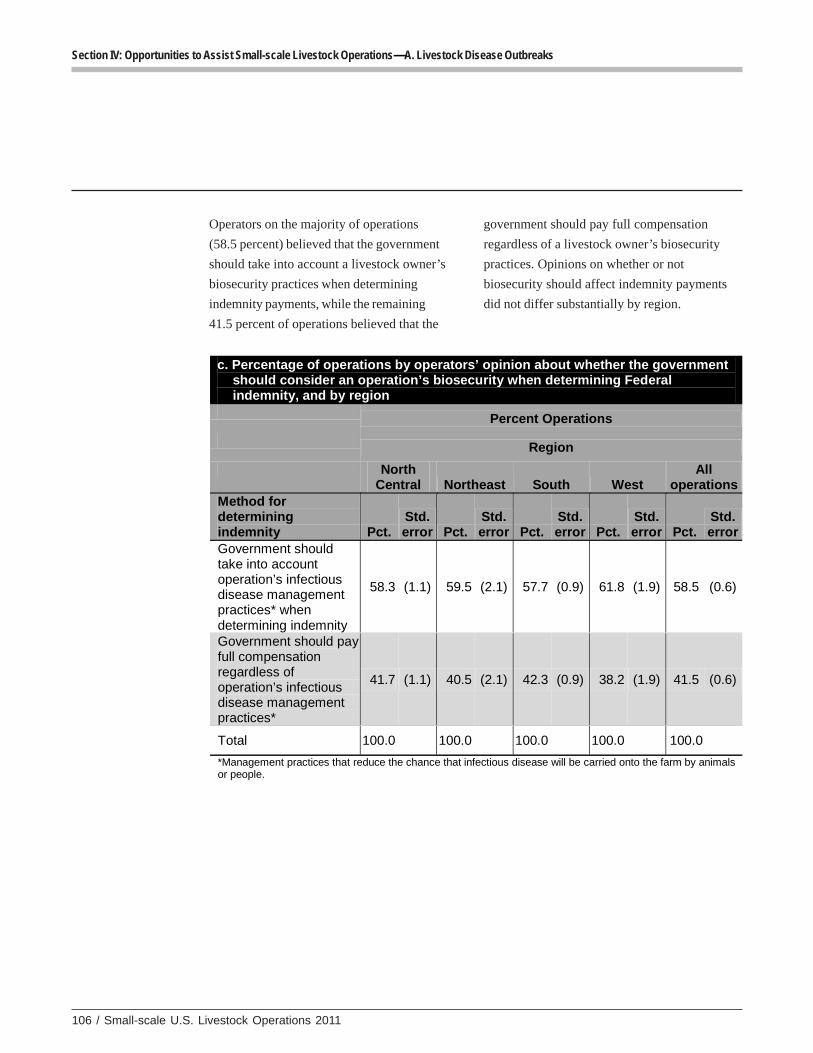
106 / Small-scale U.S. Livestock Operations 2011
Section IV: Opportunities to Assist Small-scale Livestock Operations—A. Livestock Disease Outbreaks
Operators on the majority of operations
(58.5 percent) believed that the government
should take into account a livestock owner’s
biosecurity practices when determining
indemnity payments, while the remaining
41.5 percent of operations believed that the
government should pay full compensation
regardless of a livestock owner’s biosecurity
practices. Opinions on whether or not
biosecurity should affect indemnity payments
did not differ substantially by region.
c. Percentage of operations by operators’ opinion about whether the government should consider an operation’s biosecurity when determining Federal indemnity, and by region
Percent Operations
Region
North Central Northeast South West
All operations
Method for determining indemnity Pct.
Std. error Pct.
Std. error Pct.
Std. error Pct.
Std. error Pct.
Std. error
Government should take into account operation’s infectious disease management practices* when determining indemnity
58.3 (1.1) 59.5 (2.1) 57.7 (0.9) 61.8 (1.9) 58.5 (0.6)
Government should pay full compensation regardless of operation’s infectious disease management practices*
41.7 (1.1) 40.5 (2.1) 42.3 (0.9) 38.2 (1.9) 41.5 (0.6)
Total 100.0 100.0 100.0 100.0 100.0
*Management practices that reduce the chance that infectious disease will be carried onto the farm by animals or people.
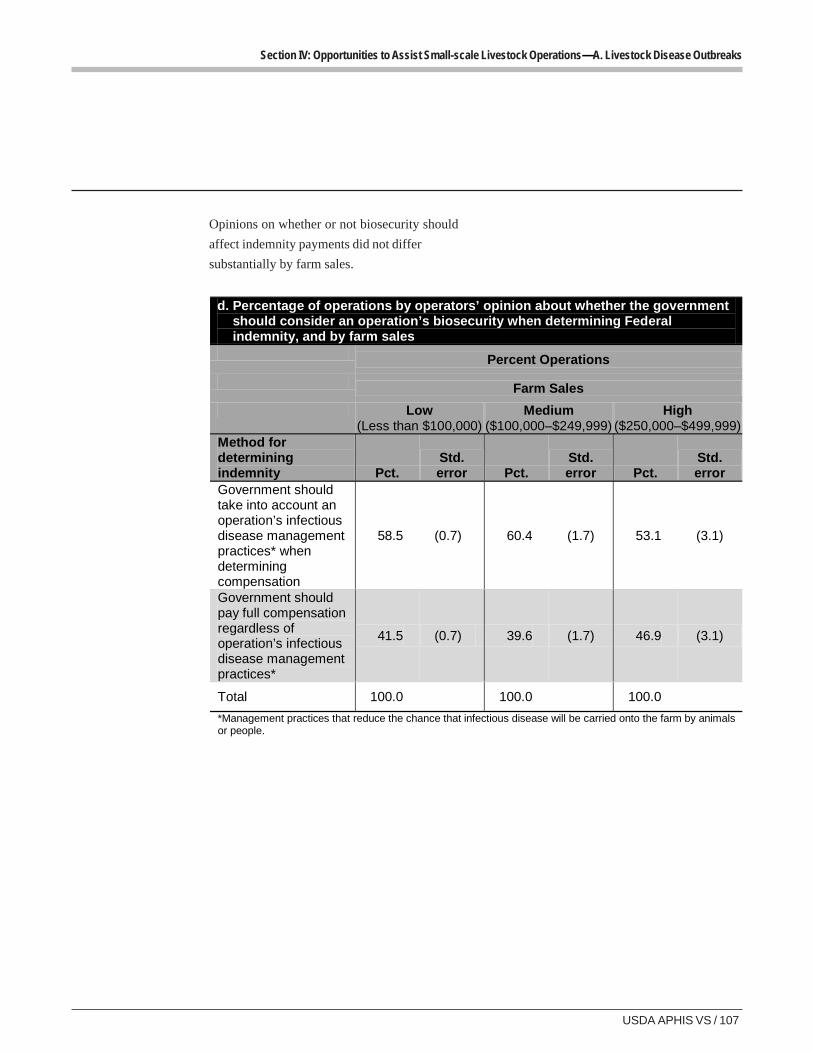
USDA APHIS VS / 107
Section IV: Opportunities to Assist Small-scale Livestock Operations—A. Livestock Disease Outbreaks
Opinions on whether or not biosecurity should
affect indemnity payments did not differ
substantially by farm sales.
d. Percentage of operations by operators’ opinion about whether the government should consider an operation’s biosecurity when determining Federal indemnity, and by farm sales
Percent Operations
Farm Sales
Low (Less than $100,000)
Medium ($100,000–$249,999)
High ($250,000–$499,999)
Method for determining indemnity Pct.
Std. error Pct.
Std. error Pct.
Std. error
Government should take into account an operation’s infectious disease management practices* when determining compensation
58.5 (0.7) 60.4 (1.7) 53.1 (3.1)
Government should pay full compensation regardless of operation’s infectious disease management practices*
41.5 (0.7) 39.6 (1.7) 46.9 (3.1)
Total 100.0 100.0 100.0
*Management practices that reduce the chance that infectious disease will be carried onto the farm by animals or people.
108 / Small-scale U.S. Livestock Operations 2011
Section IV: Opportunities to Assist Small-scale Livestock Operations—B. Information and Training Needs
B. Information and Training NeedsB. Information and Training NeedsB. Information and Training NeedsB. Information and Training NeedsB. Information and Training Needs
Operators of small-scale operations are a diverse
group with varying levels of experience in
farming. Many operators have spent a lifetime in
farming or ranching, while others are relatively
new to the business. Based on research by the
Economic Research Service in 2007, about
22 percent of all U.S. farms were operated by
producers who had been in farming for 10 years
or less (ERS, 2009). Federal agencies and
universities provide relevant training and
informational resources to assist small-scale
operations. This section identifies topics in
which small-scale livestock operators want more
training and the preferred methods for delivering
that training.
Training topics deemed very useful by the
highest percentage of operations were animal
health/diseases and how to transfer the farm to
the next generation (41.0 and
40.9 percent of operations, respectively). Almost
7 of 10 operations (69.2 percent) did not think
training on hiring and managing labor would be
useful, which makes sense considering the 2007
Census of Agriculture reported that only
27 percent of all U.S. farms with annual gross
sales between $5,000 and $249,999 hired outside
labor (NASS, 2009).
Operators on about 3 percent of operations
reported “other” types of useful training, such
as weed control and herbicides, soil topics,
chemicals and pesticides, sustainability and
conservation, animal nutrition, natural and
organic farming, safety issues, how to be more
profitable, animal genetics and breeding, and
computer training.
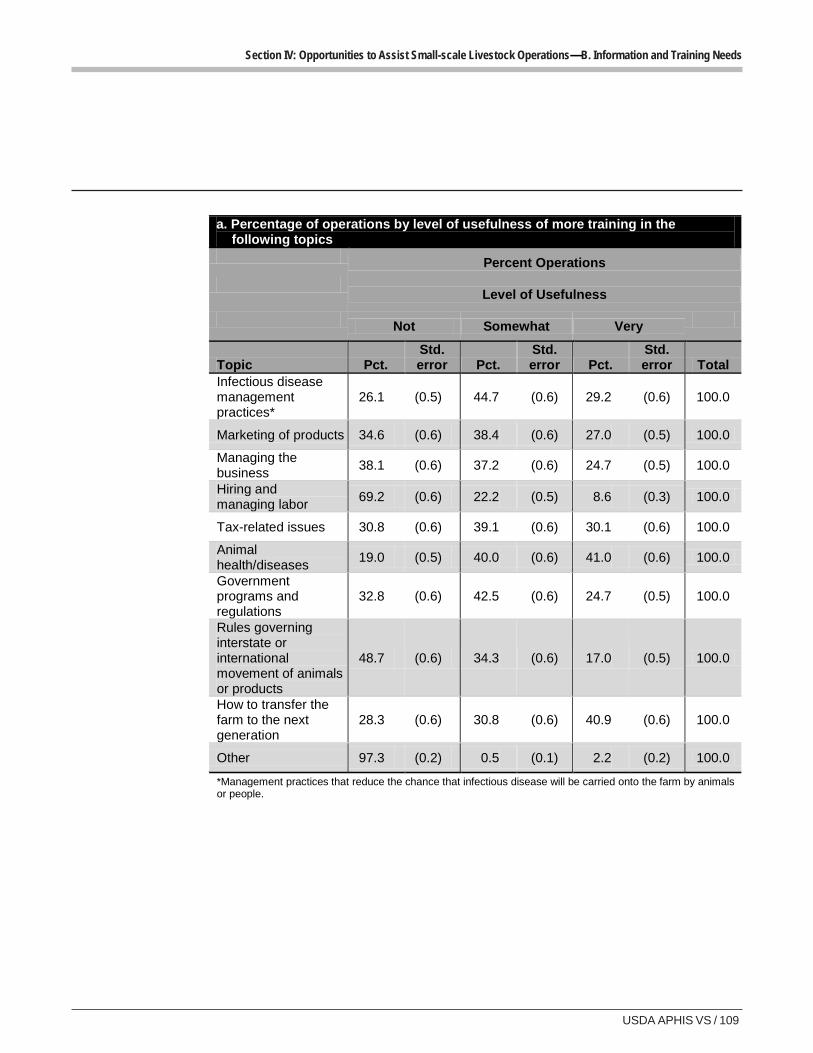
USDA APHIS VS / 109
Section IV: Opportunities to Assist Small-scale Livestock Operations—B. Information and Training Needs
a. Percentage of operations by level of usefulness of more training in the following topics
Percent Operations
Level of Usefulness
Not Somewhat Very
Topic Pct. Std. error Pct.
Std. error Pct.
Std. error Total
Infectious disease management practices*
26.1 (0.5) 44.7 (0.6) 29.2 (0.6) 100.0
Marketing of products 34.6 (0.6) 38.4 (0.6) 27.0 (0.5) 100.0
Managing the business
38.1 (0.6) 37.2 (0.6) 24.7 (0.5) 100.0
Hiring and managing labor
69.2 (0.6) 22.2 (0.5) 8.6 (0.3) 100.0
Tax-related issues 30.8 (0.6) 39.1 (0.6) 30.1 (0.6) 100.0
Animal health/diseases
19.0 (0.5) 40.0 (0.6) 41.0 (0.6) 100.0
Government programs and regulations
32.8 (0.6) 42.5 (0.6) 24.7 (0.5) 100.0
Rules governing interstate or international movement of animals or products
48.7 (0.6) 34.3 (0.6) 17.0 (0.5) 100.0
How to transfer the farm to the next generation
28.3 (0.6) 30.8 (0.6) 40.9 (0.6) 100.0
Other 97.3 (0.2) 0.5 (0.1) 2.2 (0.2) 100.0
*Management practices that reduce the chance that infectious disease will be carried onto the farm by animals or people.
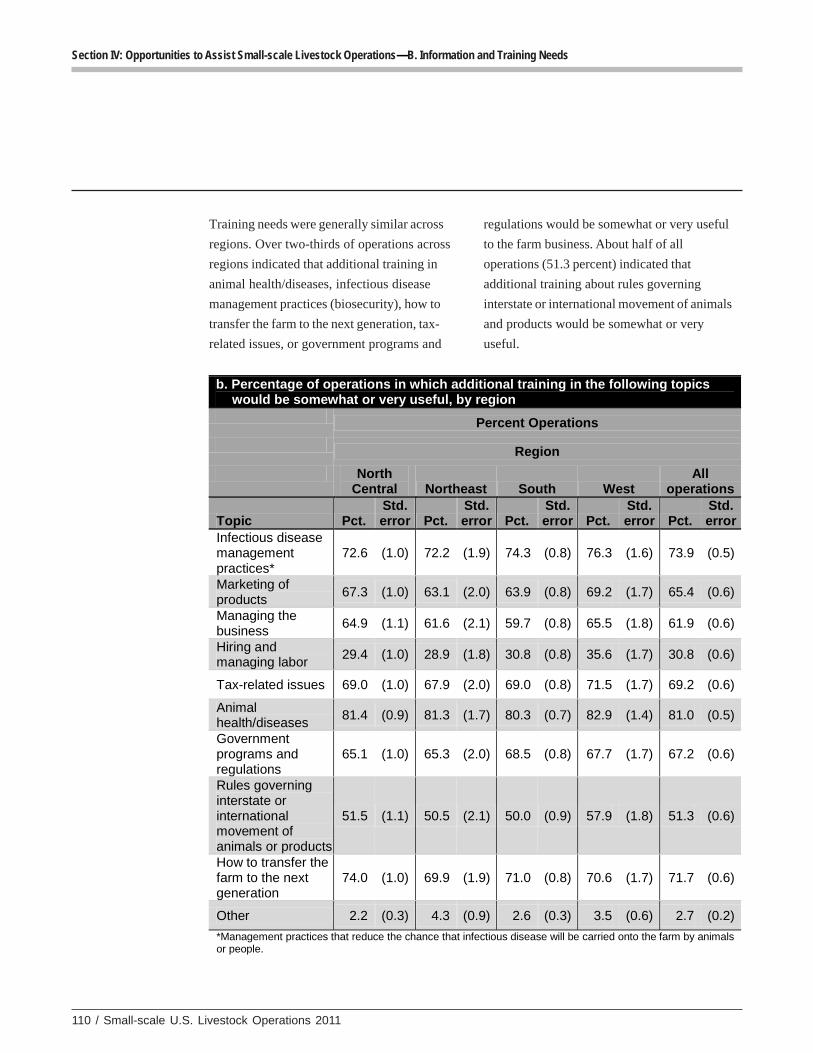
110 / Small-scale U.S. Livestock Operations 2011
Section IV: Opportunities to Assist Small-scale Livestock Operations—B. Information and Training Needs
Training needs were generally similar across
regions. Over two-thirds of operations across
regions indicated that additional training in
animal health/diseases, infectious disease
management practices (biosecurity), how to
transfer the farm to the next generation, tax-
related issues, or government programs and
regulations would be somewhat or very useful
to the farm business. About half of all
operations (51.3 percent) indicated that
additional training about rules governing
interstate or international movement of animals
and products would be somewhat or very
useful.
b. Percentage of operations in which additional training in the following topics would be somewhat or very useful, by region
Percent Operations
Region
North Central Northeast South West
All operations
Topic Pct. Std. error Pct.
Std. error Pct.
Std. error Pct.
Std. error Pct.
Std. error
Infectious disease management practices*
72.6 (1.0) 72.2 (1.9) 74.3 (0.8) 76.3 (1.6) 73.9 (0.5)
Marketing of products
67.3 (1.0) 63.1 (2.0) 63.9 (0.8) 69.2 (1.7) 65.4 (0.6)
Managing the business
64.9 (1.1) 61.6 (2.1) 59.7 (0.8) 65.5 (1.8) 61.9 (0.6)
Hiring and managing labor
29.4 (1.0) 28.9 (1.8) 30.8 (0.8) 35.6 (1.7) 30.8 (0.6)
Tax-related issues 69.0 (1.0) 67.9 (2.0) 69.0 (0.8) 71.5 (1.7) 69.2 (0.6)
Animal health/diseases
81.4 (0.9) 81.3 (1.7) 80.3 (0.7) 82.9 (1.4) 81.0 (0.5)
Government programs and regulations
65.1 (1.0) 65.3 (2.0) 68.5 (0.8) 67.7 (1.7) 67.2 (0.6)
Rules governing interstate or international movement of animals or products
51.5 (1.1) 50.5 (2.1) 50.0 (0.9) 57.9 (1.8) 51.3 (0.6)
How to transfer the farm to the next generation
74.0 (1.0) 69.9 (1.9) 71.0 (0.8) 70.6 (1.7) 71.7 (0.6)
Other 2.2 (0.3) 4.3 (0.9) 2.6 (0.3) 3.5 (0.6) 2.7 (0.2)
*Management practices that reduce the chance that infectious disease will be carried onto the farm by animals or people.
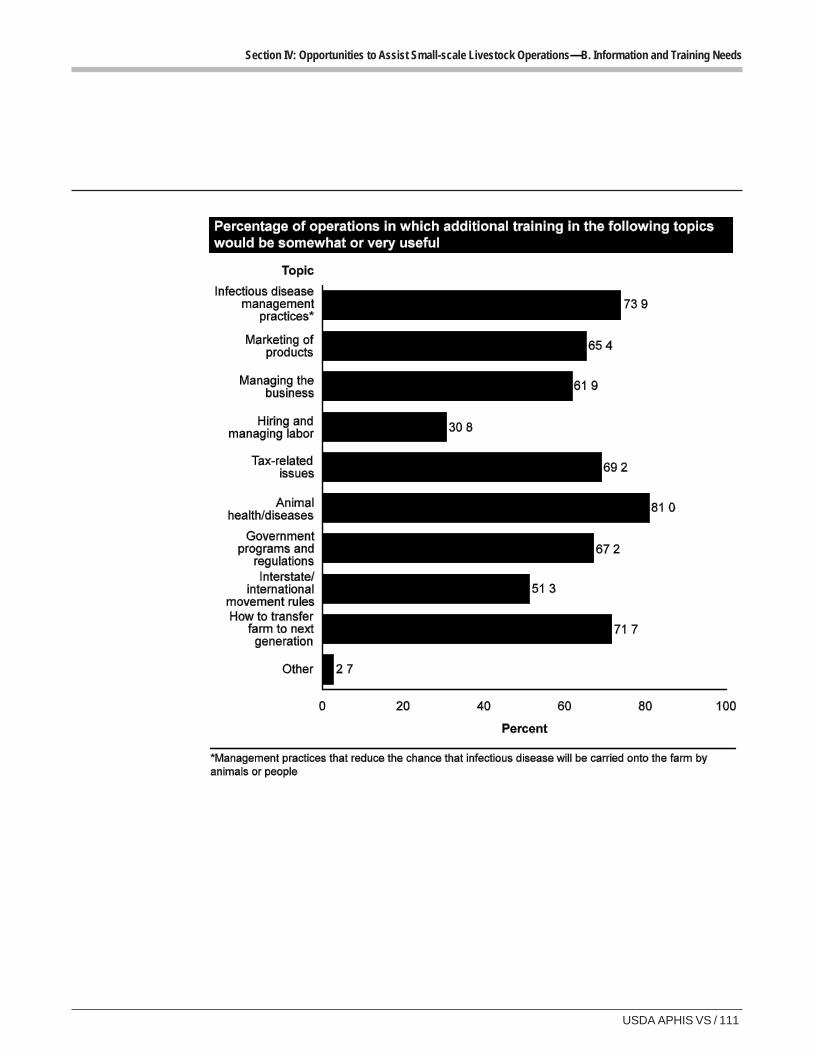
USDA APHIS VS / 111
Section IV: Opportunities to Assist Small-scale Livestock Operations—B. Information and Training Needs
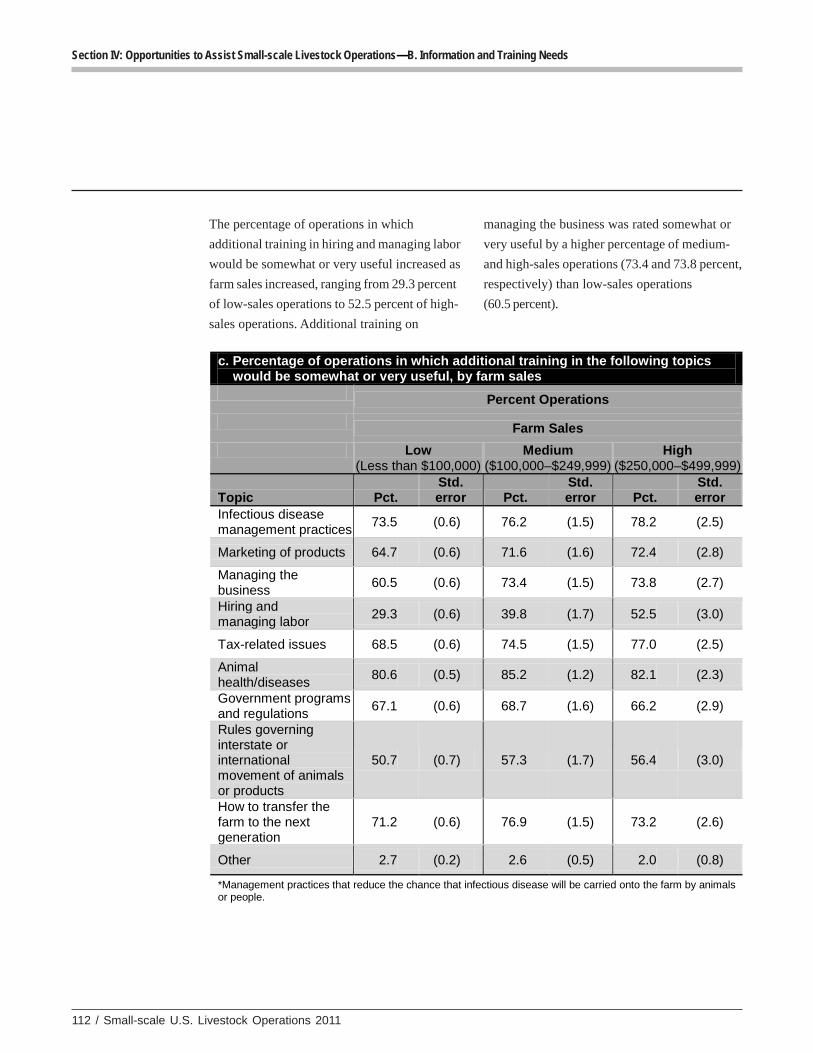
112 / Small-scale U.S. Livestock Operations 2011
Section IV: Opportunities to Assist Small-scale Livestock Operations—B. Information and Training Needs
The percentage of operations in which
additional training in hiring and managing labor
would be somewhat or very useful increased as
farm sales increased, ranging from 29.3 percent
of low-sales operations to 52.5 percent of high-
sales operations. Additional training on
managing the business was rated somewhat or
very useful by a higher percentage of medium-
and high-sales operations (73.4 and 73.8 percent,
respectively) than low-sales operations
(60.5 percent).
c. Percentage of operations in which additional training in the following topics would be somewhat or very useful, by farm sales
Percent Operations
Farm Sales
Low (Less than $100,000)
Medium ($100,000–$249,999)
High ($250,000–$499,999)
Topic Pct. Std. error Pct.
Std. error Pct.
Std. error
Infectious disease management practices
73.5 (0.6) 76.2 (1.5) 78.2 (2.5)
Marketing of products 64.7 (0.6) 71.6 (1.6) 72.4 (2.8)
Managing the business
60.5 (0.6) 73.4 (1.5) 73.8 (2.7)
Hiring and managing labor
29.3 (0.6) 39.8 (1.7) 52.5 (3.0)
Tax-related issues 68.5 (0.6) 74.5 (1.5) 77.0 (2.5)
Animal health/diseases
80.6 (0.5) 85.2 (1.2) 82.1 (2.3)
Government programs and regulations
67.1 (0.6) 68.7 (1.6) 66.2 (2.9)
Rules governing interstate or international movement of animals or products
50.7 (0.7) 57.3 (1.7) 56.4 (3.0)
How to transfer the farm to the next generation
71.2 (0.6) 76.9 (1.5) 73.2 (2.6)
Other 2.7 (0.2) 2.6 (0.5) 2.0 (0.8)
*Management practices that reduce the chance that infectious disease will be carried onto the farm by animals or people.
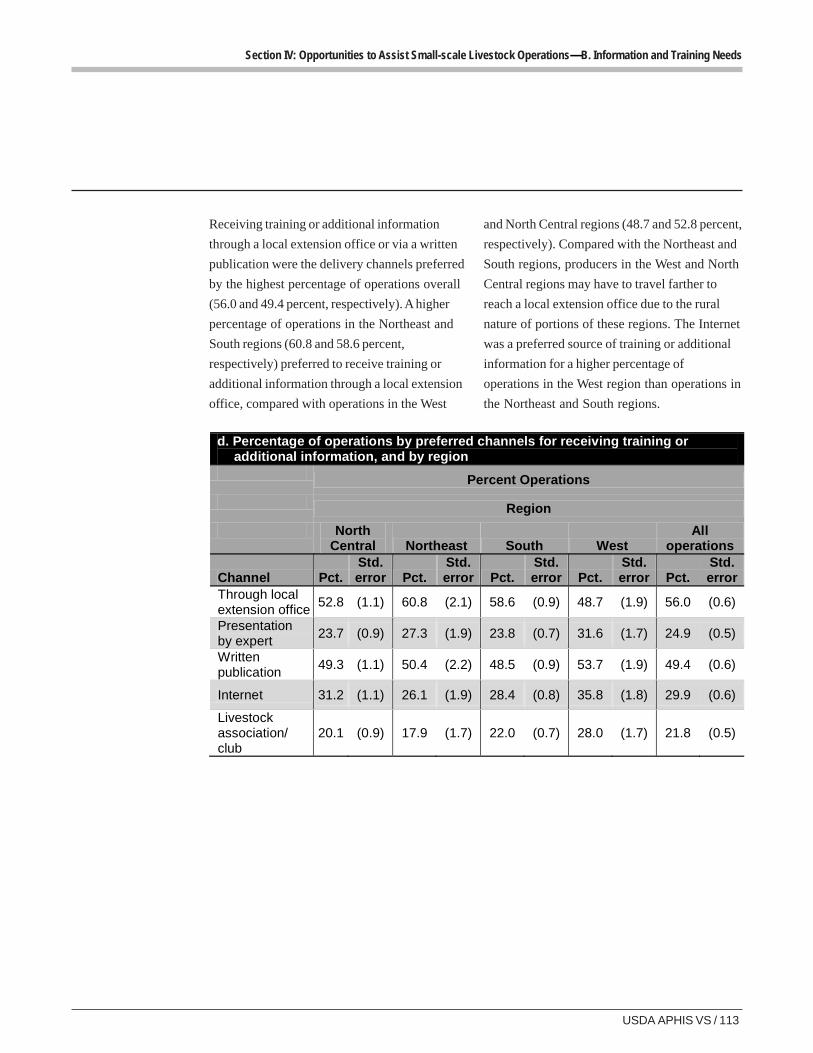
USDA APHIS VS / 113
Section IV: Opportunities to Assist Small-scale Livestock Operations—B. Information and Training Needs
Receiving training or additional information
through a local extension office or via a written
publication were the delivery channels preferred
by the highest percentage of operations overall
(56.0 and 49.4 percent, respectively). A higher
percentage of operations in the Northeast and
South regions (60.8 and 58.6 percent,
respectively) preferred to receive training or
additional information through a local extension
office, compared with operations in the West
and North Central regions (48.7 and 52.8 percent,
respectively). Compared with the Northeast and
South regions, producers in the West and North
Central regions may have to travel farther to
reach a local extension office due to the rural
nature of portions of these regions. The Internet
was a preferred source of training or additional
information for a higher percentage of
operations in the West region than operations in
the Northeast and South regions.
d. Percentage of operations by preferred channels for receiving training or additional information, and by region
Percent Operations
Region
North Central Northeast South West
All operations
Channel Pct. Std. error Pct.
Std. error Pct.
Std. error Pct.
Std. error Pct.
Std. error
Through local extension office
52.8 (1.1) 60.8 (2.1) 58.6 (0.9) 48.7 (1.9) 56.0 (0.6)
Presentation by expert
23.7 (0.9) 27.3 (1.9) 23.8 (0.7) 31.6 (1.7) 24.9 (0.5)
Written publication
49.3 (1.1) 50.4 (2.2) 48.5 (0.9) 53.7 (1.9) 49.4 (0.6)
Internet 31.2 (1.1) 26.1 (1.9) 28.4 (0.8) 35.8 (1.8) 29.9 (0.6)
Livestock association/ club
20.1 (0.9) 17.9 (1.7) 22.0 (0.7) 28.0 (1.7) 21.8 (0.5)
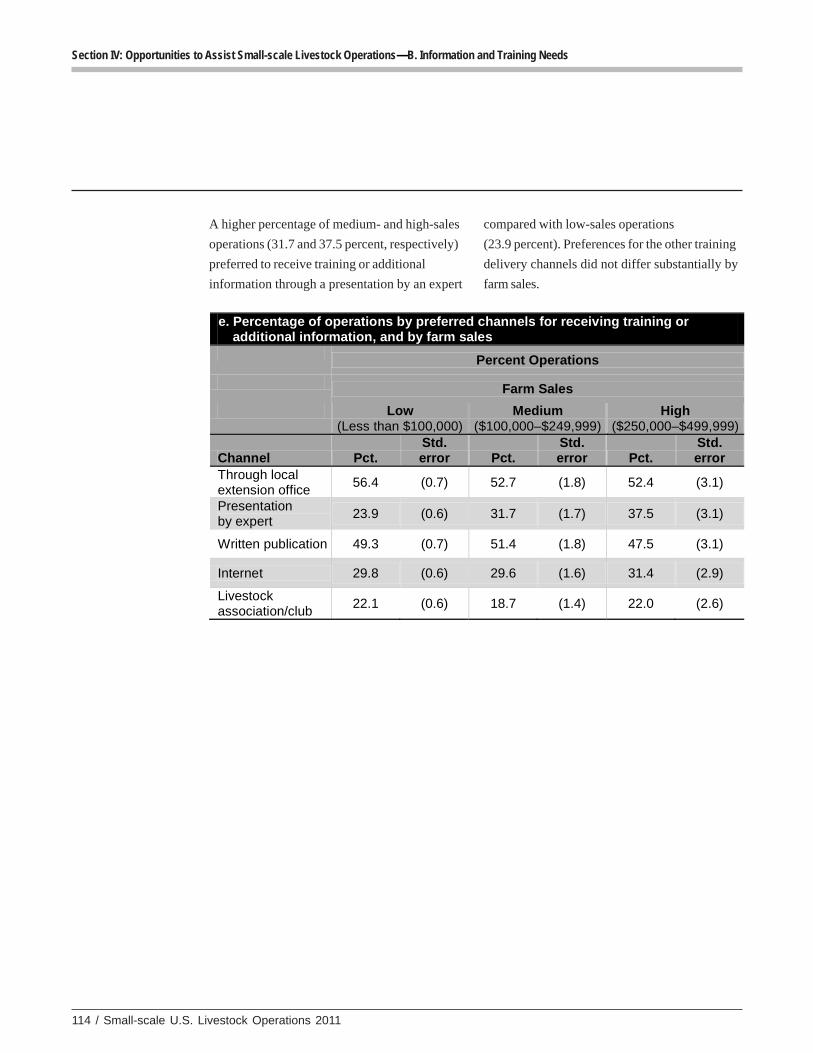
114 / Small-scale U.S. Livestock Operations 2011
Section IV: Opportunities to Assist Small-scale Livestock Operations—B. Information and Training Needs
A higher percentage of medium- and high-sales
operations (31.7 and 37.5 percent, respectively)
preferred to receive training or additional
information through a presentation by an expert
compared with low-sales operations
(23.9 percent). Preferences for the other training
delivery channels did not differ substantially by
farm sales.
e. Percentage of operations by preferred channels for receiving training or additional information, and by farm sales
Percent Operations
Farm Sales
Low (Less than $100,000)
Medium ($100,000–$249,999)
High ($250,000–$499,999)
Channel Pct. Std. error Pct.
Std. error Pct.
Std. error
Through local extension office
56.4 (0.7) 52.7 (1.8) 52.4 (3.1)
Presentation by expert
23.9 (0.6) 31.7 (1.7) 37.5 (3.1)
Written publication 49.3 (0.7) 51.4 (1.8) 47.5 (3.1)
Internet 29.8 (0.6) 29.6 (1.6) 31.4 (2.9)
Livestock association/club
22.1 (0.6) 18.7 (1.4) 22.0 (2.6)
USDA APHIS VS / 115
Methodology
MethodologyMethodologyMethodologyMethodologyMethodologyA. Study PurposeA. Study PurposeA. Study PurposeA. Study PurposeA. Study Purpose
This report is the fourth in a series of reports
resulting from the Small-scale Operations
Initiative implemented by the National Animal
Health Monitoring System (NAHMS) at the
request of the administrator of the U.S.
Department of Agriculture-Animal and Plant
Health Inspection Service. The primary objective
of the Small-scale Operations Initiative is to
provide statistically valid information on the
characteristics of small-scale operations and
obtain a better understanding of the challenges
and barriers they face.
B. Sampling and EstimationB. Sampling and EstimationB. Sampling and EstimationB. Sampling and EstimationB. Sampling and Estimation
1. Operationselection
NASS performed the sample selection from its
list frame. Within each State a stratified random
sample of livestock operations was selected.
Livestock operations are operations in which
livestock or an animal commodity comprises the
highest percentage of total sales from the
operation. The size strata were based on the
total value of sales of agricultural products for
each operation. A total of 16,000 operations were
selected.
2. Populationinferences
Inferences cover the population of small-scale
livestock operations with annual sales from
$10,000 to $499,999 in all 50 States. (See
Appendix II for data on small-scale livestock
operations in individual States.) All respondent
data were statistically weighted to reflect the
population from which they were selected. The
inverse of the probability of selection for each
operation was the initial selection weight. This
selection weight was adjusted for nonresponse
within each State and size group to allow for
inference back to the original population from
which the sample was selected.
116 / Small-scale U.S. Livestock Operations 2011
Methodology
C. DatC. DatC. DatC. DatC. Data Collectiona Collectiona Collectiona Collectiona Collection
An introductory letter and information sheet
were mailed to selected operations beginning
April 1, 2011, followed 1 week later by the
questionnaire and a cover letter. One week later
respondents were contacted via an automatic
dialing machine with a prerecorded message
reminding respondents to complete and mail the
questionnaire and thanking them if they already
had. Nonrespondents to the mailing were
contacted by telephone from April 14 to May 18,
2011, and surveys were completed via a
telephone interview. Telephone interviews were
conducted via computer-assisted telephone
interview software by a NASS Data Collection
Center.
D. DatD. DatD. DatD. DatD. Data Anala Anala Anala Anala Analyyyyysississississis
Initial data entry and validation for the Small-
scale U.S. Livestock Operations report were
performed at a NASS office. Data were entered
into a SAS data set. NAHMS national staff
performed additional data validation. Weighted
point estimates and standard errors were
generated using SUDAAN software, which
accounts for the sampling design and weighting.
E. SamE. SamE. SamE. SamE. Sample Evple Evple Evple Evple Evaluationaluationaluationaluationaluation
The purpose of this section is to provide
various performance measurements. Historically,
the term “response rate” was used as a catchall
term, but there are many ways to define and
calculate response rates. Therefore, the
following table presents an evaluation based on
a number of measurements, which are defined
with an x in categories that contribute to the
measurement.
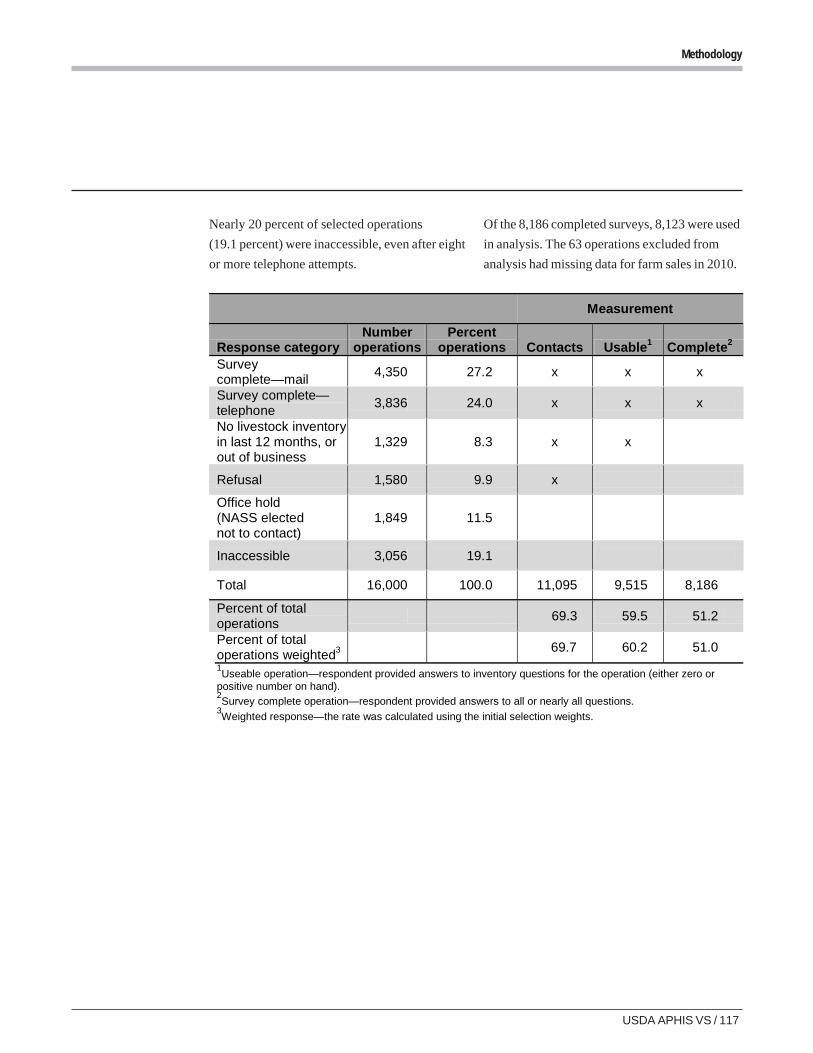
USDA APHIS VS / 117
Methodology
Of the 8,186 completed surveys, 8,123 were used
in analysis. The 63 operations excluded from
analysis had missing data for farm sales in 2010.
Measurement
Response category Number
operations Percent
operations Contacts Usable1 Complete2 Survey complete—mail
4,350 27.2 x x x
Survey complete—telephone
3,836 24.0 x x x
No livestock inventory in last 12 months, or out of business
1,329 8.3 x x
Refusal 1,580 9.9 x
Office hold (NASS elected not to contact)
1,849 11.5
Inaccessible 3,056 19.1
Total 16,000 100.0 11,095 9,515 8,186
Percent of total operations
69.3 59.5 51.2
Percent of total operations weighted3
69.7 60.2 51.0
1Useable operation—respondent provided answers to inventory questions for the operation (either zero or
positive number on hand). 2Survey complete operation—respondent provided answers to all or nearly all questions.
3Weighted response—the rate was calculated using the initial selection weights.
Nearly 20 percent of selected operations
(19.1 percent) were inaccessible, even after eight
or more telephone attempts.
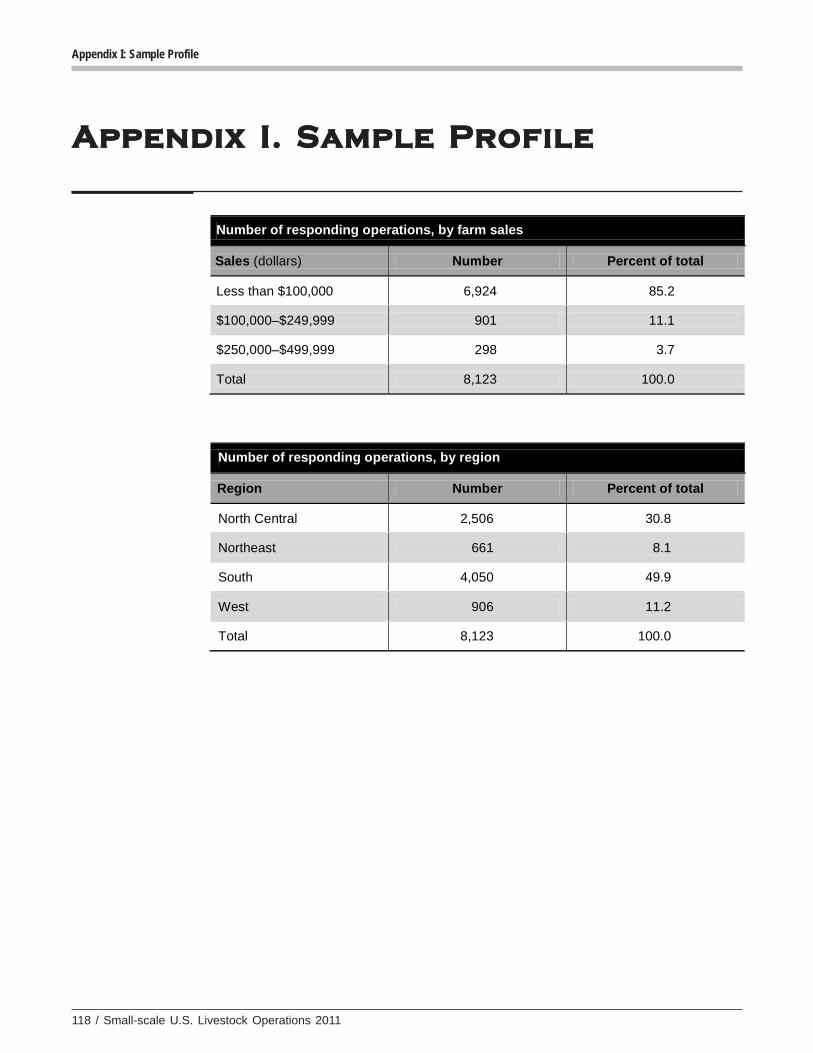
118 / Small-scale U.S. Livestock Operations 2011
Appendix I: Sample Profile
Appendix I. Sample ProfileAppendix I. Sample ProfileAppendix I. Sample ProfileAppendix I. Sample ProfileAppendix I. Sample Profile
Number of responding operations, by farm sales
Sales (dollars) Number Percent of total
Less than $100,000 6,924 85.2
$100,000–$249,999 901 11.1
$250,000–$499,999 298 3.7
Total 8,123 100.0
Number of responding operations, by region
Region Number Percent of total
North Central 2,506 30.8
Northeast 661 8.1
South 4,050 49.9
West 906 11.2
Total 8,123 100.0
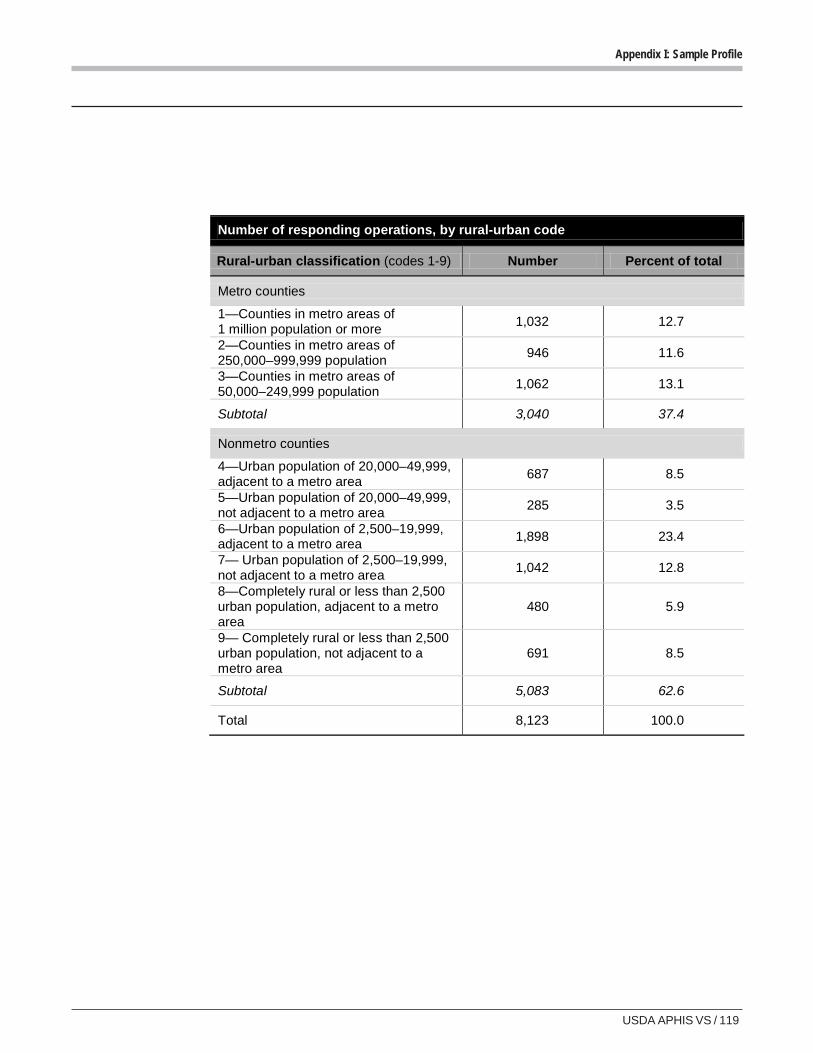
USDA APHIS VS / 119
Appendix I: Sample Profile
Number of responding operations, by rural-urban code
Rural-urban classification (codes 1-9) Number Percent of total
Metro counties
1—Counties in metro areas of 1 million population or more
1,032 12.7
2—Counties in metro areas of 250,000–999,999 population
946 11.6
3—Counties in metro areas of 50,000–249,999 population
1,062 13.1
Subtotal 3,040 37.4
Nonmetro counties
4—Urban population of 20,000–49,999, adjacent to a metro area
687 8.5
5—Urban population of 20,000–49,999, not adjacent to a metro area
285 3.5
6—Urban population of 2,500–19,999, adjacent to a metro area
1,898 23.4
7— Urban population of 2,500–19,999, not adjacent to a metro area
1,042 12.8
8—Completely rural or less than 2,500 urban population, adjacent to a metro area
480 5.9
9— Completely rural or less than 2,500 urban population, not adjacent to a metro area
691 8.5
Subtotal 5,083 62.6
Total 8,123 100.0
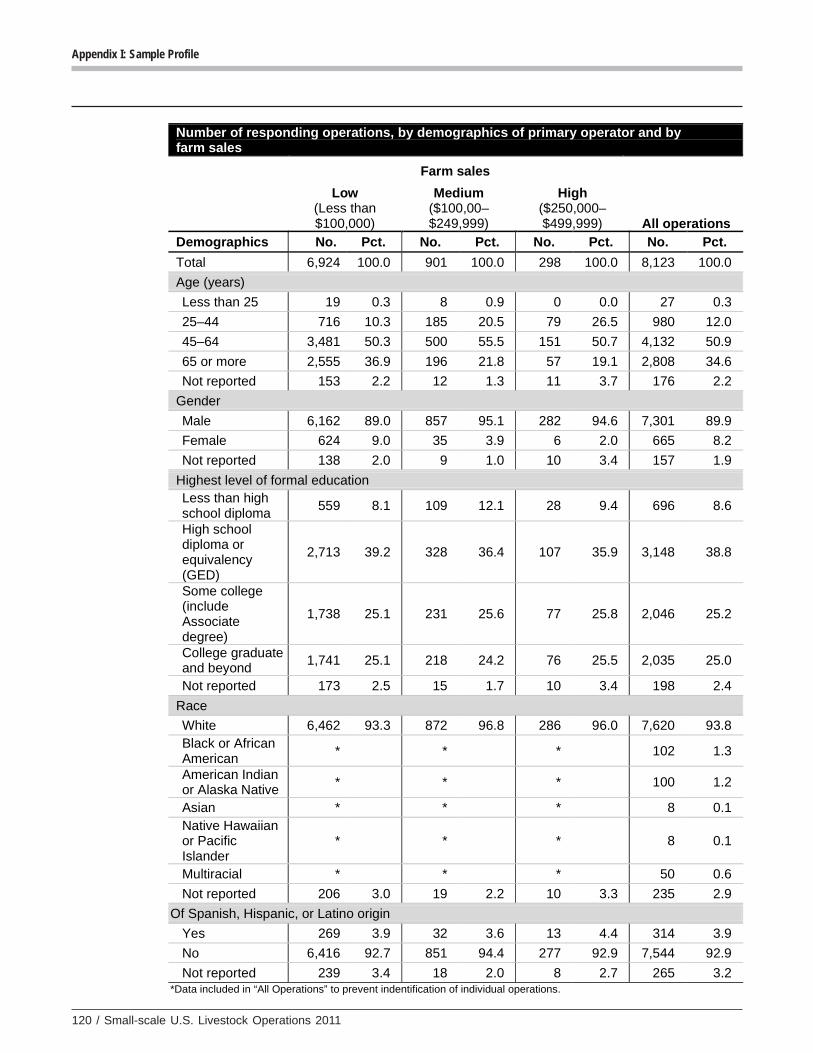
120 / Small-scale U.S. Livestock Operations 2011
Appendix I: Sample Profile
Number of responding operations, by demographics of primary operator and by farm sales
Farm sales
Low
(Less than $100,000)
Medium ($100,00–$249,999)
High ($250,000–$499,999) All operations
Demographics No. Pct. No. Pct. No. Pct. No. Pct.
Total 6,924 100.0 901 100.0 298 100.0 8,123 100.0
Age (years)
Less than 25 19 0.3 8 0.9 0 0.0 27 0.3
25–44 716 10.3 185 20.5 79 26.5 980 12.0
45–64 3,481 50.3 500 55.5 151 50.7 4,132 50.9
65 or more 2,555 36.9 196 21.8 57 19.1 2,808 34.6
Not reported 153 2.2 12 1.3 11 3.7 176 2.2
Gender
Male 6,162 89.0 857 95.1 282 94.6 7,301 89.9
Female 624 9.0 35 3.9 6 2.0 665 8.2
Not reported 138 2.0 9 1.0 10 3.4 157 1.9
Highest level of formal education Less than high school diploma
559 8.1 109 12.1 28 9.4 696 8.6
High school diploma or equivalency (GED)
2,713 39.2 328 36.4 107 35.9 3,148 38.8
Some college (include Associate degree)
1,738 25.1 231 25.6 77 25.8 2,046 25.2
College graduate and beyond
1,741 25.1 218 24.2 76 25.5 2,035 25.0
Not reported 173 2.5 15 1.7 10 3.4 198 2.4
Race
White 6,462 93.3 872 96.8 286 96.0 7,620 93.8 Black or African American
* * * 102 1.3
American Indian or Alaska Native
* * * 100 1.2
Asian * * * 8 0.1 Native Hawaiian or Pacific Islander
* * * 8 0.1
Multiracial * * * 50 0.6
Not reported 206 3.0 19 2.2 10 3.3 235 2.9
Of Spanish, Hispanic, or Latino origin
Yes 269 3.9 32 3.6 13 4.4 314 3.9
No 6,416 92.7 851 94.4 277 92.9 7,544 92.9
Not reported 239 3.4 18 2.0 8 2.7 265 3.2 *Data included in “All Operations” to prevent indentification of individual operations.
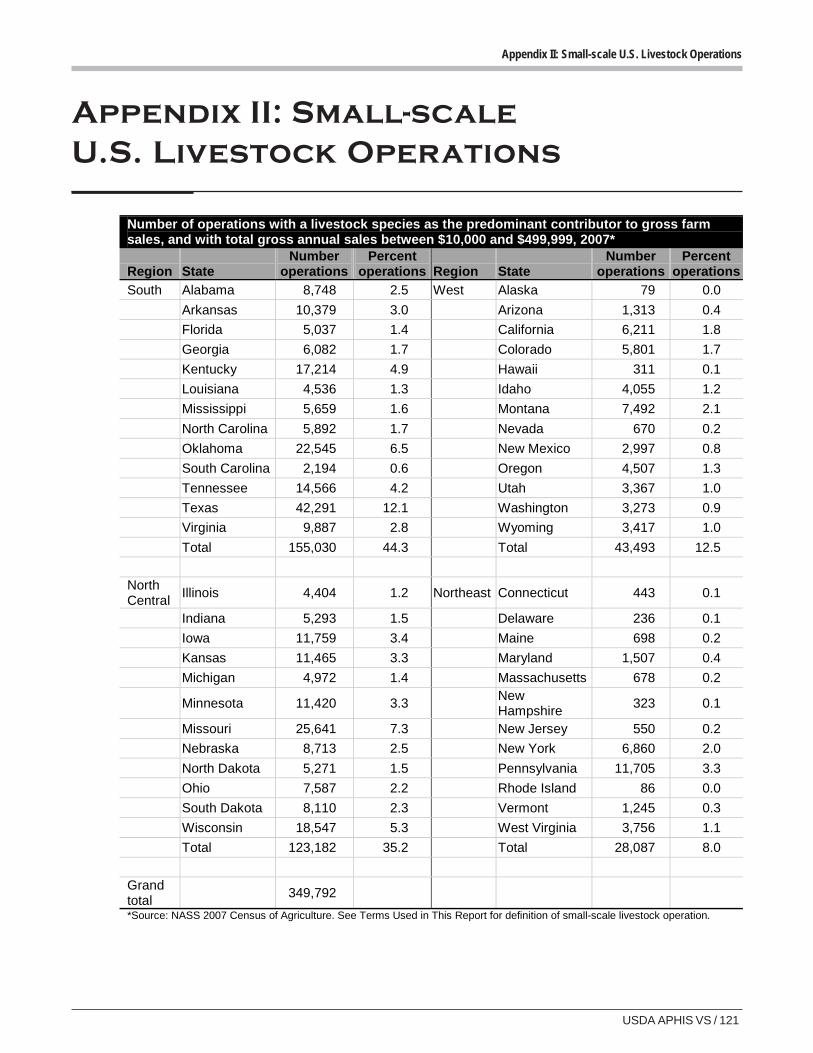
USDA APHIS VS / 121
Appendix II: Small-scale U.S. Livestock Operations
Appendix II: Small-scaleU.S. Livestock Operations
Number of operations with a livestock species as the predominant contributor to gross farm sales, and with total gross annual sales between $10,000 and $499,999, 2007*
Region State Number
operations Percent
operations Region State Number
operations Percent
operations
South Alabama 8,748 2.5 West Alaska 79 0.0
Arkansas 10,379 3.0 Arizona 1,313 0.4
Florida 5,037 1.4 California 6,211 1.8
Georgia 6,082 1.7 Colorado 5,801 1.7
Kentucky 17,214 4.9 Hawaii 311 0.1
Louisiana 4,536 1.3 Idaho 4,055 1.2
Mississippi 5,659 1.6 Montana 7,492 2.1
North Carolina 5,892 1.7 Nevada 670 0.2
Oklahoma 22,545 6.5 New Mexico 2,997 0.8
South Carolina 2,194 0.6 Oregon 4,507 1.3
Tennessee 14,566 4.2 Utah 3,367 1.0
Texas 42,291 12.1 Washington 3,273 0.9
Virginia 9,887 2.8 Wyoming 3,417 1.0
Total 155,030 44.3 Total 43,493 12.5
North Central
Illinois 4,404 1.2 Northeast Connecticut 443 0.1
Indiana 5,293 1.5 Delaware 236 0.1
Iowa 11,759 3.4 Maine 698 0.2
Kansas 11,465 3.3 Maryland 1,507 0.4
Michigan 4,972 1.4 Massachusetts 678 0.2
Minnesota 11,420 3.3 New Hampshire
323 0.1
Missouri 25,641 7.3 New Jersey 550 0.2
Nebraska 8,713 2.5 New York 6,860 2.0
North Dakota 5,271 1.5 Pennsylvania 11,705 3.3
Ohio 7,587 2.2 Rhode Island 86 0.0
South Dakota 8,110 2.3 Vermont 1,245 0.3
Wisconsin 18,547 5.3 West Virginia 3,756 1.1
Total 123,182 35.2 Total 28,087 8.0
Grand total
349,792
*Source: NASS 2007 Census of Agriculture. See Terms Used in This Report for definition of small-scale livestock operation.
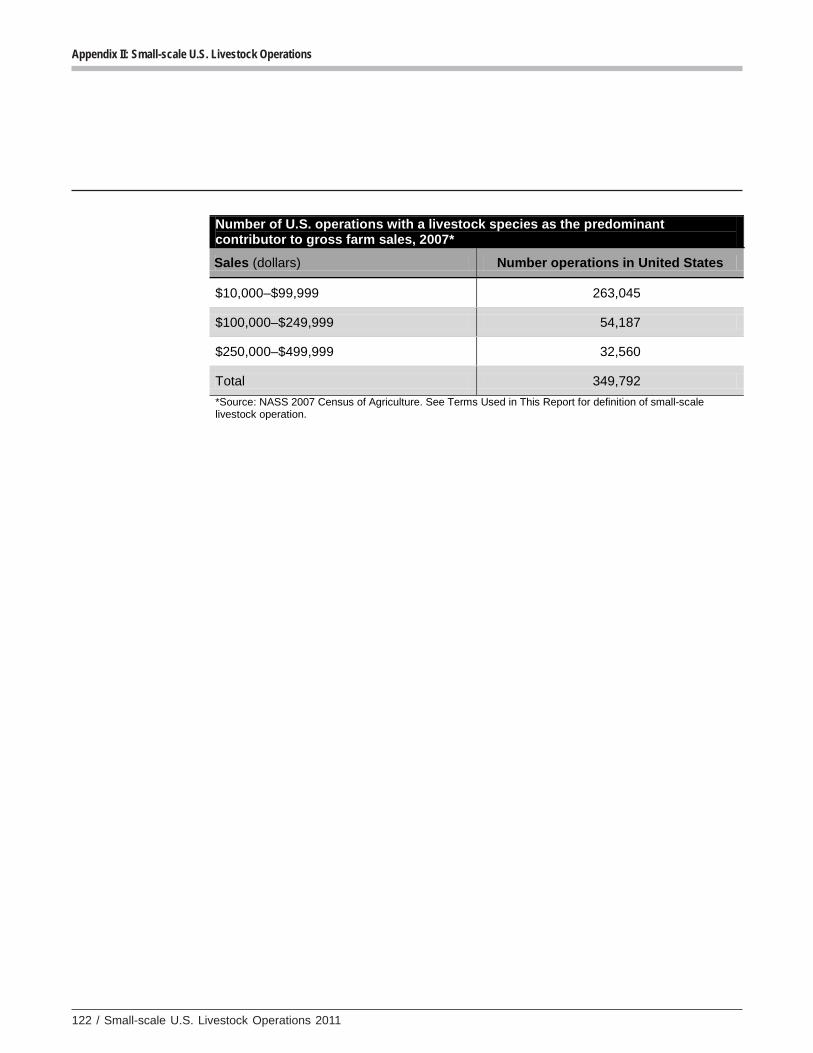
122 / Small-scale U.S. Livestock Operations 2011
Appendix II: Small-scale U.S. Livestock Operations
Number of U.S. operations with a livestock species as the predominant contributor to gross farm sales, 2007*
Sales (dollars) Number operations in United States
$10,000–$99,999 263,045
$100,000–$249,999 54,187
$250,000–$499,999 32,560
Total 349,792
*Source: NASS 2007 Census of Agriculture. See Terms Used in This Report for definition of small-scale livestock operation.
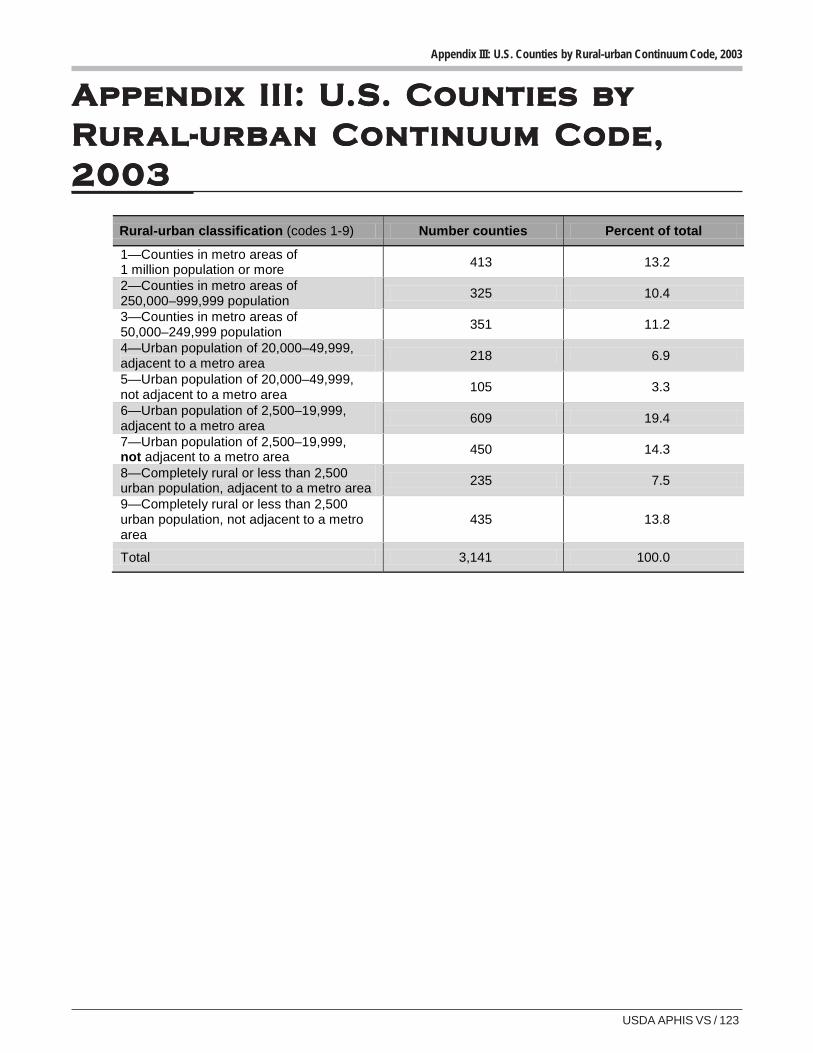
USDA APHIS VS / 123
Appendix III: U.S. Counties by Rural-urban Continuum Code, 2003
Appendix III: UAppendix III: UAppendix III: UAppendix III: UAppendix III: U.S. Counties b.S. Counties b.S. Counties b.S. Counties b.S. Counties byyyyyRRRRRururururural-urban Continuum Code,al-urban Continuum Code,al-urban Continuum Code,al-urban Continuum Code,al-urban Continuum Code,20032003200320032003
Rural-urban classification (codes 1-9) Number counties Percent of total
1—Counties in metro areas of 1 million population or more
413 13.2
2—Counties in metro areas of 250,000–999,999 population
325 10.4
3—Counties in metro areas of 50,000–249,999 population
351 11.2
4—Urban population of 20,000–49,999, adjacent to a metro area
218 6.9
5—Urban population of 20,000–49,999, not adjacent to a metro area
105 3.3
6—Urban population of 2,500–19,999, adjacent to a metro area
609 19.4
7—Urban population of 2,500–19,999, not adjacent to a metro area
450 14.3
8—Completely rural or less than 2,500 urban population, adjacent to a metro area
235 7.5
9—Completely rural or less than 2,500 urban population, not adjacent to a metro area
435 13.8
Total 3,141 100.0
124 / Small-scale Livestock Operations 2011
Appendix IV: References
Appendix IV: References
ERS. 1999a. What makes a small farm
successful? Agricultural Outlook. Available at
http://www.ers.usda.gov/publications/
agoutlook/nov1999/ao266c.pdf
ERS, 1999b. Managing risk in farming: concepts,
research and analysis. Agricultural Economic
Report #774. Accessed September 7, 2011, at
http://www.ers.usda.gov/publications/aer774/
aer774d.pdf
ERS. 2011. Accessed September 2011 at http://
www.ers.usda.gov/Briefing/WellBeing/
farmhouseincome.htm
ERS. 2009. Beginning Farmers and Ranchers.
Ahearn M and Newton D. Economic Information
Bulletin 53.
Goodsell M, Stanton 2010 T. A resource guide to
direct marketing livestock and poultry. March
2010. Available at http://
counties.cce.cornell.edu/orange/
Direct_Marketing_Livestock_and_Poultry.pdf
Hoppe RA, Korb P. 2006. Understanding U.S.
farm exits. Economic Research Service Report 21.
Sustainable Agriculture Network Publications.
2004. Opportunities in agriculture: diversifying
cropping systems. Accessed September 7, 2011,
at http://www.sare.org/Learning-Center/
Bulletins/National-SARE-Bulletins/Diversifying-
Cropping-Systems
Short SD. 2001. Characteristics and production
costs of U.S. cow-calf operations. USDA–ERS.
Accessed August 2011 at http://
www.ers.usda.gov/publications/sb974-3/sb974-
3.pdf
Swisher ME, Sterns J. 2009. An overview of
small farm direct marketing. University of Florida
Institute of Food and Agricultural Sciences.
Publication #FCS7211. Accessed September 8,
2011, at http://edis.ifas.ufl.edu/pdffiles/FY/
FY59700.pdf
NASS. 2009. A profile of small farms in Florida
and the United States: observations from the
2007 Census of Agriculture. Accessed
September 20, 2011, at http://
www.nass.usda.gov/Statistics_by_State/
Florida/Publications/Census/
A%20Profile%20of%20Small%20
Farms%20in%20Florida.pdf
NASS. 2007. Census of Agriculture: Small Farms.
Accessed September 2011 at http://
www.agcensus.usda.gov/Publications/2007/
Online_Highlights/Fact_Sheets/small_farm.pdf
USDA. 2008. NAHMS Beef 2007–08: Part I:
Reference of beef cow-calf management
practices in the United States, 2007–08, Fort
Collins, CO, #512.1008.