Embed Size (px)
Citation preview
Blood . Author manuscript
Page /1 14
An in vitro model of differentiation of memory B cells into plasmablastsand plasma cells including detailed phenotypic and molecularcharacterizationMichel Jourdan 1 , Anouk Caraux 1 , John De Vos 1 2 3 , Genevi ve Fiol è 2 , Marion Larroque 2 , Chantal Cognot 4 , Caroline Bret 1 2 ,Christophe Duperray 1 2 , Dirk Hose 5 6 , Bernard Klein 1 2 3 *
Bioth rapie des cellules souches normales et canc reuses 1 é é INSERM : U847 , Institut de recherche en bioth rapie é , Universit Montpellier I é , CHRU Montpellier , IRB - CHRU Saint-Eloi 80 Avenue Augustin Fliche 34295 MONTPELLIER Cedex 5,FR
IRB, Institut de recherche en bioth rapie 2 é CHRU Montpellier , Universit Montpellier I é , H pital Saint-Eloi 34000 Montpellier,FRô
UFR M decine 3 é Universit Montpellier I é , Montpellier,FR
Laboratoire d'immunologie 4 CHRU montpellier , Universit Montpellier I é , FR
Medizinische Klinik und Poliklinik V 5 Universit tsklinikum Heidelberg ä , Universit tsklinikum Heidelberg INF410 69115 Heidelberg,DEä
Nationales Centrum f r Tumorerkrankungen 6 ü INF350, D-69115 Heidelberg,DE
* Correspondence should be adressed to: Bernard Klein <[email protected] >
Abstract
Human plasma cells (PCs) and their precursors play an essential role in humoral immune response, but are rare and difficult to
harvest. We report here i) the generation of human syndecan-1 and immunoglobulin secreting PCs starting from memory B cells +
(MBCs) in a 3-step- and 10-day (D) culture, including a 6-fold cell amplification. ii) We report the detailed phenotypic and Affymetrix
gene expression profiles of these PCs as well as of intermediate cells - activated B cells (actBCs) and plasmablasts (PBs) -in vitro
compared to MBCs and bone marrow PCs, which is accessible through an open web ATLAS ( ). iii)http://amazonia.transcriptome.eu/
We show this B cell to PC differentiation to involve and expressions in D4 actBCs, decrease of and IRF4 AICDA PAX5 BCL6
expressions and increase in and expressions in D7 PBs and D10 PCs. It involves downregulation of genes controlled byPRDM1 XBP1
Pax5, induction of genes controlled by Blimp-1 and XBP1 (unfold protein response). iv) The detailed phenotype of D10 PCs resembles
that of peripheral blood PCs detected after immunization of healthy donors. This model will facilitate further studies in PCin vitro
biology. It will likewise be helpful to study plasma-cell dyscrasias, including multiple myeloma.
MESH Keywords B-Cell-Specific Activator Protein ; genetics ; B-Lymphocytes ; cytology ; immunology ; metabolism ; Bone Marrow Cells ; cytology ; immunology ;
metabolism ; Cell Culture Techniques ; Cell Differentiation ; Cells, Cultured ; Cytidine Deaminase ; genetics ; DNA-Binding Proteins ; genetics ; Flow Cytometry ; Gene
Expression Profiling ; Humans ; Immunoglobulins ; metabolism ; Immunologic Memory ; Immunophenotyping ; Interferon Regulatory Factors ; genetics ; Models, Biological ;
Oligonucleotide Array Sequence Analysis ; methods ; Plasma Cells ; cytology ; immunology ; metabolism ; Reverse Transcriptase Polymerase Chain Reaction ; Stem Cells ;
cytology ; immunology ; metabolism ; Syndecan-1 ; secretion ; Time Factors ; Transcription Factors ; genetics
Author Keywords plasma cell ; B lymphocyte ; transcription factors ; multiple myeloma
Introduction
Human plasma cells (PCs) and their precursors play an essential role in humoral immune response, but likewise give rise to a variety
of malignant B-cell disorders, including multiple myeloma. The final steps of B cell differentiation have been extensively studied during
the last 10 years. Na ve B cells entering into lymph node through high endothelial venules are selected by the Ag in the germinal1 –3 ïcenter reaction, yielding selection of B cells with high affinity immunoglobulins (Igs) and differentiation into memory B cells (MBCs,
CD20 CD19 CD27 CD38 ) and early plasmablasts (PBs, CD20 CD19 CD27 CD38 ). PBs exit into peripheral blood and may + + + − − + ++ ++
survive for a short period only unless they are recruited into mucosa or bone marrow niches, depending on their chemokine receptor
expression. These niches provide these PBs the factors to survive and further differentiate into long-living mature PCs. CCR104 –6 7
expressing IgA PBs are mainly recruited to mucosa niche by the CCL28 chemokine. In the bone marrow, the PC niche involves SDF-1 + 8
producing cells recruiting CXCR4 PBs and is shared by hematopoietic stem cells and Pre-pro-B cells. The rarity of this niche explains + 9
the low amount of bone marrow PCs (0.5 of BM cells) and is a matter of regulation of normal Ig production.% 10
The differentiation of B cells into PCs involves profound molecular changes yielding a cell able to produce large amounts of Igs for a
long-term period. Two sets of transcription factors (TFs) that repress each other are involved in this process (see Cobaleda andet al. 11
Calame for review). The guardian of B cell phenotype is the PAX5 TF, which induces B cell genes and represses genes as and 12 PRDM1
, whose gene products Blimp-1 and XBP1 - are critical for PC generation and survival. The BCL6 TF in association with MTA3XBP1 –maintains B cell phenotype and proliferation, downregulating expression. In germinal centre, activation of B cells through BCR,PRDM1
CD40 and/or Toll like receptor (TLR) results in upregulation of IRF4, downregulation of BCL6 protein and loss of genePRDM1
repression. This results in downregulation of gene and then upregulation of . In the centrocyte region, stimulation by IL-10,PAX5 XBP1
Blood . Author manuscript
Page /2 14
IL-21 or IL-6 results in STAT3 activation, yielding to overexpression. , This results in the full engagement of B cellPRDM1 13 14
differentiation into PBs, in particular with the switch from surface to cytoplasmic Igs, and induction of the unfold protein response driven
by XBP1. The detailed hierarchy of this molecular regulation is not fully understood and is still a challenging issue. Recent data suggest
that a PAX5 downregulation and consecutive XBP1 upregulation are the initial driving events in PC generation independently of Blimp-1
expression. Other data indicate a major role of IRF4 whose expression is triggered by NF- B signaling. In humans, research in PC15 κ 16
differentiation mechanisms is hampered by the rarity and lack of availability of PCs, due to the necessity of bone marrow aspiration.i.e.
In current models of B cell differentiation, mainly CD20 CD38 CD138 PBs have been obtained. In a recent work,in vitro 17 –21 − ++ / + −
Huggins . have reported the possibility to obtain syndecan-1 PCs through a 3-step culture but a detailed phenotypic and molecularet al 22 +
characterization of these generated cells are not available. In the current study, we first aim to design an easy culture processin vitro
making it possible to reproducibly obtain syndecan-1 PCs. The second aim was to extensively characterize these in-vitro generated PBs +
and PCs using Affymetrix gene expression profiling and multicolor cytometry and to make accessible an open web atlas of the respective
gene expression data.
Materials and MethodsReagents
Human recombinant interleukin (IL)-2, IL-12 and interferon- (IFN- ) were purchased from R&D Systems, Lille, France), IL-4, IL-6α αand IL-15 from AbCys SA (Paris, France) and IL-10 and hepatocyte growth factor (HGF) from Peprotech (Rocky Hill, NJ, USA).
Hyaluronic acid (HA) was purchased from Sigma (St Louis, MO, USA). The list of mAbs used for phenotype study are detailed in
.supplemental Methods
Cell samples
Peripheral blood cells from healthy volunteers were purchased from the French Blood Center (Toulouse, France). After removal of
CD2 cells using anti-CD2 magnetic beads (Invitrogen, Cergy Pontoise, France), CD19 CD27 MBCs were sorted by FACS Aria with a + + +
95 purity. Bone marrow PCs (BMPCs) from healthy volunteers were purified (cell purity 80 assayed by cytometry) using% ≥ %anti-CD138 magnetic microbeads sorting (Miltenyi-Biotec, Paris, France), after approval by the ethics committee and written informed
consent as described. Cells produced in the culture system were purified by multi-color fluorescence activated cell sorting (FACS) using23
FITC-conjugated anti-CD20 mAb and PE-conjugated anti-CD38 mAb for Day 4 activated B cells (CD20 CD38 cells), day 4 and day 7 + −
plasmablasts (CD20 CD38 ). Day 10 PCs (CD20 CD138 ) were FACS-sorted using FITC-conjugated anti-CD20 mAb and − + − +
PE-conjugated anti-CD138 mAb. The purity of FACS-sorted cell populations was 95 as assayed by cytometry.≥ %
Cell cultures
B-cell activation
All cultures were performed in Iscove s modified Dulbecco medium (IMDM, Invitrogen) and 10 fetal calf serum (FCS),’ %supplemented with 50 g/ml human transferrin and 5 g/ml human insulin (Sigma). Purified B cells were plated at 1.5 10 /ml andμ μ × 5
cultured with various combinations of cytokines as indicated: IL-2 (20 U/ml), IL-4 (50 ng/ml), IL-10 (50 ng/ml) and IL-12 (2 ng/ml) or
IL-2 (20 U/ml), IL-10 (50 ng/ml) and IL-15 (10 ng/ml) or IL-2 (20 U/ml) and IL-4 (50 ng/ml). Cells were cultured in 5 ml/well in 6 well
flat-bottomed culture plates. In respective cultures groups, 10 g/ml of phosphorothioate CpG oligodeoxynucleotide 2006 (Sigma)μ 24
and/or histidine tagged soluble recombinant human CD40L (50 ng/ml) and anti-poly-histidine mAb (5 g/ml) (R&D Systems) were addedμat culture start. In respective experiments, soluble CD40L was replaced by 3.75 10 /ml mitomycin-treated CD40L transfectant (a× 4
generous gift from S. Saeland, Schering-Plough, France).
Plasmablast generation
At day 4 of culture, the cells were harvested, washed and seeded at 2.5 10 /ml with various combinations of cytokines: IL-2 (20× 5
U/ml), IL-6 (50 ng/ml), IL-10 (50 ng/ml), and IL-12 (2 ng/ml) or IL-2 (20 U/ml), IL-6 (50 ng/ml), IL-10 (50 ng/ml) and IL-15 (10 ng/ml).
Plasma cell generation
At day 7 of culture, cells were washed and cultured with IL-6 (50 ng/ml), IL-15 (10 ng/ml) and IFN- (500 U/ml) for 3 days. In someαcultures, HGF (20 ng/ml) and/or HA (100 g/ml) were also added.μ
Flow cytometry analysis, cytology and immunoglobulin production
Cells were stained with FITC-anti-CD20, PE-anti-CD138 (Beckman Coulter) or PE-anti- CD38 (Becton Dickinson) mAbs.
Isotype-matched mouse mAbs were used as control. Cytospin smears of purified CD20 CD38 cells harvested at day 4 of culture, CD20 + − −
CD38 cells at day 7, and CD20 CD138 cells at day 10 were stained with May-Gr nwald-Giemsa. The percentage of cells in thebright − + ü
Blood . Author manuscript
Page /3 14
S-phase of the cell cycle was determined using propidium iodide and data were analyzed with the ModFit LT software (Verity Software
House, Topsham, ME). Immunoglobulin (Ig) production was measured in culture supernatants harvested at the end of each culture step:25
day 4, day 7 and day 10. IgM, IgA and IgG levels were evaluated by nephelometry with an automated Behring Nephelometer analyser II
(Siemens, Paris, France). The sensitivity of the assay was 2 g/ml for IgM, 3 g/ml for IgA and 4 g/ml for IgG. Ig productionμ μ μ(pg/cell/day) was estimated dividing Ig amount in the culture supernatant by the number of living cells and the duration of the culture
period.
Immunophenotypic analysis
Cells were stained using 4- to 7-colour direct immunofluorescence stain. Surface staining was performed prior to cell fixation and
permeabilization. The Cytofix/Cytoperm kit (BD Biosciences) was used for intracellular staining of IgM, IgA, IgG and Ki67 antigen,
according to manufacturer s recommendations. Flow cytometry analysis was performed with a FACSAria cytometer using FACSDiva 6.1’(Becton Dickinson, San Jose, CA). For data analysis, Cell Quest (Becton Dickinson) and Infinicit 1.3 (Cytognos SL, Salamanca, Spain)
softwares were used. The fluorescence intensity of the cell populations was compared using the stain index (SI) provided by the formula: [mean fluorescence intensity (MFI) obtained from the given mAb minus MFI obtained with a control mAb / 2 times the standard deviation] [of the MFI obtained with the same control mAb .] 26
Real-time RT-PCR analysis
Total RNA was extracted using the RNeasy Kit (Qiagen, Valencia, CA) and reverse transcribed with the Reverse Transcription Kit
(Qiagen). The assays-on-demand primers and probes and the TaqMan Universal Master Mix were used according to the manufacturer s’instructions (Applied Biosystems). Real-time RT-PCR was performed using the ABI Prism 7000 Sequence Detection System and
normalized to for each sample, and compared with the values obtained for a known positive control using the following2-microglobulin β
formula 100/2 where Ct Ct unknown Ct positive control as described.Ct ΔΔ ΔΔ = Δ − Δ 27
Microarray hybridization and bioinformatic analysis
RNA was extracted and hybridized to human genome U133 Plus 2.0 GeneChip microarrays, according to the manufacturer s’instructions (Affymetrix, Santa Clara, CA). Gene expression data are deposited in the ArrayExpress public database (
, accession number n E-MEXP-2360). Gene expression data were analyzed with ourhttp://www.ebi.ac.uk/microarray-as/ae/ °bioinformatics platforms (RAGE, ) and Amazonia ( ). The clusteringhttp://rage.montp.inserm.fr/ 28 http://amazonia.transcriptome.eu/ 29
was performed and visualized with the Cluster and TreeView softwares. Gene differentially expressed between cell populations were30
determined with the SAM statistical microarray analysis software. The biological pathways encode by these genes were analyzed with31
Ingenuity software (Ingenuity, CA, USA)
Statistical analysis
Statistical comparisons were made with the non-parametric Mann-Whitney test, unpaired or paired Student s test using SPSS’ t-
software. -values .05 were considered as significant.P ≤
ResultsObtaining of plasma cells through a 3-step culture process in vitro
Step 1. Optimization of B cell amplification and differentiation
Starting from purified CD19 CD27 MBCs, we first investigated which combination of activation signals allowed obtaining a + +
maximum number of viable activated B cells. The best result, a 6.1-fold amplification, was achieved using activations by solublei.e.
recombinant CD40L (sCD40L) and CpG oligodeoxynucleotide 2006 (ODN) and the IL-2 IL-10 IL-15 cytokine combination ( ).+ + Table 1
Comparable data were obtained using either a CD40L transfectant or sCD40L to trigger CD40 activation (results not shown). Activation
by either sCD40L or ODN only plus in each case the same additional cytokine combination yielded a 46 or 68 lower amplification% %(3.3- and 2-fold stimulation respectively, .008) ( ), indicating an additive effect if sCD40L and ODN areP ≤ supplemental Table 1
simultaneously used. Other cytokine combinations were reported to trigger B cell activation together with CD40 activation. Using sCD40L
activation and IL-2 IL-4 alone resulted in no cell amplification ( ). Adding IL-2 IL-4 IL-10 IL-12 as we reported+ supplemental Table 1 + + +initially resulted in 3.4-fold amplification as with IL-2 IL-10 IL-15. In all culture conditions, except with sCD40L IL-2 IL-4, cells20 + + + +were 87 viable. Using the optimized activation combination (sCD40L ODN IL-2 IL-10 IL-15), the expanded cells at day 4≥ % + + + +
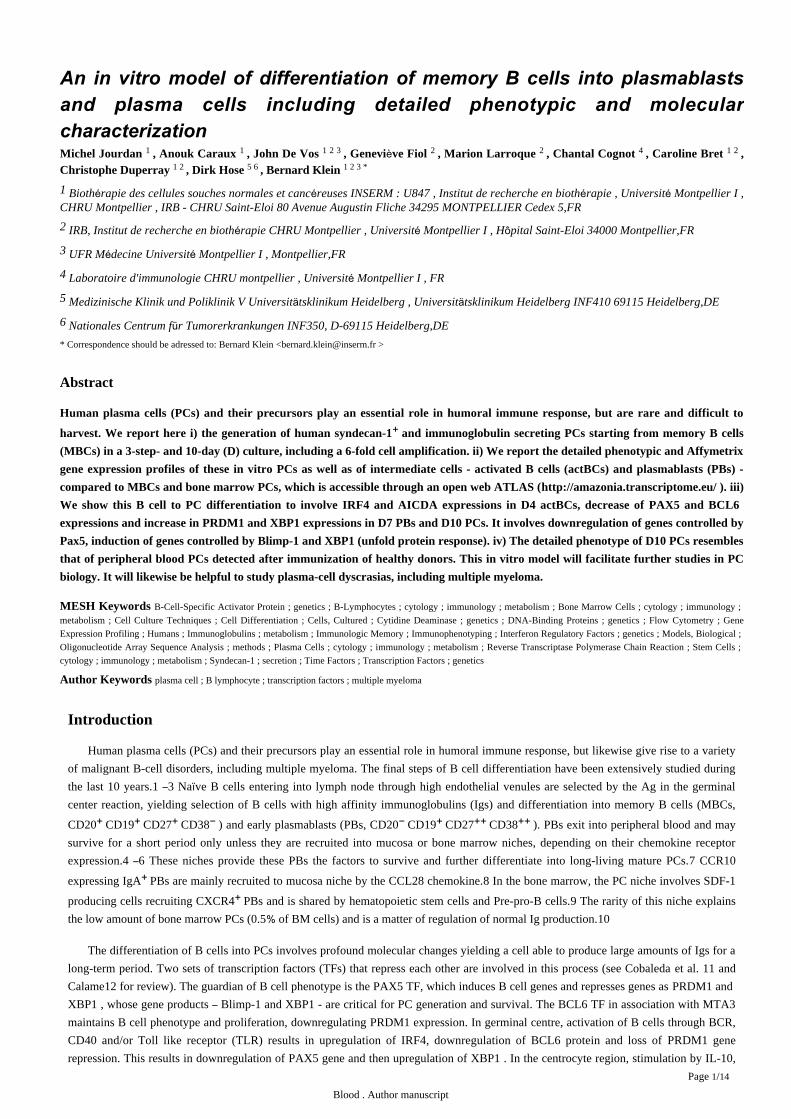
comprised 42.3 of CD20 CD38 cells, 16.4 of CD20 CD38 cells and 19.5 of CD20 CD38 cells ( ). CD20 CD38 cells% + − % + + % − ++ Table 1 + −
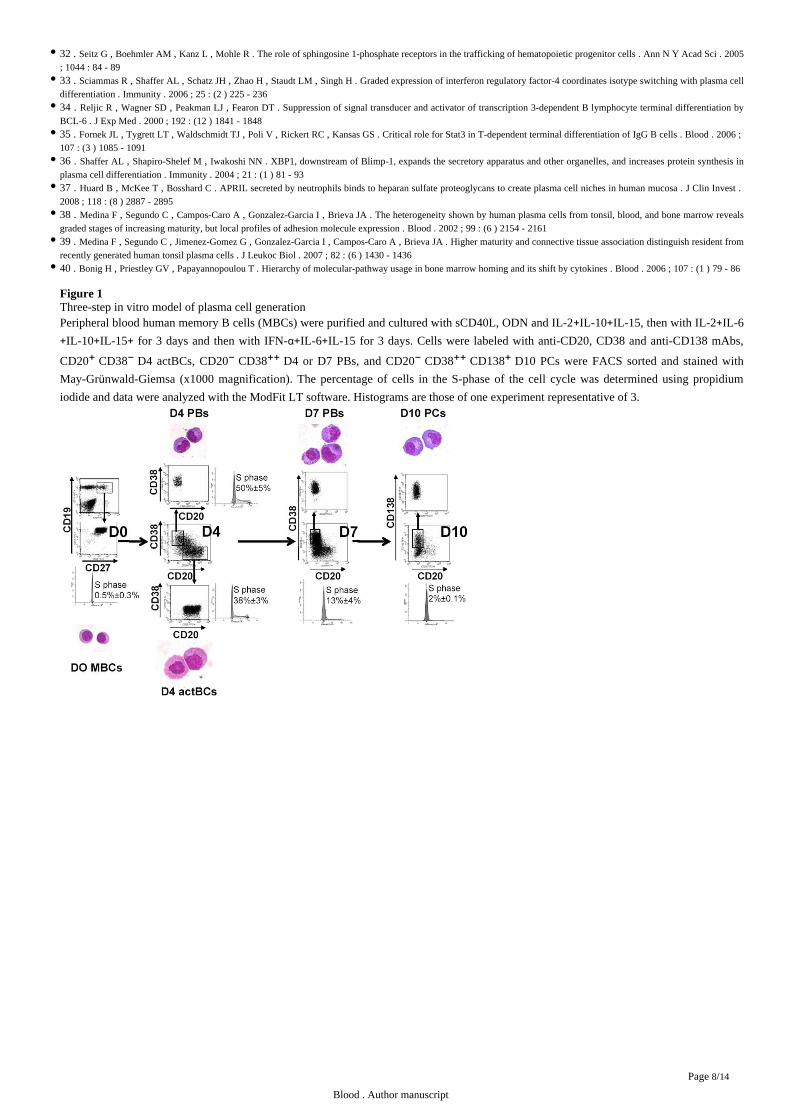
have an activated B cell cytology and were cycling (38 3 in the S phase) unlike MBCs (0.5 0.3 in the S phase) ( ).% ± % % ± % Figure 1
CD20 CD38 cells showed a typical plasmablast morphology, with an eccentrically nucleus, relatively abundant basophilic cytoplasm − ++
with archoplasm ( ). They were also highly cell cycling (50 5 in the S phase). CD20 CD38 cells were termed Day 4Figure 1 % ± % + −
activated B cells (D4 actBCs) and CD20 CD38 cells plasmablasts (PBs). − ++
Blood . Author manuscript
Page /4 14
Step 2. Cell amplification and plasmablastic differentiation
Step 2 aims to promote further PC differentiation. Soluble CD40L was removed since it partially blocks plasma cell differentiation.20
We also found that presence of ODN blocked PC differentiation (results not shown). IL-6 was added together with IL-2 IL-10 IL-15+ +since it promotes PC differentiation and survival, in particular through STAT3 activation and Blimp-1 induction. After 3 days of18 14
culture, a 3.7-fold cell expansion with 80 viable cells could be found if cells were cultured in step 1 with sCD40L and ODN ( ).≥ % Table 1
The expansion in step 2 was 57 and 32 lower ( .05) respectively, if cells were cultured with ODN or sCD40L only in step 1 (% % P ≤
). At day 3 of step 2 culture (day 7 of the whole culture), the percentage of CD20 CD38 cells decreased from 42.3supplemental Table 2 + −
at day 4 to 11.7 ( 2.10 , n 13) with an increase in the percentage of CD20 CD38 cells (56.6 , 8.10 , n 13). In% % P = 8 − = − ++ % P = 12 − =
addition, 15.9 of CD20 CD38 CD138 cells were detected. Day 7 CD20 CD38 were sorted and show the same plasmablastic% − ++ + − ++
morphology as day 4 CD20 CD38 cells and were termed day 7 plasmablasts (D7 PBs) ( ). They had a reduced number of − ++ Figure 1
cycling cells compared to day 4 plasmablasts (13 4 versus 50 5 in the S phase, paired t-test, n 3, ) and an increased% ± % % ± % = Figure 1
CD38 density (anti-CD38 stain index (SI), 125 versus 20, 5.10 , n 5). Thus, starting from one memory B cells, 12.3 6.1 CD20P = 4 − = ± −
CD38 D7 PBs could be generated using the optimal step 1 and 2 culture conditions ( ). This step-2 culture could not be extended ++ Table 1
longer than 3 days as a rapid plasmablast death occurred on days 4 5, despite addition of fresh cytokines. Prolonging the first step 1–culture for additional 4 days with fresh sCD40L ODN IL-2 IL-10 IL-15 yielded to a further B cell amplification, but to a rapid cell+ + + +death in step 2 and a lower number of overall generated PCs (results not shown).
Step 3. Plasma cell differentiation
To avoid the rapid cell death occurring after 3 days in step 2, cells were washed and cultured with IL-6 IL-15 IFN- for 3 days. 60+ + α %of the cells died at this stage. Adding hepatocyte growth factor and/or hyaluronic acid as suggested did not improve cell survival (results22
not shown). Differentiation within this last step 3 was independent on the initial step 1 conditions ( ). Surviving cellssupplemental Table 3
comprised mostly CD20 CD38 cells (79 ), including 54.8 CD20 CD38 CD138 ( ). FACS-sorted CD138 cells had PC − ++ % % − ++ + Table 1 +
cytology and were termed day 10 PCs (D10 PCs). These cells were rarely cell cycling with 2 of cells in the S phase, compared to D7 or%
D4 PBs (13 and 50 respectively). Thus, this 3-step culture process made it possible to generate 12.3 CD20 CD38 D7 PBs (at step 2)% % − ++
and 6.3 CD20 CD38 CD138 D10 PCs (at step 3) starting from one memory B cells ( ). The density of CD38 expression was − ++ + Table 1
increased in D10 PCs compared to D7 PCs (SI 276 versus 125, .006, n 5).P = =
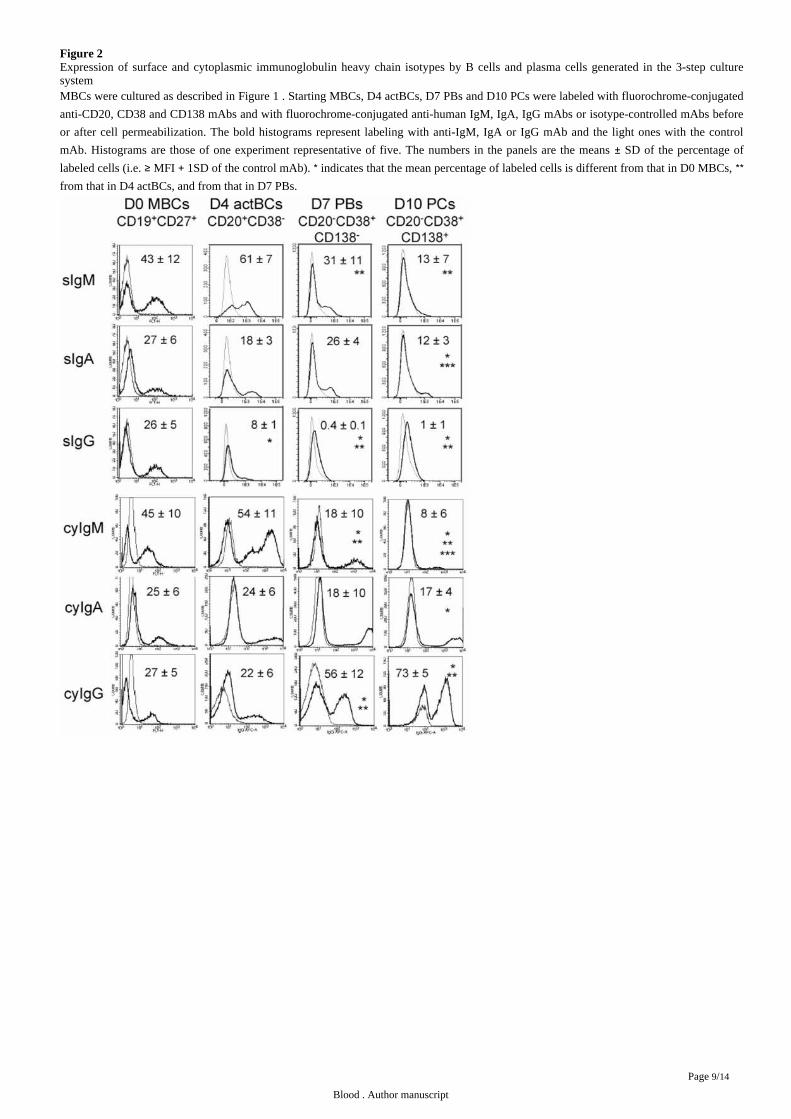
Expression of surface, cytoplasmic IgM, IgG, IgA and immunoglobulin production
Surface (s) Igs were detected by labeling cells with anti-Ig heavy chain antibodies (IgM, IgA, and IgG) without permeabilization and
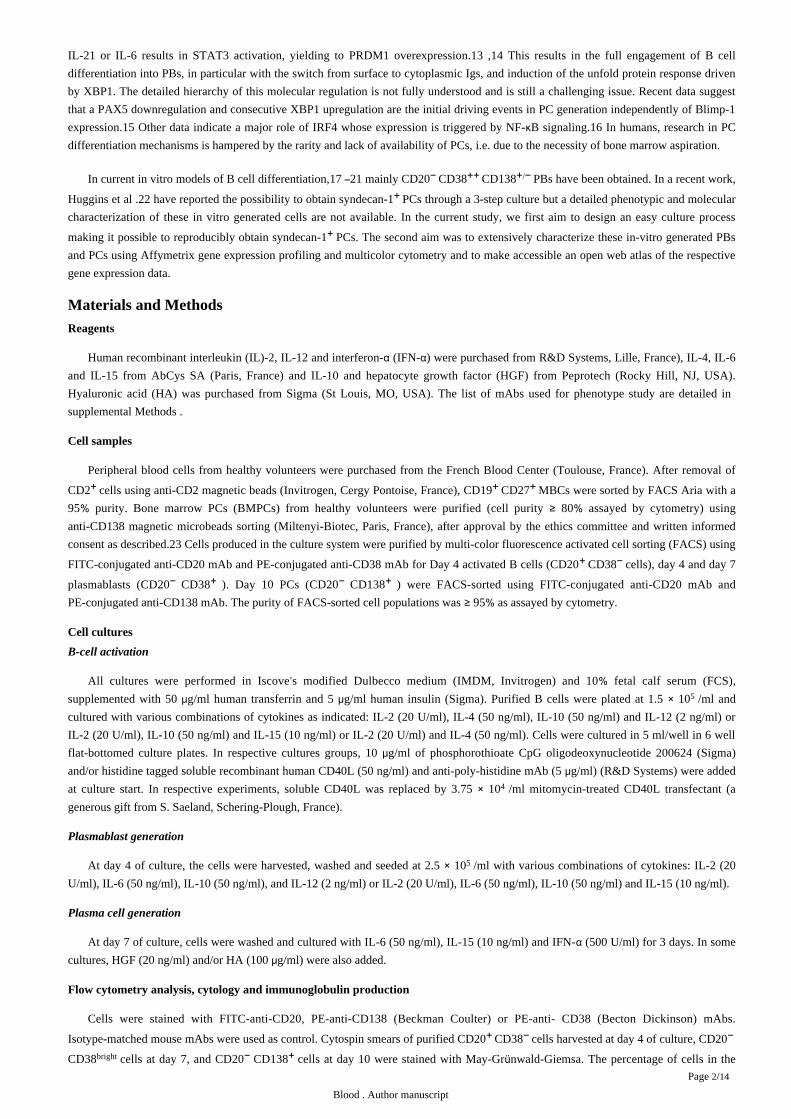
cytoplasmic (cy) and surface Igs after cell permeabilization. MBCs used to start culture comprised 43 12 sIgM , 27 6 sIgA and%± % + %± % +
26 5 sIgG cells (n 5, ). Permeabilization of MBCs yielded similar percentages of cyIgM , cyIgA and cyIgG cells with%± % + = Figure 2 + + +
similar mean fluorescence intensities (MFI). CD20 CD38 D4 actBCs comprised 61 7 sIgM and 18 3 sIgA cells (not significantly + − ± % + %± +
different from MBCs) and a 3 fold-reduced percentage of sIgG cells (8 versus 26 , .05, n 5) ( ). D4 actBCs cells were + % % P ≤ = Figure 2
preparing to secrete Igs, as permeabilization resulted in detection of 22 cyIgG actBCs and a respectively 20 fold and 2.5 fold% +
significantly increased MFI ( .05, n 5) for cyIgM and cyIgA labeling ( ). The differentiation of D4 actBCs into D7 PBs andP ≤ = Figure 2
consecutively day 10 PCs was associated with a loss of cyIgM cells (from 54 in D4 actBCs to 18 in D7 PBs and 8 in D10 PCs, + % % % P ≤
.05, n 5), an increase in cyIgG cells (from 22 in D4 actBCs to 56 in D7 PBs and 73 in D10 PCs, .05, n 5), with no= + % % % P ≤ =
significant difference in the percentage for cyIgA cells. In agreement with detection of cytoplasmic Igs and expression of PC markers by +
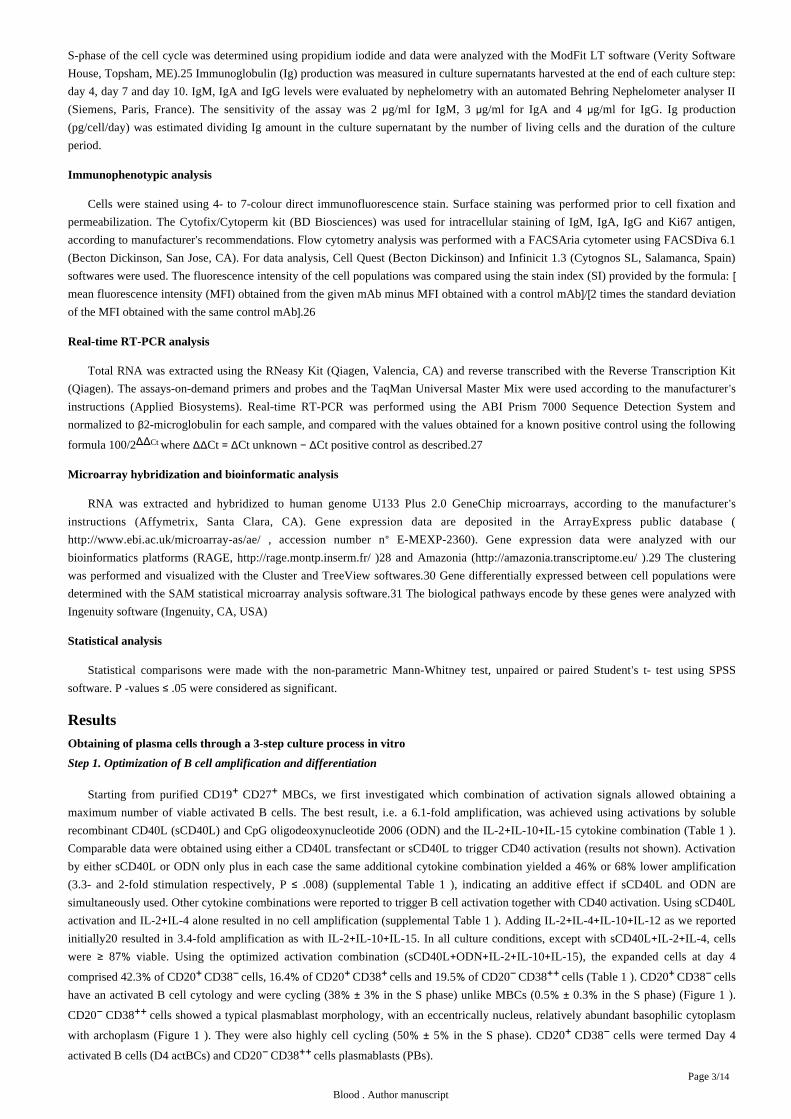
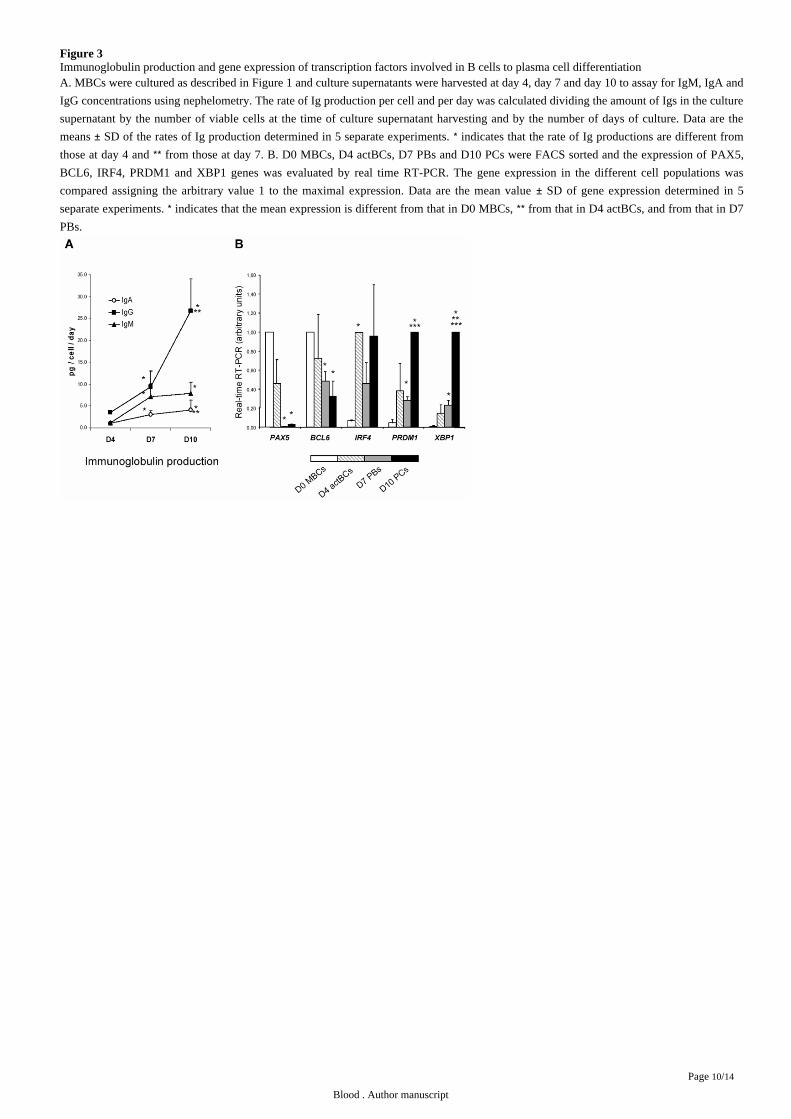
flow cytometry, the rate of IgG production/cell/day increased 8 fold at day 10 compared to day 4 ( .003, n 5, ). The rates ofP = = Figure 3A
IgA and IgM production also significantly increased ( .005, n 5, ).P ≤ = Figure 3A
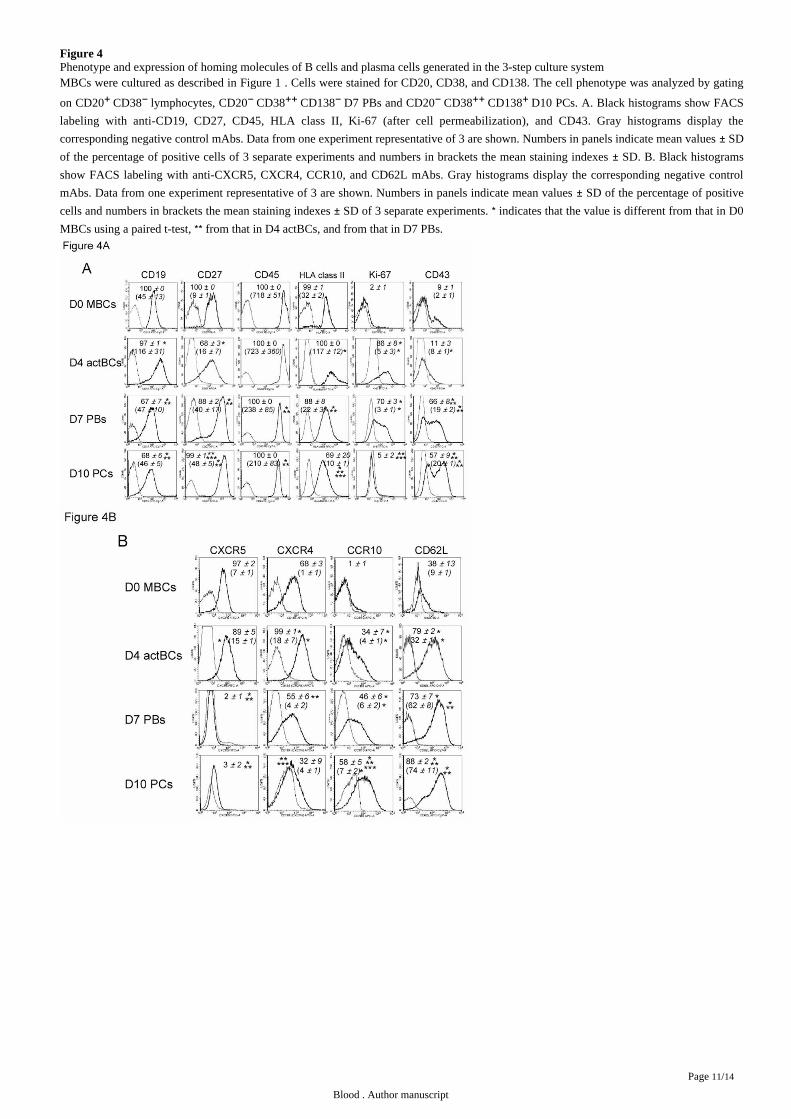
Phenotype of B cells, D7 plasmablasts and D10 plasma cells
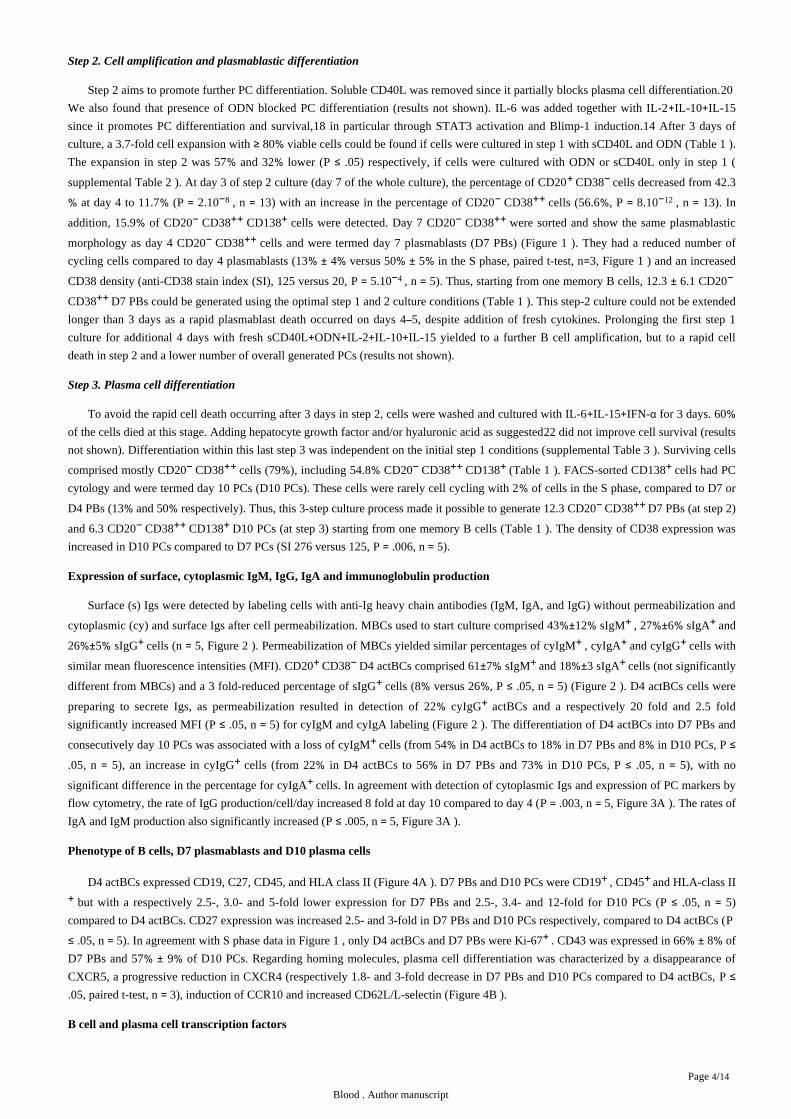
D4 actBCs expressed CD19, C27, CD45, and HLA class II ( ). D7 PBs and D10 PCs were CD19 , CD45 and HLA-class IIFigure 4A + +
but with a respectively 2.5-, 3.0- and 5-fold lower expression for D7 PBs and 2.5-, 3.4- and 12-fold for D10 PCs ( .05, n 5) + P ≤ =compared to D4 actBCs. CD27 expression was increased 2.5- and 3-fold in D7 PBs and D10 PCs respectively, compared to D4 actBCs (P
.05, n 5). In agreement with S phase data in , only D4 actBCs and D7 PBs were Ki-67 . CD43 was expressed in 66 8 of≤ = Figure 1 + % ± %D7 PBs and 57 9 of D10 PCs. Regarding homing molecules, plasma cell differentiation was characterized by a disappearance of% ± %CXCR5, a progressive reduction in CXCR4 (respectively 1.8- and 3-fold decrease in D7 PBs and D10 PCs compared to D4 actBCs, P ≤.05, paired t-test, n 3), induction of CCR10 and increased CD62L/L-selectin ( ).= Figure 4B
B cell and plasma cell transcription factors
Blood . Author manuscript
Page /5 14
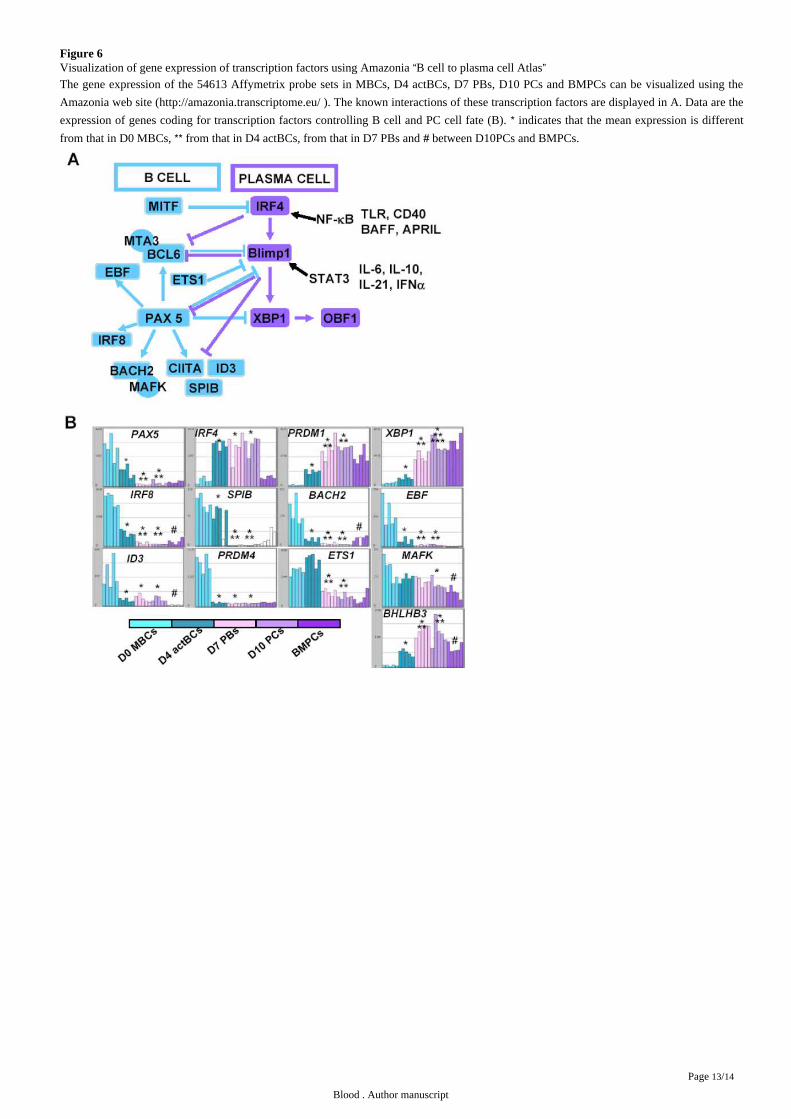
In the gene expression of 5 major transcription factors that control B cell to plasma cell differentiation is shown. A clear-cutFigure 3B
difference was the lack of expression of , the guardian of B cell phenotype in D7 PBs and D10 PCs, unlike D0 MBCs and D4PAX5 11
actBCs. and , whose gene products mutually repress gene expression of the other, showed a correlated inverse pattern. BCL6 PRDM1 12
expression progressively decreased and progressively increased from D0 MBCs to D10 PCs. , and high BCL6 PRDM1 PRDM1 XBP1
expressions were already found in D4 actBCs, suggesting these cells, with a B cell phenotype ( and ), were already on theIFR4 Figure 1 3B
way towards plasmablastic differentiation.
Gene expression atlas of B cell to plasma cell differentiation
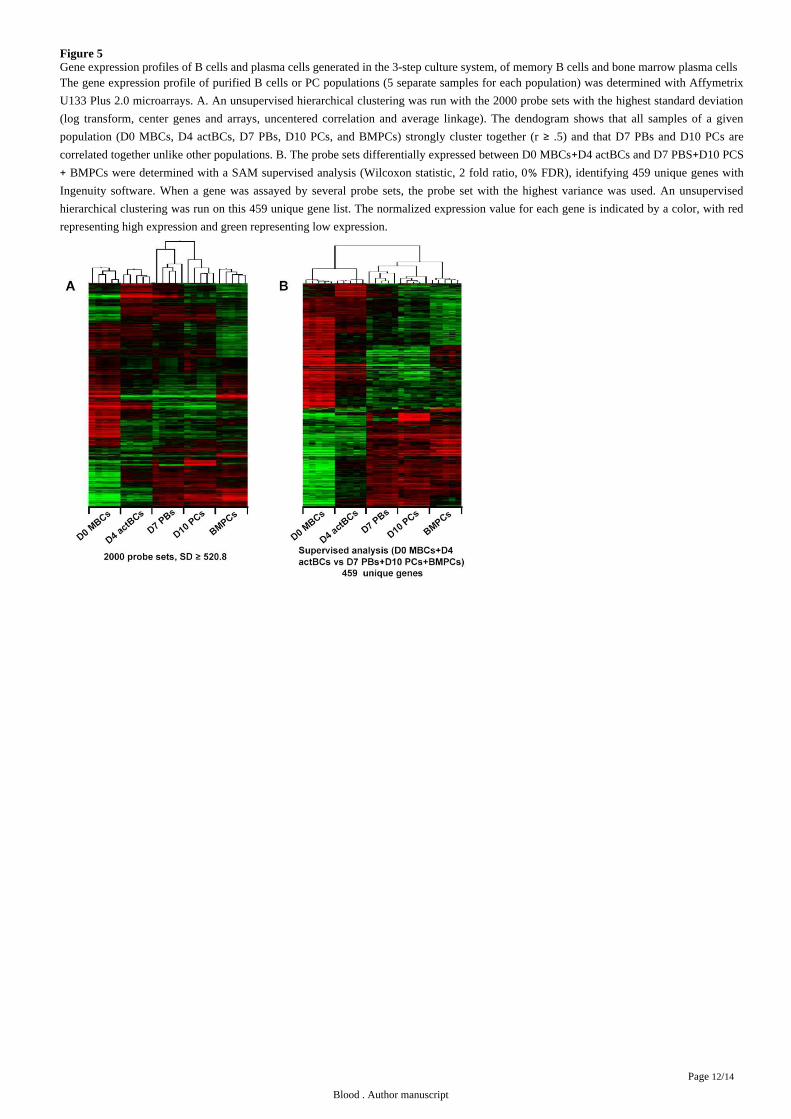
Genome wide gene expression profiling of the 4 cell populations identified above and of purified bone marrow PCs (BMPCs) were
performed using Affymetrix U133 Plus 2.0 microarrays. First an unsupervised clustering with 2000 probe sets after filtering with a
standard deviation 520.8 defined 5 clusters grouping the samples of 5 populations with a strong correlation: D0 MBCs (r 0.74), D4≥ =actBCs (r 0.76), D7 PBs (r 0.41), D10 PCs (r 0.59) and BMPCs (r 0.75) ( ). D7 PBs and D10 PCs clusters were= = = = Figure 5A
correlated together (r 0.27, .05), unlike other clusters ( ). About one third of these genes delineated a plasma cell cluster= P = Figure 5A
(D7 PBs, D10 PCs and BMPCs) versus a B cell cluster (MBCs and D4 actBCs). To extract optimally this plasma cell versus B cell gene
signature, a supervised analysis was run comparing D0 MBCs D4 actBCs and D7 PBs D10 PCs BMPCs (Wilcoxon statistic, 1000+ + +permutations, 2 fold ratio) yielding to 676 probe sets on the basis of an 0 FDR. They corresponded to 459 unique genes (202 PC and 257%BC genes) using Ingenuity analysis, separating B cells from PCs ( and ). The resulting networks encodedFigure 5B supplemental Table 4
by these PC and BC genes were analyzed and scored with Ingenuity. The PC and BC networks and detailed data including gene lists
associated with networks are shown in . The highest scoring PC network mainly comprises genes induced by XBP1supplemental Table 5
transcription factor ( ).supplemental Figure 1
The changes in gene expression at different stages of B cell to plasma cell differentiation can be quickly visualized using our
Amazonia B to plasma cell Atlas ( ). Regarding genes coding for membrane markers of B cells and“ ” http://amazonia.transcriptome.eu/
PCs, the plasma cell Atlas is in agreement with FACS data of ( ). The 3 PC populationsFigure 4A and 4B supplemental Figure 2A and 2B
did not express and genes and expressed weakly genes in agreement with decreased compared to D0CD20 CD22 HLA-class II CIITA
MBCs and D4 actBCs. The 3 PC still expressed although at a lower level and gene expression progressively decreased fromCD19, CD45
MBCs to BMPCs. expression was lost on D7 PBs and D10 PCs, but expressed in BMPCs again. PC differentiation is evidenced byCD24
increased gene expression, increased expression of , expression of and its ligand and ofIg heavy chain (IgH) CD27 CD38 CD31/PECAM1
gene was highly expressed only on BMPCs and was highly expressed in BMPCs. expression was increasedCD138. CD9 CD40 Fas/CD95
in MBCs, D4 actBCs, D7 PBs and D10 PCs compared to BMPCs. expression was rapidly lost on D4 actBCs. Of interest, only D4CD23
actBCs highly expressed gene suggesting these cells could be in a process of Ig hypermutations and/or switch. Both D4 actBCsAICDA
and D7 PCs expressed gene, in agreement with cell cycle cytometry data. Among transcription factors, which have been shown toMKi67
control the B cell and plasma cell phenotype, the expression of 13 of these could be investigated with Affymetrix U133 Plus 2.0
microarrays. The current knowledge of the mechanisms of action of these transcription factors are shown in . Affymetrix dataFigure 6A
for the main transcription factor genes are confirmed by real-time RT-PCR data ( and – Pax 5, IRF4, PRDM1, XBP1 – Figure 3B Figure 6B
). In agreement with downregulation in D7 PBs, D10 PCs and BMPCs, the following PAX5-regulated genes were downregulatedPAX5 11
in these cells: in association with increased expression of PAX5-inhibited genes , and IRF8, SPIB, BACH2, EBF, ID3, CIITA, 11 PRDM1
. Regarding genes coding for homing molecules ( ), PC differentiation was associated with loss ofXBP1 supplemental Figure 2B
expression of genes coding for lymph node chemokine receptors ( ). expression was decreased and CCR7, CXCR5 CXCR4 CCR10
expression increased in D7 PBs and D10 PCs in agreement with flow cytometry data. gene, which is downregulated by PAX5, wasCCR2
not expressed in MBCs but highly in BMPCs. was highly expressed in D7 PBs and D10 PCs unlike BMPCs. PC differentiation isCD62L
associated with increased expression of and , coding for the VLA4 heterodimer, increased expression codingITGA4 ITGB1 of ICAM2,
for a VLA4 ligand. The gene coding for sphingosine phosphate receptor ( ), which is involves in cell exit from tissues ,EDG1/S1PR1 32
was decreased in D10 PCs and BMPCs. coding for CD11a is increased in D4 actBCs, D7 PBs and D10 PCs. Finally, theITGAL, a gene
gene coding for ERN1, that induces mRNA splicing, and the genes coding for XBP1-driven unfold protein response wereXBP1
upregulated throughout B to PC differentiation ( ).supplementary Figure 3
Discussion
Human PCs and their precursors play an essential role in humoral immune response, but likewise give rise to a variety of malignant
B-cell neoplasias. They are difficult to obtain, as they are rare cells located in specific niches in the bone marrow and mucosa, hindering10
the understanding of their physiology and pathophysiology. The aim of the current study was to provide a full phenotypic and molecular
characterization of generated PCs and of the intermediate cells. We have first compared the activation signals and cytokinein vitro
combinations reported in various methodologies for PB and PC generation , , in order to get a maximum of PCs, whilein vitro 17 20 22
limiting the number of activation signals and cytokines. Here, a mean number of 6.3 viable PCs could be generated in a 3-step culture
Blood . Author manuscript
Page /6 14
system starting from one MBC. PCs show a plasma cell morphology, secrete Igs, express plasma cell markers (CD38, CD31, CD138), and
lack B cell markers (CD20, CD21, CD22, CD23). This PC phenotype was associated with expression of plasma cell transcription factor
genes ( ) and decreased expression of B cell ones ( ).PRDM1, XBP1 PAX5, BCL6
The current strategy mimics the activation and differentiation process occurring in the germinal center reaction using activation of
CD40 (mimicking T cell help) and TLR activation (mimicking Ag activation) with a combination of cytokines produced by T helper cell,
dendritic cells and macrophages. These activation signals trigger NF- B signalling that induces expression, resulting in2 κ IRF4
downregulation of BCL6, being critical to maintain the centroblast phenotype. This is what was observed in D4 actBCs, activated by2
sCD40L and CpG ODN, that express highly and a lower level of compared to MBCs. The expression is associated withIRF4 BCL6 IRF4
high expression in D4 actBCs in agreement with data showing IRF4 to control gene expression. AID controls theAICDA AICDA 33
process of Ig variable gene mutation. AID also controls heavy chain isotype switching, which may explain the progressive loss of IgM +
cells and appearance of IgG cells in this model. Alternatively, the shift from B cells expressing IgM to PCs expressing mainly + in vitro
IgG could be due to a selective proliferation of IgG starting B cells. IRF4, when expressed at high level, also induces and + PRDM1 XBP1
expression. The high expression in D4 actBCs may explain why these cells are already in the way towards PC differentiation,33 IRF4
expressing weakly and and cytoplasmic Igs, while still highly proliferating and expressing B cell markers. The second stepPRDM1 XBP1
of culture consists of removing CD40 activation and CpG ODN that block the full process of plasma cell generation and adding IL-6 to
further promote STAT3 activation. STAT3 induces expression together with IRF4 and also further downregulates PRDM1 34 33 BCL6
expression. In particular, a knock out of STAT3 abrogates PC differentiation. The final step consists of removing cytokines inducing35
proliferation (IL-2 and IL-10), and adding IFN- , IL-6 and IL-15 yielding to PCs that express syndecan-1 and secrete higher amounts ofαIgs, as measured in the culture supernatants. Both IFN- and IL-6 highly stimulate STAT3 pathway resulting in the observed increased α
expression in D10 PCs ( ). This likely explains syndecan-1 expression and increased Ig secretion in D10 PCs as thePRDM1 Figure 5
PRDM1 gene product Blimp-1 - induces gene expression and splicing of Ig RNA yielding to Ig secretion in B cells.– syndecan-1 36
Huggins et al. have reported that addition of hyaluronic acid, to stimulate CD44, and hepatocyte growth factor further improved22
differentiation of PBs into PCs, but we found no benefit of adding hyaluronic acid or HGF. Adding IL-21 and/or APRIL did not result also
in improvement of PC generation and survival (results not shown) and these generated PCs progressively died in culture. Thein vitro
identification of signals promoting long-term PC survival is a major unresolved issue. PC long-term survival and differentiation may
require cell to cell contacts, mimicking what is occurring in the putative PC niches. Tokoyoda . reported that murine PCs home inet al 9
contact to SDF-1 producing cells in the bone marrow, sharing the same niche with hematopoietic stem cells and Pre-pro-B cells. In
mucosa, a recent report has shown that tissue PCs are located in APRIL-rich niches, comprised myeloid cells. Thus, the current model37
will make it possible to further identify the niche that can promote long-term survival of human PCs.
An important question is what the differences are between these D10 PCs compared to the most studied human PCs in vitro in vivo,
tonsil PCs, bone marrow PCs and peripheral blood PCs? Tonsil PCs, either present in germinal centers or follicular and parafolliculari.e.
zones, express CD20, CD19, HLA-class II, CD45, CD22, CD9 and highly CD38 and do not express CD62L and CD138. , Peripheral38 39
blood PCs detected in healthy individuals after tetanus toxoid immunization are CD20 CD19 CD45 CD62L HLA-class II CD9 − + + + + −
CD38 and half of them express CD138. Bone marrow PCs express CD138, highly CD38 and CD31, lack CD20, express weaklyhigh 38
CD19 and half of them express CD45 and HLA-class II. The phenotype of generated D10 PCs is different from that of tonsil38 in vitro
PCs that are more immature through the expression of CD20, CD22 and lack of expression of CD138. It could correspond to the
phenotype of the fraction of CD45 HLA-class II bone marrow PCs since they all express these 2 molecules, but at reduced levels + +
compared to B cells. A difference is that D10 PCs express CD62L, weakly CXCR4 and CCR2 and did not express CD9. Actually the
phenotype of these D10 PCs fits well with that of peripheral blood PCs induced by tetanus toxoid immunization of healthy individuals.38
These circulating PCs do express CD62L, intermediate levels of CD138 and weakly CXCR4 and CCR2, and do not express CD9, unlike
BMPCs. They are considered to be newly-generated PCs, leaving the lymphoid organs to home to bone marrow or tissue, as it is the case
for generated D10 PCs. As both these circulating PCs and generated D10 PCs express weakly CXCR4, other moleculesin vitro in vitro
could be involved in their homing to bone marrow or mucosa. VLA4 could be this homing molecule, since hematopoietic stem cells can
home to BM through VLA4 in a CXCR4 independent manner. Of interest, both peripheral blood PCs and D10 PCs highly express40
VLA4 making it possible their homing to BM or tissues.
Besides studying B-cell differentiation, this model is likewise of major interest to further understand the biology of multiplein vitro
myeloma by introducing genes deregulated in MMCs and looking for their ability to induce long term survival and proliferation of
(malignant) PCs. It would be also of interest to look for whether the MM bone marrow environment could trigger the survival of these PCs
.in vitro
Ackowledgements:
This work was supported by grants from the Ligue Nationale Contre le Cancer ( quipe labellis e 2009), Paris, France, from INCA and fromé éMSCNET European strep (N E06005FF). We thank the staff of IRB Affymetrix platform (°
Blood . Author manuscript
Page /7 14
, John De Vos, Veronique Pantesco, Jennifer Torrent and Tanguy Lehttp://irb.montp.inserm.fr/en/index.php?page=Plateau&IdEquipe=6
Carrour) for their assistance with the microarray assay.
Footnotes:
Authorship
MJ designed research, performed the experiments and wrote the paper.
GF provided technical assistance.
JDV designed the Amazonia web site.
AC and ML provided assistance for cytometry experiments.
CB performed the cytology analysis.
CC performed the Ig production determination.
DH provided GEP data for BMPCs and DH and AC participated in the writing of the paper.
BK is the senior investigator who designed research and wrote the paper.
References: 1 . Allen CD , Okada T , Cyster JG . Germinal-center organization and cellular dynamics . Immunity . 2007 ; 27 : (2 ) 190 - 202 2 . Klein U , Dalla-Favera R . Germinal centres: role in B-cell physiology and malignancy . Nat Rev Immunol . 2008 ; 8 : (1 ) 22 - 33 3 . Batista FD , Harwood NE . The who, how and where of antigen presentation to B cells . Nat Rev Immunol . 2009 ; 9 : (1 ) 15 - 27 4 . Arce S , Luger E , Muehlinghaus G . CD38 low IgG-secreting cells are precursors of various CD38 high-expressing plasma cell populations . J Leukoc Biol . 2004 ; 75 : (6
) 1022 - 1028 5 . Gonzalez-Garcia I , Rodriguez-Bayona B , Mora-Lopez F , Campos-Caro A , Brieva JA . Increased survival is a selective feature of human circulating antigen-induced
plasma cells synthesizing high-affinity antibodies . Blood . 2008 ; 111 : (2 ) 741 - 749 6 . Mei HE , Yoshida T , Sime W . Blood-borne human plasma cells in steady state are derived from mucosal immune responses . Blood . 2009 ; 113 : (11 ) 2461 - 2469 7 . Tarlinton D , Radbruch A , Hiepe F , Dorner T . Plasma cell differentiation and survival . Curr Opin Immunol . 2008 ; 20 : (2 ) 162 - 169 8 . Kunkel EJ , Butcher EC . Plasma-cell homing . Nat Rev Immunol . 2003 ; 3 : (10 ) 822 - 829 9 . Tokoyoda K , Egawa T , Sugiyama T , Choi BI , Nagasawa T . Cellular niches controlling B lymphocyte behavior within bone marrow during development . Immunity .
2004 ; 20 : (6 ) 707 - 718 10 . Radbruch A , Muehlinghaus G , Luger EO . Competence and competition: the challenge of becoming a long-lived plasma cell . Nat Rev Immunol . 2006 ; 6 : (10 ) 741 -
750 11 . Cobaleda C , Schebesta A , Delogu A , Busslinger M . Pax5: the guardian of B cell identity and function . Nat Immunol . 2007 ; 8 : (5 ) 463 - 470 12 . Calame K . Activation-dependent induction of Blimp-1 . Curr Opin Immunol . 2008 ; 20 : (3 ) 259 - 264 13 . Ettinger R , Sims GP , Fairhurst AM . IL-21 induces differentiation of human naive and memory B cells into antibody-secreting plasma cells . J Immunol . 2005 ; 175 : ( 12 ) 7867 - 7879 14 . Diehl SA , Schmidlin H , Nagasawa M . STAT3-mediated up-regulation of BLIMP1 Is coordinated with BCL6 down-regulation to control human plasma cell
differentiation . J Immunol . 2008 ; 180 : (7 ) 4805 - 4815 15 . Kallies A , Hasbold J , Fairfax K . Initiation of plasma-cell differentiation is independent of the transcription factor Blimp-1 . Immunity . 2007 ; 26 : (5 ) 555 - 566 16 . Saito M , Gao J , Basso K . A signaling pathway mediating downregulation of BCL6 in germinal center B cells is blocked by BCL6 gene alterations in B cell lymphoma .
Cancer Cell . 2007 ; 12 : (3 ) 280 - 292 17 . Arpin C , Dechanet J , Van Kooten C . Generation of memory B cells and plasma cells in vitro . Science . 1995 ; 268 : 720 - 722 18 . Jego G , Bataille R , Pellat-Deceunynck C . Interleukin-6 is a growth factor for nonmalignant human plasmablasts . Blood . 2001 ; 97 : (6 ) 1817 - 1822 19 . Bernasconi NL , Traggiai E , Lanzavecchia A . Maintenance of serological memory by polyclonal activation of human memory B cells . Science . 2002 ; 298 : (5601 )
2199 - 2202 20 . Tarte K , De Vos J , Thykjaer T . Generation of polyclonal plasmablasts from peripheral blood B cells: a normal counterpart of malignant plasmablasts . Blood . 2002 ; 100 : (4 ) 1113 - 1122
21 . Poeck H , Wagner M , Battiany J . Plasmacytoid dendritic cells, antigen, and CpG-C license human B cells for plasma cell differentiation and immunoglobulin production in the absence of T-cell help . Blood . 2004 ; 103 : (8 ) 3058 - 3064
22 . Huggins J , Pellegrin T , Felgar RE . CpG DNA activation and plasma-cell differentiation of CD27- naive human B cells . Blood . 2007 ; 109 : (4 ) 1611 - 1619 23 . Mahtouk K , Cremer FW , Reme T . Heparan sulphate proteoglycans are essential for the myeloma cell growth activity of EGF-family ligands in multiple myeloma .
Oncogene . 2006 ; 25 : (54 ) 7180 - 7191 24 . Hartmann G , Krieg AM . Mechanism and function of a newly identified CpG DNA motif in human primary B cells . J Immunol . 2000 ; 164 : (2 ) 944 - 953 25 . Jourdan M , Mahtouk K , Veyrune JL . Delineation of the roles of paracrine and autocrine interleukin-6 (IL-6) in myeloma cell lines in survival versus cell cycle. A
possible model for the cooperation of myeloma cell growth factors . Eur Cytokine Netw . 2005 ; 16 : (1 ) 57 - 64 26 . Maecker HT , Frey T , Nomura LE , Trotter J . Selecting fluorochrome conjugates for maximum sensitivity . Cytometry A . 2004 ; 62 : (2 ) 169 - 173 27 . Moreaux J , Legouffe E , Jourdan E . BAFF and APRIL protect myeloma cells from apoptosis induced by interleukin 6 deprivation and dexamethasone . Blood . 2004 ; 103 : (8 ) 3148 - 3157
28 . Reme T , Hose D , De Vos J . A new method for class prediction based on signed-rank algorithms applied to Affymetrix microarray experiments . BMC Bioinformatics . 2008 ; 9 : 16 -
29 . Assou S , Le Carrour T , Tondeur S . A meta-analysis of human embryonic stem cells transcriptome integrated into a web-based expression atlas . Stem Cells . 2007 ; 25 : (4 ) 961 - 973 30 . Eisen MB , Spellman PT , Brown PO , Botstein D . Cluster analysis and display of genome-wide expression patterns . Proc Natl Acad Sci U S A . 1998 ; 95 : (25 ) 14863 -
14868 31 . Tusher VG , Tibshirani R , Chu G . Significance analysis of microarrays applied to the ionizing radiation response . Proc Natl Acad Sci U S A . 2001 ; 98 : (9 ) 5116 -
5121
Blood . Author manuscript
Page /8 14
32 . Seitz G , Boehmler AM , Kanz L , Mohle R . The role of sphingosine 1-phosphate receptors in the trafficking of hematopoietic progenitor cells . Ann N Y Acad Sci . 2005 ; 1044 : 84 - 89
33 . Sciammas R , Shaffer AL , Schatz JH , Zhao H , Staudt LM , Singh H . Graded expression of interferon regulatory factor-4 coordinates isotype switching with plasma cell differentiation . Immunity . 2006 ; 25 : (2 ) 225 - 236
34 . Reljic R , Wagner SD , Peakman LJ , Fearon DT . Suppression of signal transducer and activator of transcription 3-dependent B lymphocyte terminal differentiation by BCL-6 . J Exp Med . 2000 ; 192 : (12 ) 1841 - 1848
35 . Fornek JL , Tygrett LT , Waldschmidt TJ , Poli V , Rickert RC , Kansas GS . Critical role for Stat3 in T-dependent terminal differentiation of IgG B cells . Blood . 2006 ; 107 : (3 ) 1085 - 1091
36 . Shaffer AL , Shapiro-Shelef M , Iwakoshi NN . XBP1, downstream of Blimp-1, expands the secretory apparatus and other organelles, and increases protein synthesis in plasma cell differentiation . Immunity . 2004 ; 21 : (1 ) 81 - 93
37 . Huard B , McKee T , Bosshard C . APRIL secreted by neutrophils binds to heparan sulfate proteoglycans to create plasma cell niches in human mucosa . J Clin Invest . 2008 ; 118 : (8 ) 2887 - 2895
38 . Medina F , Segundo C , Campos-Caro A , Gonzalez-Garcia I , Brieva JA . The heterogeneity shown by human plasma cells from tonsil, blood, and bone marrow reveals graded stages of increasing maturity, but local profiles of adhesion molecule expression . Blood . 2002 ; 99 : (6 ) 2154 - 2161
39 . Medina F , Segundo C , Jimenez-Gomez G , Gonzalez-Garcia I , Campos-Caro A , Brieva JA . Higher maturity and connective tissue association distinguish resident from recently generated human tonsil plasma cells . J Leukoc Biol . 2007 ; 82 : (6 ) 1430 - 1436
40 . Bonig H , Priestley GV , Papayannopoulou T . Hierarchy of molecular-pathway usage in bone marrow homing and its shift by cytokines . Blood . 2006 ; 107 : (1 ) 79 - 86
Figure 1Three-step model of plasma cell generationin vitro Peripheral blood human memory B cells (MBCs) were purified and cultured with sCD40L, ODN and IL-2 IL-10 IL-15, then with IL-2 IL-6+ + +
IL-10 IL-15 for 3 days and then with IFN- IL-6 IL-15 for 3 days. Cells were labeled with anti-CD20, CD38 and anti-CD138 mAbs,+ + + α+ +
CD20 CD38 D4 actBCs, CD20 CD38 D4 or D7 PBs, and CD20 CD38 CD138 D10 PCs were FACS sorted and stained with + − − ++ − ++ +
May-Gr nwald-Giemsa (x1000 magnification). The percentage of cells in the S-phase of the cell cycle was determined using propidiumüiodide and data were analyzed with the ModFit LT software. Histograms are those of one experiment representative of 3.
Blood . Author manuscript
Page /9 14
Figure 2Expression of surface and cytoplasmic immunoglobulin heavy chain isotypes by B cells and plasma cells generated in the 3-step culturesystemMBCs were cultured as described in . Starting MBCs, D4 actBCs, D7 PBs and D10 PCs were labeled with fluorochrome-conjugatedFigure 1
anti-CD20, CD38 and CD138 mAbs and with fluorochrome-conjugated anti-human IgM, IgA, IgG mAbs or isotype-controlled mAbs before
or after cell permeabilization. The bold histograms represent labeling with anti-IgM, IgA or IgG mAb and the light ones with the control
mAb. Histograms are those of one experiment representative of five. The numbers in the panels are the means SD of the percentage of±labeled cells ( MFI 1SD of the control mAb). indicates that the mean percentage of labeled cells is different from that in D0 MBCs, i.e. ≥ + * **from that in D4 actBCs, and from that in D7 PBs.
Blood . Author manuscript
Page /10 14
Figure 3Immunoglobulin production and gene expression of transcription factors involved in B cells to plasma cell differentiationA. MBCs were cultured as described in and culture supernatants were harvested at day 4, day 7 and day 10 to assay for IgM, IgA andFigure 1
IgG concentrations using nephelometry. The rate of Ig production per cell and per day was calculated dividing the amount of Igs in the culture
supernatant by the number of viable cells at the time of culture supernatant harvesting and by the number of days of culture. Data are the
means SD of the rates of Ig production determined in 5 separate experiments. indicates that the rate of Ig productions are different from± *those at day 4 and from those at day 7. ** B. D0 MBCs, D4 actBCs, D7 PBs and D10 PCs were FACS sorted and the expression of PAX5,
and genes was evaluated by real time RT-PCR. The gene expression in the different cell populations wasBCL6, IRF4, PRDM1 XBP1
compared assigning the arbitrary value 1 to the maximal expression. Data are the mean value SD of gene expression determined in 5±separate experiments. indicates that the mean expression is different from that in D0 MBCs, from that in D4 actBCs, and from that in D7* **PBs.
Blood . Author manuscript
Page /11 14
Figure 4Phenotype and expression of homing molecules of B cells and plasma cells generated in the 3-step culture systemMBCs were cultured as described in . Cells were stained for CD20, CD38, and CD138. The cell phenotype was analyzed by gatingFigure 1
on CD20 CD38 lymphocytes, CD20 CD38 CD138 D7 PBs and CD20 CD38 CD138 D10 PCs. A. Black histograms show FACS + − − ++ − − ++ +
labeling with anti-CD19, CD27, CD45, HLA class II, Ki-67 (after cell permeabilization), and CD43. Gray histograms display the
corresponding negative control mAbs. Data from one experiment representative of 3 are shown. Numbers in panels indicate mean values SD±of the percentage of positive cells of 3 separate experiments and numbers in brackets the mean staining indexes SD. B. Black histograms±show FACS labeling with anti-CXCR5, CXCR4, CCR10, and CD62L mAbs. Gray histograms display the corresponding negative control
mAbs. Data from one experiment representative of 3 are shown. Numbers in panels indicate mean values SD of the percentage of positive±cells and numbers in brackets the mean staining indexes SD of 3 separate experiments. ± indicates that the value is different from that in D0*MBCs using a paired t-test, from that in D4 actBCs, and from that in D7 PBs.**
Blood . Author manuscript
Page /12 14
Figure 5Gene expression profiles of B cells and plasma cells generated in the 3-step culture system, of memory B cells and bone marrow plasma cellsThe gene expression profile of purified B cells or PC populations (5 separate samples for each population) was determined with Affymetrix
U133 Plus 2.0 microarrays. A. An unsupervised hierarchical clustering was run with the 2000 probe sets with the highest standard deviation
(log transform, center genes and arrays, uncentered correlation and average linkage). The dendogram shows that all samples of a given
population (D0 MBCs, D4 actBCs, D7 PBs, D10 PCs, and BMPCs) strongly cluster together (r .5) and that D7 PBs and D10 PCs are≥correlated together unlike other populations. B. The probe sets differentially expressed between D0 MBCs D4 actBCs and D7 PBS D10 PCS+ +
BMPCs were determined with a SAM supervised analysis (Wilcoxon statistic, 2 fold ratio, 0 FDR), identifying 459 unique genes with+ %Ingenuity software. When a gene was assayed by several probe sets, the probe set with the highest variance was used. An unsupervised
hierarchical clustering was run on this 459 unique gene list. The normalized expression value for each gene is indicated by a color, with red
representing high expression and green representing low expression.
Blood . Author manuscript
Page /13 14
Figure 6Visualization of gene expression of transcription factors using Amazonia B cell to plasma cell Atlas“ ”The gene expression of the 54613 Affymetrix probe sets in MBCs, D4 actBCs, D7 PBs, D10 PCs and BMPCs can be visualized using the
Amazonia web site ( ). The known interactions of these transcription factors are displayed in A. Data are thehttp://amazonia.transcriptome.eu/
expression of genes coding for transcription factors controlling B cell and PC cell fate (B). indicates that the mean expression is different*from that in D0 MBCs, from that in D4 actBCs, from that in D7 PBs and between D10PCs and BMPCs.** #
Blood . Author manuscript
Page /14 14
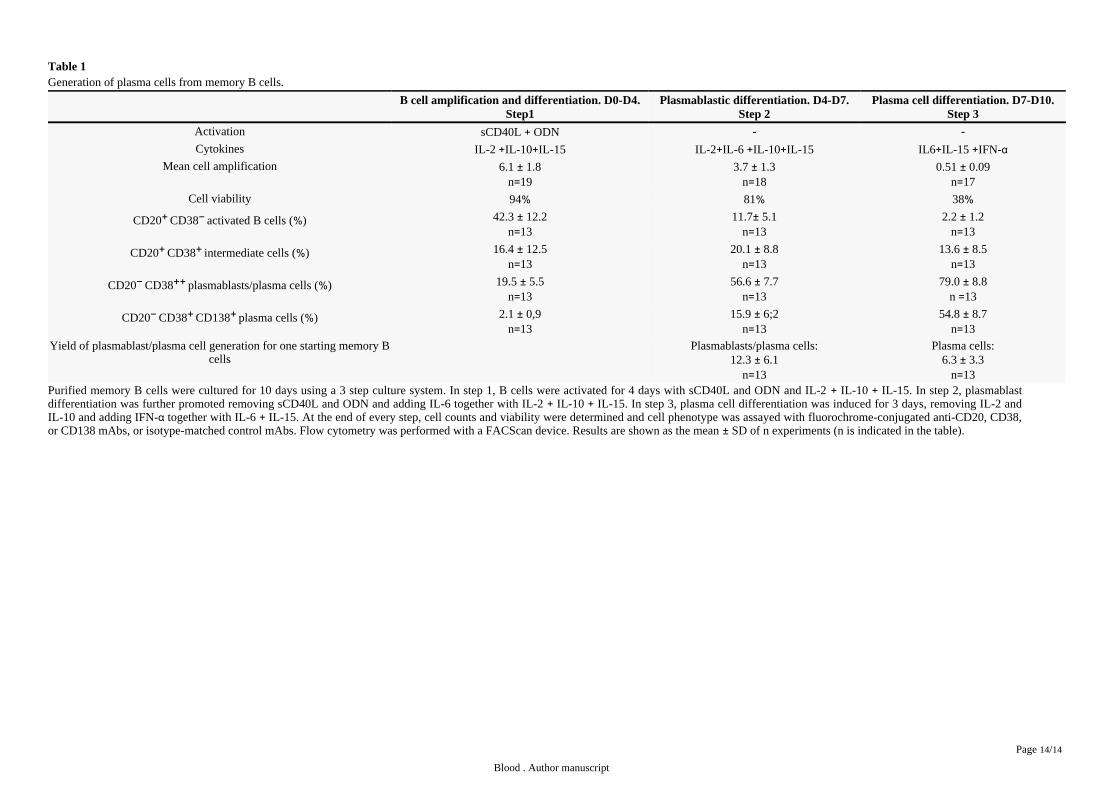
Table 1Generation of plasma cells from memory B cells.
B cell amplification and differentiation. D0-D4.Step1
Plasmablastic differentiation. D4-D7.Step 2
Plasma cell differentiation. D7-D10.Step 3
Activation sCD40L ODN+ - -
Cytokines IL-2 IL-10 IL-15+ + IL-2 IL-6 IL-10 IL-15+ + + IL6 IL-15 IFN-+ + αMean cell amplification 6.1 1.8±
n 19=3.7 1.3±
n 18=0.51 0.09±
n 17=Cell viability 94% 81% 38%
CD20 CD38 activated B cells ( ) + − % 42.3 12.2±n 13=
11.7 5.1±n 13=
2.2 1.2±n 13=
CD20 CD38 intermediate cells ( ) + + % 16.4 12.5±n 13=
20.1 8.8±n 13=
13.6 8.5±n 13=
CD20 CD38 plasmablasts/plasma cells ( ) − ++ % 19.5 5.5±n 13=
56.6 7.7±n 13=
79.0 8.8±n 13=
CD20 CD38 CD138 plasma cells ( ) − + + % 2.1 0,9±n 13=
15.9 6;2±n 13=
54.8 8.7±n 13=
Yield of plasmablast/plasma cell generation for one starting memory Bcells
Plasmablasts/plasma cells:12.3 6.1±
n 13=
Plasma cells:6.3 3.3±
n 13=Purified memory B cells were cultured for 10 days using a 3 step culture system. In step 1, B cells were activated for 4 days with sCD40L and ODN and IL-2 IL-10 IL-15. In step 2, plasmablast+ +differentiation was further promoted removing sCD40L and ODN and adding IL-6 together with IL-2 IL-10 IL-15. In step 3, plasma cell differentiation was induced for 3 days, removing IL-2 and+ +IL-10 and adding IFN- together with IL-6 IL-15. At the end of every step, cell counts and viability were determined and cell phenotype was assayed with fluorochrome-conjugated anti-CD20, CD38,α +or CD138 mAbs, or isotype-matched control mAbs. Flow cytometry was performed with a FACScan device. Results are shown as the mean SD of n experiments (n is indicated in the table).±