Embed Size (px)
Citation preview
Paul Stott, AstraZeneca – BioKorea 2007
CHALLENGES & OPPORTUNITIES OFICHQ8 (PHARMACEUTICAL DEVELOPMENT) –
AN INDUSTRY PERSPECTIVE
Paul Stott, PhDHead of US Product Development
AstraZeneca
ICH Quality Guidelines WorkshopBioKorea 2007
Sept 13-14
Paul Stott, AstraZeneca – BioKorea 2007
Overview• ICH vision• Background• Principles and concepts developed by EFPIA PAT
Topic Group • ‘Fictitious’ example – EFPIA Mock P2• AstraZeneca example – from the FDA CMC Pilot
Program• Cost Savings from AZ QbD examples to date• Conclusions
Paul Stott, AstraZeneca – BioKorea 2007
The Vision of ICHQ8 (and 9 & 10)• Pharmaceutical and Manufacturing Sciences leading to
continuous product and process improvement– A transparent, science and risk based approach to:
• product development and • dossier submission, review, approval and post-approval
changes– Manufacturers empowered to effect continual improvement
throughout the product life-cycle and supply chain– More efficient and effective Regulatory oversight
Paul Stott, AstraZeneca – BioKorea 2007
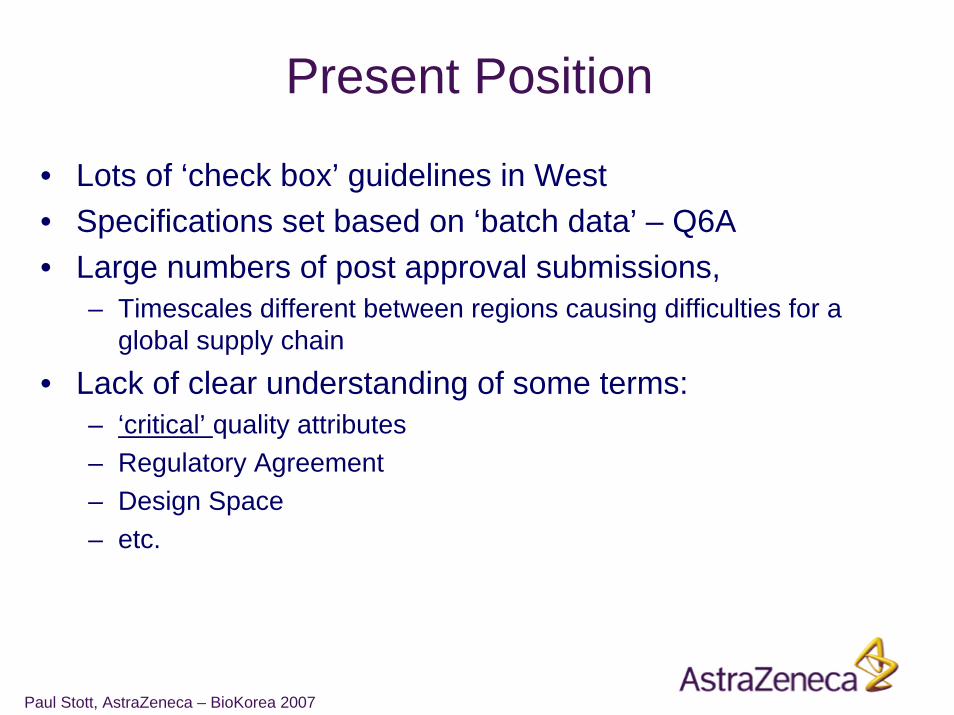
Present Position
• Lots of ‘check box’ guidelines in West• Specifications set based on ‘batch data’ – Q6A• Large numbers of post approval submissions,
– Timescales different between regions causing difficulties for a global supply chain
• Lack of clear understanding of some terms:– ‘critical’ quality attributes– Regulatory Agreement– Design Space– etc.
Paul Stott, AstraZeneca – BioKorea 2007
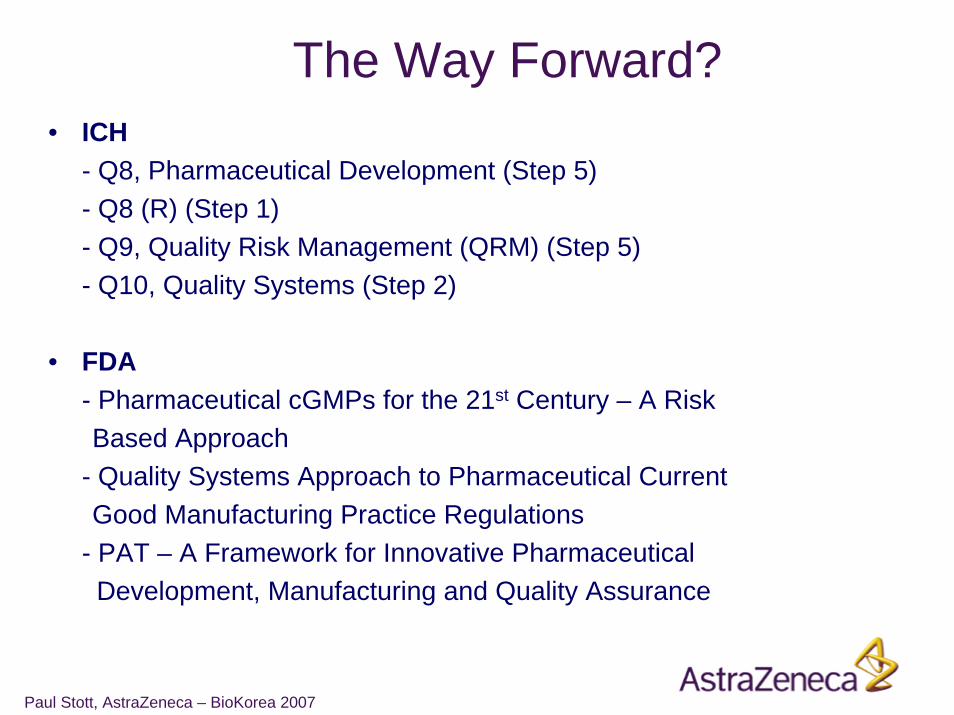
The Way Forward?• ICH
- Q8, Pharmaceutical Development (Step 5)- Q8 (R) (Step 1)- Q9, Quality Risk Management (QRM) (Step 5)- Q10, Quality Systems (Step 2)
• FDA- Pharmaceutical cGMPs for the 21st Century – A RiskBased Approach
- Quality Systems Approach to Pharmaceutical CurrentGood Manufacturing Practice Regulations
- PAT – A Framework for Innovative PharmaceuticalDevelopment, Manufacturing and Quality Assurance
Paul Stott, AstraZeneca – BioKorea 2007
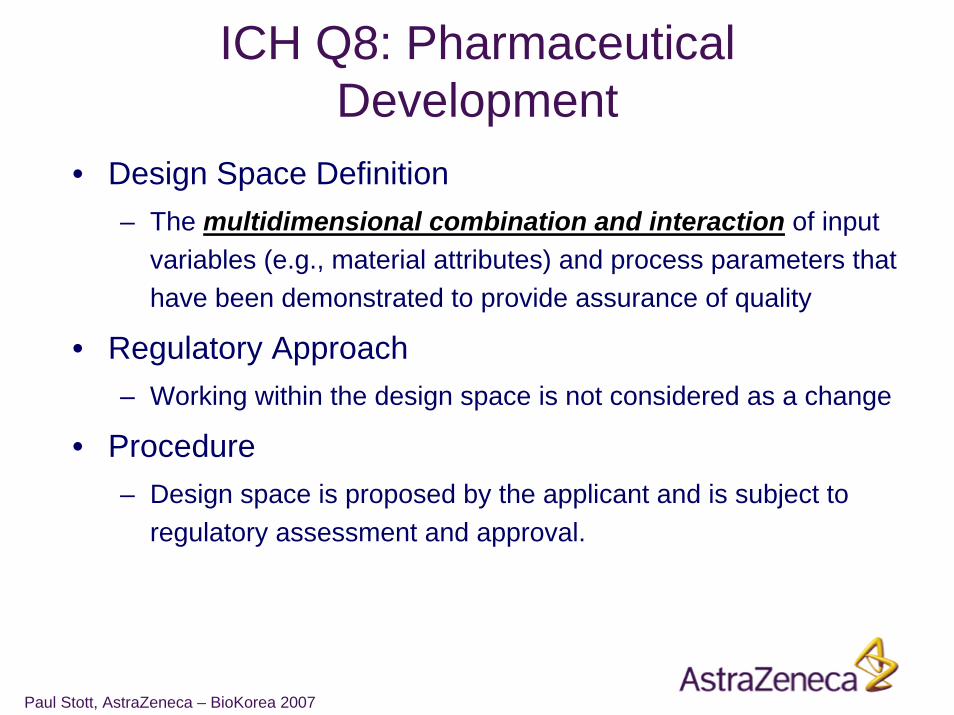
ICH Q8: Pharmaceutical Development
• Design Space Definition– The multidimensional combination and interaction of input
variables (e.g., material attributes) and process parameters that have been demonstrated to provide assurance of quality
• Regulatory Approach– Working within the design space is not considered as a change
• Procedure– Design space is proposed by the applicant and is subject to
regulatory assessment and approval.
Paul Stott, AstraZeneca – BioKorea 2007
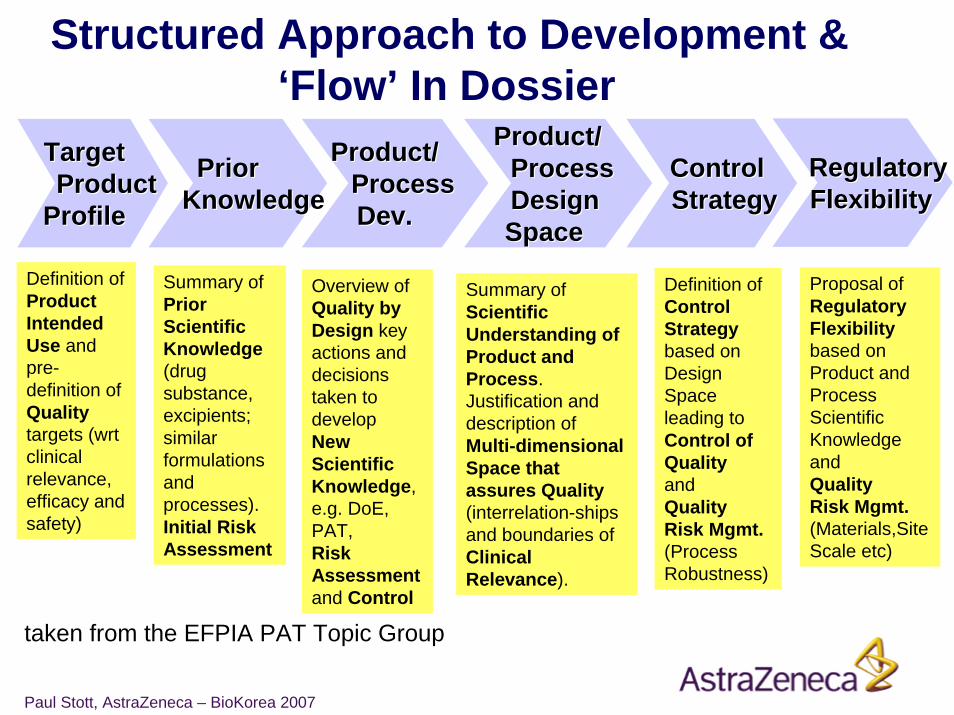
Structured Approach to Development & ‘Flow’ In Dossier
TargetTargetProductProduct
ProfileProfile
ControlControlStrategyStrategy
PriorPriorKnowledgeKnowledge
Product/Product/ProcessProcessDev.Dev.
Product/Product/ProcessProcessDesignDesignSpace Space
Definition of Product Intended Use and pre-definition of Qualitytargets (wrt clinical relevance, efficacy and safety)
Summary of Scientific Understanding of Product andProcess.Justification and description of Multi-dimensional Space that assures Quality(interrelation-ships and boundaries of Clinical Relevance).
Definition ofControl Strategybased on Design Space leading to Control of Qualityand Quality Risk Mgmt.(Process Robustness)
Overview ofQuality by Design key actions and decisions taken to develop New Scientific Knowledge, e.g. DoE, PAT, Risk Assessmentand Control
Summary ofPrior Scientific Knowledge(drug substance, excipients; similar formulations and processes). Initial Risk Assessment
RegulatoryRegulatoryFlexibilityFlexibility
Proposal of Regulatory Flexibility based on Product and Process Scientific Knowledgeand Quality Risk Mgmt.(Materials,Site Scale etc)
taken from the EFPIA PAT Topic Group
Paul Stott, AstraZeneca – BioKorea 2007
Case Study #1
“Examplain” Mock P2 Submission: fictitious product developed by the EFPIA
PAT Topic Group to illustrate the concepts of QbD
Paul Stott, AstraZeneca – BioKorea 2007
“Examplain” Tablets Brief Description
• “Examplain” an immediate release solid dosage form– Tablet of 200 mg compression weight containing 20 mg drug
substance– Biopharmaceutics Class I (highly soluble, highly permeable)– Conventional, wet granulated tablet formulation– Some potential for degradation (hydrolysis) - fluid-bed drying is a
critical step
• Drug substance properties– Low bulk density – potential issues with content uniformity– crystalline, single stable polymorph– Primary amine salt
Paul Stott, AstraZeneca – BioKorea 2007
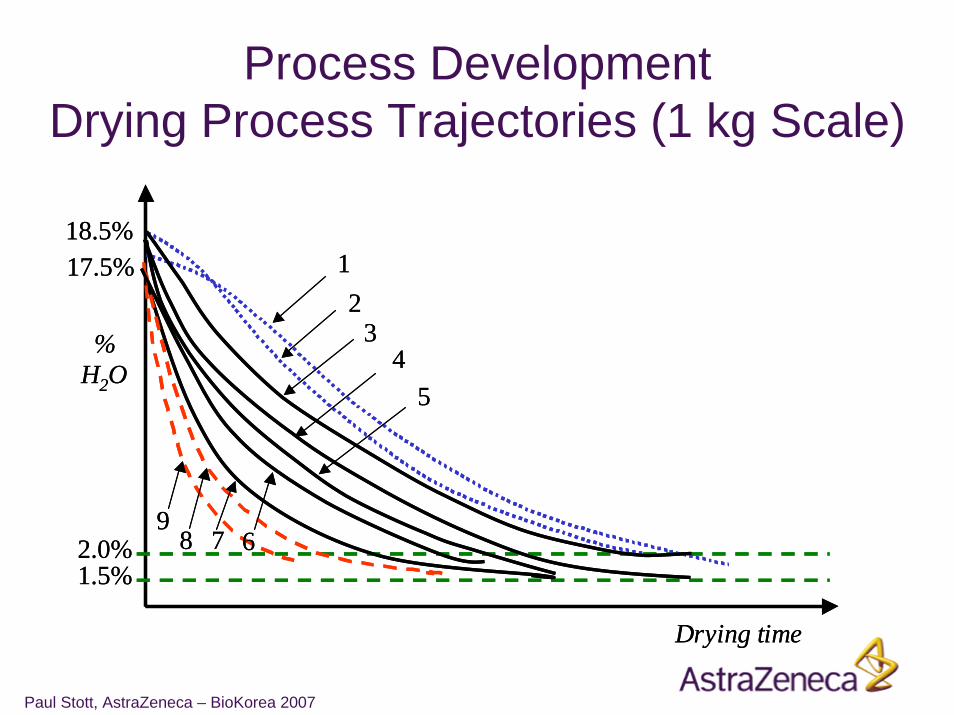
Process DevelopmentDrying Curves
• Drying experiments at 1 kg scale– Using wet granulate with water content of 18±0.5% (as is
routinely produced by the granulation process)– Fluid bed drier inlet temperature and air flow were varied– Stopped when the water content was in the range 1.5-2.0%– Water content of the granules, and their particle size distribution
were monitored on-line
• Confirmed at larger scale– On monitoring system scale independent
Paul Stott, AstraZeneca – BioKorea 2007
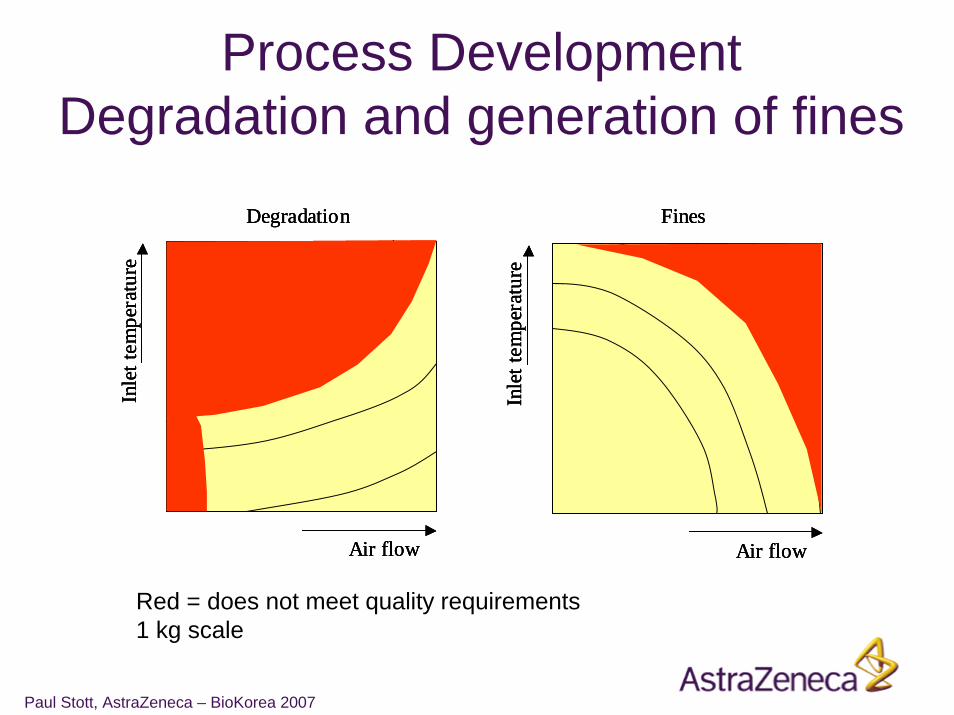
Process DevelopmentDegradation and generation of fines
Air flow
Inle
t tem
pera
ture
Fines
Air flow
Inle
t tem
pera
ture
Degradation
Air flow
Inle
t tem
pera
ture
Fines
Air flow
Inle
t tem
pera
ture
Fines
Air flow
Inle
t tem
pera
ture
Degradation
Air flow
Inle
t tem
pera
ture
Degradation
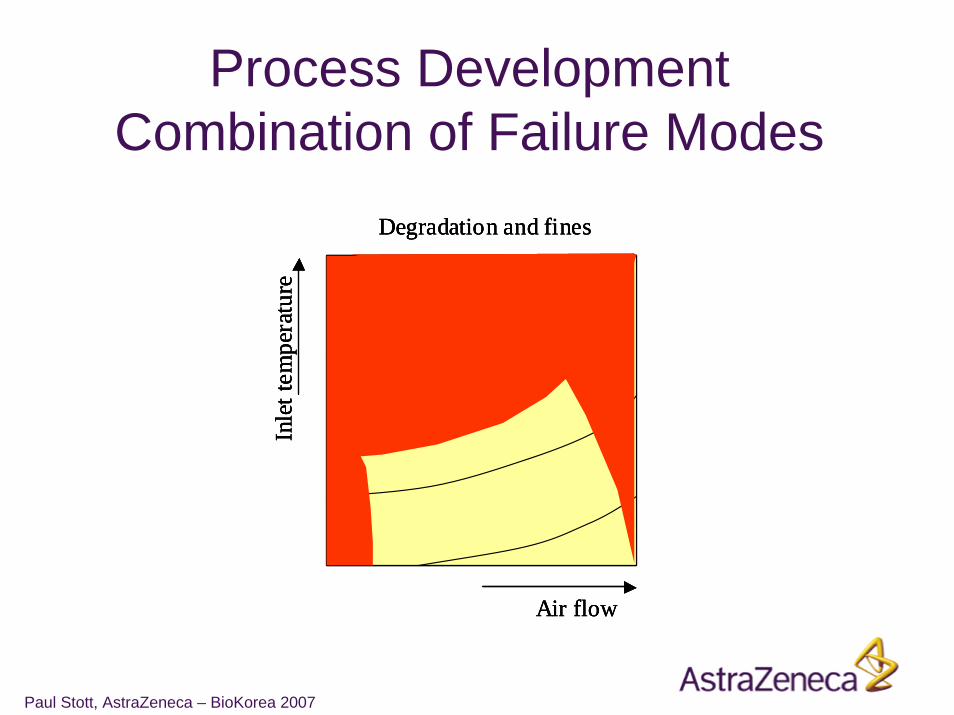
Red = does not meet quality requirements1 kg scale
Paul Stott, AstraZeneca – BioKorea 2007
Air flow
Inle
t tem
pera
ture
Degradation and fines
Air flow
Inle
t tem
pera
ture
Degradation and fines
Air flow
Inle
t tem
pera
ture
Degradation and fines
Process DevelopmentCombination of Failure Modes
Paul Stott, AstraZeneca – BioKorea 2007
Process DevelopmentDrying Process Trajectories (1 kg Scale)
% H2O
2.0%1.5%
18.5%
Drying time
17.5% 12
34
5
6789
% H2O
2.0%1.5%
18.5%
Drying time
17.5% 12
34
5
6789
Paul Stott, AstraZeneca – BioKorea 2007
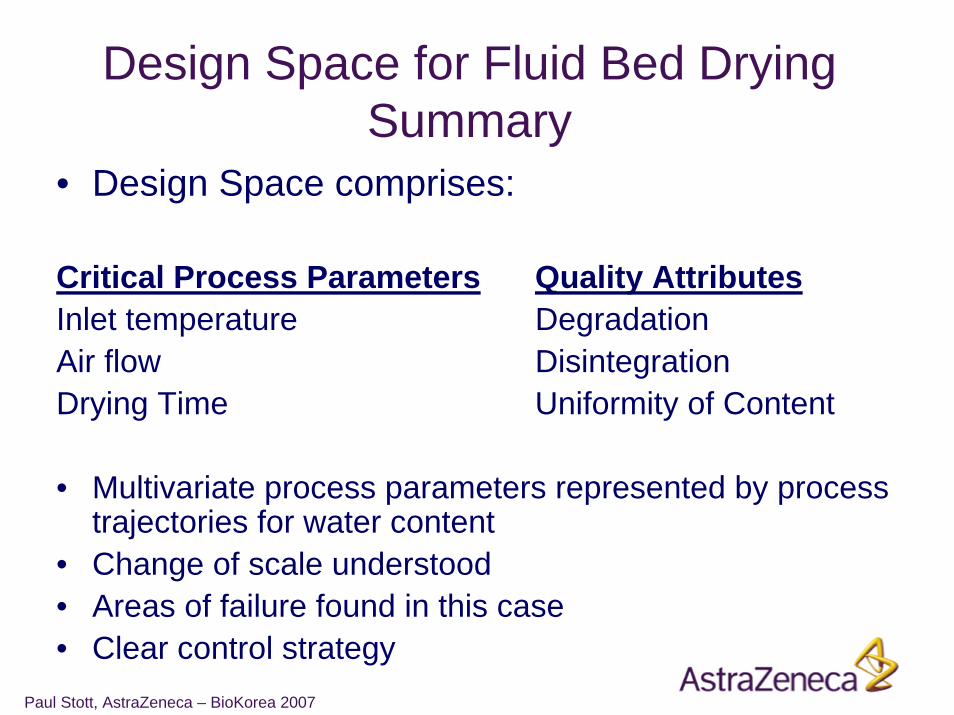
Design Space for Fluid Bed DryingSummary
• Design Space comprises:
Critical Process Parameters Quality AttributesInlet temperature DegradationAir flow DisintegrationDrying Time Uniformity of Content
• Multivariate process parameters represented by process trajectories for water content
• Change of scale understood• Areas of failure found in this case• Clear control strategy

Paul Stott, AstraZeneca – BioKorea 2007
Design Space for DryingGraphical Description
Known edge of failure due to fines
% H2O
2.0%1.5%
18.5%
Drying time
Known edge of failure due to degradation
Regions of uncertainty17.5%
Trajectories describing the boundaries of the design space where product quality is assured
Known edge of failure due to fines
% H2O
2.0%1.5%
18.5%
Drying time
Known edge of failure due to degradation
Regions of uncertainty17.5%
Trajectories describing the boundaries of the design space where product quality is assured
Paul Stott, AstraZeneca – BioKorea 2007
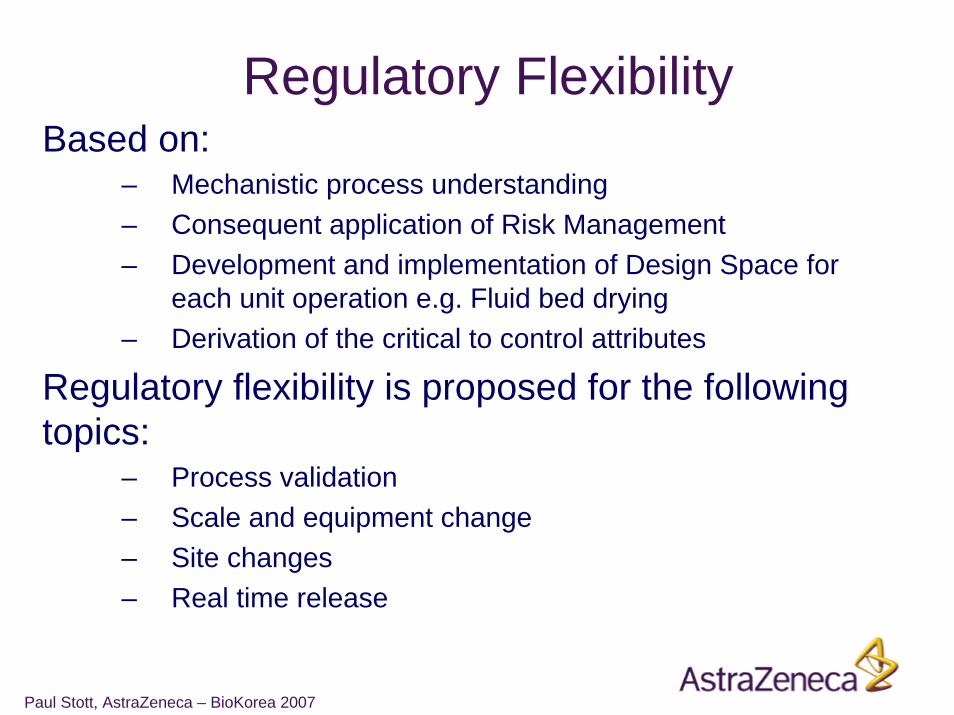
Regulatory FlexibilityBased on:
– Mechanistic process understanding– Consequent application of Risk Management– Development and implementation of Design Space for
each unit operation e.g. Fluid bed drying– Derivation of the critical to control attributes
Regulatory flexibility is proposed for the following topics:
– Process validation– Scale and equipment change– Site changes– Real time release

Paul Stott, AstraZeneca – BioKorea 2007
Case Study #2
An example of an AstraZeneca Development using the Principles of
ICHQ8 from the FDA CMC Pilot Program
Paul Stott, AstraZeneca – BioKorea 2007
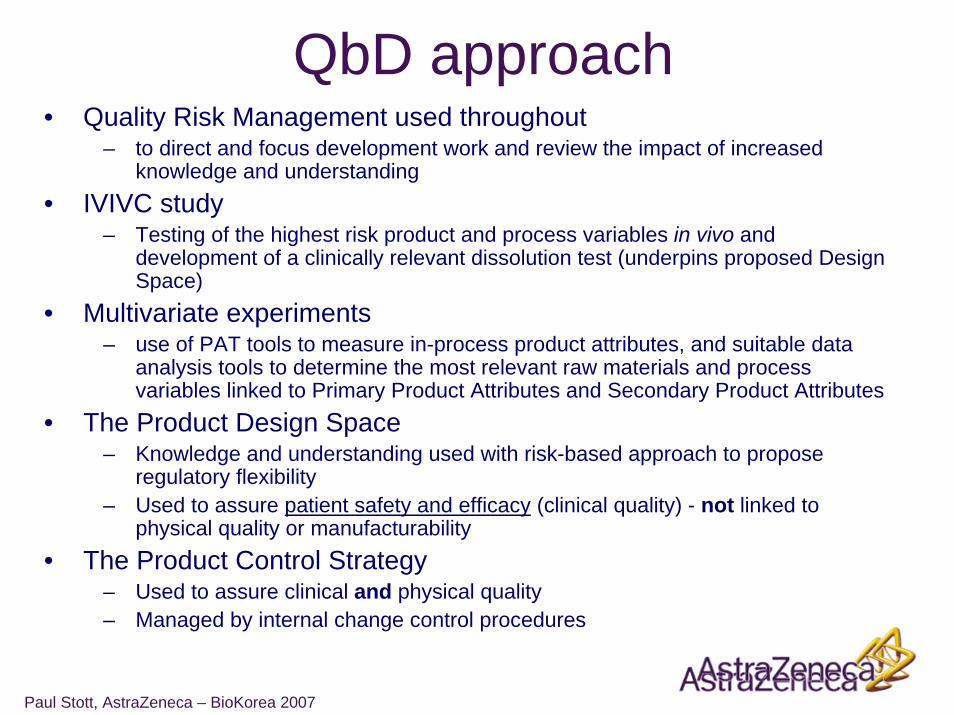
QbD approach• Quality Risk Management used throughout
– to direct and focus development work and review the impact of increased knowledge and understanding
• IVIVC study– Testing of the highest risk product and process variables in vivo and
development of a clinically relevant dissolution test (underpins proposed Design Space)
• Multivariate experiments– use of PAT tools to measure in-process product attributes, and suitable data
analysis tools to determine the most relevant raw materials and process variables linked to Primary Product Attributes and Secondary Product Attributes
• The Product Design Space– Knowledge and understanding used with risk-based approach to propose
regulatory flexibility– Used to assure patient safety and efficacy (clinical quality) - not linked to
physical quality or manufacturability• The Product Control Strategy
– Used to assure clinical and physical quality– Managed by internal change control procedures
Paul Stott, AstraZeneca – BioKorea 2007
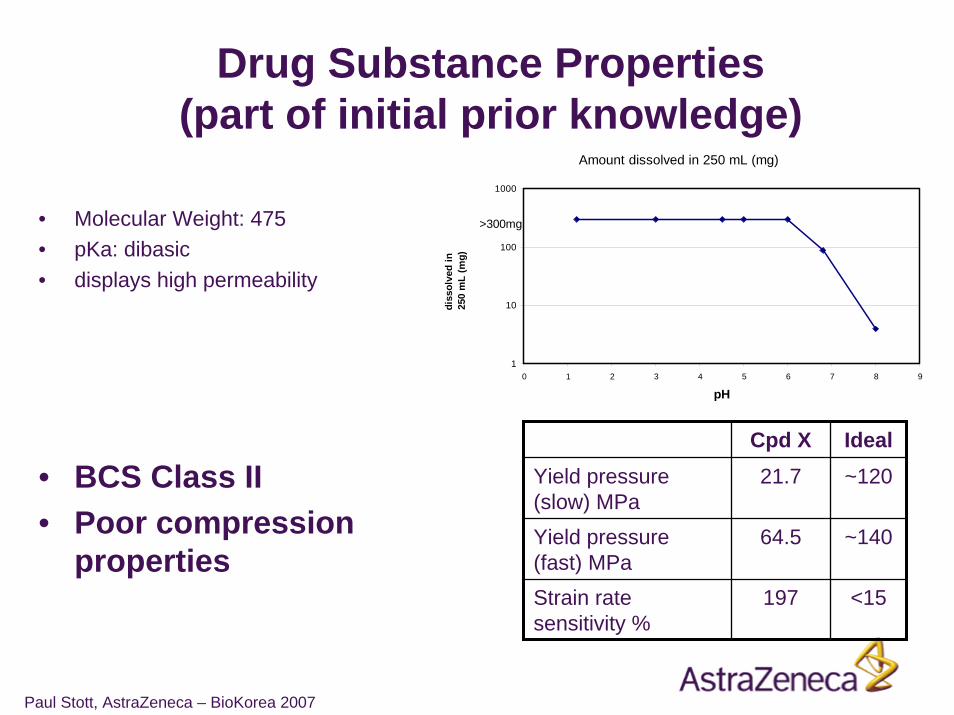
Drug Substance Properties (part of initial prior knowledge)
• Molecular Weight: 475• pKa: dibasic• displays high permeability
• BCS Class II• Poor compression
properties
Amount dissolved in 250 mL (mg)
1
10
100
1000
0 1 2 3 4 5 6 7 8 9
pH
diss
olve
d in
250
mL
(mg)
>300mg
Cpd X Ideal21.7 ~120
~140
<15
64.5
197
Yield pressure (slow) MPaYield pressure (fast) MPaStrain rate sensitivity %
Paul Stott, AstraZeneca – BioKorea 2007
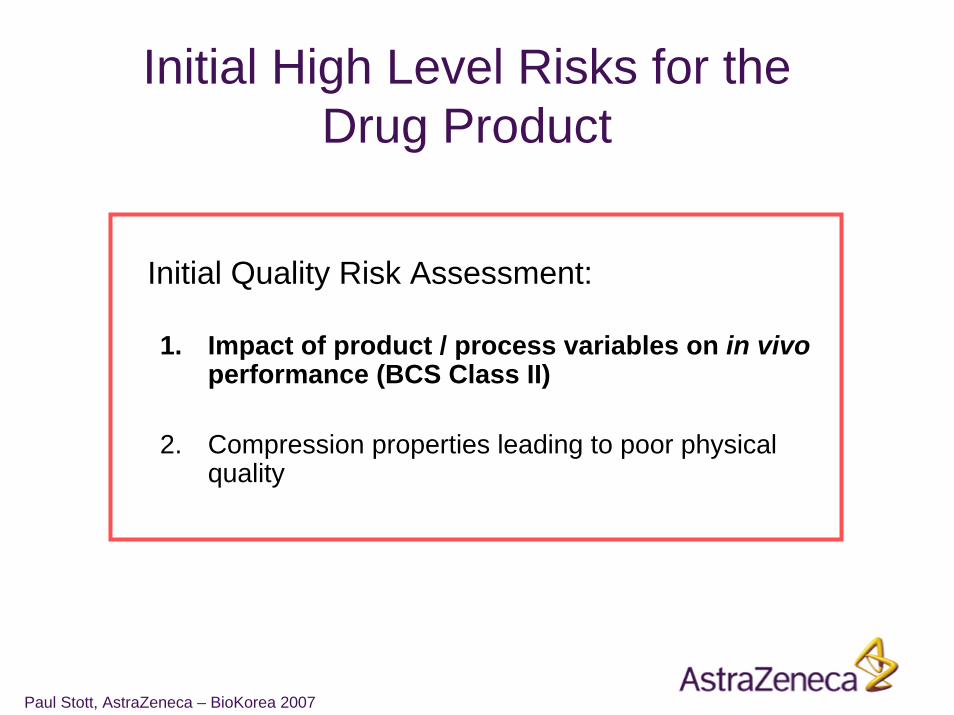
Initial High Level Risks for the Drug Product
Initial Quality Risk Assessment:
1. Impact of product / process variables on in vivoperformance (BCS Class II)
2. Compression properties leading to poor physical quality
Paul Stott, AstraZeneca – BioKorea 2007
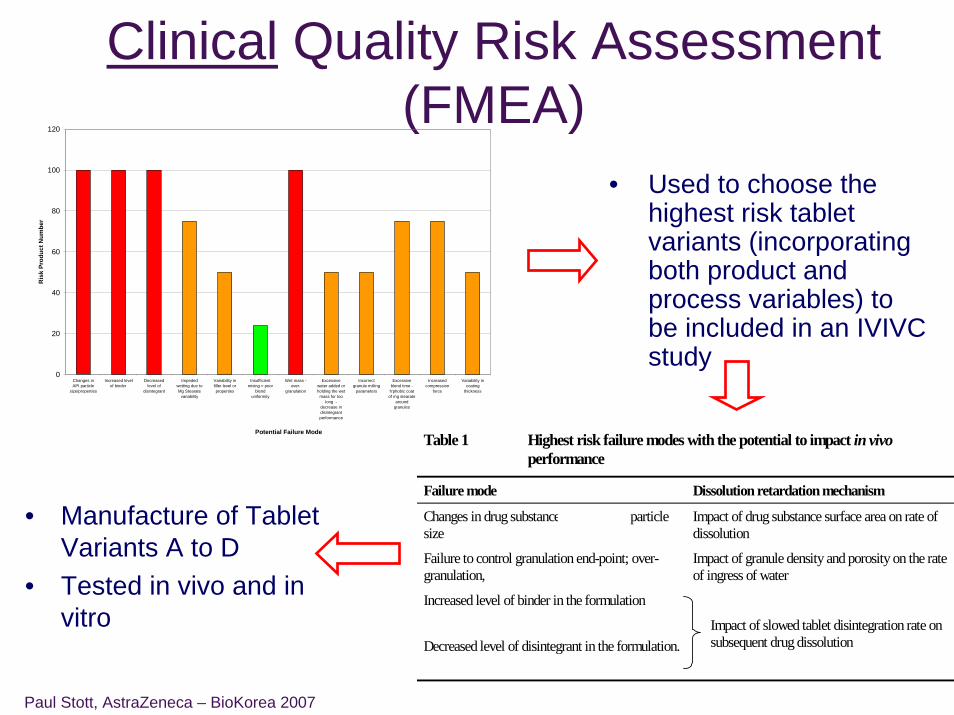
Clinical Quality Risk Assessment (FMEA)
• Used to choose the highest risk tablet variants (incorporating both product and process variables) to be included in an IVIVC study
• Manufacture of Tablet Variants A to D
• Tested in vivo and in vitro
Table 1 Highest risk failure modes with the potential to impact in vivo performance
Failure mode Dissolution retardation mechanism
Changes in drug substance (vandetanib) particle size
Impact of drug substance surface area on rate of dissolution
Failure to control granulation end-point; over-granulation,
Impact of granule density and porosity on the rate of ingress of water
Increased level of binder in the formulation
Decreased level of disintegrant in the formulation.
Impact of slowed tablet disintegration rate on subsequent drug dissolution
0
20
40
60
80
100
120
Changes inAPI particle
size/properties
Increased levelof binder
Decreasedlevel of
disintegrant
Impededwetting due toMg Stearate
variability
Variability infiller level orproperties
Insufficientmixing = poor
blenduniformity
Wet mass -over-
granulation
Excessivewater added orholding the wet
mass for toolong -
decrease indisintegrantperformance
Incorrectgranule milling
parameters
Excessiveblend time -
h'phobic coatof mg stearate
aroundgranules
Increasedcompression
force
Variability incoating
thickness
Potential Failure Mode
Ris
k Pr
oduc
t Num
ber
Paul Stott, AstraZeneca – BioKorea 2007
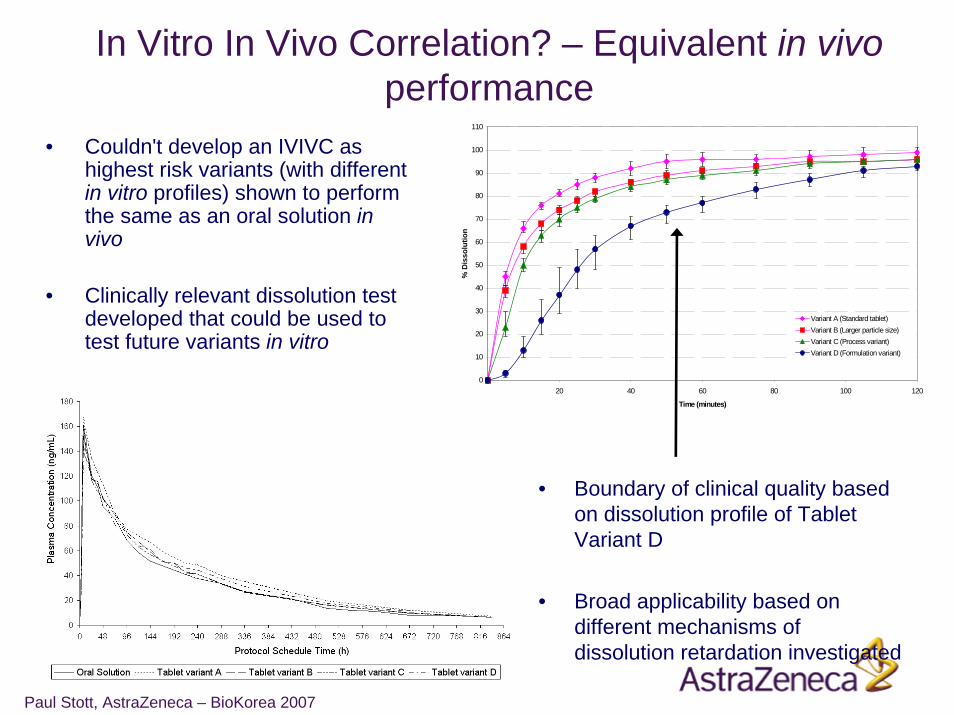
In Vitro In Vivo Correlation? – Equivalent in vivoperformance
• Couldn't develop an IVIVC as highest risk variants (with different in vitro profiles) shown to perform the same as an oral solution in vivo
• Clinically relevant dissolution test developed that could be used to test future variants in vitro
0
10
20
30
40
50
60
70
80
90
100
110
0 20 40 60 80 100 120
Time (minutes)
% D
isso
lutio
n
Variant A (Standard tablet)Variant B (Larger particle size)Variant C (Process variant)Variant D (Formulation variant)
• Boundary of clinical quality based on dissolution profile of Tablet Variant D
• Broad applicability based on different mechanisms of dissolution retardation investigated
Paul Stott, AstraZeneca – BioKorea 2007
Output of clinical evaluation of product & process variables
• The studies provide a tool to define the boundaries of the Design Space based on in vivo performance (safety & efficacy)
– An understanding that there’s a low probability of originally perceived high risk changes impacting in vivo PK
– An increased detectability as the dissolution method has been shown to be a suitable surrogate for in vivo performance (in conjunction with Assay and Uniformity of Dosage Unit)
– Product dissolution limits using this method will be based on the profile from Variant D, not on process capability
– The dissolution method can be used to evaluate other product and process variables in the establishment of the Design Space
– Future changes such as site, scale, equipment, method of manufacture can be qualified using this dissolution method and limit
Paul Stott, AstraZeneca – BioKorea 2007
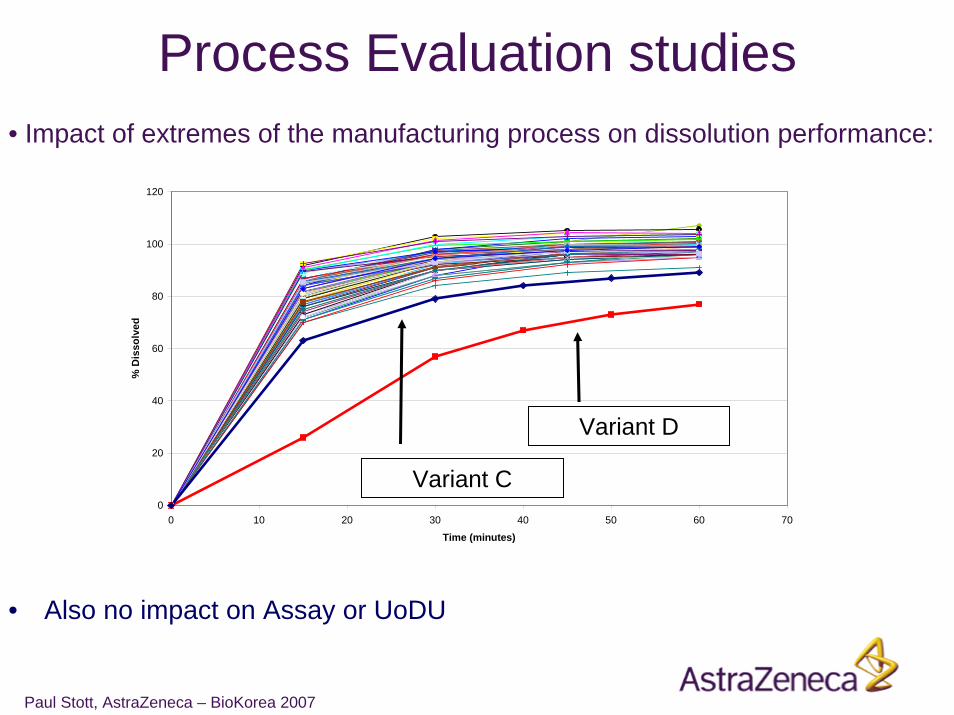
• Impact of extremes of the manufacturing process on dissolution performance:
0
20
40
60
80
100
120
0 10 20 30 40 50 60 70
Time (minutes)
% D
isso
lved
• Also no impact on Assay or UoDU
Variant D
Variant C
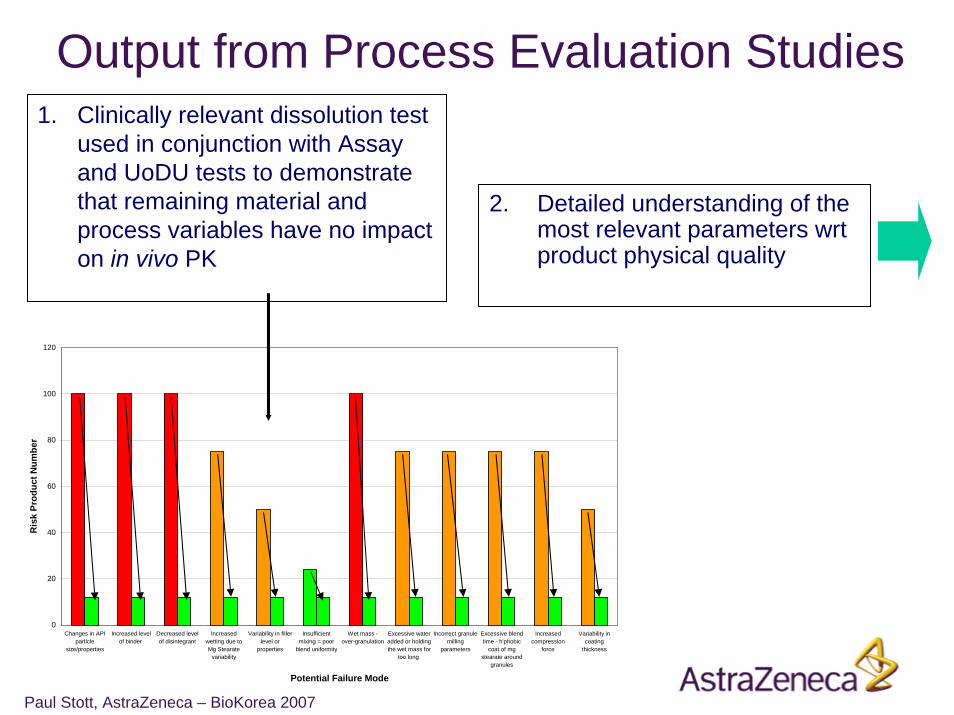
Process Evaluation studies
Paul Stott, AstraZeneca – BioKorea 2007
Output from Process Evaluation Studies1. Clinically relevant dissolution test
used in conjunction with Assay and UoDU tests to demonstrate that remaining material and process variables have no impact on in vivo PK
0
20
40
60
80
100
120
Changes in APIparticle
size/properties
Increased levelof binder
Decreased levelof disintegrant
Increasedwetting due toMg Stearate
variability
Variability in fillerlevel or
properties
Insufficientmixing = poor
blend uniformity
Wet mass -over-granulation
Excessive wateradded or holdingthe wet mass for
too long
Incorrect granulemilling
parameters
Excessive blendtime - h'phobic
coat of mgstearate around
granules
Increasedcompression
force
Variability incoating
thickness
Potential Failure Mode
Ris
k Pr
oduc
t Num
ber
2. Detailed understanding of the most relevant parameters wrt product physical quality
Paul Stott, AstraZeneca – BioKorea 2007
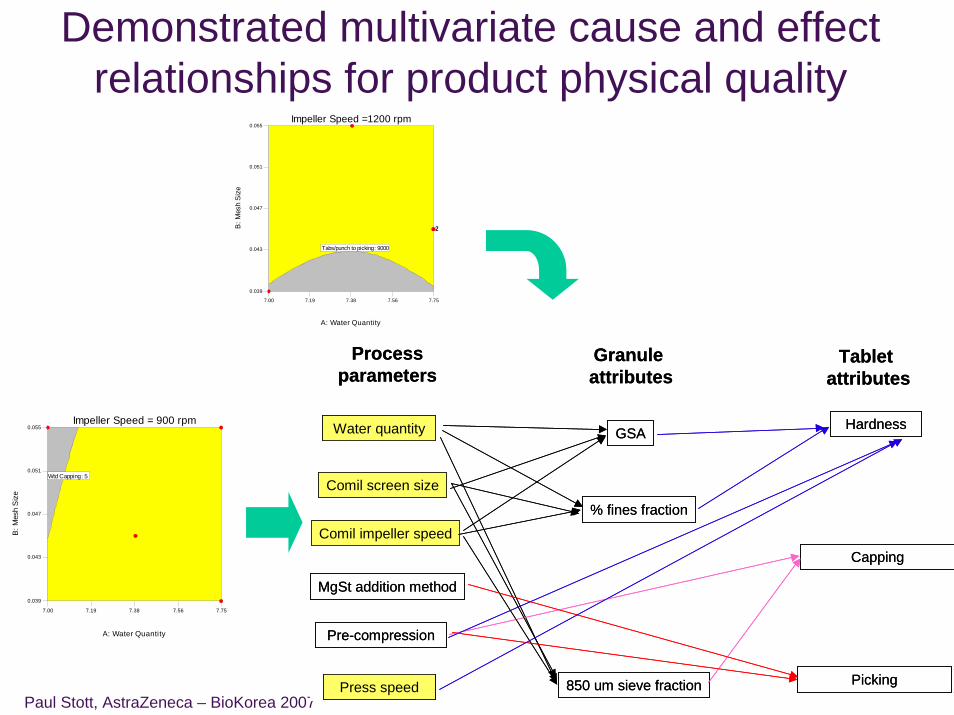
Demonstrated multivariate cause and effect relationships for product physical quality
Processparameters
Granule attributes
Tablet attributes
Water quantity
Comil screen size
Comil impeller speed
MgSt addition method
Pre-compression
Press speed
GSA
% fines fraction
850 um sieve fraction
Hardness
Capping
Picking
Processparameters
Granule attributes
Tablet attributes
Water quantity
Comil screen size
Comil impeller speed
MgSt addition method
Pre-compression
Press speed
GSA
% fines fraction
850 um sieve fraction
Hardness
Capping
Picking
7.00 7.19 7.38 7.56 7.75
0.039
0.043
0.047
0.051
0.055Impeller Speed =1200 rpm
A: Water Quantity
B: M
esh
Siz
eTabs/punch to picking: 9000
22
7.00 7.19 7.38 7.56 7.75
0.039
0.043
0.047
0.051
0.055Impeller Speed = 900 rpm
A: Water Quantity
B: M
esh
Siz
e
Wtd Capping: 5
Paul Stott, AstraZeneca – BioKorea 2007
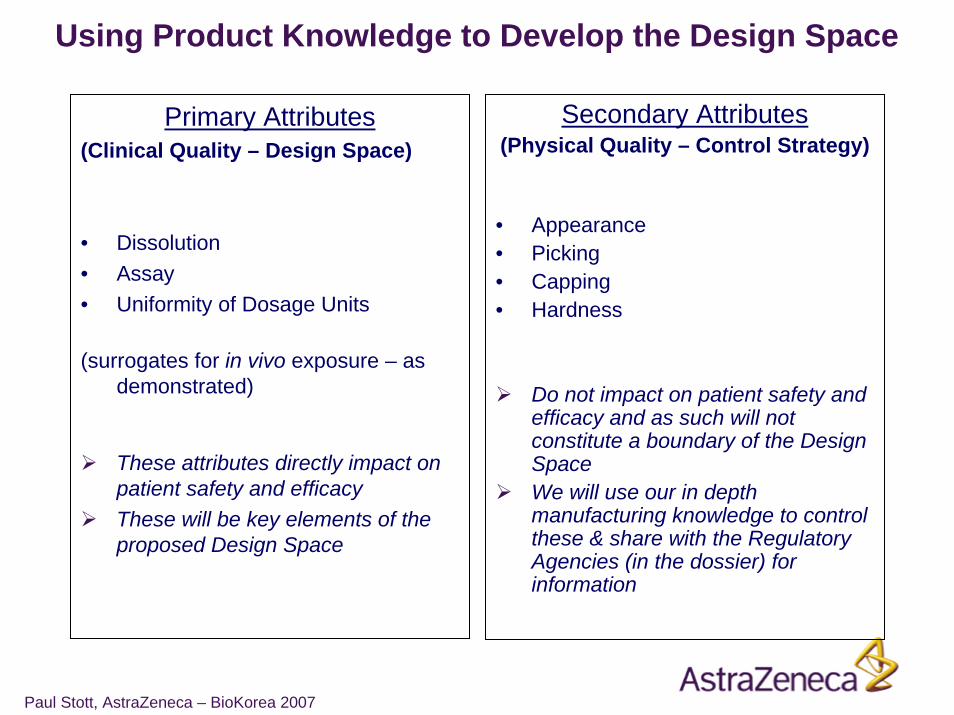
Primary Attributes(Clinical Quality – Design Space)
• Dissolution• Assay• Uniformity of Dosage Units
(surrogates for in vivo exposure – as demonstrated)
These attributes directly impact on patient safety and efficacyThese will be key elements of the proposed Design Space
Secondary Attributes(Physical Quality – Control Strategy)
• Appearance• Picking• Capping• Hardness
Do not impact on patient safety and efficacy and as such will not constitute a boundary of the Design SpaceWe will use our in depth manufacturing knowledge to control these & share with the Regulatory Agencies (in the dossier) for information
Using Product Knowledge to Develop the Design Space

Paul Stott, AstraZeneca – BioKorea 2007
• Is a combination of Input Boundaries and Primary Attributes boundaries:
• The Input Boundaries were defined to ensure: a) Low probability* of failure against Primary Attributes throughout the shelf-life of the productb) Low risk* of diminishing the clinical relevance of the clinical quality test methods (especially
dissolution)
• The Primary Attribute boundaries were defined to ensure in vivoperformance
Input Boundaries
Constraints on:• Drug substance particle size• Formulation• Process Type
No constraints on:• Site• Scale• Equipment and Process
Parameters
Primary Product Attributes (Outputs)
Constraints on:• Assay• Uniformity of Dosage Units• Dissolution
* Assessed using experimentation and prior knowledge
The Drug Product Design Space:
Ensures appropriate in vivoperformance.
Ensure correct and consistent dosing to patient
Ensures appropriate in vivoperformance.
Ensure correct and consistent dosing to patient
Low probability + High detectability = low risk within Design Space
Paul Stott, AstraZeneca – BioKorea 2007
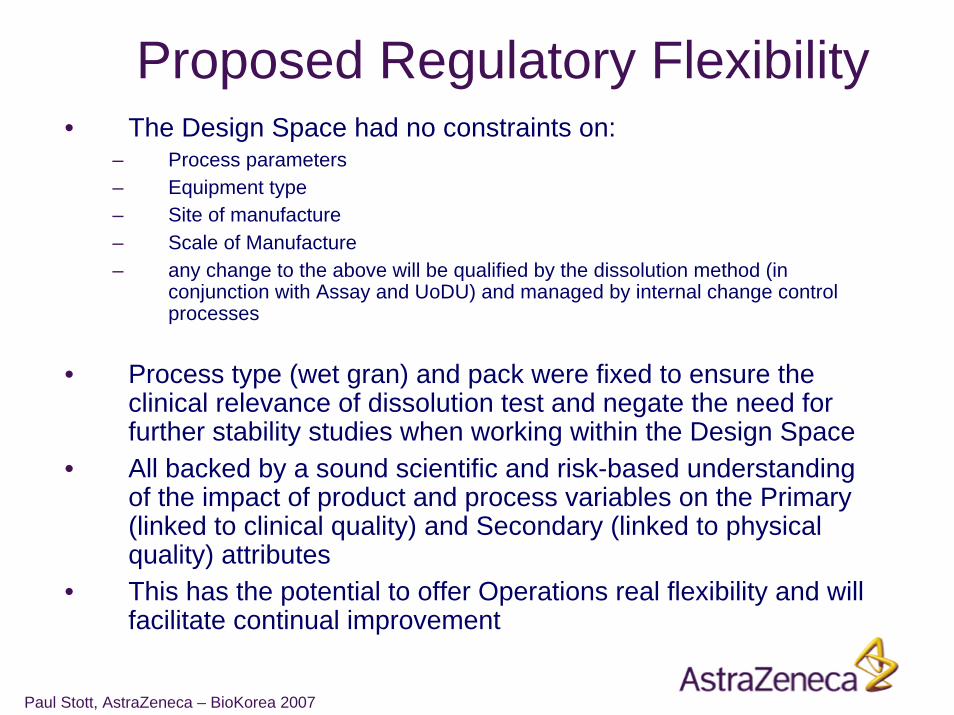
Proposed Regulatory Flexibility• The Design Space had no constraints on:
– Process parameters– Equipment type– Site of manufacture– Scale of Manufacture– any change to the above will be qualified by the dissolution method (in
conjunction with Assay and UoDU) and managed by internal change control processes
• Process type (wet gran) and pack were fixed to ensure the clinical relevance of dissolution test and negate the need for further stability studies when working within the Design Space
• All backed by a sound scientific and risk-based understanding of the impact of product and process variables on the Primary (linked to clinical quality) and Secondary (linked to physical quality) attributes
• This has the potential to offer Operations real flexibility and will facilitate continual improvement
Paul Stott, AstraZeneca – BioKorea 2007
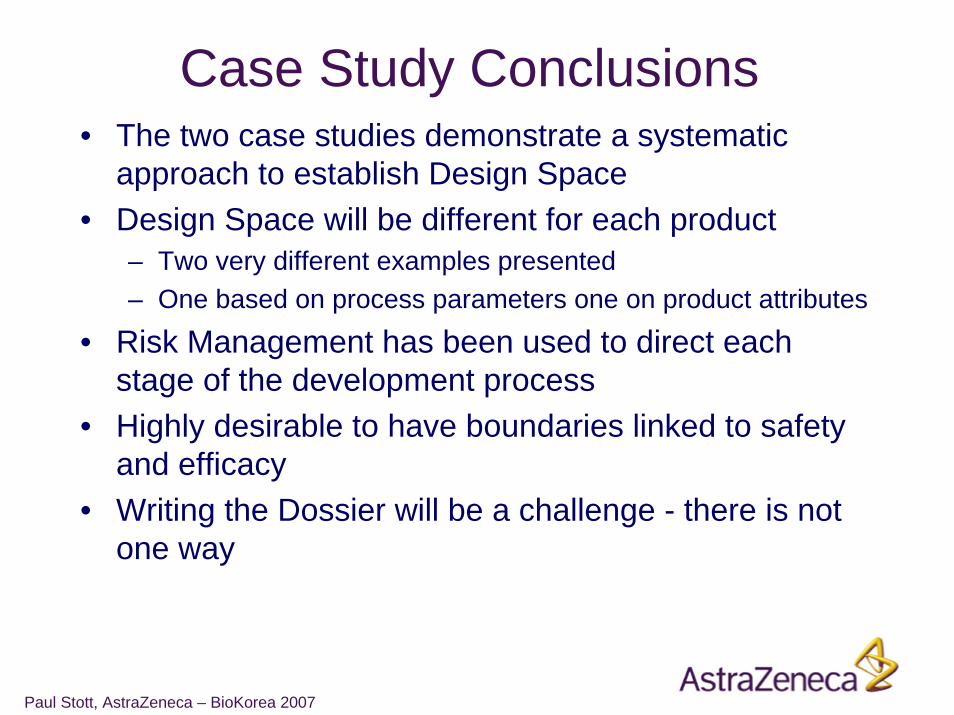
Case Study Conclusions• The two case studies demonstrate a systematic
approach to establish Design Space• Design Space will be different for each product
– Two very different examples presented– One based on process parameters one on product attributes
• Risk Management has been used to direct each stage of the development process
• Highly desirable to have boundaries linked to safety and efficacy
• Writing the Dossier will be a challenge - there is not one way
Paul Stott, AstraZeneca – BioKorea 2007
Have AstraZeneca’s investment in QbD and Control Strategies been
worth the effort?
YES!
A few examples to illustrate the internal value….
Paul Stott, AstraZeneca – BioKorea 2007
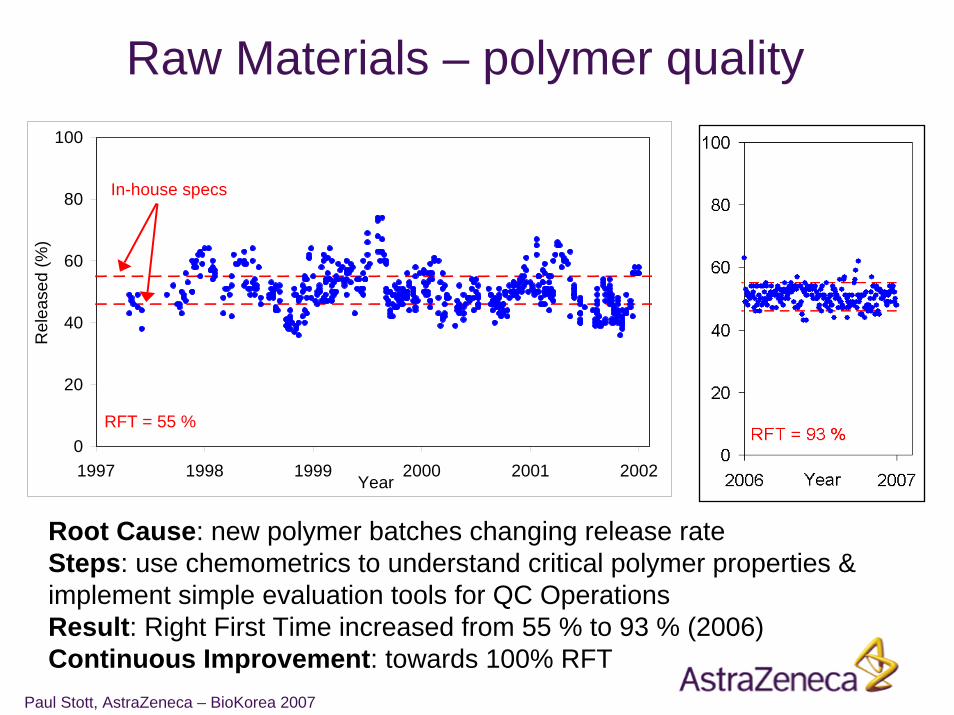
Raw Materials – polymer quality
0
20
40
60
80
100
1997 1998 1999 2000 2001 2002Year
Rel
ease
d (%
)
In-house specs
RFT = 55 %
Root Cause: new polymer batches changing release rateSteps: use chemometrics to understand critical polymer properties & implement simple evaluation tools for QC OperationsResult: Right First Time increased from 55 % to 93 % (2006)Continuous Improvement: towards 100% RFT
Paul Stott, AstraZeneca – BioKorea 2007
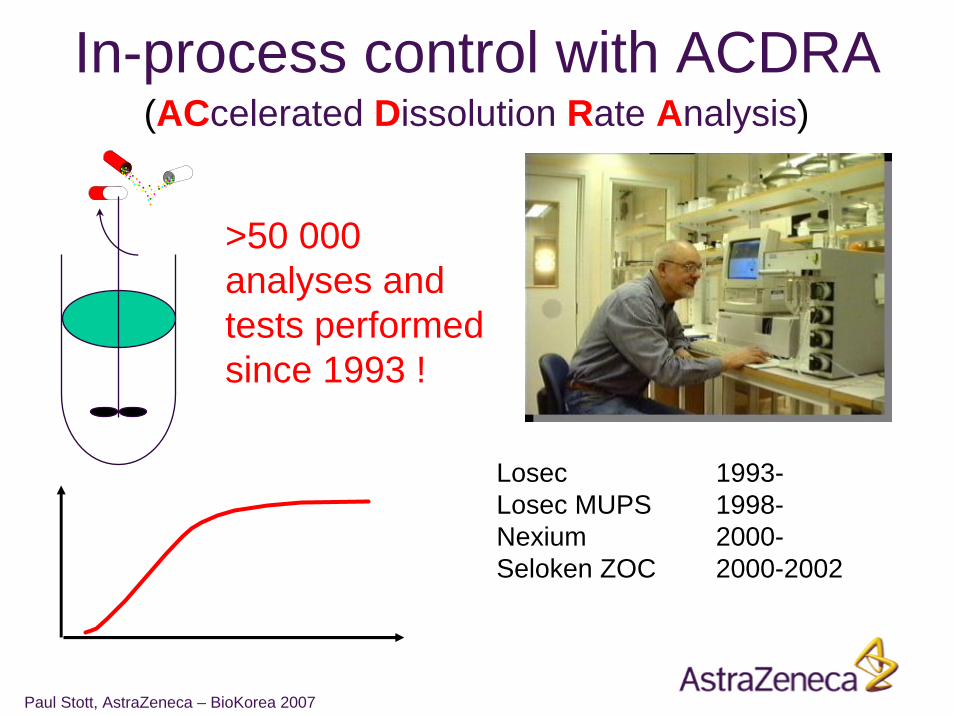
Losec 1993-Losec MUPS 1998-Nexium 2000-Seloken ZOC 2000-2002
In-process control with ACDRA(ACcelerated Dissolution Rate Analysis)
>50 000 analyses and tests performed since 1993 !
Paul Stott, AstraZeneca – BioKorea 2007
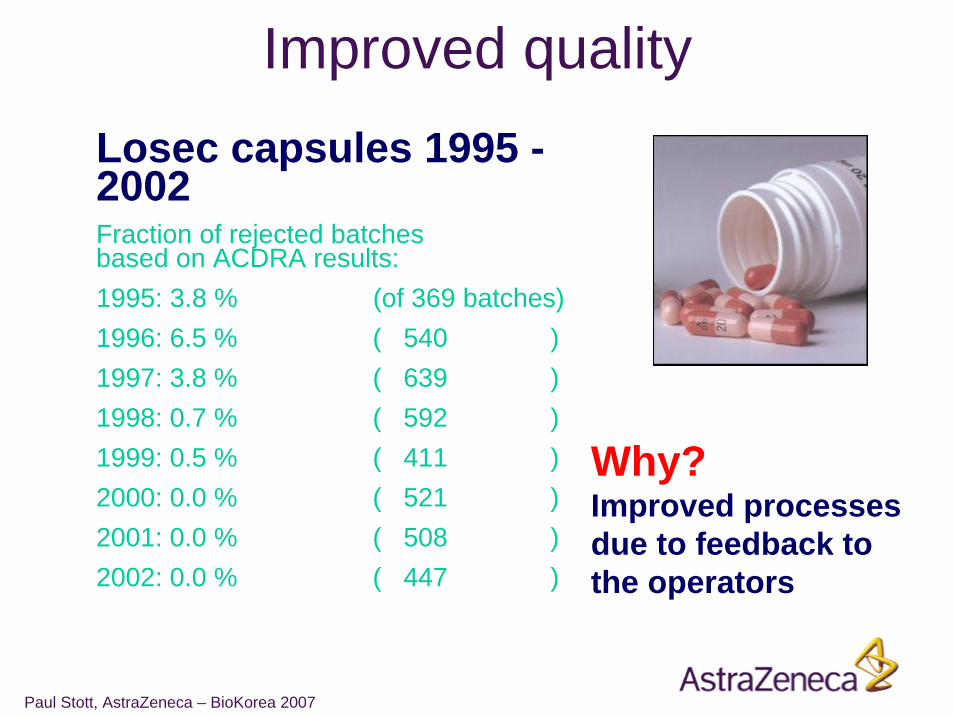
Improved quality
Why?Improved processes due to feedback to the operators
Losec capsules 1995 -2002Fraction of rejected batches based on ACDRA results:1995: 3.8 % (of 369 batches)1996: 6.5 % ( 540 )1997: 3.8 % ( 639 )1998: 0.7 % ( 592 )1999: 0.5 % ( 411 )2000: 0.0 % ( 521 )2001: 0.0 % ( 508 )2002: 0.0 % ( 447 )
Paul Stott, AstraZeneca – BioKorea 2007
Savings
Losec capsules
Dissolution tests moved from Q-lab to IPC-lab (ACDRA)
Less Q-analyses: 1.300 kUSD (1995-2000)Reduced lead time: 86 kUSD (2002)
Paul Stott, AstraZeneca – BioKorea 2007
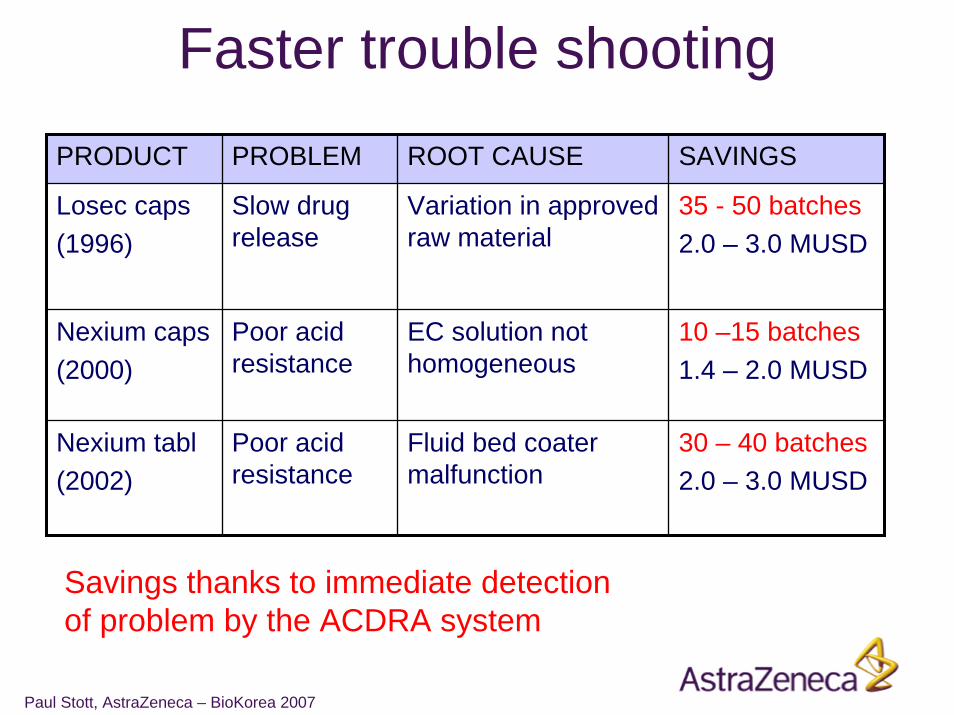
Faster trouble shootingPRODUCT PROBLEM ROOT CAUSE SAVINGS
Losec caps(1996)
Slow drug release
Variation in approved raw material
35 - 50 batches2.0 – 3.0 MUSD
Nexium caps(2000)
Poor acid resistance
EC solution not homogeneous
10 –15 batches1.4 – 2.0 MUSD
Nexium tabl(2002)
Poor acid resistance
Fluid bed coater malfunction
30 – 40 batches2.0 – 3.0 MUSD
Savings thanks to immediate detection of problem by the ACDRA system
Paul Stott, AstraZeneca – BioKorea 2007
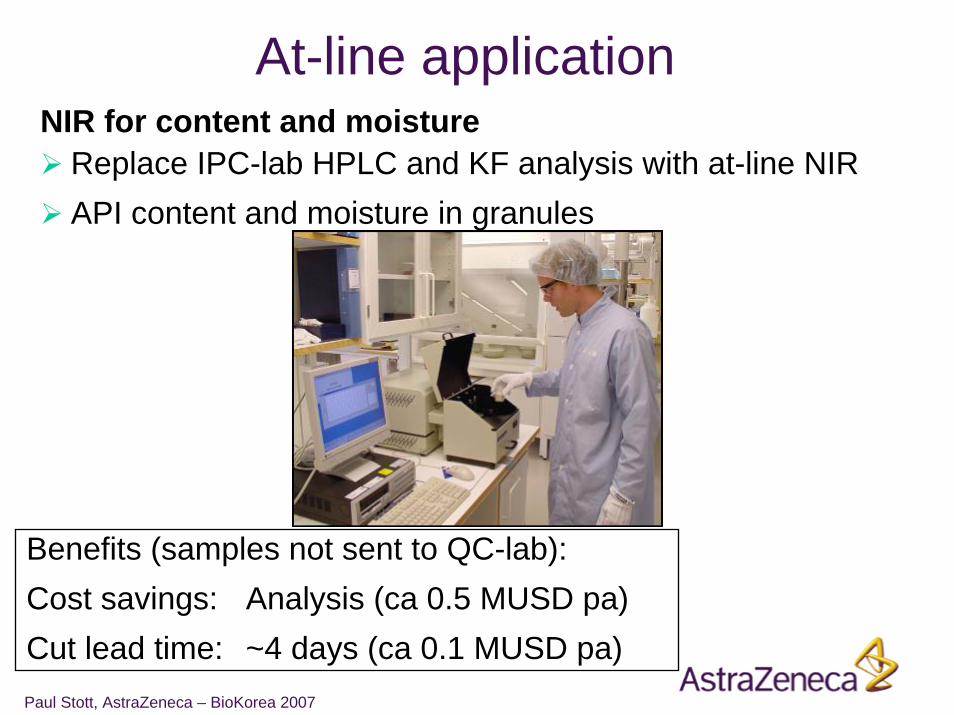
At-line applicationNIR for content and moisture
Replace IPC-lab HPLC and KF analysis with at-line NIRAPI content and moisture in granules
Benefits (samples not sent to QC-lab):Cost savings: Analysis (ca 0.5 MUSD pa)Cut lead time: ~4 days (ca 0.1 MUSD pa)
Paul Stott, AstraZeneca – BioKorea 2007
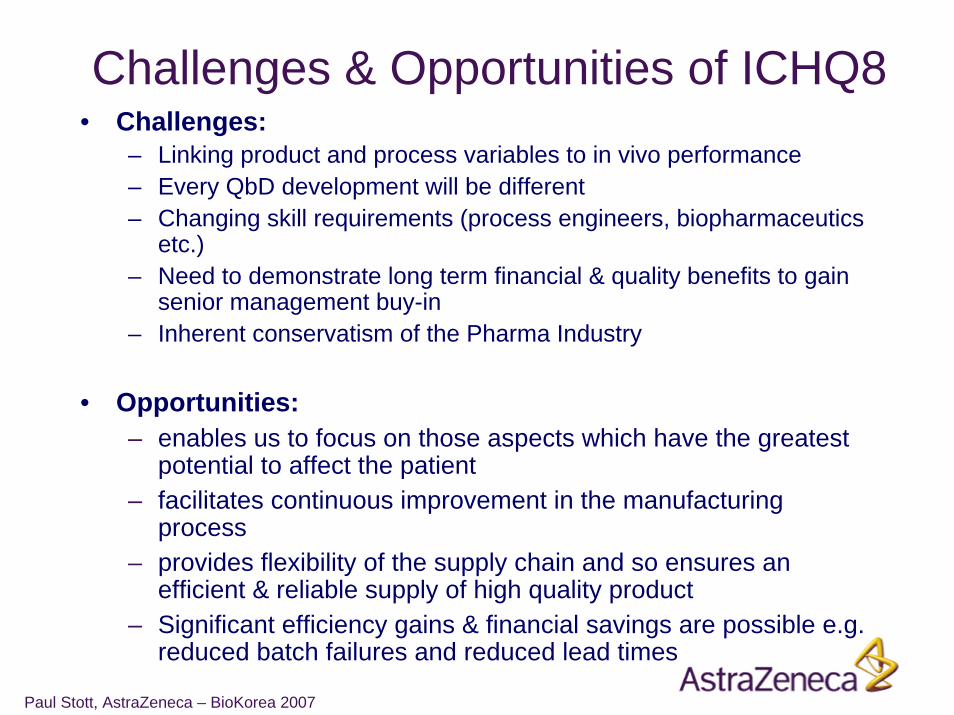
Challenges & Opportunities of ICHQ8• Challenges:
– Linking product and process variables to in vivo performance– Every QbD development will be different– Changing skill requirements (process engineers, biopharmaceutics
etc.)– Need to demonstrate long term financial & quality benefits to gain
senior management buy-in– Inherent conservatism of the Pharma Industry
• Opportunities:– enables us to focus on those aspects which have the greatest
potential to affect the patient– facilitates continuous improvement in the manufacturing
process– provides flexibility of the supply chain and so ensures an
efficient & reliable supply of high quality product– Significant efficiency gains & financial savings are possible e.g.
reduced batch failures and reduced lead times
Paul Stott, AstraZeneca – BioKorea 2007
Acknowledgements• Chris Potter (& the EFPIA PAT Topic Group)• Ryan Gibb• Paul Dickinson • Linda Billett• Christer Karlsson• Staffan Folestad• Arne Torstensson• …and many other colleagues at AZ