Embed Size (px)
Citation preview

J. of Acc. Ed. 30 (2012) 397–415
Contents lists available at SciVerse ScienceDirect
J. of Acc. Ed.
journal homepage: www.elsevier .com/locate/ jaccedu
Teaching and Education note
An instructional note on business risk and audit implications:Seasonality at Mattel
Rachel Schwartz a,⇑, John Chandler b,1
a Department of Accountancy, University of Illinois at Urbana–Champaign, 302 Wohlers Hall, 1206 S. Sixth Street, Champaign,IL 61820, USAb Department of Accountancy, University of Illinois at Urbana–Champaign, 4006 Business Instructional Facility, 515 E. Gregory Drive,Champaign, IL 61820, USA
a r t i c l e i n f o
Article history:Available online 3 November 2012
Keywords:Business risk assessmentSeasonalityAS 12ISA 315
0748-5751/$ - see front matter � 2012 Elsevier Lthttp://dx.doi.org/10.1016/j.jaccedu.2012.09.004
⇑ Corresponding author. Tel.: +1 217 333 0975;E-mail addresses: [email protected] (R. Sch
1 Tel.: +1 217 333 4539; fax: +1 217 244 0902.
a b s t r a c t
This instructional note provides materials that can be integratedinto a current auditing course to demonstrate the use of a com-pany’s disclosures to understand the company, assess businessrisks, and identify audit implications. Assessing business risks inthe audit process has been a key thrust of academic and profes-sional investigation over the last 20 years, and Auditing Standard12 raised the profile, importance and requirements for assessingbusiness risk. Teaching the assessment of business risk in the class-room, however, is challenging. Although auditors may get access tocompanies’ internal procedures of risk measurement and manage-ment, students would not. But there is a wealth of information thatstudents do have access to in required SEC filings, as well as at pub-lic companies’ investor relations websites. This note provides aspecific example of business risk and audit implications usinginformation about seasonality at Mattel.
� 2012 Elsevier Ltd. All rights reserved.
1. Introduction
Assessing business risk is an important step in the audit of financial statements as it could identifyareas for further analysis and testing that may be overlooked by a bottom-up approach. While State-ments on Auditing Standards (SAS) 109 and International Standards on Auditing (ISA) 315 require theauditor to understand the entity and its environment, the requirement to assess business risk as part
d. All rights reserved.
fax: +1 217 244 0902.wartz), [email protected] (J. Chandler).
398 R. Schwartz, J. Chandler / J. of Acc. Ed. 30 (2012) 397–415
of the audit got a boost in 2010 with the Public Company Accounting Oversight Board (PCAOB) issu-ance of Auditing Standard (AS) 12: Identifying and Assessing the Risks of Material Misstatements. AS 12includes an augmented perspective on the assessment of business risk, elevating it to the level of a keyelement of an auditor’s understanding of the company and broadening it to include a requirement forthe auditor to consider new sources of information.
This instructional note provides educational materials that can be integrated into an audit class todemonstrate the use of a company’s disclosures in understanding the company, assessing businessrisks, and identifying audit implications. The educational objectives of this note are threefold: Demon-strate the interrelatedness of business risks and financial statements, demonstrate audit implicationsof business risks, and enable students to investigate primary sources.
The need to include business risk assessment in accounting curricula received great emphasis inthe mid-1990s in the conceptualization of risk-based auditing (see Bell, Marrs, Solomon, & Thomas,1997), and all major audit textbooks now present a business risk approach, albeit at various degreesof emphasis (see e.g., Arens, Elder, and Beasley (2012), Hooks (2011), Knechel, Salterio, and Ballou(2007), Louwers, Ramsay, Sinason, Strawser, and Thibodeau (2011), Messier, Glover, and Prawitt(2010), Rittenberg, Johnstone, and Gramling (2012), Stuart (2012), and Whittington and Pany(2012)). But assessing business risk using real-world data presents some difficulties for the classroom.Few accounting students, even upper-level students, have direct experience with business processesand therefore most students find the notion of assessing business risk remote at best. In addition, busi-ness risks are managed inside of organizations, and getting direct insights into these risks and howthey are managed would require a company to divulge proprietary information. Thus, for a classroomsetting, providing real-world insights into the recognition and management of business risk is chal-lenging. Furthermore, although the Securities and Exchanges Commission (SEC) requires a disclosureof business risks in annual filings of public companies (Item 1A of form 10-K), there are no generallyaccepted principles for the measurement and disclosure of business risks, and each company maymeasure and disclose its risks differently.
This note presents a specific classroom example of investigating a business risk and its audit impli-cations using SEC filings and other information sources that AS 12 requires the auditor to consider. Byusing primary sources rather than a self-contained case, this article addresses the call by academe andthe profession for the development of realistic materials to enhance accounting education and betterprepare students for entering the profession. The American Accounting Association (AAA) began themovement in 1986 with the issuance of the Bedford Committee Report (AAA, 1986) and was joinedby the profession (see e.g., Arthur Andersen et al., 1989). This culminated in the Accounting EducationChange Commission (Accounting Education Change Commission (AECC)., 1990), and continued withthe profession’s push for more realism in teaching accounting and auditing topics (see, e.g., Albrecht& Sack, 2000; PricewaterhouseCoopers (PWC), 2003).
The use of primary sources in the classroom can be challenging as the students are often over-whelmed by the amount of information that is available and the need to evaluate the credibility ofvarious sources of information. Students must first determine what sources they can rely on andwhich information to use before they can tackle the analysis. Using realistic settings also places a bur-den on instructors to stay current with the continuous flow of information. But as Bamber and Bamber(2006) point out, these costs are outweighed by the benefits of developing the students’ research skillsand giving them experience with real-world companies.
And while the additional sources that AS 12 requires the auditor to consider may further exacer-bate the challenges of information overload, they also make the need for realism in the classroommore imperative than ever.
2. Using quarterly financial statements to teach seasonality business risk
Business risk might be conceptualized as consisting of many dimensions that might negatively im-pact the company’s ability to meet its objectives. For example, supply chain risk, competition risk,logistics risk, and seasonality risk, to name a few. This instructional note focuses on seasonalityrisk—the risk resulting from a product that experiences seasonal demand.

R. Schwartz, J. Chandler / J. of Acc. Ed. 30 (2012) 397–415 399
Seasonality risk was chosen for several reasons. First, students are familiar with the concept of sea-sonality—they buy apparel that maps to weather seasons (winter and summer), shop at retail storesthat have significant holiday seasons, and purchase certain items (such as cars) that have new modelcycles. Thus, students already have an intuitive expectation that certain industries and companiesshould disclose seasonality as a business risk. Second, seasonality is relatively easier to observe (com-pared to supply chain risk, for example) since quarterly sales are publicly available in the quarterlyreports that every publicly traded firm must file with the Securities and Exchange Commission(SEC). Finally, seasonality and cyclicality are specifically mentioned in ISA 315 Paragraph A17 as anexample of a relevant industry factor that are necessary to obtain an understanding of the companyand its environment. This provides the same impetus for inclusion mentioned in Ballou, Cashell,and Heitger (2008) for risk-based approaches.
Mattel, a toy manufacturer, was chosen for the seasonality risk analysis example because the toyindustry experiences a strong seasonality effect with most sales occurring in the second half of the fis-cal year. While this instructional note presents a series of four exercises focused on Mattel, Appendix Dprovides the resources necessary to repeat the analyses using data from another key player in the toyindustry (Hasbro).
The financial statement information used for the analysis of seasonality risk is all drawn from 10-Qquarterly reports filed by Mattel for the years 2008–2010. Although quarterly financial statements arenot audited, the auditor must understand the pattern of various account balances throughout the yearin order to form expectations about the year-end balances that are being audited. For example, sincesales of toys are concentrated in the second half of the fiscal year, and new toys are introduced eachyear, the inventory of a toy manufacturer should be at its lowest level at the end of the year. If inven-tory levels at year-end (which is also the end of the selling season) are not significantly lower thaninventory at the beginning of the selling season, it is highly likely that some of that year-end inventoryis obsolete and must be written-down. Failure to do so is likely to result in a material misstatement ofthe year-end inventory balance.
Another reason to examine the quarterly data is to understand the links between flows in variousaccounts throughout the year and the associated risks. For example, Mattel discloses that the need tobuild-up inventory well in advance of the selling season results in ‘‘seasonal working capital financingrequirements.’’ However, the full extent of the risk that Mattel is exposed to becomes clear only afterthe quarterly cash flows are examined and it is discovered that Mattel’s cash flow from operations isconsistently negative in the first three quarters of each year. This negative cash flow underscores thevital role of Mattel’s credit arrangements. Hence, the importance of the auditor understanding Mattel’scredit facility agreement and the debt covenants that are associated with it.
This instructional note proceeds as follows: Section 3.1 presents Section 3.2 presents the first exer-cise, discussing Mattel’s seasonal sales using quarterly data from the first quarter of 2008 through thefourth quarter of 2010, and the effect of sales seasonality on income. Exercise 2 in Section 3.2 exam-ines the effect of seasonal sales on the inventory build-up that occurs in anticipation of the selling sea-son, and the implications of seasonality for the audit of inventory. Section 3.3 presents the thirdexercise, examining the effect of seasonality on the pattern of accounts receivable, and the implica-tions for the audit of accounts receivable. This series of exercises culminates in Section 3.4 with Exer-cise 4 investigating the implications of inventory build-up in the first part of the year combined withcredit sales in the second part of the year for liquidity and cash flows from operations. Section 4 dis-cusses implementation issues and possible extension.
3. Teaching seasonality business risk and audit implications
3.1. Advance preparation
As advance preparation for the discussion of seasonality business risk at Mattel two readings areassigned. The first includes excerpts of AS 12 and ISA 315 that deal with regulatory requirementsfor understanding the company and assessing business risk as part of the audit, and the second refersstudents to Mattel’s 2010 10-K Items 1 and 1A, where Mattel discusses its business (Item 1) and

400 R. Schwartz, J. Chandler / J. of Acc. Ed. 30 (2012) 397–415
provides a mandatory risk factor disclosure (Item 1A). The purpose is to have the students gain anunderstanding of Mattel’s business before they come to class.
Since Items 1 and 1A cover many dimensions of the business, the class starts with two excerptsfrom the readings to focus students’ attention on the seasonality aspect of the business and form abasis for the analysis of this risk and its audit implications.
An excerpt from Mattel 2010 10-K Item 1 (Business):
‘‘Mattel’s business is highly seasonal, with consumers making a large percentage of all toy pur-chases during the traditional holiday season. A significant portion of Mattel’s customers’ purchas-ing occurs in the third and fourth quarters of Mattel’s fiscal year in anticipation of such holidaybuying. These seasonal purchasing patterns and requisite production lead times create risk to Mat-tel’s business associated with the underproduction of popular toys and the overproduction of lesspopular toys that do not match consumer demand. Retailers are also attempting to manage theirinventories more tightly in recent years, requiring Mattel to ship products closer to the time theretailers expect to sell the products to consumers. These factors increase the risk that Mattelmay not be able to meet demand for certain products at peak demand times or that Mattel’sown inventory levels may be adversely impacted by the need to pre-build products before ordersare placed.’’
An excerpt from Mattel 2010 10-K Item 1A (Risk Factors):
. . .as a result of the seasonal nature of Mattel’s business, Mattel may be significantly and adverselyaffected, in a manner disproportionate to the impact on a company with sales spread more evenlythroughout the year, by unforeseen events, such as terrorist attacks, economic shocks, earthquakesor other catastrophic events, that harm the retail environment or consumer buying patterns duringits key selling season, or by events, such as strikes, disruptions in transportation or port delays, thatinterfere with the manufacture or shipment of goods during the critical months leading up to theholiday purchasing season.
After a class discussion of the business risks that arise from the seasonal nature of the toy industry,the next step is to examine the effects of seasonality on quarterly financial statements and the auditimplications of seasonality. The sales seasonality in quarterly income statements is observed in Exer-cise 1, followed by the audit implications of the seasonal changes in the levels of inventory and ac-counts receivables (Exercises 2 and 3, respectively), and the resulting cash flows from operations(Exercise 4).
3.2. Seasonality of sales (Exercise 1)
Students are provided with a summary of Mattel’s quarterly income statements for 2008–2010 (seeAppendix A), and are asked to comment on seasonality patterns. Table 1 summarizes key quarterlyincome data over a 3 year period (2008–2010).
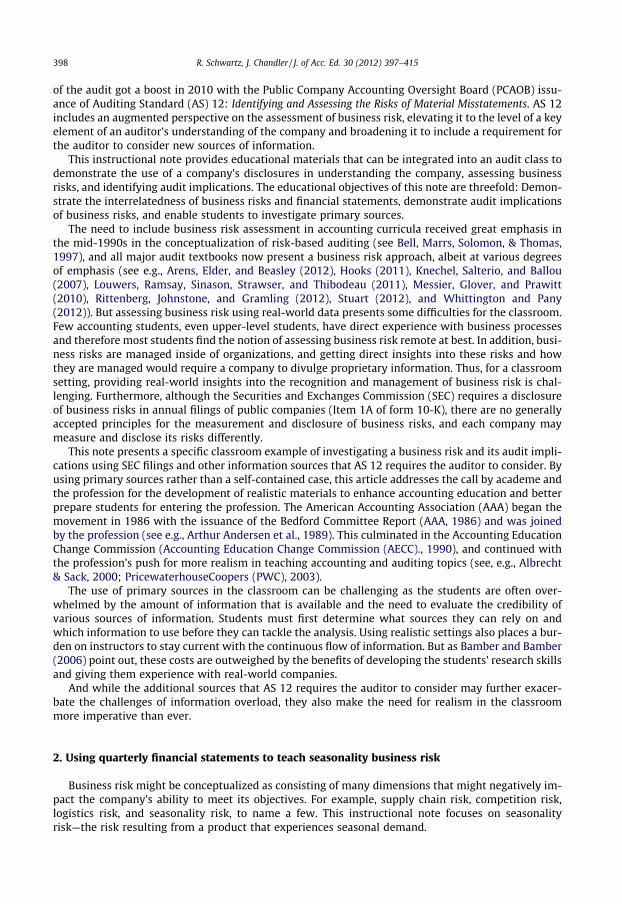
While there is some variability in the data, it is clear that over the period examined most of thesales occur in the last two quarters of each fiscal year. To highlight the seasonality effect, data wereconverted from the $ amount of sales to expressing each quarter’s sales in terms of its percentageout of the total annual sales. Fig. 1 presents the normalized data.
Table 1Quarterly sales, gross profit, and operating income.
2008 2009 2010
(in millions of $) Q1 Q2 Q3 Q4 Q1 Q2 Q3 Q4 Q1 Q2 Q3 Q4
Net sales 919 1112 1946 1940 786 898 1792 1955 880 1019 1833 2124Gross profit 397 495 900 892 346 406 919 1044 432 490 938 1096Operating income (37) 31 315 232 (55) 33 337 417 45 69 359 429
16%
19%
33% 33%
14%17%
33%36%
15%17%
31%
36%
0%
5%
10%
15%
20%
25%
30%
35%
40%
Q1 Q2 Q3 Q4 Q1 Q2 Q3 Q4 Q1 Q2 Q3 Q4
201020092008
Fig. 1. Mattel’s quarterly sales as% of annual sales.
R. Schwartz, J. Chandler / J. of Acc. Ed. 30 (2012) 397–415 401
The pattern of seasonality that is depicted in Fig. 1 is very clear. The first quarter sales range from14% to 16%; second quarter sales are somewhat higher but do not exceed 19% (second quarter sales are19% in 2008 and 17% in 2009 and 2010). In contrast, third quarter sales exceed 30% in all 3 years (33%in 2008, 33% in 2009, and 31% in 2010). Finally, fourth quarter sales are the highest with 33% in 2008and 36% in 2009 and 2010.
The quarterly sales data reveal that more than two thirds of annual sales occur between July andDecember, consistent with Mattel’s discussion of seasonality in Item 1 of the 10-K, where it stated thatthe majority of the sales occur in the third and fourth quarter.
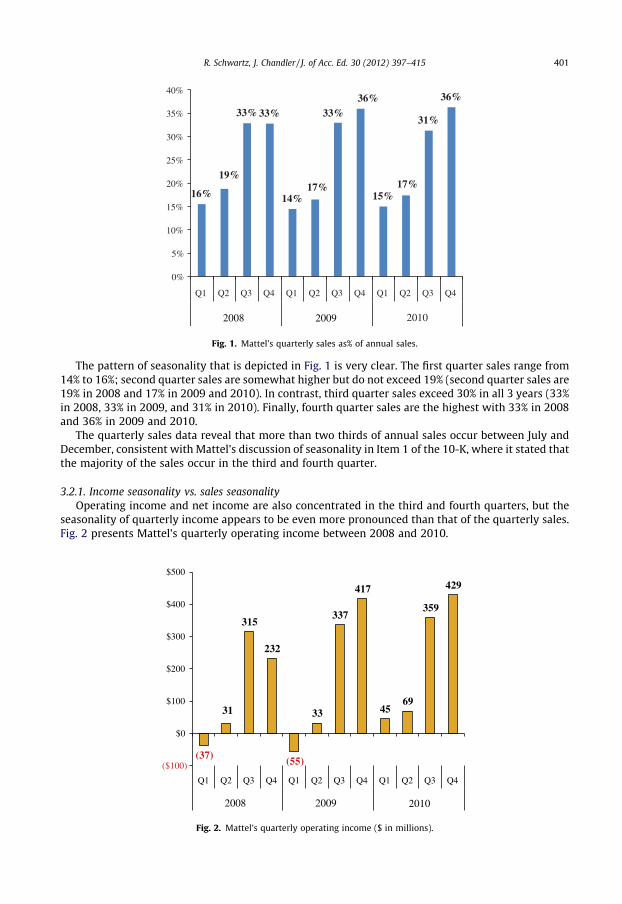
3.2.1. Income seasonality vs. sales seasonalityOperating income and net income are also concentrated in the third and fourth quarters, but the
seasonality of quarterly income appears to be even more pronounced than that of the quarterly sales.Fig. 2 presents Mattel’s quarterly operating income between 2008 and 2010.
(37)
31
315
232
(55)
33
337
417
4569
359
429
($100)
$0
$100
$200
$300
$400
$500
Q1 Q2 Q3 Q4 Q1 Q2 Q3 Q4 Q1 Q2 Q3 Q4
20102008 2009
Fig. 2. Mattel’s quarterly operating income ($ in millions).

402 R. Schwartz, J. Chandler / J. of Acc. Ed. 30 (2012) 397–415
Students are often surprised by the stronger seasonality in operating income. When asked to ex-plain it, their first response is to conjecture that the more pronounced seasonality is due to the needto build up inventory in the first part of the year while generating more sales in the later months. Thisis an excellent opportunity to remind them that while Mattel must build up inventory prior to the sell-ing season, that build-up of inventory will be reflected on the balance sheet, but will not affect theincome statement because the matching principle requires that inventory is expensed as Cost ofGoods Sold (COGS) only when the sales are recognized.
To confirm that COGS is not the cause for the stronger seasonality exhibited by income, the quar-terly income data from Appendix A is presented in a common size format as in Table 2.
Table 2 validates again that quarterly COGS is quite stable as percent of quarterly sales. It also dem-onstrates that advertising and promotion expenses are also quite stable at about 11% of quarterlysales. The only line item that exhibits great fluctuations as percent of quarterly sales is Other Sellingand Administrative (S&A).
Selling and administrative (S&A) expenses exceed 30% of sales in the first two quarters, but rangefrom 19% to 21% in the third and fourth quarters. As a result, operating income ranges from �7% to 7%of sales in the first and second quarters. In contrast, that operating margin is between 12% and 21% inthe third and fourth quarters. It is interesting to note that although quarterly S&A constitute a higherpercentage of quarterly sales in the first half of the year, the $ amount of these expenses is actuallylower during that time. As Table 3 shows, quarterly selling and administrative expenses range from$293 million to $330 million in the first quarter and from $284 million to $348 million in the secondquarter, vs. a range of $343-$385 million in the third quarter and $384-$404 million in the fourthquarter.
To summarize, the seasonality in Mattel’s operations originates in the seasonal nature of sales inthe toy industry, but the sales seasonality combined with relatively fixed administrative costs resultsin an even stronger seasonality of quarterly operating income.
Having understood the seasonal nature of sales, the next step is to examine the effects of season-ality on Mattel’s balance sheet accounts and the implications for audits of these accounts. Since the toyindustry’s seasonal business requires an inventory build-up prior to the selling season, followed by abuild-up of accounts receivable during the selling season, the focus of the analysis is on these two bal-ance sheet accounts. The pattern of inventory levels throughout the year is observed, followed by thepattern of accounts receivable, cash flow implications, and the unique risk presented by the negativecash flow from operations in the first three quarters of the year.
Table 2Common size presentation of quarterly income data.
2008 2009 2010
Q1 Q2 Q3 Q4 Q1 Q2 Q3 Q4 Q1 Q2 Q3 Q4
Net sales (%) 100 100 100 100 100 100 100 100 100 100 100 100Cost of sales (%) 57 55 54 54 56 55 49 47 51 52 49 48Gross profit (%) 43 45 46 46 44 45 51 53 49 48 51 52Advertising and promotion (%) 11 10 11 14 11 10 11 12 11 10 11 12Other selling and administrative (%) 36 31 19 20 40 32 21 20 33 31 21 20Operating income (%) �4 3 16 12 �7 4 19 21 5 7 19 19
Table 3Quarterly selling and administrative expenses.
2008 2009 2010
(in millions of $) Q1 Q2 Q3 Q4 Q1 Q2 Q3 Q4 Q1 Q2 Q3 Q4
Other selling and administrative 330 348 361 384 317 284 385 388 293 318 377 418

R. Schwartz, J. Chandler / J. of Acc. Ed. 30 (2012) 397–415 403
3.3. Seasonality and inventory (Exercise 2)
The purpose of understanding the pattern of balance sheet levels throughout the year is toenable the auditor to form expectations regarding the year-end balance that is being audited. Thisexercise begins by asking the students to form expectations about the pattern of inventorythrough the year after reading the following short excerpt from Mattel’s discussion of business(2010 10-K, Item 1):
In anticipation of retail sales in the traditional holiday season, Mattel significantly increases its pro-duction in advance of the peak selling period, resulting in a corresponding build-up of inventorylevels in the first three quarters of its fiscal year. Seasonal shipping patterns result in significantpeaks in the third and fourth quarters in the respective levels of inventories and accounts receiv-able, which result in seasonal working capital financing requirements.
In response to the question about inventory patterns, most students predict that inventory willgradually increase from the first quarter to the third quarter, and then decrease in the fourthquarter. After we discuss their predictions, students are directed to compare the predicted pat-terns to actual data that are presented in a summary of Mattel’s quarterly balance sheets for2008–2010 (see Appendix B). Fig. 3 presents the quarterly levels of inventories between 2008and 2010.
As expected, inventory levels increase from quarter 1 to quarter 2, peak in quarter 3, and then dropin quarter 4. In particular, the inventory balance at the end of the fourth quarter is less that 65% of theinventory at the end of the third quarter in all 3 years.
Since AS 12 directs the auditor to consider information from ‘‘company prepared presentationmaterials for analysts or investor groups’’ (Paragraph 11), discussion of inventory concludes with aslide from Mattel’s presentation to analysts (Mattel, 2009) where it provided a visual illustration ofmonthly levels of inventory, rather than just the quarter-end levels that are reported on 10-Q’s.Whereas the quarterly data indicate that a typical fourth quarter inventory does not exceed 65% ofthird quarter inventory, the monthly data reveal that inventory peaks in August, and the year-endinventory is less than 40% of that peak inventory.
3.3.1. Implications of seasonality for the audit of inventoryAs auditors form expectations about the year-end balance of inventories, they should be aware of
such patterns in the inventory account. In particular, since 80% of the product line is new each year(Mattel, 2009), excessive inventories at the end of the year might indicate obsolete inventory that
534
676
751
486 488
590 606
356
430
598
741
464
$0
$100
$200
$300
$400
$500
$600
$700
$800
3/31 6/30 9/30 12/31 3/31 6/30 9/30 12/31 3/31 6/30 9/30 12/31
2008 2009 2010
Fig. 3. Mattel’s inventory ($ in millions).
404 R. Schwartz, J. Chandler / J. of Acc. Ed. 30 (2012) 397–415
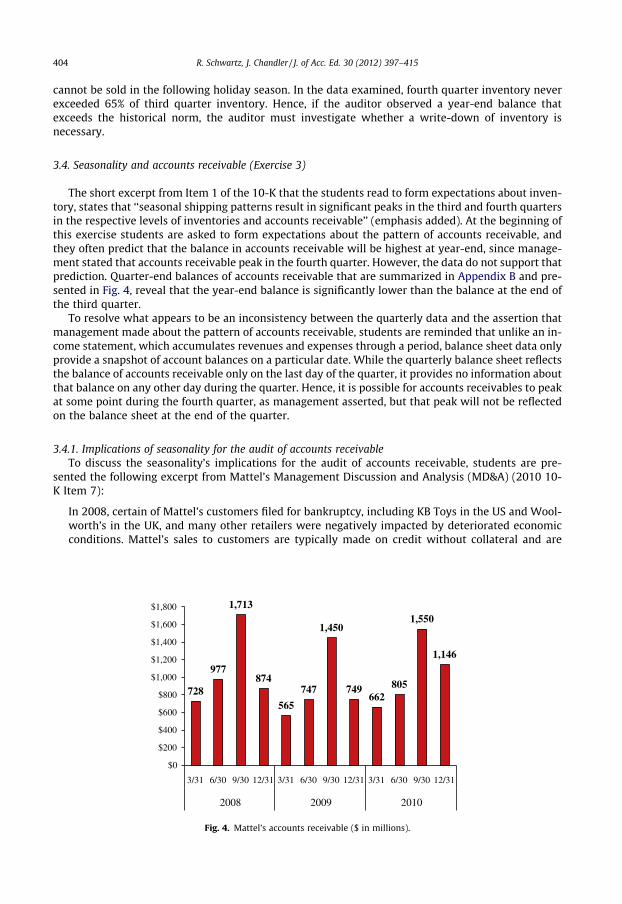
cannot be sold in the following holiday season. In the data examined, fourth quarter inventory neverexceeded 65% of third quarter inventory. Hence, if the auditor observed a year-end balance thatexceeds the historical norm, the auditor must investigate whether a write-down of inventory isnecessary.
3.4. Seasonality and accounts receivable (Exercise 3)
The short excerpt from Item 1 of the 10-K that the students read to form expectations about inven-tory, states that ‘‘seasonal shipping patterns result in significant peaks in the third and fourth quartersin the respective levels of inventories and accounts receivable’’ (emphasis added). At the beginning ofthis exercise students are asked to form expectations about the pattern of accounts receivable, andthey often predict that the balance in accounts receivable will be highest at year-end, since manage-ment stated that accounts receivable peak in the fourth quarter. However, the data do not support thatprediction. Quarter-end balances of accounts receivable that are summarized in Appendix B and pre-sented in Fig. 4, reveal that the year-end balance is significantly lower than the balance at the end ofthe third quarter.
To resolve what appears to be an inconsistency between the quarterly data and the assertion thatmanagement made about the pattern of accounts receivable, students are reminded that unlike an in-come statement, which accumulates revenues and expenses through a period, balance sheet data onlyprovide a snapshot of account balances on a particular date. While the quarterly balance sheet reflectsthe balance of accounts receivable only on the last day of the quarter, it provides no information aboutthat balance on any other day during the quarter. Hence, it is possible for accounts receivables to peakat some point during the fourth quarter, as management asserted, but that peak will not be reflectedon the balance sheet at the end of the quarter.
3.4.1. Implications of seasonality for the audit of accounts receivableTo discuss the seasonality’s implications for the audit of accounts receivable, students are pre-
sented the following excerpt from Mattel’s Management Discussion and Analysis (MD&A) (2010 10-K Item 7):
In 2008, certain of Mattel’s customers filed for bankruptcy, including KB Toys in the US and Wool-worth’s in the UK, and many other retailers were negatively impacted by deteriorated economicconditions. Mattel’s sales to customers are typically made on credit without collateral and are
728
977
1,713
874
565
747
1,450
749662
805
1,550
1,146
$0
$200
$400
$600
$800
$1,000
$1,200
$1,400
$1,600
$1,800
3/31 6/30 9/30 12/31 3/31 6/30 9/30 12/31 3/31 6/30 9/30 12/31
2008 2009 2010
Fig. 4. Mattel’s accounts receivable ($ in millions).
R. Schwartz, J. Chandler / J. of Acc. Ed. 30 (2012) 397–415 405
highly concentrated in the third and fourth quarters due to the cyclical nature of toy sales, whichresults in a substantial portion of trade receivables being collected during the latter half of the yearand the first quarter of the following year. There is a risk that customers will not pay, or that pay-ment may be delayed, because of bankruptcy or other factors beyond the control of Mattel. Thiscould increase Mattel’s exposure to losses from bad debts.
After reading this excerpt the students form small groups (in class) to discuss the audit implica-tions of credit sales that are highly concentrated in the second half of the year (close to the balancesheet date). According to Mattel’s management, accounts receivable build up from March to Novem-ber, and are being paid off starting in December. Indeed, in 2008 the accounts receivable balance at theend of the fourth quarter is 51% of the balance at the end of the third quarter, in 2009 the year-endbalance is 52% of the balance at the end of the third quarter, and in 2010 it is 74%. Hence, auditorsmust evaluate the financial health of the customers to assess the adequacy of the allowance for doubt-ful accounts.
After concluding this discussion, students are introduced to a follow-up excerpt from the sameMD&A:
A small number of customers account for a large share of Mattel’s net sales and accounts receiv-able. In 2010, Mattel’s three largest customers, Wal-Mart, Toys ‘‘R’’ Us, and Target, in the aggregate,accounted for approximately 41% of net sales, and its ten largest customers, in the aggregate,accounted for approximately 51% of net sales. As of December 31, 2010, Mattel’s three largest cus-tomers accounted for approximately 50% of net accounts receivable, and its ten largest customersaccounted for approximately 60% of net accounts receivable. The concentration of Mattel’s businesswith a relatively small number of customers may expose Mattel to a material adverse effect if oneor more of Mattel’s large customers were to experience financial difficulty.
Since 51% of accounts receivable are concentrated in three key customers, and most sales occur inquarters 3 and 4 as credit sales without collateral, the auditor must understand the financial health ofthese top customers to ensure that the allowance for doubtful accounts reflects the risk of bad debtlosses to which Mattel is exposed.
To summarize, the need to produce toys and build up the inventory ahead of the selling season,coupled with the fact that all sales are credit sales and collections from accounts receivable occur pri-marily between December and March, creates a unique situation where Mattel must finance its oper-ations by relying on external sources. The next step is to understand the cash flows and liquidityimplications of the inventory build-up in the first three quarters coupled with credit sales that areconcentrated in quarters 3 and 4.
3.5. Seasonality, liquidity, and cash flows from operations (Exercise 4)
Mattel mentions in its discussion of business that the build-up of inventory prior to the selling sea-son coupled with the increase in accounts receivable during the selling season ‘‘result in seasonalworking capital financing requirements’’ (Mattel, 2011a, p. 6).
The fourth exercise starts with the quarterly statement of cash flows (2008 through 2010). Sincemany students have not worked with that statement for a while, some time is dedicated to a shortreview of this statement. The main purpose is to remind students that the statement of cash flows al-lows them to identify cash flows from operations separately from cash used for investing and cashflows from financing activities. Hence, while the cash balance on the balance sheet reflects cash fromall sources, the statement of cash flows will allow them to observe the liquidity implications of inven-tory build-up in the first three quarters that is followed by sales at the end of the year.
Appendix C presents the cash flows worksheet. The top table presents cumulative quarterly cashflow data as provided in the 10-Q quarterly reports. Before analyzing the effect on quarterly cashflows, students must first convert the cumulative data to non-cumulative quarterly data, as summa-rized in Table 4:

Table 4Quarterly cash from operations.
2008 2009 2010
(in millions of $) Q1 Q2 Q3 Q4 Q1 Q2 Q3 Q4 Q1 Q2 Q3 Q4
Cash from operations (264) (266) (137) 1103 (215) (135) 31 1264 (245) (127) (56) 956
(264) (266)(137)
1,103
(215)(135)
31
1,264
(245)(127)
(56)
956
($400)
($200)
$0
$200
$400
$600
$800
$1,000
$1,200
$1,400
Q1 Q2 Q3 Q4 Q1 Q2 Q3 Q4 Q1 Q2 Q3 Q4
2008 2009 2010
Fig. 5. Mattel’s quarterly cash flows from operations ($ in millions).
406 R. Schwartz, J. Chandler / J. of Acc. Ed. 30 (2012) 397–415
Fig. 5 presents Mattel’s quarterly cash from operations between 2008 and 2010. Recall that morethan 90% of Mattel’s annual operating income is generated in the third and fourth quarter. In contrast,quarterly cash from operations is negative in the first three quarters of each year. In particular, cashfrom operations in the first three quarters of 2008, 2009, and 2010 was ($667) million, ($319) million,and ($428) million, respectively.
The annual cash from operations for each of the 3 years is positive, but this is only possible due tothe strong cash inflow in the fourth quarter. In fact, cash from operations in the fourth quarter of 2008,2009, and 2010 was $1103 million, $1264 million, and $956 million, whereas cash from operations inthe first 9 months of the year was ($667) million in 2008, ($319) million in 2009, and ($428) million in2010.
To finance its operations while operating cash flow is negative, ‘‘Mattel maintains a domesticunsecured committed revolving credit facility with a commercial bank group that is used as theprimary source of financing for the seasonal working capital requirements of its domestic subsidi-aries’’ (Mattel, 2011a p. 76). This external financing exacerbates the risk of cash inflow concentra-tion in the fourth quarter because without that positive inflow Mattel might default on its creditagreement.
That risk is further exacerbated by the fact that a significant percent of that cash is concentrated incollections from the three top customers. Unforeseen external events that could have negative effectson purchases in the fourth quarter, or on the financial health of Mattel’s top customers, might threatenMattel’s ability to fulfill its financial obligations.
Since auditors are required to gain understanding of the company’s funding sources (AS 12 Para-graph 10), and a failure to meet debt covenants could lead to loss of financing—a significant business

R. Schwartz, J. Chandler / J. of Acc. Ed. 30 (2012) 397–415 407
risk that could lead to material misstatements (AS 12 Paragraph 15), this unit concludes with anassignment that helps the students understand the details of Mattel’s seasonal financing and the debtcovenants it imposes. The assignment instructs students to read Form 8-K filed by Mattel on 3/10/2011 (Mattel, 2011b) for details on the credit facility agreement and prepare a written memo thatdemonstrates their understanding of the credit facility, the debt covenants, and more generally, thepressures that such covenants might create for management. That assignment is also used as a bridgeto the next unit where students explore performance measures that are used internally and in com-pensation arrangements, as well as measures that are used by external parties, such as analysts andrating agencies (AS 12 Paragraphs 16–17).
4. Implementation issues and extensions
4.1. Implementation—data availability
4.1.1. Availability of SEC filingsThe data and excerpts used by students in the exercises are derived from Mattel’s quarterly and
annual reports (Forms 10-Q and 10-K, respectively) that are filed with the SEC. Those data and allother filings with the SEC are available through the SEC’s EDGAR system (primarily as text files) athttp://www.sec.gov/cgi-bin/browse-edgar?action=getcompany&CIK=0000063276&owner=exclude&count=40&hidefilings=0. Alternatively, Mattel’s filings with the SEC are available in three other file for-mats (HTML, PDF, and XLS) via a link that Mattel provides on its investor relation site at http://inves-tor.shareholder.com/mattel/s.cfm.
4.1.2. Availability of presentations to analysts and earnings conference callsSEC Regulation Fair Disclosure (Reg. FD) requires publicly traded companies that disclose material
non-public information to certain entities (such as securities analysts) to make that information avail-able to the public in order to avoid selective disclosure. Consistent with Reg. FD, Mattel posts copies ofpresentations to analysts (including earnings conference calls), and transcripts of these presentations,at http://investor.shareholder.com/mattel/events.cfm. Mattel’s archived presentations are generallyavailable for about 24 months, but that time frame can change as it is not prescribed by Reg. FD.
4.2. Classroom implementation
The four exercises presented in this instructional note could be completed sequentially, allocatingabout 10 min to the discussion of business risks that arise from the seasonal nature of the toy industry(Section 3.1), 10 min to Exercise 1 (the effects of seasonality on sales and income), 15 min to Exercise 2(seasonality and inventory), 20 min to Exercise 3 (seasonality and accounts receivable), and 40 min toExercise 4 (seasonality, liquidity, and cash flows from operations). Following that approach will nat-urally require that the series of exercises is scheduled after the students were exposed to the audit ofinventory and accounts receivable.
Alternatively, the exercise structure allows an instructor to focus the in-class analysis on specifictopics without going through all exercises in class. For example, if an instructor wanted to focus onlyon the implications of seasonality for accounts receivable (Exercise 3), the instructor could provide allof the data and analysis of Sections 3.1 and 3.2 as a reading assignment, and work through Section 3.4in class. Similarly, an instructor who wants to focus only on the liquidity and cash flows implicationsof seasonality (Exercise 4) could assign the materials in Sections 3.1–3.4 for reading, and focus theclass analysis on Section 3.5.
4.3. Extensions
The structure described in this instructional note can easily be extended in multiple directions.First, additional analysis of Mattel can be conducted using a different time period. The 2008–2010

408 R. Schwartz, J. Chandler / J. of Acc. Ed. 30 (2012) 397–415
time period used in this note could be presented as a template for analysis and students could be as-signed a different time period to analyze on their own, individually or in groups.
Second, after discussing seasonality at Mattel in class, students can be instructed to perform asimilar analysis on Hasbro, another key player in the toy industry. Appendix D provides the neces-sary excerpts, data, and graphs for the analysis of seasonality at Hasbro from the first quarter of2008 through the fourth quarter of 2010. In addition to repeating Mattel’s seasonality analysisusing Hasbro’s data, students can be asked to compare and contrast the effects of seasonality on bothfirms.
Finally, while the toy industry experiences strong seasonality with sales concentrated in the secondhalf of the fiscal year, it is not the only industry that experiences the seasonality business risk. Auto-mobile, sports apparel, and travel are three examples of other industries that experience seasonalsales.
Acknowledgements
The authors are grateful to the editor-in-chief, David. E. Stout, and two anonymous reviewers, formany helpful comments and suggestions, and to Susan Curtis for many helpful discussions.
Appendix A. Mattel’s quarterly income statement (Q1 2008 through Q4 2010)
(In millions of $)
2008 2009 2010Q1
Q2 Q3 Q4 Q1 Q2 Q3 Q4 Q1 Q2 Q3 Q4Net sales
919 1112 1946 1940 786 898 1792 1955 880 1019 1833 2125 Cost of SALES 523 617 1,046 1,048 440 492 873 911 448 529 896 1,029 Gross profit 397 495 900 892 346 406 919 1,044 432 490 938 1,096 Advertising andpromotionexpenses
103
117 224 276 84 90 197 239 94 102 202 250Other selling andadministrativeexpenses
330
348 361 384 317 284 385 388 293 318 377 418Operating income(loss)
(37)
31 315 232 (55) 33 337 417 45 69 359 429Interest expense
16 17 20 29 16 18 19 19 14 13 14 24 Interest (income) (9) (7) (6) (3) (4) (3) (2) (1) (3) (3) (2) (1) Other non-operating(income) expense,net
16
6 (6) (19) (2) (6) 14 2 1 (3) – 1Income (loss)before incometaxes
(60)
15 307 226 (65) 24 305 397 33 62 347 405Provision (benefit)for income taxes
(13)
3 69 49 (15) 2 75 69 9 11 63 80Net income (loss)
(47) 12 238 176 (51) 22 230 328 25 52 283 325
R. Schwartz, J. Chandler / J. of Acc. Ed. 30 (2012) 397–415 409
Appendix B. Mattel’s quarterly balance-sheet (Q1 2008 through Q4 2010)
(In millionsof $)
2008
2009 20103/31
6/30 9/30 12/31 3/31 6/30 9/30 12/31 3/31 6/30 9/30 12/31Assets
Cash andequivalents
625 384 447 618 405 423 324 1117 872 545 961 1281Accountsreceivable, net
728
977 1713 874 565 747 1450 749 662 805 1550 1146Inventories
534 676 751 486 488 590 606 356 430 598 741 464 Prepaid expensesand othercurrent assets
315
340 305 410 376 403 324 333 338 330 314 336Total currentassets
2202
2378 3216 2387 1834 2162 2704 2555 2301 2278 3566 3227Property, plantand equipment,net
515
518 525 536 516 522 513 505 492 486 478 485Other noncurrentassets
1725
1737 1783 1752 1756 1793 1772 1721 1710 1712 1715 1706Total assets
4442 4633 5524 4675 4106 4478 4989 4781 4503 4476 5759 5418Liabilities and stockholders’ equity
Short-termborrowings
0 107 528 0 0 294 159 2 0 0 6 0Current portion oflong-term debt
10
150 150 150 150 50 50 50 50 250 250 250Accounts payableand accruedliabilities
813
882 1228 1071 600 703 1116 969 659 763 1138 1049Income taxespayable
3
23 45 39 21 0 11 40 15 15 52 52Total currentliabilities
827
1162 1951 1260 771 1048 1337 1061 723 1028 1446 1350Long-term debt
900 760 760 750 750 710 710 700 700 460 960 950 Other noncurrentliabilities
376 382 392 548 539 550 537 489 484 481 496 489Stockholders’equity
2339
2329 2421 2117 2046 2170 2406 2531 2596 2507 2857 2629Total liabilitiesand equity
4442
4633 5524 4675 4106 4478 4989 4781 4503 4476 5759 5418
Appendix C. Mattel’s quarterly cash flows worksheet
2008 2009 2010
3Months
6Months
9Months
12Months
3Months
6Months
9Months
12Months
3Months
6Months
9Months
12Months
(In millions of $) 3/31 6/30 9/30 12/31 3/31 6/30 9/30 12/31 3/31 6/30 9/30 12/31Cash flows from operating activities (264) (530) (667) 436 (215) (350) (319) 945 (245) (372) (428) 528Cash flows from investing activities 3 (36) (224) (312) 23 9 (3) (34) (35) (97) (89) (147)Cash flows from financing activities (15) 49 437 (407) (21) 146 28 (412) 35 (103) 361 (217)Increase (decrease) in cash and equiv. (276) (517) (454) (283) (213) (195) (294) 499 (245) (572) (156) 164
Mattel provides quarterly cash flow data on a cumulative basis (first three months, first six months, etc.).
Students use the following worksheet to convert the cumulative cash flow to quarterly cash flow for each quarter:
(In millions of $) 2008 2009 2010
Q1 Q2 Q3 Q4 Q1 Q2 Q3 Q4 Q1 Q2 Q3 Q4
Quarterly Cash from OperationsQuarterly Cash from InvestingQuarterly Cash from FinancingQuarterly Change in Cash and Equiv.
410R
.Schwartz,J.Chandler/J.of
Acc.Ed.30
(2012)397–
415

18%20%
32%31%
15%
19%
31%34%
17%18%
33% 32%
0%
5%
10%
15%
20%
25%
30%
35%
40%
Q1 Q2 Q3 Q4 Q1 Q2 Q3 Q4 Q1 Q2 Q3 Q4
20102008 2009
Fig. D1. Hasbro’s quarterly sales as % of annual sales.
R. Schwartz, J. Chandler / J. of Acc. Ed. 30 (2012) 397–415 411
Appendix D. Hasbro excerpts from the 2010 10-K and selected quarterly data (2008–2010)2
D.1. Excerpts from Hasbro 2010 10-K Item 1: Business
‘‘The strategy of retailers has generally been to make a higher percentage of their purchases of toyand game products within or close to the fourth quarter holiday consumer buying season, whichincludes Christmas. We expect that retailers will continue to follow this strategy. Our historicalrevenue pattern is one in which the second half of the year is more significant to our overall busi-ness than the first half. In 2010, the second half of the year accounted for approximately 65% of fullyear revenues with the third and fourth quarters accounting for 33% and 32% of full year revenues,respectively.’’ (p. 4)‘‘Historically, we commit to the majority of our inventory production and advertising and market-ing expenditures for a given year prior to the peak third and fourth quarter retail selling season. Ouraccounts receivable increase during the third and fourth quarter as customers increase their pur-chases to meet expected consumer demand in the holiday season. Due to the concentrated time-frame of this selling period, payments for these accounts receivable are generally not due untillater in the fourth quarter or early in the first quarter of the subsequent year. The timing differencebetween expenses paid and revenues collected sometimes makes it necessary for us to borrowvarying amounts during the year.’’ (p. 5)
D.2. Excerpts from Hasbro 2010 10-K Item 1A: risk factors
‘‘Sales of our family entertainment products at retail are extremely seasonal, with a majority ofretail sales occurring during the period from September through December in anticipation of theholiday season, including Christmas. This seasonality has increased over time, as retailers becomemore efficient in their control of inventory levels through quick response inventory managementtechniques. Customers are timing their orders so that they are being filled by suppliers, such asus, closer to the time of purchase by consumers. For toys, games and other family entertainment
2 Hasbro’s filings with the SEC can be accessed on the EDGAR system at http://www.sec.gov/cgi-bin/browse-edgar?action=get-company&CIK=0000046080&owner=exclude&count=40&hidefilings=0 or via a link that Hasbro provides on its investor relationssite at http://investor.hasbro.com/sec.cfm.
412 R. Schwartz, J. Chandler / J. of Acc. Ed. 30 (2012) 397–415
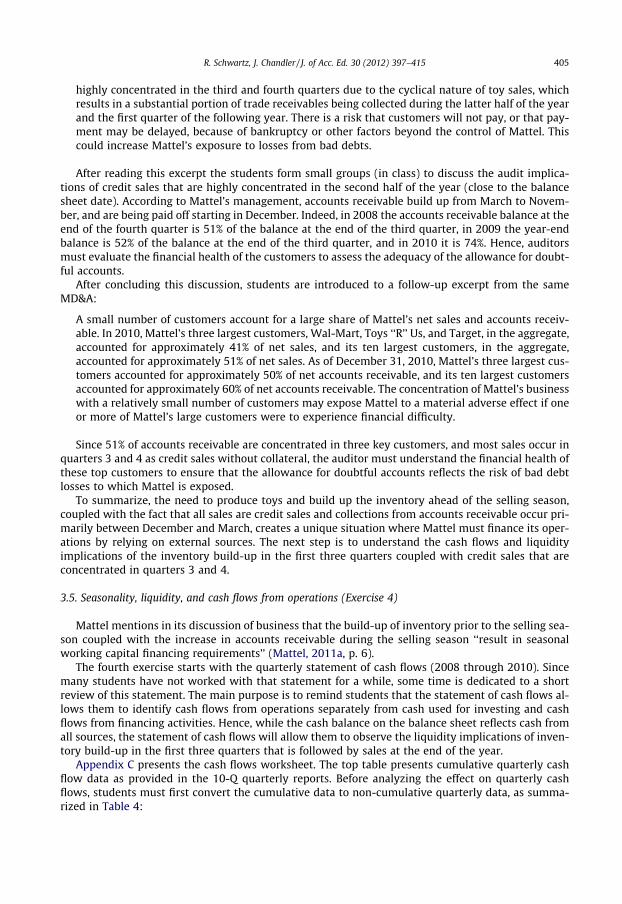
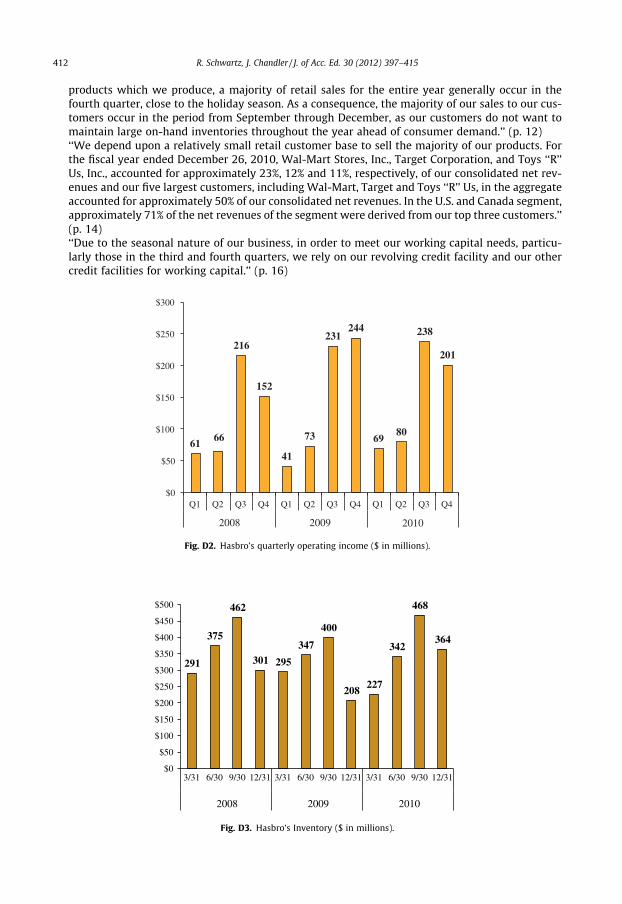
products which we produce, a majority of retail sales for the entire year generally occur in thefourth quarter, close to the holiday season. As a consequence, the majority of our sales to our cus-tomers occur in the period from September through December, as our customers do not want tomaintain large on-hand inventories throughout the year ahead of consumer demand.’’ (p. 12)‘‘We depend upon a relatively small retail customer base to sell the majority of our products. Forthe fiscal year ended December 26, 2010, Wal-Mart Stores, Inc., Target Corporation, and Toys ‘‘R’’Us, Inc., accounted for approximately 23%, 12% and 11%, respectively, of our consolidated net rev-enues and our five largest customers, including Wal-Mart, Target and Toys ‘‘R’’ Us, in the aggregateaccounted for approximately 50% of our consolidated net revenues. In the U.S. and Canada segment,approximately 71% of the net revenues of the segment were derived from our top three customers.’’(p. 14)‘‘Due to the seasonal nature of our business, in order to meet our working capital needs, particu-larly those in the third and fourth quarters, we rely on our revolving credit facility and our othercredit facilities for working capital.’’ (p. 16)
6166
216
152
41
73
231244
6980
238
201
$0
$50
$100
$150
$200
$250
$300
Q1 Q2 Q3 Q4 Q1 Q2 Q3 Q4 Q1 Q2 Q3 Q4
20102008 2009
Fig. D2. Hasbro’s quarterly operating income ($ in millions).
291
375
462
301 295
347
400
208227
342
468
364
$0
$50
$100
$150
$200
$250
$300
$350
$400
$450
$500
3/31 6/30 9/30 12/31 3/31 6/30 9/30 12/31 3/31 6/30 9/30 12/31
2008 2009 2010
Fig. D3. Hasbro’s Inventory ($ in millions).

R. Schwartz, J. Chandler / J. of Acc. Ed. 30 (2012) 397–415 413
D.3. Excerpts from Hasbro 2010 10-K Item 7: Management’s discussion and analysis
‘‘The Company’s business is highly seasonal with a significant amount of revenues occurring in thesecond half of the year. In 2010 and 2009, the second half of the year accounted for 65% of the Com-pany’s net revenues and, in 2008, the second half of the year accounted for 63% of the Company’snet revenues.’’ (p. 23)‘‘The Company commits to inventory production, advertising and marketing expenditures prior tothe peak third and fourth quarter retail selling season. Accounts receivable increase during thethird and fourth quarter as customers increase their purchases to meet expected consumer demandin the holiday season. Due to the concentrated timeframe of this selling period, payments for theseaccounts receivable are generally not due until the fourth quarter or early in the first quarter of the
389
563
947
612
365
653
1,1161,039
526
664
1,211
961
$0
$200
$400
$600
$800
$1,000
$1,200
$1,400
3/31 6/30 9/30 12/31 3/31 6/30 9/30 12/31 3/31 6/30 9/30 12/31
2008 2009 2010
Fig. D4. Hasbro’s accounts Receivable ($ in millions).
154
-131
2
569
-23
-157
-31
476
265
-92
-167
362
($300)
($200)
($100)
$0
$100
$200
$300
$400
$500
$600
$700
Q1 Q2 Q3 Q4 Q1 Q2 Q3 Q4 Q1 Q2 Q3 Q4
2008 2009 2010
Fig. D5. Hasbro’s quarterly cash flows from operations ($ in millions).

Table D1Selected quarterly data—Hasbro 2008-2010 (in millions of $).
Q1 Q2 Q3 Q4
Revenues2008 704.2 784.3 1302.0 1231.02009 621.3 792.2 1279.2 1375.22010 672.4 737.8 1313.30 1278.7
Cost of goods sold (COGS)2008 271.2 308.2 573.8 539.52009 244.7 319.5 550.0 562.12010 306.5 350.4 672.3 631.6
Operating income2008 61.3 65.5 215.9 151.62009 41.2 73.1 230.7 243.62010 69.3 79.7 237.8 201.0
Accounts receivable2008 388.7 562.5 946.9 611.82009 365.0 652.6 1116.0 1038.82010 526.0 663.5 1210.5 961.3
Inventory2008 291.2 375.0 461.6 300.52009 295.2 346.8 399.9 207.92010 226.8 342.1 468.0 364.2
Cash flows from operations2008 153.9 �131.1 1.5 568.92009 �22.7 �157.2 �30.6 476.12010 265.1 �92.1 �167.3 362.2
414 R. Schwartz, J. Chandler / J. of Acc. Ed. 30 (2012) 397–415
subsequent year. This timing difference between expenditures and cash collections on accountsreceivable makes it necessary for the Company to borrow higher amounts during the latter partof the year.’’ (p. 33)
See Figs. D1–D5 and Table D1.
References
American Accounting Association (AAA) (1986). Committee on the future structure, content and scope of accounting education(the Bedford Committee). Future accounting education: Preparing for the expanding profession. Issues in AccountingEducation, 1(Spring), 168–195.
Accounting Education Change Commission (AECC), 1990. Objectives of education for accountants: Position statement numberone. Issues in Accounting Education, 5(Fall), 307–312.
Albrecht, S., & Sack, R. (2000). Accounting education: charting the course through a perilous future. Accounting education series (Vol.16). Sarasota, FL: American Accounting Association (AAA).
Arens, A., Elder, R., & Beasley, M. (2012). Auditing and assurance services (14th ed.). Upper Saddle River, NJ: Pearson/Prentice-Hall.
Arthur Andersen & Co., Arthur Young, Coopers & Lybrand, Deloitte Haskins & Sells, Ernst & Whinney, Peat Marwick Main & Co.,Price Waterhouse, Touche Ross (1989). Perspectives on education: Capabilities for success in the accounting profession (The Big8 White Paper). New York, NY.
Ballou, B., Cashell, J., & Heitger, D. (2008). Alternatives for addressing major challenges in teaching introductory auditingcourses. Journal of Accounting Education, 26(4), 231–244.
Bamber, E. M., & Bamber, L. (2006). Using 10-K reports brings management accounting to life. Issues in Accounting Education,21(3), 267–290.
Bell, T., Marrs, F., Solomon, I., & Thomas, H. (1997). Auditing organizations through a strategic-systems lens. New York, NY: KPMG,LLP.
Hooks, K. (2011). Auditing and assurance services: Understanding the integrated audit (1st ed.). Hoboken, NJ: Wiley.Knechel, W., Salterio, S., & Ballou, B. (2007). Auditing: Assurance and risk (3rd ed.). Cincinnati, OH: South-Western.Louwers, T., Ramsay, R., Sinason, D., Strawser, J., & Thibodeau, J. (2011). Auditing & assurance services (4th ed.). New York, NY:
McGraw-Hill.Mattel (2009). Mattel analysts meeting (June 17).Mattel (2011a). Form 10-K (annual report for the year ending 12/31/2010), filed 2/24/2011. <http://www.sec.gov/Archives/
edgar/data/63276/000119312511045072/0001193125-11-045072-index.htm>.

R. Schwartz, J. Chandler / J. of Acc. Ed. 30 (2012) 397–415 415
Mattel (2011b). Form 8-K (current report), filed 3/10/2011. <http://www.sec.gov/Archives/edgar/data/63276/000119312511063964/dex101.htm>.
Messier, W., Glover, S., & Prawitt, D. (2010). Auditing and assurance services (7th ed.). New York, NY: McGraw-Hill.PricewaterhouseCoopers (PWC) (2003). Educating for the public trust: The pricewaterhousecoopers position on accounting
education, New York, NY.Rittenberg, L., Johnstone, K., & Gramling, A. (2012). Auditing: A business risk approach. Cincinnati, OH: South-Western.Stuart, I. (2012). Auditing & assurance services: An applied approach (1st ed.). New York, NY: McGraw-Hill.Whittington, R., & Pany, K. (2012). Principles of auditing & assurance services (18th ed.). New York, NY: McGraw-Hill.