Embed Size (px)
Citation preview

LBNL-1006392
An Insurance Perspective on US Electric Grid Disruption Costs
Authors
Evan Mills1 and Richard Jones2
1 Lawrence Berkeley National Laboratory 2 Hartford Steam Boiler Insurance and Inspection Company
Energy Analysis and Environmental Impacts Division Lawrence Berkeley National Laboratory
October 2016
Post-print of an article accepted for publication in The Geneva Papers on Risk and Insurance ndash Issues and Practice 41(4) 555-586 DOI 101057gpp20169
This work was supported by the US Department of Energyrsquos Office of Electricity Delivery and Energy Reliability under Lawrence Berkeley National Laboratory Contract No DE-AC02-05CH11231
An Insurance Perspective on US Electric Grid Disruption Costs
Evan Mills Lawrence Berkeley National Laboratory
Richard Jones
Hartford Steam Boiler Insurance and Inspection Company
Post-print of an article accepted for publication in The Geneva Papers on Risk and Insurance ndash Issues and Practice 41(4) 555-586
DOI 101057gpp20169
October 2016
DISCLAIMER
This document was prepared as an account of work sponsored by the United States Government While this document is believed to contain correct information neither the United States Government nor any agency thereof nor the Regents of the University of California nor any of their employees makes any warranty express or implied or assumes any legal responsibility for the accuracy completeness or usefulness of any information apparatus product or process disclosed or represents that its use would not infringe privately owned rights Reference herein to any specific commercial product process or service by its trade name trademark manufacturer or otherwise does not necessarily constitute or imply its endorsement recommendation or favoring by the United States Government or any agency thereof or the Regents of the University of California The views and opinions of authors expressed herein do not necessarily state or reflect those of the United States Government or any agency thereof or the Regents of the University of California
ABSTRACT Large yet infrequent disruptions of electrical power can impact tens of millions of people in a single event triggering significant economic damages portions of which are insured Small and frequent events are also significant in the aggregate This article explores the role that insurance claims data can play in better defining the broader economic impacts of grid disruptions in the United States context We developed four case studies using previously unpublished data for specific actual grid disruptions The cases include the 1977 New York City blackout the 2003 Northeast Blackout multi-year national annual lightning-related electrical damage and multi-year national line-disturbance events Insured losses represent between 3 and 64 of total loss costs across the case studies The household sector emerges as a larger locus of costs than indicated in previous studies and short-lived events emerge as important sources of loss costs
1
RISK LANDSCAPE Electricity is a central pillar of energy systems and the economies of nations and all segments of society depend on it Reliance on continuously available electricity is rising given the pervasive use of technologies for which electricity is the only suitable energy carrier such as motors lighting and information technologies as well as substitution for fuels in other contexts Manufacturing and its supply chains communications infrastructure and financial markets are also increasingly dependent on reliable power Electricity service disruptions have important direct links to insured risks such as property damages and business interruptions as well as indirect links to events such as civil unrest and vandalism during blackouts The US electric grid is complex with over 5800 power plants delivering electricity to 144 million customers over 450000 miles of high-voltage transmission lines This network is organized into 8 regional networks before entering the lower voltage distribution network (Executive Office of the President 2013) About 70 of the transmission lines and associated transformers are over 25 years old and the average age of power plants is over 30 years (Hines et al 2009) Grid disruptions of various types severity and scales are common Major blackouts garner the most attention as they abruptly impact a large number of customers and are easiest to quantify (Table 1) Between 1984 and 2006 blackouts in the US affected 141 million customers with an aggregate duration of 12000 days (Hines et al 2009) Table 1 Ten most severe blackouts by duration and population affected sorted by number of people affected (Bruch et al 2011)
Note post-dating the source publication for this table the September 8 2011 US Southwest Blackout rendered 27 million customers (including some in Mexico) without power for 11 minutes The cause was a combination of the loss of one transmission line together with of
2
operational deficiencies and extreme heat and associated power demands (FERC and NAERC 2012)
Grid disruptions range from subtle power fluctuations to full outages The costs are broadly allocated between the impacted energy user the energy provider public entities assisting in relief or recovery and insurance companies Estimates for the US place the cost of such events at $79 billion per year (LaCommare and Eto 2006) with other estimates ranging from $28 to $209 billion per year (Executive Office of the President 2013) Some studies are cursory simply applying a stipulated ldquovaluerdquo per unit of electricity to each un-served unit over the course of a given outage Few prior studies have looked in depth at the insurance industryrsquos perspective on the value of electricity reliability (Lecomte et al 1998 Eto et al 2001 and Lineweber and McNulty 2001 RMS 2004) The causes of events involving power outages and line disturbances are highly varied and include natural disasters extreme weather conditions (heatcolddust storm) human error and mischievous acts animals equipment or software failure under-served spikes in power demand and forced outages at power plants or within the transmission and distribution network Grid disruptions can result from a confluence of multiple factors as seen in the great European heat wave of 2003 where a period of prolonged extreme temperatures resulted in electric demand spikes just as curtailed hydroelectric power output due to drought and overheated rivers forced the temporary shutdown of fossil and nuclear power plants due to the inadequate availability of cooling water (Bruch et al 2011) While triggering events can impact the system at many points ranging from power plants to the point of end-use all manifest as the loss of services and some degree of associated economic impact On the loss side second-order impacts also occur such as inability to pump fuel needed for backup generators or to pump rising water from flooded areas Many factors can be expected to drive insured losses from grid disruptions higher in the future including increasing dependency on electricity changes in the reliability of the grid (USDOE 2013 Larsen et al 2014) and changing patterns of underlying hazards (Geneva Association 2009 Executive Office of the President 2013 van Vliet et al 2016) Weather extremes are the primary cause of power outages (Campbell 2012) and on average impact more customers per event than those attributed to other causes (USGCRP 2009) Insurers have attributed erosion of reliability in part to the curtailment of infrastructure maintenance and modernization under power sector privatization and liberalization (Bruch et al 2011) This article characterizes the nature of insurance industry exposure to losses resulting from electric grid disruptions with a focus on the United States Loss statistics are analyzed for four case studies Given the lack of primary top-down data on economy-wide economic losses including but not limited to those that are insured we illustrate the bottom-up process of extrapolating what has been carefully measured by insurers and its potential applicability for estimating broader impacts For a variety of reasons insured losses represent only a portion of total
3
economic losses These factors include incomplete penetration of insurance deductibles limits and exclusions among those who are insured Insured cost data thus help bound the lower end of total costs but also illuminate wheremdashboth geographically and by type of customermdashthe costs of these events manifest The risk-management dimension of insurance practices further illuminates how such costs can be controlled Some insurers envision a future where more comprehensive insurance coverage for losses resulting from grid disruptions will be available (Bruch et al 2011) but for this to be viable the losses must be better understood and managed INSURANCE PERSPECTIVE The insurance industry assumes risk across the entire gridmdashfrom power plant fuel supply to the point of end use Insurers take an international view as the largest companies are multinational and because vulnerable supply chains and communications infrastructure routinely cross international boundaries (Bruch et al 2011) Insurers engage with grid-disruption events at two levels The first involves risk management eg via supporting pre-event loss prevention and post-event recovery and business continuity and ideally post-loss reconstruction to a higher level of resilience The second involves risk-spreading through the collection of premiums and the payment of claims Figure 1 provides a qualitative indication of how insurance responds to various grid-disruption scenarios by peril causing the loss and generic category of loss incurred Table 2 in contrast maps specific types of insurance to types of covered damages
4
Figure 1 Applicability of insurance to grid-disruption scenarios Insurers and their trade associations have long noted their concerns about electricity reliability for example in a study of the Northeast Ice Storm of 1998 which toppled 1000 transmission towers and 30000 wooden utility poles (Lecomte et al 1998) Following that event five million people were left without power resulting in 840000 insurance claims valued at $12 billion About one million homes were impacted in Canada (with 100000 people going to shelters) The wide diversity of losses exemplified the common problem of isolating those pertaining directly to grid disruptions from those attributed to other sources of damage during such events Insurers are devoting increased attention to the reliability of the electric system Most recently Hurricane Sandy refocused many US insurers on the issue (Zola and Bourne 2012 Claverol 2013) The triggers (ldquoperilsrdquo) initiating grid-disruptions are numerous including natural hazards such as wind ice lightning wildfire drought or dust storm as well as a host of events ranging from machinery breakdown to human error to cyber-terrorism (Healey 2014) Insurers are also concerned with the effect of space weather on electrical systems (Slavin 2010 USDOE 2013) The resulting losses can be direct (physical damage) or indirect (eg disruptions to business operations or the consequences of social unrest) As described in Table 2 many insurance lines can be involved In addition to standard property damages liability claims may also be made (Blume and Holmer 2013) among which are environmental liability claims stemming from disruptions in wastewater treatment or pollution controls dependent on electricity for pumping communications and control systems (NIST
5
2015) A wide variety of adverse healthcare outcomes have also been associated with power outages (Klinger et al 2014 McElroy 2015) invoking the relevance to lifehealth insurance lines Three broad categories of electric-reliability events that trigger losses are of interest to insurers The first are rare large outages that occur on a wide scale and are often long in duration The second are frequent outages at very localsmall scales that result in large accumulations of claims The third are localized line disturbances that disrupt service or affect power quality and may not involve a complete outage Power outages are distinctive events for insurers insofar as they can cover enormous geographic areas potentially larger than any other loss event They also affect most customer classes and a multiplicity of insurance coverages Insurers perceive immediate consequences such as equipment damage as well as longer-term complications such as macroeconomic impacts A major blackout was identified as one of the ldquoTop-10 Risksrdquo by a leading catastrophe modeler serving the insurance industry (Table 3) The potential claims from such an event were estimated at $27 billion in 2004 (approximately $33 billion in 2014 dollars) A more recent study was conducted using a blackout model developed expressly for insurers The simulation assumed a wide-area blackout caused by sequential ice storms on the US East Coast resulting in 50 million people and 3 million businesses impacted (with 100000 never reopening) with $30 to $55 billion in total direct losses of which $95 to $155 billion were insured (Verisk Climate and HSB 2014)
6
Table 2 Map of types of losses linked to electricity reliability and responding lines of insurance Type of Insurance
Specific Insurance lines
Nature of covered damages (assuming necessary contract coverages)
Property Homeowners Commercial Industrial (including Boiler amp Machinery)
bull Direct equipment damage data loss1 perishables (food flowers pharmaceuticals)
bull Indirect damage frozen pipes falsely deployed fire sprinklers inoperable pumps fire vandalism damages caused by backup generators
Business interruption (BI) Commercial Industrial (typically requiring special ldquoservice interruptionrdquo policy coverage) (including Boiler amp Machinery)
bull Net revenue losses by energy user bull Supply chain disruptions bull Lost sales by utilities
BI Extra expenses Homeowners Commercial Industrial
bull Costs of temporary accommodation relocation backup power
BI Evacuation orders Civil Authority bull Complete disruption of business activity due to government order such as evacuation
BI Inability for employees to reach workplace
IngressEgress bull Disruption of access to workplace irrespective of damage does not require government action
bull Inability to refuel generators BI Disruption in trade and supply chain
Supply chain Trade disruption
bull Remote (or even overseas) disruption in production or transportation of critical products or materials
Maritime Marine bull Cargo loadingunloading disruptions supply-chain disruptions
Airlines Aviation bull Delay rerouting flight cancellation property damage
Injury mortality LifeHealth bull Injuries or death arising from the disruption and its consequences (equipment failure heat stress roadway lighting medical equipment disrupted hospital operations etc)
Liability and Legal defense costs
General liability Environmental liability Directors and Officers liability
bull Utilities waste treatment etc bull Triggering pollution releases or
impeding cleanup bull Loss of ventilation in buildings bull One party may litigate against another
to recover damages bull Insurance claims may be denied
resulting in litigation costs incurred by insurers
These policies typically require damage to covered equipment not just disruption of operation
1 Insureds themselves have claimed such losses ie Great Northern Pirie and Glens Falls case (Johnson 2001)
7
Table 3 Loss costs for hypothetical US Events costs in $ billion (RMS 2004)
Property damages are an important insurable consequence of grid disruptions and are relatively easy to define and verify Business interruptions stand as another important insured risk and are much more complex (Zola and Bourne 2012) In an annual survey by global insurer Allianz 500 corporate risk managers from around the world rank business interruption risks and natural catastrophes (two often-related events) at the top of their list of concerns (Kenealy 2015) According to Rodentis (1999) US businesses report that grid disruptions are the number-one cause of business interruptions A 2005 survey found that 72 of US companies had experienced significant business interruptions because of power outage and 34 because of lightning storms (Zinkewicz 2005) In evidence of the potential magnitude of business interruption claims thirty percent of the $18 billion in insured losses associated with Hurricane Sandy for example were attributed to business interruptions (Bartley and Rhode 2013) Small businesses are most at risk and can be rendered insolvent by significant uninsured losses A survey of 500 small businesses by the National Association of Insurance Commissioners (NAIC 2007) found that business interruption insurance coverage varies by business size 33 of firms with 1-19 employees were insured versus 58 of companies with 20-99 employees For business interruption insurance contracts deductibles are often expressed in the units of time rather than dollars or a percentage of loss There is typically a waiting period (sometimes known as a ldquotime-deductiblerdquo) of 12 to 72 hours before claims begin to accumulate and the cutoff has been increasing (Bloomberg News 2003) Given that most of these events are relatively brief and that most economic damages are estimated to occur during the first few minutes of an event (Sullivan et al 2015) only a small fraction of the related losses would be insured In order to be deemed insurable a risk must meet several conceptual core criteria These include randomness of the triggering event fortuitousness ability to assess statistical likelihood of frequency and cost a sufficient number of customers willing to participate in the risk pool by purchasing insurance and affordability of the associated products and services at risk-based premiums The risk of fraud (moral hazard) must be minimized In addition to these fundamental considerations is whether or not a given event falls within the terms of the given insurance contract
8
While some emerging risks to the electric grid notably cyber-security and space weather (USDOE 2013) do not clearly meet the standards for insurability insurance products nonetheless are being developed in lieu of a traditional actuarial underpinning If insurability criteria are met or waived then the practical insurability of a given event under a given contract is a function of the combined effects of (a) nature of the damage (b) whether the damage is caused by a named peril and (c) whether any exclusions apply Most standard insurance contracts (homeowner as well as commercial lines) require that the damage causing the disruption occur on the insuredrsquos premises yet only 20 to 25 of business interruption losses occur for this reason (Bruch et al 2011) Recent tightening of the standard forms by the Insurance Services Office2 even exclude failure of utility-owned property located on the insuredrsquos premises and other exclusionary language can limit damages to power-delivery equipment located inside the building (Massman 2012) Optional policy extensions such as ldquoContingent Business Interruptionrdquo ldquoSpoilagerdquo or ldquoUtility Services Disruptionrdquo can expand coverage to events occurring within a specified distance from the insured property Insurance products are emerging that cover disruptions in distant supply chains with waiting periods of 30 days or more (Marsh 2012) Even here if the disrupted utility is not the insuredrsquos direct provider even utility services disruption coverage may be denied Spoilage coverage on the other hand typically applies irrespective of the reason for power disruption Exclusions may apply (eg insufficient fuel at the generator or a power outage triggered by government order) Human error or deliberate decisions (eg rolling blackouts) are important potential policy exclusions in the case of power outages Given the complexity of insurance contract language and the costs involved claims often end up being litigated resulting in additional costs (Johnson and Churan 2003 Claverol 2013 Standler 2011ab Fickenscher 2013) (Greenwald 2014) Some legal decisions have covered losses where power line disruption is far from location three examples of food loss in grocery stores given in Lipshultz v General Insurance Company of America but two other decisions also related to grocery stores decided in favor of insurer (Johnson 2001) Many insurers initially argued that there was no physical damage as called for in the policy language and that claims were unjustified but the courts decided in favor of the policyholders and claims were paid (Widin 2009) In this case the unsuccessful argument made was that the underlying cause (human error) was excluded under the standard insurance contracts and could not be construed as ldquodamagerdquo Assuming the damaged property is on the insured premises the question then shifts 2 The Insurance Services Office (httpwwwveriskcomisohtml) is an insurance data-collection service specializing in loss data market data and related topics such as building code effectiveness Their focus is on property-casualty insurance as distinct from life-health
9
to whether or not the underlying cause is an ldquoinsured perilrdquo or otherwise excluded Flood is a particularly important peril in that regard because it is almost universally excluded by private insurance policies3 Electricity producers and distributors are eligible for various forms of business interruption coverage as well Insurers manage their own risk of frequent claims by stipulating high dollar deductibles for a given policy period Utilities may also self-insure in total or up to a high level of ldquoretained riskrdquo above which they spread risk by purchasing reinsurance Specialized optional business-interruption coverages are available to cover lost revenues arising from failures to produce or deliver power not otherwise traceable to a physical damage In this case insured perils are defined as ldquodata corruptionrdquo or ldquomalfunction of datardquo due to human error hacker attacks etc (Bruch et al 2011) INSURED COSTS OF POWER OUTAGES AND LINE DISTURBANCES Understanding the magnitude of losses related to electricity reliability is important to insurers seeking to improve underwriting risk management and loss prevention Beyond that insurance data can provide substantial value in understanding broader economy-wide losses as other data-collection efforts are not always as rigorous as insurance claims processing This approach has been applied successfully before in the study of natural disaster losses (Smith and Katz 2013) These authors adopt a similar approach as done here beginning with insurance claims and making extrapolations where needed (eg for uninsured population segments) The technique is easiest to apply when total loss costs are sought as aggregate insurance claims data are widely available Where losses by underlying cause are sought as in the case of power disruptions more specialized analysis must be conducted and applicable insurance data are more difficult to obtain Highly fragmented data-collection practices impede our understanding of losses from natural and manmade events including those related to electricity reliability (Pendleton et al 2013) Statistics are lacking on the numbers of customers possessing insurance policies that respond to electric grid disturbances as well as aggregate claims4 Insurance loss data are often collected and reported in highly aggregate form making it difficult to isolate the costs of each underlying cause of loss or the customer subgroups affected We found four exceptional cases in which data had been collected at a level with sufficient resolution to isolate losses related to electricity reliability The first three are based on industry-wide claims tracking and the fourth is closed-claims analysis conducted by the largest individual insurer of the risks in question The cases demonstrate a progressively complete ability to
3 The National Flood Insurance Program provides coverage for power outages (including food in freezers and damages due to failed pumps) if the damage causing the outage occurs on the insured property (NFIP 2014) 4 Findings of research by Librarians at the Insurance Library Association of Boston Massachusetts and Davis Library at St Johnrsquos University Manhattan Campus New York
10
extrapolate insured losses from individual events to broader economic impacts at the national scale Analysis Framework Beginning with insurance loss data we explore the ability to scale insured values up to total economic losses (insured plus uninsured) as described in Figure 2 We approximate economy-wide losses by applying the per-customer insured losses to all insured households and enterprises affected by the event To provide consistent reporting across the cases and to observe trends over time where multiyear data are available the final values thus obtained are normalized for inflation to year-2014 US dollars
Figure 2 Framework for characterizing the extensibility of insured losses from grid disturbances illustrates the components of total cost with emphasis on the elements related to the presence or absence of insurance The horizontal axis focuses on cost categories on a per-risk (per household or business) basis and the vertical access represents scale (eg number of households or businesses) The product of these two factors represents the total cost for any particular pair of values
11
Proceeding along the horizontal axis of Figure 2 the most elemental class of data typically encountered is the insured loss from a particular event A more inclusive cost estimate can then be progressively built up if the insuredrsquos deductible is known These values can be applied by proxy to uninsured losses together with any remaining costs that are uninsurable Proceeding along the vertical axis the most narrowly defined case would include costs for only some events and some insureds (eg those served by a particular insurer) A more inclusive estimate can then be progressively scaled up if the extent of analogous populations exposed to the events which are insurable but not insured is known followed by the total number of insureds experiencing losses from other analogous events and lastly any remaining groups andor costs applicable nationally (eg from uninsurable populations or perils) For the hypothetical example depicted in Figure 2 insured data are available from one insurer for one major grid-disruption event corresponding to the shaded area labeled ldquoEvent datardquo This core loss corresponds to the area of rectangle [A 1] Were additional data available for all insurers together with estimates of deductibles rectangle [B 2] would apply If to this were added an extrapolation of costs to the insurable population that did not carry the applicable insurance summed over all similar events each year the extrapolated loss (red outline) would correspond to rectangle [D 4] A fully inclusive estimate would provide costs for the rectangle corresponding to rectangle [E 5] ie all economic costs (insurable and uninsurable) for all customers affected by all events of this type in the country over the course of an average year We applied this framework to the four case study events described in this article They vary in terms of which sectors are included (homeowners andor businesses) Individual Large Power Outages While power outages result in economic losses claims on essentially a daily basis only two events (the 1977 New York City Blackout and the 2003 Northeast Blackout) have been recorded and quantified by the US insurance industryrsquos central loss tracking system (The Property Claims Service operated by the Insurance Services Office ISO) These are not coincidentally the two largest blackouts in US history by numbers of people impacted This lack of insured-loss data attributed to power disruptions arises for three key reasons Firstly most outages accompany other events (storms earthquakes etc) that result in losses unrelated to the outage itself Secondly data are aggregated and reported by ISOPCS only by major customer category (in this case Homeowners and Commercial) and state resulting in any differentiated costs (eg food spoilage) being lost Thirdly ISO does not collect losses on what it regards as ldquosmallrdquo events
12
ie those not affecting ldquoa significant number of policyholders and insurersrdquo and resulting in at least $25 million in insured losses to property5 The 1977 New York City Blackout Triggered by lightning strikes the 1977 New York City Blackout event is the earliest blackout for which we have identified insurance claims data (Table 4) This event illustrates several important considerations in viewing insurance data in the context of total economic costs which in this case totaled $1348 million (2014 dollars) Public and private insurance mechanisms each participated in shouldering the costs amounting to $131 million or 10 of the $135 billion total economic impact (Figure 3) Second-order impacts (in this case fires and looting) resulted in substantial additional insured losses Formal or informal limits on coverages attenuated the level of paid claims In the period leading up to this event New York residents found it difficult to obtain insurance for burglary through the private market The Federal Government offered coverages but losses were capped at $1000 per claim (New York Times 2007) Table 4 Public and private insurance claims from 1977 New York City Blackout (SCI 1978 PCS 1977)
The riots were denoted by the insurance industryrsquos Property Claim Services (PCS) as Catastrophe Serial No 99 and the blackout denoted as Serial No 11 As of February 1978 only 40-50 of these claims had been paid
5 httpwwwveriskcomveriskproperty-claim-servicespcs-catastrophe-serial-numbers-verisk-insurance-solutionshtml The cut-off point was $5 million prior to 1997 and $1 million prior to 1982
13
Figure 3 Extensibility of insured losses from 1977 New York City Blackout personal and commercial lines The total loss is not shown here because it was developed by others and not built up from the insurance loss estimates 2014 price levels
The 2003 Northeast Blackout The 2003 Northeast Blackout = left almost 20 of the US population in darkness for periods ranging from hours to days Within 8 minutes the outage took the equivalent of 62 billion watts of power offline (more than 500 generating units at 265 sites including 10 nuclear plants) in the process impacting 50 million people across 8 states and large parts of Ontario Canada (US-Canada Power System Outage Task Force 2004) Power was largely restored in the US within 30 hours (an important consideration in light of waiting-period deductibles) but took significantly longer in parts of Canada6 Total economic cost estimates range from $4 to $10 billion (US-Canada Power System Outage Task Force 2004) with $6 billion ($77B in 2014 dollars) quoted by the US Department of Energy as the central estimate One source states that the costs could have been twice as high had it not occurred late in the working week (Anderson and Geckil 2003) Per Burch et al (2011) examples of specific impacts include bull Daimler Chrysler production disruption at 14 of 31 plants eg 10000 vehicles
stranded in the painting assembly line were scrapped Direct costs not reported 6 Information on the duration of the outage particularly by and within states is remarkably scarce
14
bull Ford Motor Company solidified molten metal in furnace created a one-week
disruption Direct costs not reported bull Marathon Oil Corporation Emergency shutdown procedures triggered boiler
explosion followed by evacuation of hundreds of residents Direct costs not reported
bull Nova Chemicals Corp Business disruptions reduced earnings by $10 million at 7
facilities bull Duane Reade Inc Drugstore chain closed all of its 237 stores losing $33M in
sales bull Airports Closed in 13 locations with 1000 flights cancelled Direct costs not
reported bull New York City $250M in frozen and perishable food destroyed among other
losses PCS provided previously unpublished data for our study breaking the costs out by broad category of insurance (Personal and Commercial customer types) and by state PCS reported that the event resulted in $180 million ($2003) in insured losses with 63200 claims (of which 13200 were from commercial customers and 50000 from household customers) Note that 22 of small businesses are based in the ownerrsquos home (NAIC 2007) just under half of which depend on their homeowners insurance to cover business assets Business-related losses incurred by this latter group would rarely if ever be insured As discussed below the PCS data do not include line-disturbance claims incurred by boiler-and-machinery insurers The aggregates as well as per-customer impacts varied significantly by both customer class and geography The reasons for variations in losses per claim are not known or examined by PCS These could well arise from differences in policy types and terms (deductibles and exclusions) in size and business activity of the insured and in duration of the blackout (influencing size of waiting-period deductible) When adjusted for inflation to 2014 price levels aggregate insured losses for the event are $230 million of which $157 million fell in the household sector and $73 million in the commercial sector (68 and 32 of losses respectively) Normalized average insured losses were $3149 per customer in the household sector and $5527 per customer in the commercial sector (Figure 4)
15
Figure 4 Insured losses from the 2003 Northeast blackout were dominated by household claims centered primarily in New York but spanning eight states Per-customer insured losses from the 2003 Northeast blackout varied significantly by state and were highest among commercial customers Includes copyrighted material of Insurance Services Office Inc used with its permission Values are inflation-adjusted to 2014 price levels by the authors
A somewhat more inclusive cost estimate can be made when deductibles and insurance penetration are considered (Figure 5) For households carrying insurance we assume a fixed deductible of $750 (midway between the standard $500 to $1000 values) Consideration of the 74 weighted-average owner and renter insurance penetration7 implies about 17000 additional uninsured households where impacted with an aggregate insurable loss of $55M plus associated equivalent deductible costs of $13M ($2014) Total personal lines losses (insured and insurable but uninsured) totaled $263M For commercial enterprises these extrapolations are far more difficult to estimate Property damage food spoilage and business interruptions each have distinct deductibles and exclusions which are generally not documented and publicly reported at the aggregate level The majority of business-interruption losses likely occurred during the waiting period We thus stipulate that only 25 of overall business losses for the insured cohort tracked by ISO were claimable which corresponds to a total cost to businesses with insurance cover that responded to the event of $292 million
7 According to III 95 of homeowners had insurance versus 29 for renters (httpwwwiiiorgfact-statisticrenters-insurance) As of 2003 32 of households were renters (US Census) The net effect is 74 of all households (owned and rented) being insured
16
The total quantifiable cost was $555 million (excluding uninsured commercial enterprises the number of which cannot be estimated) (Figure 6) representing approximately 7 of the aforementioned total economic losses This low ratio is loosely consistent with the fact that the 50000 insured homeowners filing claimsmdashand the additional proportional uninsured cohortmdash represent only a small fraction of the 50 million people reported to have experienced this multi-state power outage Many more than 13200 businesses were also likely impacted (there are 18 million non-farm businesses in this region) However directly extrapolating per-customer insured losses to the entire impacted population results on a value ($84 billion) an order of magnitude larger than the ldquotop-downrdquo published estimates This suggests that the significant geographical and economic diversity of homes and businesses in this multi-state region renders the up-scaling method inappropriate in cases where information on specific impacted customer types and insurance penetration is highly limited
Figure 5 Values shown here include only insurance policyholders submitting insurance claims Includes copyrighted material of Insurance Services Office Inc used with its permission Values are inflation-adjusted to 2014 price levels by the authors
17
Figure 6 Extensibility of loss data from the 2003 Northeast Blackout personal and commercial lines Includes estimates of deductibles and insurable but uninsured homeowners and renters Losses by uninsured commercial customers are not estimated 2014 price levels
We have insufficient information to scale up the insured losses to a full national cost estimate for the event because numbers of homes and businesses impacted by the event could not be found in the literature A more detailed characterization of insurance penetration and terms such as deductibles for each type of relevant insurance coverage would also be required The outage duration for each state would be essential in estimating business-interruption costs incurred during waiting periods In order to apply these per-event costs to other outage events data by type of peril would need to be utilized in order to estimate the portion of losses that were uninsured (eg from flooding) due to exclusions Accumulations of Small-scale Power Outages Lightning Few data are available which attribute insured losses from power outages to specific perils One exception is lightning The Insurance Information Institute and State Farm (III 2015a) tabulated 22 million claims totaling $96 billion in insured US homeownersrsquo losses due to lightning strikes between 2004 and 2014 The number of claims paid over this period ranged from 100000 to 278000 per year (only about 2000 per year involved fires their share of total losses is not reported) The insured cost per claim roughly doubled to approximately $6000 over this
18
period with a national aggregate average of $1 billion per year (64 of total economic losses) The average annual outcome based on multi-year data in Figure 7 including deductibles and adjustments for uninsured owned and rented homes brings the total to $16 billion per year (Figure 8) Claims peak in summer months and are most common in the Gulf states (Table 5) This estimation can be more specifically represented as follows
bull Average insured loss $1022 million ie 197635 paid claims per year x $5173claim
bull Deductible $148 million ie $750claim (center of the typical range) bull Insurable but uninsured amount $427 million ie based on average insured
fraction of 073 (the product of 95 weighted average insurance penetration of owners with insurance and 28 renters and their shares in the housing stock 67 and 33 respectively)
bull Insurability assumed at 100 thus no additional amounts considered One factor reported to be driving the rise in per-claim lightning damage costs is the increased penetration of valuable household electronics The Insurance Information Institute points out that ldquowide screen TVs home entertainment centers multiple computer households gaming systems and other expensive devices are having a significant impact on lossesrdquo (III 2007) Even conventional appliances and equipment (refrigerators air conditioners boilers etc) contain increasing amounts of vulnerable electronic controls and are often not surge-protected
Figure 7 US homeowner insurance claims plus deductibles and uninsured amounts from lightning strikes average approximately $16 billion per year Uninsured values are estimated by applying insured costs to uninsured owner-occupied and rental dwelling stock (American Housing Survey 2015 III 2015b) Deductibles assumed at $750 per household Fires represent only about 2 of
19
the total claim count Values not adjusted for inflation Source claims Insurance Information Institute and State Farm (III 2015a)
Figure 8 Extensibility of loss data from average annual US household lightning claims personal lines Extrapolation includes deductibles for insured and total losses for uninsured households Assumes all losses insurable 2014 price levels
Table 5 Top 10 states for insured homeowner lightning losses by number of claims 2014
20
Line Disturbances Line disturbance insurance claims result when the quality or voltage of electricity entering the equipment is instrumental in causing loss of equipment function (Bendre et al 2004) According to Hartford Steam Boiler Insurance and Inspection Companyrsquos (HSB) loss experience line disturbance is the most likely cause of insured loss for a ldquoboiler and machineryrdquo type of insured equipment claim in the United States for most insured customer types Line disturbance claim frequency and severity data from insurable residential and commercial exposures represent statistically robust estimates for a component of the overall economic grid disruption costs As discussed above insurable losses depend on contract language Insurable damages may include equipment damage foodproduct spoilage data loss and business interruptions Deductibles parallel those of typical property insurance policies eg $750 for homeowners and small businesses to tens or hundreds of thousands of dollars for large businesses HSB estimates that aggregate deductibles are on the order of three to five times the magnitude of insured losses An important indirect cost associated with line disturbances are the so-called ldquocontingent business interruptionsrdquo that arise in the insuredsrsquo supply chain either upstream or downstream of the entity directly experiencing the disruption Those costs are not captured in line-disturbance insurance claim data Large power outages are a contributing factor but the majority of line disturbance equipment failures (by numbers of claims as well as aggregate loss) are caused by local power fluctuations arising either from the buildingrsquos internal electrical distribution system or from the local external power distribution infrastructure On-site systems can also cause power fluctuations if not properly maintained or from design limitations as the buildingrsquos electrical needs evolve Off-site power fluctuations are particularly difficult to identify since they can be caused by vehicle collisions with electric infrastructure local weather and a host of other events The economic losses occurring in the United States from this cause of loss are pervasive yet not widely noted because the precipitating events are individually small and diffuse Equipment that operates in a poor power quality environment may experience reduced service life rather than failing immediately (an uninsurable loss) Consequently it is often the case that no single event can be identified as the root cause of failure Power outages and some weather events can in some cases be associated with line disturbances by comparing loss dates and locations and often these events can be seen in claim frequency spikes8
8 Notably the 2003 blackout represented the largest all-time number of daily claims for HSB with the rank-ordering by state differing from that of the entire industry (PCS data for all types of insured losses) Hurricane Irene the Southwest Blackout of September 8 and the Northwest Storm on October 29 resulted in record line-disturbance claims However these events are rare and the aggregate cost of small frequent events is greater
21
One notable easily identified event type is lightning strikes which have the potential to cause line disturbances However lightning is a property not an equipment-breakdown peril and losses are thus aggregated with other property perils like flood and fire in property insurance reports Lightning effects are an active area of research and some equipment insurers capture equipment claims that could be related to lightning (Kolodziej 1998) However these claims are a small fraction of total line disturbance claim counts and losses Equipment insurers categorize commercial and residential exposures from an engineering rather than activity perspective For example a propertycasualty insurer will typically classify office buildings and apartments separately but from an engineering perspective both business types have common exposures They generally both contain one or more transformers and various layers of electrical distribution equipment like switchgear distribution panels and circuit breakers with centralized HVAC Equipment insurers consider hundreds of location types Here we group those into ldquoExposure Categoriesrdquo representing locations with broadly similar vulnerability characteristics In evaluating historical loss experience our first objective was to rank exposure categories from the highest loss potential to the lowest across 28 exposure categories Loss potential here is defined as the largest gross dollars paid (claims plus estimated deductibles) per location type insured These results provide insights into the sensitivity of each exposure category to line disturbance losses We compiled nationwide claims and exposures from HSB the largest US equipment insurer9 by detailed business line over the five-year period 2009-2013 From this database robust gross-loss cost per location insured estimates were computed for each exposure category representing in excess of 10 million location-years of exposure and loss experience Varying regional values represent a combination of weather geography and a host of other factors As the deductibles are also known and included and insureds and uninsured experience involves analogous levels of damage these values represent national estimates To visually display the findings we normalize the results to the national average value of ldquoApartmentsOffice Buildingsrdquo This is a common electrical exposuremdashwith very large claims in aggregatemdashand comparing other categories to this classification presents a meaningful reference point for relative value The uncertainty range for each exposure category is defined by highest and lowest loss per region When viewed in terms of losses per location the top sectors are clearly energy intensive manufacturing industries and utilities where repair replacement and business interruption costs are very high Office warehouse and agricultural 9 Insureds include over 5 million business and industry customers 350k farm customers and 300000 residential customers
22
locations do not individually possess significant loss potentials from electrical line disturbance losses The two lowest exposures on a per-site level are ApartmentsOffice Buildings and Residential locations which tend to have simple load distribution systems and relatively constant or predictable electricity demand To estimate the aggregate insurable loss amounts for each category we then multiply the per-location claims experience by estimates of the total number of locations nationally (Figures 9 and 10)
23
Figures 9-10 Per-location and aggregate equipment breakdown loss costs associated with grid disruptions based on HSB data for the 2009-2013 period including deductibles paid Relative values are indexed to the national average apartmentoffice building exposure category Ranges reflect highest and lowest regional average outcomes National counts of locations from NAICS USDOE Energy Information Administration US Department of Commerce
These results show the relative importance and pervasiveness of electrical line disturbance loss in the United States (Figure 11) The dominant aggregate loss categories are those where the loss per location is relatively small but are associated with a large number of locations Foremost among these are apartmentoffice buildings and stores with refrigerated food ndash including restaurants and other food service facility types
Figure 11 Extensibility of loss data from average annual national US household and business line-disturbance claims including deductibles recorded by HSB personal and commercial lines Extrapolation includes non-HSB and uninsured customers Results presented in terms of relative rather than absolute losses by customer type
The household and business customer categories represent very large numbers of customers with relatively low per-customer losses On the other hand Concrete Manufacturing for example is an extremely energy intensive industry where line
24
disturbance mitigation may have a direct influence Medical Offices amp Nursing Homes are the 4th largest exposure category reflecting the recent introduction of high-value diagnostic equipment such as medical imaging equipment in non-hospital environments This type of equipment can be highly sensitive to line disturbance and power outages and the risk can be easily reduced technically if owners (and insurers) begin to value the long-term benefit of risk reduction measures Discussion The proportion of total grid disruption costs that are insured varies widely among the four case studies depending on the nature of the event and the degree of overlap with insurance penetration and policy terms (Table 6) Table 6 Summary of case-study findings
At one extreme approximately 64 of the costs of household lightning-related disruptions are insured and the balance (deductibles and costs of those not carrying insurance) is readily estimated such that the full economic costs can be derived from insurance data A far lower fraction of total costs of power outages are insured or readily estimable using insurance data For the 2003 event the insured losses were 3 of the total-cost estimate Insured losses for the 1977 blackout represented 10 of total cost estimates Insufficient insurance data on blackouts make it not possible to readily estimate nationwide annual costs from these individual events Line-disturbance losses represent only 15 to 25 of the total
25
insurable and uninsurable losses from electrical line disturbances However for all loss types the total costs often reported are far less certain and well-defined than insured costs albeit spread widely in the media On the contrary the scrutiny of insurance claims (within the terms and conditions of policies) results in some claims being rejected Sullivan et al (2015) conducted a meta-analysis of the literature on customer value of electricity reliability Their study includes 34 different datasets from surveys fielded by 10 different utility companies between 1989 and 2012 Our results for commercial customers overlap at the low end of Sullivan et alrsquos range As our insurance data are not disaggregated by customer size the level of agreement for commercial customers is not clear Our findings for household customers are on the order of 50- to 200-times greater (Table 7) In the two case studies for which we have sector-specific loss data (the 2003 blackout and Line Disturbances) aggregate insurance payments were greater in the homeowner sector than the businessindustrial sector This reflects at least in part the vastly larger number of policy-holders and perhaps also the less advanced level of loss-prevention through methods such as uninterruptible power supplies and backup generators as well as surge protection devices However this finding suggests that traditional research methods (such as surveys about the value of service) may not fully capture the costs of grid disruptions to households Table 7 Comparison of our findings with Value-of-Service studies ($ losscustomer)
Small commercial amp Industrial
Medium amp Large Commercial amp Industrial
Households
Sullivan et al 2015 $9100 $165000 $31 to $42 2003 Northeast Blackout ndash this study
$14300 to 102000 $1700 to $4600
Lightning ndash this study Not available
$8347
Values are for a 16-hour outage Range shows variation by time of day Varies by state Given that waiting-period deductibles are typically on the order of 24 to 72 hours it is likely that the majority of commercial lines losses in the 2003 blackout were uninsured This would have been reinforced by the fact that the event took place late on a Thursday indicating that only one full day of certain business activities were disrupted This is reinforced by HSBrsquos estimate that deductibles from line-disturbance events are three- to five-times the insured values However in the case of equipment damages (the primary loss in the line-disturbances example) duration of outage is not a factor as losses occur more or less immediately The top economic loss exposures encompass the majority of the US population (homes and commercial businesses) This result challenges many business models as to how to cost-effectively reduce this apparent societal exposure On a per
26
location basis cost effective mitigation may not be possible especially if financiers are looking for short pay back returns Grid-disruption events are relatively infrequent yet the exposures very widespread It is often difficult for a homeowner or business owner to financially justify spending funds today to directly mitigate future potential losses from future infrequent events However from a societal or regional perspective mitigation measures on this scale can yield substantial reductions in claims This finding suggests that the most effective mitigation measures could be introduced across a region or exposure category and not necessarily on a site-by-site basis This could be incentivized by insurers or other organizations that place value on the common good created from certain forms of risk mitigation The insurance industry is working to better understand the role of grid disruptions in their overall risk environment The scale of losses from the 2003 Blackout took leading insurance industry organizations by surprise as actual claims of $180 million were at least seven-times greater than initial projections that they may not exceed $25 million (Levick 2003) Projections two months after the event were still less than 50 of the ultimate loss (Bloomberg News 2003) Similarly line disturbances are a previously underappreciated category of losses in both the insurance literature and the power-sector literature These events affect many customer segments occurring throughout the household commercial industrial agricultural and power-production sectors
BLACKOUT MODELING Our case-study analysis of discrete historical events illuminates loss mechanisms but cannot be always be extrapolated to other scales or contexts In the majority of cases actual loss data are highly aggregated and do not isolate the costs solely related to grid disruptions from other impacts such as property damage Modeling offers the potential to isolate costs of interest and to explore the sensitivity of different regions and customer types to grid disruption events The Blackout Risk ModelTM developed jointly by HSB and Atmospheric and Environmental Research (AER) a unit of Verisk Climate is now being used to examine the influence of risks from wide-area blackouts This is the first commercially available model of its kind The new modeling technology integrates a database of possible weather conditions satellite analysis of trees near distribution lines proprietary knowledge of the electrical grid infrastructure and detailed economic data The model incorporates extensive data on four peril categories hurricanes winter storms thunderstorms and equipment or operator error The system can be applied assess the exposures faced by individual insurers individual communities or large regions
27
More than 95000 actual and potential hurricane events 68000 winter storms and 400000 severe convective storms (tornados and thunderstorms) are included in the analysis The model assesses impacts on electrical infrastructure including more than 11000 power plants 64000 substations and 737000 miles of transmission lines in the US and Canada Approximately 12000 key substations have been classified through detailed satellite data analysis engineering review andor visual inspections Power flows of the US grid are simulated down to the local substation level A US population weighted tree density sub-model accounts for the proximity of trees to power lines Estimation of tree cover uses proprietary algorithms based on satellite data vegetation type and density information The analysis is performed at very high spatial resolution (Figure 12) The model can be used for a specific named storm to forecast hypothetical outage locations and durations based on AERrsquos forecast track models or to examine probabilistic outage risks at a specific location Localized events such as lightning strikes or line disturbances at individual locations are not addressed in the model
28
Figure 12 Percent outage by zip code in affected counties New Jersey New York and Connecticut (left) and percent outage by exact location (ZIP 07733) (Bartley and Rhode 2013)
INNOVATIONS IN RISK SPREADING AND LOSS PREVENTION With rising awareness of electricity reliability risks will likely come increased demand for responsive insurance products and services Loss-prevention measures may reduce current risks to a level that insurers can more readily assume although it will be challenging in some customer classes particularly households where loss costs are small individually but large in aggregate As is the case with many other large-scale risks (eg storm damage to the building stock) insurersrsquo willingness to assume risks can increase where public policymakers take steps to prevent losses (eg by improving building and equipment codes and standards) Such considerations would no doubt apply in the case of electrical system maintenance and modernization A range of customer-side risk-management technologies are employed today including on-site primary or backup generators uninterruptable power supplies (UPS) on-site energy storage surge protectors and improved grounding (for lightning risk) Equally important are business-continuity programs and financial risk-transfer mechanisms such as insurance Yet little has been done to determine the levels of adoption and cost-effectiveness of these strategies (LaCommare and Eto 2004) Insurers are finding new business opportunities to become more engaged as advisors and service providers in loss prevention Some already provide premium credits for homes with permanently installed backup generators (Spencer 2013) or lightning protection devices ldquoSue-and-laborrdquo clauses within some insurance contracts which have the insurer pay for efforts to avoid an insured loss (eg on-site generators) are an example of this thinking from early in the history of maritime insurance (Johnson and Churan 2003) Such losses must be ldquoimminentrdquo meaning that only those loss-prevention measures taken during an outage event may be claimed Insurance terms and conditions could more precisely reflect loss exposure and be used to reward loss-prevention initiatives Potential underwriting criterion could range from equipment- and building-specific levels to the propertyrsquos location within the utility grid There is more that insurers can do Emerging technologies are creating new opportunities for risk management particularly with regard to the Smart Grid Advanced metering infrastructure for example is reported to have improved response time during recent major hurricanes in the US (Executive Office of the
29
President 2013 Campbell 2012) Two-way communication between the grid and end-use loads offers a potential for strategic load shedding so as to preserve essential services and protect equipment during line disturbances While present-day grid-intertied solar photovoltaic systems go out of service when the broader grid is down new approaches involving advanced batteries and controls could enable end users to ldquoislandrdquo themselves and remain operational during outages At a larger scale micro-grids can similarly isolate large numbers of customers On the demand side energy-efficient technologies such as high-performance refrigeration systems that can coast through outages may help prevent losses and enable insurance holders to ldquoshelter in placerdquo and not incur insured extra expenses The insurance industry anticipates a spate of new products and services and notes the potential benefits in the event of grid disruptions (Galovich 2015) American Family Insurance Company in partnership with Microsoft is making equity investments in smart-home startups with promising insurance applications including communications and loss prevention functionality in times of grid disruptions The giant German insurer Allianz has also entered this market in partnership with Deutsche Telecom The Italian insurer BNP Paribas Cardif combines smart home technology with tailored insurance coverage with sensors in place to detect a range of loss triggers including power outages (Smith 2014) While insurers are natural advocates of loss-prevention they are also sensitive to potential risks associated with customer-side responses to grid disruptions such as fire or carbon monoxide poisoning resulting from the use of generators (Spencer 2013) Similarly smart-home technology has pros and cons On the one hand the connected home can keep insurers far better informed of practices that correlate with losses including those stemming from power disruptions as well as providing opportunities to automate loss prevention (thermostat management) On the other hand these technologies can introduce new risks (Holbrook 2010 Business Insurance 2014) which for example on the supply side (eg wind solar) or on the demand side (eg variable speed drives) may introduce new reliability-related risks (Lineweber and McNulty 2001) In the electricity upstream emerging risks such as oversupply from grid-connected renewables are also a consideration (Bruch et al 2011) CONCLUSIONS AND FURTHER ANALYSIS NEEDS We find that the consequences of fluctuations in electric grid reliability are a substantial source of insurance claims with a single blackout event potentially generating insured losses on a par with those experienced following a major hurricane The causes and magnitude of these events are less well documented and understood than most insurance risks Once regarded as minor events multi-billion-dollar insured losses for a single power outage are today seen as a real possibility Our analysis makes new insurance data available for analysts and decision makers We find that these data can be used to approximate part or all of the broader economic costs of certain events
30
However very substantial information gaps remain More efforts are needed within the private and public and sectors (each of which has its domains of influence) to better document the role and insured and total costs of grid disruptions Improved Data and Analysis Insurance loss data are valuable in helping understand the broader societal costs of electric reliability disruptions They offer perhaps the most rigorous and best quantification of impacts at a macro scale and when taken as a proxy for costs analogously incurred by non-insureds can be extrapolated to estimate regional or national cost impacts They can also provide fine-grain data onto how losses vary by geography or type of facility This is particularly evident in the line-disturbance case study Promising research avenues include
bull A better market-wide perspective is needed on the insured costs of power disruptions We discovered that aggregate insurance data do not currently exist on numbers of policyholders with coverages that respond to outages terms of these coverages (eg time-deductible periods) or loss experience In tandem with these data gaps utility-side statistics on outage duration and types and numbers of customers affected are also poor
bull For private-sector insurance the PCS $25-million-per-event cutoff results in
most power outages being unrecorded at an industry-wide level and closed-claim analyses at the individual insurer level have not been published other than that provided here for HSB Moreover PCS statistics do not include claims data for line disturbances presumably because of their decision rules (too few insurers in this sub-market andor minimum claim size) This is a significant data gap illustrated by the fact that three large outages in 2011 resulted in record line-disturbance claims More comprehensive data collection would provide better estimates of aggregate claims faced by the insurance industry
bull As insurance premiums are actuarially based on exposures and expected values of specific losses identifying the component of insurance premiums that is associated with grid disruption risk would provide an alternate avenue for understanding aggregate cost In this sense premiums can be looked at as a reflection of willingness to pay However as these premiums are typically ldquobundledrdquo together with others (eg embedded in a general ldquoHomeownersrdquo or ldquoBusiness Interruptionrdquo premium) the underlying actuarial information would need to be identified
bull Outages and losses due to events triggered by natural disasters could be tracked more precisely In particular the coding and reporting mechanisms utilized in existing event-tracking (eg DOE and NERC) could be improved
31
bull Further analysis could focus on examining more events involving only
electricity infrastructure such as the WSSC area events of Summer 1996 (July 2 July 3 and August 10) the San Francisco Tripoff of December 8 1998 and the Southwest Blackout of September 8 2011 These events offer the best remaining opportunities to identify outage costs independent of confounding factors such as storm damages
bull Further analyses could scale-up existing estimates to expected values of
national annual-average losses Extrapolating insured losses incurred during large-scale power outages to national costs is confounded by highly variable penetration of relevant insurance as well as terms and conditions (eg exclusions and deductibles) While total costs may be estimable in this fashion insured losses would require information on the penetration of responding policy types and numbers of customers impacted
bull Insurance costs incurred by publicly funded insurance mechanisms
particularly the National Flood Insurance Program may yield additional relevant data however this programrsquos publicly available statistics do not separately identify losses associated with electric grid disruptions (NFIP 2014)
bull Better data in turn can help specify better models As grid-disruption events
triggered by extreme weather have been increasing faster than non-weather-related causes (USGCRP 2009 Campbell 2012) models must also consider the role of trends in extreme weather and climate change in shaping risks (van Vliet et al 2016) This is a natural initiative for public-private coordination (Pendleton et al 2013) Well-specified models can be powerful tools for investigating the cost-effectiveness of loss-prevention interventions
Targeted Risk Management Further analysis of the patterns of insurance claims data could inform risk-management efforts by shedding light on the anatomy of losses and providing information on underlying causes and vulnerable customer segments Promising research avenues include
bull Deeper examination of losses by location type and exposure category could yield new insights into vulnerabilities and context-sensitive loss-prevention strategies For example examination of impacts in healthcare settings has suggested a number of specific ways to prevent losses (Klinger et al 2014) Enhanced understanding would also improve underwriting and enable more risk-based premiums
32
bull As innovations occur in the electricity sector driven by goals for improving energy efficiency making the grid smarter and deploying climate-friendly generation technologies it is critical to conduct proactive technology assessments to ensure that reliability and resilience are maintained if not enhanced Insurers are interested in both issues and are well positioned to capitalize on synergies (Mills 2009) These considerations could be more deeply integrated with energy technology RampD on both the supply and demand sides
bull Many technologies exist for mitigating losses from grid disruptions ranging
from lightning protection to backup generators Future analyses may enable insurers to encourage customer-side loss-prevention investments by reflecting their value in policy terms and conditions
bull While domestic interests tend to focus on domestic issues grid disruptions and their impacts often extend over national borders This is increasingly so given the role of global communications and supply chains as well as trans-national power pools Analysis of vulnerability and international impacts of electricity reliability problems is merited as it affects insurance claims As noted above some insurance products explicitly cover disruptions in distant supply chains
In sum there is clearly a greater role for insurers in spreading and managing the risks associated with electric grid disruptions Basic consumer education about coverage gaps and the role of optional policy endorsements could result in more homes and businesses utilizing insurance As loss-prevention is a core precept in the insurance business techniques already utilized by insurers may have broader value and insurers are well positioned to develop new and improved techniques Loss prevention also deserves increased attention given multiple trends that can be expected to elevate future losses above what has been experienced historically Public-private partnerships with insurers and policymakers could yield impactful results particularly for customer types represented by large numbers of relatively low per-customer losses ACKNOWLEDGEMENTS This work was supported by the US Department of Energy Office of Electricity Delivery and Energy Reliability under Contract No DE-AC02-05CH11231 Useful comments were provided by Joe Eto (LBNL) Robert Muir-Wood (RMS) Anthony Wagar (Willis) Howard Kunnreuther (Wharton) Tom Phillips (CARB retired) Eric Rollison and Sharon Hernandez (USDOE) and two anonymous reviewers REFERENCES
33
American Housing Survey 2013 US Census Bureau httpwwwcensusgovhousinghvsdatahist_tab7a_v2013xls [accessed February 1 2015]
Anderson P and IK Geckil 2003 ldquoNortheast Blackout Likely to Reduce US Earnings by $64 billionrdquo Anderson Economic Group working paper 2003-2 8pp
Bartley W and J Rhode 2013 Case Study Leveraging Data on Wind Storm Surge and Electrical Blackout in the Superstorm Sandy Aftermathrdquo Atmospheric and Environmental Research Munich Re and Hartford Steam Boiler presentation 31pp
Bendre A Divan D Kranz W Brumsickle W 2004 Equipment Failures Caused by Power Quality Disturbances Industry Applications Conference 2004 39th IAS Annual Meeting Conference Record of the 2004 IEEE vol1 no pp489 Vol1 Seattle WA
Bloomberg News 2003 ldquoBlackout to cost insurers $75 Millionrdquo October 14 Via Chicago Tribune httparticleschicagotribunecom2003-10-14business0310140280_1_blackout-insurance-market-power-failure [accessed February 9 2015]
Blume B and J Holmer 2013 ldquoElectric Heat Threats to the Reliability of the Power Grid Will Present Challenges to Insurersrdquo Bestrsquos Review (September) pp 83-85
Bruch M M Kuhn and G Schmid 2011 ldquoPower Blackout Risksrdquo CRO Forum 28pp Report November 31pp editor Markus Aichinger (Allianz) KPMG Advisory NV Laan van Langerhuize 1 1186 DS Amstelveen or PO Box 74500 1070 DB Amsterdam
Business Insurance 2014 ldquorsquoSmartrsquo Technology could make Utilities More Vulnerable to Hackersrdquo httpwwwbusinessinsurancecomarticle20140715NEWS07140719922smart-technology-could-make-utilities-more-vulnerable-to-hackers [ accessed February 1 2015]
Campbell R J 2012 ldquoWeather-related Power Outages and Electric System Reliabilityrdquo Congressional Research Service R42696 15pp
R42696
Claverol M 2013 ldquoThere is Coverage for Business Income Losses Caused by Power Outages During Hurricane Sandyrdquo Property Insurance Coverage Law Blog httpwwwpropertyinsurancecoveragelawcom201301articlescommercial-insurance-claimsthere-is-coverage-for-business-income-losses-caused-by-power-outages-during-hurricane-sandy [accessed November 10 2014]
34
Eto J J Koomey B Lehman N Martin E Mills C Webber and E Worrell 2001 Scoping Study on Trends in the Economic Value of Electricity Reliability to the US Economy Prepared for the Electric Power Research Institute LBNL-47911 148pp httpevanmillslblgovpubspdflbnl_47911pdf [accessed July 12 2015]
Executive Office of the President 2013 ldquoEconomic Benefits of Increasing Electric Grid Resilience to Weather Outagesrdquo The White House 28pp
FERC and NAERC 2012 ldquoArizona-Southern California Outages on September 8 2011 Causes and Recommendationsrdquo Federal Energy Regulatory Commission and the North American Electric Reliability Corporationrdquo 151pp April httpwwwfercgovlegalstaff-reports04-27-2012-ferc-nerc-reportpdf [accessed July 30 2015]
Fickenscher L 2013 ldquoTrump SoHo Sues over Sandy Damagesrdquo Business Insurance httpwwwbusinessinsurancecomarticle20130606NEWS05130609880trump-soho-sues-over-sandy-damages [accessed February 1 2015]
Galovich R 2015 ldquoWell Connectedrdquo Bestrsquos Review February p 64
Geneva Association 2009 The Geneva Report No 2 The insurance industry and climate changemdashContribution to the global debate The Geneva Association httpswwwgenevaassociationorgmedia201070Geneva_report5B25Dpdf [accessed August 17 2014]
Glotfelty J 2003 ldquoTransforming The Grid to Revolutionize Electric Power in North
Americardquo USDOE Office of Electricity Transmission and Distribution Presentation 24pp
Greenwald S 2014 ldquoNew Jersey Transit Sues Lloyds and Other Insurers over
Superstorm Sandy Coveragerdquo Business Insurance httpwwwbusinessinsurancecomarticle20141008NEWS07141009843new-jersey-transit-sues-lloyds-and-other-insurers-over-superstorm [accessed February 1 2015]
Healey J 2014 ldquoRisk Nexus Beyond Data Breaches Global Interconnections of
Cyber Riskrdquo Atlantic Council and Zurich 29pp
Hines P J Apt and S Talukdar 2009 ldquoLarge Blackouts in North America Historical Trends and Policy Implicationsrdquo Energy Policy v 37 pp 5249-5259 2009See also supporting documentation posted at httpwwwuvmedu~phinespublications2009blackoutshtml [accessed August 25 2015]
35
Holbrook E 2010 ldquoIs The Smart Grid Smart Enoughrdquo Risk Management February 1 httpwwwrmmagazinecom20100201is-the-smart-grid-smart-enough [accessed December 10 2014]
III 2007 ldquoLightning Striking Again and Again New III Study Finds Increase in Lightning Claim Costsrdquo Insurance Information Institute news release June 21 httpwwwiiiorgpress-releaselightning-striking-again-and-again-new-iii-study-finds-increase-in-lightning-claim-costs-062107 [accessed January 29 2015]
III 2015a ldquoLightningrdquo Insurance Information Institute httpwwwiiiorgfact-statisticlightning [accessed January 29 2015]
III 2015b ldquoRenters Insurancerdquo Insurance Information Institute httpwwwiiiorgfact-statisticrenters-insurance [accessed February 1 2015]
Johnson S G 2001 ldquoInsurance Coverage for Power Outage Lossesrdquo Journal of Insurance Coverage Autumn issue httpwwwrobinskaplancom~mediapdfsinsurance20coverage20for20power20outage20lossespdfla=en
Johnson SG and A M Churan ldquoThe August 2003 Blackout and Insurance Coverage for Power Outage Lossesrdquo Tort Trial amp Insurance Practice Law Journal 39(3)813-835
Kenealy B 2015 ldquoBusiness Interruption Natural Catastrophes Top Risk Manager Concernsrdquo Business Insurance p8 httpwwwbusinessinsurancecomarticle20150114NEWS06150119921business-interruption-natural-catastrophes-top-risk-manager-concernstags=|59|64|83|299|302|306|329|338 [accessed February 1 2015]
Klinger C O Landeg and V Murray 2014 Power Outages Extreme Events and Health a Systematic Review of the Literature from 2011-2012 PLOS Currents Disasters 2014 Jan 2 Edition 1 httpcurrentsplosorgdisastersarticlepower-outages-extreme-events-and-health-a-systematic-review-of-the-literature-from-2011-2012 [accessed July 30 2015]
Kolodziej K-H 1998 ldquoAn Analysis of Lightning Strikes and Equipment Failuresrdquo International Lightning Detection Conference Tucson AZ November
LaCommare K and J Eto 2006 ldquoCost of Power Interruptions to Electricity Consumers in the United Statesrdquo Energy the International Journal 311509-1519
36
LaCommare K and JH Eto 2004 ldquoUnderstanding the Cost of Power Interruptions to US Electricity Consumersrdquo Lawrence Berkeley National Laboratory Report no 55718 50pp
Larsen P K LaCommare J Eto and J Sweeney Assessing Changes in the Reliability of the US Electric Power System LBNL report December 2014
Lecomte EL AW Pang JW Russell 1998 ldquoIce Storm rsquo98rdquo Institute for Catastrophic Loss Reduction and the Institute for Business amp Home Safety 47pp httpwwwiclrorgwinterstormicestorm98html [accessed September 15 2014]
Levick D 2003 ldquoInsurers Expecting Few Blackout Claimsrdquo Hartford Courant August 16 httparticlescourantcom2003-08-16business0308160340_1_outage-power-surge-water-damage [accessed October 15 2014]
Lineweber D and S McNulty 2001 ldquoThe Cost of Power Disturbances to Industrial and Digital Economy Companiesrdquo Prepared for the Electric Power Research Institute 98pp wwwonpowercompdfEPRICostOfPowerProblemspdf [accessed October 10 2014]
Marsh 2012 ldquoPower Outages Are You Preparedrdquo Marsh USA August httpusamarshcomNewsInsightsThoughtLeadershipArticlesID26064Power-Outages-Are-You-Preparedaspx [accessed September 1 2014]
Massman S 2012 ldquoPower Outa]ges and Catastrophes Evaluating Utility Services Exclusionsrdquo Property Casualty 360 January 2 httpwwwpropertycasualty360com20120102power-outages-and-catastrophes [accessed October 25 2014]
McElroy W 2015 ldquoThe Next Big Thing Environmental Insurance for the Rest of Usrdquo PropertyCasualty 360 July 16 httpenvfpnadvisencomfpnHomepagepshtmlresource_id=2424103302021539025ampuserEmail=anthonywagarwilliscomtop [Accessed July 30 2015]
Mills E 2009 A Global Review of Insurance Industry Responses to Climate Change The Geneva Papers International Association for the Study of Insurance Economics 34323-359 httpevanmillslblgovpubspdfgpp200914apdf [accessed January 5 2015]
NAIC 2007 ldquoBusiness amp Employee Insurance Issues among US Small Businessesrdquo National Association of Insurance Commissioners httpwwwnaicorgdocumentsnewsroom_small_business_summarypdf [accessed November 28 2014]
37
New York Times 2007 ldquoThe rsquo77 Blackout Authors Take Questions Part 3rdquo July 14 httpcityroomblogsnytimescom20070714the-77-blackout-authors-take-questions-part-3 [accessed February 9 2015]
NFIP 2014 ldquoDwelling Form Standard Flood Insurance Policyrdquo National Flood Insurance Program 47pp httpswwwfemagovnational-flood-insurance-programstandard-flood-insurance-policy-forms3 [accessed February 1 2014]
NIST 2015 ldquoCommunity Resilience Planning Guide for Buildings and Infrastructure Systems Volume IIrdquo NIST Special Publication 1190 Draft for Public Comment April 247pp
PCS 1977 ldquoCatastrophe Bulletin No 99rdquo Property Claim Services American Insurance Association July 21 6 pp
Pendleton L T Karl and E Mills 2013 Economic Growth in the Face of Weather and Climate Extremes A Call for Better Data Transactions of the American Geophysical Union 94(25)224-225 httpevanmillslblgovpubspdfpendleton-karl-mills-EOSpdf [accessed September 22 2014]
RMS 2004 Todays 10 Greatest Risks analysis by Risk Management Solutions (RMS) in Risk amp Insurance Magazine April 15 23pp
Rodentis S 1999 Can Your Business Survive the Unexpected Journal of Accountancy (February) 187(2) American Institute of Certified Public Accountants httpwwwjournalofaccountancycomIssues1999Febrodetishtm [accessed February 1 2015]
SCI 1978 ldquoImpact Assessment of the 1977 New York City Blackoutrdquo Systems Control Incorporated Project 5236-100 155pp httpblackoutgmueduarchivepdfimpact_77pdf [accessed February 9 2015]
Slavin A 2010 ldquoToo Much Sunrdquo Bestrsquos Review (August) pp 86-89
Smith A and RW Katz 2013 ldquoUS Billion-dollar Weather and Climate Disasters Data Sources Trends Accuracy and Biasesrdquo Natural Hazards June 2013 67(2) 387-410 httplinkspringercomarticle101007s11069-013-0566-5 [accessed February 20 2015]
Smith K 2014 ldquoHome Smart Homerdquo Bests Review November pp 16-22
Spencer S 2013 ldquoOut of the Darkrdquo Bestrsquos Review (February) p 66
38
Standler RB 2011a ldquoLiability of Electric Utility in the USA for Outage or Blackoutrdquo 51pp httpwwwrbs2comoutagepdf [accessed July 16 2014]
Standler RB 2011b ldquoLegal Liability for Electricity in the USA Products Liability httpwwwrbs2comutilitypdf [accessed July 16 2014]
Sullivan MJ J Schellenberg and M Blundell 2015 ldquoUpdated Value of Service Reliability for Electric Utility Customers in the United Statesrdquo Lawrence Berkeley National Laboratory Report No 6941E 49pp
US-Canada Power System Outage Task Force 2004 ldquoFinal Report on the August 14 2003 Blackout in the United States and Canada Causes and Recommendationsrdquo Prepared by the governments of the United States and Canada 30pp httpenergygovsitesprodfilesoeprodDocumentsandMediaBlackoutFinal-Webpdf [accessed July 25 2014]
USDOE 2013 ldquoInsurance as a Risk-Management Instrument for Energy Infrastructure Security and Resiliencerdquo US Department of Energy Office of Electricity Delivery and Energy Reliability 76pp
USGCRP 2009 Global Climate Change Impacts in the United States US Global Change Research Program Cambridge University Press 188pp
Verisk Climate and HSB 2014 ldquoOverview of Insurance Risk Assessment Methods for Blackoutrdquo Presented at the Workshop on Gap Identification for Future Risk Modeling and Analysis Program US Department of Energy December 11
van Vliet M D Wiberg S Leduc and K Riahi 2016 ldquoPower-generation System Vulnerability and Adaptation to Changes in Climate and Water Resourcesrdquo Nature Climate Change httpwwwnaturecomnclimatejournalv6n4fullnclimate2903html 6375ndash380 doi101038nclimate2903
Widin DR 2009 ldquo2003 Blackout Held to Involve lsquoProperty Damagersquo Sufficient to Support Claim under Property Policy The Policyholder Perspective ReedSmith httpwwwpolicyholderperspectivecom200906articlesfirst-party-property2003-blackout-held-to-involve-property-damage-sufficient-to-support-claim-under-property-policyprinthtml [accessed July 20 2014]
Zinkewicz P 2005 ldquoBusiness Interruption InsurancemdashDeath Protection for a Businessrdquo Rough Notescom July 5 httpwwwroughnotescomrnmagazinesearchcommercial_lines05_07p62htm (accessed February 12 2015)
39
Zola J and A N Bourne 2012 ldquoAttorneys Discuss Possible Triggers for Business Interruption Coveragerdquo Insurance Journal November 20 httpwwwinsurancejournalcomnewseast20121120271177htm [accessed January 25 2014]
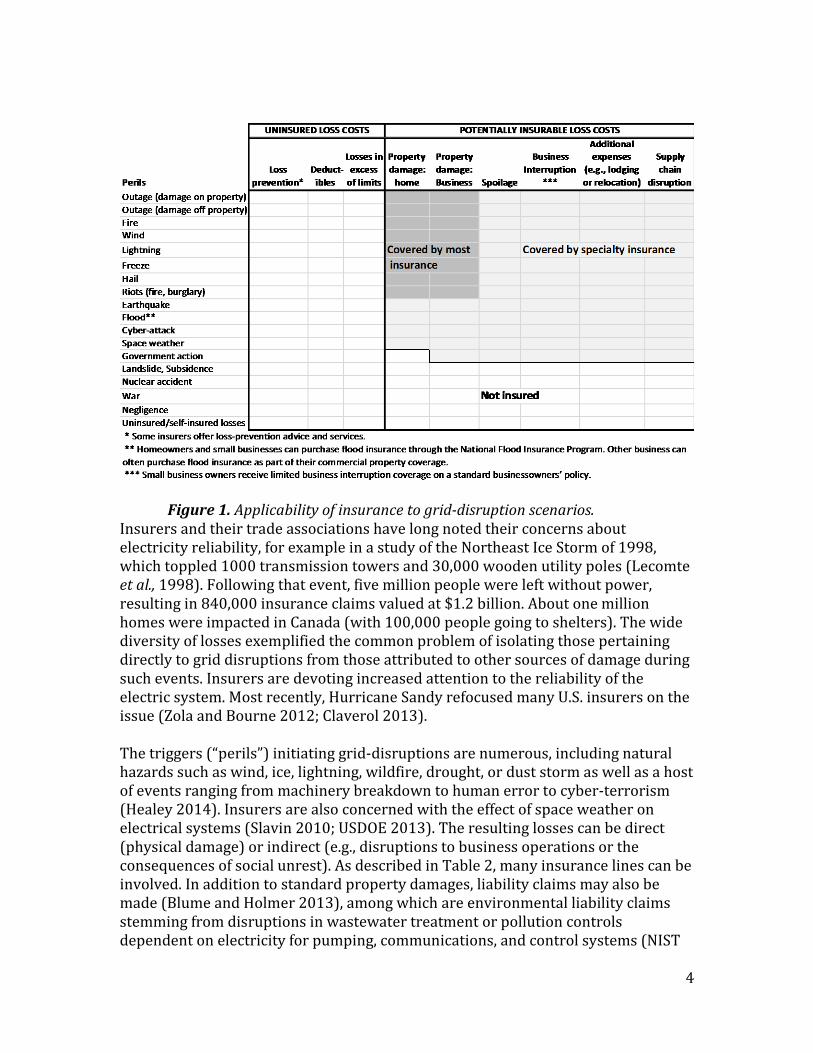
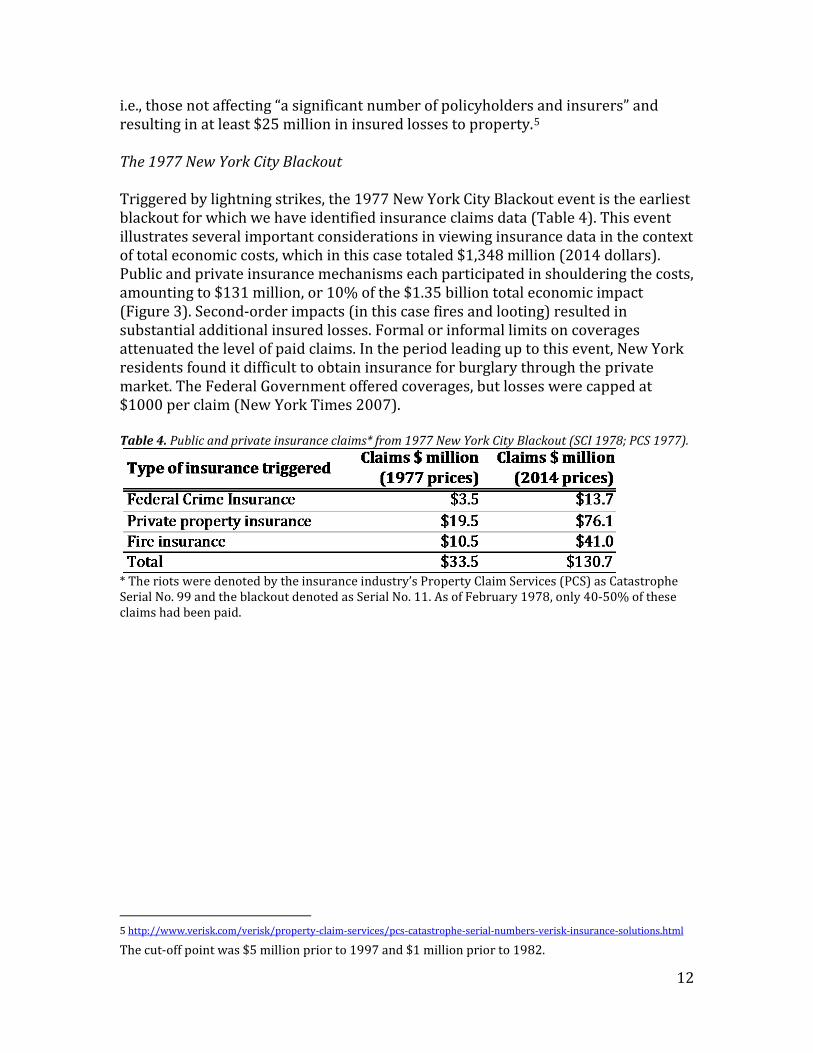
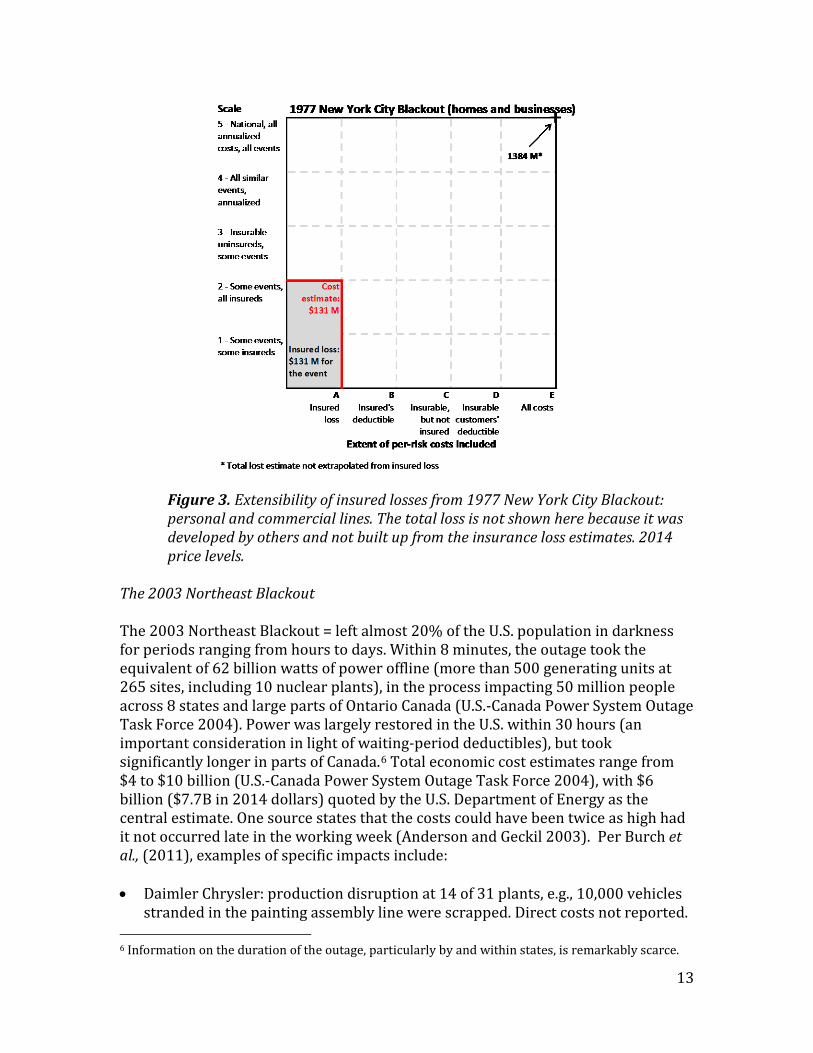

39
Zola J and A N Bourne 2012 ldquoAttorneys Discuss Possible Triggers for Business Interruption Coveragerdquo Insurance Journal November 20 httpwwwinsurancejournalcomnewseast20121120271177htm [accessed January 25 2014]