Embed Size (px)
Citation preview

Slope Stability 2013 – P.M. Dight (ed) © 2013 Australian Centre for Geomechanics, Perth, ISBN 978-0-9870937-5-2
Slope Stability 2013, Brisbane, Australia 1149
An integrated approach for rockfall analysis with drapery systems
K. Thoeni Centre for Geotechnical and Materials Modelling, The University of Newcastle, Australia
C. Lambert Civil and Natural Resources Engineering, University of Canterbury, New Zealand
A. Giacomini Centre for Geotechnical and Materials Modelling, The University of Newcastle, Australia
S.W. Sloan Centre of Excellence for Geotechnical Science and Engineering; and Centre for Geotechnical and Materials Modelling, The University of Newcastle, Australia
J.P. Carter Centre of Excellence for Geotechnical Science and Engineering; and Centre for Geotechnical and Materials Modelling, The University of Newcastle, Australia
Abstract
The rockfall hazard in mining environments needs to be rigorously managed in order to ensure safe mining operations, in particular when designing portal entries for punch longwalls. The installation of drapery systems is a common practice to mitigate the rockfall hazard at the base of highwalls. However, the hazard is not completely eliminated since blocks can still detach and fall in between the drapery and the highwall. This contribution shows how geostructural modelling and 3D rockfall analysis can be combined in order to accurately map and assess the rockfall hazard at the base of such highwalls. The study entails the estimation of the size distribution of unstable blocks and the simulation of their trajectories and velocities for highwalls without and with drapery.
First, 3D photogrammetry is combined with discrete fracture network modelling in order to generate polyhedral models of the rock mass structure. Polyhedral modelling and kinematic analyses are combined to estimate the volume and shape distribution of unstable blocks. Unstable blocks are then classified according their shape.
Second, a 3D discrete element rockfall model is presented which allows for an accurate prediction of velocities and run-out distances for rock slopes with and without drapery. The 3D model is used to predict trajectories and velocities for blocks representative of a highwall, i.e. block size and shape according the results from the polyhedral modelling. The focus is to investigate the efficiency of the drapery and to quantify the residual rockfall hazard at the base of a highwall.
1 Introduction
Rockfall hazards pose significant problems worldwide because they are responsible for major damage to infrastructure and for severe accidents including fatalities. In mining environments rockfall events can also have financial consequences in cases where the production must be temporarily stopped for safety reasons. Rockfall phenomena have been widely studied for roads and highways (Pfeiffer and Bowen, 1989; Giani, 1992; Agliardi and Crosta, 2003; Dorren, 2003; Turner and Schuster, 2012) but it is only recently that they have been accounted for in the context of quarries (Alejano et al., 2007, 2008) and open pits (Giacomini et al., 2012a).
Several areas with significant rockfall hazards exist in a mining environment. Areas which are particularly vulnerable to rockfall events are portal entries for punch longwalls in underground mining which can be found along a highwall. For Australian punch longwall operations, the standard approach has been the use of draperies combined with face bolting of potentially large blocks (Giacomini et al., 2012b). However, this protection system does not totally eliminate the rockfall hazard as blocks can still detach and fall in
doi:10.36487/ACG_rep/1308_81_Thoeni

An integrated approach for rockfall analysis with drapery systems K. Thoeni et al.
1150 Slope Stability 2013, Brisbane, Australia
between the drapery and the rock surface. Therefore, an accurate assessment of the residual hazard once such protective systems are in place is essential for a safe operation of the mine site.
This paper presents an integrated approach for rockfall analysis with drapery systems. The approach consists of two main steps: geostructural modelling and three-dimensional (3D) discrete element rockfall analysis. The first step consists of developing an accurate geostructural representation of the rock mass. 3D photogrammetry and discrete fracture network (DFN) modelling are used in order to generate polyhedral models of the rock mass structure. Polyhedral modelling and kinematic analyses are then combined to estimate the volume and shape distribution of unstable blocks. The second step involves 3D numerical modelling. A 3D discrete element model developed by the authors is used in order to simulate rockfalls without and with drapery. Simulations for a specific highwall with the block characteristics identified in the geostructural modelling are presented. The integrated approach is applied in order to investigate the efficiency of the drapery and to quantify the residual rockfall hazard.
2 Methodology
Rockfalls are driven by two successive mechanisms: the detachment of a block or rock compartment (i.e. failure) and its propagation down the slope (Jaboyedoff, 2005). Abbruzzese et al. (2009) emphasized the importance of both the block size and the shape of unstable blocks since they influence the propagation down the slope and consequently the impact energies and run-out distances. Both sizes and shapes of blocks are controlled by intersecting fractures. Hence, a good estimate of the fracture properties (orientation, size, density) is of prime importance when assessing the rockfall hazard.
The first step of the integrated approach presented in this paper consists of developing an accurate geostructural representation of the rock mass which allows reliable estimates for the size and shape of unstable blocks to be derived. This is achieved by combining a remote geostructural survey and geostatistical analysis with DFN modelling and polyhedral modelling. Geostructural surveys based on remote techniques, such as digital photogrammetry or laser scanning, are commonly used in order to obtain a detailed description of the rock mass structure (Haneberg, 2008; Sturzenegger and Stead, 2009; Sturzenegger et al., 2011). The methods allow a 3D model of the rock slope to be created from which it is possible to derive properties of the rock mass structure such as orientation, persistence (size), density, and intensity. Unlike one- and two-dimensional (2D) properties that are measured on rock exposure (e.g. a cliff face), measurement of 3D fracture properties such as volumetric density and volumetric intensity are generally not possible. Such properties need to be extrapolated from one and two-dimensional measurements by using a geostatistical analysis (Lambert et al., 2012). Once all the fracture properties are defined a model of the rock mass structure can be created. Rock mass structures and their interconnectivity can be accurately described with DFN modelling tools. In the DFN model used in this work, fractures are assumed to be planar disks whose centroids are randomly distributed in space following a Poisson distribution. Under these assumptions, volumetric densities and size distributions are assessed stochastically. The resulting statistical parameters are then used with a polyhedral modeller in order to generate a series of DFN realisations, which are statistically identical. Outcomes from each realisation can be combined to provide reliable estimates of the block sizes, shapes and stability (Kalenchuk et al., 2006; Elmouttie and Poropat, 2011).
The second step consists of performing 3D rockfall analyses in order to investigate the movement of a falling block along the slope. Lambert et al. (2012) recently proposed a new methodology for a quantitative rockfall hazard assessment where the full block size distribution (and associated energies) are accounted for. However, most rockfall analyses only consider the most likely rockfall event or the most representative event for the rockfall hazard assessments. Shapes and sizes of the falling blocks and their source locations as identified in the geostructural model need to be considered. Furthermore, the rockfall analysis tool needs to be able to consider a drapery. Many 2D and 3D rockfall simulation models exist which allow the assessment of the rockfall hazard at the base of a rock slope (Volkwein et al., 2011). However, only a few models allow the consideration of arbitrary block shapes and only one specific model allows the consideration of a drapery system. This specific model was developed by the authors of this paper based on
Rockfall
Slope Stability 2013, Brisbane, Australia 1151
the discrete element method (Thoeni et al., 2013a). The 3D discrete element model allows the simulation of rockfalls without and with drapery meshes. The method is based on the classical discrete element approach with spherical particles (Cundall and Strack, 1979). Arbitrary block shapes can be created using the clump logic (i.e. the shape is approximated by a rigid assembly of spheres). In addition, the model allows a realistic representation of the rock slope based on a triangulated surface and data from the geostructural survey can be used directly. After defining size and shape of the block, the source location needs to be defined. Once this is done, simulations from different source locations and with various block sizes can be performed. Finally, the rockfall hazard can be assessed by analysing trajectories, velocities and impact energies for several scenarios.
In the following sections, the methodology outlined in this section is discussed considering a highwall located at an open cut mine in the Hunter Valley in New South Wales, Australia.
3 Geostructural modelling
3.1 Geostructural survey and geostatistical analysis
The geostructural survey was carried out by using close-range terrestrial digital photogrammetry. Stereo pairs of images were collected during a site visit. These images were analysed by using the software package Sirovision (CAE Mining, 2013). The module Siro3D was used to generate a geo-referenced 3D model of the highwall and the module SiroJoint was used to carry out a detailed mapping of the structures (Thoeni et al., 2011). The orientations of the structures (i.e. dip and dip direction) were used do identify joint sets in the rock mass. A trace length distribution was derived for each set and used to estimate the joint size distribution (persistence) of each set. Finally, a geostatistical analysis was performed in order to define the 3D representation of the joint fabric which is needed to generate the DFNs discussed in the following section. More details regarding the geostatistical analysis can be found in Lambert et al. (2012).
3.2 Discrete fracture network modelling
The modelling of the network of discontinuities is performed stochastically. The polyhedral modeller Siromodel (Elmouttie et al., 2010) was used to generate and model various DFN representations. The modeller is capable of handling a large number of discontinuities with finite persistence and of automatically identifying complex polyhedra. Thereby, fractures are represented by polygons whose properties follow a user specified statistical distribution. Hence, a series of realisations is needed in order to support any meaningful analysis of the results.
A series of 100 Monte Carlo simulations were performed and the joint properties and the spatial distribution of the joints were varied according to the results of the geostatistical analysis. Figure 1(a) shows an example of the fracture representation for one of the simulations. Figure 1(b) shows the polyhedral model obtained from the same realisation where fractures have been truncated against the model boundaries and the intersecting polygons have been calculated. It should be mentioned that only part of the highwall was modelled due to the large computation times.
3.3 Kinematic analysis
Each DFN realisation results in a particular formation of blocks. In the model, the rock mass is represented by a collection of non-deformable polyhedra which can potentially undergo structurally controlled failures such as sliding and toppling. A limit equilibrium analysis was performed for all geometrically removable blocks and blocks for all realisations were classified following the procedure of Goodman and Shi (1985), where type I indicates unstable blocks, type II indicates stable blocks with the presence of friction, and type III indicates geometrically stable blocks.

An integrated approach for rockfall analysis with drapery systems K. Thoeni et al.
1152 Slope Stability 2013, Brisbane, Australia
(a) (b)
Figure 1 Example of a DFN realisation; (a) visualisation of the generated fractures, and (b) polyhedral model obtained by truncation of the fractures with the model boundaries and calculation of the intersecting polygons
Figure 2(a) shows an example of the blocks formed in one realisation. These blocks were then classified following the Goodman and Shi procedure and the results of all realisations were summarised in a hazard map. The hazard map in Figure 2(b) shows the positions of the three different types of removable blocks for all realisations. This colour-coded plot represents all the removable blocks on the excavation surface. The point size is inversely proportional to the Factor of Safety.
(a) (b)
Figure 2 Kinematic analysis; (a) visualisation of all geometrically removable blocks for one DFN realisation, and (b) hazard map summarising the geometrically removable blocks of all DFN realisations (red type I, yellow type II, and green type III)
3.4 Shape and size distributions of unstable blocks
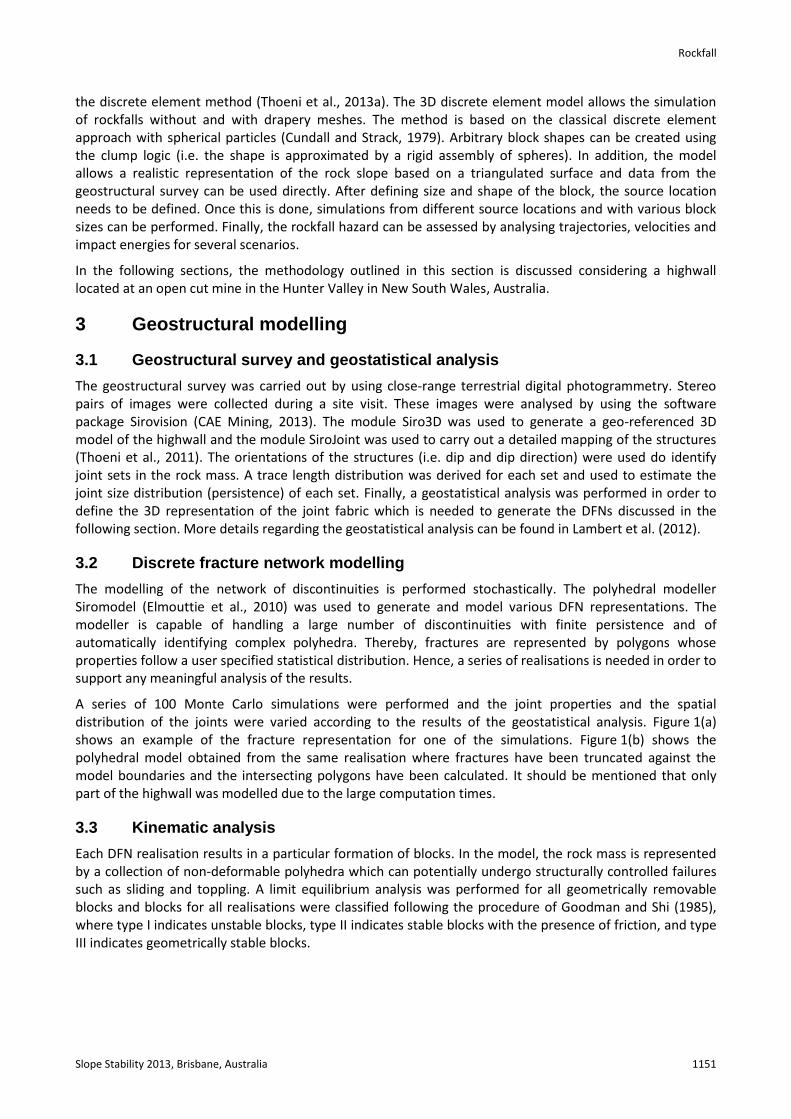
The block volume distribution of all unstable blocks (type I) generated in the polyhedral models was calculated and the results can be seen in Figure 3. The graph shows that 90% of the unstable blocks are smaller than 0.004 m3 (blue dashed lines) and the maximum volume is 0.115 m3 (red dashed line). Lambert et al. (2012) compared the block volume distribution from the polyhedral model to field data and a good agreement was observed.
Rockfall
Slope Stability 2013, Brisbane, Australia 1153
Figure 3 Volume distribution of unstable blocks
Finally, the shapes of all removable blocks (i.e. stable and unstable) were categorised following the classification scheme of Kalenchuk et al. (2006). The block shape diagram and the relevant basic shapes used for the classification are shown in Figure 4(a). Two shape parameters were used to identify the shape of a block. The first parameter α reflects the flatness of a block. It is calculated using a relationship between the surface area and the volume. A perfect cube has α = 1 and as α increases the block becomes thinner. The second parameter β reflects the angularity of a polyhedral block. It is a function of the inter-vertex vectors of all vertex pairs. A perfect cube has β = 1 and as β increases the block becomes longer.
Figure 4(b) shows the results of the shape analysis for the geometrically removable blocks of all DFN realisations. Each point represents a block and unstable blocks are marked with a red diamond. From the results it can be seen that the majority of the removable stable blocks are elongated and most unstable blocks can be classified between platy and elongated. Figure 4(c) shows some examples of unstable blocks obtained from the polyhedral models with the corresponding volume and shape parameters.
4 3D discrete element rockfall modelling
4.1 Model representation
The discrete element model developed by Thoeni et al. (2013a) and the open-source framework YADE (Šmilauer et al., 2010) was used for the rockfall analysis. Thereby, the rock slope is represented by triangular elements. The surface model of the slope was created based on a point cloud which was obtained from a photogrammetric survey (Thoeni et al., 2012). Material layers and the corresponding triangular elements in the model were identified and material properties (e.g. coefficients of restitution) were assigned to each triangle.

An integrated approach for rockfall analysis with drapery systems K. Thoeni et al.
1154 Slope Stability 2013, Brisbane, Australia
The block is modelled as a rigid assembly of spheres. The interaction between the slope and the block consists of interactions between fixed triangles and dynamic spheres. Energy dissipation during impact is considered via viscous damping and friction. The drapery is represented by spherical particles which are located at the physical nodes of the double-twisted hexagonal mesh the drapery is made of. In order to model the wire behaviour of the mesh, particles are linked remotely which means interactions exist without direct contact (Thoeni et al., 2013b).
(a) (b)
V = 5.04e-5 m3
α = 10
β = 9.30
Vol.: 4.783e-3 m3
α = 10
β = 9.75
Vol.: 2.76e-3 m3
α = 3.0
β = 3.25
Vol.: 5.405e-5 m3
α = 8.50
β = 4.91
(c)
Figure 4 Block shape classification; (a) zones defining the basic shapes (after Kalenchuk et. al., 2006); (b) results for the analysed highwall where green dots indicate stable removable blocks and red diamonds indicate unstable blocks; and (c) some typical shapes of unstable blocks generated by the DFN realisations
Figure 5(a) shows a picture of the highwall considered in this study, indicating the drapery installed on the section where a portal provides access to underground operations. The highwall is about 40 m high and it dips at about 70°. The maximum width of the drapery at the top is about 12 m. The numerical representation of the same highwall is shown in Figure 5(b). The different material layers are indicated by the different colours. The drapery is represented with blue particles. A close-up view of the of the particle model for the double-twisted hexagonal wire mesh shows where the particles are located on the mesh.

Rockfall
Slope Stability 2013, Brisbane, Australia 1155
(a) (b)
Figure 5 (a) Picture of a highwall with drapery and portal entry; and (b) numerical representation of the same highwall
A calibration of the numerical model was performed by Thoeni et al. (2013a) where numerical predictions were compared to the experimental results observed by Giacomini et al. (2012a). A good agreement between the numerical predictions and experimental results was observed. Hence, the same numerical parameters (i.e. contact stiffnesses) as in Thoeni et al. (2013a) were used in this work.
4.2 Residual hazard assessment with representative blocks
The 3D numerical model was combined with the results from the structural modelling and was used to simulate rockfalls with and without drapery. Information at the base of the highwall was collected in order to evaluate the residual rockfall hazard around the portal entry. Two representative blocks were used in the simulations.
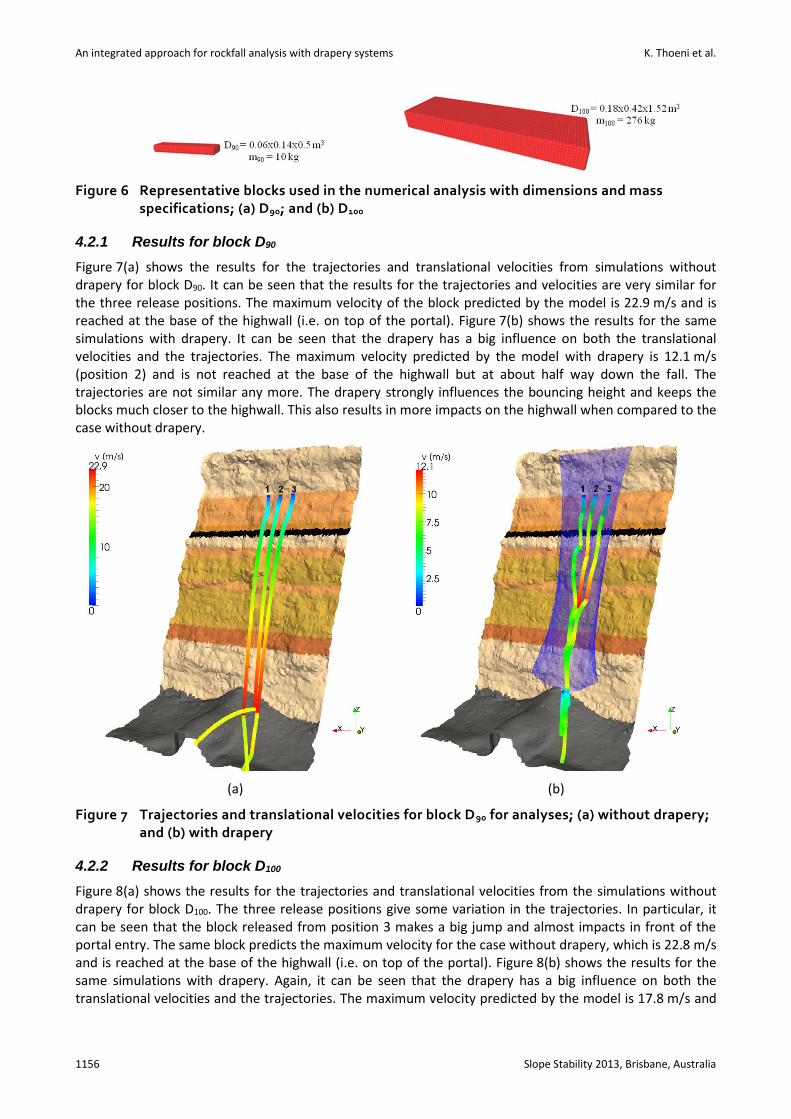
The shape analysis of the geometrically removable blocks in Section 3.4 suggested that the majority of the unstable blocks are between elongated and platy. Hence, the representative blocks are of this shape. The volume of the two blocks was adapted according to the volume distribution analysis results and corresponds to 0.004 m3 and 0.115 m3 for block D90 (Figure 6(a)) and D100 (Figure 6(b)), respectively. D100 can be considered a worst case scenario since it corresponds to the maximum block volume obtained from the polyhedral modelling results, whereas 90% of the unstable blocks have a volume lower than D90 (see dashed lines in Figure 3).
The blocks were assumed to be sandstone blocks which detach in between the highest sandstone and mudstone layer. Three different positions were chosen in order to produce some variability in the results and all blocks were released separately. The height of the release positions remained unchanged but the position was varied horizontally along the highwall. It is suggested that these configurations will give results which are representative for a residual hazard assessment. The results are discussed in the following sections where predictions without drapery are compared to predictions with drapery.
An integrated approach for rockfall analysis with drapery systems K. Thoeni et al.
1156 Slope Stability 2013, Brisbane, Australia
Figure 6 Representative blocks used in the numerical analysis with dimensions and mass specifications; (a) D90; and (b) D100
4.2.1 Results for block D90
Figure 7(a) shows the results for the trajectories and translational velocities from simulations without drapery for block D90. It can be seen that the results for the trajectories and velocities are very similar for the three release positions. The maximum velocity of the block predicted by the model is 22.9 m/s and is reached at the base of the highwall (i.e. on top of the portal). Figure 7(b) shows the results for the same simulations with drapery. It can be seen that the drapery has a big influence on both the translational velocities and the trajectories. The maximum velocity predicted by the model with drapery is 12.1 m/s (position 2) and is not reached at the base of the highwall but at about half way down the fall. The trajectories are not similar any more. The drapery strongly influences the bouncing height and keeps the blocks much closer to the highwall. This also results in more impacts on the highwall when compared to the case without drapery.
(a) (b)
Figure 7 Trajectories and translational velocities for block D90 for analyses; (a) without drapery; and (b) with drapery
4.2.2 Results for block D100
Figure 8(a) shows the results for the trajectories and translational velocities from the simulations without drapery for block D100. The three release positions give some variation in the trajectories. In particular, it can be seen that the block released from position 3 makes a big jump and almost impacts in front of the portal entry. The same block predicts the maximum velocity for the case without drapery, which is 22.8 m/s and is reached at the base of the highwall (i.e. on top of the portal). Figure 8(b) shows the results for the same simulations with drapery. Again, it can be seen that the drapery has a big influence on both the translational velocities and the trajectories. The maximum velocity predicted by the model is 17.8 m/s and

Rockfall
Slope Stability 2013, Brisbane, Australia 1157
is not reached at the base of the highwall but at about three quarters down the fall. Both translational velocities and trajectories have a big variation when comparing the three positions. The drapery strongly influences the bouncing height and keeps the blocks close to the highwall. This also causes more impacts on the highwall when compared to the case without drapery.
(a) (b)
Figure 8 Trajectories and translational velocities for block D100 for analyses; (a) without drapery; and (b) with drapery
4.2.3 Residual hazard
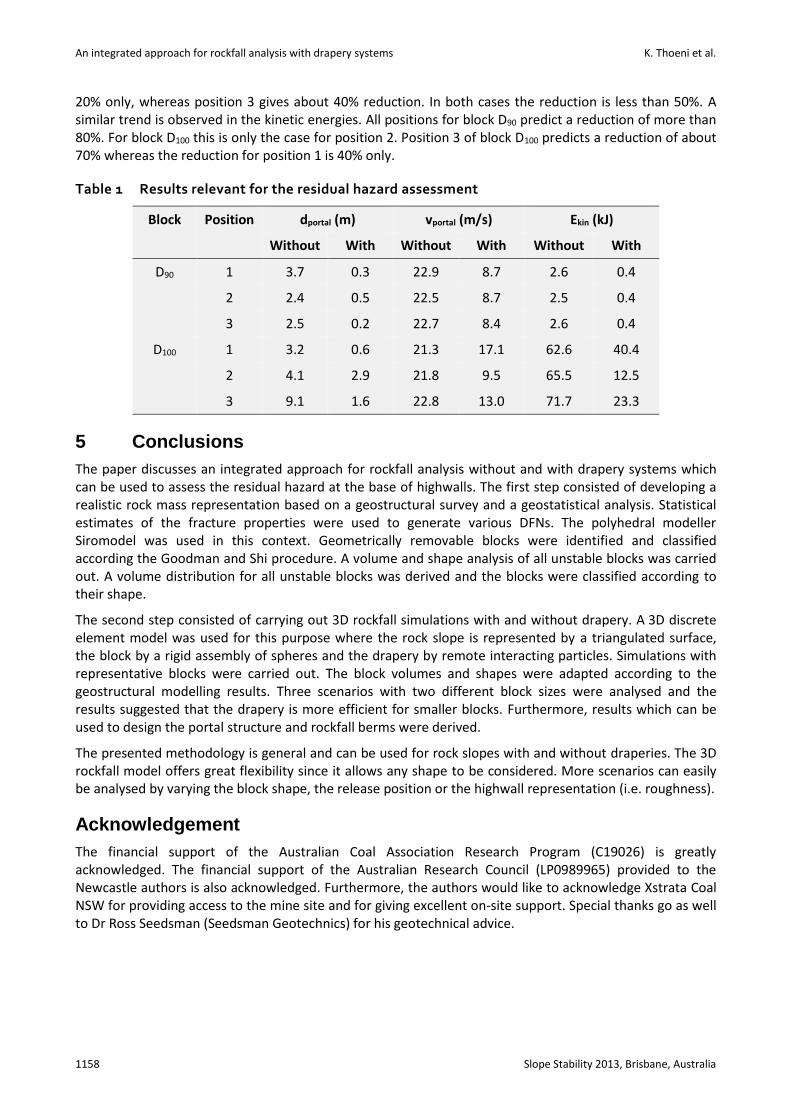
In order to assess the residual hazard at the base of the highwall the results without drapery are compared to the results with drapery. The relevant results for the hazard assessment, which include the translational velocity on top of the portal vportal and the horizontal distance dportal measured from the base of the highwall at the top of the portal to the impact point, are summarised in Table 1. The latter is important for a hazard assessment since it usually defines the length of the portal and the locations of the rockfall berms. The kinetic energy reached at the top of the portal is calculated as:
𝐸𝑘𝑖𝑛 =1
2𝑚𝑣2 (1)
Where m is the mass of the block and v the translational velocity. This value is commonly used to design the portal structure.
As indicated in the previous sections the drapery drastically decreases the bouncing height or horizontal distance dportal and keeps the blocks close to the highwall. The model predicts a reduction of 80% or more for all simulations except position 2 of block D100. The latter has a reduction of 30% only. Furthermore, it can be seen that in the case of position 3 for block D100 the drapery was very efficient. Without drapery the block is almost impacting in front of the portal whereas this is not the case with drapery.
The velocities vportal for the analyses without drapery do not have a big variation and even the values for block D90 and D100 are very similar. This behaviour changes in the case for the analyses with drapery. It can be seen that the velocities for block D90 are drastically reduced to more or less the same value. The model predicts a reduction of the velocity from about 22.7 to 8.6 m/s. This corresponds to a reduction of more than 60%. No similar trend can be observed for block D100. The predictions for position 2 give a similar reduction as in the case of D90 but this is not the case for positions 1 and 3. Position 1 gives a reduction of
An integrated approach for rockfall analysis with drapery systems K. Thoeni et al.
1158 Slope Stability 2013, Brisbane, Australia
20% only, whereas position 3 gives about 40% reduction. In both cases the reduction is less than 50%. A similar trend is observed in the kinetic energies. All positions for block D90 predict a reduction of more than 80%. For block D100 this is only the case for position 2. Position 3 of block D100 predicts a reduction of about 70% whereas the reduction for position 1 is 40% only.
Table 1 Results relevant for the residual hazard assessment
Block Position dportal (m) vportal (m/s) Ekin (kJ)
Without With Without With Without With
D90 1 3.7 0.3 22.9 8.7 2.6 0.4
2 2.4 0.5 22.5 8.7 2.5 0.4
3 2.5 0.2 22.7 8.4 2.6 0.4
D100 1 3.2 0.6 21.3 17.1 62.6 40.4
2 4.1 2.9 21.8 9.5 65.5 12.5
3 9.1 1.6 22.8 13.0 71.7 23.3
5 Conclusions
The paper discusses an integrated approach for rockfall analysis without and with drapery systems which can be used to assess the residual hazard at the base of highwalls. The first step consisted of developing a realistic rock mass representation based on a geostructural survey and a geostatistical analysis. Statistical estimates of the fracture properties were used to generate various DFNs. The polyhedral modeller Siromodel was used in this context. Geometrically removable blocks were identified and classified according the Goodman and Shi procedure. A volume and shape analysis of all unstable blocks was carried out. A volume distribution for all unstable blocks was derived and the blocks were classified according to their shape.
The second step consisted of carrying out 3D rockfall simulations with and without drapery. A 3D discrete element model was used for this purpose where the rock slope is represented by a triangulated surface, the block by a rigid assembly of spheres and the drapery by remote interacting particles. Simulations with representative blocks were carried out. The block volumes and shapes were adapted according to the geostructural modelling results. Three scenarios with two different block sizes were analysed and the results suggested that the drapery is more efficient for smaller blocks. Furthermore, results which can be used to design the portal structure and rockfall berms were derived.
The presented methodology is general and can be used for rock slopes with and without draperies. The 3D rockfall model offers great flexibility since it allows any shape to be considered. More scenarios can easily be analysed by varying the block shape, the release position or the highwall representation (i.e. roughness).
Acknowledgement
The financial support of the Australian Coal Association Research Program (C19026) is greatly acknowledged. The financial support of the Australian Research Council (LP0989965) provided to the Newcastle authors is also acknowledged. Furthermore, the authors would like to acknowledge Xstrata Coal NSW for providing access to the mine site and for giving excellent on-site support. Special thanks go as well to Dr Ross Seedsman (Seedsman Geotechnics) for his geotechnical advice.
Rockfall
Slope Stability 2013, Brisbane, Australia 1159
References
Abbruzzese, J.M., Sauthier, C. and Labiouse, V. (2009) Considerations on Swiss methodologies for rock fall hazard mapping based on trajectory modelling, Natural Hazards and Earth System Sciences, European Geosciences Union, Vol. 9(4), pp. 1095–1109.
Agliardi, F. and Crosta, G.B. (2003) High resolution three-dimensional numerical modelling of rockfalls, International Journal of Rock Mechanics and Mining Sciences, Elsevier, Vol. 40(4), pp. 455–471.
Alejano, L., Pons, B., Bastante, F., Alonso, E. and Stockhausen, H. (2007) Slope geometry design as a means for controlling rockfalls in quarries, International Journal of Rock Mechanics and Mining Sciences, Elsevier, Vol. 44(6), pp. 903–921.
Alejano, L., Stockhausen, H., Alonso, E., Bastante, F. and Ramírez-Oyanguren, P. (2008) ROFRAQ: A statistics-based empirical method for assessing accident risk from rockfalls in quarries, International Journal of Rock Mechanics and Mining Sciences, Elsevier, Vol. 45(8), pp. 1252–1272.
CAE Mining (2013) Sirovision Version 5.1, mapping and analysis system, http://sirovision.com. Cundall, P.A. and Strack, O.D.L. (1979) A discrete numerical model for granular assemblies, Géotechnique, Vol. 29(1), pp. 47–65. Dorren, L.K.A. (2003) A review of rockfall mechanics and modelling approaches, Progress in Physical Geography, Sage Publications,
Vol. 27(1), pp. 69–87. Elmouttie, M., Poropat, G. and Krähenbühl, G. (2010) Polyhedral modelling of rock mass structure, International Journal of Rock
Mechanics and Mining Sciences, Elsevier, Vol. 47(4), pp. 544–552. Elmouttie, M. and Poropat, G. (2011) A method to estimate in situ block size distribution, Rock Mechanics and Rock Engineering,
Elsevier, Vol. 37, pp. 529–535. Giacomini, A., Thoeni, K., Lambert, C., Booth, S. and Sloan, S.W. (2012a) Experimental study on rockfall drapery systems for open pit
highwalls, International Journal of Rock Mechanics and Mining Sciences, Elsevier, Vol. 56, pp. 171–181. Giacomini, A., Lambert, C. and Thoeni, K. (2012b) Improved management of the rock fall hazard at the base of the highwalls, Tech.
Rep. ACARP C19026, Australian Coal Association Research Program. Giani, G.P. (1992) Rock Slope Stability Analysis, Chap. 7, A.A. Balkema, pp. 191–208. Goodman, R.E. and Shi, G. (1985) Block theory and its application to rock engineering, Prentice-Hall, New Jersey, USA. Haneberg, W. (2008) Using close range terrestrial digital photogrammetry for 3-d rock slope modeling and discontinuity mapping in
the United States, Bulletin of Engineering Geology and the Environment, Springer, Vol. 67(4), pp. 457–469. Jaboyedoff, M. (2005) An attempt to refine rockfall hazard zoning based on the kinetic energy, frequency and fragmentation
degree, Natural Hazards and Earth System Sciences, European Geosciences Union, Vol. 5, pp. 621–632. Kalenchuk, K.S., Diederichs, M.S. and McKinnon, S. (2006) Characterizing block geometry in jointed rockmasses, International
Journal of Rock Mechanics and Mining Sciences, Elsevier, Vol. 43(8), pp. 1212–1225. Lambert, C., Thoeni, K., Giacomini, A., Casagrande, D. and Sloan, S.W. (2012) Rockfall hazard analysis from discrete fracture
network modelling with finite persistence discontinuities, Rock Mechanics and Rock Engineering, Elsevier, Vol. 45(5), pp. 871–884.
Pfeiffer, T.J. and Bowen, T. (1989) Computer simulation of rock-falls, Bulletin of the Association of Engineering Geologists, Springer, Vol. 26 (1), pp. 135–146.
Šmilauer, V., Catalano, E., Chareyre, B., Dorofenko, S., Duriez, J., Gladky, A., Kozicki, J., Modenese, C., Scholtès, L., Sib ille, L., Stránskỳ, J. and Thoeni, K. (2010) Yade Documentation, The Yade Project, 1st edition, viewed 10 July 2013, http://yade-dem.org/doc/.
Sturzenegger, M. and Stead, D. (2009) Close-range terrestrial digital photogrammetry and terrestrial laser scanning for discontinuity characterization on rock cuts, Engineering Geology, Elsevier, Vol. 106(3-4), pp. 163–182.
Sturzenegger, M., Stead, D. and Elmo, D. (2011) Terrestrial remote sensing-based estimation of mean trace length, trace intensity and block size/shape, Engineering Geology, Elsevier, Vol. 119(3-4), pp. 96–111.
Thoeni, K., Giacomini, A., Sloan, S.W., Lambert, C. and Casagrande, D. (2011) Numerical analysis of rockfall hazard in open pit coal mines, in Proceeding Computer Methods for Geomechanics: Frontiers and New Application, International Conference of the International Association for Computer Methods and Advances in Geomechanics, N. Khalili and M. Oeser (eds), 9–13 May 2011, Melbourne, Australia, International Association for Computer Methods and Advances in Geomechanics, Tucson, Vol. 2, pp. 1151–1156.
Thoeni, K., Irschara, A. and Giacomini, A. (2012) Efficient photogrammetric reconstruction of highwalls in open pit coal mines, in Proceedings 16th Australian Remote Sensing and Photogrammetry Conference, 27–28 August 2012, Melbourne, Australia, Remote Sensing and Photogrammetry Commission, Deakin West, pp. 85–90.
Thoeni, K., Giacomini, A., Lambert, C., Sloan, S.W. and Carter, J.P. (2013a) A 3D discrete element modelling approach for rockfall analysis with drapery systems, International Journal of Rock Mechanics and Mining Sciences, Elsevier, submitted (IJRMMS−S-13-00201).
Thoeni, K., Lambert, C., Giacomini, A. and Sloan, S.W. (2013b) Discrete modelling of hexagonal wire meshes with a stochastically distorted contact model, Computers and Geotechnics, Elsevier, Vol. 49, pp. 158–169.
Turner, A.K. and Schuster, R.L. (2012) Rockfall: Characterization and Control, Transportation Research Board, Washington, D.C., 658 p.
Volkwein, A., Schellenberg, K., Labiouse, V., Agliardi, F., Berger, F., Bourrier, F., Dorren, L.K.A., Gerber, W. and Jaboyedoff, M. (2011) Rockfall characterization and structural protection – a review, Natural Hazards and Earth System Sciences, European Geosciences Union, Vol. 11, pp. 2617–2651.

An integrated approach for rockfall analysis with drapery systems K. Thoeni et al.
1160 Slope Stability 2013, Brisbane, Australia