Embed Size (px)
Citation preview
1
AN INTEGRATED APPROACH TO E-GOVERNANCE,
E-PARTICIPATION AND POLICY MODELLING
www.fupol.eu
www.facebook.com/fupol
www.facebook.com/fupol
www.facebook.com/fupol
www.youtube.com/fupoltv
2
Inhalt
1. FUTURE POLICY MODELLING (FUPOL) IN BRIEF ........................................ 4
2. FUPOL BENEFITS ..................................................................................... 4
3. THE INTEGRATED FUPOL APPROACH ........................................................ 5
4. The Policy Lifecycle .................................................................................. 6
5. The ICT Features ..................................................................................... 6
5.1 Data Integration and Storage.................................................................... 6
Description .................................................................................................... 6
Business Value .............................................................................................. 8
5.2 Unified Integrated User Interface .............................................................. 8
Description .................................................................................................... 8
Business Value .............................................................................................. 8
5.3 Policy Indicator Dashboard ....................................................................... 9
Description .................................................................................................... 9
Business Value .............................................................................................. 9
5.4 Social Network Aggregation and Single Window Display ............................. 9
Description .................................................................................................... 9
Business Value .............................................................................................. 9
5.5 Hot Topic Sensing and Topic Summarization ............................................ 10
Description .................................................................................................. 10
Business Value ............................................................................................ 10
5.6 Community Feedback Platform ................................................................ 10
Description .................................................................................................. 10
3
Business Value ............................................................................................ 11
5.7 Visualization of Statistical Data ................................................................ 11
Description .................................................................................................. 11
Business Value ............................................................................................ 13
5.8 Visual Social Data Analysis ...................................................................... 14
Description .................................................................................................. 14
Business Value ............................................................................................ 14
5.9 FUPOL Knowledge Database and Visualization ......................................... 15
Description .................................................................................................. 15
Business Value ............................................................................................ 15
5.10 Outgoing Multichannel Social Media Single Window Messaging .............. 16
Description .................................................................................................. 16
Business Value ............................................................................................ 16
5.11 Opinion Maps ...................................................................................... 16
Description .................................................................................................. 16
Business Value ............................................................................................ 17
5.12 Simulation and Impact Visualization ..................................................... 17
Description .................................................................................................. 17
Business Value ............................................................................................ 19
5.13 Visual Fuzzy Cognitive Map .................................................................. 19
Description .................................................................................................. 19
Business Value ............................................................................................ 20
4
1. FUTURE POLICY MODELLING (FUPOL) IN BRIEF
FUPOL is a research project funded by the 7th framework program of the European
Union with a budget of 9 Mio Euro. Its main research focus are new technologies and
methods for e-governance, e-participation and policy modeling.
The FUPOL consortium consists of 17 partners from 9 countries and comprises
innovative multinational companies, leading research institutes, high-level political
organizations as well as strong pilot partners. It has a good balance of research
partners, IT-industry, governmental partners and political cluster organizations
capable to ensure wide-spread dissemination.
2. FUPOL BENEFITS
The FUPOL has major benefits for:
• Politicians
• Civil servants
• Citizens
• Enterprises
It supports governments in
Gaining a better understanding of the citizen´s needs and businesses
activities
Getting direct feedback from all political stakeholders through multi-channel
social network analysis based on the communication between politicians and
citizens
Predicting the impacts of policy measures leading to a more efficient
implementation of government policies
Taking better decisions based on forecasts regarding the potential impact of
political decisions
Achieving a High-level engagement of citizens and a wider use of ICT
tools resulting in a higher innovation potential related to the interaction of
citizens with their respective governments.
5
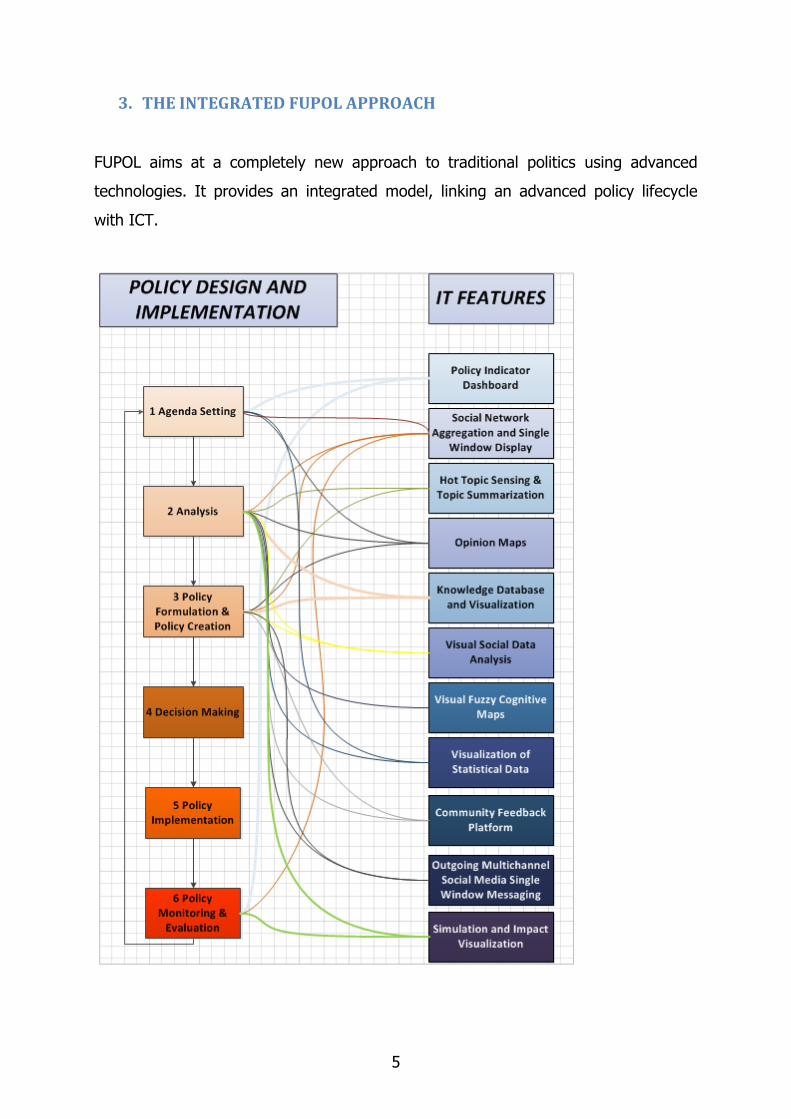
3. THE INTEGRATED FUPOL APPROACH
FUPOL aims at a completely new approach to traditional politics using advanced
technologies. It provides an integrated model, linking an advanced policy lifecycle
with ICT.
6
4. The Policy Lifecycle
The major steps of the policy lifecycle are:
1. Agenda setting: establishing the need for a policy or a change in policy
and defining what the problem to be addressed is.
2. Analysis: defining the challenges and opportunities associated with an
agenda item more clearly in order to produce a draft policy document.
3. Creating the policy: ensuring a good workable policy document. This
involves a variety of mechanisms which can include: formal
consultation, risk analysis, undertaking pilot studies, and designing the
implementation plan.
4. Policy decision making:
5. Implementing the policy: this involves the development of legislation,
regulation, guidance, and a delivery plan.
6. Monitoring the policy: this encompasses evaluation and review of the
policy in action, research evidence and views of users. Afterwards there
is the possibility to loop back to stage one
This model has been enhanced in FUPOL with three components:
1. A detailed description of the subtasks in each stage
2. A subtask - technology assignment: This refers to the business process and
the usage of certain technologies in each step.
3. The added value created by using the technology
5. The ICT Features
5.1 Data Integration and Storage
Description
One of the most important features of the FUPOL Core Platform is that it provides
access to a comprehensive set of data. This includes...
statistical data from various sources (Eurostat, regional/local data,...)
semantic data - mainly from social media
geographical data
knowledge data
7
operational data (user accounts, user activity data, clients, journals, ...)
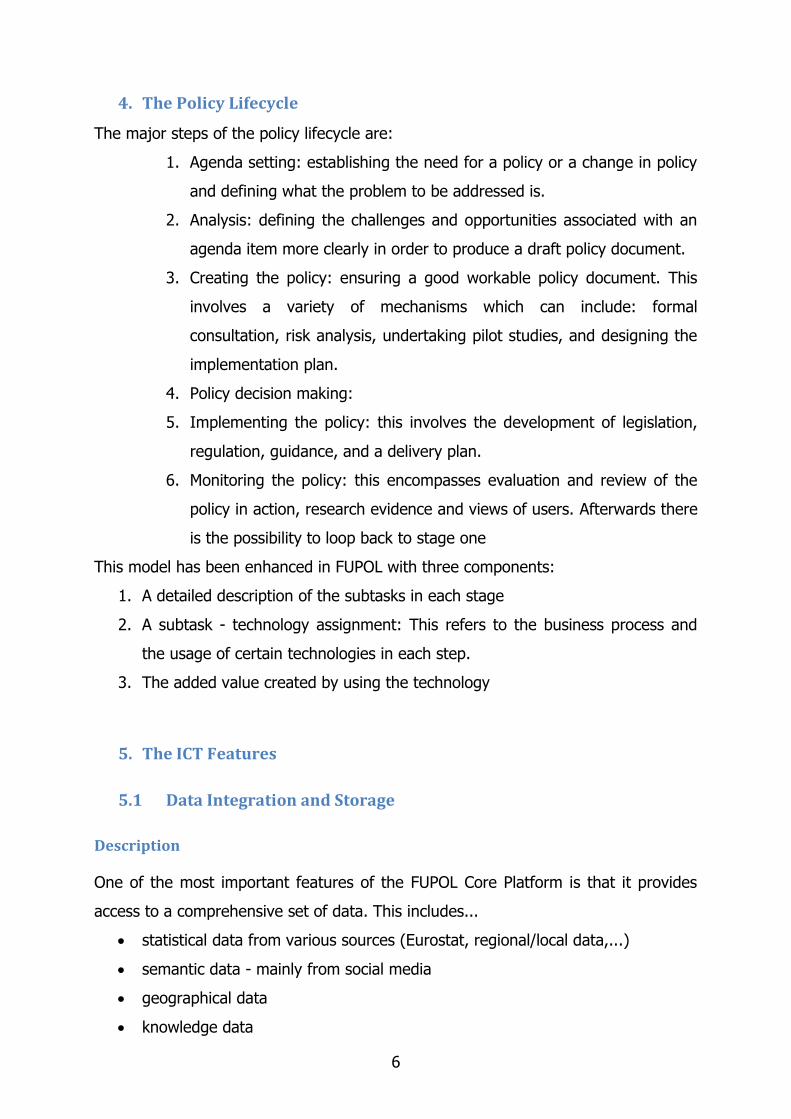
All this data are stored by the FUPOL Core Platform and made accessible to all tools
that might require it (reading and writing).
The following diagram illustrates the various sources and users of data:
The FUPOL Core Platform acting as a multi-purpose data store provides the ability to
store-and-forward data between the modules. As we use the same underlying logical
structure for all data (i.e. the same ontology for all social media content) data
exchange between the modules is supported. For example ...
the idea management system can be fed with ideas originating from
Facebook, Twitter, Sina Weibo, Blogs, Emails etc. at the same time - following
our principle of multi-channel social media communication
simulators will be provided statistical data to set their boundary conditions,
geographical data (i.e. manually imported from local GIS data) and user data,
generating new geographical data (i.e. a map representing the state of the
city in 5 years) and statistical data (i.e. the development of the city's CO2
emissions over the next five years)
all data can be dragged into the visualization module and browsed in order to
get a better understanding of the information behind it
8
statistical data can be exported to Excel, edited and imported again in order to
use it as input for the next simulation cycle
...and much more
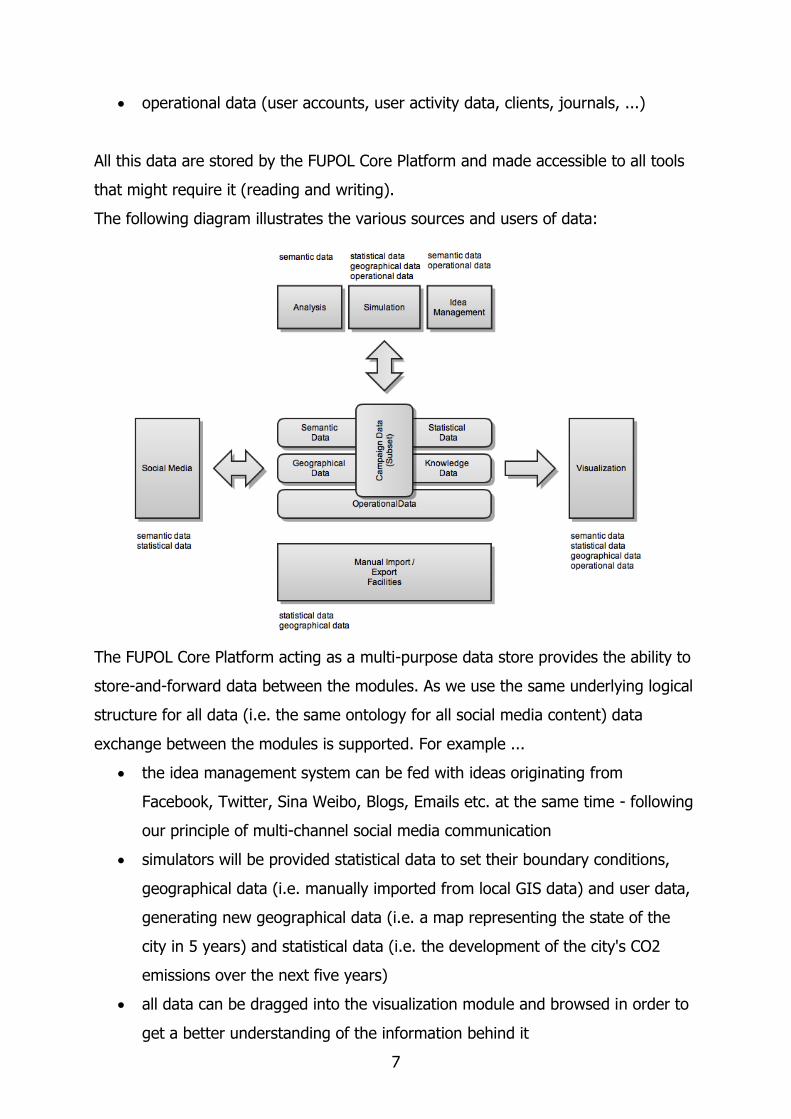
Business Value
The central repository integrates data from multiple source systems and ensures
data consistency across all steps of the policy lifecycle. It provides a single common
data model for all data of interest regardless of the data's source. Data generated in
one policy lifecycle process are used for the next step.
It also supports the improvement of data quality, by providing consistent codes and
descriptions, flagging or even fixing bad data.
5.2 Unified Integrated User Interface
Description
User interface integration in FUPOIL means that two applications are integrated so
that a user can carry out an operation that involves two different applications –
without having to take into account that he or she is actually running two
applications.
Business Value
The FUPOL Unified Integrated User Interface has two major benefits
a) “Unified Look and Feel”
b) Single sign on to all applications
This simplifies the use of the system and improves security through a centralized
authentication.
9
5.3 Policy Indicator Dashboard
Description
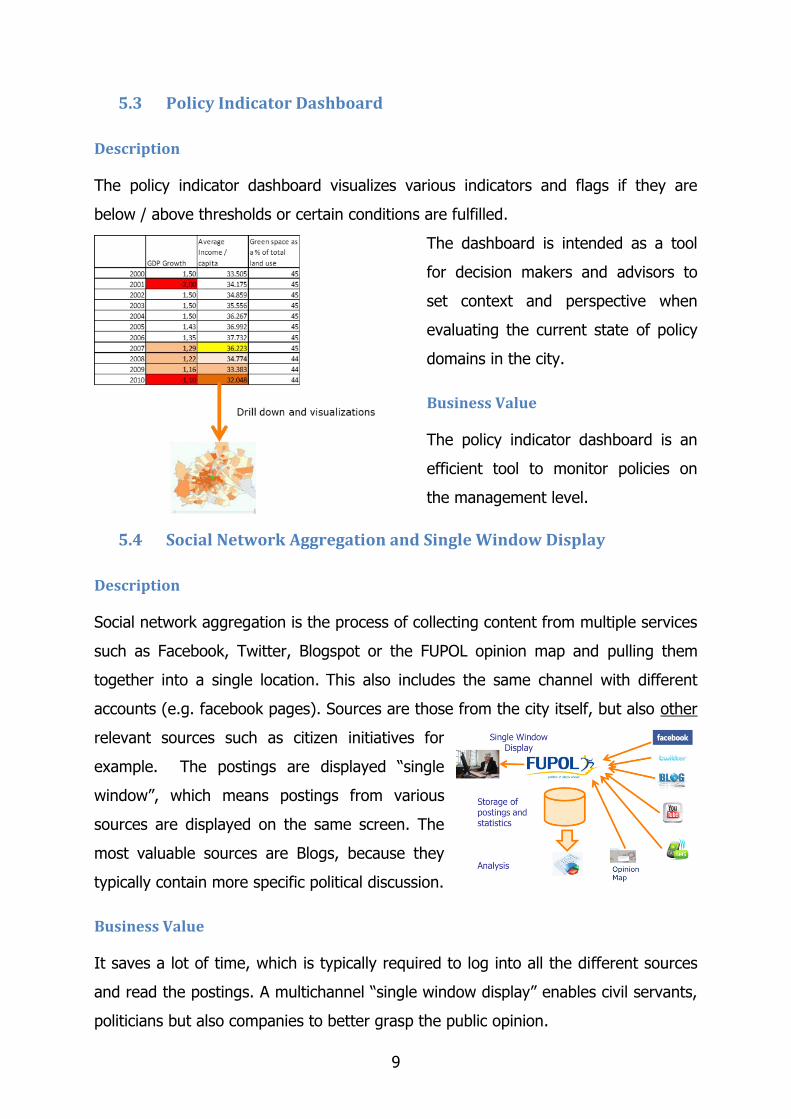
The policy indicator dashboard visualizes various indicators and flags if they are
below / above thresholds or certain conditions are fulfilled.
The dashboard is intended as a tool
for decision makers and advisors to
set context and perspective when
evaluating the current state of policy
domains in the city.
Business Value
The policy indicator dashboard is an
efficient tool to monitor policies on
the management level.
5.4 Social Network Aggregation and Single Window Display
Description
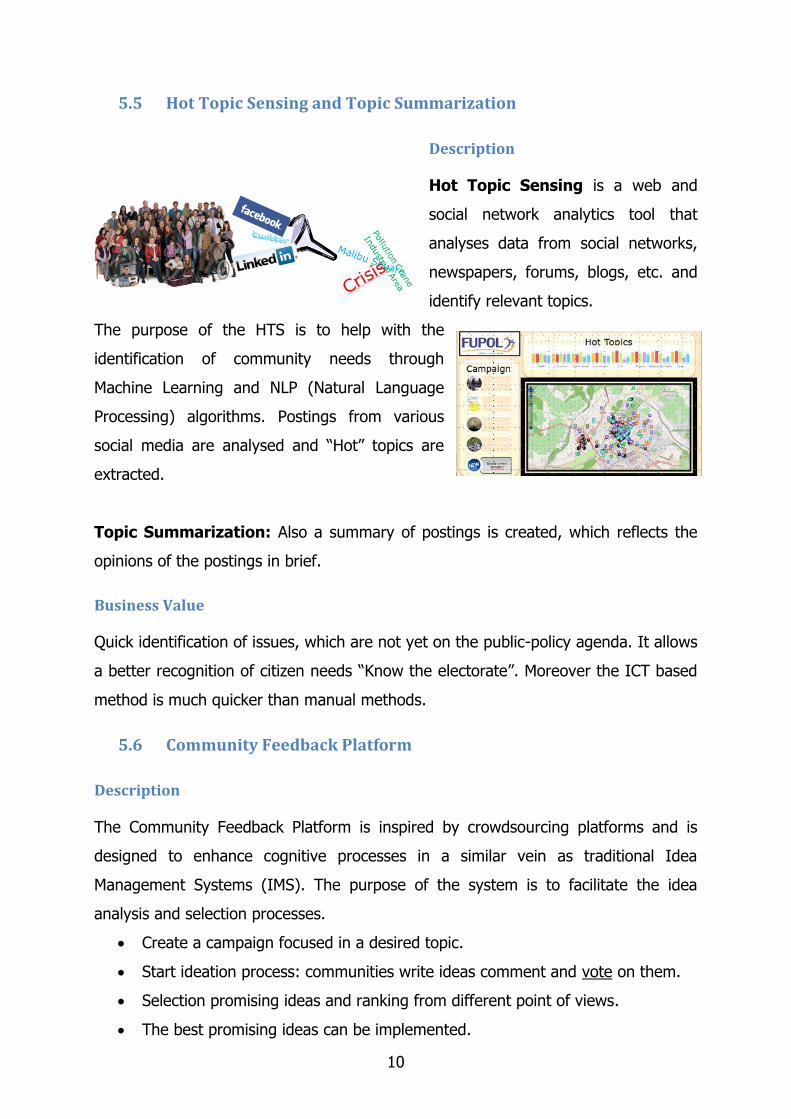
Social network aggregation is the process of collecting content from multiple services
such as Facebook, Twitter, Blogspot or the FUPOL opinion map and pulling them
together into a single location. This also includes the same channel with different
accounts (e.g. facebook pages). Sources are those from the city itself, but also other
relevant sources such as citizen initiatives for
example. The postings are displayed “single
window”, which means postings from various
sources are displayed on the same screen. The
most valuable sources are Blogs, because they
typically contain more specific political discussion.
Business Value
It saves a lot of time, which is typically required to log into all the different sources
and read the postings. A multichannel “single window display” enables civil servants,
politicians but also companies to better grasp the public opinion.
10
5.5 Hot Topic Sensing and Topic Summarization
Description
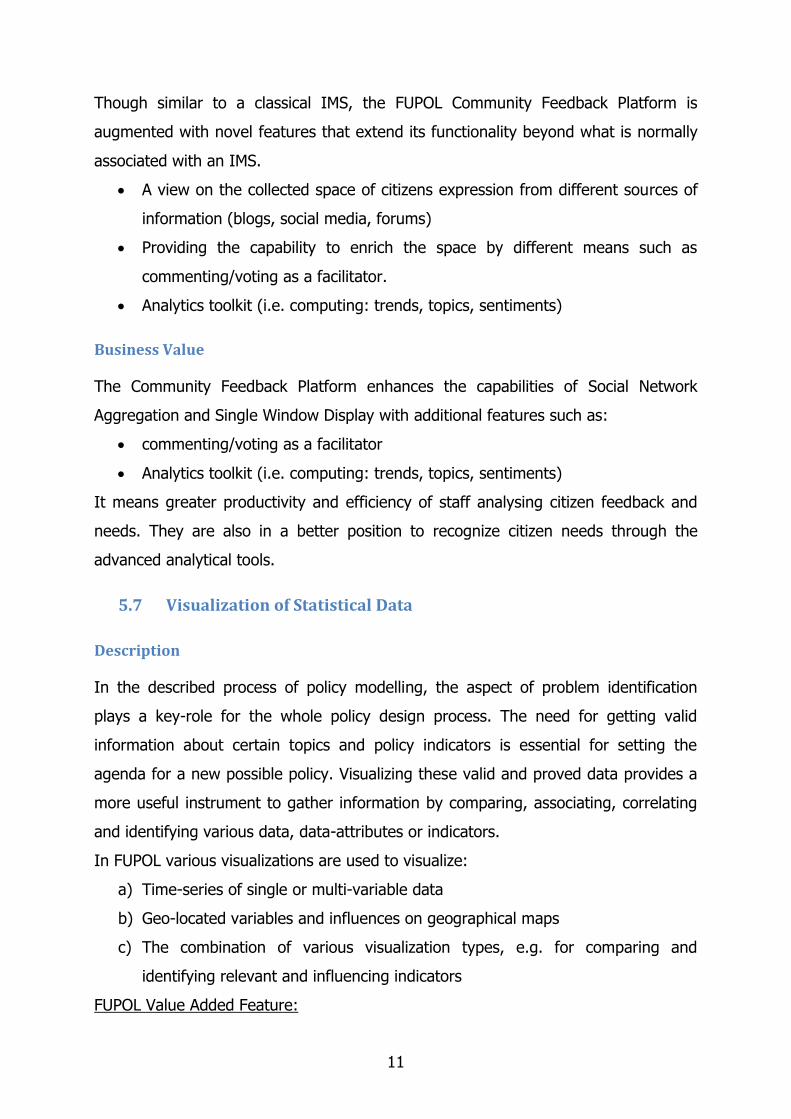
Hot Topic Sensing is a web and
social network analytics tool that
analyses data from social networks,
newspapers, forums, blogs, etc. and
identify relevant topics.
The purpose of the HTS is to help with the
identification of community needs through
Machine Learning and NLP (Natural Language
Processing) algorithms. Postings from various
social media are analysed and “Hot” topics are
extracted.
Topic Summarization: Also a summary of postings is created, which reflects the
opinions of the postings in brief.
Business Value
Quick identification of issues, which are not yet on the public-policy agenda. It allows
a better recognition of citizen needs “Know the electorate”. Moreover the ICT based
method is much quicker than manual methods.
5.6 Community Feedback Platform
Description
The Community Feedback Platform is inspired by crowdsourcing platforms and is
designed to enhance cognitive processes in a similar vein as traditional Idea
Management Systems (IMS). The purpose of the system is to facilitate the idea
analysis and selection processes.
Create a campaign focused in a desired topic.
Start ideation process: communities write ideas comment and vote on them.
Selection promising ideas and ranking from different point of views.
The best promising ideas can be implemented.
11
Though similar to a classical IMS, the FUPOL Community Feedback Platform is
augmented with novel features that extend its functionality beyond what is normally
associated with an IMS.
A view on the collected space of citizens expression from different sources of
information (blogs, social media, forums)
Providing the capability to enrich the space by different means such as
commenting/voting as a facilitator.
Analytics toolkit (i.e. computing: trends, topics, sentiments)
Business Value
The Community Feedback Platform enhances the capabilities of Social Network
Aggregation and Single Window Display with additional features such as:
commenting/voting as a facilitator
Analytics toolkit (i.e. computing: trends, topics, sentiments)
It means greater productivity and efficiency of staff analysing citizen feedback and
needs. They are also in a better position to recognize citizen needs through the
advanced analytical tools.
5.7 Visualization of Statistical Data
Description
In the described process of policy modelling, the aspect of problem identification
plays a key-role for the whole policy design process. The need for getting valid
information about certain topics and policy indicators is essential for setting the
agenda for a new possible policy. Visualizing these valid and proved data provides a
more useful instrument to gather information by comparing, associating, correlating
and identifying various data, data-attributes or indicators.
In FUPOL various visualizations are used to visualize:
a) Time-series of single or multi-variable data
b) Geo-located variables and influences on geographical maps
c) The combination of various visualization types, e.g. for comparing and
identifying relevant and influencing indicators
FUPOL Value Added Feature:
12
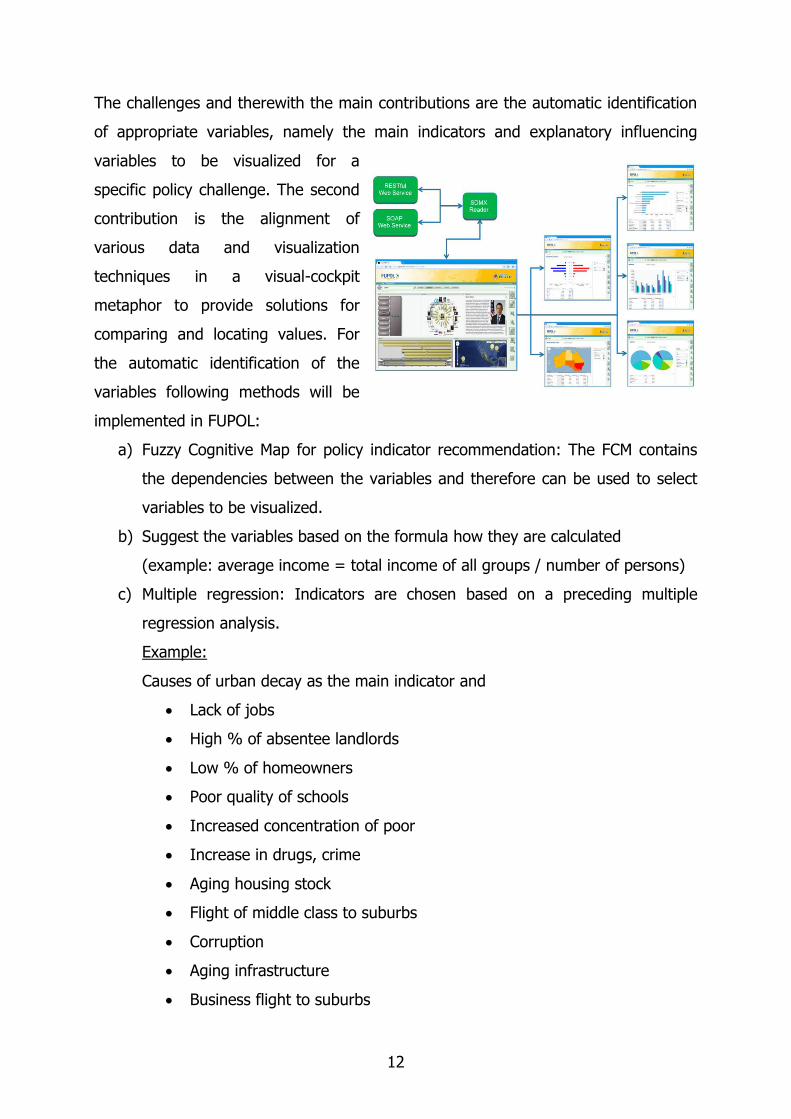
The challenges and therewith the main contributions are the automatic identification
of appropriate variables, namely the main indicators and explanatory influencing
variables to be visualized for a
specific policy challenge. The second
contribution is the alignment of
various data and visualization
techniques in a visual-cockpit
metaphor to provide solutions for
comparing and locating values. For
the automatic identification of the
variables following methods will be
implemented in FUPOL:
a) Fuzzy Cognitive Map for policy indicator recommendation: The FCM contains
the dependencies between the variables and therefore can be used to select
variables to be visualized.
b) Suggest the variables based on the formula how they are calculated
(example: average income = total income of all groups / number of persons)
c) Multiple regression: Indicators are chosen based on a preceding multiple
regression analysis.
Example:
Causes of urban decay as the main indicator and
Lack of jobs
High % of absentee landlords
Low % of homeowners
Poor quality of schools
Increased concentration of poor
Increase in drugs, crime
Aging housing stock
Flight of middle class to suburbs
Corruption
Aging infrastructure
Business flight to suburbs
13
Out of the variables those with a high correlation to urban decay are selected to be
visualized together
Lack of jobs
Low % of homeowners
Poor quality of schools
Increase in drugs, crime
Aging infrastructure
d) Expert Model: Recommendation of variables based on the usage behaviour
(variable choice) of assigned and valid experts. Variables are suggested
based on previous user choices.
This means that the “menu” driven approach is registered and used to
propose the joint visualization of variables
e) Manual "Menu driven" approach: Variables are selected manually using a
“menu”. The menu-approach provides a facetted search technique.
f) Semantic Analysis (quantitative):
Statistics for variables appearing together in a text are automatically linked in
a statistical visualization.
Business Value
The various methods support users to select the variables really influencing the main
indicator used to measure the intended impact of a certain policy. Currently this is
done manually. Visualization means a cost reduction, because it enables stakeholders
to evaluate data quicker leading to resource rationalisation, greater productivity and
efficiency. The combined visualization techniques provide a more time-efficient
solving of comparative problem identifications. Moreover the automatic selection
transfers some “implicit” knowledge to the users, which they may not have before.
14
5.8 Visual Social Data Analysis
Description
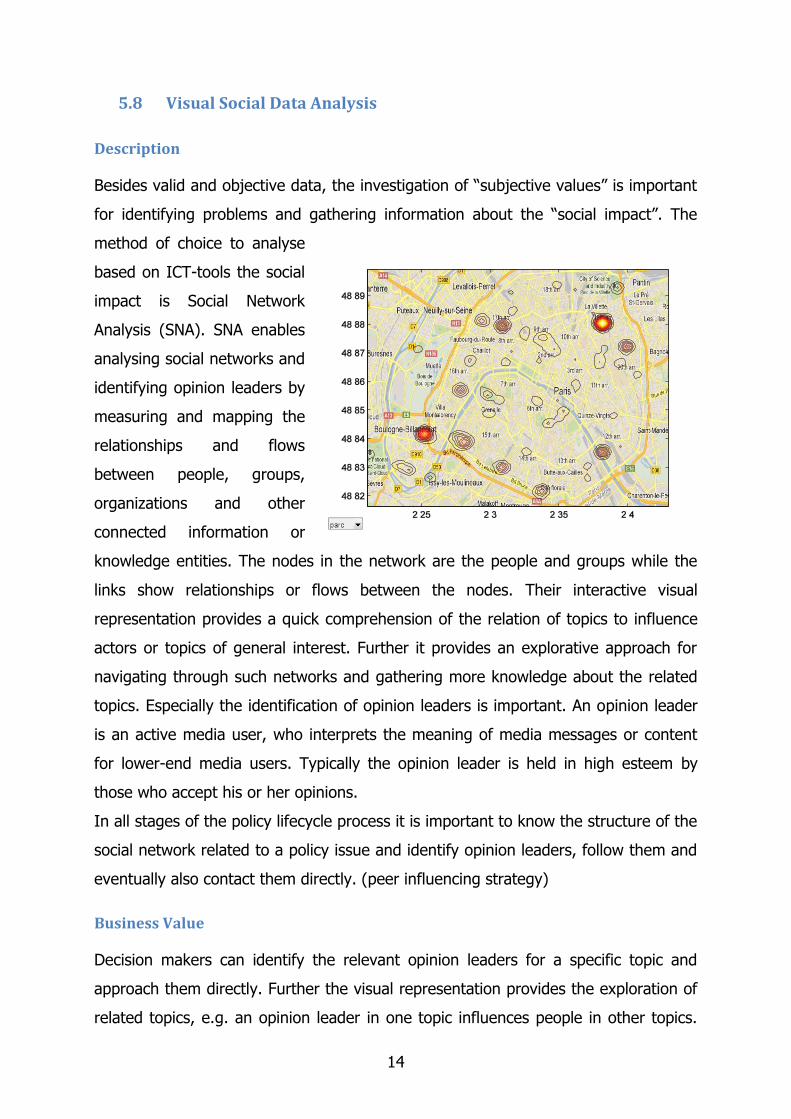
Besides valid and objective data, the investigation of “subjective values” is important
for identifying problems and gathering information about the “social impact”. The
method of choice to analyse
based on ICT-tools the social
impact is Social Network
Analysis (SNA). SNA enables
analysing social networks and
identifying opinion leaders by
measuring and mapping the
relationships and flows
between people, groups,
organizations and other
connected information or
knowledge entities. The nodes in the network are the people and groups while the
links show relationships or flows between the nodes. Their interactive visual
representation provides a quick comprehension of the relation of topics to influence
actors or topics of general interest. Further it provides an explorative approach for
navigating through such networks and gathering more knowledge about the related
topics. Especially the identification of opinion leaders is important. An opinion leader
is an active media user, who interprets the meaning of media messages or content
for lower-end media users. Typically the opinion leader is held in high esteem by
those who accept his or her opinions.
In all stages of the policy lifecycle process it is important to know the structure of the
social network related to a policy issue and identify opinion leaders, follow them and
eventually also contact them directly. (peer influencing strategy)
Business Value
Decision makers can identify the relevant opinion leaders for a specific topic and
approach them directly. Further the visual representation provides the exploration of
related topics, e.g. an opinion leader in one topic influences people in other topics.
15
With the visual representation the processes of information acquisition and finding
relations are more efficient.
5.9 FUPOL Knowledge Database and Visualization
Description
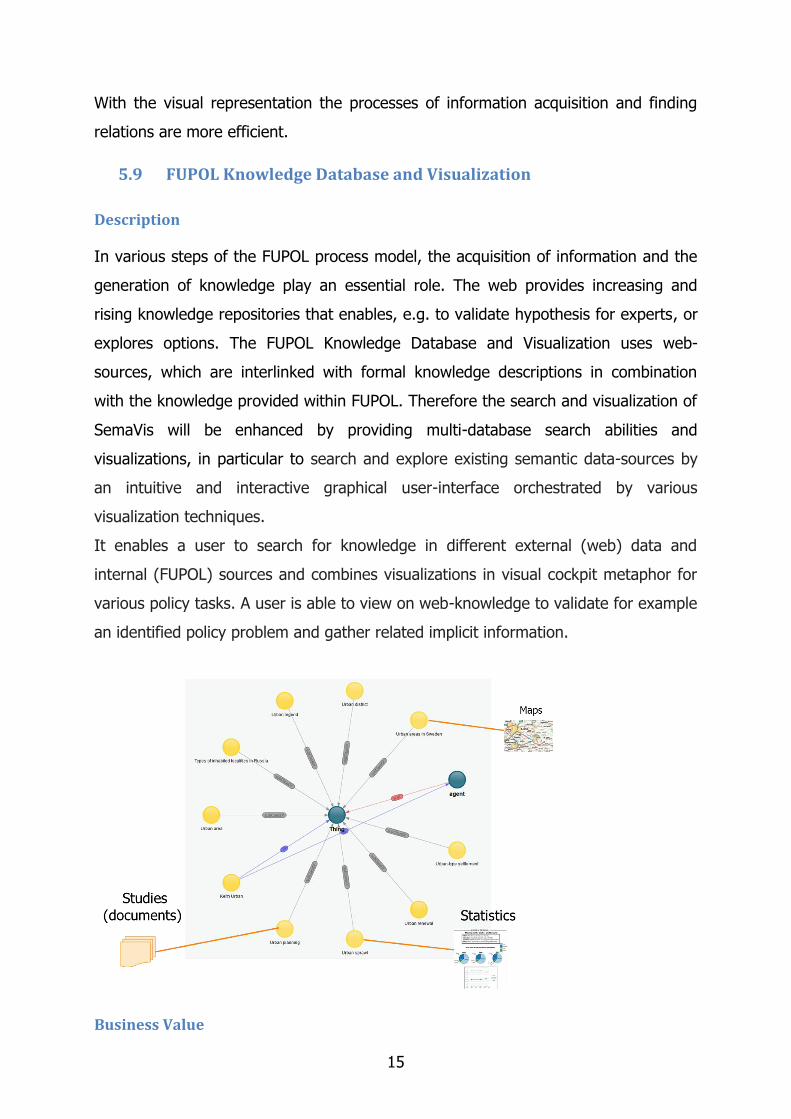
In various steps of the FUPOL process model, the acquisition of information and the
generation of knowledge play an essential role. The web provides increasing and
rising knowledge repositories that enables, e.g. to validate hypothesis for experts, or
explores options. The FUPOL Knowledge Database and Visualization uses web-
sources, which are interlinked with formal knowledge descriptions in combination
with the knowledge provided within FUPOL. Therefore the search and visualization of
SemaVis will be enhanced by providing multi-database search abilities and
visualizations, in particular to search and explore existing semantic data-sources by
an intuitive and interactive graphical user-interface orchestrated by various
visualization techniques.
It enables a user to search for knowledge in different external (web) data and
internal (FUPOL) sources and combines visualizations in visual cockpit metaphor for
various policy tasks. A user is able to view on web-knowledge to validate for example
an identified policy problem and gather related implicit information.
Business Value
16
The visual knowledge database of FUPOL provides a visual search ability for proving
the given information and compare to the web-knowledge. The visualization
decreases the time-effort of search and exploration and provides an efficient tool for
the increasing amount of linked open data. Further the comparison to internal
knowledge databases (e.g. FUPOL or other cities) enables in a visual manner a
comprehensible view on relevant topics. It enhances the FUPOL process model with
open web-data.
5.10 Outgoing Multichannel Social Media Single Window Messaging
Description
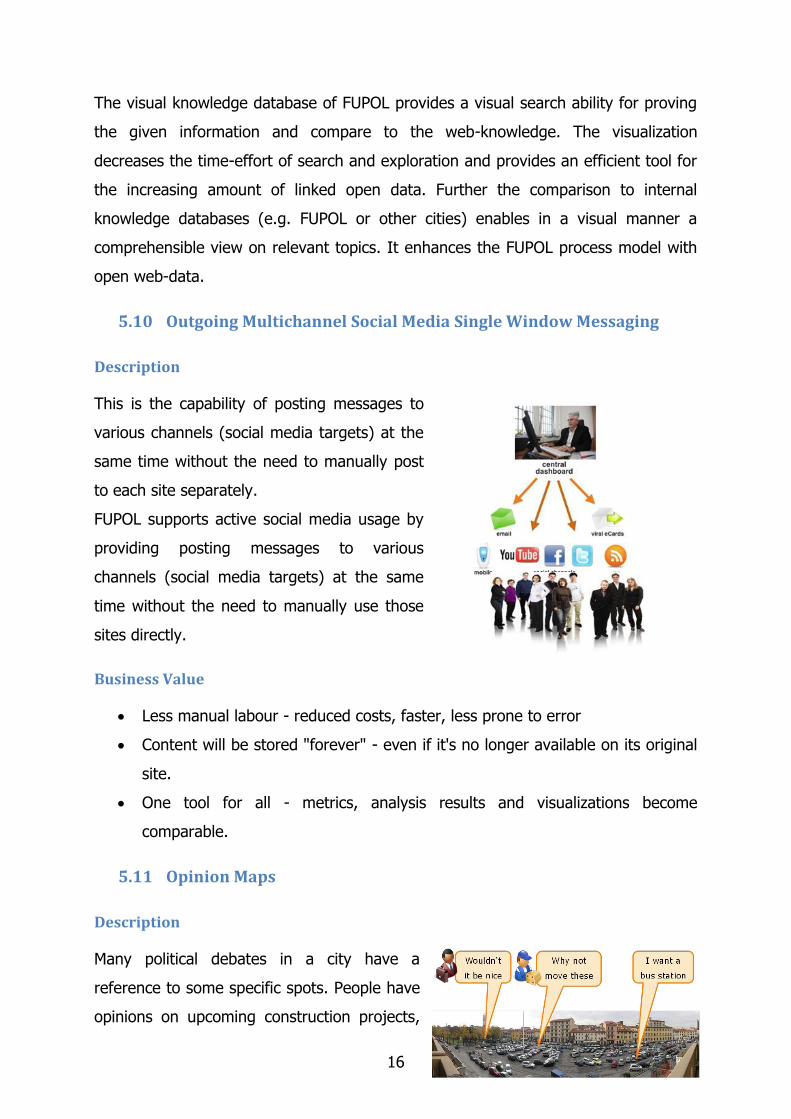
This is the capability of posting messages to
various channels (social media targets) at the
same time without the need to manually post
to each site separately.
FUPOL supports active social media usage by
providing posting messages to various
channels (social media targets) at the same
time without the need to manually use those
sites directly.
Business Value
Less manual labour - reduced costs, faster, less prone to error
Content will be stored "forever" - even if it's no longer available on its original
site.
One tool for all - metrics, analysis results and visualizations become
comparable.
5.11 Opinion Maps
Description
Many political debates in a city have a
reference to some specific spots. People have
opinions on upcoming construction projects,
17
on the place for a new bus station or they just want to tell you that there’s some
broken traffic light there.
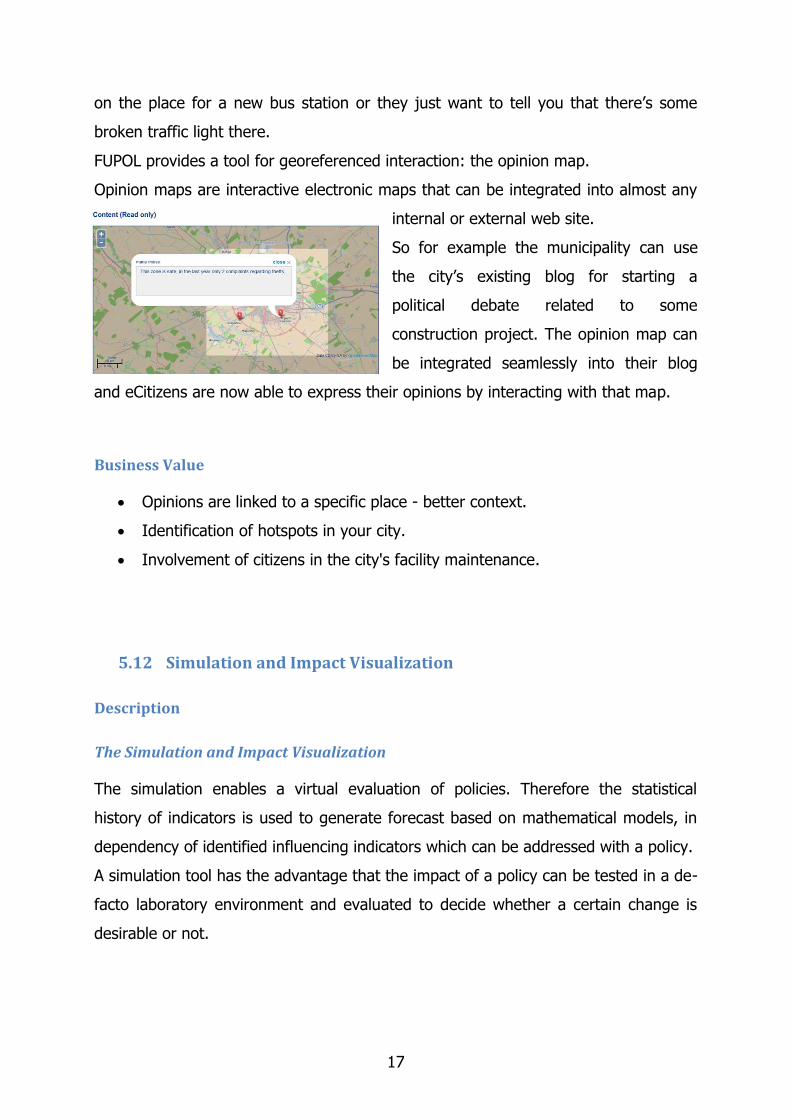
FUPOL provides a tool for georeferenced interaction: the opinion map.
Opinion maps are interactive electronic maps that can be integrated into almost any
internal or external web site.
So for example the municipality can use
the city’s existing blog for starting a
political debate related to some
construction project. The opinion map can
be integrated seamlessly into their blog
and eCitizens are now able to express their opinions by interacting with that map.
Business Value
Opinions are linked to a specific place - better context.
Identification of hotspots in your city.
Involvement of citizens in the city's facility maintenance.
5.12 Simulation and Impact Visualization
Description
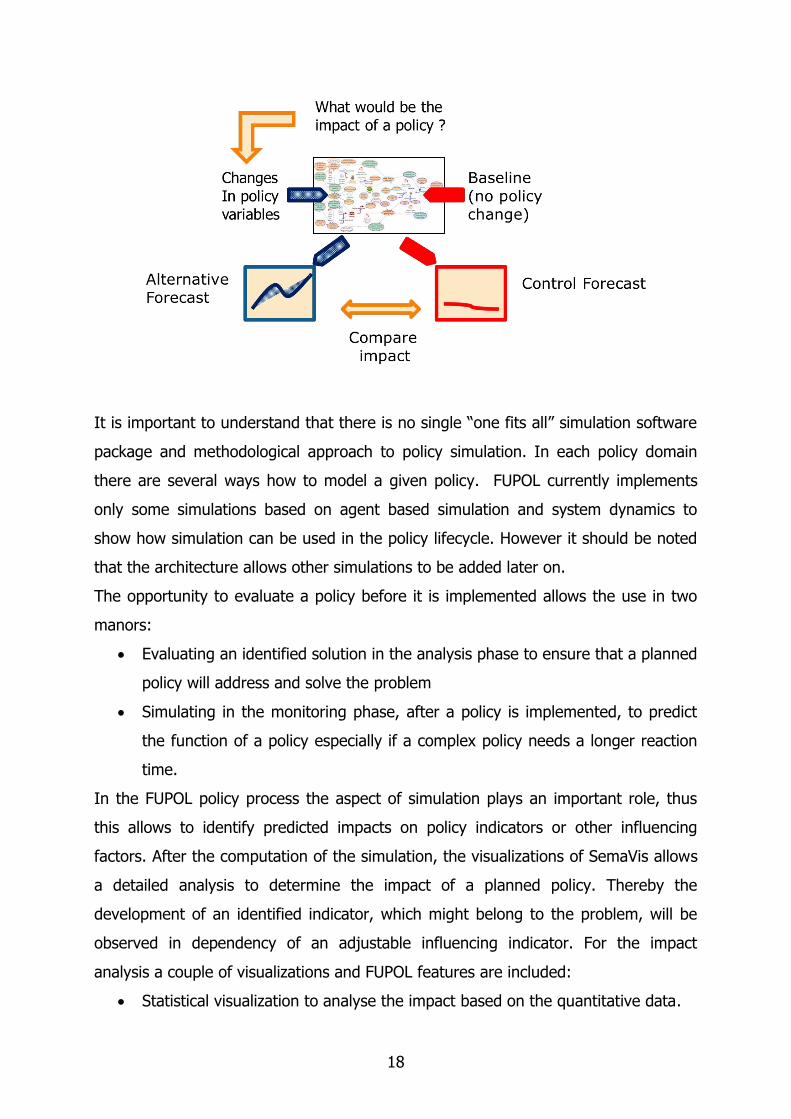
The Simulation and Impact Visualization
The simulation enables a virtual evaluation of policies. Therefore the statistical
history of indicators is used to generate forecast based on mathematical models, in
dependency of identified influencing indicators which can be addressed with a policy.
A simulation tool has the advantage that the impact of a policy can be tested in a de-
facto laboratory environment and evaluated to decide whether a certain change is
desirable or not.
18
It is important to understand that there is no single “one fits all” simulation software
package and methodological approach to policy simulation. In each policy domain
there are several ways how to model a given policy. FUPOL currently implements
only some simulations based on agent based simulation and system dynamics to
show how simulation can be used in the policy lifecycle. However it should be noted
that the architecture allows other simulations to be added later on.
The opportunity to evaluate a policy before it is implemented allows the use in two
manors:
Evaluating an identified solution in the analysis phase to ensure that a planned
policy will address and solve the problem
Simulating in the monitoring phase, after a policy is implemented, to predict
the function of a policy especially if a complex policy needs a longer reaction
time.
In the FUPOL policy process the aspect of simulation plays an important role, thus
this allows to identify predicted impacts on policy indicators or other influencing
factors. After the computation of the simulation, the visualizations of SemaVis allows
a detailed analysis to determine the impact of a planned policy. Thereby the
development of an identified indicator, which might belong to the problem, will be
observed in dependency of an adjustable influencing indicator. For the impact
analysis a couple of visualizations and FUPOL features are included:
Statistical visualization to analyse the impact based on the quantitative data.
19
Geographical visualization to illustrate the impact on a map, e.g. the urban
growth.
Policy Indicator Dashboard to provide a simplified impact overview of the key
indicators.
FUPOL Knowledge Database and Visualization for additional information about
the simulated situation and the influence on specific indicators.
Business Value
Decision makers have the advantage to simulate and analyse a planned policy for its
impact, before a policy is implemented. Hence insufficient policies can be avoided
and the policy implementation-coasts can be decreased. Additionally decision makers
can use the simulation and impact analysis as monitoring tool to observe the impact
of policies with long reaction time.
5.13 Visual Fuzzy Cognitive Map
Description
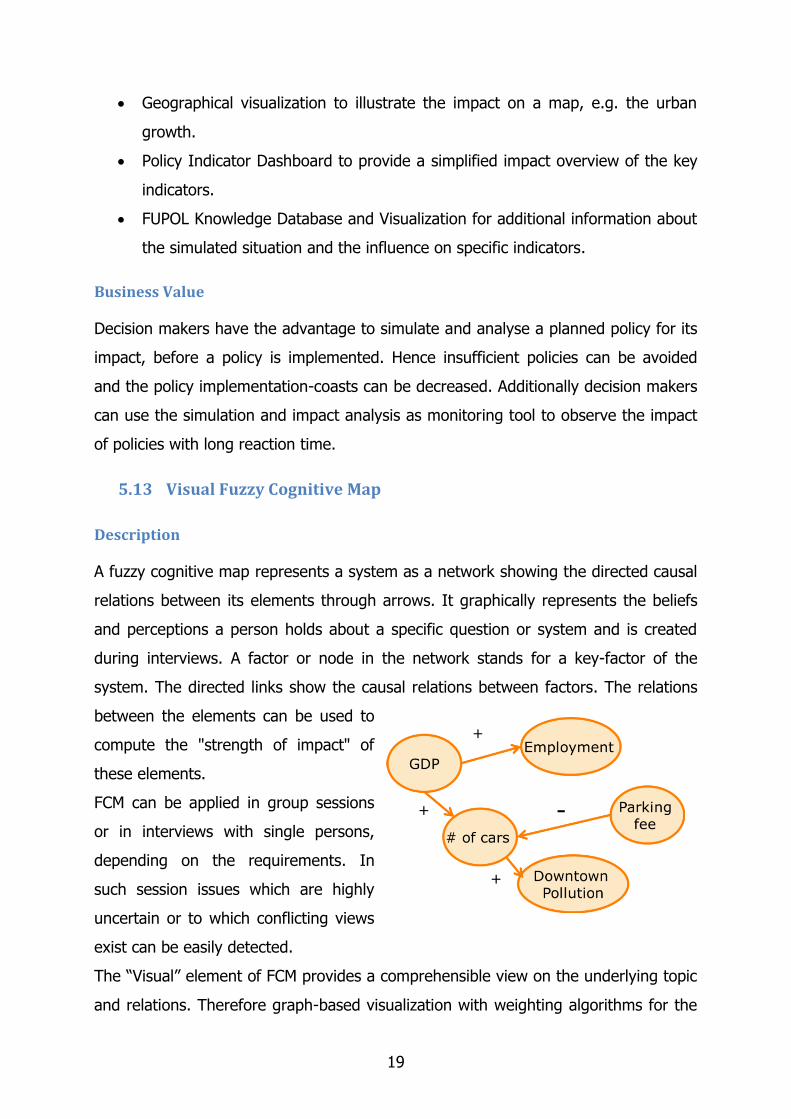
A fuzzy cognitive map represents a system as a network showing the directed causal
relations between its elements through arrows. It graphically represents the beliefs
and perceptions a person holds about a specific question or system and is created
during interviews. A factor or node in the network stands for a key-factor of the
system. The directed links show the causal relations between factors. The relations
between the elements can be used to
compute the "strength of impact" of
these elements.
FCM can be applied in group sessions
or in interviews with single persons,
depending on the requirements. In
such session issues which are highly
uncertain or to which conflicting views
exist can be easily detected.
The “Visual” element of FCM provides a comprehensible view on the underlying topic
and relations. Therefore graph-based visualization with weighting algorithms for the
20
FCM outcomes are used. The comprehensive view on the relations provides more
transparency.
From the visualization point of view the FCM describes in its major presentation a
graph, i.e. it can be shown as node-graph visualization. Therefore the used data for
the definition of the FCM is close to existing graph-based definition formats e.g.
GraphML. For the final integration into FUPOL the focus lays on the visualization just
as graph with labels for additional explanations on the node and edges. To allow
interactivity, a linking between the FCM and the considered model in the background
and the simulation as analysis tool is provided. The new FCM will be visualized by the
end users and they will be allowed to check the effects of changing the value-force
assigned to the different concepts represented in the FCM.
Business Value
The major advantage of fuzzy cognitive maps is that they can handle incomplete or
conflicting information in the decision making process. It is quite suitable to
represent political systems and support related decisions, because frequently
important information may be missing, be unreliable or be vague or conflicting.
Hence FCMs are a suitable tool to support complex policy decisions. They can be
used to visually show complex relationships to stakeholders and decision-makers.